Embed Size (px)
Citation preview

Prepared by John D. ChandleyFor
Organization of MISO StatesFebruary - March 2005
RTO 101: What RTOs Do and WhySession 1 - System OperationsSession 2 - RTO Spot Markets

2
Topics for This Meeting
Session 1: Understanding System Operations• System operations, dispatch and reliability• Many control areas but one grid• Loop flows, contract paths and TLRs • How RTO dispatch replaces TLRs to improve reliability• Inter-RTO coordination and Joint and Common Markets• How the construct provides “open, comparable transmission access”
Session 2: RTO Spot Markets• How the spot market supports policy options• How bilaterals and self schedules are handled• Day-ahead and real-time markets – two-settlement systems
Session 3: Locational Marginal Pricing• Why LMP and not something else?• LMP example and observations

3
Topics for This Meeting (cont.)
Session 4: Financial Transmission Rights• Why “financial” rights and not “physical” rights• How FTRs work and how to get them• Are there enough FTRs?
Session 5: Resource Adequacy in an RTO Framework• Theory, merits and issues with “energy-only” market-clearing
approaches• Market power and price caps• Issues with current ICAP approaches• LICAP and demand curves: new approaches in NY, NE, PJM
Session 6: Transmission Investment in an RTO Framework• FTRs and elements of a market-based approach• Regulatory backstop and the need for a bright line• Cost allocation – Case Study from ISO-New England

4
Understanding System Operations

5
A Utility Is Commonly Thought of as Having Three Major Operational Functions:
Distribution . . .
Generation . . .
Transmission . . .
But there is another function – SYSTEM OPERATIONS

6
ISOs and Most Utilities Have a Control Room for System Operations
(This is MISO’s, but all larger utilities have one)

7
System Operators Work in Local Dispatch Centers That Manage “Control Areas”A control area may cover one utility grid/service area, or two or more interconnected grids. An RTO may cover a broad region.
• There are over 140 control areas in the United States alone.
• Each control area manages only a piece of an interconnection.
In fact, there are only three very large “interconnections.”
• Dozens of separately owned grids/control areas are interconnected.
• And energy flows travel throughout each interconnection along all possible paths – the laws of physics dictate this.
• Each interconnection functions like one huge electrical machine.

8

9
Essential Reliability Functions Center Around Each System Operator’s Dispatch
Security-ConstrainedEconomicDispatch
& Regulation
Security-ConstrainedEconomicDispatch
& RegulationCongestionRedispatch
(internal only?)
Real-TimeBalancing
CoordinateInter-utility
Flows w/Others
Keep FlowsWithin Limits
Maintain Voltageand Frequency
Monitor Flows, Limits& Contingencies
Grid OperatingInstructions
Manage OperatingReserves
TLR

10
A System Operator’s Dispatch Is The Essential Tool For Reliable Operations
• Dispatchers instruct generators how much to generate at each location in each dispatch interval (usually every 5 minutes).
=
+
Losses
•There’s virtually no “storage” in electricity, so electricity must be generated as it is consumed.
•Automated “regulation” fine tunes output in seconds to balance supply/demand at all times.
•Energy dispatch keeps frequency at 60Hz
•Reactive power dispatch keeps voltage stable
•These and other actions keep the lights on

11
The System Operator’s Dispatch Also Serves to Meet Demand At Lowest Cost
West Nuke
East Coal
South Gen
West Gas
East Gas
System Load
UNCONSTRAINED MERIT ORDER DISPATCH
0 100 200 300 400 500
Must run?
Running Costs/ Bids ($/MWh)
Capacity (MW)
80
60
40
20
0
• Operators try to dispatch economically.
$30
$37
$40
$60
$/MWh
$20

12$0
$10
$20
$30
$40
$50
$60
A BDC
EF
J
G
HI
K
ML
NO P
Q
Constrained-Off Unit
Constrained-On Unit
UnconstrainedMerit Order
Marginal CostOr
Clearing Price
Demand
Security-Constrained Economic Dispatch: Congestion Requires Operators to Dispatch Out of Merit Order
to Keep Flows Within Security Constraints.
This “Redispatch” Raises Costs
Least costRedispatch
Units H & N are the most cost-effectiveto constrain off and on to relieve the constraint

13
Many Small Control Areas Make the Interconnected Grid Harder to Manage
• Actions here affect flows there – it’s one interconnected grid
• Coordination is challenging, unforgiving – every operator must do his/her job and let neighbors know quickly about problems.
• So 100% reliability is harder to assure. The August 14, 2003 blackout was probably inevitable, and could happen again.
• Economic dispatch is balkanized – each local dispatch is less efficient than it could be: we pay more in each area.
• Market power is easier to exercise -- the entity that controls the dispatch controls grid access, imbalance pricing, etc.

14
Security-ConstrainedEconomicDispatch
& Regulation
Security-ConstrainedEconomicDispatch
& RegulationCongestionRedispatch
(internal only?)
Real-TimeBalancing
CoordinateInter-utility
Flows w/Others
Keep FlowsWithin Limits
Monitor Flows, Limits& Contingencies
(with state estimator)
Grid OperatingInstructions(to Tx owners)
Manage OperatingReserves
(with contingency analysis)
TLR
Security-ConstrainedEconomicDispatch
& Regulation
Security-ConstrainedEconomicDispatch
& RegulationCongestionRedispatch
(internal only?)
Real-TimeBalancing
CoordinateInter-utility
Flows w/Others
Keep FlowsWithin Limits
Monitor Flows, Limits& Contingencies
(with state estimator)
Grid OperatingInstructions(to Tx owners)
Manage OperatingReserves
(with contingency analysis)
TLR
A Weak Link in Reliability: Multiple Control Areas, Each With Its Own Dispatch, Must Coordinate Flows Between Each Other
“Interchange” isPreset and FixedEvery 30-60 Min
Timing:
Flows = near light speed
AGC – regulation = seconds
Internal dispatch = 5 min
Inter-CA schedules = 30-60 min
Control Area A
Control Area B
Control Area C

15
Contract Path Scheduling and TLRsIn regions outside ISOs, parties reserve transmission from the grid owner by selecting and paying for a “contract path.”
The contract path concept bears no relationship to physical flows.
The contract path is only one of many paths along which electricity actually flows from “source” to “sink” for any given schedule.
Although a contract path may be able to accommodate the flows...
Other possible paths on which the flows actually travel may not be able to accommodate those flows without violating their security limits.
When this happens, control areas need a system to “unschedule” the overloaded line/equipment to ensure flows stay within security limits.
System Operators and Reliability Coordinators use “TLRs” --Transmission Line Loading Relief – rules developed by NERC.

16
Contract Path Scheduling Is Flawed Because It Ignores the Actual Flows/Physics
Schedule with flows along the contract path . . .
(not congested)
. . . causes flows on all other paths
Control Area A
Contract path scheduling needs curtailments (TLRs) to “unschedule” the grid to get flows within security limits
Control Area B
Control Area C
Loop flows can cause congestion (flows above
line limits) anywhere along any path
10 0 MW

17
Security-ConstrainedEconomicDispatch
& Regulation
Security-ConstrainedEconomicDispatch
& RegulationCongestionRedispatch
(internal only?)
Real-TimeBalancing
CoordinateInter-utility
Flows w/Others
Keep FlowsWithin Limits
Monitor Flows, Limits& Contingencies
(with state estimator)
Grid OperatingInstructions(to Tx owners)
Manage OperatingReserves
(with contingency analysis)
TLR
Security-ConstrainedEconomicDispatch
& Regulation
Security-ConstrainedEconomicDispatch
& RegulationCongestionRedispatch
(internal only?)
Real-TimeBalancing
CoordinateInter-utility
Flows w/Others
Keep FlowsWithin Limits
Monitor Flows, Limits& Contingencies
(with state estimator)
Grid OperatingInstructions(to Tx owners)
Manage OperatingReserves
(with contingency analysis)
TLR
TLR Curtailments Are Necessary Only Because There is No Regional Dispatch Alternative
1. Schedules between these control areas . . .
2. Can cause congestion in another control area, which has the right to request TLR instead of redispatching, which would increase its own costs.
Cut?
Cut?
4. ReliabilityCoordinatorCalls TLR
3. Help!
6. Result costs more to serve all loads
5. After TLR cuts, each CA must rebalance its
dispatch
100 MW
Cut? Cut?
C
B
A

18
Can We Still Rely On TLRs For Reliability?There may have been a time when primary reliance of TLRs was sufficient to ensure reliable inter-control area grid coordination. With increasing numbers (100s) of TLRs being called, that time is past.
TLRs are inadequate because . . .
• TLRs can take too long – couldn’t have avoided August 14.
• TLRs are imprecise in matching curtailment with relief needed
• Too many schedules may be cut, leaving the grid underutilized
• TLR rules don’t cover all flows, so they discriminate
• TLRs can curtail economic schedules that serve “native loads”
• But . . . TLR curtailment rules pay no attention to economics

19
A Regional Dispatch Replaces TLRs by Redispatching Flows Every 5 Minutes
Original Control Area D
Original Control Area B
Original Control Area C
Original Control Area A
RegionalSecurity-
ConstrainedEconomicDispatch
RegionalSecurity-
ConstrainedEconomicDispatch
ManageCongestion
Real-TimeBalancing
CoordinateFlows
Keep FlowsW/in Limits
RTOFunctions
MonitorGrid
Control Grid Operations
ManageReserves
Maintain Voltageand Frequency
Coordinate with other
RTOs
TLR
TLR

20
RTO Reliability Functions and BenefitsAn RTO that offers a bid-based security-constrained economic dispatch and related monitoring tools across its region can . . .
• Internalize regional loop flows and congestion in a large region
• Solve congestion region-wide every 5 minutes, before it happens, and solve much of it day ahead with bid-based day-ahead markets
• Replace reliance on TLRs within its regional dispatch area
• Monitor and react quickly to grid problems on a regional basis
• Vastly simplify the coordination needed to ensure regional reliability
• Facilitate reserve sharing and reduce operating reserve requirements (diversity is more reliable and saves money)

21
RTOs with Standard Core Features Enhance Grid Reliability – And Create Spot Markets
RTO Functions
Self Schedules
Bilateral Schedules
Forecasts andLoad Bids
Generator Offers
TransmissionUsage Charge
(LMPB - LMPA)
FinanciallyFirm Tx(LMPB - LMPA)
Allocate & Auction FTRs
Market Inputs Market Support
Ensure ReliabilityEnsure Reliability
Reserves
RegionalSecurity-
ConstrainedEconomicDispatch
RegionalSecurity-
ConstrainedEconomicDispatch Congestion
Redispatch(In lieu of TLR)
Real-TimeBalancing
Co-OptimizedCover
Imbalances
Buy and SellSpot Energy
Reliably ServeAll Loads
Use LMPs forSettlements$$$
CalculateDispatchPrices(LMP)
CalculateDispatchPrices(LMP)
$$$

22
Reliability and Spot Markets Are Linked
An open spot market arises naturally from . . .
The reliability necessity of a security-constrained dispatch
The desirability of an having an economic (“least-cost”) dispatch
The commercial necessity of paying/charging all parties that use the dispatch at market prices
Reliability is supported by efficiently priced dispatch/spot market.
Prices consistent with the dispatch and offers/bids encourage parties to follow dispatch instructions and use the grid efficiently.
If prices are inconsistent with dispatch, reliability can suffer. • (e.g., early PJM, California, etc)

23
Open Access to Dispatch/Spot Market/LMP Solved Open Access to Transmission
Open access to a regional, bid-based dispatch priced at LMP ensures open, non-discriminatory access to transmission.
Access to dispatch = access to balancing and spot market• LMP is inherently non-discriminatory way to support trading, settle
imbalances and spot trades. No subsidies/leaning; no bias.Access to redipatch = open access to transmission without curtailments• Pricing redispatch at LMPB-LMPA is inherently non-discriminatory
All previous FERC efforts at open access fell short . . .Order 888/889 – decreed open access, but didn’t provide/price it Order 2000 – saw the need for balancing market, but didn’t clearly connect this to the ISO’s real-time dispatch. The two are the same. • Liked, but didn’t require, LMP. • Left confusion over ISO vs Transco, different RTO functions, etc.

24
Interim Coordination Between RTOs Can Partly Reconfigure RTO Boundaries
PJMMISO
(1) MISO/PJM coordinate flows between them
(2) MISO responsible for redispatch for some PJM flowgates affected more by MISO generation and flows
(3) PJM responsible for redispatch for some MISO flowgates . . .
(4) Substitutes more efficient regional redispatch for TLRs

25
Future Coordination Between RTO Markets Can Create Joint/Common Market
PJMMISO
(1) MISO & PJM exchange data on constraints, bids, LMP prices
(2) MISO & PJM readjust their respective dispatches
(3) MISO & PJM exchange data again, etc.
(4) Iterations lead to optimized inter-regional dispatch and prices
(5) Forms basis for joint/common market = one unified dispatch

26
RTO Spot Markets
Features of LMP and FTR Markets

27
RTOs with These Core Features Ensure Reliability, Create Spot Markets, Support Contracts
RTO Functions
Self Schedules
Bilateral Schedules
Load Bids
Generator Offers
TransmissionUsage Charge
(LMPB - LMPA)
EfficientPrice signals
Allocate & Auction FTRs
Market Inputs Market Support
Ensure ReliabilityEnsure Reliability
Reserves
RegionalSecurity-
ConstrainedEconomicDispatch
RegionalSecurity-
ConstrainedEconomicDispatch Congestion
Redispatch(In lieu of TLR)
Real-TimeBalancing
Co-OptimizedCover
Imbalances
Buy and SellSpot Energy
Reliably ServeAll Loads
Settlements atSpot Prices$$$
CalculateDispatchPrices(LMP)
CalculateDispatchPrices(LMP)
$$$
Con
tra c
tsC
o ntr
a cts
Cont ract + Sp ot P ri ces
Cont ract + Sp ot P ri ces
FinanciallyFirm Tx(LMPB - LMPA)

28
The RTO’s Structure Readily Accommodates Many Public Policy OptionsTraditional utility-owned generation
• Self scheduling or LMP/spot salesIndependent power generation
• Self or bilateral scheduling or LMP/spot salesIntermittent power, e.g., wind
• When it generates, it receives its LMP; displaces marginal plantDistributed generation
• When it generates, it receives the LMP at its locationCustomer demand-side response and real-time pricing
• Used with real-time pricing, customer saves or sells back energy at the LMP spot price
Efficient retail choice and default supply options• All suppliers and LSEs have open access to grid and spot market

29
The Energy Spot Markets Are “Voluntary”
No one is forced to buy energy from the RTO spot markets or sell energy into the spot market
• Any LSE/utility can self-schedule its own generation to its own loads – load is served at the LSE/utility’s generation costs
• Any entity can arrange pt-to-pt bilaterals to serve its loads –load is served at the price of the bilateral contract
But parties that use the spot market must accept its settlements
• Parties that have imbalances/deviations settle at spot prices
• Parties that buy/sell “extra” energy through the dispatch also settle at spot prices.

30
RTO May Operate Multiple Spot Markets
There is always a “real-time” spot (balancing) market
• The Real-time market flows from the real-time dispatch
But an RTO can use the same approach to create a day-ahead (and/or hour-ahead) spot market
• The RTO can accept schedules, offers and bids day ahead, to arrange a day-ahead security-constrained economic dispatch
• The RTO then prices the dispatch to define day-ahead LMP prices for spot energy and day-ahead usage charges

31
PJM/MISO Use A “2-Settlement” System
A party that schedules (or buys/sells) in the Day-ahead (DA) market . . .
• Settles spot sales and purchases at DA spot prices = LMPDA
• Settles spot transmission at DA transmission (usage) prices
– Usage charge = MW times (LMPsink – LMPsource)– FTR Credit = MW times (LMPsink – LMPsource)
A party that deviates from its day-ahead schedules in real time . . .
• Settles the deviations at the real-time spot prices = LMPRT

32
Day-Ahead Market for Day-Ahead TradesSets Up Real-time Reliability and Dispatch
RTO DA Functions
Imports andExports
Self Schedules(and virtuals)
Load Bids andForecasts
Generator Offers
Cash OutFTRs
MW * (LMPB - LMPA)
DA Inputs DA Outcomes
Commitment
DA RegionalSecurity-
ConstrainedEconomicDispatch
DA RegionalSecurity-
ConstrainedEconomicDispatch
Co-Optimized
Day-AheadSchedules
Buy and SellEnergy DA
(at DA LMPs)
Enough CapacityCommitted to
Meet RT Loads
1st Settlement atDA LMP Prices
CalculateDA
LMPs
CalculateDA
LMPs
Reserves
Pay Usage forDA Schedules
MW * (LMPB - LMPA)
Co-Optimized
Bilateral data(Financial)
(Later) $$$

33
Real-Time Market = Real-Time DispatchDeviations Are Settled at Real Time Prices
RTO RT Functions
Hour-aheadImport/Export
Self Schedules
Load Bids
Generator Offers
Settle DADeviations
(at RT LMPs)
Inputs Outcomes
RT RegionalSecurity-
ConstrainedEconomicDispatch
RT RegionalSecurity-
ConstrainedEconomicDispatch
Day-AheadSchedules
Buy and SellEnergy RT
(at RT LMPs)
Reliably ServeAll Loads
2nd Settlement atRT LMP Prices
CalculateRT
LMPs
CalculateRT
LMPs
Reserves
Pay Usage forRT Schedules
MW * (LMPB - LMPA)
Co-Optimized
Bilateral data(Financial)
(Later)
Real-timeSchedules
Uplift
$
$$$

34
RTO Markets Often Use “Net” Settlements
A party that schedules a bilateral transaction from point A to point B is settled on a “net” basis:
• Party receives a credit for its net injections at the source (A) LMP
• Party gets a debit for its net withdrawals at the sink (B) LMP
The settlements are based on LMPs at source (A) and sink (B).• If there is no congestion, LMPs at A and B are the same
– Net settlement is zero (ignoring losses)
• If there is congestion, LMPs will be different at A and B– Net Settlement = MW times (LMPB - LMPA)– Net Settlement = marginal cost of redispatch

35
What Else Do RTOs Do? Other Topics
RTOs often operate resource adequacy mechanismsSpot market price caps lead to revenue shortfalls for investmentEastern ISOs coordinate capacity markets to supply the missing revenues and encourage investment in resource adequacy
RTOs conduct regional forecasting and grid planningIt’s an extension of the planning needed for short-run reliabilityLeads to regional integrated transmission/generation planning exercises
RTOs monitor the markets for market power and manipulationInternal and independent market monitors watch prices and behaviorAnd recommend remedies and mitigation
RTOs help allocate regional grid costs among members Especially for transmission with regional impactsAnd to pay the costs of administering a regional system

Prepared by John D. ChandleyFor
Organization of MISO StatesFebruary - March 2005
RTO 101: What RTOs Do and WhySession 3 - Locational Marginal Pricing
Session 4 - Financial Transmission Rights

2
Topics for This Meeting
Session 3: Locational Marginal Pricing• Definition and rationale• Alternatives to LMP – history and examples• LMP example and observations
Session 4: Financial Transmission Rights• Why “financial” rights and not “physical” rights• How FTRs work and how to get them• Are there enough FTRs?

3
Locational Marginal Pricing
Theory, Examples And Observations

4
Why Are Locational Marginal Prices Used for Spot Energy Settlements?LMP defines the prices paid to sellers and paid by buyers for “spot energy” and imbalances . . .
• An LMP is the lowest dispatch cost for serving an increment of load (1 more MW) at each location, given the available offers/bids and the transmission limits faced by the dispatch
• So its both fair and efficient to charge/pay LMP for imbalances and spot energy purchases and sales.
We will see that LMPs also provide important incentives for both reliable operations and adequate investments.

5
Locational Marginal Prices Also Define Transmission Usage ChargesLMP difference between two locations defines the price charged to transmission users.
• The difference between the LMPs at any two locations reflects the marginal cost of the RTO’s least-bid-cost, security-constrained redispatch needed to move power from one location to the other, given constraints on the system.
• If there were no congestion, no redispatch would be needed. Locational Prices would differ only because of losses.
• If there were no losses as well, this difference would be zero.
LMP-based usage charges provide incentives/signals for efficient grid use and transmission investments.

250 MW
250 MW 50
0 M
WLoad = 750 MW
In these examples, all lines have equal impedance. Flows are inverse to impedance.
A B
C
A Basic 3-Bus Dispatch Model
Flows follow all possible paths
So 2/3 of flows go from B to C and 1/3 of flows go
from B to A to C
Generation= 750 MW

A B
C
250 MW
250 MW 50
0 M
W
750 MW
Load = 750 MW
7
600 MW Limit
Assume a Limit on the B to C Line
Given this level of load and generation, the flows do not exceed the thermal “constraint.” There is no “congestion.”
For reliability, Operators will not
allow flows on line B - C to
exceed 600 MW

$15/MWh
A B
C
250 MW $15/MWh
250 MW 50
0 M
W
LMP = $15/MWh everywhere
750 MW
Load = 750 MW
If the generator at B offered power at $15/MWH, and could produce more at that price, that is the price at all locations.
8
600 MW Limit
Pricing is Simple If There Is No Congestion

A B
C
333 1/3 MW$30 $15
333 1/3 MW
666
2/3
MW
$60
1,000 MW
Load = 1,000 MW
A B
C
200 MW$30 $15
400 MW
600
MW
LMP at C = $45
800 MW
Load = 1,000 MW
200 MW
Thermal Limit on B-C Exceeded = Congestion
System Re-dispatched to Respect Thermal Limit
Redispatching generation to relieve congestion can change the price of power at different locations.
9
600 MW Limit
600 MW Limit
. . . we must change the dispatch of generation to keep flows within limits
If we increase load and generation to 1000 MW, there is congestion . . .

10$0
$10
$20
$30
$40
$50
$60
A B
D
C
EF
J
G
HI
K
ML
NO P
Q
Constrained-Off Unit
Constrained-On Unit
UniformBalancing Price
Demand
Why Not Use the Same Price Everywhere?Ignoring Price Differences Creates Problems
Constrained-OffPayment = UBP minus offer
LMP avoids these “games”
Non-LMP Prices Encourage Bid “Games” . . .
Constrained-on and –off units must be paid
ED

11
Examples of “Fixes” for Non-LMP Schemes
Don’t pay constrained-off generators (PJM in 1997)• When PJM tried this, generators left the dispatch and self-scheduled• In August 1997, PJM almost lost control of the dispatch when most
eastern LSEs began self-scheduling their western units, creating west-east congestion with no way for ISO to redispatch
Zonal pricing (California and ERCOT)• California started with few zones, but later realized they would need
many – as many as 35 or so – CIAO is now implementing LMP • ERCOT started with one zone, then four, and has determined that
that’s not enough -- now considering “Texas Nodal” (LMP)
Problems with zonal pricing:• If you have only a few zones, congestion occurs inside the zones• If you have many zones, transmission rights become complicated• If you start with a few, it’s politically difficult to create more zones

12
Pricing Imbalances and Spot Energy At Marginal Cost = Locational Marginal PricingDefinition: LMP reflects the marginal cost of serving an increment of load at each location, given the dispatch, grid constraints, and the offers/bids.
LMP Supports Reliability: LMP payments encourage generators to follow dispatch instructions, without side payments. Prices are consistent with reliable dispatch.
No subsidies: Using LMP allows parties to use the dispatch to support their bilateral transactions (if they have imbalances) or to make spot purchases and sales, without any party “leaning” on the system.

13
West LSE
25 MW
LMP Example
West Gas
$35.00
100 MW
There are several generators, with different capacities and costs/MWh
They’re all connected by transmission, but the grid elements have limits
We have various loads –consumers of electricity
90 MW
The rmal

14
South LSE
5 MW
North LSE
5 MW
West LSE
25 MW
Southeast LSE
25 MW
East LSE
290 MW
P O
L K
B
A
C
V
Z
Y
W
SYSTEM CONFIGURATION(bilateral)
West Gas$35.00
100 MW
West Nuke$20.00
100 MW
South Gen$32.50
90 MW
East Coal$30.00
100 MW
East Gas$50.00
50 MW
North IPP
25 MW
N
M
D X
80 MW
The rmal
50 MW Thermal
200 MW
Th erma l
West Nuke 100 MW, West Gas 100 MW, North IPP 25 MW, South Gen. 90 MW, East Gas 50 MW, East Coal 100 MW
SYSTEM LOAD = 350 MW
100 MW
Th erma l
90 MW
The rmal
90 MW
The rmal

15West Nuke 100 MW, West Gas 100 MW, North IPP 25 MW, South Gen. 90 MW, East Gas 50 MW, East Coal 100 MW
N
P
South Gen
$32.50
South LSE
5 MW
O
L
North IPPNorth LSE
5 MW
K
M
West Nuke
$20.00
B
West Gas
$35.00
A
West LSE
25 MW
C
D
Southeast LSE
25 MW
V
X Z
East Gas
$50.00
Y
W
SYSTEM LOAD = 350 MW
12.5 MW
52.5 MW
5 MW
25 MW
65 MW
5 MW
100 M
W
62.5 MW
22.5 MW
290
MW
`
10 MW
25 MW
25 MW
100 MW
35 MW
25 MW
(bilateral)
DISPATCH AND POWER FLOWS
75 MW
East LSE
290 MW
East Coal
$30.00
80 MW
The rmal
10 0 MW
Th erma l
90 MW
The rmal
50 MW Thermal
200 MW
Th erma l
90 MW
The rmal
$0

16
Security-Constrained Economic DispatchWhy is the dispatch out of merit order?
Previous page shows the least-cost security-constrained dispatch to meet the 350 MW of load on the system. It appears no transmission constraints are actually binding. But South Gen and East Gas are dispatched out of merit order. Why?
West Nuke
East Coal
South Gen
West Gas
East Gas
System Load
UNCONSTRAINED MERIT ORDER DISPATCH
0 100 200 300 400 500
North IPP
Running Cost Bid ($/MWh)
Capacity (MW)
80
60
40
20
0

17West Nuke 100 MW, West Gas 100 MW, North IPP 25 MW, South Gen. 90 MW, East Gas 50 MW, East Coal 100 MW
N
P
South Gen
$32.50
South LSE
5 MW
O
L
North IPPNorth LSE
5 MW
K
M
West Nuke
$20.00
B
West Gas
$35.00
A
West LSE
25 MW
C
D
Southeast LSE
25 MW
V
East Coal
$30.00
X Z
East Gas
$50.00
Y
W
OUT OF SERVICE IN CONTINGENCY
SYSTEM LOAD = 350 MW
50 MW
90 MW
5 MW
25 MW
65 MW
5 MW
100 M
W
100 MW
60 MW
290
MW
`
10 MW
25 MW
25 MW
100 MW
35 MW
25 MW
(bilateral)
DISPATCH IN CONTINGENCY IN WHICH LINE CONNECTING BUSES D AND X IS OUT
East LSE
290 MW
80 MW
The rmal
10 0 MW
Th erma l
90 MW
The rmal
50 MW Thermal
200 MW
Th erma l
90 MW
The rmal
$0

18
Security-Constrained DispatchThe out-of-merit dispatch is required for the system to be secure in the contingency in which the line from Bus D to Bus X is out of service.
This dispatch is the same as that shown in the diagram two pages back. However, the energy flows in this dispatch are up against two thermal limits if the D to X line is out of service.
Out-of-merit dispatch occurs because South Gen (the lowest-cost generator with capacity available) cannot generate any more energy without jeopardizing system reliability in this contingency.
Transmission congestion exists because of constraints that would be binding in contingencies, such as outages, not just constraints that are binding when everything is up.

19West Nuke 100 MW, West Gas 100 MW, North IPP 25 MW, South Gen. 90 MW, East Gas 50 MW, East Coal 100 MW
N
P
South Gen
$32.50
South LSE
5 MW
O
L
North IPPNorth LSE
5 MW
K
M
West Nuke
$20.00
B
West Gas
$35.00
A
West LSE
25 MW
C
D
Southeast LSE
25 MW
V
East Coal
$30.00
X Z
East Gas
$50.00
Y
W
OUT OF SERVICE IN CONTINGENCY
SYSTEM LOAD = 350 MW
50 MW
90 MW
5 MW
25 MW
65 MW
5 MW
100 M
W
100 MW
60 MW
290
MW
`
10 MW
25 MW
25 MW
100 MW
35 MW
25 MW
(bilateral)
DISPATCH IN CONTINGENCY IN WHICH LINE CONNECTING BUSES D AND X IS OUT
East LSE
290 MW
80 MW
The rmal
10 0 MW
Th erma l
90 MW
The rmal
50 MW Thermal
200 MW
Th erma l
90 MW
The rmal
$0

20
LOCATIONAL PRICING Least-Cost DispatchThis is the lowest-bid-cost dispatch available, given the transmission constraints and the flows that would occur in the contingency in which the D-X lines goes out.
The energy flows shown in this figure (determined by the characteristics of the grid) do not violate any thermal transmission limits.
No other dispatch will meet system load at a lower generation bid cost, while respecting transmission limits.

21West Nuke 100 MW, West Gas 100 MW, North IPP 25 MW, South Gen. 90 MW, East Gas 50 MW, East Coal 100 MW
N
P
South Gen
$32.50
South LSE
5 MW
O
L
North IPPNorth LSE
5 MW
K
M
West Nuke
$20.00
B
West Gas
$35.00
A
West LSE
25 MW
C
D
Southeast LSE
25 MW
V
X Z
East Gas
$50.00
Y
W
OUT OF SERVICE IN CONTINGENCY
SYSTEM LOAD = 350 MW
50 MW
90 MW
5 MW
25 MW
65 MW
5 MW
100 M
W
100 MW
60 MW
290
MW
`
10 MW
25 MW
25 MW
100 MW
35 MW
25 MW
(bilateral)
LOCATIONAL PRICES, GIVEN DISPATCH IN D-X OUTAGE CONTINGENCY
$35.00
$35.00
$35.00
$35.00
$37.50
$32.50 $32.50
$50.00
$37.50
$32.50
$50.00
$50.00
$50.00
$50.00
East LSE
290 MW
East Coal
$30.00
80 MW
The rmal
10 0 MW
Th erma l
90 MW
The rmal
50 MW Thermal
200 MW
Th erma l
90 MW
The rmal
$0
$37.50

22
LOCATIONAL PRICING Price DeterminationIn this example, locational prices differ from location to location because the cost of meeting an increment of load at different locations varies due to the impact of the transmission constraints:
At Bus N and buses radially connected to it, the running cost bid of South Gen, the lowest-bidding generator not operating at full capacity, sets the locational price.
The locational price at Bus D and buses radially connected to itis set by the running cost bid of the West Gas generator. Meeting the load using South Gen would violate transmission limits.
At Buses V through Z, the locational price is set by the runningcost bid of the East Gas generator. Meeting the load using South Gen or West Gas would violate transmission limits.

23West Nuke 100 MW, West Gas 100 MW, North IPP 25 MW, South Gen. 90 MW, East Gas 50 MW, East Coal 100 MW
N
P
South Gen
$32.50
South LSE
5 MW
O
L
North IPPNorth LSE
5 MW
K
M
West Nuke
$20.00
B
West Gas
$35.00
A
West LSE
25 MW
C
D
Southeast LSE
25 MW
V
X Z
East Gas
$50.00
Y
W
OUT OF SERVICE IN CONTINGENCY
SYSTEM LOAD = 350 MW
51 MW
90 MW
5 MW
25 MW
64 MW
6 MW
100 M
W
100 MW
61 MW
290
MW
`
10 MW
25 MW
25 MW
100 MW
37 MW
25 MW
(bilateral)
CHANGE IN DISPATCH TO MEET INCREMENT OF LOAD AT BUS K
$35.00
$35.00
$35.00
$35.00
$37.50
$32.50 $32.50
$37.50
$50.00
$37.50
$32.50
$50.00
$50.00
$50.00
$50.00
East LSE
290 MW
East Coal
$30.00
80 MW
The rmal
10 0 MW
Th erma l
90 MW
The rmal
50 MW Thermal
200 MW
Th erma l
90 MW
The rmal
$0

24
LOCATIONAL PRICING Price at Bus KAt Buses K, L and M, the locational price is not equal to the running cost bid of any single generator.
Meeting an increment of load at these buses at least cost, whilerespecting the thermal limits on each line, requires changes in the dispatch of both West Gas and South Gen.
The locational price at these locations is determined by the bids of both these generators.
So LMP can be set by the marginal costs of more than one unit– it is common for multiple units to define the marginal cost of serving load at some locations.
• The common view that LMP = the highest cost resource dispatched is not correct. LMP can be higher or lower than any 1 unit’s bid.

25
LOCATIONAL PRICING Price at Bus KThe least-cost redispatch that meets an incremental 1 MW load at Bus K without violating any transmission constraints is to increase generation at West Gas by 2 MW while reducing generation by 1 MW at South Gen.
The total cost of these changes in dispatch is $37.50, so the incremental cost of meeting load and locational price at Bus K (as well as Buses L and M) is $37.50/MWh.

26
DERIVATION OF LOCATIONAL PRICE AT BUS KSales to ISO inInitial Dispatch
Sales to ISO with Additional1 MWh of Load at Bus K Change
Generators At
RunningCost Bid($/MWh)
Capacity(MW) MWh
TotalRunning
Cost1 MWhTotal
Running Cost1 MWh
TotalRunning
Cost
West Gas A 35.00 100 35 $1,225.00 37 $1,295.00 2.00 $70.00
West Nuke B 20.00 100 100 2,000.00 100 2,000.00
North IPP L N/A 25 25 N/A 25 N/A
South Gen P 32.50 90S 65 2,112.50 64 2,080.00 (1.00) (32.50)
East Gas Y 50.00 50 25 1,250.00 25 1,250.00
East Coal Z 30.00 100 100 3,000.00 100 3,000.00
Total1 350 $9,587.50 351 $9,625.00 1.00 $37.50
1 Excludes cost of generation at North IPP sold under bilateral contract.

27
LOCATIONAL PRICING ObservationsThe locational price at a bus is not necessarily equal to the bid of any single generator. It is not necessarily the bid of the last generator capacity segment dispatched in a “zone.”
A generator’s bid will generally set the locational price at its location when the generator capacity segment is only partially dispatched (unless it is at its minimum, or being held down to provide regulation, operating reserves, or voltage support).
If a generator capacity segment is fully dispatched, the locational price that it is paid will be determined by the bids of other generators and will be greater than or equal to the generator’s energy bid for that capacity segment.

28
LOCATIONAL PRICING ObservationsIf a generator capacity segment is not dispatched, the locational price will be less than its energy bid (not shown here).
The locational price can differ between two buses even if the line directly connecting them is not at a limit.
When two or more generators are on the margin for meeting the next increment of load at a location, the nodal price at that location may be:
• Higher than the offer price of any generator/unit
• Lower than the offer price of any generator/unit
• And may even be negative

29
Common Questions About LMP
Does LMP increase congestion? • No. The congestion is present today, given the grid’s actual
limits for any give dispatch• And pricing congestion with LMP tends to discourage
transactions whose flows cause congestion
Does LMP increase the costs of managing congestion?• No. Regional security-constrained economic dispatch is the
least-cost solution to congestion; it will tend to reduce the costs of managing congestion, compared to TLRs
• LMP reveals the marginal costs of managing congestion, and makes these costs transparent

30
Financial Transmission Rights

31
Recall: LMP Allows An RTO to Offer and Price Redispatch To Avoid TLR CurtailmentsLMP prices congestion redispatch at marginal cost – the change in the cost of the dispatch necessary to relieve congestion and allow a schedule to flow without curtailment.
• Marginal cost of redispatch = MW times (LMPsink – LMPsource)
• Marginal cost of redispatch = Transmission usage charge
Buying through congestion – the ability to price redispatch means the RTO can offer redispatch service at an efficient/fair price.
• Users can choose to pay the usage charge for redispatch, or . . .
• They can choose to be curtailed if the price is too much
• A third choice is to hedge redispatch costs with FTRs.

32
Financial Transmission Rights Provide the Financial Equivalent of Firm Physical RightsFTRs entitle the holder to a rebate or credit of the congestion part of usage charges between any two locations.
• Credit = the difference between the price at the FTR sink and the price at the FTR source (ignoring losses component).
• FTR credit = MW times (LMPsink – LMPsource)
• This is the same way the ISO charges for congestion
• So FTRs can directly hedge against congestion costs/risks
• FTR holders can lock in the cost of congestion/usage charges

33
FTRs Support Efficient Dispatch
FTRs need not match actual schedules
• Parties don’t have to change/trade their FTRs just because they change their schedules, supplier or load locations
• And parties are free to follow ISO economic dispatch instructions without changing their FTRs
In the ISO market settlements, the holder will receive the market value of the FTRs it holds, even if . . .
• It schedules a transaction to/from different points• It doesn’t schedule any transactions• Or the ISO dispatches its generators differently

34
Who Should Get FTRs?
Initial principle: those who pay grid fixed costs get FTRs.
Those who pay for network integrated service – typically LSEs
Those who purchase point-to-point firm service – gencos, LSEs, traders
Applying this principle to transmission upgrades:The entity that pays the costs of an upgrade should receive the net incremental FTRs made feasible by the upgrade• This principle provides important incentives for grid investment

35
Alternative Ways to Allocate FTRs
Initial allocation to those who paid the grid’s fixed costs• This is how other ISO/RTOs got started• Allocates the value of the grid to those who paid/pay its costs
Periodic auctions of FTRs (or the auction revenues)• Allows an efficient allocation to those who value FTRs most• RTO can auction residual FTRs or all of them• What do we do with the auction revenues?
Auction revenue rights = ARRs = Combines both concepts – now used in NY, PJM, NE
From an initial FTR allocation, allocate the corresponding revenue rightsHold FTR auction, then allocate the revenues to the holders of the ARRs

36
How Many FTRs Are Available?
It’s not a fixed number. All LMP-based RTOs allocate FTRs up to the limits of the grid. Grid capacity is not “held back.”
Grid limits are honored by a “simultaneous feasibility test”
If a set of awarded FTRs could be dispatched as injections and withdrawals and not violate any operating security constraints, that set of FTRs is “simultaneously feasible.”• Each FTR is point-to-point: -- “From location A to location B”• There can be many feasible sets – many different combinations
This test uses the same grid assumptions that the ISO expects to use every day.

A B
C
0 MW
900 MW300 MW
900 MW
Feasible Transfers or FTRs:If: 900 from B to C
Then, 0 from A to C
600 M
W
300 MW
A B
C
600 MW 600 MW0 MW
1,200 MW
Feasible Transfers or FTRs:If: 600 from A to C
Then, 600 from B to C60
0 MW
600 MW
A B
C
1,800 MW 0 MW600 MW
1,800 MW
Feasible Transfers or FTRs:If: 1,800 from A to CThen, 0 from B to C
600 M
W
1,200 MW
1 2 3
The Capacity of the Grid is Not Fixed. It Depends on Where Generators Inject and Loads Withdraw,
Relative to Grid Constraints
So, the Number of Feasible FTRs is Also Not Fixed
Many different combinations may be feasible, depending on where the FTRs’ points for injections/withdrawals are defined.
What’s “feasible” depends on which FTR parties request.37
600 MW
Limit
600 MW
Limit
600 MW
Limit

38
Simultaneous Feasibility = Financial Test
Meeting the simultaneous feasibility test also means: there’s enough money to pay the FTR holders. This is sometimes called “revenue adequate.”
If a set of awarded FTRs is simultaneously feasible, then the ISO settlements will usually have enough money to fund all awardedFTRs at full value – even if the dispatch is different.
Exceptions: grid outages or other factors that reduce grid capacity can result in not enough congestion charges collected to fund all outstanding FTRs.
Remedies for inadequate funds: pro-rata settlements, balancing accounts, recovery from increased TO revenue requirements, and TO maintenance incentives.

39
Are There Enough FTRs?
There are enough FTRs to match how you actually operate today.
If you can reliably meet all loads today using the current grid,there is a corresponding allocation of FTRs that is “simultaneously feasible.”
There are probably many such feasible allocations.
Counter-flows help simultaneous feasibility.“Counter-flows” reduce congestion and make other flows possible; so a corresponding set of FTRs would include some “counter-flow FTRs” to make other FTRs feasible.

40
Why Aren’t There Always the FTRs We Want?When we make selection of FTRs voluntary, parties may decline to ask for “counter-flow” FTRs, because they come with some payment risks.
Without counter-flows, some transactions we do today aren’t feasibleAnd the corresponding FTRs would also not be feasible.So MISO requires parties to accept some counter-flow FTRs that correspond with the way they use the system, to allow other FTRs to be allocated. When parties begin to use the auctions, they will start to acquire these counter-flow FTRs on their own.
Sometimes utilities sell “too much” transmission.
Simultaneous use of the grid by all those who were sold “too much firm transmission” would not be feasible . . .So, the corresponding set of FTRs is not simultaneously feasible either.

RTO 101 Session 5:RTO Markets and Resource Adequacy
John Chandley(With thanks/apologies to Ruff, Stoft, Hogan, et al.)
Prepared forOrganization of Midwest ISO States
February-March 2005

2
Part 1: Does Resource Adequacy Require an Installed
Capacity Requirement?

3
Does An Electricity Market Need a Resource Adequacy or Capacity (ICAP) Requirement?In other markets, market clearing prices for the basic commodity are assumed to do the job.
Market-clearing prices are set by the intersection of demand/supply.
• If supplies are tight or demand high, prices rise to “clear” the market.
Expectations of future clearing prices that are high enough overtime to cover the investment costs and risks provide the “correct”investment incentives.
In markets where prices are allowed to “clear the market,” there is no apparent need for capacity/adequacy requirements.

4
Spot Prices Clear the Market in Each Period
Supply Offers
Quantity In MW
Spot prices vary and depend on demand and supply conditions in each period.
P
Demand at 10 am
P
Demand at 5 pm

5
Marginal-cost Offers From High-cost Generators Can Clear the Market At Very High Prices In or Near
Shortage Conditions
Supply Offers
Quantity In MW
D
Q
P
These prices need only occur a few hours each year – in/near shortage conditions

6
Price Responsive Demand Can Set Prices In Shortage Conditions = Willingness to Pay
Supply Offers
Quantity
Clearing Price
Concept requires “real-time” pricing for at least larger price-sensitive loads.
Price responsive demand

7
Some Market Designers Dismiss the Need for Capacity Markets, Because . . . Under competitive conditions, allowing energy (and operating reserve) prices to clear the market solves difficult problems:
The price incentives will be sufficient to support an efficient level of investments (cover fixed and variable costs) for:• The right amount and mix of capacity, at the right locations
In real time, generators have the right incentives to produce when/where they are needed, especially in or near shortage conditions
Consumers have the right incentives for demand-side response
Buyers and sellers have strong incentives to contract to hedge spot price volatility (and contracts will reflect expected spot prices)
Spot plus contract prices are, on average, just and reasonable (in the absence of market power).

8
Some Problems With the Theory
Relies on key (sometimes heroic?) assumptions:
Competitive conditions – but there may/will be some market power
Efficient dispatch/pricing rules (we think we know how to do this)
Strong (justified) belief in regulatory certainty and non-intervention
Practical Problems:Insufficient demand response for markets to clear in shortage conditions – This problem is probably fixable with more Real-Time Pricing!
Allowing generators to define high enough clearing prices requires controversial bidding rules (e.g., PUSH) to set high prices.
Do high bids reflect market power or legitimate marginal costs?

9
The Dilemma For Market Monitors When Faced With Possible Economic Withholding
Q2
P1
P2
Q1
With this offer curve, relatively small changes in output can cause very large changes in price. Is the bid legitimate?
Short-term/emergency output
Nominal output range
Does this Offer Reflect:
• Economic withholding to exercise market power?
or
• Valid marginal cost?
• Spot gas costs?
• High heat rates?
• High opportunity cost?
• Breakdown risks?
• High market prices next door?
• Energy-limited or emission-limited resource?What info do we need to decide?

10
If “Economic Withholding” is Not Allowed, Then Physical Withholding May Increase
Is Unit Withheld Because of:
Market power?
OR
Forced outage?
Maintenance?
Energy limited?
Inflexible bid rules?
Supply Offers
Quantity
Competitive Price?
Price responsive demand
Competitive Price?

11
Who Is At Risk for Spot Price Volatility?
Consumers can be hedged against spot price spikes and volatility. In New England, PJM and New York . . .
• All small consumers (residential and small commercial) pay fixed or average prices for standard offer or default service.
• LSEs shield small/medium consumers from spot prices.
• Larger consumers are free to, and do, contract with their own LSE/retailers or directly with suppliers.
• LSEs and other entities that actually face spot prices all have the ability, incentive and intelligence to hedge themselves through self supply, demand response capability and/or contracts.
Contracting also eliminates incentives to exercise market power in spot energy/reserve markets.

12
In/near Shortage Conditions, Demand-side Response Can Mitigate Price Spikes . . .
Q1
P2
P1
Q2
In or near scarcity, fairly small changes in demand can cause very large changes in price.
D1
D2
RT Pricing for Price-Sensitive Loads May Be the Best (But Mostly Unused) Mitigation Tool

13
Price/Bid Caps Are Still the Political Norm
Uncapped clearing prices lead to unpopular results:
High potential for very high spot price spikes
Price spikes move from business page to front page
Potential for boom/bust investment cycles – from “too little” to “too much” for sustained periods – especially in “young” markets
The reality: Public officials are unlikely to accept the political risks of allowing an “energy-only” market to “work” without price and/or bid caps.

14
If Price Caps Preclude Market-clearing Prices, All Plants Are Adversely Affected
Quantity
Uncapped Clearing
Price
Price Cap
The “missing revenues” = lost contributions to fixed costs
DPeak
The tendency to focus on “peakers” misses much of the under-investment problem.
Base-load plants

15
Capacity Markets Are Attempts to Provide The “Missing Revenues” and IncentivesIf shortage pricing is not allowed in the real-time spot markets, then a workable ICAP mechanism must:
Provide the “missing revenues” -- to support investments in …
• New plants (and Demand-response capability)
• Maintaining, refurbishing existing plants (and DR),
Provide the right incentives -- to ensure that necessary supply/demand-side resources are offered . . .
• When we need them – i.e., at peak hours, and
• Where we need them – i.e., at key grid locations

16
Some Designers Doubt that Capacity Markets Actually Achieve Their Objectives
The goal isn’t just “enough” iron in the ground or 15% reserves. It’s getting enough energy/reserves provided at the right time and the right place at a price consumers are willing to pay.
It’s hard to get the operational incentives right• The right incentives to be available at the right times and places are
the uncapped (competitive) real-time energy and operating reserve prices.
• Correcting the capacity price incentives tends to mimic the spikes that some parties dislike about spot energy prices.
“Good” capacity markets are very hard to design!

17
And Some Capacity Market Designs Invite The Exercise of Market PowerIn the near term, today’s capacity markets tend to have both vertical supply curves and vertical demand curves.
Supply curve -- is almost vertical because new entry usually can’t occur in the short run, even if short-run prices are higher.
Demand curve -- is vertical because the demand is usually a fixed reserve margin requirement, no matter what the price is.
Inelastic demand (fixed reserve margins with no demand response) plus inelastic supply (delayed entry) invites market power.

18
Incentives to Exercise Market Power
The combination of a vertical demand curve and a near-vertical supply curve presents strong incentives to exercise market power.
When there is a surplus, suppliers have an incentive to withhold a little supply to drive up prices.• Any withheld supply shifts
the S curve to the left• A slight shift of the supply
curve to the left can have a huge impact on price.
• This can easily offset the revenues foregone as a result of withholding.
Price
QuantityD
S
Price
Quantity
Price
QuantityD
SP
P

19
Problems with Current ICAP ApproachesDon’t always provide the “missing revenues” for fixed cost recovery
• Temptation is to solve the problem for peakers or new capacity only • Ultimately leads us into “pocket” RFP cycles (SW Connecticut) and RMR.
Don’t provide the right incentives for supply availability at peak• The right incentives at peak are uncapped market-clearing LMPs• ICAP availability is less reliable unless penalties mimic peak LMPs
Don’t provide the right incentives for demand-side response• The right incentives at peak are uncapped scarcity prices• The rationale for ICAP was to avoid paying these RT clearing prices
Don’t provide the right locational incentives• The right incentives at each location are the LMPs• Politics forces even “locational” ICAP into large, politically designed zones
(“déjà vu all over again”)
Can the “market designers” solve these problems? Stay tuned.

20
Part 2: The Role of ISO-Coordinated Capacity Markets

21
Recall What We’re Trying to Do
Reliability is about having the right amount of power at the right locations
at the right times, every second
at prices consumers are willing to pay.
So Reliability is At Least Partly a Real-time Problem
The entity that controls the real-time dispatch is the entity responsible for real-time reliability.
The ISO has to be involved in the solution, no matter what.

22
One Way of Thinking About the ISO Role
In real-time, the ISO maintains reliability via its real time security-constrained economic dispatch.
The set of generators dispatched must be security-constrained
So spot prices will differ by location = LMP
The dispatch should be economically efficient• It should be the “least-cost” dispatch capable of meeting load, given the
binding transmission constraints
Market power must be mitigated to get competitive result• Bid caps may be needed at some locations
Energy/reserve prices must properly incent timely availability

23
Analogous ISO Role in ICAP Markets
In forward capacity markets, supply adequacy can be seen as an extension of the dispatch problem.
Deliverability: The set of generators built/awarded contracts must be physically capable of delivering under their contracts withinsecurity limits.
So capacity prices will differ by location = LICAP
Efficiency: We want an economic set of installed plants/contracts
Market power must be mitigated somehow
Capacity payments must properly incent timely availability

24
Deliverability – Why is it Important?
Without some deliverability solution, ICAP would tend to encourage new generators to site at locations with insufficient transmission to deliver their power to loads during peak periods.
New plants would be sited where it’s cheap to build
But the new capacity would contribute little to reliability when needed
If ICAP payments are a large part of revenues, then the incentive problem is worse.
For any deliverability solution, we need:No unfair barriers to new entry
Long-term contracts for ICAP must be possible
Deliverability solution must ensure reliability criteria are met

25
ISO Role in ICAP Deliverability
ISOs use two approaches in dealing with transmission limits.
A “deliverability” requirement – (PJM and ISO-NE today)• To receive capacity payments, a resource must show that, in combination
with other units, it can “deliver” its capacity to loads.• Capacity owner must upgrade transmission to achieve deliverability.• All capacity receives the same ICAP payment.
Locational capacity requirements (NY and proposed ISO-NE LICAP)• The ISO defines different regions with different ICAP requirements• In ISO auctions, ICAP providers are paid different prices for capacity at
different locations (tend to be sub-regional zones)
Arguably, both approaches are needed if LICAP is zonal. (We may need a “deliverability” rule for transmission limits inside each zone.)

26
ISOs Use Auctions to Promote Efficiency
Eastern ISOs all conduct capacity auctions – yearly, monthly, even daily – to pick resources and allocate costs.
Long-run auctions intended to encourage LSEs to sign long-run forward contracts for capacity
Short-run auctions intended to cure LSE ICAP “deficiencies”
Bilaterals and self-supply are accommodated in the auctions.LSE is credited at the auction price for its offered/cleared resources
LSE is debited at the auction price for its pro rata requirements
LSE is credited (charged) for its extra capacity (deficiency)

27
BiPolar Pricing in Current Capacity Markets
Current PJM/NE markets tend to skip between very low (or zero) prices and very high prices at deficiency.
When there is a surplus, the capacity price tends to be very low, or zero.When there is a slight shortage of capacity, the price rises to the deficiency charge (PD) – a price cap.The more vertical the supply/ demand curves, the more this bipolar pricing occurs.It invites market power.Investment risks are high.
Price
QuantityD
S
Price
Quantity
Price
QuantityD
SPD
P

28
Demand Curve Solutions (NY, NE)
A demand curve approach solves bipolar pricing.The price for capacity varies depending on where supply meets the downward sloping demand curve.The curve reflects intuitive notions:• That capacity above the reliability objective still has some value to
consumers, but at a lower price• That consumers are willing to purchase more adequacy/reliability if
the price is lower, and willing to purchase less adequacy/reliability if the price is higher.
A demand curve reduces incentives for market power. Withholding may raise price some, but not to deficiency charge.
A demand curve can also reduce investment risks, and thus lower investment costs.

29
ROS ICAP Price
ICAP Quantity
Price Ceiling
Net Cost of Entry in ROS
Minimum NYCA
Requirement
Zero-Crossing
Point
NY ISO ICAP Demand Curve

30
Proposed ISO-NE Demand Curve

31
Availability Incentives – How Do We Ensure that Capacity is Available When Needed?Current approaches focus on administrative penalties.
Availability (UCAP) is measured over time (reflects outages) Failure to be available when called results in penaltiesBut penalties seldom match the value of energy/reserves at the time of non-availability – 1 hour’s availability not worth the same as another’s• Only the real-time, non-capped, competitive LMPs can measure RT value.
Recent proposals are moving towards paying capacity a price dependent on being available at the right times.
E.g., in ISO-NE proposal, ISO selects 100 or so critical hours for which payments are madeNon-availability in an hour results in forfeiture of that hour’s paymentThe hours have different values -- an effort to match the payment size to each hour’s importance depending on how close ISO is to shortages.
This is a very difficult design problem for capacity markets!

32
Shortage Pricing of Reserves Can Encourage Timely AvailabilityOne approach to encouraging generators to make their capacity available when it is most needed is to increase the prices paid during periods when we are low on operating reserves.
Operating reserve margin targets are usually fixed, implying a vertical demand curve
But NY ISO uses downward sloping demand curve for operating reserves. (ISO-NE is proposing the same concept.)
Concept: Raise prices paid to generators more rapidly the more that operating reserves fall below reserve targets.
In theory, prices could reach “value of lost load” (VOLL) at the point where blackouts are imminent.
This is an administrative substitute for shortage cost pricing in markets with insufficient demand response.

33
X% Target 0-1%
% of Operating Reserves Above Demand
Demand Curve for Operating Reserves VOLL
Shortage Cost Adder in $/MWh
$1000
$0
Available Supply in MW
Shortage Cost Adder Approach (Illustrative)
5%3%
Rotating blackout warning
Reserve shortage warning
$500
Note: Actual ISO methods may use separate curves for each type of reserves, and simple steps for the “curve”

34
Supply Curve Solutions (PJM-proposed)
Another approach to market power is to design the process to allow new entry by more suppliers. This expands the supply curve.
If the ISO auction is for capacity resources to be available 3-4 years from now, then new entrants can compete by building new plants.
RAM = Resource Adequacy Mechanism = A joint study by PJM, NY and NE ISOs proposed this approach.
Resources would be acquired by ISO in a central auction, ICAP products to be delivered 3-4 years forward – allows new entry1/3 of capacity needs would be acquired each yearInvestors could finance based on forward contracts or ISO payments ISO would charge LSEs for their share of capacity when the obligation to offer that capacity into DAM came due in subsequent years

35
PJM’s Reliability Pricing Model (RPM)
PJM’s recent proposal – Reliability Pricing Model --combines LICAP, demand curves, forward obligation auctions and more ...
Some reliability requirements are not priced in the energy or operating reserve priceToday, ISO buys the services with Reliability-Must-Run (RMR) contracts (based on cost-of-service).
RPM allows generators to offer these services at higher prices in the capacity auction. Plants get paid more if they are (e.g.):
• Dispatchable – they can follow load under dispatch instructions
• Quick-start – they can start up within 30 minutes or less

36
PJM’s Reliability Pricing Model
Key features of the RPMCentralized procurement by PJM (with bilaterals accounted for)Forward auctions (4 years in advance of obligations to supply)Locational requirements/auctions/prices (3 LICAP zones now, then more LICAP zones later)Demand curves for each regionPrice other “reliability” products = load following, quick start, etcSimultaneous optimization for all products in the auction
Allocate costs to LSEs on a load-based pro-rata basis when the products are delivered 3-4 years later.
Can they do all of this in one optimized process? Will stakeholders support it? Is it enough? Stay tuned.

37
Possible PJM Demand Curve from PJM’s“Whitepaper on Future PJM Capacity Adequacy Construct,” November 2004, PJM website
Recommended PJM Demand Curve
0
50
100
150
200
25010
%
11%
12%
13%
14%
15%
16%
17%
18%
19%
20%
21%
22%
23%
24%
25%
ICAP Reserve
ICAP
Pric
e, $
/MW
-Day
Recommended PJM Demand Curve

38
The Need for Administrative Inputs
All current models/proposals for resource adequacy require at least some inputs that are administratively determined.
Energy only with scarcity pricing => pick Value of Lost Load>>
VOLL adder in reserve pricing => define VOLL and demand curve
Installed capacity requirement => pick reserve target, def.charge, etc
Use a demand curve approach => design the demand curve
Use a locational ICAP approach => define the LICAP “zones”
Availability payments => select the hours and their values
There are no “pure market” approaches under consideration.

Grid Expansion and Investments:Grid Expansion and Investments:RTO Planning, Market Incentives RTO Planning, Market Incentives and Regulatory Backstopsand Regulatory Backstops
John John ChandleyChandley
Prepared for Organization of MISO StatesPrepared for Organization of MISO StatesMarch 2005March 2005

2
DisclaimerDisclaimer
Previous RTO 101 presentations sought only to Previous RTO 101 presentations sought only to describe what describe what RTOs RTOs do and why.do and why.
Transmission planning and investment paradigms are Transmission planning and investment paradigms are changing. changing.
TodayToday’’s RTO Regional Expansion Plans are s RTO Regional Expansion Plans are ““works works in progress.in progress.””
What follows is more a perspective What follows is more a perspective –– opinion opinion –– than a than a factual description. I donfactual description. I don’’t assume this is the only t assume this is the only reasonable view, and the jury is still out. reasonable view, and the jury is still out. ---- JCJC

3
Traditional Approach to Transmission Traditional Approach to Transmission
WeWe’’re used to vertically integrated utilities, who:re used to vertically integrated utilities, who:Are primarily Are primarily ““locallocal”” and state regulatedand state regulatedHave a unified obligation to serveHave a unified obligation to serveApply Apply ““license platelicense plate”” rate to their own native loads/customersrate to their own native loads/customers
Vertically integrated utilities planned transmission to Vertically integrated utilities planned transmission to get needed generation to loadget needed generation to load
It is an integrated planning processIt is an integrated planning processThe tradeoffs between transmission and generation are The tradeoffs between transmission and generation are understood and internalizedunderstood and internalizedVirtually all transmission investments are rateVirtually all transmission investments are rate--basedbased
State regulators have varying roles in guiding the State regulators have varying roles in guiding the planning and approving/rateplanning and approving/rate--basing outcomes.basing outcomes.

4
RTOs RTOs and Market Prices Are and Market Prices Are Creating New Opportunities . . . Creating New Opportunities . . .
More regional planning More regional planning –– a logical need given the a logical need given the realities of a regional interconnectionrealities of a regional interconnectionLMP is new LMP is new -- Transparent prices that may signal Transparent prices that may signal when upgrades are economicwhen upgrades are economicFTRsFTRs are new are new -- New system of property rights may New system of property rights may support nonsupport non--raterate--based investmentsbased investmentsNew forums New forums –– RTO creates forum for deciding RTO creates forum for deciding regional/local cost sharing to fund projects with regional/local cost sharing to fund projects with regional/local benefitsregional/local benefits
May help solve key problem when interstate upgrades are May help solve key problem when interstate upgrades are needed/justified but encounter local objections. needed/justified but encounter local objections.

5
. . . But also Potential Pitfalls . . . We . . . But also Potential Pitfalls . . . We See All of These In See All of These In RTOsRTOs TodayToday
Increased chance of interIncreased chance of inter--regional cost shifting regional cost shifting –– is is SW Connecticut a test case or just a transition?SW Connecticut a test case or just a transition?Potential loss of local influence? Need OMSPotential loss of local influence? Need OMSIs new transmission a necessity? Or is transmission Is new transmission a necessity? Or is transmission a competitor? Who decides? How can we tell?a competitor? Who decides? How can we tell?Can Can RTOsRTOs compel compel ““economiceconomic”” investments?investments?
Does regional planning lead to regional IRP to create Does regional planning lead to regional IRP to create ““level playing fieldlevel playing field”” for generation and DR?for generation and DR?Could the IRP Could the IRP ““winnerswinners”” all get rateall get rate--based?based?If so, is this a slippery slope for competitive markets?If so, is this a slippery slope for competitive markets?
6
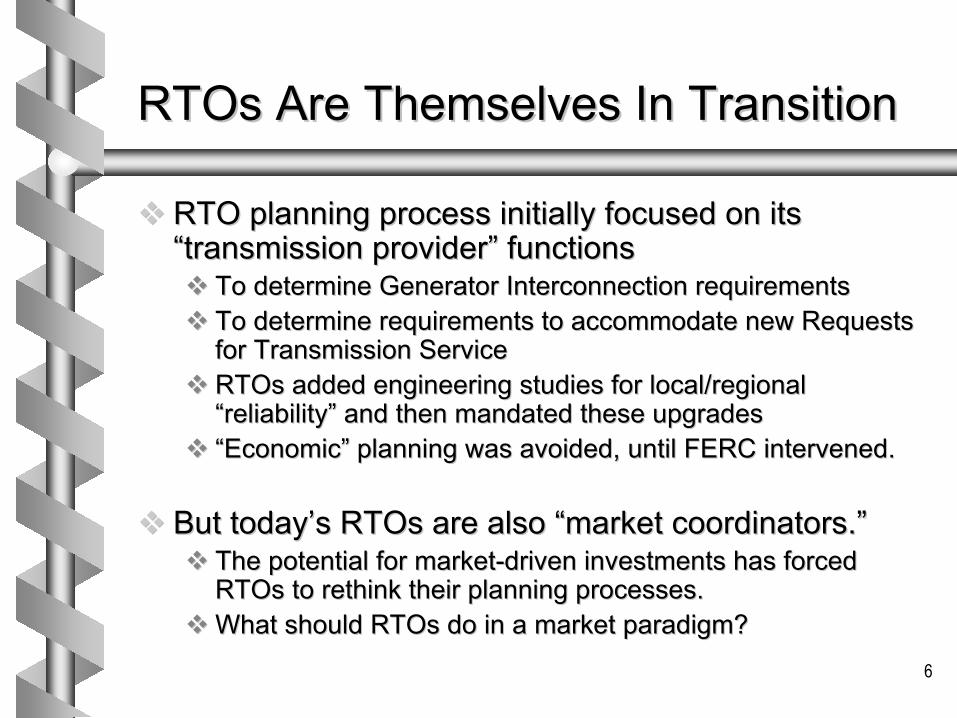
RTOs RTOs Are Themselves In TransitionAre Themselves In Transition
RTO planning process initially focused on its RTO planning process initially focused on its ““transmission providertransmission provider”” functionsfunctions
To determine Generator Interconnection requirementsTo determine Generator Interconnection requirementsTo determine requirements to accommodate new Requests To determine requirements to accommodate new Requests for Transmission Servicefor Transmission ServiceRTOs RTOs added engineering studies for local/regional added engineering studies for local/regional ““reliabilityreliability”” and then mandated these upgradesand then mandated these upgrades““EconomicEconomic”” planning was avoided, until FERC intervened.planning was avoided, until FERC intervened.
But todayBut today’’s s RTOsRTOs are also are also ““market coordinators.market coordinators.””The potential for marketThe potential for market--driven investments has forced driven investments has forced RTOsRTOs to rethink their planning processes. to rethink their planning processes. What should What should RTOs RTOs do in a market paradigm?do in a market paradigm?

7
MISO and OMS PrinciplesMISO and OMS Principles
MISO proposals and OMS general principles mirror MISO proposals and OMS general principles mirror the general trends in PJM and other the general trends in PJM and other RTOsRTOs::
Cost causers should payCost causers should payBeneficiaries should be identified and pay their fair shareBeneficiaries should be identified and pay their fair shareVoltage thresholds can help simplify cost allocationVoltage thresholds can help simplify cost allocationCost allocation should not distort or overwhelm market price Cost allocation should not distort or overwhelm market price signalssignalsLMP/FTR prices can help us define costLMP/FTR prices can help us define cost--effective upgradeseffective upgradesTransmission companies are changing Transmission companies are changing –– Planning and cost Planning and cost allocation rules should accommodate allocation rules should accommodate ITCsITCs, stand, stand--alones, alones, and potential merchant projects.and potential merchant projects.
These seem sound principles These seem sound principles –– but watch the details!but watch the details!

8
Transmission Cost Allocation AffectsTransmission Cost Allocation AffectsGeneration & Efficiency InvestmentGeneration & Efficiency Investment
““Transmission Transmission complementscomplements some electricity some electricity investments and investments and substitutessubstitutes for others. . .for others. . .””
Transmission Transmission complementscomplements generation/efficiency generation/efficiency investments that are distant from loads.investments that are distant from loads.Transmission can Transmission can substitutesubstitute for generation/efficiency for generation/efficiency investments that are in or near load centersinvestments that are in or near load centers
““It follows that transmission investment rules and cost It follows that transmission investment rules and cost allocations can have a significant effect on the allocations can have a significant effect on the incentives for investment in generation and incentives for investment in generation and efficiency.efficiency.””

9
Transmission Cost Allocation:Transmission Cost Allocation:Should Costs Be Socialized?Should Costs Be Socialized?
““If we socialized the cost of transmission investments, the resulIf we socialized the cost of transmission investments, the result t would tip incentives towards more of those generation and would tip incentives towards more of those generation and efficiency investments that were transmission complements efficiency investments that were transmission complements [e.g., generation distant from load]. . . [e.g., generation distant from load]. . . ““At the same time, socializing the cost of transmission At the same time, socializing the cost of transmission investments would blunt the incentives for load center efficiencinvestments would blunt the incentives for load center efficiency y or distributed generation investments that would be transmissionor distributed generation investments that would be transmissionsubstitutes. . . substitutes. . . ““The problem then is not merely selecting the efficient level of The problem then is not merely selecting the efficient level of transmission investment. Even with the right level of transmission investment. Even with the right level of investments, socialization of costs could alter, perhaps investments, socialization of costs could alter, perhaps substantially, the mix and location of generation and efficiencysubstantially, the mix and location of generation and efficiencyinvestments that we seek to leave to the markets.investments that we seek to leave to the markets.””
Bill Hogan, Comments submitted to FERC on New England ISOBill Hogan, Comments submitted to FERC on New England ISO’’s Cost s Cost Allocation Proposal, August 21, 2003Allocation Proposal, August 21, 2003

10
Foundations for MarketFoundations for Market--driven driven InvestmentsInvestments
In a market regime, market prices and the value of In a market regime, market prices and the value of property rights provide investment incentives.property rights provide investment incentives.The key requirements are:The key requirements are:
Price the value of grid usagePrice the value of grid usage ---- this gives investors a means this gives investors a means to determine the market value of investments that expand to determine the market value of investments that expand grid usagegrid usageCapture the market valueCapture the market value ---- Investors need a means to Investors need a means to capture the value of the expansions they pay forcapture the value of the expansions they pay for
Markets based on locational marginal pricing (LMP) Markets based on locational marginal pricing (LMP) and financial transmission rights (and financial transmission rights (FTRsFTRs) can meet ) can meet these requirements these requirements –– at least in theory.at least in theory.

11
HedgeCongestion
(LMPB - LMPA)
LMP Settlements forEnergy and FTRs
RegionalSecurity-
ConstrainedEconomicDispatch
RegionalSecurity-
ConstrainedEconomicDispatch
Self Schedules
Load Bids
Generator Bids
Bilateral Schedules
Features of the RTO Markets WillSupport Market-Driven Grid Investments
RTO FunctionMarket Inputs Market Support
CongestionRedispatch
CoverImbalances
Real-TimeBalancing
Buy ThroughCongestion
(LMPB - LMPA)
Buy and SellIn Spot Market
Market-DrivenIncentives
Auction andAward FTRs
$$$
CalculateNodal Spot
Prices
CalculateNodal Spot
Prices
Ensure Reliability
Expansions andInterconnection

12
LMP Prices the Value of Grid UsageLMP Prices the Value of Grid Usage
LMP congestion charges show the value of grid LMP congestion charges show the value of grid usage = MW times (usage = MW times (LMPLMPsinksink –– LMPLMPsourcesource))
LMP reveals when/whether upgrades are economicLMP reveals when/whether upgrades are economicGrid expansions become economic when the expected Grid expansions become economic when the expected congestion charges over time exceed the costs of upgrades congestion charges over time exceed the costs of upgrades that reduce congestion and reduce/avoid these chargesthat reduce congestion and reduce/avoid these charges
Various parties will have incentives for upgradesVarious parties will have incentives for upgradesLoads seeking access to lowerLoads seeking access to lower--cost resourcescost resourcesGenerators seeking access to loads in constrained areasGenerators seeking access to loads in constrained areasTransmission customers seeking lower congestion chargesTransmission customers seeking lower congestion chargesOwners and merchant investors seeking to capture the value Owners and merchant investors seeking to capture the value of the awarded of the awarded FTRsFTRs

13
FTRsFTRs Are Property RightsAre Property Rights
FTRs FTRs represent the economic value of grid represent the economic value of grid usageusage
Allocated to those who pay the gridAllocated to those who pay the grid’’s fixed costss fixed costsAuctioned to those who value grid usageAuctioned to those who value grid usage
ISO also awards incremental ISO also awards incremental FTRs FTRs to those to those who fund transmission expansionswho fund transmission expansions
Incremental Incremental FTRs FTRs are those simultaneously are those simultaneously feasible with existing feasible with existing FTRsFTRs and made possible by and made possible by the grid expansionthe grid expansion

14
FTR Forward Prices Can Signal the FTR Forward Prices Can Signal the Value of Grid ExpansionsValue of Grid Expansions
Prices paid for Prices paid for FTRs FTRs in ISO auctions and in ISO auctions and secondary trades send important price secondary trades send important price signals:signals:
They tend to reflect the value the market places on They tend to reflect the value the market places on avoiding congestion charges (usage charges)avoiding congestion charges (usage charges)
Forward FTR prices reflect what the market Forward FTR prices reflect what the market might pay to have an upgrade built in lieu of might pay to have an upgrade built in lieu of continuing to pay the congestion charges or continuing to pay the congestion charges or buying buying FTRsFTRs

15
Awarding Awarding FTRsFTRs Allows Investors to Allows Investors to Capture Value from Grid ExpansionsCapture Value from Grid Expansions
Awarding incrementalAwarding incremental FTRsFTRs for grid expansions gives for grid expansions gives investors a means to capture the market value investors a means to capture the market value
Efficient grid expansions wonEfficient grid expansions won’’t eliminate congestion, so t eliminate congestion, so awardedawarded FTRsFTRs still have valuestill have valueExpanding to Expanding to eliminateeliminate congestion is probably not economiccongestion is probably not economic
Investors can use Investors can use FTRsFTRs to capture value: to capture value: By selling the awarded By selling the awarded FTRs FTRs to the market in advance, via to the market in advance, via ““open seasonsopen seasons”” or in secondary tradesor in secondary tradesBy selling the awarded By selling the awarded FTRsFTRs in the RTO auctionsin the RTO auctions
LongLong--run run FTRs FTRs are awarded, but monthly rights can be soldare awarded, but monthly rights can be soldOr they can use the Or they can use the FTRs FTRs to hedge their own transactions to hedge their own transactions

16
Not All Upgrades Expand Capacity: Not All Upgrades Expand Capacity: Some May Dilute Existing Some May Dilute Existing FTRsFTRs
The general rule is that the investor in an upgrade The general rule is that the investor in an upgrade receives the set of incrementalreceives the set of incremental FTRs FTRs made feasible made feasible by the upgrade.by the upgrade.
If an upgrade makes some existing If an upgrade makes some existing FTRs FTRs not not feasible, then counterfeasible, then counter--flow flow FTRsFTRs would be awarded would be awarded to the investor, so that existing to the investor, so that existing FTRsFTRs remain feasible.remain feasible.
The resulting incentive will be to avoid upgrades that The resulting incentive will be to avoid upgrades that on net diminish the value of the grid, while on net diminish the value of the grid, while encouraging encouraging ““beneficialbeneficial”” upgrades.upgrades.

17
Are MarketAre Market--driven Investments driven Investments Enough?Enough?
Even with the right locational incentives and Even with the right locational incentives and the award of FTR property rights, market the award of FTR property rights, market failures occur.failures occur.
Free rider problems may prevent investment Free rider problems may prevent investment coalitionscoalitions““LumpinessLumpiness”” issues may discourage private issues may discourage private investment coalitions investment coalitions ––
E.g., the most costE.g., the most cost--effective upgrade is so big and has effective upgrade is so big and has such a broad impact on prices, that it creates many such a broad impact on prices, that it creates many dispersed beneficiaries dispersed beneficiaries –– coalition is not possible.coalition is not possible.
A regulatory backstop is needed for these A regulatory backstop is needed for these market failuresmarket failures

18
Possible Rules for Regulatory Possible Rules for Regulatory BackstopBackstop
The economic test should still applyThe economic test should still applyExpected congestion costs should exceed upgrade costsExpected congestion costs should exceed upgrade costs
Regulators should also require a showing of Regulators should also require a showing of market failuremarket failure
Otherwise, regulated investments will drive out marketOtherwise, regulated investments will drive out market--driven investmentsdriven investments
RTO/regulators should allocate costs to RTO/regulators should allocate costs to beneficiaries, where they can be determinedbeneficiaries, where they can be determined
This will discourage free riders and encourage marketThis will discourage free riders and encourage market--driven investments by beneficiary coalitionsdriven investments by beneficiary coalitions

19
A A ““Bright LineBright Line”” for Grid Investmentsfor Grid Investments
Ideally, weIdeally, we’’d want a d want a ““bright linebright line”” to tell us when to tell us when regulation should intervene and when to let the regulation should intervene and when to let the market decide.market decide.
If regulation intervenes too quickly, and costs are socialized If regulation intervenes too quickly, and costs are socialized and rateand rate--based, it crowds out marketbased, it crowds out market--driven expansiondriven expansionMarket reluctance to proceed may be the right decisionMarket reluctance to proceed may be the right decision
A possible A possible ““bright linebright line”” might be:might be:Focus regulatory backstop on expansions with large scale Focus regulatory backstop on expansions with large scale economies with many beneficiarieseconomies with many beneficiariesE.g., high voltage lines with broad regional impactsE.g., high voltage lines with broad regional impactsThese are cases where These are cases where ““market failuremarket failure”” is most likely is most likely because of free rider problems and/or economies of scale.because of free rider problems and/or economies of scale.

20
A Foundation for MarketA Foundation for Market--Based Based Investment Would Include . . .Investment Would Include . . .
A market design with LMP and A market design with LMP and FTRs FTRs These are core features of These are core features of MISOMISO’’ss marketsmarkets
Rules to award Rules to award FTRs FTRs for investmentsfor investmentsMISO agrees in concept, but rules not developed yetMISO agrees in concept, but rules not developed yet
Consistent, open interconnection rulesConsistent, open interconnection rulesFERC agrees in concept, but . . .FERC agrees in concept, but . . .
Level playing field for merchant investmentsLevel playing field for merchant investmentsAre merchants allowed in your state?Are merchants allowed in your state?
A regulatory backstop that goes last, not firstA regulatory backstop that goes last, not firstA bright line could cede most A bright line could cede most ““economiceconomic”” investments to the investments to the marketmarket

RT 101: Case StudyTransmission Cost Allocation
For ISO-New England
Prepared forOrganization of Midwest ISO States
March 2005

2
Transmission Planning in NE
• ISO-NE planning process– ISO-NE conducts an annual planning process to determine the
need for new transmission expansions and upgrades.
• Factors considered:– Reliability studies– Anticipated new generation interconnections– Anticipated generation retirements– Forecast load growth and demand response– Expansion proposals from project proponents
• RTEP = Regional Transmission Expansion Plan

3
RTEP Identifies Two Types of “Need”
• Reliability upgrades = any upgrade/expansion ISO finds to be necessary to ensure reliable operation of the New England transmission system – A very broad definition
• Economic upgrades = any upgrade/expansion that produces net economic benefits to the region as a whole (not each/every sub-region)– Another broad definition: larger upgrades “virtually
always provide diffuse benefits through the integrated network, often immediately and certainly over the useful life of those facilities.” – ISO-NE filing

4
Participant Funding Option
• Once the RTEP is approved, ISO-NE allows an opportunity for market participants who might benefit from the upgrades/expansions to propose and fund any “needed” facilities.
• Entities who might come forward:– Traditional transmission owners/utilities– Independent transmission companies – Merchant transmission companies– Investment coalitions of generators/traders/LSEs

5
Participant Funded Projects• Generator interconnection upgrades – generator pays
– Usually radial lines from plant to connect to network
• “Merchant” proposals – merchant investors pay– Those who fund upgrades receive the incremental FTRs
• “Elective” upgrades – proponent/developer pays– Any party can volunteer to invest in an expansion or upgrade– Party receives the incremental FTRs.
• “Local Benefit” upgrades – Local sub-region pays– Any project rated below 115 kV – benefits assumed to be local– Projects 115 kV and above that aren’t “Pool” facilities, if any
• Localized Costs (“goldplating”) – Local sub-region pays
Same?

6
Mandated Upgrades
• If no parties come forward to fund RTEP projects under the “participant funding” approach, then ISO-NE can direct that the relevant transmission owner(s) construct the projects approved in the RTEP.
• The question then becomes:
– To whom should the costs be allocated?

7
FERC’s Directives
• When the cost allocation proceeding began, ISO-NE was under FERC Orders to develop a “default” transmission cost allocation proposal.
• The plan should be– Compatible with the new “standard market design”
(based on LMP and FTRs)– Enjoy broad stakeholder support– An objective way to resolve disputes, unbiased– Result in a “just and reasonable” allocation of costs
for transmission expansions

8
Cost Allocation – Reliability Projects
• By definition, reliability projects are “needed” to ensure reliable operation of the system– The implication is that all of NE benefits
• Project costs are allocated to all Network Integrated Transmission Service (NITS) users throughout the ISO region.– No attempt to identify and allocate to “beneficiaries”– All costs are socialized throughout the ISO region– According to ISO-NE, virtually all projects in the
current RTEP, including SW Connecticut and NEMA Boston upgrades, are needed for “reliability”

9
Cost Allocation – Economic Projects• In the past, FERC policies urged ISOs to identify
beneficiaries and to allocate project costs to the beneficiaries – a principle of “cost causer pays”
• In a 2003 “White Paper,” FERC proposed to defer to regions on cost allocation policies, especially if the Regional State Committee agreed with an approach
• In 2003 ISO-NE case, FERC deferred to a joint filing by ISO-NE and NEPOOL on cost allocation, even though …
– There was no New England RSC in existence yet, and– The six NE states were equally divided – 3 for and 3 against
• MA DTE, Connecticut DPUC supported the ISO; Maine, Rhode Island opposed ISO allocation scheme.

10
“Regional” vs “Local” Benefits
• ISO-NE proposal distinguished upgrades that had “regional” benefits and projects that had “local” benefits.
• If the upgrade had only “local” benefits, then– Costs would be allocated to the “local” sub-region that was the
principal beneficiary• If the upgrade had “regional” benefits, then . . .
– Costs would be allocated across the ISO-NE region and all sub-regions would pay a load-based pro rata share of costs
• Most upgrades with 115 kV or higher are deemed to have “regional” benefits – to minimize disputes– So, most projects would automatically be “regional”

11
Differences Over Cost Allocation Focused on “Local” vs “Regional”
• Some parties favored a closer search for and allocation of costs to specific/local beneficiaries.– Maine and Rhode Island opposed having all costs
socialized across the region. • They preferred allocating 25% regional, 75% local, if specific
beneficiaries could not be sufficiently identified• This could limit their responsibility for the costs of upgrades
in SW Connecticut and North East MA/Boston– Some independent generators also saw regionally
allocated costs as undermining the generation market• Some transmission competes against some generation• So socializing most transmission investments could put some
generation investment at a competitive disadvantage

12
Support for Broad “Regional” Cost Allocation Rule
• Many parties (including Mass and Conn regulators) favored rules that recognize regional benefits and assign costs regionally.
• Since virtually all RTEP projects were viewed by ISO as either needed for reliability or benefitting the entire region, this meant:
– All RTEP projects would have their costs allocated regionally
– No RTEP expansion costs would be paid solely by “local”beneficiaries

13
Potential Winners When a Broad “Regional” Definition is Used
• Sub-regions in need of expansion, like SW Connecticut and NEMA/Boston, can benefit from spreading costs to others.– Loads inside these areas would benefit from lower
energy costs and congestion charges, while spreading costs to others
• Generators located outside these areas might benefit from improved access to those loads and lower congestion charges in serving them.

14
Potential Losers When a Broad “Regional” Definition is Used
• Generators located inside congested areas might see lower prices if socialized transmission upgrades reduced congestion into their area.
• Loads outside these congested areas may see fewer benefits, or even higher prices, but pay an equal share of costs.
• Merchant transmission investors would find investment coalitions harder to form, because specific beneficiaries would prefer to wait and let all NE loads pay for the upgrade. (Classic “free rider” problem)

15
FERC’s Decision On ISO-NE
• On December 18, 2004, FERC approved the ISO-NE/NEPOOL proposal
– It rejected the protests of a coalition of Maine, Rhode Island, and several independent gencos.
– It cited favorably the broad stakeholder support (78% NEPOOL vote) and discounted the 3 to 3 state split.
– It agreed with ISO-NE on liberal definitions of “regional” benefits

16
FERC’s Decision On ISO-NE
• A strong dissent by Commissioner Nora Brownell– ISOs should make greater effort to identify economic
beneficiaries and allocate costs to them
– Reliability upgrades should be socialized, but . . .• A less expansive definition of “reliability” should be used
– Deference to regional wishes can’t override FERC’sstatutory mandate to determine if approach is “just and reasonable”