Embed Size (px)
Citation preview
Examensarbete Master ThesisAgronom - mark/växt
SLU, Institutionen för energi och teknik Examensarbete 2010:02 Swedish University of Agricultural Sciences ISSN 1654-9392 Department of Energy and Technology Uppsala 2010
RTLS - Real time location systems An inventory study for agriculture applications and requirements
RTLS - Real tid lokaliserings system
Mattias Larsson
En inventering av användningsområden inom lantbruket
SLU, Sveriges lantbruksuniversitet Institutionen för energi och teknik Swedish University of Agricultural Sciences Department of Energy and Technology RTLS- Real Tid Lokaliserings System- En inventering av lantbruksapplikationer och dess krav
RTLS- Real Time Location Systems- An inventory study for agriculture applications and requirements
Författare/Author: Mattias Larsson Handledare/Supervisor: Anders Larsolle, SLU, Dept. of Energy and Technology
Anna Rydberg, JTI, Institute of Agricultural and Environmental Technology
Examinator/Examiner: Per-Anders Hansson, SLU, Dept. of Energy and Technology Kurskod/Course code: EX0579 Independent project/degree project in agricultural science, Advanced Level, 30 HEC Examensarbete (Institutionen för energi och teknik) Master’s Thesis (Department of Energy and Technology) ISSN 1654-9392 2010:02 Uppsala 2010 Nyckelord/Key words: RTLS, RFID, VIR, Herd management, traceability, precision
agriculture, Irrigation management
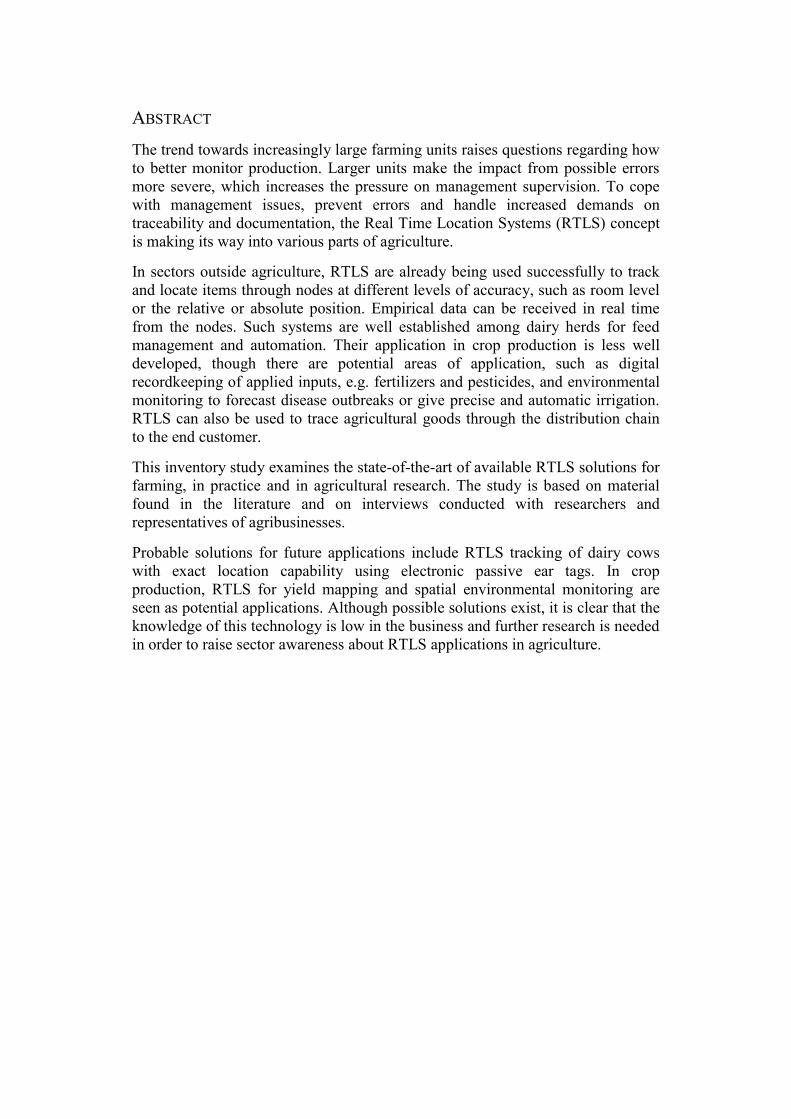
ABSTRACT
The trend towards increasingly large farming units raises questions regarding how to better monitor production. Larger units make the impact from possible errors more severe, which increases the pressure on management supervision. To cope with management issues, prevent errors and handle increased demands on traceability and documentation, the Real Time Location Systems (RTLS) concept is making its way into various parts of agriculture.
In sectors outside agriculture, RTLS are already being used successfully to track and locate items through nodes at different levels of accuracy, such as room level or the relative or absolute position. Empirical data can be received in real time from the nodes. Such systems are well established among dairy herds for feed management and automation. Their application in crop production is less well developed, though there are potential areas of application, such as digital recordkeeping of applied inputs, e.g. fertilizers and pesticides, and environmental monitoring to forecast disease outbreaks or give precise and automatic irrigation. RTLS can also be used to trace agricultural goods through the distribution chain to the end customer.
This inventory study examines the state-of-the-art of available RTLS solutions for farming, in practice and in agricultural research. The study is based on material found in the literature and on interviews conducted with researchers and representatives of agribusinesses.
Probable solutions for future applications include RTLS tracking of dairy cows with exact location capability using electronic passive ear tags. In crop production, RTLS for yield mapping and spatial environmental monitoring are seen as potential applications. Although possible solutions exist, it is clear that the knowledge of this technology is low in the business and further research is needed in order to raise sector awareness about RTLS applications in agriculture.

SWEDISH SUMMARY SAMMANFATTNING Trenden med en strukturrationalisering mot större enheter med mindre personal per producerad enhet höjer behovet av en effektiv produktionsövervakning. Stora enheter med hantering av stora varuflöden leder till att ett misstag får större konsekvenser och det gör att kraven som ställs på lantbrukaren ökar. För att klara detta och möta större krav på spårbarhet och dokumentation skulle RTLS (Real Tid Lokaliserings System) kunna hjälpa till att automatisera eller åtminstone effektivisera dokumentation spårbarhet och även precision inom lantbruksproduktionen.
Inom andra branscher än lantbruk har redan RTLS gjort sitt intåg, det används inom logistik och transport, sjukhus och på byggarbetsplatser för att ge möjlighet att spåra verktyg, varor och personal för att snabbt kunna se var de befinner sig och enkelt göra t ex en löpande lagerinventering. Det finns olika noggrannhet i systemet. Man pratar om exakt positionering där man ger föremålets placering en kordinat, det vanligaste är dock att man placerar läsare vid strategiska platser för att avläsa när objektet passerar genom t ex en dörr.
Ett RTLS kan vara uppbyggt på olika vis, genomgående är dock att systemet har en eller flera läsare och taggar som är fästa på de enheter man vill registrera. Taggarna kan vara utformade på olika vis, den här studien behandlar främst system med passiva RFID (Radio Frekvens Identifikation) taggar men även aktiva taggar förekommer. I ett passivt system saknar taggarna batteri och är uppladdade av ett elektromagnetiskt fält som sänds ut av läsaren. Aktiva taggar har längre räckvidd än passiva men batterierna måste bytas och taggarna är betydligt dyrare.
Det finns ett antal potentiella applikationer för RTLS inom lantbruket, inom animalieproduktion är framförallt ett system för exakt positionsbestämning av djur med hjälp av passiva taggar i form av elektroniska öronmärken. Ett sådant system skulle kunna användas för att spåra upp djur i stora besättningar men även ersätta befintliga system för brunstpassning och transponderutfodring. Inom växtodling skulle ett potentiellt system kunna samla in klimatdata i ett fält och bearbeta denna för att skapa exakta bevattningskartor eller sjukdomsprognoser. Ett annat system skulle kunna användas för att skördekartera och spåra skördade produkter.
Slutsatsen är dock att det finns stora möjligheter med RTLS inom varierande applikationer, dock är kunskapen om möjligheterna mycket liten och mer undersökningar behövs för att underbygga de olika systemens praktiska tillämpbarhet

PREFACE
This work was commissioned by the Swedish Institute for Agriculture and Environmental Technology as part of their future development projects.
The conclusions drawn by this work will set the basis for a second Master’s project examining the technical design of equipment that could be used in future agriculture. Ultimately, this project might result in new products being developed for agriculture applications.
During the time-span of this work, from late summer to Christmas, the development of RTLS in the agricultural sector progressed further. During the period, several new articles on the subject were published and a newly launched system for cow management rather similar to that proposed in the present work was exhibited at Agromek, an agrotechnical exhibition in Denmark. This can be pessimistically interpreted as the present project being completed too late, or optimistically interpreted as showing that this report is at the front line of agricultural research and that the ideas presented are of high current relevance. There is clearly rapid progress underway in the area of RTLS for agriculture, so a review of the state-of-the-art is urgently needed.

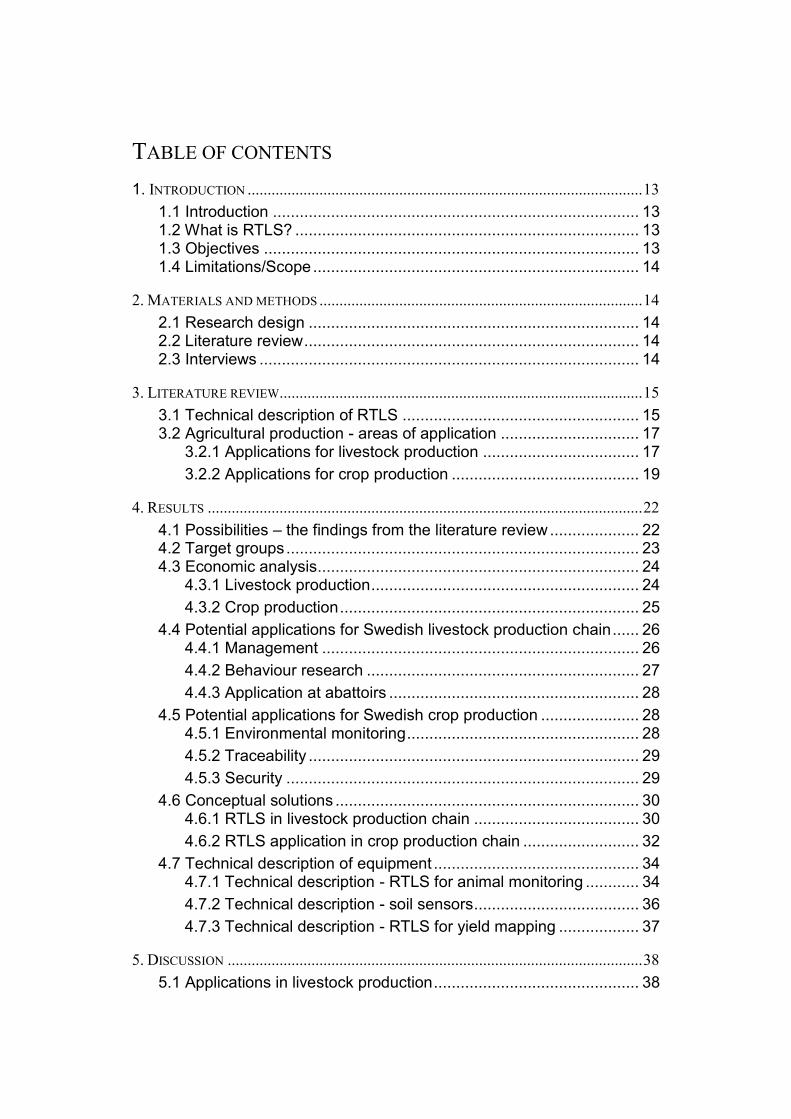
TABLE OF CONTENTS 1. INTRODUCTION ................................................................................................... 13
1.1 Introduction .................................................................................. 13 1.2 What is RTLS? ............................................................................. 13 1.3 Objectives .................................................................................... 13 1.4 Limitations/Scope ......................................................................... 14
2. MATERIALS AND METHODS ................................................................................. 14
2.1 Research design .......................................................................... 14 2.2 Literature review ........................................................................... 14 2.3 Interviews ..................................................................................... 14
3. LITERATURE REVIEW........................................................................................... 15
3.1 Technical description of RTLS ..................................................... 15 3.2 Agricultural production - areas of application ............................... 17
3.2.1 Applications for livestock production ................................... 17
3.2.2 Applications for crop production .......................................... 19
4. RESULTS ............................................................................................................. 22
4.1 Possibilities – the findings from the literature review .................... 22 4.2 Target groups ............................................................................... 23 4.3 Economic analysis ........................................................................ 24
4.3.1 Livestock production ............................................................ 24
4.3.2 Crop production ................................................................... 25
4.4 Potential applications for Swedish livestock production chain ...... 26 4.4.1 Management ....................................................................... 26
4.4.2 Behaviour research ............................................................. 27
4.4.3 Application at abattoirs ........................................................ 28
4.5 Potential applications for Swedish crop production ...................... 28 4.5.1 Environmental monitoring .................................................... 28
4.5.2 Traceability .......................................................................... 29
4.5.3 Security ............................................................................... 29
4.6 Conceptual solutions .................................................................... 30 4.6.1 RTLS in livestock production chain ..................................... 30
4.6.2 RTLS application in crop production chain .......................... 32
4.7 Technical description of equipment .............................................. 34
4.7.1 Technical description - RTLS for animal monitoring ............ 34
4.7.2 Technical description - soil sensors ..................................... 36
4.7.3 Technical description - RTLS for yield mapping .................. 37
5. DISCUSSION ........................................................................................................ 38
5.1 Applications in livestock production .............................................. 38
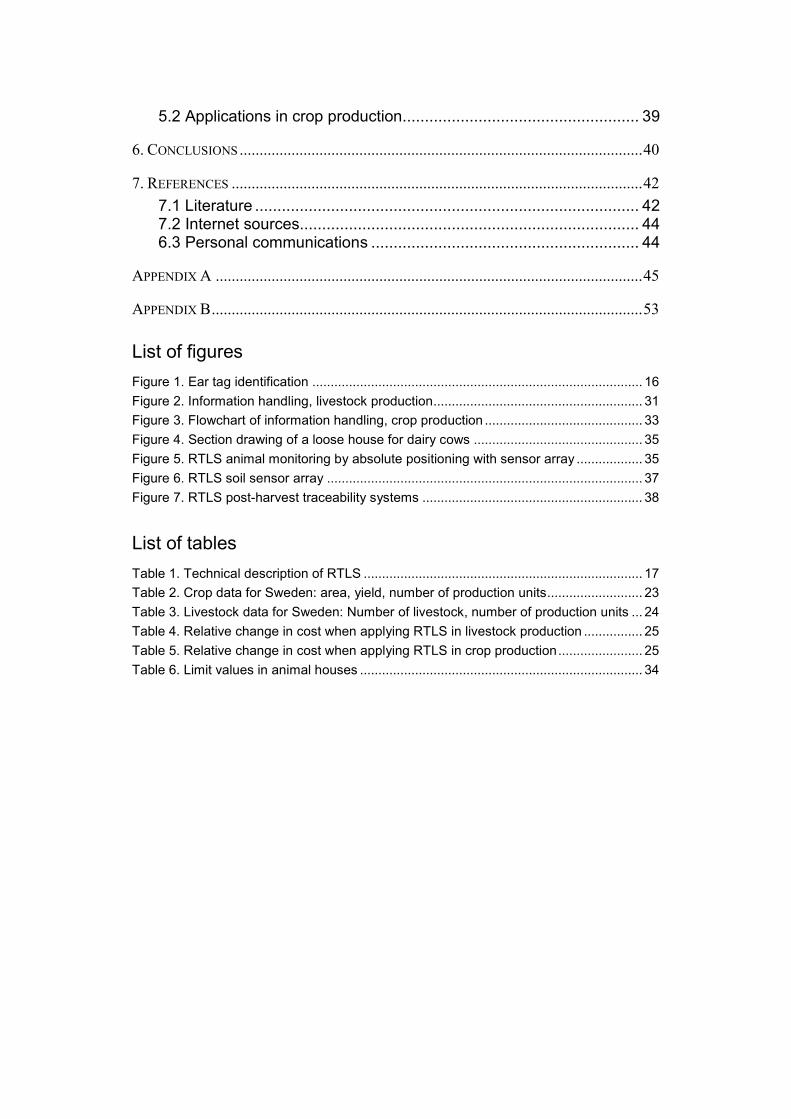
5.2 Applications in crop production..................................................... 39
6. CONCLUSIONS ..................................................................................................... 40
7. REFERENCES ....................................................................................................... 42
7.1 Literature ...................................................................................... 42 7.2 Internet sources............................................................................ 44 6.3 Personal communications ............................................................ 44
APPENDIX A ........................................................................................................... 45
APPENDIX B ............................................................................................................ 53
List of figures Figure 1. Ear tag identification .......................................................................................... 16
Figure 2. Information handling, livestock production ......................................................... 31
Figure 3. Flowchart of information handling, crop production ........................................... 33
Figure 4. Section drawing of a loose house for dairy cows .............................................. 35
Figure 5. RTLS animal monitoring by absolute positioning with sensor array .................. 35
Figure 6. RTLS soil sensor array ...................................................................................... 37
Figure 7. RTLS post-harvest traceability systems ............................................................ 38
List of tables Table 1. Technical description of RTLS ............................................................................ 17
Table 2. Crop data for Sweden: area, yield, number of production units .......................... 23
Table 3. Livestock data for Sweden: Number of livestock, number of production units ... 24
Table 4. Relative change in cost when applying RTLS in livestock production ................ 25
Table 5. Relative change in cost when applying RTLS in crop production ....................... 25
Table 6. Limit values in animal houses ............................................................................. 34
Nomenclature
RTLS Real Time Location Systems
RFID Radio Frequency Identification
GNSS Global Navigation Satellite System
GPS Global Positioning Systems
GLONASS Global Navigation Satellite System
VRI Variable Irrigation Rate
EID Electronic Identity Tag
IR Infra red
RF Radio Frequency
Sensor array Network of sensors
Rumen bolus Identity tag inserted in rumen
Node One sensor in a network

13
1. INTRODUCTION
1.1 INTRODUCTION
Farming is being concentrated into increasingly large units and production units are tending to become more specialised, with an increased level of mechanisation. This means that fewer people are now responsible for a larger amount of agricultural products. There is a wide range of applications in agriculture where positioning of different units is desired. In animal production there are obvious benefits in being able to track and find individuals in large herds of e.g. cattle or pigs. In addition, public opinion is placing pressure on agriculture to increase animal welfare and decrease negative environmental impacts. Farmers today have large amounts of paperwork to complete on recording of cattle and farm operations to meet the demands for traceability from the health and environment authorities. In future, agriculture will face an increased demand for food due to a growing global population, as well as a reduced input of energy due to lower availability of fossil fuels. One way of managing the increased food production and reducing energy consumption, without increasing the negative impact on the environment, is to use technologies for precision agriculture. In large herds of animals it is difficult for the farmer or herdsman to monitor all individuals, although failure to do so can cause severe suffering for weak animals and loss of income. Satellite positioning, such as GPS or Glonass, is already an established method in agriculture, but it is limited by obstacles in the signal pathway, such as tree foliage or building roofs. In addition, this technology is advanced and expensive if one unit has to be purchased per animal. This is where RTLS (Real Time Location Systems) could be of interest.
Whether it concerns traceability, precision farming or animal welfare, a system is needed to aid the farmer in his daily work. Real Time Locating Systems could be used to solve this need for real time information and recording.
This report explains what the RTLS concept is and how it can be used in different applications. It also provides suggestions on where future work should be done to meet the need for technical solutions.
1.2 WHAT IS RTLS?
Real Time Locating Systems (RTLS) enable the user to track items and/or receive data from the tracked items in real time. The RTLS uses tags and receivers which usually communicate by radiofrequency signals. Such tags are called RFID (Radio Frequency Identification) tags.
1.3 OBJECTIVES
The overall aim of this project was to identify areas where RTLS can be applied within the agricultural sector, describe the different applications and the technical demands on these applications and determine the role RTLS play at present and in the future. In order to fulfil this aim, the specific objectives of the study were to:
14
1. Identify and describe the main areas of present RTLS applications in agriculture.
2. Identify and evaluate future fields of application in agriculture.
1.4 LIMITATIONS/SCOPE
The scope of this work was to find helpful solutions in livestock and crop production. Forestry was excluded.
The study did not deal with technical details, since these will be addressed in a second Master’s project based on the findings of the present work.
The work was limited to finding solutions suitable for Scandinavian agriculture.
2. MATERIALS AND METHODS In order to locate the main areas where RTLS have their most extensive utilisation, it is important to have thorough background knowledge of previous developments in the area. This knowledge was acquired here through a literature review based on library services and online databases of scientific papers. Once the background had been established, the most important areas were chosen.
2.1 RESEARCH DESIGN
The primary methods used to achieve the objectives stated above for this thesis were:
1. An extensive literature review 2. Interviews with scientists, authorities and industry. 3. Evaluation of methods 1 and 2.
2.2 LITERATURE REVIEW
The literature review aimed to provide an understanding of the past and present and to show the stage of research for future applications. The majority of the literature reviewed was obtained from scientific databases and conference proceedings.
2.3 INTERVIEWS
Interviews were held to identify areas where RTLS can be beneficial. Since this project sought solutions for livestock production and crop production, a large variety of different production forms were included. This made it difficult to achieve representative results from quantitative farmer interviews. However, since the number of farm businesses and scientists was relatively limited, it suited the time frame of this study to establish a analysis based on the results of qualitative interviews with those stakeholders.
List of interviewees:
15
Christina Ohlsson; DeLaval; Solution manager; 11/10/2009 Göran Nybom; Tractechnology; 06/10/2009 Jenny-Ann Sundelöf; Ugglarps AB; Supply manager; 01/10/2009 Joakim Ekelöf; SLU; Scientist; 13/10/2009 Johan Arvidsson; SLU; Scientist; 23/10/2009 Kristher Svensson; Scan, supply manager; 28/10/2009 Kristina Lindgren; JTI; 30/09/2009 Lars Andersson; OLW; Local manager; 01/12/2009 Mats Karlsson; Yara, Product flow manager; 29/10/2009 Sören Kjellström; Chief herdsman; 07/10/2009 Per Peetz Nielsen; SLU; Scientist; 23/09/2009 Peter Malm; HS Kristianstad; 02/10/2009
3. LITERATURE REVIEW
In order to understand and evaluate potential applications, it is essential to understand the basis of RTLS. This section gives a brief description of the technical functions behind RTLS and their different applications. It also gives a review of the applications used in commercial agriculture and in research, as well as potential future applications.
3.1 TECHNICAL DESCRIPTION OF RTLS
Real Time Locating Systems do exactly what the name indicates: they track the location of units in real time. They also supply measured values from the unit. A system consists of four main components.
Tags: Small electronic units that can be attached to a wide range of subjects.
Location sensors: Reading antennae that can locate the tag.
Location engine: Software that allows communication between tags and location sensors.
Middleware and application software: The interface that communicates with the end-user
The units can be located at fixed points and return values from the predefined point, or can be attached to a moving subjects, in which case the system can locate these. There are different ways of locating objects, with differing accuracy of exact positioning.
Presence-based location: The tag location is returned in terms of whether it is present in a certain area. For example, the cow has entered the feeding area.
16
Location at room level: The tag location is returned in terms of whether it is in one corner of the room or another. For example whether a cow is at feeding station number 1 or 2.
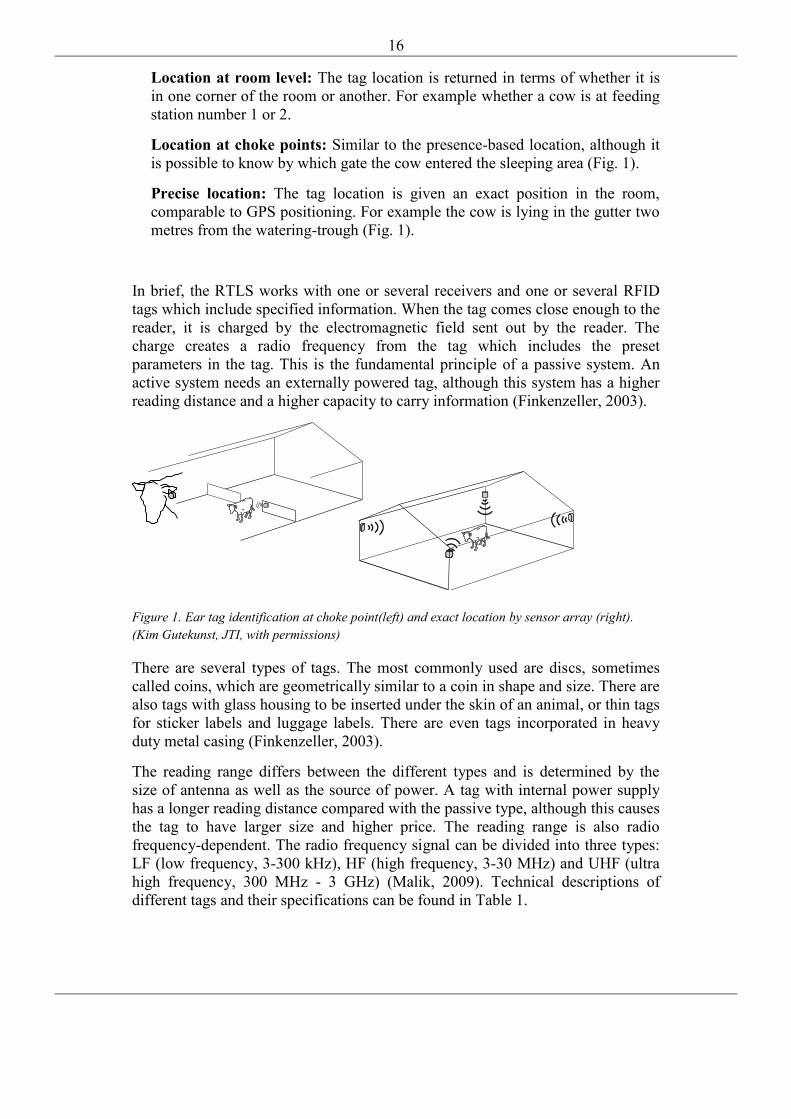
Location at choke points: Similar to the presence-based location, although it is possible to know by which gate the cow entered the sleeping area (Fig. 1).
Precise location: The tag location is given an exact position in the room, comparable to GPS positioning. For example the cow is lying in the gutter two metres from the watering-trough (Fig. 1).
In brief, the RTLS works with one or several receivers and one or several RFID tags which include specified information. When the tag comes close enough to the reader, it is charged by the electromagnetic field sent out by the reader. The charge creates a radio frequency from the tag which includes the preset parameters in the tag. This is the fundamental principle of a passive system. An active system needs an externally powered tag, although this system has a higher reading distance and a higher capacity to carry information (Finkenzeller, 2003).
Figure 1. Ear tag identification at choke point(left) and exact location by sensor array (right).(Kim Gutekunst, JTI, with permissions) There are several types of tags. The most commonly used are discs, sometimes called coins, which are geometrically similar to a coin in shape and size. There are also tags with glass housing to be inserted under the skin of an animal, or thin tags for sticker labels and luggage labels. There are even tags incorporated in heavy duty metal casing (Finkenzeller, 2003).
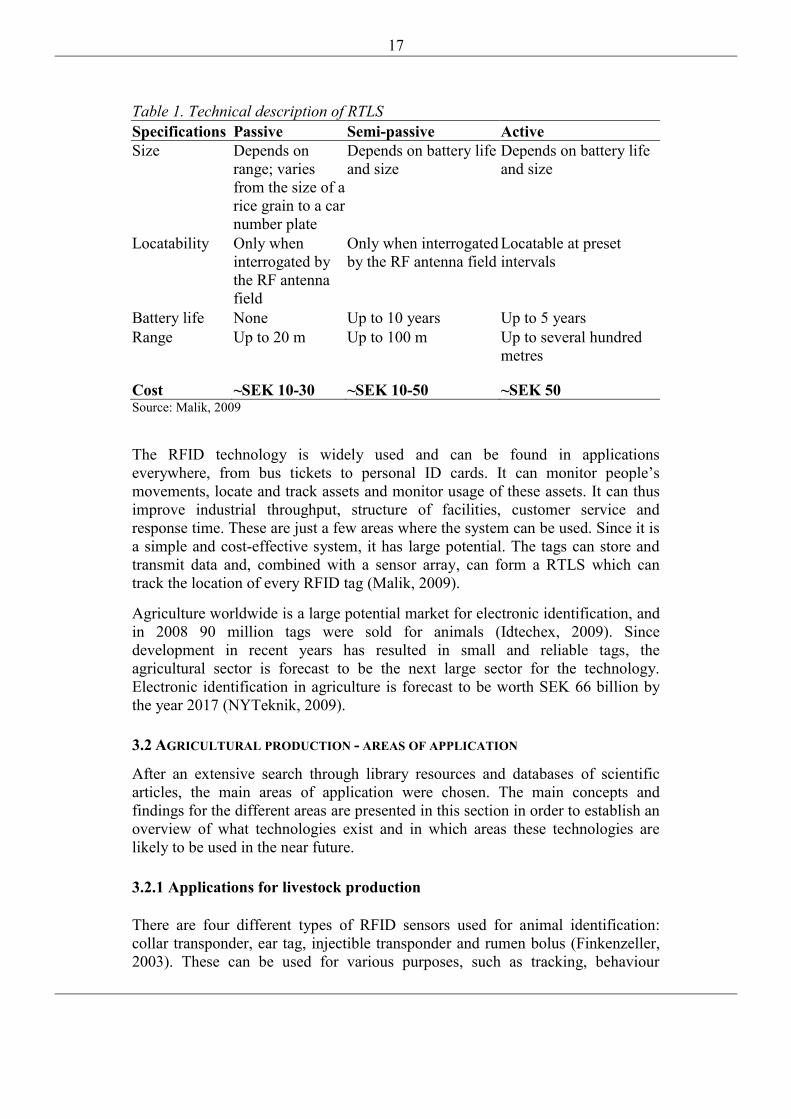
The reading range differs between the different types and is determined by the size of antenna as well as the source of power. A tag with internal power supply has a longer reading distance compared with the passive type, although this causes the tag to have larger size and higher price. The reading range is also radio frequency-dependent. The radio frequency signal can be divided into three types: LF (low frequency, 3-300 kHz), HF (high frequency, 3-30 MHz) and UHF (ultra high frequency, 300 MHz - 3 GHz) (Malik, 2009). Technical descriptions of different tags and their specifications can be found in Table 1.
17
Table 1. Technical description of RTLS Specifications Passive Semi-passive Active Size Depends on
range; varies from the size of a rice grain to a car number plate
Depends on battery life and size
Depends on battery life and size
Locatability Only when interrogated by the RF antenna field
Only when interrogated by the RF antenna field
Locatable at preset intervals
Battery life None Up to 10 years Up to 5 years Range Up to 20 m Up to 100 m Up to several hundred
metres
Cost ~SEK 10-30 ~SEK 10-50 ~SEK 50 Source: Malik, 2009
The RFID technology is widely used and can be found in applications everywhere, from bus tickets to personal ID cards. It can monitor people’s movements, locate and track assets and monitor usage of these assets. It can thus improve industrial throughput, structure of facilities, customer service and response time. These are just a few areas where the system can be used. Since it is a simple and cost-effective system, it has large potential. The tags can store and transmit data and, combined with a sensor array, can form a RTLS which can track the location of every RFID tag (Malik, 2009).
Agriculture worldwide is a large potential market for electronic identification, and in 2008 90 million tags were sold for animals (Idtechex, 2009). Since development in recent years has resulted in small and reliable tags, the agricultural sector is forecast to be the next large sector for the technology. Electronic identification in agriculture is forecast to be worth SEK 66 billion by the year 2017 (NYTeknik, 2009).
3.2 AGRICULTURAL PRODUCTION - AREAS OF APPLICATION
After an extensive search through library resources and databases of scientific articles, the main areas of application were chosen. The main concepts and findings for the different areas are presented in this section in order to establish an overview of what technologies exist and in which areas these technologies are likely to be used in the near future.
3.2.1 Applications for livestock production
There are four different types of RFID sensors used for animal identification: collar transponder, ear tag, injectible transponder and rumen bolus (Finkenzeller, 2003). These can be used for various purposes, such as tracking, behaviour
18
research and feed management. Of these different tags, the ear tags are the most promising for livestock applications, since they can be applied to different kinds of animals (sheep, goats, pigs and cattle), whereas the rumen bolus is only suitable for cattle. Injectible glass tags are most suitable for pets, since there are concerns and problems associated with the removal of the tags from livestock carcasses to avoid them remaining in the meat products (Voulodimos et al., 2009).
Traceability is important in the food chain to achieve high food safety and reliable information on origin. The use of RFID tags in animal production not only provides management and welfare benefits, but also increases accuracy in traceability. Manual recording of cattle movements is labour-intensive and the risk of error is fairly high. At present, animals usually have ear number tags. The regulations concerning tagging vary depending on the animal type. For example, ear tags must be applied within 20 days of birth for cattle and within 6 months for sheep and goats, while pigs can be tagged by ear tags or tattoos at latest before departure from the place of birth (Jordbruksverket 2008a,b; 2009a). About 10% of cattle lose one of their two tags and 2% lose both tags. This causes problems in identifying the animals and if the tags are not replaced the single farm payment is reduced (Tractech, 2009a).
Animals carrying a RFID tag can easily be recognised through the logistics chain from farm to slaughterhouse. The only equipment needed is readers placed at strategic positions, such as the loading gate on the transportation lorry and the intake door at the receiving facility. The information from the tag can follow the carcass through the cutting process (Tractech, 2009a). The information from the original tag can be transferred to new labels on the meat packages and once the meat reaches the shelf of a food shop, the information stored on the tag, such as climate impact, transportation, veterinary records, etc. can be displayed for the consumer on a screen (Tractech, 2009b). RFID-based RTLS are already in use in hospitals for tracking and locating people and equipment, which is useful not only in increasing efficiency but also healthcare safety (Awarepoint, 2009).
This technology has potential in animal husbandry. With RTLS the farmer can monitor the movement of the individual animals in the production facility and can track the location of a specific animal if necessary. Such an ability would greatly save labour and time when sorting animals or with veterinary services.
Use of RFID is well established among dairy farms. The cows use a RFID tag placed in a collar, and identification is made at essential choke points, such as gateways and feed stations. According to a study carried out in 1976, the technology was already available at that time (Bridle, 1976). In that study, the reading security was 5998 out of 6000 readings. The major problem was wear and tear of the casing in which the electronic circuit was placed. The transponder technology seemed to be a promising product for automatic reading to replace the identification by punch cards used at that time (Bridle, 1976).
RFID systems could be a useful tool for breeder management. At present there is at least one Swedish company offering an RFID-based product for cattle tracking. In a Canadian experiment where dairy cows were equipped with RFID sensors, a significant reduction (up to 90%) in labour for data collection and recording was
19
observed and the researchers estimated the equipment to have a one-year payback time (Murray et al., 2009).
These systems described above are based on the passive ‘write once, read many’ type of tags. In a study by Athanasios et al. (2009), a system using tags with the possibility to overwrite many times was used. The features of this system were the ability to store data, other than ID, on the animal tag. The data were stored in a local database as well as in the ear tag. The local database was connected to a central database from which other farms could retrieve information about the cattle purchased from another farm. This system allows information exchange between farms or any actor connected to the database network. This is possible through use of the write once tags as well, but the benefit of the other system is that important information such as medical records, disease, diet and behaviour can be stored and updated in the tag, so farmers not connected to the network can retrieve the information if they have reading equipment (Athanasios et al., 2009).
To measure social behaviour and interactions, it is of interest to monitor the behaviour of animals with an automatic local positioning system. This was traditionally done by manual observation, but studies on video recording have been made. A real time local radar system working with active necklace tags, provided by ABATEC electronic systems, installed in a house for loose cattle showed an accuracy of less than one metre and was seen as a successful system for animal behaviour research (Gygax et al., 2006).
3.2.2 Applications for crop production
RTLS are used to track goods. Large container terminals have RFID tags to allow their location to be monitored. The number of units in a box can be determined without opening the box if every unit has an RFID tag. This is used to track and locate goods worldwide. An already established technology combined with a large quantity of agricultural goods would have some applications in the agricultural sector.
There has been some research on using RFID tags in batches of grain. This technique is useful in the process of traceability and quality management. It could even be of interest for manufacturers of grain handling machinery, since it can be used for measuring the movement of grain inside dryers, silos and mixers. The system is in principle uncomplicated. A number of RFID tags are deployed into the batch of grain at harvesting. The physical characteristics of the tags are similar to the grain in both size and mass. This is of great importance to avoid separation due to differences in particle size and weight. In an experiment in which RFID tags were deployed into four different batches of grain filled into an experimental silo, the concentration of tags was 2 per kg of grain (Steinmeier et al., 2009). The main findings from this experiment were that 1.33% of the tags were lost and that the probability of error in finding the correct tag in the correct batch was not more than 9%. However in this case, the tags were collected from the batches manually (Steinmeier et al., 2009).
There is often interest in having spatial resolution on harvest. In a study by Ampatzidris & Vougioukas (2009), spatial variable yield maps were created for
20
apples. When harvesting apples or other handpicked crops there are several advantages if the kind of crop in the box or crate is automatically recorded. The ability to do so reduces the risk of errors during logistics and reduces the workload on harvesting staff. In a study in Greece, a trial was conducted in which RFID tags was fixed on the trees and on the crates. The tractor onto which the crates were loaded was equipped with a RFID reader connected to weighing scales. When the worker loaded a crate onto the tractor, the weight was measured and associated with the unique information on the crate tag. The tractor RFID reader also identified the tree the crate was filled from. The information about the type and amount of apples and the trees from which they were gathered was all stored in the computer. In a second similar trial, the RFID tag on the crates was replaced by a barcode tag and a barcode reader was installed on the tractor. The main conclusions were that both systems functioned well but that the RFID tag was more reliable than the barcode tag (Ampatzidris & Vougioukas, 2009).
In precision agriculture it is important to record the time and spatial variability of harvest and also the application of different inputs. There are different ways available to automatically record the amount of fertilizer or spraying chemical applied at a certain location. If the tractor is equipped with a position satellite-aided mapping system, it would be possible to connect this to a reader on a sprayer or spreader that recorded the type of materials applied at a certain location. This would enable the type and the characteristics of the material applied to be recorded, and would form part of the process to establish a spatially and time variable log file for fertilizer or pesticide application. Such a system could work with RF identity tags or with barcodes. This would reduce the pile of papers that have to bounce around in the tractor cab, as well as removing the work load when the information is digitised in spraying records and eliminating the risk of conscious or unconscious error during data transfer (Miller, 1999). Watts (2003) conducted a trial in which a sprayer was equipped with a RFID identification device and a load cell connected to the onboard sprayer computer and satellite positioning system. The system made records of the product and quantity loaded. The study then compared the results of this digital recording with those obtained by traditional methods and found that the loading time with automatic recording was 15 seconds longer than by the traditional method. However, when the manual recording time was taken into account, the automatic system was 4 seconds faster. The data input on the type of product loaded could also be used for automatic alteration of machine settings, but the time required for this was not determined (Watts, 2003).
Irrigation is essential in many valuable crops, and timing of irrigation is a keystone for optimising the returns from irrigation. At present there are about 100 000 ha of irrigated land in Sweden, which require 100 million cubic metres of water. There are several methods to determine the timing of irrigation. The traditional way is to measure precipitation and rainfall and from those data calculate a water budget. However today, computers support farmers with advanced modelling software. There is software available that is aimed directly at farmers and also versions designed for agricultural consultants. However such a system is based on meteorological data and usually does not take into account the local variations in the field, despite the fact that there are several factors that influence the time of irrigation, such as type of crop, root depth, wilting point and
21
field capacity. There are several ways to measure the amount of plant-available water in the soil, the traditional method being to use tensiometers that measure the tension at which water is held in the soil pores. It is also possible to measure the electrical resistance in the soil or to use neutron measurement systems to measure the amount of hydrogen, although such a system is only used for research purposes since it produces radioactive radiation (Jordbruksverket, 2007).
In order to increase the efficiency of irrigation and cut the cost of collecting data manually, a real time wireless sensor array can be used to monitor moisture and temperature data at multiple locations simultaneously in a field. The wireless sensors remove the need for manual collection of data in the field from every sensor, which decreases the labour input and improves the timing of irrigation. The system can be directly connected to the irrigation system to automatically adjust the amount of water applied against the need at specific locations (Vellidis et al., 2007a). In a study by Vellidis et al. (2007b), data logger soil moisture sensors combined with active RFID transmitters formed a sensor array. The transmitters, which were active, needed a power source. In the study the source was a 9 V lithium battery, which was enough power for the whole crop season. The tags used had a line-of-site transmission range of 0.8 km. The system is not only technically promising but also economically sound. The price of one node is approximately USD 115 (SEK 800)1 and the price for a complete system providing complete instrumentation, including 20 nodes, for measuring and reporting data from 40 hectares when launched commercially will be approximately USD 2700 (SEK 18700)2. The lifespan of the nodes is expected to be 5 years (Vellidis et al., 2007b). Such a system provides promising scope to reduce water consumption as well as increase crop yield and quality, especially when integrated with a VIR (variable rate irrigation) system (Vellidis et al., 2007b). In a study by Damas et al. (2001), a VIR system called HidroBus evaluated on a 1500 hectare area in Spain was shown to have the potential to save up to 60% of water.
In potato cultivation, environmental factors have a large impact on product quality and quantity. An even water supply is important to achieve a product with a good appearance that is attractive to the customer. With an uneven water supply the tubers can start to grow in peculiar shapes and cracks can occur (Fågelfors, 2001). Late blight (Phytophthora infestans) causes severe damage and reductions in yield, with field experiments in England and Wales showing an average yield decrease of 30.2% (Bradshaw and Vaughan, 1996). To avoid this, farmers use pesticides once every 5-10 days, which makes up a significant part of the total cropping costs (Chow and Bernard, 1999). The average number of pesticide treatments is 6.6 annually (Thomas et al., 1997). The high costs combined with the potential environmental impact create a need for more a efficient plant protection strategy. To forecast blight outbreaks, data on temperature, rainfall and relative humidity are needed. Such data have been manually collected for over 40 years for blight prognosis but in a study by Chow and Bernard (1999), a fully automated real time potato late blight alert unit was constructed to measure data
1 According to exchange rate 1:6.92 (17/09/2009) 2 According to exchange rate 1:6.92 (17/09/2009)
22
and process it automatically directly in the field. A visual signal was sent by flashing light when spraying should occur and data were also sent to a central computer for logging and processing. The main findings from that study were that the automated units were better in response time and stability, and cut delays and errors characteristic of manual data collection and processing.
Positioning systems are not new in crop production. They have been used and developed since 1995, when the American GNSS (global navigation satellite system) became available for private use. Systems for mapping spatial variability in fields and guidance have an accuracy down to a centimetre (Lechner and Baumann, 2000). However, the GNSS-based systems are not by definition RTLS since they cannot report data from the tags (in this case the onboard vehicle unit) in real time. Auernhammer et al. (1994) studied a system in which yield mapping was executed with GPS positioning and the data were either manually transferred from the combine harvester to a stationary computer or transmitted by radio modem every 7 seconds. This shows that the technology for RTLS in yield mapping has been available for a number of years.
4. RESULTS
To identify the need for the new technology, it is essential to examine the structure in agriculture and to determine the application/s that will have the largest impact on the potential market. An analysis was therefore carried out of the agricultural sector and of the different steps in the production chain.
4.1 POSSIBILITIES – THE FINDINGS FROM THE LITERATURE REVIEW
RTLS is already a well established technology in dairy production and is widely used for precision feeding and cow traffic management, with approximately 60% of Swedish dairy cows being equipped with transponders (C. Ohlsson, pers. comm. 2009). There is a wide range of different potential RTLS applications in agricultural production. As the literature review showed, RTLS can be used in monitoring environmental data such as humidity and temperature and for raising the efficiency of production by optimising the timing and amount of inputs for crop production. RTLS have long been established in logistics and can become so in agriculture for harvest mapping, quality monitoring and traceability issues. There are also applications in which the systems can be utilised to monitor the environment in order to supply data for decisions in irrigation and pesticide use. In animal production, RTLS can be used to raise productivity by more efficient management and increased animal welfare through monitoring the behaviour of animals in order to prevent disease or to increase fertility by determining oestrus before it occurs. RTLS can also be used to track the exact position of animals. In addition to being used on-farm, RTLS can be applied throughout the logistics chain of the farm products. The RTLS applications with the most potential in agriculture according to the literature review are livestock production and electronic identification.
RTLS for crop production seem most suitable for environmental monitoring in microclimate forecast modelling for pesticide application and irrigation
23
management. This is essential for success in growing sensitive high value crops, in order to maintain yield and high homogeneous quality.
4.2 TARGET GROUPS
To determine the areas where applications should first be introduced and those with the largest potential, the parts of the sector with the greatest numbers of potential customers for the product or with the largest quantities or area need to be identified. Different parameters are needed to meet the need from a variety of applications. Some applications can be dependent on the number of consumers and some might be dependent on the production units (animals, hectares or yield).
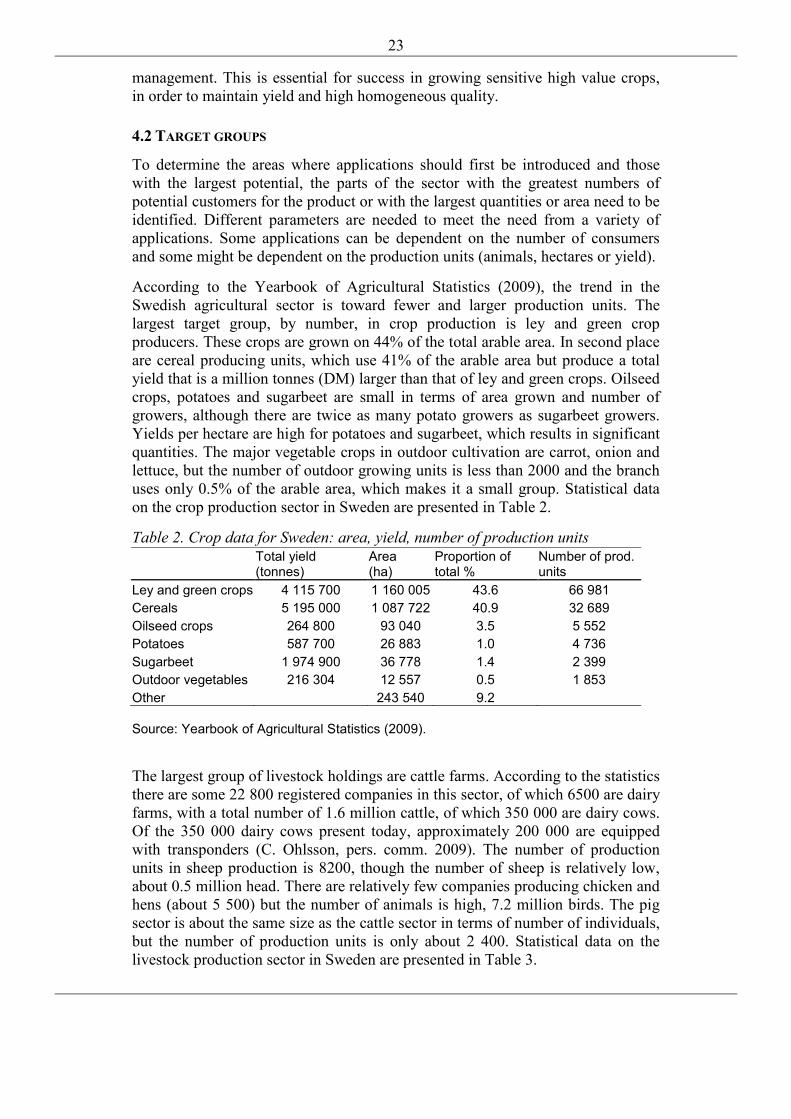
According to the Yearbook of Agricultural Statistics (2009), the trend in the Swedish agricultural sector is toward fewer and larger production units. The largest target group, by number, in crop production is ley and green crop producers. These crops are grown on 44% of the total arable area. In second place are cereal producing units, which use 41% of the arable area but produce a total yield that is a million tonnes (DM) larger than that of ley and green crops. Oilseed crops, potatoes and sugarbeet are small in terms of area grown and number of growers, although there are twice as many potato growers as sugarbeet growers. Yields per hectare are high for potatoes and sugarbeet, which results in significant quantities. The major vegetable crops in outdoor cultivation are carrot, onion and lettuce, but the number of outdoor growing units is less than 2000 and the branch uses only 0.5% of the arable area, which makes it a small group. Statistical data on the crop production sector in Sweden are presented in Table 2.
Table 2. Crop data for Sweden: area, yield, number of production units
Source: Yearbook of Agricultural Statistics (2009).
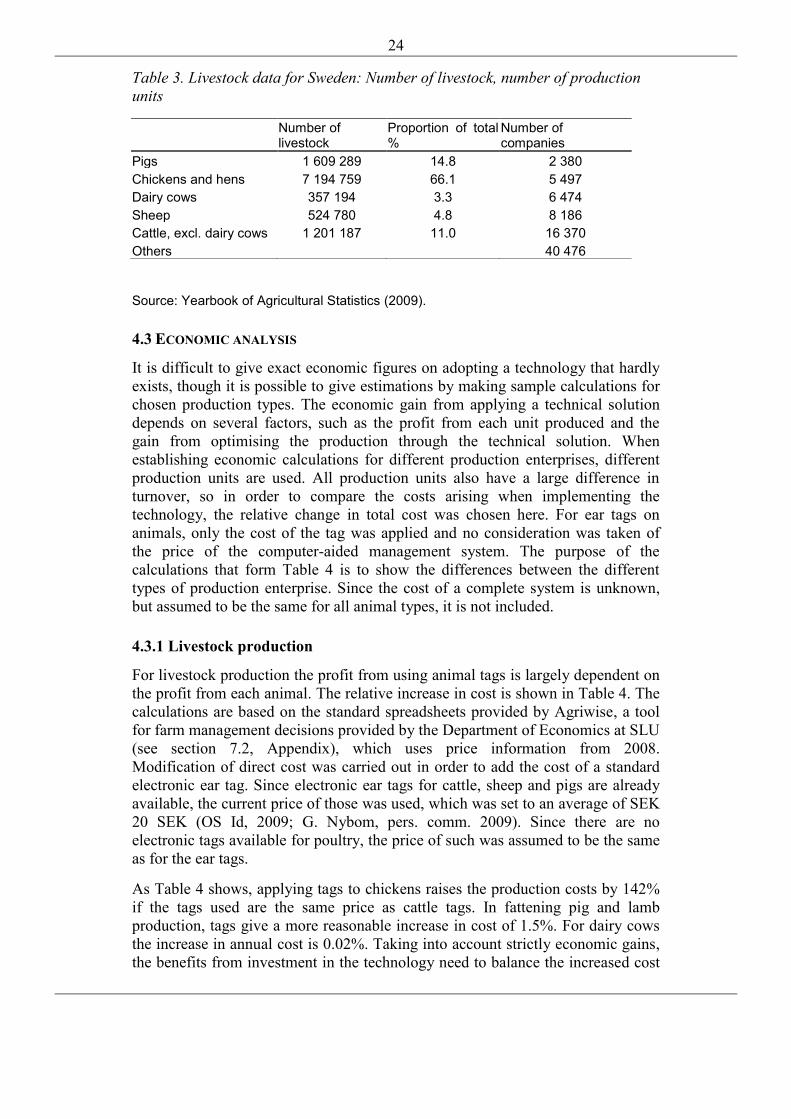
The largest group of livestock holdings are cattle farms. According to the statistics there are some 22 800 registered companies in this sector, of which 6500 are dairy farms, with a total number of 1.6 million cattle, of which 350 000 are dairy cows. Of the 350 000 dairy cows present today, approximately 200 000 are equipped with transponders (C. Ohlsson, pers. comm. 2009). The number of production units in sheep production is 8200, though the number of sheep is relatively low, about 0.5 million head. There are relatively few companies producing chicken and hens (about 5 500) but the number of animals is high, 7.2 million birds. The pig sector is about the same size as the cattle sector in terms of number of individuals, but the number of production units is only about 2 400. Statistical data on the livestock production sector in Sweden are presented in Table 3.
Total yield (tonnes)
Area (ha)
Proportion of total %
Number of prod. units
Ley and green crops 4 115 700 1 160 005 43.6 66 981 Cereals 5 195 000 1 087 722 40.9 32 689 Oilseed crops 264 800 93 040 3.5 5 552 Potatoes 587 700 26 883 1.0 4 736 Sugarbeet 1 974 900 36 778 1.4 2 399 Outdoor vegetables 216 304 12 557 0.5 1 853 Other 243 540 9.2
24
Table 3. Livestock data for Sweden: Number of livestock, number of production units
Source: Yearbook of Agricultural Statistics (2009).
4.3 ECONOMIC ANALYSIS
It is difficult to give exact economic figures on adopting a technology that hardly exists, though it is possible to give estimations by making sample calculations for chosen production types. The economic gain from applying a technical solution depends on several factors, such as the profit from each unit produced and the gain from optimising the production through the technical solution. When establishing economic calculations for different production enterprises, different production units are used. All production units also have a large difference in turnover, so in order to compare the costs arising when implementing the technology, the relative change in total cost was chosen here. For ear tags on animals, only the cost of the tag was applied and no consideration was taken of the price of the computer-aided management system. The purpose of the calculations that form Table 4 is to show the differences between the different types of production enterprise. Since the cost of a complete system is unknown, but assumed to be the same for all animal types, it is not included.
4.3.1 Livestock production
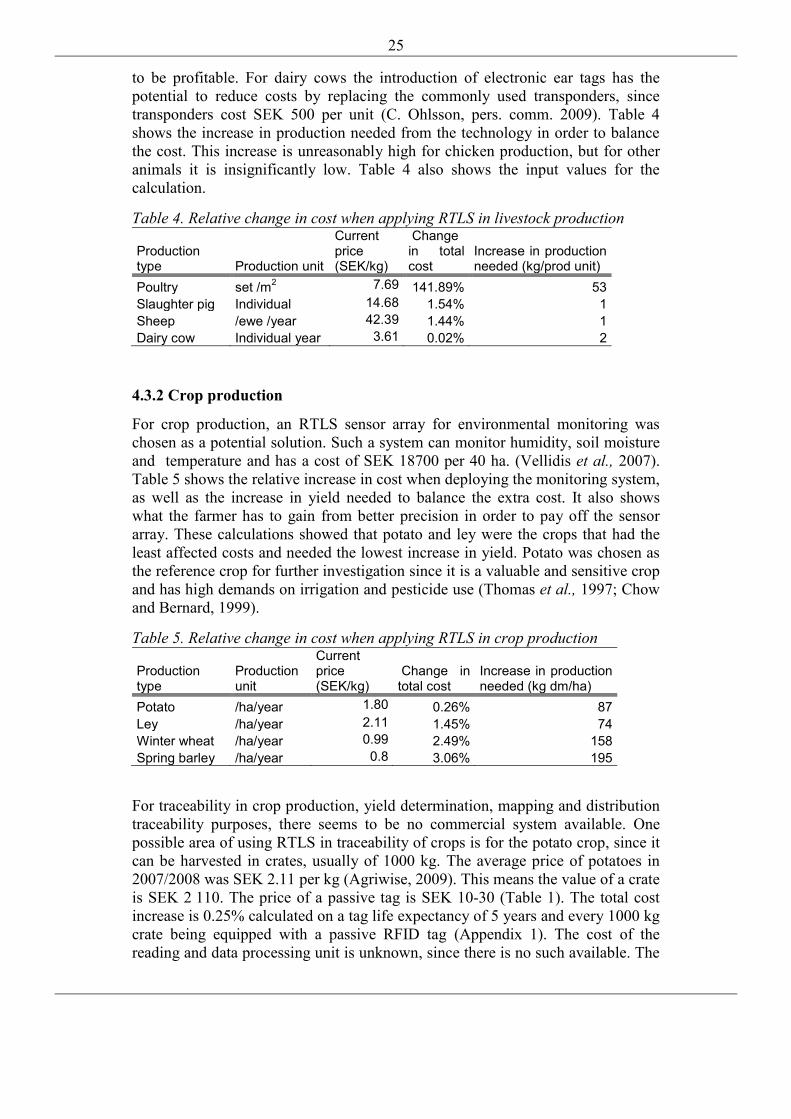
For livestock production the profit from using animal tags is largely dependent on the profit from each animal. The relative increase in cost is shown in Table 4. The calculations are based on the standard spreadsheets provided by Agriwise, a tool for farm management decisions provided by the Department of Economics at SLU (see section 7.2, Appendix), which uses price information from 2008. Modification of direct cost was carried out in order to add the cost of a standard electronic ear tag. Since electronic ear tags for cattle, sheep and pigs are already available, the current price of those was used, which was set to an average of SEK 20 SEK (OS Id, 2009; G. Nybom, pers. comm. 2009). Since there are no electronic tags available for poultry, the price of such was assumed to be the same as for the ear tags.
As Table 4 shows, applying tags to chickens raises the production costs by 142% if the tags used are the same price as cattle tags. In fattening pig and lamb production, tags give a more reasonable increase in cost of 1.5%. For dairy cows the increase in annual cost is 0.02%. Taking into account strictly economic gains, the benefits from investment in the technology need to balance the increased cost
Number of livestock
Proportion of total %
Number of companies
Pigs 1 609 289 14.8 2 380 Chickens and hens 7 194 759 66.1 5 497 Dairy cows 357 194 3.3 6 474 Sheep 524 780 4.8 8 186 Cattle, excl. dairy cows 1 201 187 11.0 16 370 Others 40 476
25
to be profitable. For dairy cows the introduction of electronic ear tags has the potential to reduce costs by replacing the commonly used transponders, since transponders cost SEK 500 per unit (C. Ohlsson, pers. comm. 2009). Table 4 shows the increase in production needed from the technology in order to balance the cost. This increase is unreasonably high for chicken production, but for other animals it is insignificantly low. Table 4 also shows the input values for the calculation.
Table 4. Relative change in cost when applying RTLS in livestock production
Production type Production unit
Current price (SEK/kg)
Change in total cost
Increase in production needed (kg/prod unit)
Poultry set /m2 7.69 141.89% 53 Slaughter pig Individual 14.68 1.54% 1 Sheep /ewe /year 42.39 1.44% 1 Dairy cow Individual year 3.61 0.02% 2
4.3.2 Crop production
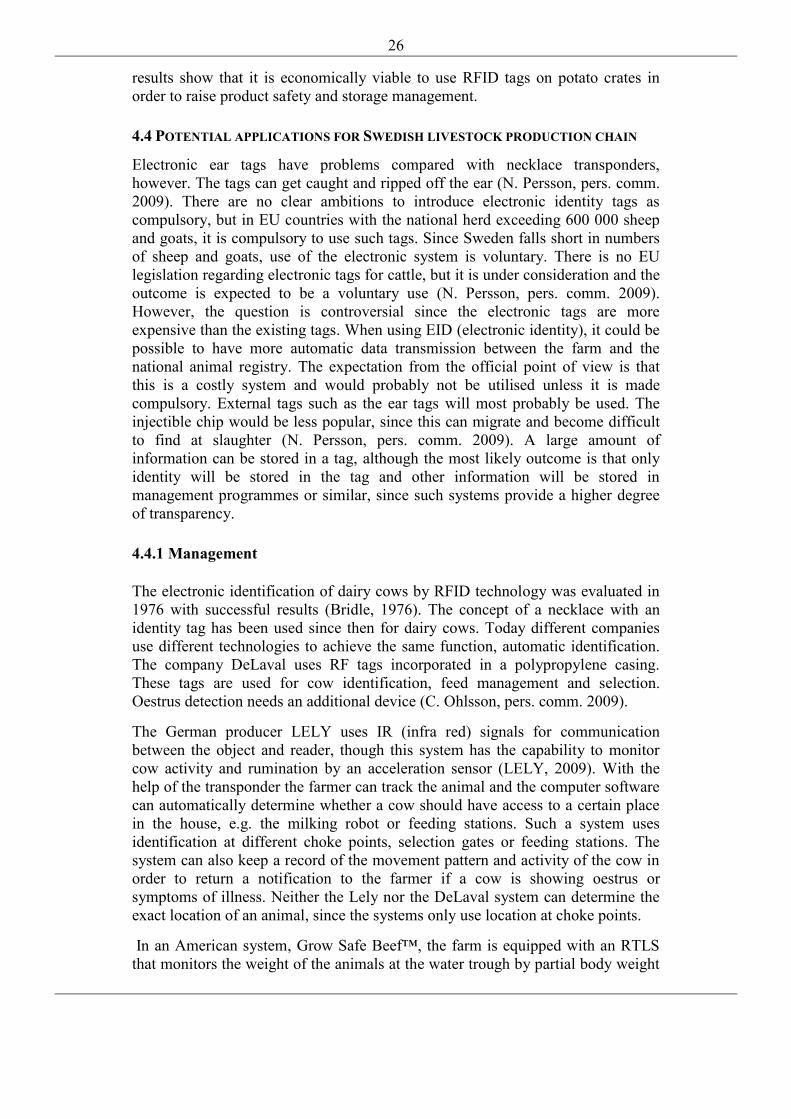
For crop production, an RTLS sensor array for environmental monitoring was chosen as a potential solution. Such a system can monitor humidity, soil moisture and temperature and has a cost of SEK 18700 per 40 ha. (Vellidis et al., 2007). Table 5 shows the relative increase in cost when deploying the monitoring system, as well as the increase in yield needed to balance the extra cost. It also shows what the farmer has to gain from better precision in order to pay off the sensor array. These calculations showed that potato and ley were the crops that had the least affected costs and needed the lowest increase in yield. Potato was chosen as the reference crop for further investigation since it is a valuable and sensitive crop and has high demands on irrigation and pesticide use (Thomas et al., 1997; Chow and Bernard, 1999).
Table 5. Relative change in cost when applying RTLS in crop production
Production type
Production unit
Current price (SEK/kg)
Change in total cost
Increase in production needed (kg dm/ha)
Potato /ha/year 1.80 0.26% 87 Ley /ha/year 2.11 1.45% 74 Winter wheat /ha/year 0.99 2.49% 158 Spring barley /ha/year 0.8 3.06% 195
For traceability in crop production, yield determination, mapping and distribution traceability purposes, there seems to be no commercial system available. One possible area of using RTLS in traceability of crops is for the potato crop, since it can be harvested in crates, usually of 1000 kg. The average price of potatoes in 2007/2008 was SEK 2.11 per kg (Agriwise, 2009). This means the value of a crate is SEK 2 110. The price of a passive tag is SEK 10-30 (Table 1). The total cost increase is 0.25% calculated on a tag life expectancy of 5 years and every 1000 kg crate being equipped with a passive RFID tag (Appendix 1). The cost of the reading and data processing unit is unknown, since there is no such available. The
26
results show that it is economically viable to use RFID tags on potato crates in order to raise product safety and storage management.
4.4 POTENTIAL APPLICATIONS FOR SWEDISH LIVESTOCK PRODUCTION CHAIN
Electronic ear tags have problems compared with necklace transponders, however. The tags can get caught and ripped off the ear (N. Persson, pers. comm. 2009). There are no clear ambitions to introduce electronic identity tags as compulsory, but in EU countries with the national herd exceeding 600 000 sheep and goats, it is compulsory to use such tags. Since Sweden falls short in numbers of sheep and goats, use of the electronic system is voluntary. There is no EU legislation regarding electronic tags for cattle, but it is under consideration and the outcome is expected to be a voluntary use (N. Persson, pers. comm. 2009). However, the question is controversial since the electronic tags are more expensive than the existing tags. When using EID (electronic identity), it could be possible to have more automatic data transmission between the farm and the national animal registry. The expectation from the official point of view is that this is a costly system and would probably not be utilised unless it is made compulsory. External tags such as the ear tags will most probably be used. The injectible chip would be less popular, since this can migrate and become difficult to find at slaughter (N. Persson, pers. comm. 2009). A large amount of information can be stored in a tag, although the most likely outcome is that only identity will be stored in the tag and other information will be stored in management programmes or similar, since such systems provide a higher degree of transparency.
4.4.1 Management
The electronic identification of dairy cows by RFID technology was evaluated in 1976 with successful results (Bridle, 1976). The concept of a necklace with an identity tag has been used since then for dairy cows. Today different companies use different technologies to achieve the same function, automatic identification. The company DeLaval uses RF tags incorporated in a polypropylene casing. These tags are used for cow identification, feed management and selection. Oestrus detection needs an additional device (C. Ohlsson, pers. comm. 2009).
The German producer LELY uses IR (infra red) signals for communication between the object and reader, though this system has the capability to monitor cow activity and rumination by an acceleration sensor (LELY, 2009). With the help of the transponder the farmer can track the animal and the computer software can automatically determine whether a cow should have access to a certain place in the house, e.g. the milking robot or feeding stations. Such a system uses identification at different choke points, selection gates or feeding stations. The system can also keep a record of the movement pattern and activity of the cow in order to return a notification to the farmer if a cow is showing oestrus or symptoms of illness. Neither the Lely nor the DeLaval system can determine the exact location of an animal, since the systems only use location at choke points.
In an American system, Grow Safe Beef™, the farm is equipped with an RTLS that monitors the weight of the animals at the water trough by partial body weight
27
measures. The animals are tagged by passive RFID tags which are recognised by the weight measuring equipment. When an animal reaches slaughter weight the system automatically colour-marks the hide. According to the company that produces it, this system improve income by SEK 500 per head (Growsafe, 2009). However there is no such system in use in Sweden for beef cattle, although according to Göran Nybom at Tractech Company, which provides and develops solutions for traceability to different branches, there is a system under development that can be used for beef production. The Tractech system is based on standard EID tags and has a relatively low cost and aims more at traceability through transportation and the slaughter chain than at farm management. However, the system can aid farmers in their management since the transportation of animals from the farm is automatically recorded and reported to the authorities, so this is a step that reduces the paperwork as well as reading errors when selling animals. The reading security of the tags is dependent on the radio frequency used. According to Göran Nybom at Tractech, in the early version that used low frequency tags the reading safety was too low, but now UHF signals are used and the readings are satisfactory.
The reading safety from the UHF tags is close to 100% and the price of such a system is approximately SEK 20 for the standard tag and computer software and readers cost SEK 10 000 depending on the scope (G. Nybom, pers. comm. 2009). Just recently a system was released (CowDetect) for dairy herd management that can actually locate the precise position of a cow with an accuracy of centimetres. (Anonymous, 2009). However, this system does not work with passive tags, but has an active tag with a battery replacement time of 3 years.
4.4.2 Behaviour research
In behaviour research, RTLS would be useful to farmers if it could be used to trace the location of individuals, giving the opportunity to measure activity in order to supervise heat or health problems. According to Per Peetz Nielsen, from the Department of Animal Nutrition and Management at SLU, it is clear that there is a need for automatic positioning of animals, at least for scientific purposes. He is conducting an experiment which aims to determine whether cows need shade during sunny days, as there is no reliable and functioning system for this available at present. Although a GPS positioning system could be used, at present it would be too expensive if it had to be applied to every individual in a herd. Furthermore, the GPS system available is too inaccurate and needs free line-of-sight, which means it is not useful inside a cattle shed or in dense forest. According to Kristina Lindgren at JTI, who is working with GPS sensors on cows, the GPS system is not as easy to work with as desired. In research carried out at JTI, the GPS system was bought from Vectronic Aerospace and their cheapest version costs SEK 11000 per unit (Vectronic price list, 2009). This system reads and stores positional data in the collar, which needs to be taken off the animal in order to transfer data.
The GPS system is still too expensive and difficult to work with for applications in large-scale research trials or commercially on farms. This is why RFID could have significant potential in these applications. Such a system could be of great use in animal behaviour research and it could also be used to evaluate the design
28
of farm buildings by recording movements of cattle and preferred places for eating and lying (P.P. Nielsen, pers. comm. 2009).
4.4.3 Application at abattoirs
From interviews with the major Swedish farmers’ abattoir cooperative Scan and its collaborative company Ugglarps, it emerged that not much work has been done in the traceability chain as regards applying electronic identification in transportation. Scan, which is the largest actor on the market, does not use any electronic identification system, though Ugglarps has set up a trial together with the company Hencol, which provides electronic identification and management systems (J-A. Sundelöf, pers. comm. 2009). Scan has just recently installed vehicle computers in its animal transport lorries to reduce the paperwork with transportation documents and get more efficient connection between the abattoir and the lorry, but this system does not include automatic animal identification. (K. Svensson, pers. comm. 2009).
Abattoir representatives reported the electronic identification system to be beneficial not only in reducing work load but also in reducing animal stress while identifying the ear number tags.
4.5 POTENTIAL APPLICATIONS FOR SWEDISH CROP PRODUCTION
4.5.1 Environmental monitoring
The establishment of an irrigation regime requires the collection of environmental data such as precipitation and temperature. Such data can also be useful for creating forecasts and disease warnings, as well as spatially variable maps of pesticide application rates. The technology of wireless remote soil sensors has recently been developed. Such a system supports farmers with real time data on desired parameters such as temperature and humidity. It can also be utilised to create computerised models for irrigation scheduling. Today it is not common for farmers to use tools such as computer-aided models in general (P. Malm, pers. comm. 2009). He noted in interview that farmers generally determine the timing of irrigation by relying on their own instincts or by testing the soil moisture content using a spade.
There are forecasting products in use in Denmark, though estimates show that the Swedish market is either too small or not yet ready for large-scale adoption of such technology (P. Malm, pers. comm. 2009). The forecast models are one way of using water more efficiently and could be complemented by soil sensors. However, since there is little pressure on Swedish farmers to apply methods for efficient water usage, it will probably take time before such a system is accepted by the market. The most valuable crops are the most important to keep irrigated, although irrigation is not only a matter of maximising yield, but also quality and size. An potato field can lose 500 kg in growth per day if there is insufficient water available. As vegetable producers often have contracts to deliver a certain amount on a daily or weekly basis, one way to regulate growth to meet these criteria is to regulate irrigation (P. Malm, pers. comm. 2009).
29
The ability to regulate irrigation for specific needs at different locations in the field would probably be beneficial for such growth regulation.
For research it is favourable to have an automatic system providing data with time resolution, since today most research is conducted with only spatial resolution. Data with time resolution could be beneficial for research on e.g. nutrient leaching behaviour or gas emissions from agricultural land over the season (J. Arvidsson, pers. comm. 2009).
4.5.2 Traceability
There are various applications of traceability in crop production, all depending on the type of production. It is possible to use RTLS for tracing inputs such as fertilizers and pesticides and outputs such as crop products. Experiments show that it is clearly possible to equip pesticide containers or fertilizer bags with tags. This enables automatic storage inventory, as well as automatic recording once loaded in the machine for field application. However, there are no clear ambitions from the fertilizer suppliers to introduce electronic tagging of their fertilizer bags. Yara is the largest fertilizer supplier on the Swedish market and according to their product flow manager Mats Karlsson, visual marking of bags is fully sufficient for their own distribution since a bag is wrongly distributed only once every 500 000 tonnes (M. Karlsson, pers. comm. 2009).
Yara have had discussions about introducing RFID labelling in order to establish automatic storehouse inventory, but unfortunately the benefits from such a system were not considered sufficient to overcome the cost of investment, and a major problem was attaching the labels to the plastic material used to make the fertilizer bags, which has a rough texture (M. Karlsson, pers. comm. 2009).
Agricultural products can be equipped with sensors. Crates of fruit and vegetables are examples of this. Variations within a potato field are known to affect the quality properties of potato tubers. Therefore it would be of interest to tag potato crates at harvest to achieve accurate storage handling (F. Fogelberg, pers. comm. 2009). Trials to put sensors in bulk products such as grain have been tested successfully, although the removal from the grain of such sensors was not complete.
4.5.3 Security
Applying RTLS on a farm can have other beneficial advantages than purely productive ones. According to Göran Nybom of Tractech, on large farms where there is a large number of staff, it could be useful to give certain people access to certain places or to add tags on valuable goods in order to track their location. Such systems are already used on construction sites, in hospitals and by major companies.
30
4.6 CONCEPTUAL SOLUTIONS
4.6.1 RTLS in livestock production chain
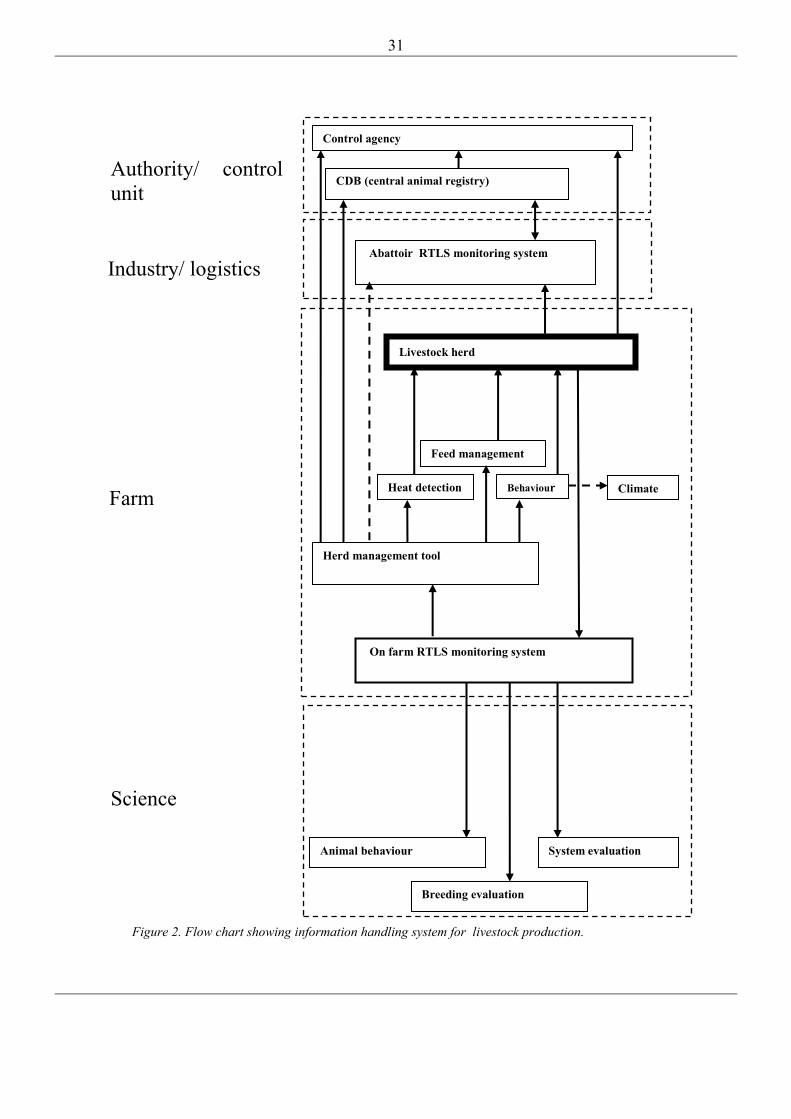
Whether RTLS is applied for dairy, beef, pig or lamb production, the concept of the system applied is similar. Figure 2 shows the information flow in an integrated conceptual system where connection is established between farm, industry, authorities and scientists. The conceptual solution can be diversified into several spheres of application. On the farm RTLS monitors the movement pattern of each EID-tagged individual. This opens the possibility of combining feed management and cow traffic together with oestrus and physiological disorder detection into one system. According to Christina Ohlsson, solutions manager at DeLaval, this would be a beneficial function since it is currently achieved by separate systems. It could be combined in a herd management tool which helps the farmer managing the herd. In the long run, the management software could be connected to the abattoir for supplying information about e.g. slaughter scheduling and reporting. Such a system could also report automatically or semi-automatically to the central animal database when animals are loaded into the slaughter lorry or other off-farm transport, or to other controlling or certification units (G. Nybom, pers. comm. 2009). The system also allows for automatic indoor climate regulation when connected to the animal housing climatic control system, which can be regulated on basis of the animal herd behaviour. Data acquired from private or experimental farms can be used for scientific purposes such as animal behaviour studies and evaluation of construction design when developing new buildings or interior fittings. Such real time positioning data collection would be of great interest for animal scientists. The connection from farm to abattoir is functionally ready to use, but the major abattoir contacted in this study had hardly heard about such technology and is not likely to introduce it in the near future. At farm level there are different systems in use, for dairy cows and pigs there are feed management systems as well as heat detection systems, although these systems are separate. The connection from farm to authorities could be established once the system is deployed at the farm.
31
Figure 2. Flow chart showing information handling system for livestock production.
On farm RTLS monitoring system
Heat detection
Feed management
Behaviour
Herd management tool
Livestock herd
CDB (central animal registry)
Abattoir RTLS monitoring system
Farm
Animal behaviour System evaluation
Science
Authority/ control unit
Breeding evaluation
Industry/ logistics
Control agency
Climate
32
4.6.2 RTLS application in crop production chain
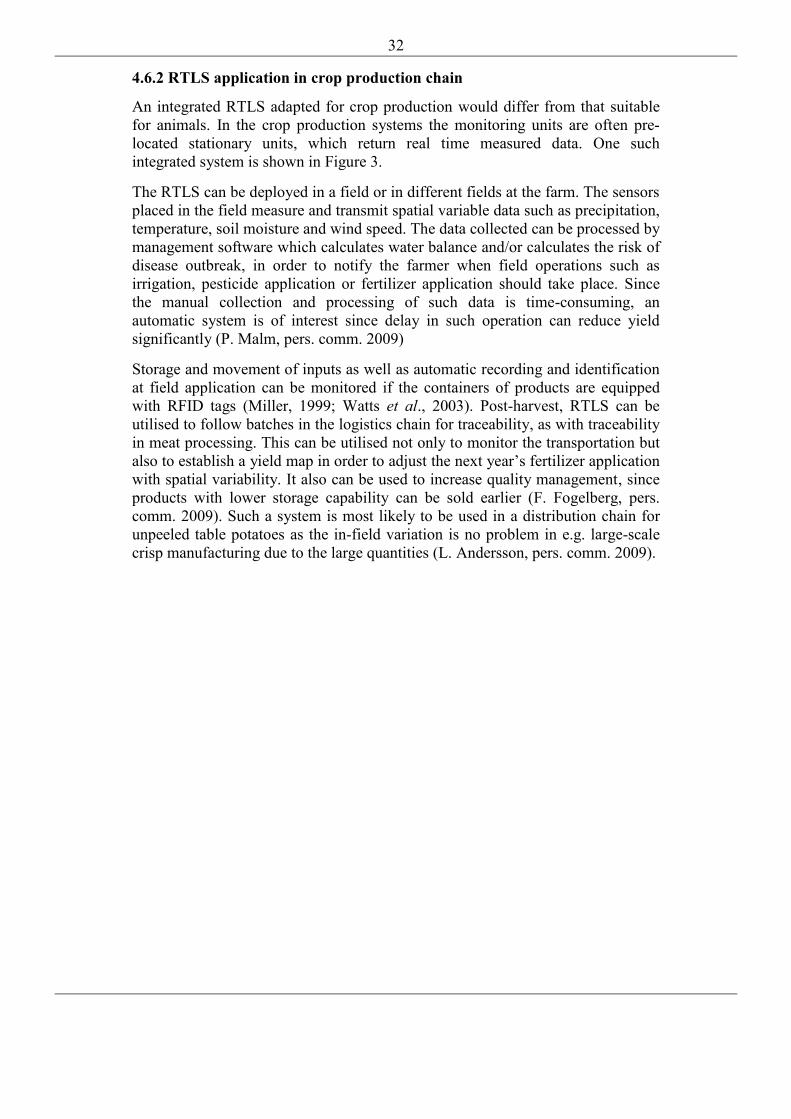
An integrated RTLS adapted for crop production would differ from that suitable for animals. In the crop production systems the monitoring units are often pre-located stationary units, which return real time measured data. One such integrated system is shown in Figure 3.
The RTLS can be deployed in a field or in different fields at the farm. The sensors placed in the field measure and transmit spatial variable data such as precipitation, temperature, soil moisture and wind speed. The data collected can be processed by management software which calculates water balance and/or calculates the risk of disease outbreak, in order to notify the farmer when field operations such as irrigation, pesticide application or fertilizer application should take place. Since the manual collection and processing of such data is time-consuming, an automatic system is of interest since delay in such operation can reduce yield significantly (P. Malm, pers. comm. 2009)
Storage and movement of inputs as well as automatic recording and identification at field application can be monitored if the containers of products are equipped with RFID tags (Miller, 1999; Watts et al., 2003). Post-harvest, RTLS can be utilised to follow batches in the logistics chain for traceability, as with traceability in meat processing. This can be utilised not only to monitor the transportation but also to establish a yield map in order to adjust the next year’s fertilizer application with spatial variability. It also can be used to increase quality management, since products with lower storage capability can be sold earlier (F. Fogelberg, pers. comm. 2009). Such a system is most likely to be used in a distribution chain for unpeeled table potatoes as the in-field variation is no problem in e.g. large-scale crisp manufacturing due to the large quantities (L. Andersson, pers. comm. 2009).
33
Figure 3. Flow chart showing information handling system for crop production.
Data Processing
Canopy temperature
Soil data Meterological data
Crop
Logistics RTLS monitoring
Farm
Percipitation Soil moisture
Authority
Other parameters
Logistics
Controling unit
Yield mapping
Record keeping
Pesticide application Fertilizer application
Irrigation
Fertilizer Disease forecast Irrigation
Ambient temperature
Wind speed
34
4.7 TECHNICAL DESCRIPTION OF EQUIPMENT
4.7.1 Technical description - RTLS for animal monitoring
The system used in animal production not only needs to withstand the mechanical stress caused by the animal, but also the environment in which the animal lives. This can of course vary greatly between different housing systems. The Swedish animal welfare law stipulates maximum values for a number of gases in the air, as well as maximum relative humidity. The equipment needs at least to withstand the environmental factors shown in Table 6.
Table 6. Limit values in animal houses max level Ammonium (ppm) 10 Carbon dioxide (ppm) 3000 Hydrogen sulphide (ppm) 0.5 Organic dust (mg/m3) 10 Source: Jordbruksverket, 2008.
The maximum permissible level regarding relative humidity varies not only between warm and cold houses, but also with the ambient air temperature. The maximum relative humidity for an insulated building is 80-90% depending on the temperature. For an uninsulated livestock building the limit value is 10 units above the value outside the building. These limits are the same for cows, sheep, goats and pigs. There are no regulations about temperature (Jordbruksverket, 2008), and therefore it is likely that the equipment should be able to withstand normal ambient temperature. The lifetime of the tags used needs to be at least the life time of the animal.
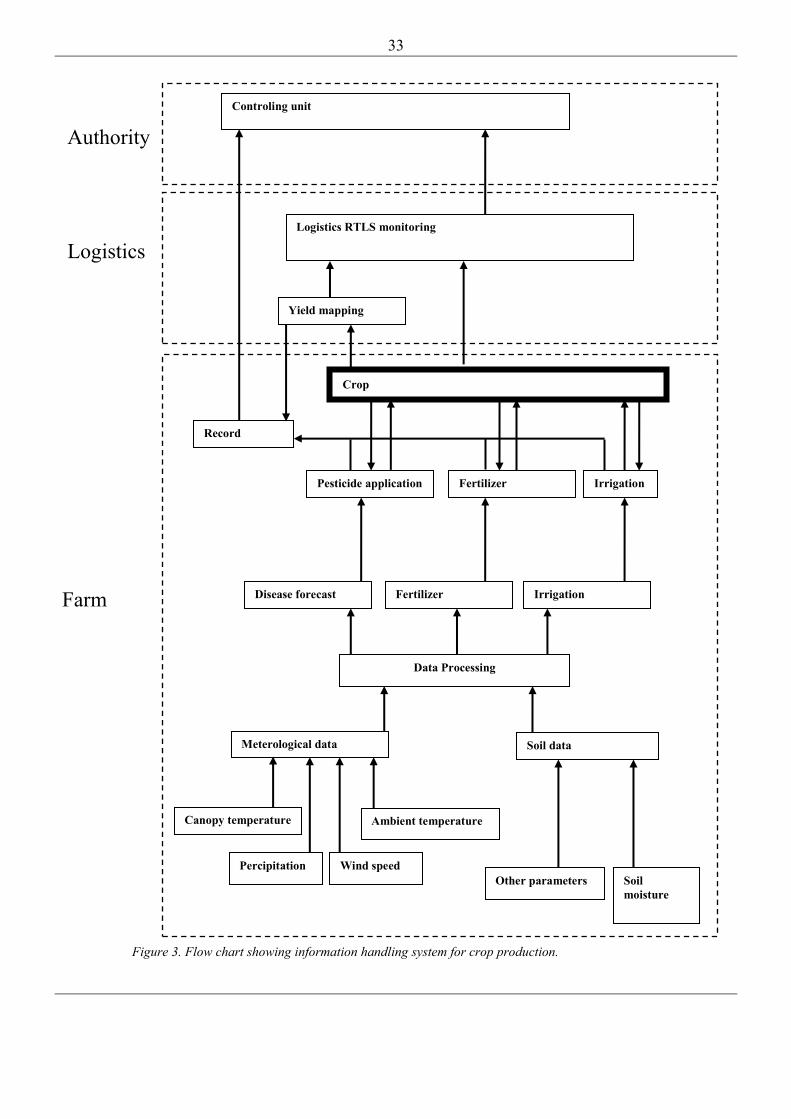
Since a large number of cows are already equipped with transponders, the market is adapted to the technology. There is a need for technology that can locate cows precisely in the house in order to determine the activity of animals and detect heat or illness. Such a system could also be integrated in feed management. In the following text, a house for dairy cattle is chosen to explain the demands on the equipment. The construction of a cattle house is different from case to case. Today all cattle houses in Sweden are built as loose houses, since tying cattle in stalls was abolished in 2007 by animal welfare regulations (DFS 2007:5). The loose house is usually built around a steel or wood frame, usually without internal pillars. The roof is usually made of galvanised iron and walls of wood or adjustable screens. The structure is built on a reinforced concrete slab. The interior fittings consist of steel tubes and plywood or plastic. Feeding troughs and feed stations are normally located within the free stall, while milking can be done in a milking parlour situated within the cubicle house or in a separate house (Kostallplan, 2009). A section drawing is shown in Figure 4.
35
Figure 4. Section drawing of a loose house for dairy cows. (Björn Forss, DeLaval International, with permissions)
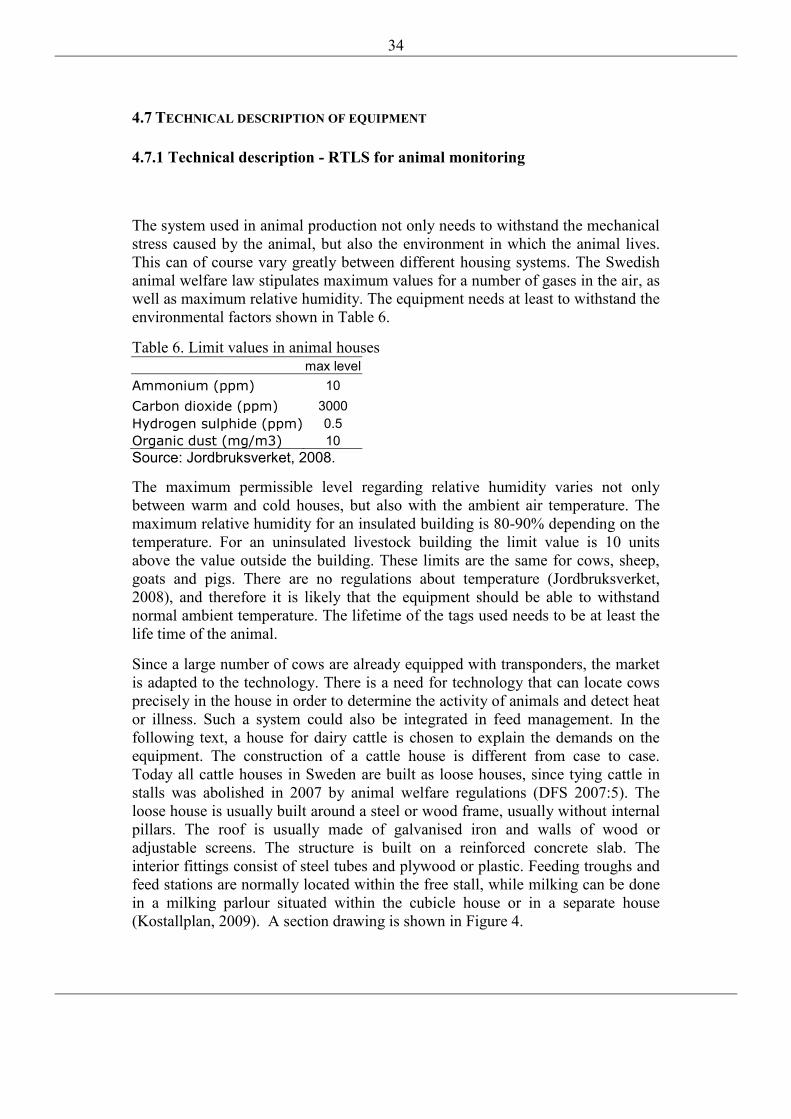
The RTLS needs to be able to locate the absolute position of the individual in the house, e.g. in the pre-milking holding pen or milking parlour. Since the feed stations are usually located in cubicle spaces, the system must be able to locate whether the cow is in the feeding station and determine that the cow sleeping in the cubicle next to the feeding station is not inside the feeding station. Figure 5 shows the layout of a system with exact location of ear-tagged animals.
Figure 5. RTLS - Animal monitoring by absolute positioning with sensor array. (Kim Gutekunst, JTI,with permissions)
36
Similar specifications are necessary in the milking parlour if a system with automatic milk yield recording is used. Since cattle can exert strong forces on interior fittings (P.P. Nielsen, pers. comm. 2009), the parts of the system that can come in contact with animals need to be rigid enough to withstand the physical pressures from cattle that may occur. The positioning system must also be able to return an exact positioning without disturbance from the interior fittings or from cows within the line of sight, in other words the signals must be able to pass through steel tubes, wooden boards and plastic materials, as well as bone and meat, without significant disturbance. The area of surveillance could be different from case to case, though a reasonable area could be 500-1000 m2, as shown in Figure 4.
4.7.2 Technical description - soil sensors
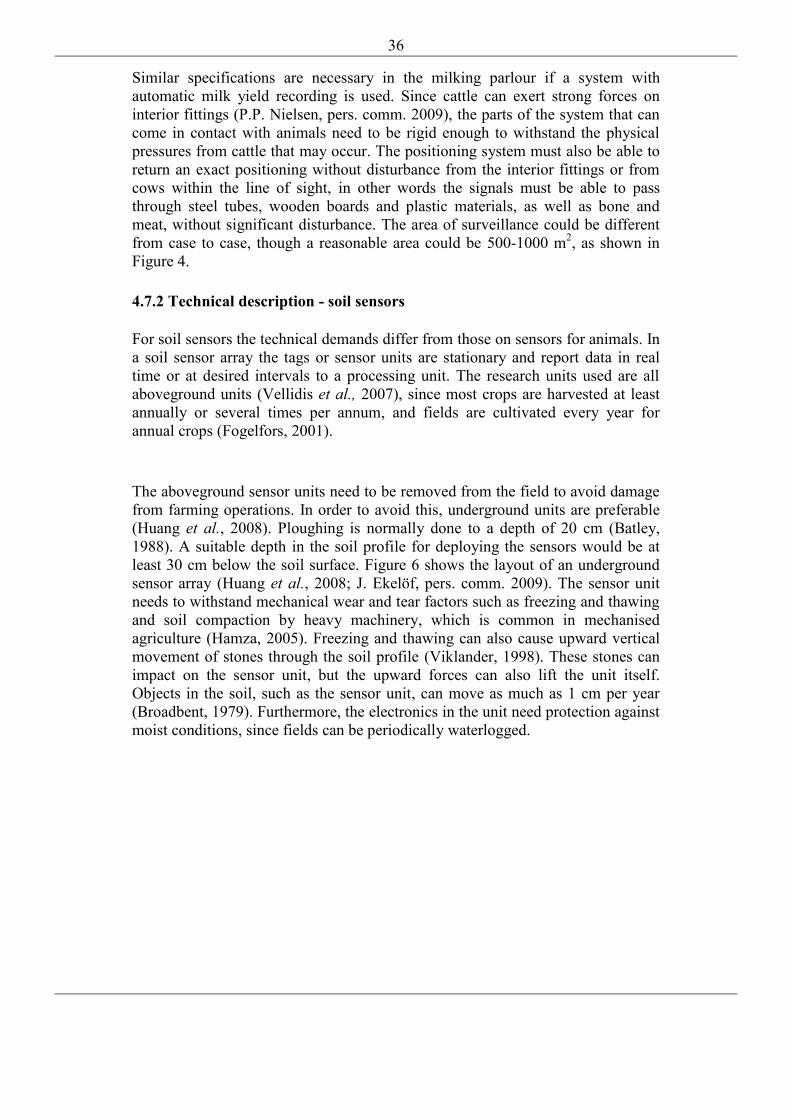
For soil sensors the technical demands differ from those on sensors for animals. In a soil sensor array the tags or sensor units are stationary and report data in real time or at desired intervals to a processing unit. The research units used are all aboveground units (Vellidis et al., 2007), since most crops are harvested at least annually or several times per annum, and fields are cultivated every year for annual crops (Fogelfors, 2001).
The aboveground sensor units need to be removed from the field to avoid damage from farming operations. In order to avoid this, underground units are preferable (Huang et al., 2008). Ploughing is normally done to a depth of 20 cm (Batley, 1988). A suitable depth in the soil profile for deploying the sensors would be at least 30 cm below the soil surface. Figure 6 shows the layout of an underground sensor array (Huang et al., 2008; J. Ekelöf, pers. comm. 2009). The sensor unit needs to withstand mechanical wear and tear factors such as freezing and thawing and soil compaction by heavy machinery, which is common in mechanised agriculture (Hamza, 2005). Freezing and thawing can also cause upward vertical movement of stones through the soil profile (Viklander, 1998). These stones can impact on the sensor unit, but the upward forces can also lift the unit itself. Objects in the soil, such as the sensor unit, can move as much as 1 cm per year (Broadbent, 1979). Furthermore, the electronics in the unit need protection against moist conditions, since fields can be periodically waterlogged.
37
Figure 6. RTLS soil sensor array. (Kim Gutekunst, JTI, with permissions)
For environmental monitoring, sensors need to be aboveground or partly aboveground in order to measure factors such as wind speed, canopy temperature and sun radiation. The number of sensor units per area strongly affects the cost of the array. The array density is strongly parameter dependent, e.g. to explain at least 90% of variation between sites, the density for measuring minimum temperature, relative humidity, solar radiation and evapotranspiration is 30 km distance between nodes. For precipitation the same value is 5 km between nodes (Hubbard, 1993). This shows that an array consisting of one node per two hectares, as used in the experimental set-up by Vellidis et al. (2007a), is more than sufficient. The sensors need to be rigid and lightweight, since they have to be collected from the field by hand before harvest.
4.7.3 Technical description - RTLS for yield mapping
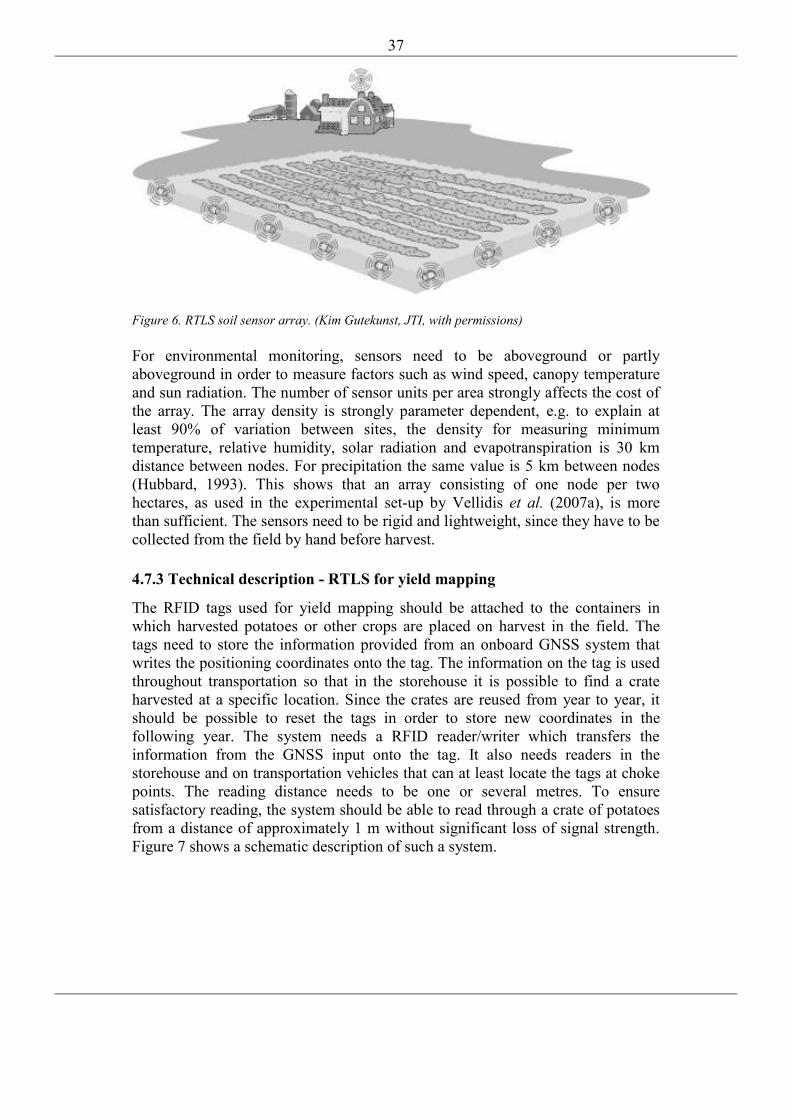
The RFID tags used for yield mapping should be attached to the containers in which harvested potatoes or other crops are placed on harvest in the field. The tags need to store the information provided from an onboard GNSS system that writes the positioning coordinates onto the tag. The information on the tag is used throughout transportation so that in the storehouse it is possible to find a crate harvested at a specific location. Since the crates are reused from year to year, it should be possible to reset the tags in order to store new coordinates in the following year. The system needs a RFID reader/writer which transfers the information from the GNSS input onto the tag. It also needs readers in the storehouse and on transportation vehicles that can at least locate the tags at choke points. The reading distance needs to be one or several metres. To ensure satisfactory reading, the system should be able to read through a crate of potatoes from a distance of approximately 1 m without significant loss of signal strength. Figure 7 shows a schematic description of such a system.
38
Figure 7. RTLS post-harvest traceability system. (Kim Gutekunst, JTI, with permissions)
5. DISCUSSION
There are several areas where RTLS are beneficial for managing agricultural production. They can be used for replacing old systems, combining systems or creating systems for new useful applications. Some applications need more refined technology and some is directly adaptable.
5.1 APPLICATIONS IN LIVESTOCK PRODUCTION
The results and literature study clearly indicate a trend for the use of electronic tracking of livestock. A system to be used for logistics purposes in animal transportation systems has already been developed, though it has not yet been widely taken up within the sector. Since the system is based on EID ear tags, the animals need to be fitted with these. A critical factor for the use of EID is that farmers gain something from it, since it is not likely to become compulsory in Europe except for sheep. Necklace transponders, which today are used for feed and herd management, could be replaced by the ear tags.
During the period in which the present study was carried out, a system for RTLS with exact location for use in animal herds was released (Anonymous, 2009). This system makes it possible to combine systems for feed management, herd management, heat detection and behaviour monitoring into one system, which reduces the number of technical systems on the farm. The system works with active battery-powered tags. Development of a system with passive tags would be of great interest and could form the basis of an integrated automated traceability system from farm to customer. The dairy sector is not the largest livestock enterprise in Sweden, but since it already has such systems it is most likely to be the pioneer in adopting new technology. Therefore the first version of RTLS
39
should be developed for dairy farmers. It could then be applied to practically any livestock where it is possible to attach an identity tag.
A system developed for use on farms would need to withstand hard environmental conditions, as well as mechanical stress and a corrosive environment. The signals used would need to be unaffected by the steel tubes used in cubicles, gates and other interior fittings.
At farm level, a local measurement system for tracking cows would involve:
Feed management: The system records the amount of feed intake of the individual on every visit to the feed station in order to ensure that it correlates to the feed plan. A daily amount is set and if the animal reaches the maximum limit no more feed is provided when animal enters the feed station. For this purpose the system needs high time resolution and high positioning accuracy.
Herd management: The system records the movement of animals and regulates their movement by opening and closing gates to allow the animal access to certain parts of the house. High time resolution and high positioning resolution are required.
Heat detection: The system records the movement pattern of the animal to observe differences from the normal, with a high activity indicating oestrus. For this purpose the system needs lower time resolution and lower positioning accuracy.
Behaviour monitoring: The system monitors the movement pattern of animals. For this purpose the system needs similar accuracy as for heat detection.
Exact location: A tool, e.g. a pocket computer, is used in order to find individuals in a herd. This would be of greater importance in large herds of animals. Time resolution needs to be relatively high, as well as positioning accuracy.
The creation of a system which can combine these five functions would be a reasonable product. Such a system is of high interest for scientists and industry (both manufacturing and processing). From the literature it is clear that adoption of RTLS in livestock production would have potential benefits, although data on the financial gains from such a system are limited. Therefore a system needs to be developed for further studies in order to convince a future market.
A system for automatic real time location determination would appear to be useful in many applications for livestock handling and it probably has several possibilities that have not yet been discovered.
5.2 APPLICATIONS IN CROP PRODUCTION
Sensors in an outdoor irrigation system must be able to withstand factors such as wind, sun, water and temperature variations, but also mechanical stress and animal damage. The equipment also has to be able to measure the moisture at the right depth in the soil for different crops and soil types. The use of moisture sensors in irrigation management has the potential to save large amounts of water,
40
which is a scarce resource in some areas of the world (although not normally in Sweden). Since there is little official pressure on Swedish farmers to introduce water-saving technology, it will probably take time for the market to implement technology such as the irrigation scheduling system, despite the low investment costs as shown by the calculations in section 3.3. Systems where irrigation as well as disease forecasting can be achieved would appear to be possible with the present technology, although the area of application is relatively small on the Swedish market. Knowledge about the use of such tools is limited and more research is needed on appropriate measurement methods and forecast models for Swedish conditions. A system for environmental monitoring can reduce labour and time for data collection and analysis. Such a system has potential benefits in reducing water consumption, pesticide usage and leaching, which in turn can reduce the negative impact of agriculture on the environment.
Current knowledge of spatial variability and array density is limited and further studies are probably needed to determine the optimal distance between the nodes. The existing data show that a relatively low density gives a high accuracy, although the situation is likely to differ in a heterogeneous landscape.
Yield mapping by RFID tags and subsequent tracing of the batches has proven successful on apples, but fruit production is a relatively small business in Sweden. As crates are often used for potatoes and other vegetables, this could be a potential branch for a yield mapping system, at least among smaller farms. The yield mapping system could be integrated into an RTLS production and distribution chain for monitoring traceability.
The implementation of storehouse recording systems and field recording of inputs is dependent on the use of RFID tags on packages by producers and distributors. There has been no dedicated research to date on the introduction of such a system on fertilizer bags, although it will probably be introduced in the future as the technology grows and the cost of the system decreases.
The use of RTLS in grain handling is technically possible, but since there might be residual sensors left in the product, it is probably not suitable for grain used for food or feed. However, it can have a place in the manufacturing industry, where micro nodes are deployed in the batch of grain in order to investigate and evaluate flow behaviour in grain storage, transportation and drying facilities.
6. CONCLUSIONS
The RTLS concept is relatively unknown among agribusiness people and research on such systems for agriculture is scarce.
There are several areas where RTLS can be applied. More work is needed to develop products for such applications.
RTLS have been used in dairy cow management for many years, so a modern system is most likely to be adopted by such producers.
41
For larger livestock farms, RTLS can be successfully utilised for monitoring and feed management, but individual tagging of chickens would be too expensive. A system that records animal movement by exact positioning and which can integrate feed management, behaviour monitoring and herd management into one unit has large potential and it seems reasonable to devote efforts to developing such a system.
RTLS for traceability in logistics is perceived by abattoirs as having potential, but they require more convincing evidence of the reliability of such systems.
In crop production, RTLS could be most successful in environmental monitoring for irrigation and disease management, but could also be used in yield mapping and quality management, and traceability in post-harvest handling of crops.
RTLS can be used for several other purposes such as fertilizer recording and storage management.
The RTLS technology is expanding and in agriculture it can become widely used as society’s demands on traceability and management increase.
42
7. REFERENCES
7.1 LITERATURE
Ampazidris Y.G., S.G. Vougioukas. 2009. Field experiments for evaluating the incorporation of RFID and Barcode registration and digital weighing technologies in manual fruit harvesting;
Athanasios S. Voulodimos, Charalampos Z. Patrikakis, Alexander B. Sideridis, Vasileios A. Ntafis, Eftychia M. Xylouri. 2009 A. complete farm management system based on animal identification using RFID technology; Computers and electronics in agriculture xx.
Auerhammer H., M. Demmel, T. Muhr, J. Rottmeier, K. Wild. 1994. GPS for yield mapping on combines; pp 53-68 Computers and Electronics in agriculture 11
Batley T. Soil husbandry. 1988. ISBN 0951360507;
Bradshaw N.J., Vaughan T.B. 1996. The effects of phenylamide fungicides on the control of potato late-blight (phytophthora infestans) in England and wales from 1978-1992; Plant pathology 45, pp 249-269;
Bridle J.E. 1976. Automatic Dairy cow identification; Journal of Agricultural Engineering Research 21; pp 41-48.
Broadbent, N. 1979. Coastal resources and settlement stability, a critical study of a mesolithic site complex in northern Sweden. Archaeological Studies, Uppsala Univ., Institute of North European Archaeology, Aun 3.
Chow T.L., G. Bernard. 1999. A versatile fully automated, real-time potato late blight alert unit; pp 55-69 Computers and electronics in agriculture 23
DFS 2007:5; Djurskyddsmyndighetens föreskrifter och allmänna råd om djurhållning inom lantbruket m.m.; 2007; ISSN 1652-3040
Damas M. Prados A M. Gomez F. Olivares G. Fiend bus for integrated management of extensive areas of irrigated land, Spain, 2001
Finkenzeller K. 2003. RFID handbook, fundamentals and Applications in contactless smart cards and identification, Sussex, England, ISBN 0-470-84402
Fogelfors H. 2001. Växtproduktion i jordbruket. ISBN 91-27-35292-7
Gygax L., G. Neisen, H. Bollhalder. 2007. Accuracy and validation of a radar-based automatic local position measurement system for tracking dairy cows in free-stall barns; pp 23-33; Computers and electronics in agriculture 56
Hamza M.A., W.K. Anderson. 2005. Soil compaction in cropping systems A review of the nature, causes and possible solutions; pp 121–145; Soil & Tillage Research 82
43
Huang J., Kumar R., Kamal A. E., Weber R. J. 2008. Development of a wireless soil sensor network; ASABE Meeting presentation, paper no: 080025.
Hubbard K.G. 1993. Spatial variability of daily weather variables in the high plains of the USA
Jordbruksverket 2007; Jordbruksinformation 5-2007; Bevattning och växtnäringsutnyttjande; Sweden
Jordbruksverket 2008; Jordbruksinformation 12-2008; Djurskyddsbestämmelser nötkreatur; ISSN 1102-8025
Jordbruksverket. 2008a. Märkning, journalföring och rapportering av grisar
Jordbruksverket. 2008b. Märkning och registrering av får och getter
Jordbruksverket. 2009a. Märkning och registrering av nötkreatur
Jordbruksverket. 2009. Yearbook of agricultural statistics 2009; ISSN 1654-4382; Sweden
Lechner W., Baumann S. 2000. Global navigation satellite system; pp 67-85; Computers and electronics in agriculture 25
Malik A. 2009. RTLS For dummies, Wiley publishing, Indianapolis, ISBN 978-0-470-39868-5
Miller P.C.H. 1999. The International Fertilizer Society (IFS); Proceedings no. 439; Automatic recording by application machinery of rates and spatial distribution of field inputs; York, UK; ISBN 0 85310 074 8
Murray B.B, I. Rumbles, J. Rodenburg; Application of RFID technology in herd management on dairy herds in Canada; pp 259-265 Presicion livestock farming ’09, 2009; ISBN 978-90-8686-112-5
Steinmeier U., D. von Hoersten, W. Luecke. 2009. Flow behaviour analysis of a RFID-tracer for traceability of grain; pp 403-411 Presicion agriculture ’09, 2009, ISBN 978-90-8686-113-2
Thomas M.R., Garthwaite D.G., Banham A.R. 1997. Pesticide usage survey Report 141. Arable farm crops in Great Britain 1996. Ministry of Agriculture, Fisheries and Food, London
Vellidis G., M. Tucker, C. Perry, C. Kvien, C Bednarz. 2007a. A real-time wireless smart sensor array for scheduling irrigation; Computers and electronics in agriculture 61 (2008) pp 45-50;
Vellidis G., V. Garrick, S. Pocknee, C. Perry, C. Kvien, M. Tucker. 2007b. How wireless will change agriculture; pp 57-67; Precision agriculture ’07; 2007; ISBN 978-90-8686-024-1
Watts A.J., P.C.H. Miller, R.J. Godwin. 2003. Automatically recording sprayer inputs to improve traceability and control; The BCPC International congress- Crop Science & Technology 2003; Glasgow, Scotland; ISBN 1901396630
44
7.2 INTERNET SOURCES
Agriwise 2009; databoken, potatis; http://www.agriwise.org/databoken/databok2k9/databok2009htm/index.htm
Awarepoint; www.awarepoint.com
Tractech 2009a; http://www.tractechnology.se/files/MeatTracBreeder_SWE.pdf; 2009-09-14
Tractech 2009b; http://www.bequoted.com/investor/company/documents/trac_press_071207.pdf; 2009-09-15
Vectronic pricelist, 2009
OS ID 2009; Product catalogue, price list nov 2009; OS ID, OS i Österdalen
Idtechex; http://www.idtechex.com/research/articles/rfid_market_forecasts_2009_2019_00001377.asp
NYTeknik; 2007-10-24; www.nyteknik.se/special/automation/article46925.ece
Kostallplan; http://www.jbt.slu.se/KOSTALLPLAN/; 2009-10-30
LELY, Brochure LELY QWES-H/HR infra red systems; 2009-11-17; http://www.lely.com/brochures/brochures_pdf/dairy/lely-qwes_h-en.pdf
6.3 PERSONAL COMMUNICATIONS
Andersson Lars. 2009. OLW potato storehouse. December 2009
Anonymous. 2009. Cowdetect, Agromek exhibition. Nobvember 2009
Arvidsson Johan. 2009. SLU. December 2009
Ekelöf Joakim. 2009. SLU. October 2009
Fogelberg Fredrik. 2009. JTI. November 2009
Karlsson Mats. 2009. Yara. October 2009
Kjellström Sören. 2009. Stallmästaren. October 2009
Lindgren Kristina. 2009. JTI. September 2009
Malm Peter. 2009. HS Kristianstad. October 2009
Nielsen Per Peetz. 2009. SLU. September 2009
Nybom Göran. 2009. Tractechnology. October 2009
Ohlsson Christina. 2009. DeLaval. October 2009
Persson Niclas. 2009. Ministry of agriculture. September 2009
Sundelöf Jenny-Ann. 2009. Ugglarps AB. October 2009
Svensson Kristher. 2009. Scan. October 2009
45
APPENDIX A Interview protocols
8.1.1 Per Peetz Nielsen, Scientist Animal husbandry
20090923
Hur positionsbestämmer man djur? -Ofta med GPS halsband, om det inte görs mannuellt. Fungerar GPS halsband bra? -Ja utomhus, men om man vill undersöka djur som går in under tak eller så. Behövs någon annan utrustning. Vad får ett alternativt system kosta? -Så billigt som möjligt, men 20-30 000 är rimligt. Vad skulle ett system behöva vara kapabelt till att registrera? -Rörelsemönster, brunst, aktivitet. Vilka användningsområden skulle ett system kunna få? -Utvärdera stall byggnader, genom att se rörelsemönster hos djuren, mäta välbefinnande hos djur. Använda rörelsedata i beteende forskning.
8.1.2 Niclas Persson, Jordbruksverket
2009-09-17
1. Det händer att djur tappar sina öronmärken, hur stor andel av kontrollerade djur har bristfällig märkning eller saknar märkning? För 2008 så såg siffrorna ut enligt följande; bland nötkreatur påträffades 1415 djur som saknade märkning av 183143 st. kontrollerade. För får och getter var motsvarande siffra 31916 av 34450. Det går dock inte att säga hur många av dessa som tappat sina brickor och hur många som aldrig varit märkta. 2. Finns det något mål att införa elektronisk ID för lantbrukets produktionsdjur? Det finns inga direkta ambitioner i Sverige i den riktningen. För får och getter är det dock tillåtet att använda ett elektroniskt öronmärke i Sverige . För medlemsstater som har fler än 600 000 får och getter är det obligatoriskt från och med årsskiftet att införa elektronisk märkning för djuren. Sverige har dock färre varför det är frivilligt att använda elektronisk identifiering för svenska djurhållare. För nötkreatur saknas fortfarande den nödvändiga EG-lagstiftningen för att införa elektronisk märkning. Diskussioner pågår dock men det återstår att se hur bestämmelserna utformas. Det lutar förmodligen att det blir ett frivilligt införande
46
för de medlemsstater som så önskar. Frågan är kontroversiell efter som EID är dyrare än konventionella märken. För länder med små besättningar och dålig lönsamhet så är det svårt att se några direkta vinster med införande av EID. 3. Om det gör det, när skulle ett sådant system vara aktuellt för Sverige? Elektroniska öronbrickor tillåtna för får och getter. För nötkreaturen återstår att se var diskussionerna inom EU landar. 4. Med RFID taggar på djur öppnas många möjligheter för driftledning, rapportering och spårbarhet. Skulle det vara intressant att länka ett sådant system mot CDB via gårdens driftplanering för direkt rapportering? Ja, den typen av dataöverföring mellan märke och databas är en av att de större vinsterna med EID. Samtidigt är det ett kostsamt system så jag antar att den typen av lösning förutsätter ett obligatoriskt införande. 5. Det finns olika typer av taggar, främst en variant som är inbyggd i det befintliga öronmärket, men även en som läggs i idisslarens mage, eller som placeras under huden. Vilken typ skulle vara mest aktuell att använda? För får och getter är det som sagt en bricka med elektronisk identifierare som är godkänt. Minst attraktivt, om man vänder på det, är chip i tanke på att de kan migrera i djuret samt att de är svåra att återfinna då djuret slaktas. 6. En rad data kan lagras i en RFID tagg, så som ålder, kön, veterinärbehandlingar etc. Vilka parametrar skulle vara av intresse att lagra i taggen som automatiskt följer djuret till exempelvis slakteriet? Vår tolkning av reglerna är att själva märket endast innehåller djurets identitet. Övriga uppgifter kan lagras i exempelvis foderprogram eller liknande.
8.1.3 Peter Malm, HS Kristianstad
2009-10-02
1. Hur bestäms bevattningstidpunkt?
Oftast är det lantbrukarens förnuft som avgör när det ska bevattnas eller ej. Användning av tensiometer eller dylikt hjälpmedel används sällan. Spade är ett mer frekvent använt hjälpmedel.
47
HS bedömer att det är en allt för liten marknad i Sverige för en prognostjänst för bevattning. Lantmännen har försökt introducera en sådan utan att lyckas.
2. Vanliga typer av bevattningsutrustning?
Vattenkanon är det vanligaste på den svenska marknaden, den är mest effektiv i avseende arbete och hektaravverkning. Ramper börjar dock bli allt vanligare, de kräver mer arbete att flytta och sköta men ger en jämnare bevattning och är mer vatteneffektiva. Och mindre vindkänsliga
3. Var hämtas bevattningsvattnet?
Det vanligaste är att ta ytvatten från närliggande vattendrag, men visst grundvattenuttag förekommer dock. Valet beror mycket på var i landen man befinner sig.
4. Hur stora arealer bevattnas?
Ca 100000 ha
5. Vilka grödor ställer högst krav på en precis bevattning?
I regel är det viktigare ju dyrare grödan är. T ex. potatis kan tappa så mycket som 500 kg/ dag i utebliven tillväxt utan bevattning.
6. Begränsar vattendomen bevattningsmängden?
Det varierar från plats till plats. Det är sällan problem, men i vissa delar av landet har det varit mål uppe i domstol och några vattendrag har helt stängts av för bevattningsuttag. Det är troligt att större krav kommer ställas i framtiden.
8.1.4 Jenny-Ann Sundelöf, Ugglarps AB
20091001
Frågor slakteri Team Ugglarp AB
1 Sker i dagsläget någon elektronisk identifiering av djur?
Nej
2 Skulle det vara av intresse att införa ett system som automatiskt registrerar när ett djur lastas ombord på slaktbilen?
Allt som underlättar arbetet och minskar felkällor är givetvis av intresse!
3 Ser Ni någon arbetsvinst i att eID märkta djur automatiskt kan registreras?
Om samtliga djur vara eID märkta så skulle det säkert vara en arbetsbesparing i stallet. Då skulle det kunna motsvara ungefär en halvtidstjänst för vår del.
48
4 Sker något arbete hos er att införa ett elektroniskt identifieringssystem för att höja spårbarheten?
Nej men vi är i uppstartsfasen med ett projekt tillsammans med Hencol hos några av våra leverantörer som kommer märka djuren med eID.
5Ser Ni eID baserad identifiering som något som i framtiden kan underlätta arbetet med identifiering och rapportering?
Se ovan
8.1.5 Kristher Svensson, Scan, Intransportchef
20091028
1 Sker i dagsläget någon elektronisk identifiering av djur?
Nej
2 Skulle det vara av intresse att införa ett system som automatiskt registrerar när ett djur lastas ombord på slaktbilen?
Ja, Att slippa den manuella registreringen skulle vara intressant.
3 Ser Ni någon arbetsvinst i att eID märkta djur automatiskt kan registreras?
Ja, så väl för bonden som lastbilschauffören och i stallet, i dagsläget skriver bonden ner id numren för varje djur på en transportsedel, när djuren och sedlarna kommer till slakteriet kontrolleras numren manuellt mot CDB, det arbete skulle kunna reduceras om det skedde delvis automatiskt.
4 Sker något arbete hos er att införa ett elektroniskt identifieringssystem för att höja spårbarheten?
Nej, men vi håller på att installera fordonstatorer i lastbilarna för att bli av med bland annat transportsedlarna i pappersform.
5Ser Ni eID baserad identifiering som något som i framtiden kan underlätta arbetet med identifiering och rapportering?
Ja om det är ett robust system har det säkert stora fördelar. Både arbetsbesparande och för djuren, genom mindre stress vid identifierings processen.
8.1.5 Göran Nybom, Tractechnology –Meattrac
20091006
Fördelar med systemet?
Koppling till CDB är under godkännande. Arbetar med UHF teknik vilket ger liten antenn och låg störning samtidigt som den teoretiska räckvidden
49
är 12 meter den praktiska är dock lägre ca 4-8 meter. Läs noggrannhet nära 100 %. Systemet kan läsa flera djur samtidigt. Tanken med systemet är att höja spårbarheten i distributionsledet från gård till konsument. Inga slakterier har dock gått med i systemet.
Tillämpning djurslag?
I dagsläget har företaget i Sverige inriktat sig på nötkreatur. Men större grisbesättningar i ryssland har varit intresserade av systemet.
Utbredning?
I dagsläget används systemet på ett fåtal pilotgårdar. Utvecklingsfasen är i det närmsta klar.
Prisuppgifter?
Taggar kostar ca 20 kr/st. Läsare och programvara och övrig kringutrustning kostar ca 10000 kr.
Typer av taggar?
Vanliga örontaggar. Av samma typ som de vanliga EID märkena.
Andra användningsområden inom jordbruket?
Logistik, Rondering, stöldskydd, ID-access är applikationer som redan används i andra sektorer.
8.1.6 Sören kjellström, Stallmästaren
20091007 Vad kostar en handläsare för EID taggar?
-Priset på vår handläsare HHR 3000 PRO är c:a 6,000 SEK
Hur stort är läsavståndet?
- Läs avståndet beror på om man använder sig av HDX eller FDX transponder. När det gäller HDX transponder är läsavståndet c:a 50cm och FDX något kortare.
Hur stor datamängd kan lagras i märkets chip?
-Datan som lagras i märket är antingen djurets hela identitet eller ett transponder nummer.
Kan data lagras in i chipet kontinuerligt under djurets livstid eller är detta bara möjligt en gång?
-Datan kan bara läggas in i chipet eller transpondern en gång på grund av att märket följer djuret från födsel till slakt.
För vilka djur är märket godkännt som EID märke?
50
På får finns detta märke redan godkänt av Jordbruksverket, och vad det gäller nöt kommer vi att i höst skicka in ett märke för godkännande. På gris används märket som en egen märkning.
8.1.7 Christina Ohlsson, DeLaval
20091022
-Hur länge har transpondrar använts för att identifiera mjölkboskap? Transpondrar för att identifiera djur har använts i ca 20 år. Aktivitetsmätare i ca 10 år. -Vilken teknik använder delaval för dataöverföringen? t ex IR eller RF? Transpondrarna avläses med magnetiskt fält. Data förs via ALCOM bus till dator. -Är transpondrarna passiva eller akvtiva, dvs. har dom batteri eller inte? Transpondrarna har inget batteri endast spole. -Vad kostar en transponder? En transponder kostar ca 500SEK. -Vilka djurtyper används den på? Transponder används på ko, kviga, kalv, buffel. -Hur stor andel av de svenska korna har transpondrar? Av de 350.000 kor vi har i Sverige har gissningsvis 200.000 st transpondrar. -Finns det någon kompabilitet mot andra system, t ex. att använda EU- godkända RFID, elektroniska öronmärken tillsammans med DeLavals utfodringssystem? Ja, det kan man göra, så länge det är HDX-transpondrar, dvs. att de kan läsas på längre avstånd. FDX kan endast läsas på mkt kort avstånd – några centimeter. -Skulle det finnas några fördelar med att ha ett system i djurstallet som kan lokalisera djurets absoluta position och inte bara som idag veta när djuret passerat en grind eller varit i en kraftfoderstation? Mkt stor fördel i stora besättningar. Där kan det vara svårt att hitta kor som ska behandlas, t ex djur som registrerats för hög aktivitet = brunstiga kor.
8.1.8 Mats Karlsson, Yara
20091028
51
- Hur identifieras gödselsäckarna under transporten idag? Vårt ansvar för flödet slutar i stort vid våra terminaler, det är Lantmännen och andra distributörer som sköter transporten till slutförbrukaren. Säcken har en rätt tydlig produktmärkning så vi får åtminstone väldigt få reklamationer på grund av fellastning, kanske 1 per år på ett flöde på 500 000 ton.
- Används RFID taggar på några produkter? Vi har idag ingen användning av RFID teknik och vi använder inte heller streckkod på Lantbruksprodukter.
- Om RFID inte används finns då någon ambition att införa detta? Vi har diskuterat att använda RFID märkning för att säkerställa att vi lastar rätt produkt och även för att inventera lagret. Tekniken har dock hittintills varit för dyr jämfört de vinster vi sett. Vi har heller inte sett någon rationell anordning för att applicera etiketten på våra storsäckar som utgör 95-97% av flödet. Det är svårt att få klister att fästa på säckens väv. Skulle vi se stora fördelar med tekniken så löses dock säkert det problemet.
8.1.9 Joakim Ekelöf, SLU
20091013
på vilket djup får man den bästa avläsningen? Det beror på flera faktorer så som rotdjup, gröda, bevattningssytem, jordart etc och variationer inom fällt. Gällande potatis och sandjordar så tycker jag att 20 cm är ett intressant djup att installera sensorerna på. Det bästa är om man kan täcka in flera djup. Har man två bör en sitta på 40 cm. Hur tätt man bör placera sensorerna? Ju fler sensorer desto bättre, men det beror helt på fältförhållandena.
8.1.10 Lars Andersson, OLW
20091201
Hur hanteras den skördade potatisen? Det mesta skördas i lösvikt, men en del i lådor. Vid utlastning från OLWs lager transporteras allt i lösvikt. Hur identifieras skörden? Vid lösvikt mäts vikten på inlastade partier från respektive leverantör, vid utlastning vägs återigen partiet och man räknar baklänges för att veta från vilken leverantör potatisen kommer. Vid lådlagring lagras varje leverantör i egen rad vilket gör att man vet att lådan från en rad kopplas till just den leverantören Finns problem med lagrings förluster pga. Dålig kvalitet?
52
Nej, inga större lagringsförluster. Det sker stickprovs kontroller i partierna vid intransport. Före skörd kontrolleras fälten och om misstanke finns för kvalitets problem levereras potatisen direkt till fabrik. Varierar kvalitén beroende på var den är skördad inom ett fält? Ja, men det utjämnas i lagret pga. De stora kvantiteter som hanteras (500-700 ton/vecka). Dock om ett parti befaras ha dåliga lagringsegenskaper går det ut ur lagret vid ett tidigt stadium. Då all potatis skalas är skorv ett mindre problem, vid röta kasseras dock potatisen. Det kan säkert vara ett problem för mindre leverantörer som hanterar små mängder av främst konsumtionspotatis.
8.1.11 Johan Arvidsson, SLU
20091123
Skulle det finnas något behov att avläsa parametrar i fält automatiskt? -Ja, i forsknings syfte kan det vara av intresse att kunna ta in data utan att behöva gå ut i fält för att effektivisera och få en billigare provtagning. Dessutom kan det vara av värde att kunna mäta data med tidsupplösning i t ex. utlakningsförsök. Vilka parametrar skulle vara intressanta att kunna mäta? -Syre, och koldioxid. Men även andra gaser som metan och lustgas skulle vara intressant om det finns utrustning som kan mäta detta i fält. Även näringsämnen kan vara av intresse att mäta i realtid för precisions åtgärder.
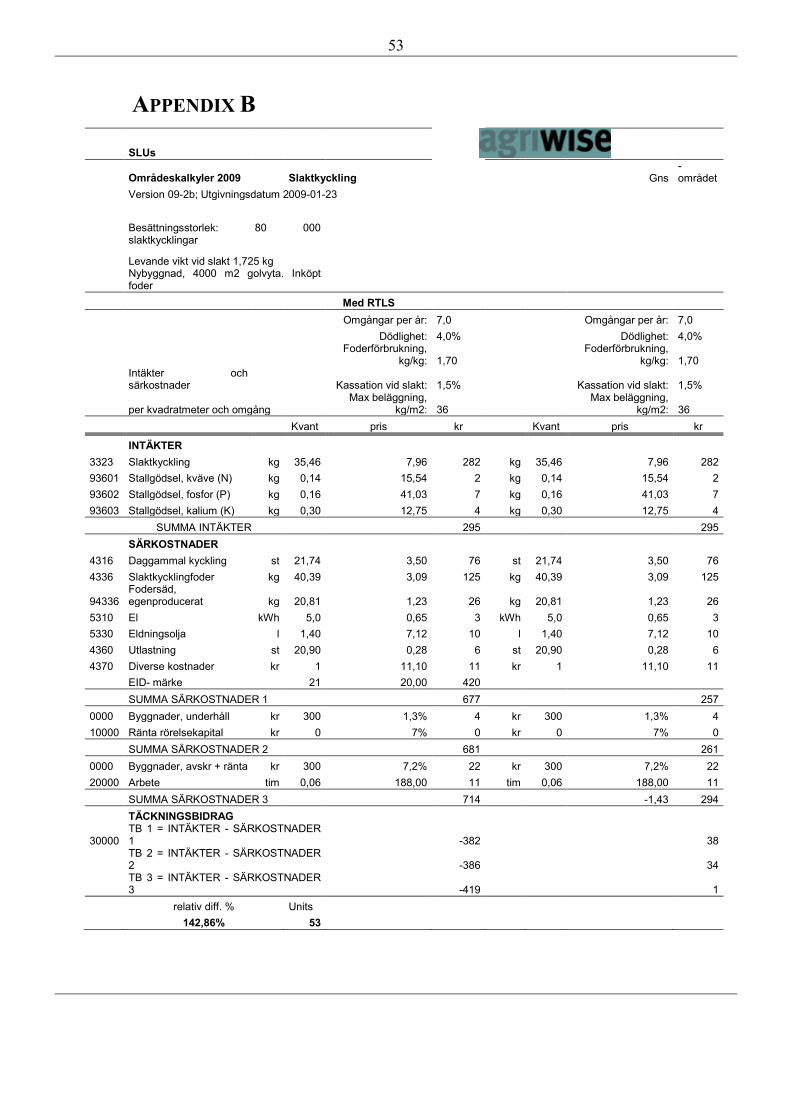
53
APPENDIX B
SLUs
Områdeskalkyler 2009 Slaktkyckling Gns -området
Version 09-2b; Utgivningsdatum 2009-01-23
Besättningsstorlek: 80 000 slaktkycklingar
Levande vikt vid slakt 1,725 kg
Nybyggnad, 4000 m2 golvyta. Inköpt foder
Med RTLS Omgångar per år: 7,0 Omgångar per år: 7,0 Dödlighet: 4,0% Dödlighet: 4,0%
Foderförbrukning,
kg/kg: 1,70 Foderförbrukning,
kg/kg: 1,70
Intäkter och särkostnader Kassation vid slakt: 1,5% Kassation vid slakt: 1,5%
per kvadratmeter och omgång Max beläggning,
kg/m2: 36 Max beläggning,
kg/m2: 36 Kvant pris kr Kvant pris kr
INTÄKTER 3323 Slaktkyckling kg 35,46 7,96 282 kg 35,46 7,96 282 93601 Stallgödsel, kväve (N) kg 0,14 15,54 2 kg 0,14 15,54 2 93602 Stallgödsel, fosfor (P) kg 0,16 41,03 7 kg 0,16 41,03 7 93603 Stallgödsel, kalium (K) kg 0,30 12,75 4 kg 0,30 12,75 4 SUMMA INTÄKTER 295 295 SÄRKOSTNADER 4316 Daggammal kyckling st 21,74 3,50 76 st 21,74 3,50 76 4336 Slaktkycklingfoder kg 40,39 3,09 125 kg 40,39 3,09 125
94336 Fodersäd, egenproducerat kg 20,81 1,23 26 kg 20,81 1,23 26
5310 El kWh 5,0 0,65 3 kWh 5,0 0,65 3 5330 Eldningsolja l 1,40 7,12 10 l 1,40 7,12 10 4360 Utlastning st 20,90 0,28 6 st 20,90 0,28 6 4370 Diverse kostnader kr 1 11,10 11 kr 1 11,10 11 EID- märke 21 20,00 420 SUMMA SÄRKOSTNADER 1 677 257 0000 Byggnader, underhåll kr 300 1,3% 4 kr 300 1,3% 4 10000 Ränta rörelsekapital kr 0 7% 0 kr 0 7% 0 SUMMA SÄRKOSTNADER 2 681 261 0000 Byggnader, avskr + ränta kr 300 7,2% 22 kr 300 7,2% 22 20000 Arbete tim 0,06 188,00 11 tim 0,06 188,00 11 SUMMA SÄRKOSTNADER 3 714 -1,43 294 TÄCKNINGSBIDRAG
30000 TB 1 = INTÄKTER - SÄRKOSTNADER 1 -382 38
TB 2 = INTÄKTER - SÄRKOSTNADER 2 -386 34
TB 3 = INTÄKTER - SÄRKOSTNADER 3 -419 1
relativ diff. % Units 142,86% 53
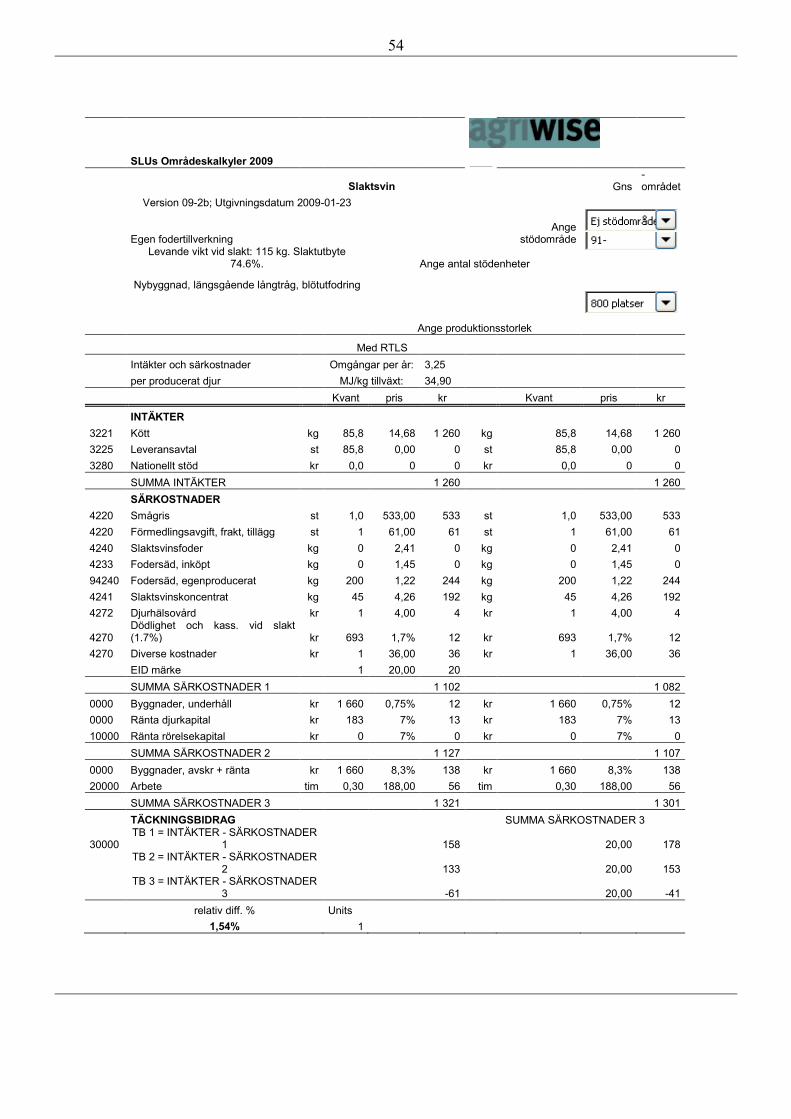
54
SLUs Områdeskalkyler 2009
Slaktsvin Gns -området
Version 09-2b; Utgivningsdatum 2009-01-23
Egen fodertillverkning Ange
stödområde
Levande vikt vid slakt: 115 kg. Slaktutbyte
74.6%. Ange antal stödenheter
Nybyggnad, längsgående långtråg, blötutfodring
Ange produktionsstorlek
Med RTLS Intäkter och särkostnader Omgångar per år: 3,25 per producerat djur MJ/kg tillväxt: 34,90 Kvant pris kr Kvant pris kr
INTÄKTER 3221 Kött kg 85,8 14,68 1 260 kg 85,8 14,68 1 260 3225 Leveransavtal st 85,8 0,00 0 st 85,8 0,00 0 3280 Nationellt stöd kr 0,0 0 0 kr 0,0 0 0 SUMMA INTÄKTER 1 260 1 260 SÄRKOSTNADER 4220 Smågris st 1,0 533,00 533 st 1,0 533,00 533 4220 Förmedlingsavgift, frakt, tillägg st 1 61,00 61 st 1 61,00 61 4240 Slaktsvinsfoder kg 0 2,41 0 kg 0 2,41 0 4233 Fodersäd, inköpt kg 0 1,45 0 kg 0 1,45 0 94240 Fodersäd, egenproducerat kg 200 1,22 244 kg 200 1,22 244 4241 Slaktsvinskoncentrat kg 45 4,26 192 kg 45 4,26 192 4272 Djurhälsovård kr 1 4,00 4 kr 1 4,00 4
4270 Dödlighet och kass. vid slakt (1.7%) kr 693 1,7% 12 kr 693 1,7% 12
4270 Diverse kostnader kr 1 36,00 36 kr 1 36,00 36 EID märke 1 20,00 20 SUMMA SÄRKOSTNADER 1 1 102 1 082 0000 Byggnader, underhåll kr 1 660 0,75% 12 kr 1 660 0,75% 12 0000 Ränta djurkapital kr 183 7% 13 kr 183 7% 13 10000 Ränta rörelsekapital kr 0 7% 0 kr 0 7% 0 SUMMA SÄRKOSTNADER 2 1 127 1 107 0000 Byggnader, avskr + ränta kr 1 660 8,3% 138 kr 1 660 8,3% 138 20000 Arbete tim 0,30 188,00 56 tim 0,30 188,00 56 SUMMA SÄRKOSTNADER 3 1 321 1 301 TÄCKNINGSBIDRAG SUMMA SÄRKOSTNADER 3
30000 TB 1 = INTÄKTER - SÄRKOSTNADER
1 158 20,00 178
TB 2 = INTÄKTER - SÄRKOSTNADER
2 133 20,00 153
TB 3 = INTÄKTER - SÄRKOSTNADER
3 -61 20,00 -41 relativ diff. % Units 1,54% 1
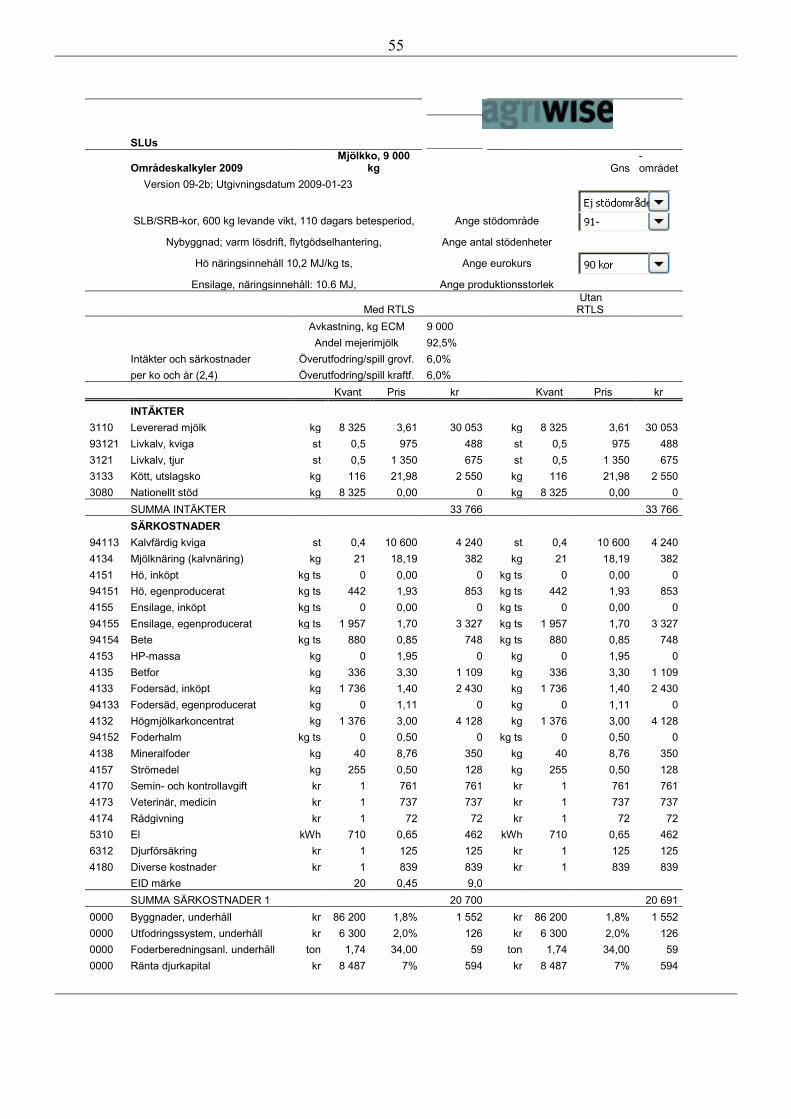
55
SLUs
Områdeskalkyler 2009 Mjölkko, 9 000
kg Gns -området
Version 09-2b; Utgivningsdatum 2009-01-23
SLB/SRB-kor, 600 kg levande vikt, 110 dagars betesperiod, Ange stödområde
Nybyggnad; varm lösdrift, flytgödselhantering, Ange antal stödenheter
Hö näringsinnehåll 10,2 MJ/kg ts, Ange eurokurs 10,71
Ensilage, näringsinnehåll: 10.6 MJ, Ange produktionsstorlek
Med RTLS Utan RTLS
Avkastning, kg ECM 9 000 Andel mejerimjölk 92,5% Intäkter och särkostnader Överutfodring/spill grovf. 6,0% per ko och år (2,4) Överutfodring/spill kraftf. 6,0% Kvant Pris kr Kvant Pris kr
INTÄKTER 3110 Levererad mjölk kg 8 325 3,61 30 053 kg 8 325 3,61 30 053 93121 Livkalv, kviga st 0,5 975 488 st 0,5 975 488 3121 Livkalv, tjur st 0,5 1 350 675 st 0,5 1 350 675 3133 Kött, utslagsko kg 116 21,98 2 550 kg 116 21,98 2 550 3080 Nationellt stöd kg 8 325 0,00 0 kg 8 325 0,00 0 SUMMA INTÄKTER 33 766 33 766 SÄRKOSTNADER 94113 Kalvfärdig kviga st 0,4 10 600 4 240 st 0,4 10 600 4 240 4134 Mjölknäring (kalvnäring) kg 21 18,19 382 kg 21 18,19 382 4151 Hö, inköpt kg ts 0 0,00 0 kg ts 0 0,00 0 94151 Hö, egenproducerat kg ts 442 1,93 853 kg ts 442 1,93 853 4155 Ensilage, inköpt kg ts 0 0,00 0 kg ts 0 0,00 0 94155 Ensilage, egenproducerat kg ts 1 957 1,70 3 327 kg ts 1 957 1,70 3 327 94154 Bete kg ts 880 0,85 748 kg ts 880 0,85 748 4153 HP-massa kg 0 1,95 0 kg 0 1,95 0 4135 Betfor kg 336 3,30 1 109 kg 336 3,30 1 109 4133 Fodersäd, inköpt kg 1 736 1,40 2 430 kg 1 736 1,40 2 430 94133 Fodersäd, egenproducerat kg 0 1,11 0 kg 0 1,11 0 4132 Högmjölkarkoncentrat kg 1 376 3,00 4 128 kg 1 376 3,00 4 128 94152 Foderhalm kg ts 0 0,50 0 kg ts 0 0,50 0 4138 Mineralfoder kg 40 8,76 350 kg 40 8,76 350 4157 Strömedel kg 255 0,50 128 kg 255 0,50 128 4170 Semin- och kontrollavgift kr 1 761 761 kr 1 761 761 4173 Veterinär, medicin kr 1 737 737 kr 1 737 737 4174 Rådgivning kr 1 72 72 kr 1 72 72 5310 El kWh 710 0,65 462 kWh 710 0,65 462 6312 Djurförsäkring kr 1 125 125 kr 1 125 125 4180 Diverse kostnader kr 1 839 839 kr 1 839 839 EID märke 20 0,45 9,0 SUMMA SÄRKOSTNADER 1 20 700 20 691 0000 Byggnader, underhåll kr 86 200 1,8% 1 552 kr 86 200 1,8% 1 552 0000 Utfodringssystem, underhåll kr 6 300 2,0% 126 kr 6 300 2,0% 126 0000 Foderberedningsanl. underhåll ton 1,74 34,00 59 ton 1,74 34,00 59 0000 Ränta djurkapital kr 8 487 7% 594 kr 8 487 7% 594
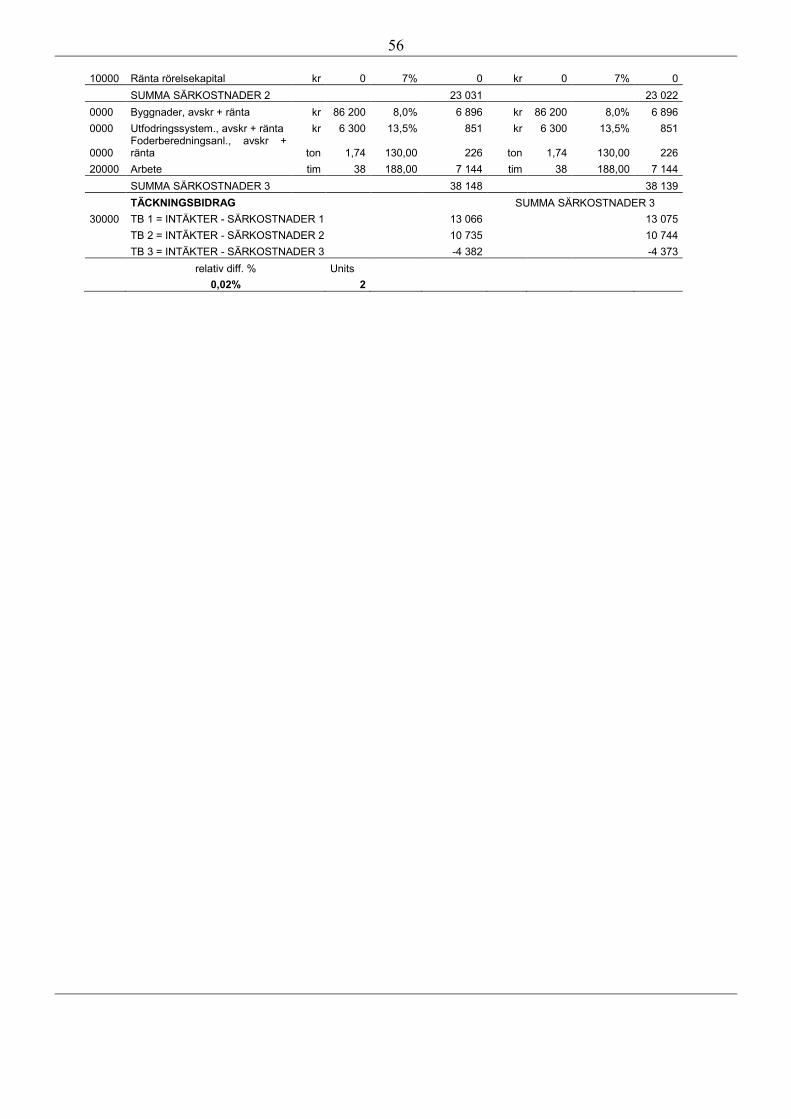
56
10000 Ränta rörelsekapital kr 0 7% 0 kr 0 7% 0 SUMMA SÄRKOSTNADER 2 23 031 23 022 0000 Byggnader, avskr + ränta kr 86 200 8,0% 6 896 kr 86 200 8,0% 6 896 0000 Utfodringssystem., avskr + ränta kr 6 300 13,5% 851 kr 6 300 13,5% 851
0000 Foderberedningsanl., avskr + ränta ton 1,74 130,00 226 ton 1,74 130,00 226
20000 Arbete tim 38 188,00 7 144 tim 38 188,00 7 144 SUMMA SÄRKOSTNADER 3 38 148 38 139 TÄCKNINGSBIDRAG SUMMA SÄRKOSTNADER 3 30000 TB 1 = INTÄKTER - SÄRKOSTNADER 1 13 066 13 075 TB 2 = INTÄKTER - SÄRKOSTNADER 2 10 735 10 744 TB 3 = INTÄKTER - SÄRKOSTNADER 3 -4 382 -4 373 relativ diff. % Units 0,02% 2
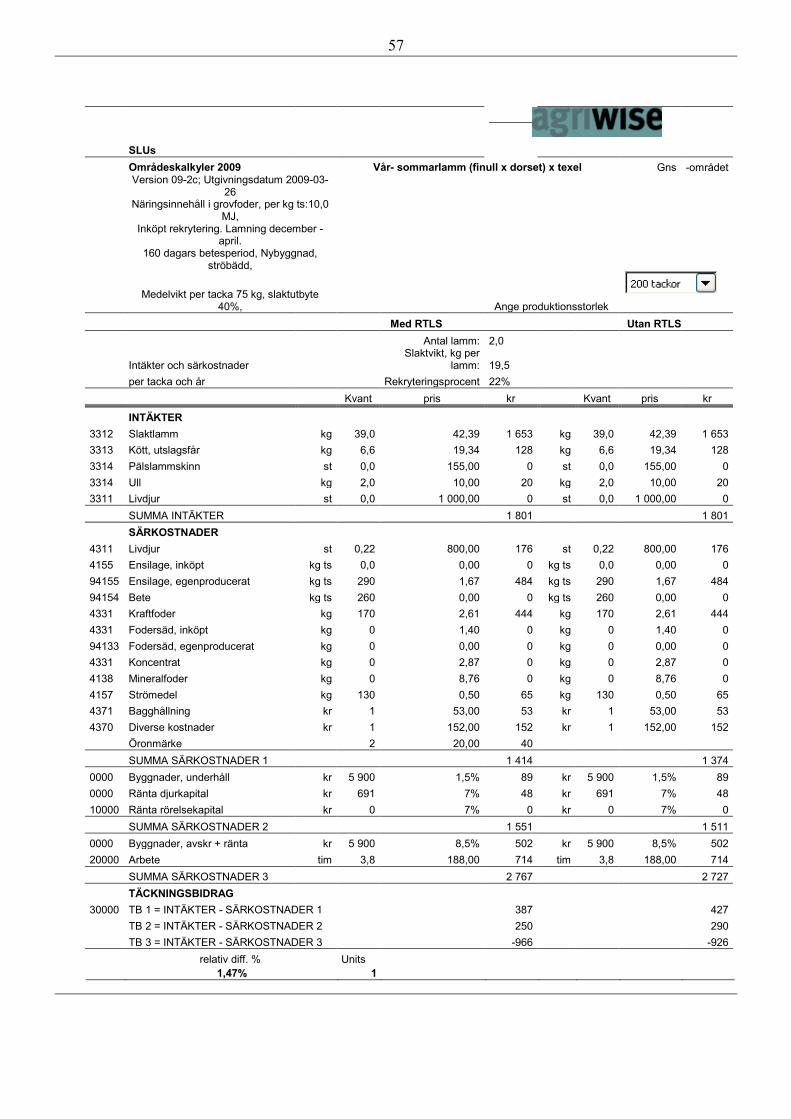
57
SLUs
Områdeskalkyler 2009 Vår- sommarlamm (finull x dorset) x texel Gns -området
Version 09-2c; Utgivningsdatum 2009-03-
26
Näringsinnehåll i grovfoder, per kg ts:10,0
MJ,
Inköpt rekrytering. Lamning december -
april.
160 dagars betesperiod, Nybyggnad,
ströbädd,
Medelvikt per tacka 75 kg, slaktutbyte
40%, Ange produktionsstorlek
Med RTLS Utan RTLS Antal lamm: 2,0
Intäkter och särkostnader Slaktvikt, kg per
lamm: 19,5 per tacka och år Rekryteringsprocent 22% Kvant pris kr Kvant pris kr
INTÄKTER 3312 Slaktlamm kg 39,0 42,39 1 653 kg 39,0 42,39 1 653 3313 Kött, utslagsfår kg 6,6 19,34 128 kg 6,6 19,34 128 3314 Pälslammskinn st 0,0 155,00 0 st 0,0 155,00 0 3314 Ull kg 2,0 10,00 20 kg 2,0 10,00 20 3311 Livdjur st 0,0 1 000,00 0 st 0,0 1 000,00 0 SUMMA INTÄKTER 1 801 1 801 SÄRKOSTNADER 4311 Livdjur st 0,22 800,00 176 st 0,22 800,00 176 4155 Ensilage, inköpt kg ts 0,0 0,00 0 kg ts 0,0 0,00 0 94155 Ensilage, egenproducerat kg ts 290 1,67 484 kg ts 290 1,67 484 94154 Bete kg ts 260 0,00 0 kg ts 260 0,00 0 4331 Kraftfoder kg 170 2,61 444 kg 170 2,61 444 4331 Fodersäd, inköpt kg 0 1,40 0 kg 0 1,40 0 94133 Fodersäd, egenproducerat kg 0 0,00 0 kg 0 0,00 0 4331 Koncentrat kg 0 2,87 0 kg 0 2,87 0 4138 Mineralfoder kg 0 8,76 0 kg 0 8,76 0 4157 Strömedel kg 130 0,50 65 kg 130 0,50 65 4371 Bagghållning kr 1 53,00 53 kr 1 53,00 53 4370 Diverse kostnader kr 1 152,00 152 kr 1 152,00 152 Öronmärke 2 20,00 40 SUMMA SÄRKOSTNADER 1 1 414 1 374 0000 Byggnader, underhåll kr 5 900 1,5% 89 kr 5 900 1,5% 89 0000 Ränta djurkapital kr 691 7% 48 kr 691 7% 48 10000 Ränta rörelsekapital kr 0 7% 0 kr 0 7% 0 SUMMA SÄRKOSTNADER 2 1 551 1 511 0000 Byggnader, avskr + ränta kr 5 900 8,5% 502 kr 5 900 8,5% 502 20000 Arbete tim 3,8 188,00 714 tim 3,8 188,00 714 SUMMA SÄRKOSTNADER 3 2 767 2 727 TÄCKNINGSBIDRAG 30000 TB 1 = INTÄKTER - SÄRKOSTNADER 1 387 427 TB 2 = INTÄKTER - SÄRKOSTNADER 2 250 290 TB 3 = INTÄKTER - SÄRKOSTNADER 3 -966 -926 relativ diff. % Units 1,47% 1
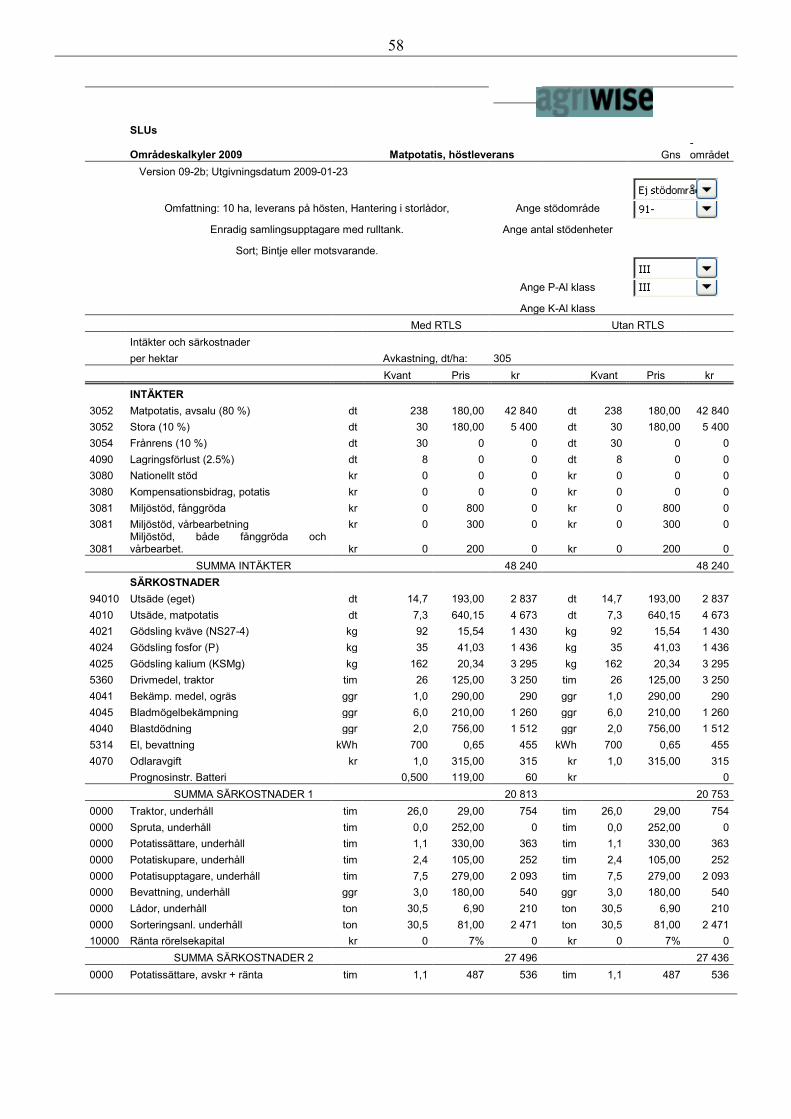
58
SLUs
Områdeskalkyler 2009 Matpotatis, höstleverans Gns -området
Version 09-2b; Utgivningsdatum 2009-01-23
Omfattning: 10 ha, leverans på hösten, Hantering i storlådor, Ange stödområde
Enradig samlingsupptagare med rulltank. Ange antal stödenheter
Sort; Bintje eller motsvarande.
Ange P-Al klass
Ange K-Al klass Med RTLS Utan RTLS Intäkter och särkostnader per hektar Avkastning, dt/ha: 305 Kvant Pris kr Kvant Pris kr
INTÄKTER 3052 Matpotatis, avsalu (80 %) dt 238 180,00 42 840 dt 238 180,00 42 840 3052 Stora (10 %) dt 30 180,00 5 400 dt 30 180,00 5 400 3054 Frånrens (10 %) dt 30 0 0 dt 30 0 0 4090 Lagringsförlust (2.5%) dt 8 0 0 dt 8 0 0 3080 Nationellt stöd kr 0 0 0 kr 0 0 0 3080 Kompensationsbidrag, potatis kr 0 0 0 kr 0 0 0 3081 Miljöstöd, fånggröda kr 0 800 0 kr 0 800 0 3081 Miljöstöd, vårbearbetning kr 0 300 0 kr 0 300 0
3081 Miljöstöd, både fånggröda och vårbearbet. kr 0 200 0 kr 0 200 0
SUMMA INTÄKTER 48 240 48 240 SÄRKOSTNADER 94010 Utsäde (eget) dt 14,7 193,00 2 837 dt 14,7 193,00 2 837 4010 Utsäde, matpotatis dt 7,3 640,15 4 673 dt 7,3 640,15 4 673 4021 Gödsling kväve (NS27-4) kg 92 15,54 1 430 kg 92 15,54 1 430 4024 Gödsling fosfor (P) kg 35 41,03 1 436 kg 35 41,03 1 436 4025 Gödsling kalium (KSMg) kg 162 20,34 3 295 kg 162 20,34 3 295 5360 Drivmedel, traktor tim 26 125,00 3 250 tim 26 125,00 3 250 4041 Bekämp. medel, ogräs ggr 1,0 290,00 290 ggr 1,0 290,00 290 4045 Bladmögelbekämpning ggr 6,0 210,00 1 260 ggr 6,0 210,00 1 260 4040 Blastdödning ggr 2,0 756,00 1 512 ggr 2,0 756,00 1 512 5314 El, bevattning kWh 700 0,65 455 kWh 700 0,65 455 4070 Odlaravgift kr 1,0 315,00 315 kr 1,0 315,00 315 Prognosinstr. Batteri 0,500 119,00 60 kr 0 SUMMA SÄRKOSTNADER 1 20 813 20 753 0000 Traktor, underhåll tim 26,0 29,00 754 tim 26,0 29,00 754 0000 Spruta, underhåll tim 0,0 252,00 0 tim 0,0 252,00 0 0000 Potatissättare, underhåll tim 1,1 330,00 363 tim 1,1 330,00 363 0000 Potatiskupare, underhåll tim 2,4 105,00 252 tim 2,4 105,00 252 0000 Potatisupptagare, underhåll tim 7,5 279,00 2 093 tim 7,5 279,00 2 093 0000 Bevattning, underhåll ggr 3,0 180,00 540 ggr 3,0 180,00 540 0000 Lådor, underhåll ton 30,5 6,90 210 ton 30,5 6,90 210 0000 Sorteringsanl. underhåll ton 30,5 81,00 2 471 ton 30,5 81,00 2 471 10000 Ränta rörelsekapital kr 0 7% 0 kr 0 7% 0 SUMMA SÄRKOSTNADER 2 27 496 27 436 0000 Potatissättare, avskr + ränta tim 1,1 487 536 tim 1,1 487 536
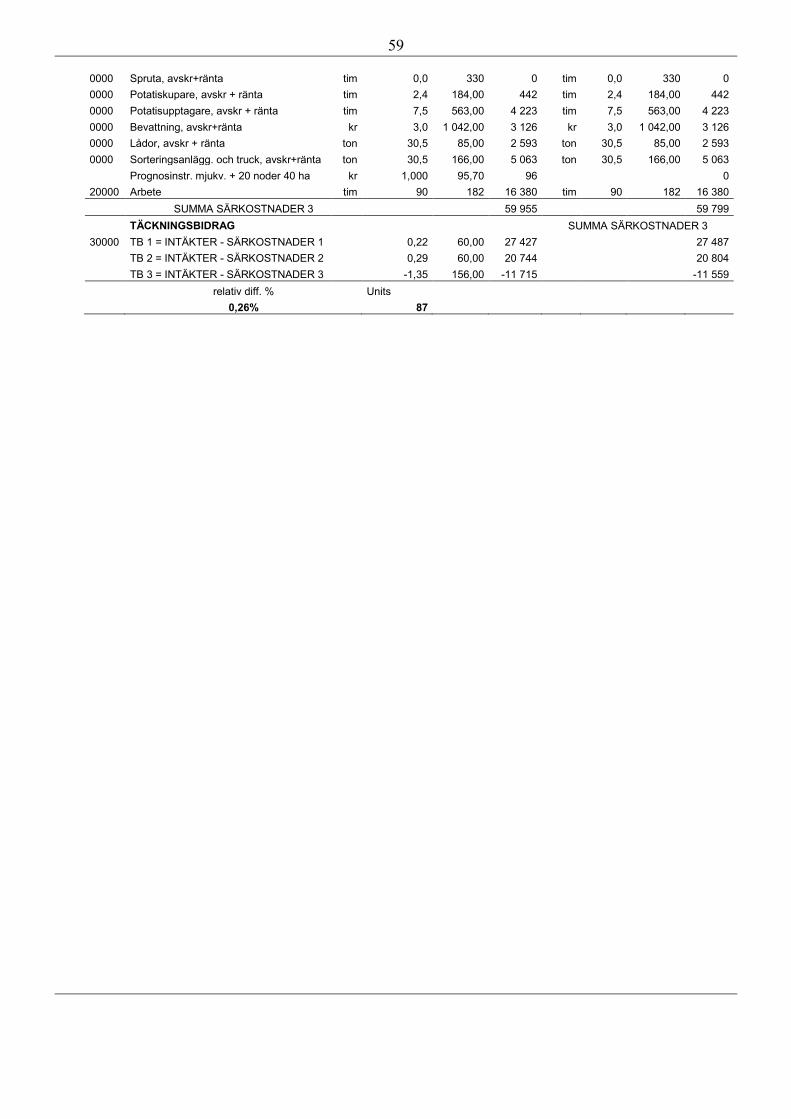
59
0000 Spruta, avskr+ränta tim 0,0 330 0 tim 0,0 330 0 0000 Potatiskupare, avskr + ränta tim 2,4 184,00 442 tim 2,4 184,00 442 0000 Potatisupptagare, avskr + ränta tim 7,5 563,00 4 223 tim 7,5 563,00 4 223 0000 Bevattning, avskr+ränta kr 3,0 1 042,00 3 126 kr 3,0 1 042,00 3 126 0000 Lådor, avskr + ränta ton 30,5 85,00 2 593 ton 30,5 85,00 2 593 0000 Sorteringsanlägg. och truck, avskr+ränta ton 30,5 166,00 5 063 ton 30,5 166,00 5 063 Prognosinstr. mjukv. + 20 noder 40 ha kr 1,000 95,70 96 0 20000 Arbete tim 90 182 16 380 tim 90 182 16 380 SUMMA SÄRKOSTNADER 3 59 955 59 799 TÄCKNINGSBIDRAG SUMMA SÄRKOSTNADER 3 30000 TB 1 = INTÄKTER - SÄRKOSTNADER 1 0,22 60,00 27 427 27 487 TB 2 = INTÄKTER - SÄRKOSTNADER 2 0,29 60,00 20 744 20 804 TB 3 = INTÄKTER - SÄRKOSTNADER 3 -1,35 156,00 -11 715 -11 559 relativ diff. % Units 0,26% 87
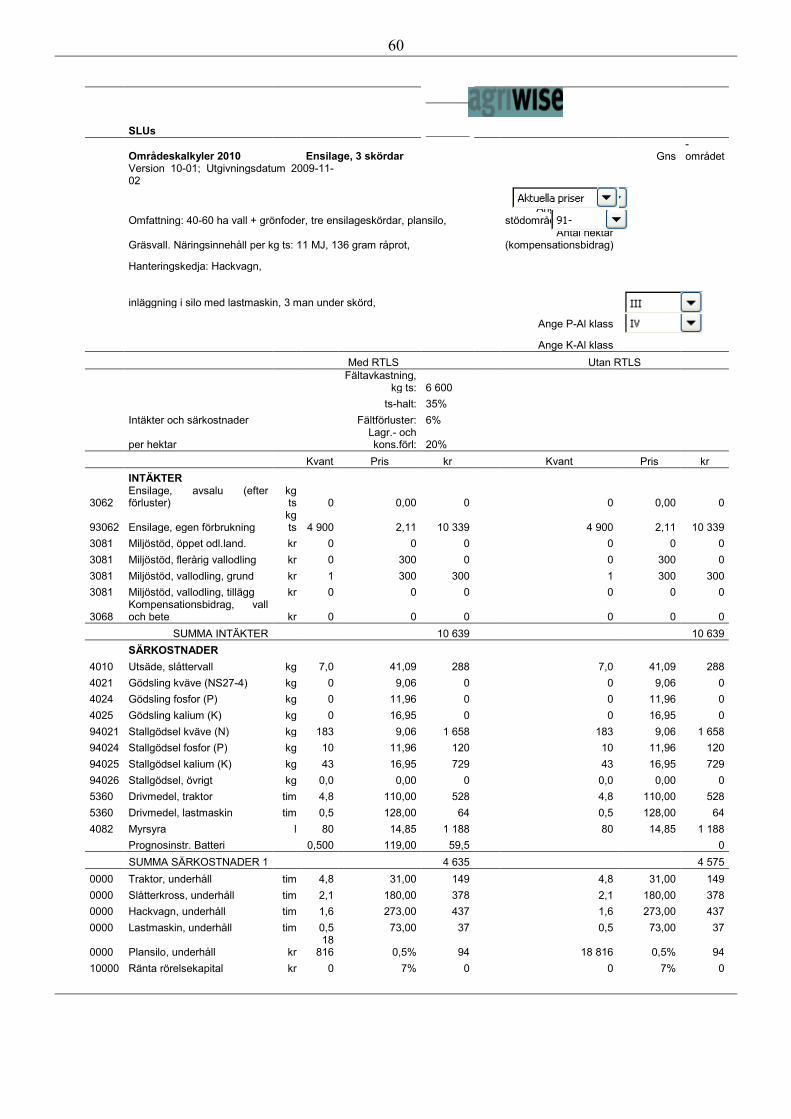
60
SLUs
Områdeskalkyler 2010 Ensilage, 3 skördar Gns -området
Version 10-01; Utgivningsdatum 2009-11-02
Omfattning: 40-60 ha vall + grönfoder, tre ensilageskördar, plansilo,
Ange
stödområde
Gräsvall. Näringsinnehåll per kg ts: 11 MJ, 136 gram råprot, Antal hektar
(kompensationsbidrag)
Hanteringskedja: Hackvagn,
inläggning i silo med lastmaskin, 3 man under skörd,
Ange P-Al klass
Ange K-Al klass Med RTLS Utan RTLS
Fältavkastning,
kg ts: 6 600 ts-halt: 35% Intäkter och särkostnader Fältförluster: 6%
per hektar Lagr.- och kons.förl: 20%
Kvant Pris kr Kvant Pris kr INTÄKTER
3062 Ensilage, avsalu (efter förluster)
kg ts 0 0,00 0 0 0,00 0
93062 Ensilage, egen förbrukning kg ts 4 900 2,11 10 339 4 900 2,11 10 339
3081 Miljöstöd, öppet odl.land. kr 0 0 0 0 0 0 3081 Miljöstöd, flerårig vallodling kr 0 300 0 0 300 0 3081 Miljöstöd, vallodling, grund kr 1 300 300 1 300 300 3081 Miljöstöd, vallodling, tillägg kr 0 0 0 0 0 0
3068 Kompensationsbidrag, vall och bete kr 0 0 0 0 0 0
SUMMA INTÄKTER 10 639 10 639 SÄRKOSTNADER 4010 Utsäde, slåttervall kg 7,0 41,09 288 7,0 41,09 288 4021 Gödsling kväve (NS27-4) kg 0 9,06 0 0 9,06 0 4024 Gödsling fosfor (P) kg 0 11,96 0 0 11,96 0 4025 Gödsling kalium (K) kg 0 16,95 0 0 16,95 0 94021 Stallgödsel kväve (N) kg 183 9,06 1 658 183 9,06 1 658 94024 Stallgödsel fosfor (P) kg 10 11,96 120 10 11,96 120 94025 Stallgödsel kalium (K) kg 43 16,95 729 43 16,95 729 94026 Stallgödsel, övrigt kg 0,0 0,00 0 0,0 0,00 0 5360 Drivmedel, traktor tim 4,8 110,00 528 4,8 110,00 528 5360 Drivmedel, lastmaskin tim 0,5 128,00 64 0,5 128,00 64 4082 Myrsyra l 80 14,85 1 188 80 14,85 1 188 Prognosinstr. Batteri 0,500 119,00 59,5 0 SUMMA SÄRKOSTNADER 1 4 635 4 575 0000 Traktor, underhåll tim 4,8 31,00 149 4,8 31,00 149 0000 Slåtterkross, underhåll tim 2,1 180,00 378 2,1 180,00 378 0000 Hackvagn, underhåll tim 1,6 273,00 437 1,6 273,00 437 0000 Lastmaskin, underhåll tim 0,5 73,00 37 0,5 73,00 37
0000 Plansilo, underhåll kr 18
816 0,5% 94 18 816 0,5% 94 10000 Ränta rörelsekapital kr 0 7% 0 0 7% 0
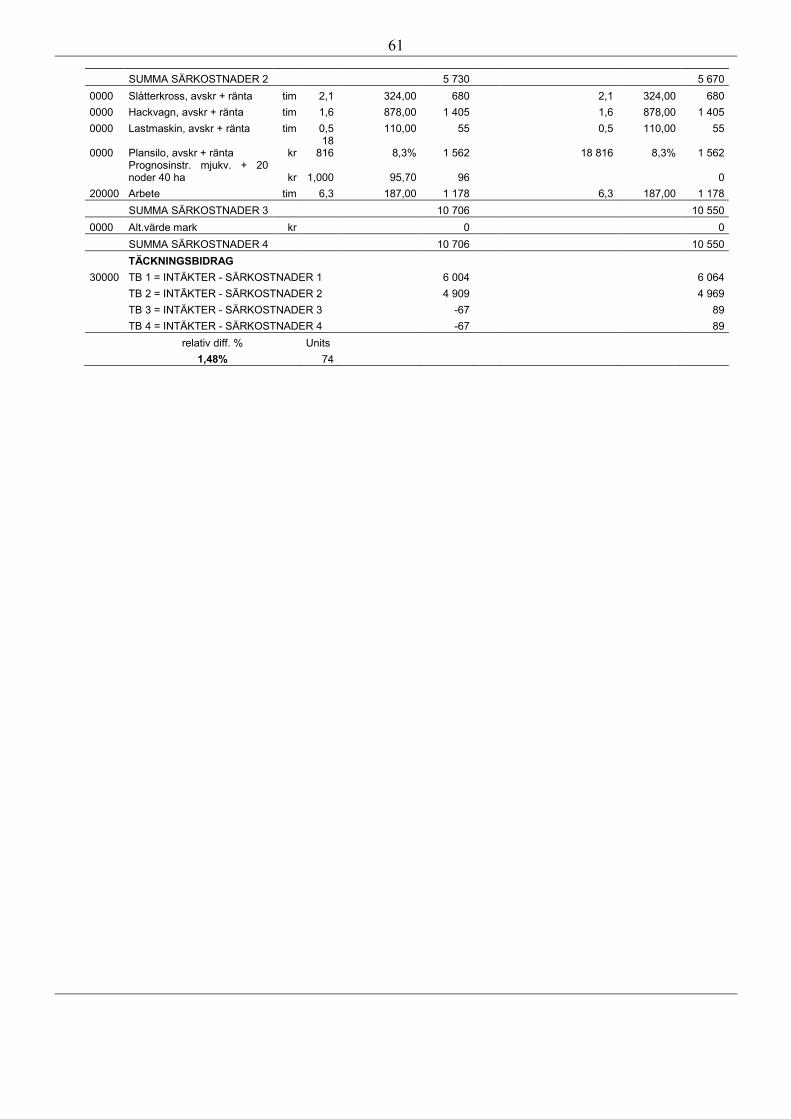
61
SUMMA SÄRKOSTNADER 2 5 730 5 670 0000 Slåtterkross, avskr + ränta tim 2,1 324,00 680 2,1 324,00 680 0000 Hackvagn, avskr + ränta tim 1,6 878,00 1 405 1,6 878,00 1 405 0000 Lastmaskin, avskr + ränta tim 0,5 110,00 55 0,5 110,00 55
0000 Plansilo, avskr + ränta kr 18
816 8,3% 1 562 18 816 8,3% 1 562
Prognosinstr. mjukv. + 20 noder 40 ha kr 1,000 95,70 96 0
20000 Arbete tim 6,3 187,00 1 178 6,3 187,00 1 178 SUMMA SÄRKOSTNADER 3 10 706 10 550 0000 Alt.värde mark kr 0 0 SUMMA SÄRKOSTNADER 4 10 706 10 550 TÄCKNINGSBIDRAG 30000 TB 1 = INTÄKTER - SÄRKOSTNADER 1 6 004 6 064 TB 2 = INTÄKTER - SÄRKOSTNADER 2 4 909 4 969 TB 3 = INTÄKTER - SÄRKOSTNADER 3 -67 89 TB 4 = INTÄKTER - SÄRKOSTNADER 4 -67 89 relativ diff. % Units 1,48% 74
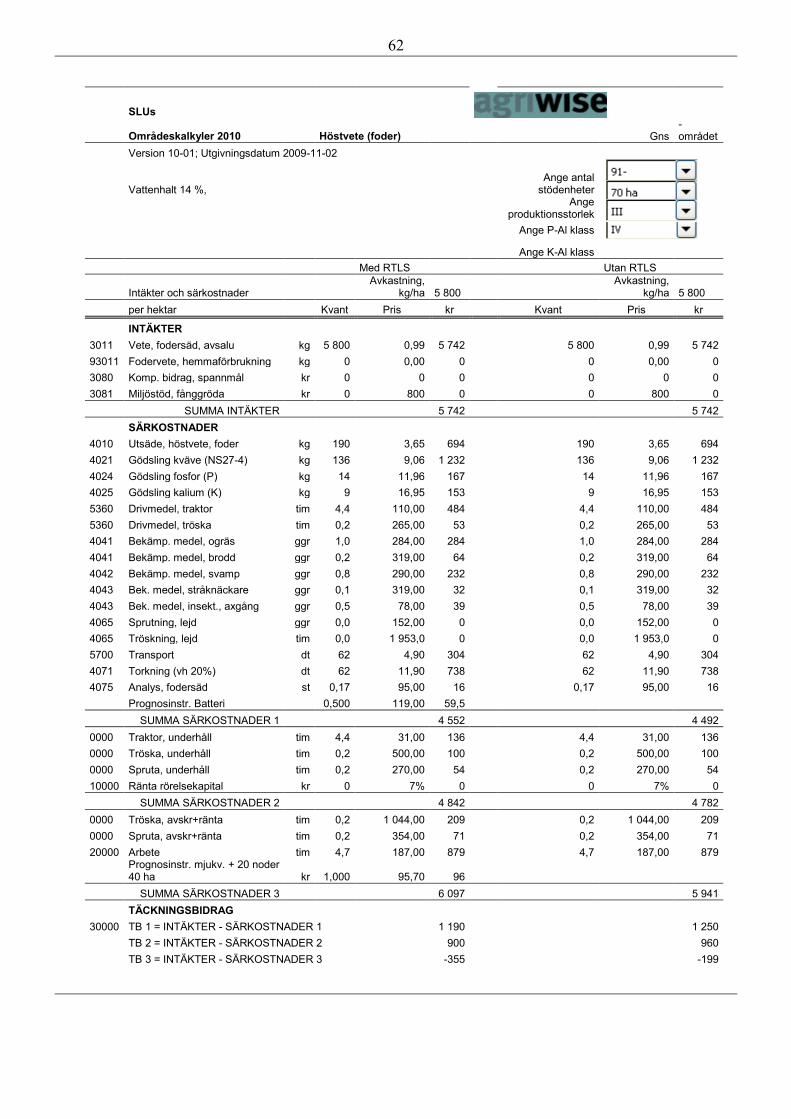
62
SLUs
Områdeskalkyler 2010 Höstvete (foder) Gns -området
Version 10-01; Utgivningsdatum 2009-11-02
Vattenhalt 14 %, Ange antal
stödenheter
Ange
produktionsstorlek Ange P-Al klass
Ange K-Al klass Med RTLS Utan RTLS
Intäkter och särkostnader Avkastning,
kg/ha 5 800 Avkastning,
kg/ha 5 800 per hektar Kvant Pris kr Kvant Pris kr
INTÄKTER 3011 Vete, fodersäd, avsalu kg 5 800 0,99 5 742 5 800 0,99 5 742 93011 Fodervete, hemmaförbrukning kg 0 0,00 0 0 0,00 0 3080 Komp. bidrag, spannmål kr 0 0 0 0 0 0 3081 Miljöstöd, fånggröda kr 0 800 0 0 800 0 SUMMA INTÄKTER 5 742 5 742 SÄRKOSTNADER 4010 Utsäde, höstvete, foder kg 190 3,65 694 190 3,65 694 4021 Gödsling kväve (NS27-4) kg 136 9,06 1 232 136 9,06 1 232 4024 Gödsling fosfor (P) kg 14 11,96 167 14 11,96 167 4025 Gödsling kalium (K) kg 9 16,95 153 9 16,95 153 5360 Drivmedel, traktor tim 4,4 110,00 484 4,4 110,00 484 5360 Drivmedel, tröska tim 0,2 265,00 53 0,2 265,00 53 4041 Bekämp. medel, ogräs ggr 1,0 284,00 284 1,0 284,00 284 4041 Bekämp. medel, brodd ggr 0,2 319,00 64 0,2 319,00 64 4042 Bekämp. medel, svamp ggr 0,8 290,00 232 0,8 290,00 232 4043 Bek. medel, stråknäckare ggr 0,1 319,00 32 0,1 319,00 32 4043 Bek. medel, insekt., axgång ggr 0,5 78,00 39 0,5 78,00 39 4065 Sprutning, lejd ggr 0,0 152,00 0 0,0 152,00 0 4065 Tröskning, lejd tim 0,0 1 953,0 0 0,0 1 953,0 0 5700 Transport dt 62 4,90 304 62 4,90 304 4071 Torkning (vh 20%) dt 62 11,90 738 62 11,90 738 4075 Analys, fodersäd st 0,17 95,00 16 0,17 95,00 16 Prognosinstr. Batteri 0,500 119,00 59,5 SUMMA SÄRKOSTNADER 1 4 552 4 492 0000 Traktor, underhåll tim 4,4 31,00 136 4,4 31,00 136 0000 Tröska, underhåll tim 0,2 500,00 100 0,2 500,00 100 0000 Spruta, underhåll tim 0,2 270,00 54 0,2 270,00 54 10000 Ränta rörelsekapital kr 0 7% 0 0 7% 0 SUMMA SÄRKOSTNADER 2 4 842 4 782 0000 Tröska, avskr+ränta tim 0,2 1 044,00 209 0,2 1 044,00 209 0000 Spruta, avskr+ränta tim 0,2 354,00 71 0,2 354,00 71 20000 Arbete tim 4,7 187,00 879 4,7 187,00 879
Prognosinstr. mjukv. + 20 noder 40 ha kr 1,000 95,70 96
SUMMA SÄRKOSTNADER 3 6 097 5 941 TÄCKNINGSBIDRAG 30000 TB 1 = INTÄKTER - SÄRKOSTNADER 1 1 190 1 250 TB 2 = INTÄKTER - SÄRKOSTNADER 2 900 960 TB 3 = INTÄKTER - SÄRKOSTNADER 3 -355 -199
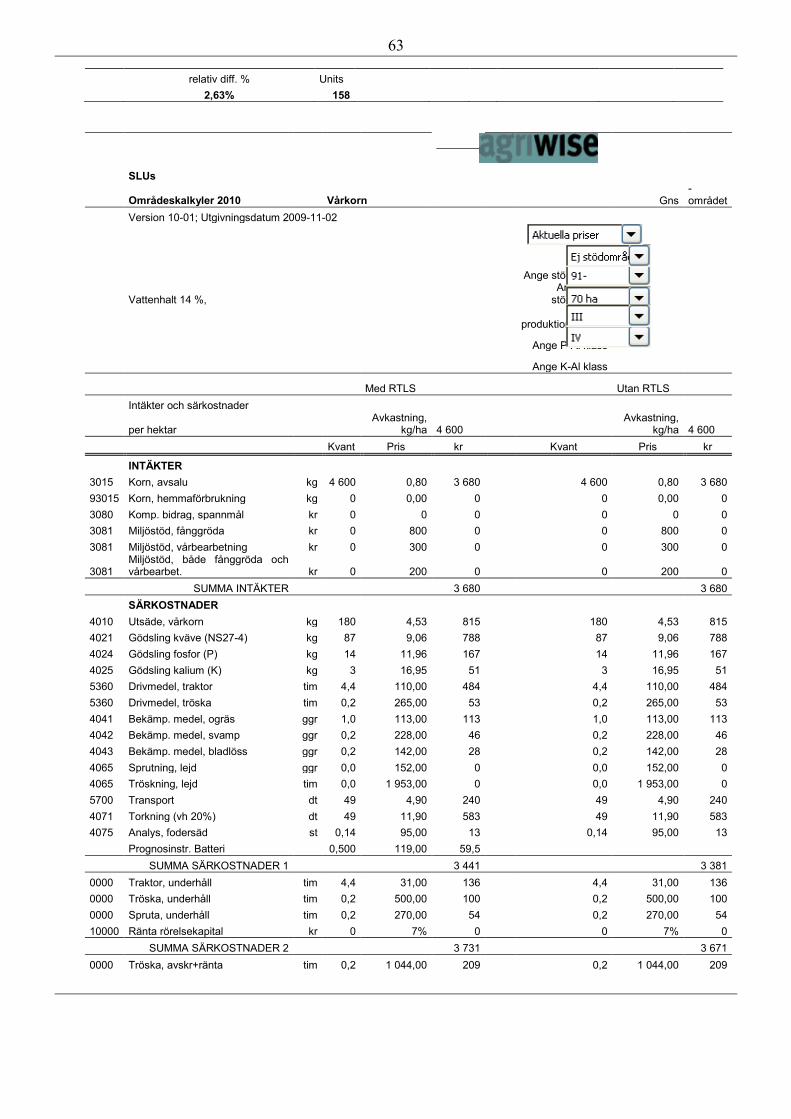
63
relativ diff. % Units 2,63% 158
SLUs
Områdeskalkyler 2010 Vårkorn Gns -området
Version 10-01; Utgivningsdatum 2009-11-02
Ange stödområde
Vattenhalt 14 %, Ange antal
stödenheter
Ange
produktionsstorlek
Ange P-Al klass
Ange K-Al klass
Med RTLS Utan RTLS Intäkter och särkostnader
per hektar Avkastning,
kg/ha 4 600 Avkastning,
kg/ha 4 600 Kvant Pris kr Kvant Pris kr
INTÄKTER 3015 Korn, avsalu kg 4 600 0,80 3 680 4 600 0,80 3 680 93015 Korn, hemmaförbrukning kg 0 0,00 0 0 0,00 0 3080 Komp. bidrag, spannmål kr 0 0 0 0 0 0 3081 Miljöstöd, fånggröda kr 0 800 0 0 800 0 3081 Miljöstöd, vårbearbetning kr 0 300 0 0 300 0
3081 Miljöstöd, både fånggröda och vårbearbet. kr 0 200 0 0 200 0
SUMMA INTÄKTER 3 680 3 680 SÄRKOSTNADER 4010 Utsäde, vårkorn kg 180 4,53 815 180 4,53 815 4021 Gödsling kväve (NS27-4) kg 87 9,06 788 87 9,06 788 4024 Gödsling fosfor (P) kg 14 11,96 167 14 11,96 167 4025 Gödsling kalium (K) kg 3 16,95 51 3 16,95 51 5360 Drivmedel, traktor tim 4,4 110,00 484 4,4 110,00 484 5360 Drivmedel, tröska tim 0,2 265,00 53 0,2 265,00 53 4041 Bekämp. medel, ogräs ggr 1,0 113,00 113 1,0 113,00 113 4042 Bekämp. medel, svamp ggr 0,2 228,00 46 0,2 228,00 46 4043 Bekämp. medel, bladlöss ggr 0,2 142,00 28 0,2 142,00 28 4065 Sprutning, lejd ggr 0,0 152,00 0 0,0 152,00 0 4065 Tröskning, lejd tim 0,0 1 953,00 0 0,0 1 953,00 0 5700 Transport dt 49 4,90 240 49 4,90 240 4071 Torkning (vh 20%) dt 49 11,90 583 49 11,90 583 4075 Analys, fodersäd st 0,14 95,00 13 0,14 95,00 13 Prognosinstr. Batteri 0,500 119,00 59,5 SUMMA SÄRKOSTNADER 1 3 441 3 381 0000 Traktor, underhåll tim 4,4 31,00 136 4,4 31,00 136 0000 Tröska, underhåll tim 0,2 500,00 100 0,2 500,00 100 0000 Spruta, underhåll tim 0,2 270,00 54 0,2 270,00 54 10000 Ränta rörelsekapital kr 0 7% 0 0 7% 0 SUMMA SÄRKOSTNADER 2 3 731 3 671 0000 Tröska, avskr+ränta tim 0,2 1 044,00 209 0,2 1 044,00 209
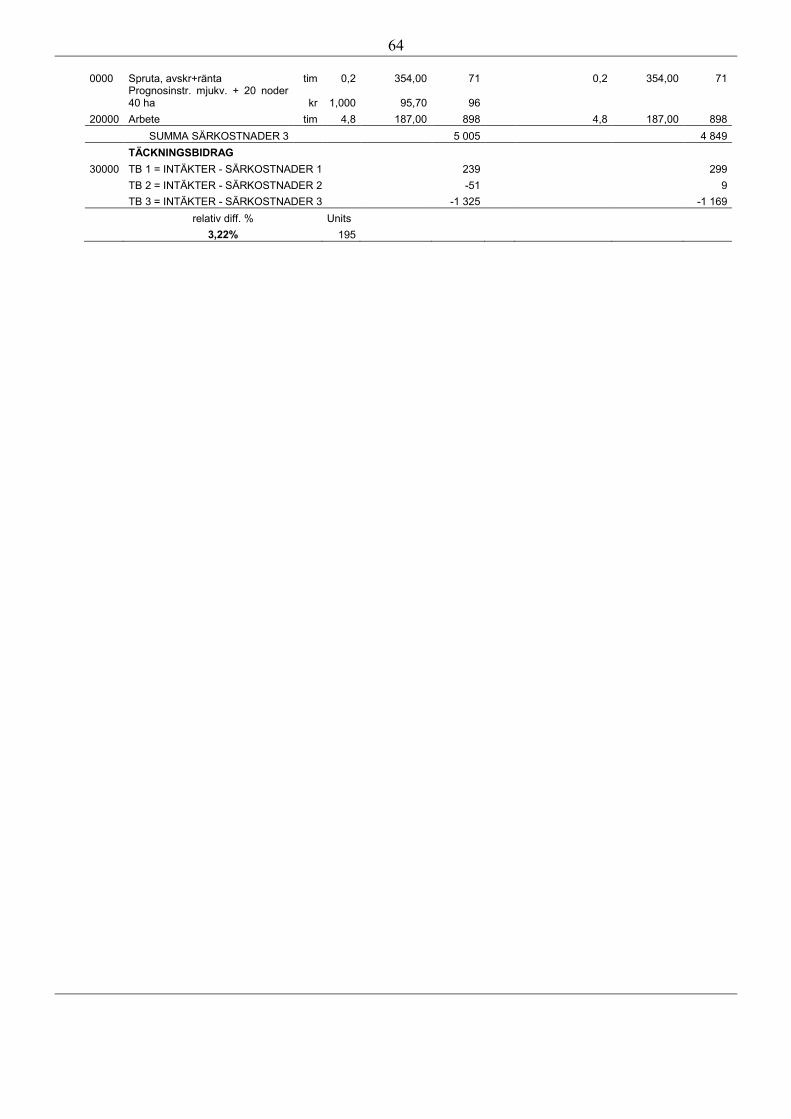
64
0000 Spruta, avskr+ränta tim 0,2 354,00 71 0,2 354,00 71
Prognosinstr. mjukv. + 20 noder 40 ha kr 1,000 95,70 96
20000 Arbete tim 4,8 187,00 898 4,8 187,00 898 SUMMA SÄRKOSTNADER 3 5 005 4 849 TÄCKNINGSBIDRAG 30000 TB 1 = INTÄKTER - SÄRKOSTNADER 1 239 299 TB 2 = INTÄKTER - SÄRKOSTNADER 2 -51 9 TB 3 = INTÄKTER - SÄRKOSTNADER 3 -1 325 -1 169 relativ diff. % Units 3,22% 195

Examensarbete (Institutionen för energi och teknik) Master Thesis (Department of Energy and Technology) ISSN 1654-9392 2010:02 Uppsala 2010