Embed Size (px)
Citation preview

RTG 1666 GlobalFood ⋅ Heinrich Düker Weg 12 ⋅ 37073 Göttingen ⋅ Germany www.uni-goettingen.de/globalfood
ISSN (2192-3248)
www.uni-goettingen.de/globalfood
RTG 1666 GlobalFood
Transformation of Global Agri-Food Systems: Trends, Driving Forces, and Implications for Developing Countries
Georg-August-University of Göttingen
GlobalFood Discussion Papers
No. 27
Food Standards, Certification, and Poverty among Coffee Farmers in
Uganda
Brian Chiputwa Matin Qaim
David J. Spielman
December 2013

Food Standards, Certification, and Poverty among Coffee Farmers in Uganda
Brian Chiputwa a*, Matin Qaim a, and David J. Spielman b
a Department of Agricultural Economics and Rural Development, Georg-August-University of Goettingen, 37073 Goettingen, Germany
b International Food Policy Research Institute (IFPRI), Washington, DC 20006-1002, USA
* Corresponding author; phone: +49-551-3920210, fax: +49-551-3922030,
e-mail: [email protected]
Summary.— Private standards are gaining in importance in global markets for high-value
foods. We analyze and compare impacts of three sustainability oriented standards – Fairtrade,
Organic, and UTZ – on the livelihoods of smallholder coffee farmers in Uganda. Using
survey data and propensity score matching with multiple treatments, we find that Fairtrade
certification increases household living standards by 30% and significantly reduces the
prevalence and depth of poverty. For the other two certification schemes, no significant
impacts are found. Institutional factors that may explain differential impacts are discussed.
Overly general statements about the effects of standards on smallholder livelihoods may be
misleading.
Key words— coffee; smallholder farmers; Organic; Fairtrade; impact; Uganda; Africa
JEL codes— I32; L15; O12; Q13; Q17
Acknowledgements:
This research was financially supported by the German Research Foundation (DFG).

1
Food Standards, Certification, and Poverty among Coffee Farmers in Uganda
Summary.— Private standards are gaining in importance in global markets for high-value
foods. We analyze and compare impacts of three sustainability oriented standards – Fairtrade,
Organic, and UTZ – on the livelihoods of smallholder coffee farmers in Uganda. Using survey
data and propensity score matching with multiple treatments, we find that Fairtrade
certification increases household living standards by 30% and significantly reduces the
prevalence and depth of poverty. For the other two certification schemes, no significant
impacts are found. Institutional factors that may explain differential impacts are discussed.
Overly general statements about the effects of standards on smallholder livelihoods may be
misleading.
1. INTRODUCTION
Food systems around the world are undergoing a rapid transformation, with modern retailers,
private standards, and vertically integrated supply chains gaining in importance (Henson,
Masakure, & Boselie, 2005; Reardon, Barrett, Berdegué, & Swinnen, 2009). This
transformation is partly driven by changing consumer preferences, induced by rising living
standards and growing concerns about food safety and the environmental and social
consequences of agricultural production (Mergenthaler, Weinberger, & Qaim, 2009; Narrod et
al., 2009). What do these trends imply for smallholder farmers in developing countries? On the
one hand, farmers may profit from higher prices that are paid for high-quality products. They
may also benefit from technical and institutional support that is sometimes provided in
integrated supply chains. On the other hand, smallholders may find it difficult to meet the high

2
standards, or they might be exploited by agribusiness companies through monopsony situations
or unfavorable contracts.
A growing body of literature has studied related questions in different developing countries.
One literature strand has analyzed the impacts of new supermarket procurement channels on
smallholder productivity and household welfare (e.g., Hernandez, Reardon, & Berdegué, 2007;
Neven, Odera, Reardon, & Wang, 2009; Rao & Qaim, 2011; Rao, Brümmer, & Qaim, 2012).
Another literature strand has studied the direct and indirect effects of GlobalGAP and other
private standards in horticultural export channels on small-scale producers (e.g., Maertens &
Swinnen, 2009; Asfaw, Mithöfer, & Waibel, 2010; Carletto, Kirk, Winters, & Davis, 2010;
Colen, Maertens, & Swinnen, 2012). Most of these studies show that poor rural households can
benefit from modern supply chains through own participation as producers or through labor
markets.
However, the number of standards is growing, and different standards may have different
impacts. Hence, overly general statements about the welfare effects of standards for
smallholder farmers may not be justified. Especially for luxury foods – such as coffee, tea, or
cocoa – retailers and manufacturers are increasingly using sustainability oriented standards and
labels to differentiate their products and fulfill objectives of corporate social responsibility.
This trend is supported by non-governmental organizations and independent certification
bodies (Liu, Byers, Giovannucci et al., 2008). For coffee, the global market share of products
with sustainability certification – such as Organic, Fairtrade, UTZ, or Rainforest Alliance – has
doubled from 4% in 2006 to 8% in 2009; it is expected to grow to over 20% in the next couple
of years (ITC, 2011). Especially in rich and emerging countries, a rising share of consumers is
willing to pay more for foods that are labeled to be sustainably produced. For coffee and other
tropical products, this also involves consumer perceptions to contribute to improved

3
livelihoods of smallholder farmers (Basu & Hicks, 2008; Elfenbein & McManus, 2010).
However, actual evidence about producer benefits is mixed (ITC, 2011).
Several studies have explored the impacts of different sustainability standards on coffee
producers in developing countries. Impacts of Fairtrade, Organic, and other certification
schemes were analyzed in Nicaragua (Utting-Chamorro, 2005; Bacon, 2005; Valkila & Nygren,
2009; Beuchelt & Zeller, 2011), Mexico (Jaffee, 2008; Barham, Callenes, Gitter, Lewis, &
Weber, 2011), and other countries in Latin America (Raynolds, Murray, & Taylor, 2004).
Some of these studies are qualitative in nature. Others used quantitative techniques but without
accounting for non-random selection of farmers into certification schemes, so the impact
estimates may be biased. There are also a few quantitative studies that tried to control for
selection bias, but most of these studies focused on only one certification scheme. Arnould,
Plastina, & Ball (2009) evaluated the impact of Fairtrade certification on coffee farmers in Peru,
Guatemala, and Nicaragua, using a multi-stage sampling procedure. Ruben & Fort (2012) also
focused on Fairtrade, evaluating impacts in Peru with propensity score matching techniques.
Bolwig, Gibbon & Jones (2009) analyzed impacts of Organic certification in Uganda, and
Wollni & Zeller (2007) looked at specialty coffees in Costa Rica; both studies used Heckman
selection models. Jena et al. (2012) evaluated the impact of coffee certification on smallholder
farmers in Ethiopia; their sample included Fairtrade and Organic farmers, but the results were
not disaggregated by certification scheme. We are not aware of studies that compared impacts
of different certification schemes in the same context, using quantitative techniques and
controlling for selection bias. Such comparison could help to better understand how differences
in the institutional design of standards and certification schemes affect smallholder livelihoods.
Here, we address this research gap by analyzing and comparing impacts of three
sustainability oriented certification schemes – namely, Fairtrade, UTZ, and Organic – on
household living standards and poverty among smallholder coffee producers in Uganda. We
4
use household survey data collected in 2012 and employ a propensity score matching approach
with multiple treatments to control for observed heterogeneity between different groups of
farmers. We also test for the potential role of unobserved heterogeneity. The estimation results
suggest that there are indeed significant differences in impacts between certification schemes.
2. FAIRTRADE, UTZ, AND ORGANIC STANDARDS
Fairtrade, UTZ, and Organic are among the most important sustainability oriented standards
in the global coffee market. Recent trends in the global trade of coffee under these standards
are shown in Figure 1. All three are relevant for smallholder farmers in developing countries,
and all three have social and environmental objectives. For smallholders to be certified under
any of these standards, they need to be organized in farmer groups or cooperatives.
Figure 1 about here
Fairtrade certification and labeling systems for coffee were launched in 1988 by the Fairtrade
Labeling Organization (FLO) with the aim of improving the livelihoods of smallholder
producers and cushioning them from volatile market prices. Fairtrade certification can only be
attained by smallholder producer organizations that are farmer managed, transparent, and
founded on democratic principles. Democratic principles require that leaders are elected by all
members of the organization. The Fairtrade label guarantees producers a minimum floor price,
whenever the international free market price falls below a certain threshold. In addition, a
Fairtrade premium is paid to the producer organization to be used for capacity building,
community development, and related projects. Producers have to ensure good labor conditions
for workers, including payment of minimum wages, no child labor, and measures to reduce
occupational health hazards. There are also specific rules for environmental protection,
including practices for sustainable soil and water management and safe use of pesticides and

5
fertilizers (Fairtrade, 2011). The most important markets for Fairtrade coffee are the United
States, United Kingdom, Germany, France, and the Netherlands (ITC, 2011).
The UTZ labeling system (formerly known as UTZ Kapeh) is a more recently founded
standard. It was established in 1999 by the Ahold Coffee Company, a Dutch roaster, but is now
used by other European coffee companies and restaurant chains as well. The primary focus of
UTZ is on traceability and sustainable production processes, based on Good Agricultural
Practice (GAP) as specified by GlobalGAP. The GlobalGAP standard requires producers to
comply with the labor laws concerning wages and working hours, and to handle agrochemicals
responsibly, as stipulated by the International Labor Organization. The UTZ label does not
guarantee a minimum price to producers, nor does it provide any premium or protection against
price volatility. It is mandatory for UTZ certified farmers to be trained in GAP. The idea is that
this training will contribute to higher coffee yields, better quality, and thus higher prices. The
official website says: “Through the UTZ-program farmers grow better crops, generate more
income and create better opportunities while safeguarding the environment and securing the
earth’s natural resources” (UTZ Certified, 2013). Blackmore et al. (2012) argue that the
certification process is less bureaucratic for UTZ than for other sustainability oriented
standards, which may be one reason for the rapid expansion of this standard. The Netherlands
is the biggest consumer of UTZ certified coffee; around 30% of all coffee consumed in the
Netherlands has the UTZ label (ITC, 2011).
The Organic standard follows the principles of health, ecology, fairness, and care. Certified
farmers have to use production methods based on traditional and scientific knowledge that
maximize farm soil fertility and enhance biodiversity. The use of inorganic inputs such as
synthetic fertilizers and chemical pesticides is strictly prohibited. Organic certification requires
farmers to strictly follow organic production guidelines for a minimum period of three years
(referred to as the conversion period) before getting full certification, thus making it one of the

6
most stringent among the voluntary standards (Coulibaly & Liu, 2006). Prices paid for Organic
coffee are usually higher than for uncertified coffee. The international guidelines for Organic
farming are set by the International Federation of Organic Agriculture Movements (IFOAM),
an organization based in Germany with affiliated organizations in over 100 countries. In
addition, some countries and companies use their own organic standards, which are similar to
the IFOAM guidelines but may differ in certain details.
A fundamental difference between the three standards is that Fairtrade and Organic provide
price bonuses in comparison to free market prices, while UTZ does not. Fairtrade provides a
minimum guaranteed price that is above the average cost of production and independent of the
prevailing international price, while the Organic price is usually above the prevailing
international price, but not necessarily above the average cost of production. Hence, the social
sustainability component has a higher weight in Fairtrade than in the other two standards.
3. METHODS
(a) Modeling farmers’ choice of certification scheme
We model farmers’ participation in a particular certification scheme in a random utility
framework. Utility, , is determined by a set of socioeconomic variables and contextual factors,
X, which also influence the farmers’ ability and willingness to participate in certification. The
farmer is assumed to maximize utility
MAX . (1)
We postulate that coffee farmer will participate in a certified coffee market j if and only if the
utility derived is greater than the utility that results from accessing an alternative
market m. This relationship can be represented by latent variable ∗ as

7
∗ ∀ (2)
wher ∗ is representing the benefits of participating in certified coffee market j as opposed to
market m. While ∗ itself is unobserved, we can observe the type of marketing channel the
farmer participates in. The probability that a farmer participates in certified market j can be
denoted by Pr( =1); if the farmer does not participate in market j, ∗ takes a value of zero. The
utility maximizing behavior of farmers can be represented as
∗ 00 0
∀ (3)
If we assume a linear relationship, I* can be written as
(4)
where β is a vector of coefficients to be estimated, and u is a vector of random disturbances of
the unobserved factors affecting the participation decision.
(b) Modeling the impact of certification
In theory, impacts of a program should be evaluated by estimating the average treatment
effect on the treated (ATT) as follows
| 1 | 1 | 1 , (5)
where denotes the unbiased welfare effect for households i that participate in the program, I
=1. In our case, I = 1 means that households participate in a particular certification scheme.
is the outcome variable of interest (e.g., income, poverty) with certification, while is the
outcome variable when the same households were not certified. Unfortunately, the same

8
households are not observed with and without certification, so in reality one has to compare
certified and uncertified households that are not identical as follows
| 1 | 1 | 0 , (6)
where | 0 is the outcome for households not participating in certification. Equations
(5) and (6) lead to identical results when there is no systematic difference between participating
and non-participating households, except for the certification scheme itself. Yet, whenever
participating and non-participating households differ in terms of observed or unobserved
characteristics, equation (6) will lead to biased impact estimates, where the bias B can be
represented as
| 1 | 0 . (7)
A good method to avoid estimation bias is an experiment where households are randomly
assigned to treatment and control groups, thus ensuring that there are no systematic differences.
In our case, such random assignment was not possible. Our study builds on observational data,
where households self-selected into certification. We use a propensity score matching approach
to reduce selection bias B when evaluating the impact of different certification schemes.
(c) Propensity score matching with multiple treatments
We use generalized propensity scores to control for pre-treatment differences between
certified and uncertified households in estimating the ATT. Propensity score matching (PSM)
is often used to evaluate impacts of a binary treatment variable (e.g., Fischer & Qaim, 2012;
Ruben & Fort, 2012). However, in our case there are different certification schemes j that
farmers can participate in, so that the treatment variable can take more than two values. In
particular, with three certification schemes and one control group, the treatment variable can
have four possible values. We define j=0 for farm households that are not certified under any

9
scheme, j=1 for households with Fairtrade certification, j=2 for households with UTZ
certification, and j=3 for households with Organic certification. We follow theoretical
foundations by Imbens (2000) and Lechner (2001) and empirical applications by Gerfin &
Lechner (2002) and Lechner (2002) for estimating propensity scores with multiple treatments.
For each marketing channel, we predict the individual probability of participation using an
unconditional multinomial probit model. Predicted propensity scores of participation can be
written as
, ∈ 0,1, . .3 . (8)
Following Lechner (2002), the resulting pairwise propensity scores are
│ ∀ ; , ∈ 0,1, . .3 ,
(9)
where │ is the predicted conditional propensity score of a household participating in
channel j as opposed to an alternative channel m. We want to evaluate the impact of
certification in comparison to no certification. In addition, we are interested in how each
certification scheme compares to no certification, and how the different schemes compare
against each other. Thus, there are seven pairwise comparisons, namely certified vs. non-
certified, Fairtrade, UTZ, and Organic vs. non-certified, as well as Fairtrade vs. UTZ, Fairtrade
vs. Organic, and UTZ vs. Organic.
Following Lechner (2001, 2002), estimation of ATT with multiple treatments can be
extended to
ATT | | , ∀ , ∈ 0,1, . .3 (10)
In our case ATT | estimates the expected average effects of participating in marketing
channel j compared to the alternative channel m.

10
As in any PSM analysis, an algorithm to match treated and control households has to be
chosen. We use nearest neighbor matching (NNM) and kernel matching (KM), two commonly
used algorithms for empirical analysis (Caliendo & Kopeinig, 2008). NNM involves choosing
a partner from the control group for matching with each treated household or individual based
on propensity scores. We match each treated household with the three nearest neighbors (with
replacement) in terms of propensity score distances. To avoid the possibility of bad matches,
we impose a maximum caliper restriction of 0.1. KM uses non-parametric techniques to
compare treated and control households based on kernel-weighted averages (Caliendo &
Kopeinig, 2008). For the KM, we specified a default bandwidth of 0.06.
It should be stressed that PSM builds on the conditional independence assumption (CIA),
which is also called selection on observables (Rosenbaum & Rubin, 1983). This means that the
method only controls for observed heterogeneity between treated and control households.
Estimates of the ATT may still be biased when there is unobserved heterogeneity. We test for
the influence of such hidden bias by calculating Rosenbaum bounds (DiPrete & Gangl, 2004;
Becker & Caliendo, 2007).
(d) Estimating poverty outcomes
We are interested in analyzing how sustainability certification affects the living standard and
poverty of coffee-producing households in Uganda. We use household per capita expenditure
on food and non-food consumption items as our measure of living standard. This also includes
the market value of home-produced goods. In evaluating poverty outcomes, we make use of the
FGT (Foster, Greer, & Thorbecke 1984) class of poverty measures, which are calculated as
1
0,
(11)

11
where N is the total number of households in the sample, z is the poverty line, is per capita
expenditure of household i; q is the number of households below the poverty line, and α is the
poverty aversion parameter. We calculate two measures, (i) the head count index, when α= 0,
and (ii) the poverty gap index, when 1. For the calculations, we use the international
poverty line of $1.25 a day in terms of purchasing power parity (PPP). Expenditures by
households in Ugandan shillings (UGX) are converted to international dollars by using the PPP
exchange rate (World Bank, 2013).1
4. DATA AND DESCRIPTIVE STATISTICS
(a) Coffee production in Uganda
Uganda is one of the top coffee producers in Africa, accounting for approximately 2.5% of
global coffee production. Coffee is also the most important export crop in Uganda. Eighty-five
percent of the coffee grown in the country is Robusta, which is indigenous to Uganda, while
the rest is Arabica (World Bank, 2011). It is estimated that in Uganda the coffee sector
employs more than 3.5 million people directly and indirectly. The crop is mostly grown by
smallholders; an estimated 90% of the coffee in Uganda is produced by farm households with
less than 7 acres of total land (GAIN, 2012). In smallholder production systems, coffee is often
intercropped with staples like banana, maize, and cassava; coffee is the main source of cash
income, while the other crops are predominantly grown for subsistence consumption.
Prior to 1991, the Ugandan coffee market was centrally controlled by a marketing board.
Coffee producers were organized in cooperatives, and through these cooperatives the
marketing board paid farmers a fixed price upon delivery, and a premium based on quality at a
later stage. The fixed prices were often below world market levels, and the quality premium
was often paid with significant delays. The system was liberalized in 1991. The Uganda Coffee
1 The PPP exchange rate is 744.62 UGX per dollar. In 2012, the official market exchange rate was around 2600 UGX per dollar.

12
Development Authority (UCDA) was established to monitor and regulate the market, and to
promote value addition and competitiveness among local farmers. But the UCDA is not
directly involved in purchasing or marketing coffee; this is left to independent private traders
and companies. As a result of liberalization, market efficiency and prices that farmers received
for their coffee increased, while poverty rates in coffee-growing regions decreased (Baffes,
2006).
Farmers in Uganda sell their coffee in different forms, depending on technical ability,
availability of labor, financial needs, and other factors. When farmers urgently need cash
already before the harvest, they sometimes decide to sell their coffee to middlemen when it is
still at the flowering stage in the field. Prices received by farmers for such coffee sales are very
low. Alternatively, when the coffee turns red, it can be harvested and sold as fresh red cherries.
If the cherries are dried in the sun to a moisture content of about 12%, they can be sold as
‘kiboko’. The sun-dried cherries can also be milled, by separating the husk from the bean,
using a hulling machine. After milling, the coffee is sold as green beans. Green beans are then
further graded by size, shape, and quality and exported to various international destinations for
roasting (Fafchamps & Hill, 2005).
(b) Household survey
We carried out a structured survey of coffee-producing households in Uganda between July
and September 2012. For the selection of households to be interviewed, we used a multi-stage
sampling procedure. At first, we contacted the main coffee associations in Uganda to obtain
lists of existing farmer cooperatives, including information on their location, the number of
cooperative members, and certification details. Based on these lists and visits to many of the
locations, we purposively selected three cooperatives. These three cooperatives had similar
agro-ecological and infrastructure conditions. All three are located in the Central Region of

13
Uganda; two of them in Luwero District, and the third in Masaka District. In all three
cooperatives, farmers produce Robusta coffee. Luwero and Masaka are among the top four
districts that account for over 50% of Uganda’s Robusta coffee production.
All three cooperatives selected had acquired UTZ certification around the year 2007; two of
them had added a second certification scheme shortly thereafter. At the time of the survey, one
cooperative had only UTZ, the second had UTZ plus Fairtrade, and the third UTZ plus Organic
certification. We could not identify farmers that are only certified under Fairtrade or Organic
without also having UTZ certification. This may be considered a drawback for the evaluation
of individual standards. However, we evaluate the impact of each standard not only in
comparison to uncertified farmers but also in comparison to farmers with other standards, so
the combination in two of the cooperatives is not a problem. As Fairtrade and Organic
standards both have stronger requirements than the UTZ, we refer to the UTZ-Fairtrade
combination as “Fairtrade” and to the UTZ-Organic combination as “Organic” below.
Farmers have to be member of a cooperative to participate in the certification schemes, but
not all members of the three cooperatives actually participated in certification. Hence,
participation is an individual decision. Cooperative management provided us with lists of all
members, including details on the location of each farm household and their participation in
certification schemes. In each cooperative we randomly selected two parishes, and in each
parish we randomly selected three villages. In these villages, we randomly selected households
for the interviews. In total, we interviewed 108 Fairtrade farmers, 101 Organic farmers, and 69
UTZ farmers. In addition, 141 control farmers were randomly selected from the lists of non-
certified farmers in the same villages.
The farmers were interviewed with a structured questionnaire by a small team of local
enumerators that were carefully selected, trained, and supervised by the researchers. The
questionnaire covered all economic activities of households with a detailed breakdown for

14
coffee production and marketing. We also captured the household demographic composition,
food and non-food consumption, and a variety of household contextual characteristics. Food
consumption data were collected through a 7-day recall. As the timing of the survey was
shortly after the main harvest, consumption levels may be somewhat higher than during other
times of the year. Yet, as all farmers were surveyed during a relatively short period, this should
not lead to any bias in the impact assessment.
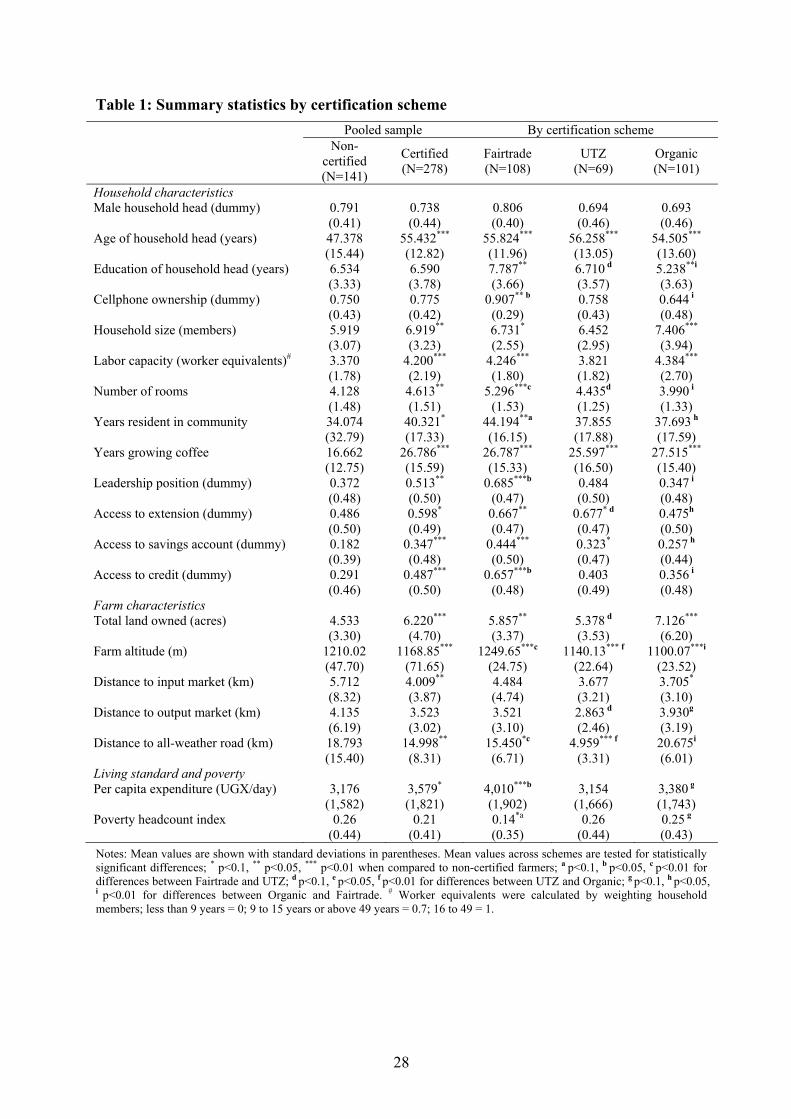
(c) Descriptive statistics
Table 1 shows descriptive statistics of sample farmers with a disaggregation by certification
scheme. There are a few significant differences between certified and non-certified farmers.
Certified farms have larger households, older household heads, longer experience with coffee
cultivation, and better access to credit and agricultural extension. They also have larger farms
and shorter distances to all-weather roads and input shops. Furthermore, we observe a few
significant differences between farmers in different certification schemes. On average,
Fairtrade farmers are better educated, own larger houses, and have better access to credit than
UTZ and Organic farmers. They are also more likely to have a leadership position in the
cooperative or any other local association, which we use as a proxy for diplomatic skills and
social standing. On the other hand, UTZ farmers have better infrastructure conditions, whereas
Organic farmers have somewhat larger landholdings.
Table 1 about here
Considering household consumption expenditures and poverty levels, which are shown in the
lower part of Table 1, Fairtrade farmers seem to be better off than all other groups. This is also
visualized in Figure 2, which depicts cumulative distribution functions (CDFs) of per capita
expenditure for certified and non-certified farmers in our sample. A Kolmogorov-Smirnov test
confirms that the Fairtrade distribution stochastically dominates the CDF of uncertified farmers

15
(p<0.01) and that of UTZ farmers (p<0.05). The pooled CDF for certified farmers dominates
that of non-certified farmers at 10% significance level. Figure 3 shows the poverty headcount
index and the poverty gap. Fairtrade farmers are less likely to be poor, and those below the
poverty line are less likely to be very poor.
Figures 2 and 3 about here
These descriptive statistics suggest that there are systematic differences between participants
and non-participants in certified markets and also between participants in different certification
schemes. However, without estimating treatment effects we do not know whether the observed
differences in household living standards are impacts of certification or the result of other
factors. This will be analyzed in the next section.
5. ESTIMATION RESULTS AND DISCUSSION
(a) Factors influencing the certification decision
We start this analysis by analyzing the factors that influence household decisions to
participate in a particular certification scheme. We estimate a multinomial probit model for the
three certification schemes and take non-certified farmers as the base category. As described
above, this multinomial probit is also employed to calculate propensity scores. Hence, we
include a broad range of explanatory variables. Estimation results are shown in Table 2. For the
calculation of propensity scores it does not matter if the explanatory variables are endogenous.
However, to the extent possible we tried to use exogenous variables. For the more durable
assets such as size of the house and landholding we preferred values lagged by five years, as
this was the time when the certification schemes started in the study region. Thus, we avoid
possible reverse causality. Interestingly, lagged size of the landholding does not influence
participation in any of the three schemes, suggesting that certification is scale-neutral in this

16
local context. However, the size of the house, which we use as a proxy of wealth, increases the
likelihood of Fairtrade and UTZ certification.
Table 2 about here
Farmers with local leadership positions are more likely to be Fairtrade certified, while
access to extension seems to be more important for UTZ and Organic certification. Organic
production involves knowledge-intensive agronomic practices, so farmers with access to
extension may find it easier to participate. Organic practices are often more labor-intensive, too.
Hence, households with a larger family labor capacity have an advantage. And, in organic
production external inputs such as chemical fertilizers and pesticides are replaced with
household resources, which may explain why farms further away from roads and markets are
more likely to be certified in the Organic scheme. For them, it is more difficult to access such
external inputs anyway. In contrast, better road access increases the likelihood of participation
in Fairtrade and UTZ certification.
Based on this multinomial probit model, we predict propensity scores for the PSM analysis.
Figures A1 and A2 in the appendix show the propensity score distributions for each of the
seven pairwise comparisons. Regions of common support are identified by eliminating
observations in the treatment and control groups that do not find matches due to too low or too
high propensity scores (“untreated off-support” and “treated off-support”). These eliminated
observations are not included in the calculation of the treatment effects below.
(b) Impact of certification
Table 3 shows the average treatment effects of certification on household expenditure and
poverty levels for the different matching comparisons. On average, the ATTs are somewhat
larger with nearest neighbor matching than with kernel matching, although the significance
levels are almost identical. Looking at the first comparison between certified and non-certified

17
farmers, we find that certification increases consumption expenditure by UGX 369-479 per
capita and day (PPP $ 0.50-0.64). This effect is significant and implies an increase in living
standard by 12-15% when compared to mean expenditure levels of non-certified households.
However, the effects on household poverty are not statistically significant. These results are
similar to the findings of Jena et al. (2012) in Ethiopia; they also concluded that certification
somewhat increased household expenditures among smallholder coffee producers, but without
a significant effect on poverty.
Table 3 about here
Disaggregating by certification scheme, we find that the positive impact on household
expenditure is entirely driven by Fairtrade certification. Participation in Fairtrade increases per
capita expenditure by 27-33%, while the effects for UTZ and Organic are both insignificant.
Likewise, we find significant poverty-reducing effects for Fairtrade, but not for UTZ and
Organic. Participation in Fairtrade reduces the poverty headcount index by 0.13-0.15, implying
a 50% reduction of the poverty rates among non-certified households. Fairtrade also reduces
the poverty gap by 9-11 percentage points. These results confirm that differentiating impacts
by certification scheme is important.
How do the three certification schemes compare with each other in terms of living standard
effects? Fairtrade farmers have significantly higher household expenditures than both UTZ and
Organic farmers. The differences in the poverty headcount index between certification schemes
are not statistically significant. Interestingly, however, Fairtrade farmers below the poverty line
have a much lower poverty gap than their colleagues in the UTZ and Organic schemes.
Comparing UTZ with Organic, none of the effects is statistically significant. These patterns
underline that Fairtrade is more beneficial for smallholder coffee farmers in Uganda than the
other two certification schemes. The results also suggest that the combination of treatments in
two of the cooperatives is unlikely to confuse the impact assessment. As discussed above,

18
Fairtrade farmers actually have UTZ plus Fairtrade certification, whereas Organic farmers have
UTZ plus Organic certification. Our estimates show that participation in UTZ alone has no
significant effect on living standard. Hence, it seems justified to attribute the combined UTZ-
Fairtrade effects primarily to the Fairtrade standard. This does not rule out that UTZ
certification may facilitate participation in more stringent standards, such as Fairtrade or
Organic.
(c) Robustness tests
As discussed in section 3, PSM controls for selection bias in impact assessment that is caused
by observed heterogeneity between treatment and control groups. While we have used a broad
set of farm, household, and contextual variables to calculate the propensity scores, it is still
possible that there are unobserved factors that could be jointly correlated with the decision to
participate in certification and household living standard. Such unobserved heterogeneity could
bias the estimated treatment effects. To test the robustness of our results we calculate
Rosenbaum bounds for hidden bias (DiPrete & Gangl, 2004; Becker & Caliendo, 2007).
Assume two matched individuals with the same observed covariates that differ in their odds of
participating in a certification scheme solely by the difference in unobserved factors. The
Rosenbaum bound (Г) measures how big the difference in unobserved factors that drive the
participation decision would have to be, in order to render the estimated ATT insignificant.
The Rosenbaum bounds are shown in the last column of Table 3.2 For the significant ATTs,
the values for Г range between 1.5 and 2.3. The lower bound of 1.5 (for the Fairtrade poverty
gap effect) implies that matched farmers with the same observed covariates would have to
differ in terms of unobserved covariates by a factor of 1.5 (50%), in order to invalidate the
inference of a significant treatment effect. The upper bound of 2.3 implies that unobserved
2 The Rosenbaum bounds shown in Table 3 refer to the nearest neighbor matching algorithm. We did the same calculations also for the kernel matching algorithm with almost identical results.

19
covariates could even differ by a factor of 2.3 (130%). Based on these results we conclude that
the impact estimates are quite robust to possible hidden bias.
(d) Possible impact pathways
We have shown that Fairtrade certification is associated with significant benefits for
smallholder coffee producers in Uganda, while UTZ and Organic certification is not. What are
the reasons for these differences in impact between certification schemes? Differences in prices
that farmers receive for their coffee may play a role. In section 2, we discussed that the three
standards involve different pricing schemes. Fairtrade provides minimum support prices to
farmers plus a Fairtrade premium to the cooperative, while Organic coffee is supposed to fetch
a bonus on top of international market prices. In Table 4, we show average coffee prices
received by sample farmers in different marketing channels. As coffee prices can fluctuate
considerably, we asked farmers to report prices received over a period of two years. These
price data are not normally distributed; we show median prices that better reflect the average
than arithmetic means. Prices received by farmers for certified coffee are significantly higher
than for non-certified coffee. This is in line with expectations and with studies conducted in
other settings (e.g., Bacon, 2005; Wollni & Zeller, 2007). However, further disaggregation by
certification scheme reveals that this pattern is primarily driven by the high prices in the
Fairtrade scheme. In fact, average prices received for UTZ and Organic coffee are not
significantly different from prices received for non-certified coffee. This also confirms farmers’
subjective perceptions. Especially Organic farmers in our sample pointed out that there is
usually no difference in prices between certified Organic and uncertified channels. An
advantage of selling to traders in uncertified channels is that farmers get cash on the spot, while
sales in the Organic channels are through the cooperative and associated with payment delays.
Table 4 about here

20
Table 4 shows that the average price received for Fairtrade coffee is more than double the
price of uncertified coffee. This is not only due to price bonuses for certified coffee, but also to
differences in processing and sales channels. Many non-certified farmers sell their coffee as
fresh red cherries or as ‘kiboko’. UTZ and Organic producers also sell primarily in the ‘kiboko’
stage. In contrast, farmers in the Fairtrade cooperative mostly sell their coffee after milling in
the green bean stage. Hence, Fairtrade farmers benefit from value addition at the cooperative
level. Such value addition, including capacity building and technological upgrading, is
especially promoted through the Fairtrade premium. Obviously, other cooperatives could also
engage in further processing, but this is not specifically supported in any of the other schemes.
Furthermore, there is an important institutional difference in the local context. The Fairtrade
cooperative is entirely managed by its farmer members, and it owns the certification documents
itself. The cooperative independently sells the coffee directly to exporters in Kampala, where it
can negotiate prices. In contrast, the certification process for the UTZ and Organic cooperatives
was partly funded by local export companies. Thus, the certification documents are owned by
these companies, who buy the coffee from certified farmers and determine prices and
processing stages.
6. CONCLUSION
Global food systems are undergoing a rapid transformation, with high-value market
segments, private standards, and certification schemes gaining in importance. Smallholder
farmers in developing countries may potentially benefit from these trends when they can be
linked successfully to the emerging international value chains. Especially for luxury foods from
tropical regions – such as coffee, tea, and cocoa – manufacturers and retailers use an increasing
number of sustainability oriented standards and labels that also promise to improve the
livelihoods of farmers. Several recent studies have analyzed the impacts of sustainability

21
oriented standards on farmers in developing countries, but no previous research has compared
the effects of different standards in the same setting with rigorous quantitative evaluation
techniques. This can be important to better understand how differences in standard design and
certification practices can affect outcomes at the local level. In this article, we have addressed
this research gap and have analyzed and compared the impact of three standards, namely
Fairtrade, UTZ, and Organic, on the livelihoods of coffee farmers in Uganda. For the analysis,
we have used data from a household survey in Central Uganda and a propensity score matching
approach with multiple treatments.
Estimation results show that farm households in all three certification schemes combined
have significantly higher living standards than their matched counterparts in non-certified
channels. Poverty effects are not statistically significant for the combined sample of certified
households. However, disaggregation by certification scheme has revealed important
differences. Fairtrade certification causes a 30% increase in per capita consumption
expenditures, primarily through higher prices received in the Fairtrade channel. Fairtrade
certification cuts the likelihood of being poor by 50% and also significantly reduces the
poverty gap. Participation in UTZ and Organic certification schemes is not associated with
significant impacts on living standards and poverty. In fact, average prices received by UTZ
and Organic farmers are not different from those received by non-certified farmers. These
results confirm that differentiating by certification scheme is important. Overly broad
statements about the impact of certification in general may be misleading.
The differences in impact can be explained by various factors. First, Fairtrade guarantees
farmers a minimum support price and pays an additional Fairtrade premium to the cooperative
for capacity building and related community projects. Such social premiums are not paid in
UTZ and Organic certification schemes. Second, farmers in the Fairtrade cooperative have
more freedom how to market their coffee. The cooperative owns the certification documents

22
itself and can sell to any buyer; thus it is in a better position to negotiate prices. In contrast, the
UTZ and Organic certification documents are owned by specific exporters, to which
participating farmers have to sell their coffee. Third, and related to the previous point, the
Fairtrade cooperative sells most of the coffee from its members in milled form as green beans;
member farmers benefit from this value addition at the cooperative level. UTZ and Organic
farmers, on the other hand, sell most of their coffee in unprocessed form, as specified by the
exporters that own the certification documents. Some of these factors are specific to the
particular cooperatives analyzed here. Therefore, one should not extrapolate these findings to
other settings without further analysis. We should also stress that our study is not an attempt to
holistically assess all possible impacts of certification. We focused on socioeconomic
implications for smallholder producers in terms of living standard and poverty. Especially the
Organic standard places higher priority on aspects of environmental sustainability, which we
did not analyze here.
Nevertheless, there are some broader lessons that can be learned from our results. First, when
provided with institutional support, smallholder farmers and cooperatives can participate in
certified markets and comply with stringent food quality and food safety standards. The
cooperatives investigated in this study, in one of the poorest countries in the world, were
certified around the year 2007 and have since managed to fully comply with the different
international standards. This is encouraging and disproves pessimistic views that smallholder
farmer will not be able to participate in high-value markets on a sustained basis. Second, the
impact of standards and certification on farmer livelihoods may differ significantly by
certification scheme. Hence, it is worthwhile to take a closer look. Better understanding impact
differences and factors that contribute to these differences may be relevant for all actors along
the supply chain, including for consumers who may wish to make more informed purchase
decisions. Such understanding may also help improve the design of standards and certification

23
systems from a social perspective. Third, the impacts of standards and certification systems
depend to a large extent on institutional factors at the local level, including cooperative
performance and management capacity. Certification may be a prerequisite for entering
international high-value chains, but this alone is not a sufficient condition for improved
livelihoods and poverty reduction.

24
REFERENCES
Arnould, E. J., Plastina, A., & Ball, D. (2009). Does Fair Trade deliver on its core value proposition? Effects on income, educational attainment, and health in three countries. Journal of Public Policy & Marketing, 28(2), 186–201.
Asfaw, S., Mithöfer, D., & Waibel, H. (2009). EU food safety standards, pesticide use and farm-level productivity: the case of high-value crops in Kenya. Journal of Agricultural Economics, 60(3), 645–667.
Asfaw, S., Mithöfer, D., & Waibel, H. (2010). Agrifood supply chain, private-sector standards, and farmers’ health: evidence from Kenya. Agricultural Economics, 41, 251–263.
Bacon, C. M. (2005). Confronting the coffee crisis: can fair trade, organic, and specialty coffees reduce small-scale farmer vulnerability in northern Nicaragua? World Development, 33(3), 497–511.
Baffes, J. (2006). Restructuring Uganda’s coffee industry: why going back to basics matters. Development Policy Review, 24(4), 413-436.
Barham, B., Callenes, M., Gitter, S., Lewis, J., & Weber, J. (2011). Fair trade/organic coffee, rural livelihoods, and the “agrarian question”: southern Mexican coffee families in transition. World Development, 39(1), 134–145.
Basu, A., & Hicks, R. (2008). Label performance and the willingness to pay for Fair Trade coffee: a cross‐national perspective. International Journal of Consumer Studies, 5(32), 823–42.
Becker, S., & Caliendo, M. (2007). Mhbounds-sensitivity analysis for average treatment effects. The Stata Journal, 7(1), 71–83.
Beuchelt, T.D., & Zeller, M. (2011). Profits and poverty: certification's troubled link for Nicaragua's organic and Fairtrade coffee producers. Ecological Economics, 70(7), 1316-1324.
Blackmore, E., Keeley, J., with Pyburn, R., M., E., Chen, L., & Yuhui. (2012). Pro-poor certification: assessing the benefits of sustainability certification for small-scale farmers in Asia. Natural Resource Issues 25, London: International Institute of Environment and Development.
Bolwig, S., Gibbon, P., & Jones, S. (2009). The economics of smallholder organic contract farming in tropical Africa. World Development, 37(6), 1094–1104.
Caliendo, M., & Kopeinig, S. (2008). Some practical guidance for the implementation of propensity score matching. Journal of Economic Surveys, 22(1), 31–72.
Carletto, C., Kirk, A., Winters, P. C., & Davis, B. (2010). Globalization and smallholders: the adoption, diffusion, and welfare impact of non-traditional export crops in Guatemala. World Development, 38(6), 814–827.
25
Colen, L., Maertens, M., & Swinnen, J. (2012). Private standards, trade and poverty: GlobalGAP and horticultural employment in Senegal. The World Economy, 35(8), 1073–1088.
Coulibaly, A. L., & Liu, P. (2006). Regulations, Standards and Certification for Agricultural Exports. A Practical Manual for Producers and Exporters in East Africa. Rome: Food and Agricultural Organization of the United Nations.
DiPrete, T., & Gangl, M. (2004). Assessing bias in the estimation of causal effects: Rosenbaum bounds on matching estimators and instrumental variables estimation with imperfect instruments. Sociological Methodology, 34, 271–310.
Elfenbein, D. W., & McManus, B. (2010). A greater price for a greater good? Evidence that consumers pay more for charity-linked products. American Economic Journal: Economic Policy, 2(2), 28–60.
Fafchamps, M., & Hill, R. (2005). Selling at the farmgate or traveling to market. American Journal of Agricultural Economics, 87(3), 717–734.
Fairtrade (2011). Fairtrade Standard for Small Producer Organizations. Retrieved on 6 December 2013 from http://www.fairtrade.net.
Fischer, E., & Qaim, M. (2012). Linking smallholders to markets: determinants and impacts of farmer collective action in Kenya. World Development, 40(6), 1255–1268.
Foster, J., Greer, J., & Thorbecke, E. (1984). A class of decomposable poverty measures. Econometrica, 52(3), 761-766.
GAIN. (2012). Uganda Coffee Annual Report 2012. Kampala: Global Agricultural Information Network, USDA Foreign Agricultural Services.
Gerfin, M., & Lechner, M. (2002). A microeconometric evaluation of the active labour market policy in Switzerland. Economic Journal, 482(112), 854–893.
Henson, S., Masakure, O., & Boselie, D. (2005). Private food safety and quality standards for fresh produce exporters: the case of Hortico Agrisystems, Zimbabwe. Food Policy, 30(4), 371–384.
Hernandez, R., Reardon, T., & Berdegue, J. (2007). Supermarkets, wholesalers, and tomato growers in Guatemala. Agricultural Economics, 36(3), 281–290.
Imbens, G. (2000). The role of the propensity score in estimating dose-response functions. Biometrika, 87(3), 706–710.
ITC (2011). Trends in the Trade of Certified Coffees. Technical Paper, Geneva: International Trade Center, World Trade Organization and United Nations.
Jaffee, D. (2008). “Better, but not great”: the social and environmental benefits and limitations of Fair Trade for indigenous coffee producers in Oaxaca, Mexico. In R. Rueben (ed.). The Impact of Fair Trade. Wageningen: Wageningen Academic Publishers, pp. 195–222.

26
Jena, P. R., Chichaibelu, B. B., Stellmacher, T., & Grote, U. (2012). The impact of coffee certification on small-scale producers’ livelihoods: a case study from the Jimma Zone, Ethiopia. Agricultural Economics, 43(4), 429–440.
Lechner, M. (2001). Identification and estimation of causal effects of multiple treatments under the conditional independence assumption. In M. Lechner & F. Pfeiffer (eds.). Econometric Evaluation of Labour Market Policies. ZEW Economic Studies 13, Heidelberg: Physica Verlag, pp. 43-58.
Lechner, M. (2002). Program heterogeneity and propensity score matching: an application to the evaluation of active labor market policies. Review of Economics and Statistics, 84(May), 205–220.
Liu, P., Byers, A., & Giovannucci, D. (2008). Value-Adding Standards in the North American Food Market - Trade Opportunities in Certified Products for Developing Countries. Rome: Food and Agriculture organization of the United Nations.
Maertens, M., & Swinnen, J. F. M. (2009). Trade, standards, and poverty: Evidence from Senegal. World Development, 37(1), 161–178.
Mergenthaler, M., Weinberger, K., & Qaim, M. (2009). The food system transformation in developing countries: a disaggregate demand analysis for fruits and vegetables in Vietnam. Food Policy, 34(5), 426-436.
Narrod, C., Roy, D., Okello, J., Avendaño, B., Rich, K., & Thorat, A. (2009). Public–private partnerships and collective action in high value fruit and vegetable supply chains. Food Policy, 34(1), 8–15.
Neven, D., Odera, M. M., Reardon, T., & Wang, H. L. (2009). Kenyan supermarkets, emerging middle-class horticultural farmers, and employment impacts on the rural poor. World Development, 37(11), 1802–1811.
Rao, E. J. O., Brümmer, B., & Qaim, M. (2012). Farmer participation in supermarket channels, production technology, and efficiency: the case of vegetables in Kenya. American Journal of Agricultural Economics, 94(4), 891–912.
Rao, E. J. O., & Qaim, M. (2011). Supermarkets, farm household income, and poverty: insights from Kenya. World Development, 39(5), 784–796.
Raynolds, Laura T., Murray, D., & Leigh Taylor, P. (2004). Fair trade coffee: building producer capacity via global networks. Journal of International Development, 16(8), 1109–1121.
Reardon, T., Barrett, C. B., Berdegué, J. A., & Swinnen, J. F. M. (2009). Agrifood industry transformation and small farmers in developing countries. World Development, 37(11), 1717–1727.
Rosenbaum, P. R., & Rubin, D. B. (1983). The central role of the propensity score in observational studies for causal effects. Biometrika, 70(1), 41.

27
Ruben, R., & Fort, R. (2012). The impact of Fair Trade certification for coffee farmers in Peru. World Development, 40(3), 570–582.
Utting-Chamorro, K. (2005). Does fair trade make a difference? The case of small coffee producers in Nicaragua. Development in Practice, 15(3), 584–599.
UTZ Certified (2013). https://www.utzcertified.org (retrieved on 6 December 2013).
Valkila, Joni, & Nygren, A. (2009). Impacts of Fair Trade certification on coffee farmers, cooperatives, and laborers in Nicaragua. Agriculture and Human Values, 27(3), 321–333.
Wollni, M., & Zeller, M. (2007). Do farmers benefit from participating in specialty markets and cooperatives? The case of coffee marketing in Costa Rica1. Agricultural Economics, 37(2-3), 243–248.
World Bank. (2011). Ugandan Coffee Supply Chain Risk Assessment. Washington, DC: World Bank.
World Bank. (2013). World Development Indicators. Washington, DC: World Bank.
28
Table 1: Summary statistics by certification scheme
Pooled sample By certification scheme Non-
certified (N=141)
Certified (N=278)
Fairtrade (N=108)
UTZ (N=69)
Organic (N=101)
Household characteristics Male household head (dummy) 0.791 0.738 0.806 0.694 0.693 (0.41) (0.44) (0.40) (0.46) (0.46) Age of household head (years) 47.378 55.432*** 55.824*** 56.258*** 54.505*** (15.44) (12.82) (11.96) (13.05) (13.60) Education of household head (years) 6.534 6.590 7.787** 6.710 d 5.238**i (3.33) (3.78) (3.66) (3.57) (3.63) Cellphone ownership (dummy) 0.750 0.775 0.907** b 0.758 0.644 i (0.43) (0.42) (0.29) (0.43) (0.48) Household size (members) 5.919 6.919** 6.731* 6.452 7.406*** (3.07) (3.23) (2.55) (2.95) (3.94) Labor capacity (worker equivalents)# 3.370 4.200*** 4.246*** 3.821 4.384*** (1.78) (2.19) (1.80) (1.82) (2.70) Number of rooms 4.128 4.613** 5.296***c 4.435d 3.990 i (1.48) (1.51) (1.53) (1.25) (1.33) Years resident in community 34.074 40.321* 44.194**a 37.855 37.693 h (32.79) (17.33) (16.15) (17.88) (17.59) Years growing coffee 16.662 26.786*** 26.787*** 25.597*** 27.515*** (12.75) (15.59) (15.33) (16.50) (15.40) Leadership position (dummy) 0.372 0.513** 0.685***b 0.484 0.347 i (0.48) (0.50) (0.47) (0.50) (0.48) Access to extension (dummy) 0.486 0.598* 0.667** 0.677* d 0.475h (0.50) (0.49) (0.47) (0.47) (0.50) Access to savings account (dummy) 0.182 0.347*** 0.444*** 0.323* 0.257 h (0.39) (0.48) (0.50) (0.47) (0.44) Access to credit (dummy) 0.291 0.487*** 0.657***b 0.403 0.356 i (0.46) (0.50) (0.48) (0.49) (0.48) Farm characteristics Total land owned (acres) 4.533 6.220*** 5.857** 5.378 d 7.126*** (3.30) (4.70) (3.37) (3.53) (6.20) Farm altitude (m) 1210.02 1168.85*** 1249.65***c 1140.13*** f 1100.07***i (47.70) (71.65) (24.75) (22.64) (23.52) Distance to input market (km) 5.712 4.009** 4.484 3.677 3.705* (8.32) (3.87) (4.74) (3.21) (3.10) Distance to output market (km) 4.135 3.523 3.521 2.863 d 3.930g (6.19) (3.02) (3.10) (2.46) (3.19) Distance to all-weather road (km) 18.793 14.998** 15.450*c 4.959*** f 20.675i (15.40) (8.31) (6.71) (3.31) (6.01) Living standard and poverty Per capita expenditure (UGX/day) 3,176 3,579* 4,010***b 3,154 3,380 g (1,582) (1,821) (1,902) (1,666) (1,743) Poverty headcount index 0.26 0.21 0.14*a 0.26 0.25 g (0.44) (0.41) (0.35) (0.44) (0.43)
Notes: Mean values are shown with standard deviations in parentheses. Mean values across schemes are tested for statistically significant differences; * p<0.1, ** p<0.05, *** p<0.01 when compared to non-certified farmers; a p<0.1, b p<0.05, c p<0.01 for differences between Fairtrade and UTZ; d p<0.1, e p<0.05, f p<0.01 for differences between UTZ and Organic; g p<0.1, h p<0.05, i p<0.01 for differences between Organic and Fairtrade. # Worker equivalents were calculated by weighting household members; less than 9 years = 0; 9 to 15 years or above 49 years = 0.7; 16 to 49 = 1.

29
Table 2: Multinomial probit estimates for participation in certification schemes
Variables Fairtrade UTZ Organic Household characteristics Male household head (dummy) -0.142 0.158 0.893 (0.384) (0.501) (0.634) Age of household head (years) 0.104 0.127 0.270** (0.077) (0.093) (0.115) Age of household head squared -0.001 -0.001 -0.002** (0.001) (0.001) (0.001) Education of household head (years) 0.067 0.073 -0.036 (0.050) (0.071) (0.083) Cellphone ownership (dummy) 0.106 0.334 0.284 (0.467) (0.475) (0.586) Labor capacity (worker equivalents) 0.061 0.172 0.243* (0.087) (0.119) (0.135) Number of rooms (5 years ago) 0.276*** 0.289** -0.096 (0.100) (0.132) (0.211) Years resident in community 0.006 0.008 0.004 (0.005) (0.011) (0.009) Years growing coffee 0.038*** 0.017 0.029 (0.013) (0.020) (0.024) Leadership position (dummy) 0.853*** 0.554 -0.695 (0.326) (0.466) (0.653) Access to extension (dummy) 0.389 1.477*** 1.357** (0.312) (0.484) (0.584) Access to savings account (dummy) 0.200 0.312 0.536 (0.364) (0.558) (0.666) Access to credit (dummy) 0.985*** 0.631 0.854 (0.303) (0.443) (0.523) Farm characteristics Total land owned 5 years ago (acres) -0.017 -0.089 0.059 (0.042) (0.069) (0.071) Farm altitude (m) 0.018*** -0.044*** -0.076*** (0.004) (0.009) (0.010) Distance to input market (km) -0.030 0.038 -0.069 (0.027) (0.071) (0.071) Distance to output market (km) 0.039 0.076 0.092* (0.037) (0.088) (0.053) Distance to all-weather road (km) -0.058*** -0.161*** 0.061** (0.015) (0.037) (0.025) Constant -28.25*** 42.27*** 75.17*** (5.239) (9.834) (10.94) Log likelihood -178.7 Chi-square 200.0*** Observations 419
Notes: Coefficient estimates are shown with standard errors in parentheses. The base category consists of farmers without any certification. * p<0.1, ** p<0.05, *** p<0.01.

30
Table 3: Average treatment effects on the treated for household expenditure and poverty
Nearest neighbor matching Kernel matching
ATT S.E. ATT S.E. Г
Certified vs. non-certified
Per capita expenditure (UGX) 478.99** 191.88 369.44** 180.24 1.9
Poverty headcount index -0.08 0.05 -0.05 0.05 1.5
Poverty gap index 0.01 0.04 0.01 0.04 1.3
Fairtrade vs. non-certified
Per capita expenditure (UGX) 1028.58*** 239.84 871.27*** 229.69 1.6
Poverty headcount index -0.15** 0.06 -0.13** 0.05 2.0
Poverty gap index -0.09* 0.04 -0.11** 0.04 1.5
UTZ vs. non-certified
Per capita expenditure (UGX) -51.70 269.70 36.72 254.52 1.2
Poverty headcount index -0.02 0.08 -0.03 0.07 1.3
Poverty gap index 0.05 0.07 0.05 0.07 1.1
Organic vs. non-certified
Per capita expenditure (UGX) 242.42 286.99 0.55 252.84 1.3
Poverty headcount index -0.04 0.08 0.02 0.07 1.4
Poverty gap index 0.06 0.05 0.07 0.06 1.1
Fairtrade vs. UTZ
Per capita expenditure (UGX) 984.83*** 318.74 850.20*** 286.93 1.8
Poverty headcount index -0.07 0.07 -0.07 0.07 1.4
Poverty gap index -0.21** 0.06 -0.22*** 0.06 2.3
Fairtrade vs. Organic
Per capita expenditure (UGX) 619.75* 334.15 484.8 331.01 1.4
Poverty headcount index -0.08 0.08 -0.07 0.08 1.1
Poverty gap index -0.19** 0.08 -0.24** 0.1 2.3
UTZ vs. Organic
Per capita expenditure (UGX) 97.53 405.28 -106.55 343.34 1.2
Poverty headcount index 0.15 0.11 0.13 0.09 1.1
Poverty gap index -0.17 0.18 0.03 0.13 1.1
Notes: ATT: average treatment effect on the treated; S.E.: bootstrapped standard errors; Г: Rosenbaum bounds (critical levels of hidden bias). * p<0.1; ** p<0.05; *** p<0.01.

31
Table 4: Median prices received for coffee under different certification schemes
Certification scheme Median coffee price (UGX/kg) Interquartile range
All non-certified 1550 1150
All certified 2000a 1350
Fairtrade 3233a,c,d 1783
UTZ 1750b 762
Organic 1500b 900
Notes: Median coffee prices received by farmers were calculated over the last two seasons. The interquartile range is analogous to the standard deviation for the median. Median prices between schemes are tested for statistically significant differences using the Kruskal-Wallis test; a p<0.01 when compared to non-certified; b p<0.01 when compared to Fairtrade; c p<0.01 when compared to UTZ; d p<0.01 when compared to Organic.

32
Figure 1: Global import quantities of Organic, Fairtrade, and UTZ Certified coffee
Source: Own graphical presentation based on data from ITC (2011).
0
20
40
60
80
100
120
2005 2006 2007 2008 2009
Th
ou
san
d m
etr
ic t
on
s
Organic Fairtrade UTZ

33
Figure 2: Cumulative distribution of per capita expenditure by certification scheme
0.2
.4.6
.81
Cum
ula
tive
frac
tion
of h
ous
eho
lds
0 2,000 4,000 6,000 8,000 10,000
Per capita household expenditure (UGX/day)
All non-certified All certified UTZ
Organic Fairtrade

34
Figure 3: Poverty indicators by certification scheme
0
5
10
15
20
25
30
35
Non-certified Certified Fairtrade UTZ Organic
Per
cen
t
Headcount index Poverty gap

35
Figure A1: Propensity score distribution and common support for certified and non-certified farmers
0 .2 .4 .6 .8 1
Propensity score
Untreated Treated: on support Treated: off support
Certified vs. non-certified
0 .2 .4 .6 .8 1
Propensity score
Untreated: off support Untreated: on support Treated
Fairtrade vs. non-certified
0 .2 .4 .6 .8 1
Propensity score
Untreated Treated: on support Treated: off support
Organic vs. non-certified
0 .2 .4 .6 .8 1
Propensity score
Untreated: off support Untreated: on support Treated
UTZ vs. non-certified

36
Figure A2: Propensity score distribution and common support for farmers in different certification schemes
0 .2 .4 .6 .8 1
Propensity score
Untreated Treated: on support Treated: off support
Fairtrade vs. UTZ
0 .2 .4 .6 .8 1
Propensity score
Untreated: off support Untreated: on support Treated
Fairtrade vs. Organic
0 .2 .4 .6 .8 1
Propensity score
Untreated Treated: on support Treated: off support
Organic vs. UTZ