Embed Size (px)
DESCRIPTION
RSS Operations Analysis. Mark Whitworth The Center for Emergency Response Analytics Cambridge, MA. Purpose. To convince you that your city, county, state needs to participate in the RSS Analysis Project. It’s free!. What’s in it for you?. What do you get? - PowerPoint PPT Presentation
Citation preview

Mark WhitworthThe Center for Emergency Response Analytics
Cambridge, MA
March 2008 1www.Response-Analytics.org

To convince you that your city, county, state needs to participate in the RSS Analysis Project.
It’s free!
March 2008 2www.Response-Analytics.org
What do you get?◦ A comparison of some different ways to run your
RSS◦ A detailed analysis of the most promising way
What do you have to do? ◦ Not much◦ Fill out a questionnaire with data that you already
have
March 2008 3www.Response-Analytics.org

Analyze RSS operations in 36 jurisdictions Test RSS performance in standard scenario Evaluate operational alternatives Select the best operational approach and
perform detailed analysis◦ Performance◦ Robustness◦ Cost
Develop understanding of “RSS physics” Identify rules of thumb, best practices
March 2008 www.Response-Analytics.org 4

We’ve completed about 20 analyses and we’ve seen a lot◦ Delivery by dump truck◦ An RSS in an airplane hangar◦ Drive-through PODs◦ Mega-PODs for 1,000,000◦ A mini-POD at every neighborhood school◦ Ferry boats◦ State delivery to county warehouses
March 2008 5www.Response-Analytics.org

March 2008 6
RSS is the critical link in supply chain connecting Federal materiel and PODs
RSS Goal—assure uninterrupted supply of materiel to PODs
Smooth RSS operations are essential to effective bioterror response
RSS operations difficult to plan and manage
www.Response-Analytics.org
Push pack
Managed inventoryRSS
PODPOD
PODPOD
PODPOD
PODPOD
PODPOD
PODPOD
Complexity increases with◦ Larger number of PODs◦ Wide variation in POD sizes◦ Larger geography◦ Long drive times, traffic◦ Shorter operational window◦ Longer and/or later receiving window◦ Limited resources: crews, docks, trucks◦ Mixed-capacity truck fleet
March 2008 www.Response-Analytics.org 7

March 2008 8
Slack◦ “Breathing room”◦ Ability to ship early
POD Interruption◦ Negative slack late delivery◦ How many regimens are delayed?
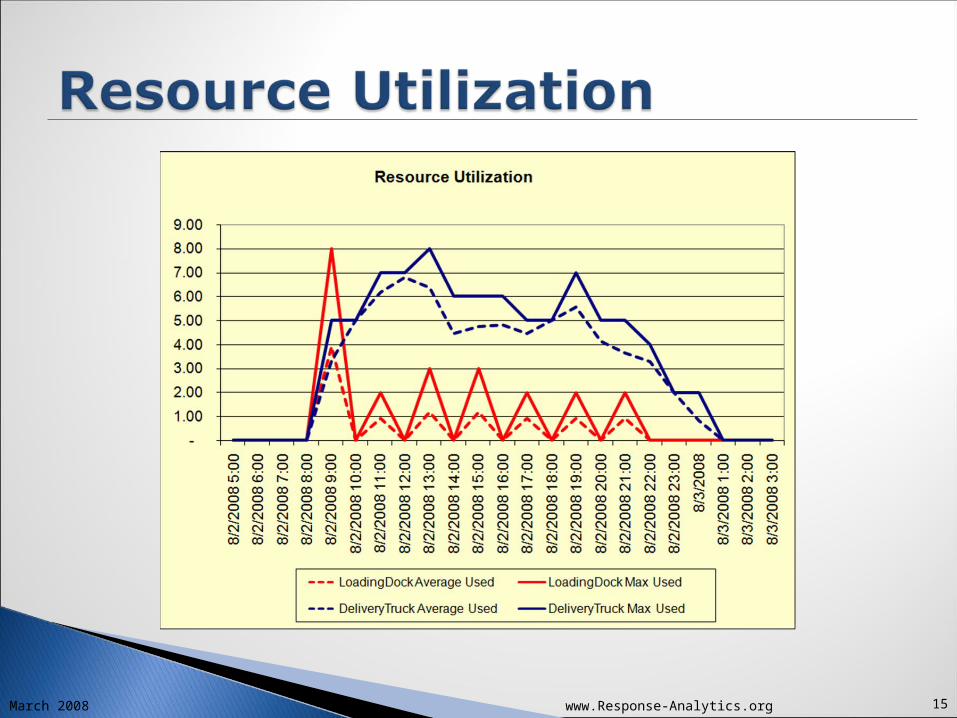
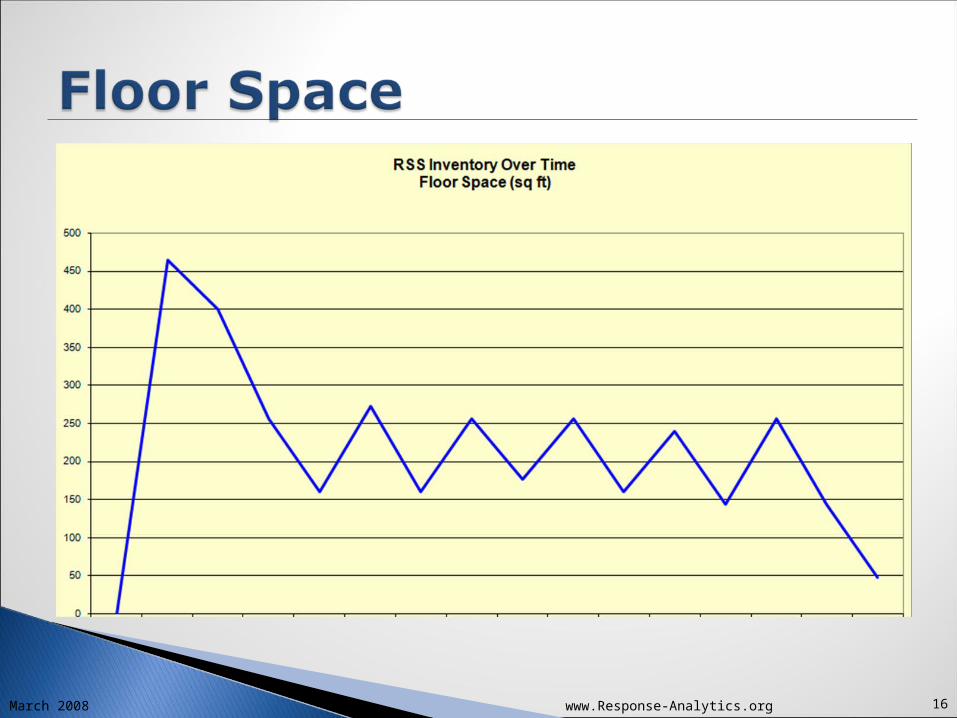
Other metrics◦ RSS floorspace (square feet occupied)◦ Dock utilization◦ Truck utilization◦ Miles traveled
www.Response-Analytics.org

March 2008 www.Response-Analytics.org 9
RSS setup
SNS receipts
POD setup
POD hours of operation
Number of trucks
Sizes of trucks
Liftgates
Number of PODs
Locations of PODs
Populations served by PODs
Throughput, surges, lulls
Unload facilities--docks? Forklifts?
Unload crews
Docks
Crews
Square feet
Location
Times for load/unload and order-picking operations
Number of deliveries
Number of routes
Drive times
Number of stops
Traffic
POD delivery
Schedule of operations
Truck Fleet
PODs
RSS

1.1 M people 68 PODs 60 miles X 40 miles 17 48-foot trucks 3 24-foot trucks
Aerosolized anthrax attack Requires 48-hour response
◦ 24-hour setup◦ 24-hour dispensing operation
SNS materiel “pulsed in”◦ Push pack arrives at hour-12◦ Managed inventory arrives in
waves
March 2008 www.Response-Analytics.org 10

How many deliveries per POD? Which trucks should you use? How many pallets do you put on a truck?
Each alternative requires its own route system
March 2008 www.Response-Analytics.org 11
RSS
March 2008 www.Response-Analytics.org 12
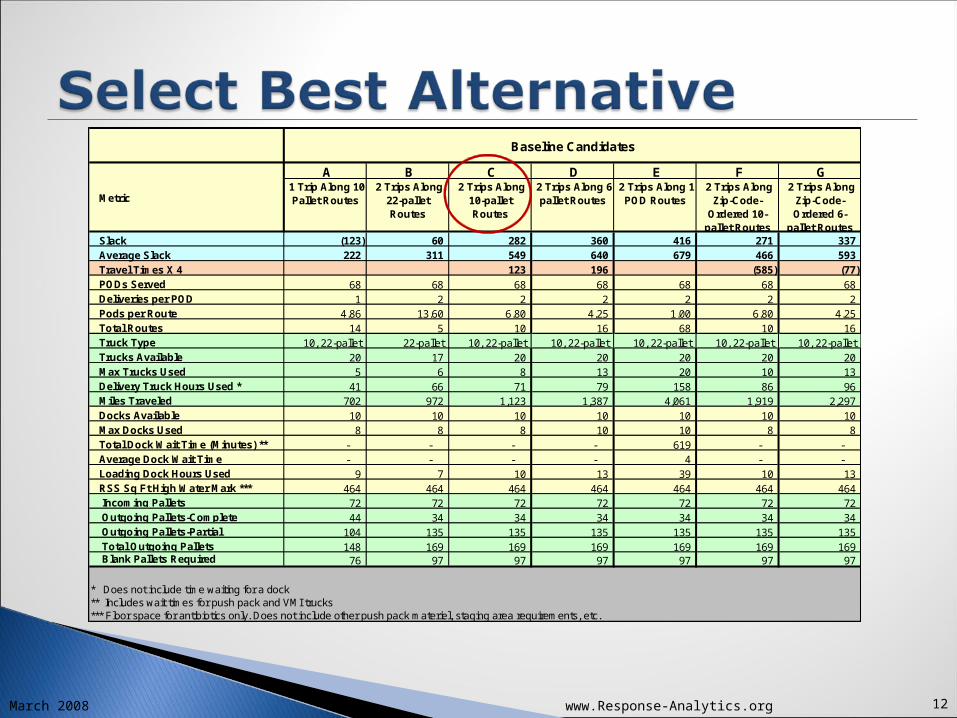
A B C D E F G 1 Trip Along 10-
Pallet Routes 2 Trips Along
22-pallet Routes
2 Trips Along 10-pallet Routes
2 Trips Along 6-pallet Routes
2 Trips Along 1-POD Routes
2 Trips Along Zip-Code-
Ordered 10-pallet Routes
2 Trips Along Zip-Code-Ordered 6-
pallet Routes Slack (123) 60 282 360 416 271 337 Average Slack 222 311 549 640 679 466 593 Travel Times X 4 123 196 (585) (77) PODs Served 68 68 68 68 68 68 68 Deliveries per POD 1 2 2 2 2 2 2 Pods per Route 4.86 13.60 6.80 4.25 1.00 6.80 4.25 Total Routes 14 5 10 16 68 10 16 Truck Type 10, 22-pallet 22-pallet 10, 22-pallet 10, 22-pallet 10, 22-pallet 10, 22-pallet 10, 22-palletTrucks Available 20 17 20 20 20 20 20 Max Trucks Used 5 6 8 13 20 10 13 Delivery Truck Hours Used * 41 66 71 79 158 86 96 Miles Traveled 702 972 1,123 1,387 4,061 1,919 2,297 Docks Available 10 10 10 10 10 10 10 Max Docks Used 8 8 8 10 10 8 8 Total Dock Wait Time (Minutes) ** - - - - 619 - - Average Dock Wait Time - - - - 4 - - Loading Dock Hours Used 9 7 10 13 39 10 13 RSS Sq Ft High Water Mark *** 464 464 464 464 464 464 464 Incoming Pallets 72 72 72 72 72 72 72 Outgoing Pallets-Complete 44 34 34 34 34 34 34 Outgoing Pallets-Partial 104 135 135 135 135 135 135 Total Outgoing Pallets 148 169 169 169 169 169 169 Blank Pallets Required 76 97 97 97 97 97 97
* Does not include time waiting for a dock** Includes wait times for push pack and VMI trucks*** Floor space for antibiotics only. Does not include other push pack materiel, staging area requirements, etc.
Baseline Candidates
Metric
March 2008 www.Response-Analytics.org 13
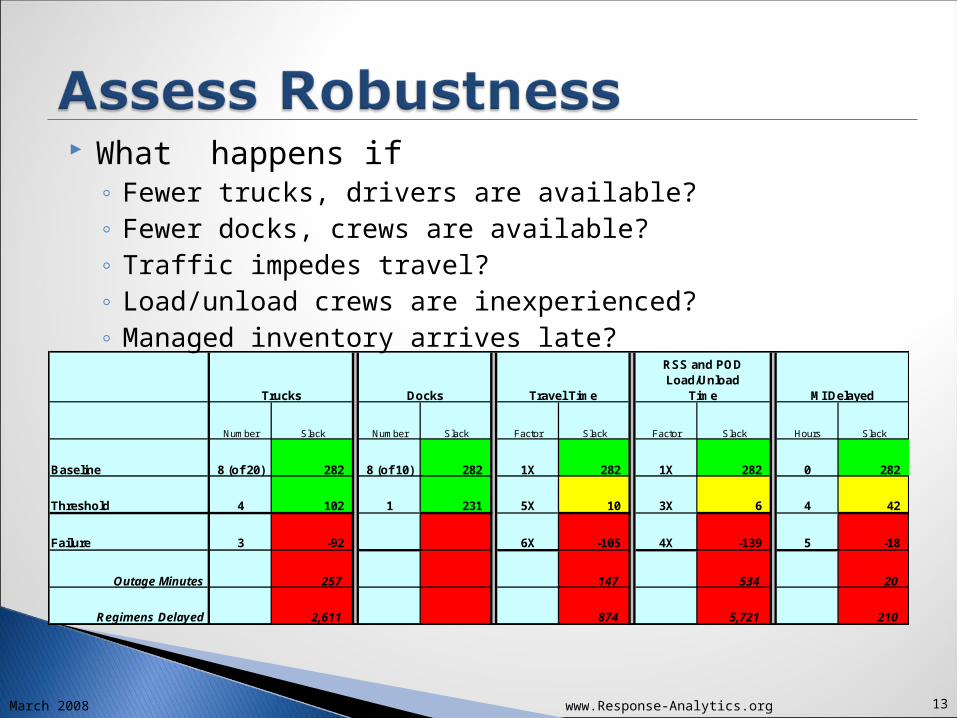
Number Slack Number Slack Factor Slack Factor Slack Hours Slack
Baseline 8 (of 20) 282 8 (of 10) 282 1X 282 1X 282 0 282
Threshold 4 102 1 231 5X 10 3X 6 4 42
Failure 3 -92 6X -105 4X -139 5 -18
Outage Minutes 257 147 534 20
Regimens Delayed 2,611 874 5,721 210
MI DelayedTrucks Docks Travel Time
RSS and POD Load/Unload
Time
What happens if ◦ Fewer trucks, drivers are available?◦ Fewer docks, crews are available?◦ Traffic impedes travel?◦ Load/unload crews are inexperienced?◦ Managed inventory arrives late?
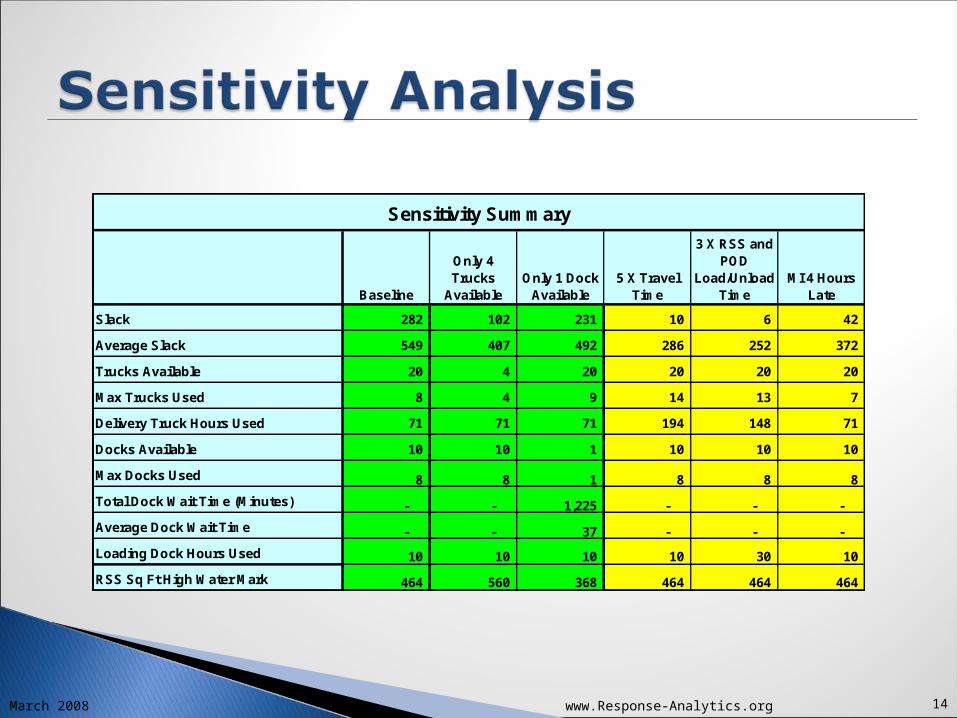
March 2008 www.Response-Analytics.org 14
Baseline
Only 4 Trucks
AvailableOnly 1 Dock
Available5 X Travel
Time
3 X RSS and POD
Load/Unload Time
MI 4 Hours Late
Slack 282 102 231 10 6 42
Average Slack 549 407 492 286 252 372
Trucks Available 20 4 20 20 20 20
Max Trucks Used 8 4 9 14 13 7
Delivery Truck Hours Used 71 71 71 194 148 71
Docks Available 10 10 1 10 10 10
Max Docks Used 8 8 1 8 8 8
Total Dock Wait Time (Minutes) - - 1,225 - - -
Average Dock Wait Time - - 37 - - -
Loading Dock Hours Used 10 10 10 10 30 10
RSS Sq Ft High Water Mark 464 560 368 464 464 464
Sensitivity Summary
March 2008 www.Response-Analytics.org 15
March 2008 www.Response-Analytics.org 16
March 2008 www.Response-Analytics.org 17
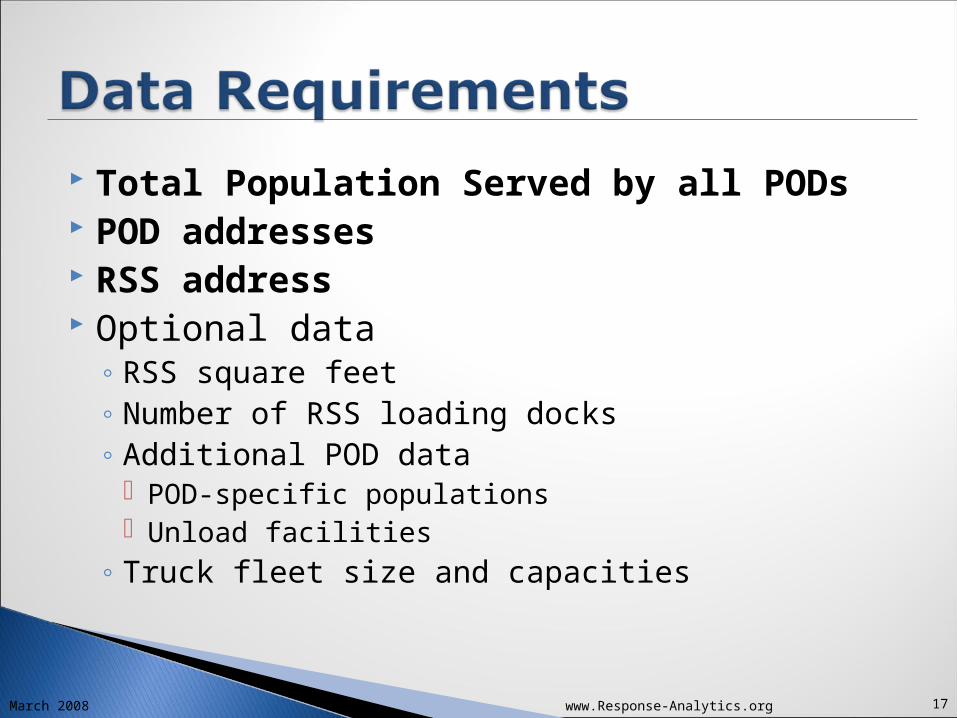
Total Population Served by all PODs POD addresses RSS address Optional data
◦ RSS square feet◦ Number of RSS loading docks◦ Additional POD data
POD-specific populations Unload facilities
◦ Truck fleet size and capacities

March 2008 www.Response-Analytics.org 18


![RSS 2013 - A re-analysis of the Cochrane Library data]](https://img.pdfslide.us/doc/110x75/53fb66358d7f729c2e8b5792/rss-2013-a-re-analysis-of-the-cochrane-library-data.jpg)

