Embed Size (px)
Citation preview
rsos.royalsocietypublishing.org
ResearchCite this article: Treusch K, Ritzberger J,Schwaiger N, Pucher P, Siebenhofer M. 2017Diesel production from lignocellulosic feed:the bioCRACK process. R. Soc. open sci.4: 171122. http://dx.doi.org/10.1098/rsos.171122
Received: 11 August 2017Accepted: 13 October 2017
Subject Category:Engineering
Subject Areas:chemical engineering/power and energysystems
Keywords:bioCRACK, biofuel, liquid phase pyrolysis,refinery integrated
Author for correspondence:K. Treusche-mail: [email protected]
Diesel production fromlignocellulosic feed: thebioCRACK processK. Treusch1,2, J. Ritzberger1, N. Schwaiger1,2, P. Pucher1
and M. Siebenhofer21BDI – BioEnergy International AG, Parkring 18, 8074 Raaba-Grambach, Austria2Institute of Chemical Engineering and Environmental Technology, Graz University ofTechnology, Inffeldgasse 25/C, 8010 Graz, Austria
KT, 0000-0002-3706-4986
The bioCRACK process is a promising technology for theproduction of second generation biofuels. During this process,biomass is pyrolized in vacuum gas oil and converted intogaseous, liquid and solid products. In cooperation with theGraz University of Technology, the liquid phase pyrolysisprocess was investigated by BDI – BioEnergy International AGat an industrial pilot plant, fully integrated in the OMV refineryin Vienna/Schwechat. The influence of various biogenousfeedstocks and the influence of the temperature on the productdistribution in the temperature range of 350°C to 390°C wasstudied. It was shown that the temperature has a majorimpact on the product formation. With rising temperature,the fraction of liquid products, namely liquid CHO-products,reaction water and hydrocarbons, increases and the fractionof biochar decreases. At 390°C, 39.8 wt% of biogenous carbonwas transferred into a crude hydrocarbon fractions. The typeof lignocellulosic feedstock has a minor impact on the process.The biomass liquefaction concept of the bioCRACK processwas in pilot scale compatible with oil refinery processes.
1. IntroductionAccording to the adoption of the Paris Agreement in 2015 theglobal average temperature increase is to be kept significantlybelow 2°C above the preindustrial level. This target has tobe achieved by reducing greenhouse gas emissions withoutthreatening food production [1]. Second generation biofuels basedon lignocellulose will play a sustainable key role for futurefuel production from renewable feedstock. Main lignocellulose-conversion technologies are: indirect liquefaction via gasificationand methanol synthesis or Fischer–Tropsch synthesis; pyrolysis-based direct liquefaction with subsequent hydrodeoxygenation;upgrading of residues from solvent-based pulping processes andbiotechnological treatment of biomass [2]. Gasification methods
2017 The Authors. Published by the Royal Society under the terms of the Creative CommonsAttribution License http://creativecommons.org/licenses/by/4.0/, which permits unrestricteduse, provided the original author and source are credited.
on July 7, 2018http://rsos.royalsocietypublishing.org/Downloaded from

2
rsos.royalsocietypublishing.orgR.Soc.opensci.4:171122
................................................such as the Choren technology and the successor Linde Carbo-V® technology [3] require extensive gastreatment in order to remove impurities from crude gas for subsequent processes like Fischer–Tropschsynthesis [4]. Particles have to be removed and sulfur content reduced by gas cleaning concepts, e.g. thelow-temperature Rectisol process using methanol as scrubbing agent [5]. Bioethanol from fermentationof cellulose can be admixed to gasoline. However, bioethanol-based biofuels are faced with severalunfavourable properties like different density, corrosiveness, low calorific value, low boiling point andmiscibility with water, to mention just a few [6]. Pyrolysis of biomass yields in the production of pyrolysisoil, biochar and pyrolysis gas, which can be further upgraded to biofuels [7]. Crude products from drypyrolysis of lignocellulose need extensive pretreatment for further processing due to coal particle loadand the high viscosity of pyrolysis oil. The solids content varies between 0.3% and 3% [8].
Liquid phase pyrolysis (LPP) [9,10], as applied in the bioCRACK process [11], is a promisingalternative technology for fuel production from lignocellulosic biomass. The acronym ‘bioCRACK’ wasgenerated from the words ‘biomass’ and ‘cracking’, as the biomass is cracking the carrier oil. BioCRACKis a registered word and design mark. In liquid phase pyrolysis, biomass is thermally treated in a heatcarrier oil, e.g. vacuum gas oil (VGO), a side product of crude oil refining. The process is operated in thetemperature range between 350°C and 390°C. Due to elevated operation temperature, VGO is partiallycracked during pyrolysis, an advantageous side effect of biomass pyrolysis. Biomass is converted intopyrolysis gas, biochar and liquid products. The homolytic degradation process of biomass duringpyrolysis is slightly modified by the influence of VGO. Repolymerization reactions are reduced andparticles are held back in the heat carrier. The liquid products partially dissolve in vacuum gas oil andmay be processed in the refinery without further treatment, achieving a direct transfer of biogenouscarbon into VGO. The bioCRACK process was operated in pilot scale (100 kg h−1 biomass) at OMVrefinery in Vienna/Schwechat [12]. Vacuum gas oil limits the pyrolysis temperature to about 400°Cbecause of its boiling range between 365°C and 530°C [13]. This allows process operation at ambientpressure which simplifies construction and significantly decreases investment costs. Kumar et al. [14]have described a related process with a pressure of at least 50 bar and a reaction time of at least 15 min.Nevertheless, the bioCRACK process is the first direct biomass liquefaction process that has alreadybeen operated in pilot scale in a petrol refinery. Compared to other biomass liquefaction technologies,the concept is very simple [3–5,7].
1.1. BiomassPyrolysisRefineryFor an economic operation of the bioCRACK pyrolysis process, a high recovery of all product streamsis obligatory. The upgrading of the two main side streams biochar and pyrolysis oil is part of theBiomassPyrolysisRefinery concept [15,16,17]. Feiner [18] investigated the liquefaction of biochar, Pucher[19] the hydrodeoxygenation of LPP oil.
Experiments for the liquefaction of biochar [20] were performed in a stirred 450 ml batch reactorbetween 370°C and 450°C at 180 bar. In order to avoid polymerization reactions [21], hydrogen wasprovided with tetralin as a hydrogen donor. Biochar conversion of 84 wt% and an oil yield of 72 wt%could be achieved. Hydrodeoxygenation of LPP oil [22] was investigated at 250°C and 100 bar and at300°C and 150 bar in a batch reactor. Pyrolysis oil from the bioCRACK process has a higher water contentthan pyrolysis oil from flash pyrolysis [23]. This results in a lower viscosity. In LPP oil, no particles arepresent, as they are held back together with the biochar by the VGO. This facilitates the handling ofpyrolysis oil. An oil yield of up to 56 wt% was observed.
2. Material and methodsAnalytical methods, feedstock and process parameters will be discussed in this section.
2.1. Feedstock materialLignocellulosic feedstock was spruce wood, beech wood, miscanthus and wheat straw. Alllignocelluloses were provided in pelletized form. The pellets were milled on-site with a mechanicalmill. For temperature study, spruce wood was used as lignocellulosic feed. Spruce wood was providedin ENplus A1 and DINplus accredited pellets from RZ Pellets GmbH in Bad St Leonhard, Austria.Beech wood and wheat straw were provided by FAIR Holz in Leopoldshöhe, Germany. Miscanthuswas provided by TD Zorn GmbH in Heidenrod–Zorn, Germany. An elemental analysis of the feedstockis shown in table 1. Lignocellulosic biomass contains up to 50% oxygen [24]. This oxygen has to be
on July 7, 2018http://rsos.royalsocietypublishing.org/Downloaded from

3
rsos.royalsocietypublishing.orgR.Soc.opensci.4:171122
................................................Table 1. Elemental analysis of feedstock material.
carbon [wt%] hydrogen [wt%] nitrogen [wt%] balance [wt%]
spruce wood 50.1 6.3 0.04 43.5. . . . . . . . . . . . . . . . . . . . . . . . . . . . . . . . . . . . . . . . . . . . . . . . . . . . . . . . . . . . . . . . . . . . . . . . . . . . . . . . . . . . . . . . . . . . . . . . . . . . . . . . . . . . . . . . . . . . . . . . . . . . . . . . . . . . . . . . . . . . . . . . . . . . . . . . . . . . . . . . . . . . . . . . . . . . . . . . . . . . . . . . . . . . . . . . . . . . . . . . . . . . . . . . . . . . . . . . .
beech wood 45.3 6.3 0.09 48.3. . . . . . . . . . . . . . . . . . . . . . . . . . . . . . . . . . . . . . . . . . . . . . . . . . . . . . . . . . . . . . . . . . . . . . . . . . . . . . . . . . . . . . . . . . . . . . . . . . . . . . . . . . . . . . . . . . . . . . . . . . . . . . . . . . . . . . . . . . . . . . . . . . . . . . . . . . . . . . . . . . . . . . . . . . . . . . . . . . . . . . . . . . . . . . . . . . . . . . . . . . . . . . . . . . . . . . . . .
miscanthus 43.3 6.4 0.14 50.2. . . . . . . . . . . . . . . . . . . . . . . . . . . . . . . . . . . . . . . . . . . . . . . . . . . . . . . . . . . . . . . . . . . . . . . . . . . . . . . . . . . . . . . . . . . . . . . . . . . . . . . . . . . . . . . . . . . . . . . . . . . . . . . . . . . . . . . . . . . . . . . . . . . . . . . . . . . . . . . . . . . . . . . . . . . . . . . . . . . . . . . . . . . . . . . . . . . . . . . . . . . . . . . . . . . . . . . . .
wheat straw 45.1 6.0 0.58 48.4. . . . . . . . . . . . . . . . . . . . . . . . . . . . . . . . . . . . . . . . . . . . . . . . . . . . . . . . . . . . . . . . . . . . . . . . . . . . . . . . . . . . . . . . . . . . . . . . . . . . . . . . . . . . . . . . . . . . . . . . . . . . . . . . . . . . . . . . . . . . . . . . . . . . . . . . . . . . . . . . . . . . . . . . . . . . . . . . . . . . . . . . . . . . . . . . . . . . . . . . . . . . . . . . . . . . . . . . .
VGO 86.31 12.26 0.55 0.88. . . . . . . . . . . . . . . . . . . . . . . . . . . . . . . . . . . . . . . . . . . . . . . . . . . . . . . . . . . . . . . . . . . . . . . . . . . . . . . . . . . . . . . . . . . . . . . . . . . . . . . . . . . . . . . . . . . . . . . . . . . . . . . . . . . . . . . . . . . . . . . . . . . . . . . . . . . . . . . . . . . . . . . . . . . . . . . . . . . . . . . . . . . . . . . . . . . . . . . . . . . . . . . . . . . . . . . . .
removed in order to produce hydrocarbons with fuel quality. The carbon content of the wood samplesvaries between 43.3 and 50.1%.
Liquid phase pyrolysis product formation is not significantly dependent on the particle size of thebiogenous feedstock in the range between 1 mm and 1 cm [9]. The elemental composition of VGO isshown in table 1. Vacuum gas oil has a boiling range between 365°C and 530°C [13]. The VGO used forthe bioCRACK had a boiling range between 300°C and 530°C.
2.2. Analytical methodsThe elemental analyses of all streams were characterized by a vario MACRO CHN-analyzer from‘Elementar Analysensysteme GmbH’. The water content of pyrolysis oil was determined by agas chromatograph, type Agilent 7890A, with a TCD detector and a HP-INNOWAX column,30 m×0.53 mm×1 µm. The water content of the oil fraction was determined by Karl-Fischer-titration witha Schott Titro Line KF-Titrator and a Hydranal titration reagent. The boiling range of the oil fractions wasdetermined by a gaschromatograph, type Agilent 7890A, with an FID-detector and the Restek-columnMXT-2887, 10 m×0.53 mm×2.65 µm. Density and viscosity were measured with a digital viscometer,SVM 3000, of Anton Paar GmbH. The content of biogenous carbon (14C) was determined by the externallaboratory Beta Analytic Limited, SO/IEC 17025:2005 accredited, in Miami, FL, via acceleration massspectrometry.
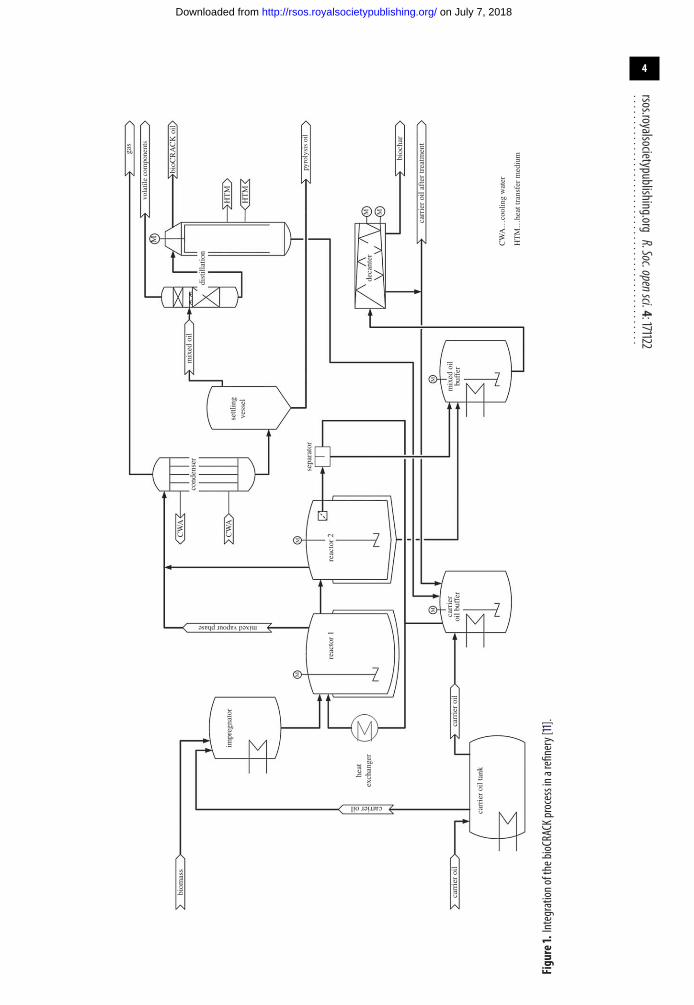
2.3. The bioCRACK pilot plantThe bioCRACK pilot plant with a nominal biomass capacity of 100 kg h−1 and 600 kg h−1 VGO was incontinuous operation for two years. The mass ratio of VGO to biomass was 6. A scheme of the bioCRACKprocess is shown in figure 1. Biomass is impregnated with VGO in a first vessel and then fed in reactors 1and 2 together with additional recycle-VGO. The reaction takes place at 350–400°C and ambient pressure.Biogenous and fossil vapours are condensed and separated in two steps, obtaining the aqueous pyrolysisoil fraction, the non-polar bioCRACK oil fraction and high boiling heat carrier residues. Biochar and heatcarrier are separated in a decanter. Figure 2 shows the integration concept of the bioCRACK process inan existing refinery [11], as practised during operation of the pilot plant. Utilities, such as steam, power,cooling water and nitrogen, can be used from the refinery. Gaseous products generate electricity and/orsteam. The reaction products can be upgraded in existing refinery facilities.
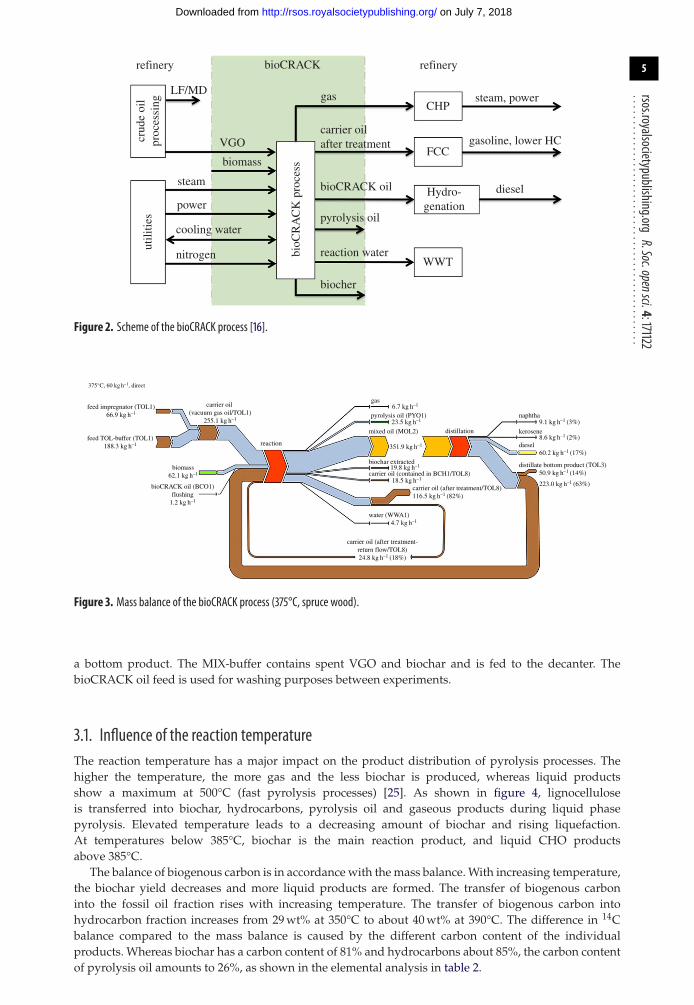
3. Results and discussionThe mass balance of the liquid phase pyrolysis process at 375°C with the feedstock spruce wood is shownin figure 3. Process operation is 5 days, balance period is about 36 h. The carrier oil feed is composedof the oil from the impregnator and the carrier oil buffer. To minimize the consumption of VGO, thebottom product of the distillation as well as the spent VGO are recycled. The reaction products consistof non-condensible gases (at ambient temperature and pressure), pyrolysis oil, mixed oil, pyrolysis char,spent VGO and the water-content of the biomass. The water formed during LPP and the feed moistureare discharged with the pyrolysis oil. The amount of dry biochar is determined analytically throughextraction of VGO residues with hexane in laboratory scale. The composition of these product streamsis shown in table 2. The mixed oil is distilled to obtain bioCRACK oil (naphtha, kerosene, diesel) and
on July 7, 2018http://rsos.royalsocietypublishing.org/Downloaded from
4
rsos.royalsocietypublishing.orgR.Soc.opensci.4:171122
................................................
biom
ass
impr
egna
tor
heat
exch
ange
r
carrier oil
carr
ier
oil
carr
ier
oil
reac
tor
1re
acto
r 2
sepa
rato
r
cond
ense
r
settl
ing
vess
el
mix
ed o
il
dist
illat
ion
deca
nter
CW
A
CW
A…
cool
ing
wat
er
HT
M…
heat
tran
sfer
med
ium
HT
M
HT
M
gas
vola
tile
com
pone
nts
bioC
RA
CK
oil
pyro
lysi
s oi
l
bioc
har
carr
ier
oil a
fter
trea
tmen
t
CW
A
carr
ier
oil t
ank
carr
ier
oil b
uffe
rm
ixed
oil
buff
er
mixed vapour phase
MM
MM
M
MM
Figure1.Integration
ofthebioCRACKprocessina
refinery[11].
on July 7, 2018http://rsos.royalsocietypublishing.org/Downloaded from
5
rsos.royalsocietypublishing.orgR.Soc.opensci.4:171122
................................................refinery refinery
crud
e oi
lpr
oces
sing
bioC
RA
CK
pro
cess
utili
ties
bioCRACK
gas
carrier oilafter treatment
bioCRACK oil
pyrolysis oil
reaction water
biocher
WWT
Hydro-genation
FCC
CHPsteam, power
gasoline, lower HC
diesel
VGO
biomass
steam
power
cooling water
nitrogen
LF/MD
Figure 2. Scheme of the bioCRACK process [16].
375°C, 60 kg h–1, direct
feed impregnator (TOL1)66.9 kg h–1
feed TOL-buffer (TOL1)188.3 kg h–1
carrier oil (vacuum gas oil/TOL1)
255.1 kg h–1 23.5 kg h–1pyrolysis oil (PYO1)
18.5 kg h–1
carrier oil (after treatment/TOL8)116.5 kg h–1 (82%)
9.1 kg h–1 (3%)
8.6 kg h–1 (2%)
60.2 kg h–1 (17%)
223.0 kg h–1 (63%)
carrier oil (after treatment-return flow/TOL8)24.8 kg h–1 (18%)
4.7 kg h–1
distillate bottom product (TOL3)50.9 kg h–1 (14%)
19.8 kg h–1biochar extracted
water (WWA1)
351.9 kg h–1
mixed oil (MOL2)
6.7 kg h–1
reaction
gas
distillation
naphtha
diesel
kerosene
biomass62.1 kg h–1
bioCRACK oil (BCO1)flushing
1.2 kg h–1
carrier oil (contained in BCH1/TOL8)
Figure 3. Mass balance of the bioCRACK process (375°C, spruce wood).
a bottom product. The MIX-buffer contains spent VGO and biochar and is fed to the decanter. ThebioCRACK oil feed is used for washing purposes between experiments.
3.1. Influence of the reaction temperatureThe reaction temperature has a major impact on the product distribution of pyrolysis processes. Thehigher the temperature, the more gas and the less biochar is produced, whereas liquid productsshow a maximum at 500°C (fast pyrolysis processes) [25]. As shown in figure 4, lignocelluloseis transferred into biochar, hydrocarbons, pyrolysis oil and gaseous products during liquid phasepyrolysis. Elevated temperature leads to a decreasing amount of biochar and rising liquefaction.At temperatures below 385°C, biochar is the main reaction product, and liquid CHO productsabove 385°C.
The balance of biogenous carbon is in accordance with the mass balance. With increasing temperature,the biochar yield decreases and more liquid products are formed. The transfer of biogenous carboninto the fossil oil fraction rises with increasing temperature. The transfer of biogenous carbon intohydrocarbon fraction increases from 29 wt% at 350°C to about 40 wt% at 390°C. The difference in 14Cbalance compared to the mass balance is caused by the different carbon content of the individualproducts. Whereas biochar has a carbon content of 81% and hydrocarbons about 85%, the carbon contentof pyrolysis oil amounts to 26%, as shown in the elemental analysis in table 2.
on July 7, 2018http://rsos.royalsocietypublishing.org/Downloaded from

6
rsos.royalsocietypublishing.orgR.Soc.opensci.4:171122
................................................
350°Cspruce
375°Cspruce
390°Cspruce
fuel fractions + carrier oil(after treatment)
biochar extracted
carrier oil (after treatment)
pyrolysis oil
mixed oil
gas
100%
90%
80%
70%
60%
50%
40%
30%
20% 50% 37%30%
14%
16%
19%
11%
22%25%
26%
5%6%
20%20%
1%
14C
-Con
vers
ion
(wt%
14C
_tot
al)
10%
0%
Figure 4. Bio-carbon transfer as a function of the pyrolysis temperature.
Table 2. Product characterization in dependence of the pyrolysis temperature.
[wt%] biochar pyrolysis oil mixed oilcarrier oil aftertreatment gas
reactiontemperature [°C]
350 375 390 350 375 390 350 375 390 350 375 390 350 375 390. . . . . . . . . . . . . . . . . . . . . . . . . . . . . . . . . . . . . . . . . . . . . . . . . . . . . . . . . . . . . . . . . . . . . . . . . . . . . . . . . . . . . . . . . . . . . . . . . . . . . . . . . . . . . . . . . . . . . . . . . . . . . . . . . . . . . . . . . . . . . . . . . . . . . . . . . . . . . . . . . . . . . . . . . . . . . . . . . . . . . . . . . . . . . . . . . . . . . . . . . . . . . . . . . . . . . . . . .
C [wt%] 77.5 80.9 80.9 25.8 25.6 26.6 85.3 84.9 84.3 86.2 86.6 86.3 — — —. . . . . . . . . . . . . . . . . . . . . . . . . . . . . . . . . . . . . . . . . . . . . . . . . . . . . . . . . . . . . . . . . . . . . . . . . . . . . . . . . . . . . . . . . . . . . . . . . . . . . . . . . . . . . . . . . . . . . . . . . . . . . . . . . . . . . . . . . . . . . . . . . . . . . . . . . . . . . . . . . . . . . . . . . . . . . . . . . . . . . . . . . . . . . . . . . . . . . . . . . . . . . . . . . . . . . . . . .
H [wt%] 5.3 5.4 5.4 9.2 9.4 9.2 12.3 12.3 12.1 12.2 12.1 11.8 — — —. . . . . . . . . . . . . . . . . . . . . . . . . . . . . . . . . . . . . . . . . . . . . . . . . . . . . . . . . . . . . . . . . . . . . . . . . . . . . . . . . . . . . . . . . . . . . . . . . . . . . . . . . . . . . . . . . . . . . . . . . . . . . . . . . . . . . . . . . . . . . . . . . . . . . . . . . . . . . . . . . . . . . . . . . . . . . . . . . . . . . . . . . . . . . . . . . . . . . . . . . . . . . . . . . . . . . . . . .
N [wt%] 0.2 0.3 0.3 0.3 0.4 0.4 0.4 0.4 0.5 0.5 0.5 0.6 — — —. . . . . . . . . . . . . . . . . . . . . . . . . . . . . . . . . . . . . . . . . . . . . . . . . . . . . . . . . . . . . . . . . . . . . . . . . . . . . . . . . . . . . . . . . . . . . . . . . . . . . . . . . . . . . . . . . . . . . . . . . . . . . . . . . . . . . . . . . . . . . . . . . . . . . . . . . . . . . . . . . . . . . . . . . . . . . . . . . . . . . . . . . . . . . . . . . . . . . . . . . . . . . . . . . . . . . . . . .
residue [wt%] 16.9 13.5 13.4 64.7 64.6 63.8 2.0 2.4 3.2 1.2 0.9 1.3 — — —. . . . . . . . . . . . . . . . . . . . . . . . . . . . . . . . . . . . . . . . . . . . . . . . . . . . . . . . . . . . . . . . . . . . . . . . . . . . . . . . . . . . . . . . . . . . . . . . . . . . . . . . . . . . . . . . . . . . . . . . . . . . . . . . . . . . . . . . . . . . . . . . . . . . . . . . . . . . . . . . . . . . . . . . . . . . . . . . . . . . . . . . . . . . . . . . . . . . . . . . . . . . . . . . . . . . . . . . .
water [wt%] — — — 50.2 51.9 50.2 — — — — — — — — —.. . . . . . . . . . . . . . . . . . . . . . . . . . . . . . . . . . . . . . . . . . . . . . . . . . . . . . . . . . . . . . . . . . . . . . . . . . . . . . . . . . . . . . . . . . . . . . . . . . . . . . . . . . . . . . . . . . . . . . . . . . . . . . . . . . . . . . . . . . . . . . . . . . . . . . . . . . . . . . . . . . . . . . . . . . . . . . . . . . . . . . . . . . . . . . . . . . . . . . . . . . . . . . . . . . . . . . . .14C [wt%] 88.9 84.1 79.4 100 100 100 4.9 6.7 3.4 1.7 2.1 1.7 — — —
. . . . . . . . . . . . . . . . . . . . . . . . . . . . . . . . . . . . . . . . . . . . . . . . . . . . . . . . . . . . . . . . . . . . . . . . . . . . . . . . . . . . . . . . . . . . . . . . . . . . . . . . . . . . . . . . . . . . . . . . . . . . . . . . . . . . . . . . . . . . . . . . . . . . . . . . . . . . . . . . . . . . . . . . . . . . . . . . . . . . . . . . . . . . . . . . . . . . . . . . . . . . . . . . . . . . . . . . .
CO [wt%] — — — — — — — — — — — — 33.9 34.4 33.4. . . . . . . . . . . . . . . . . . . . . . . . . . . . . . . . . . . . . . . . . . . . . . . . . . . . . . . . . . . . . . . . . . . . . . . . . . . . . . . . . . . . . . . . . . . . . . . . . . . . . . . . . . . . . . . . . . . . . . . . . . . . . . . . . . . . . . . . . . . . . . . . . . . . . . . . . . . . . . . . . . . . . . . . . . . . . . . . . . . . . . . . . . . . . . . . . . . . . . . . . . . . . . . . . . . . . . . . .
CO2 [wt%] — — — — — — — — — — — — 61.5 55.0 53.4. . . . . . . . . . . . . . . . . . . . . . . . . . . . . . . . . . . . . . . . . . . . . . . . . . . . . . . . . . . . . . . . . . . . . . . . . . . . . . . . . . . . . . . . . . . . . . . . . . . . . . . . . . . . . . . . . . . . . . . . . . . . . . . . . . . . . . . . . . . . . . . . . . . . . . . . . . . . . . . . . . . . . . . . . . . . . . . . . . . . . . . . . . . . . . . . . . . . . . . . . . . . . . . . . . . . . . . . .
CH4 [wt%] — — — — — — — — — — — — 4.6 10.6 13.2. . . . . . . . . . . . . . . . . . . . . . . . . . . . . . . . . . . . . . . . . . . . . . . . . . . . . . . . . . . . . . . . . . . . . . . . . . . . . . . . . . . . . . . . . . . . . . . . . . . . . . . . . . . . . . . . . . . . . . . . . . . . . . . . . . . . . . . . . . . . . . . . . . . . . . . . . . . . . . . . . . . . . . . . . . . . . . . . . . . . . . . . . . . . . . . . . . . . . . . . . . . . . . . . . . . . . . . . .
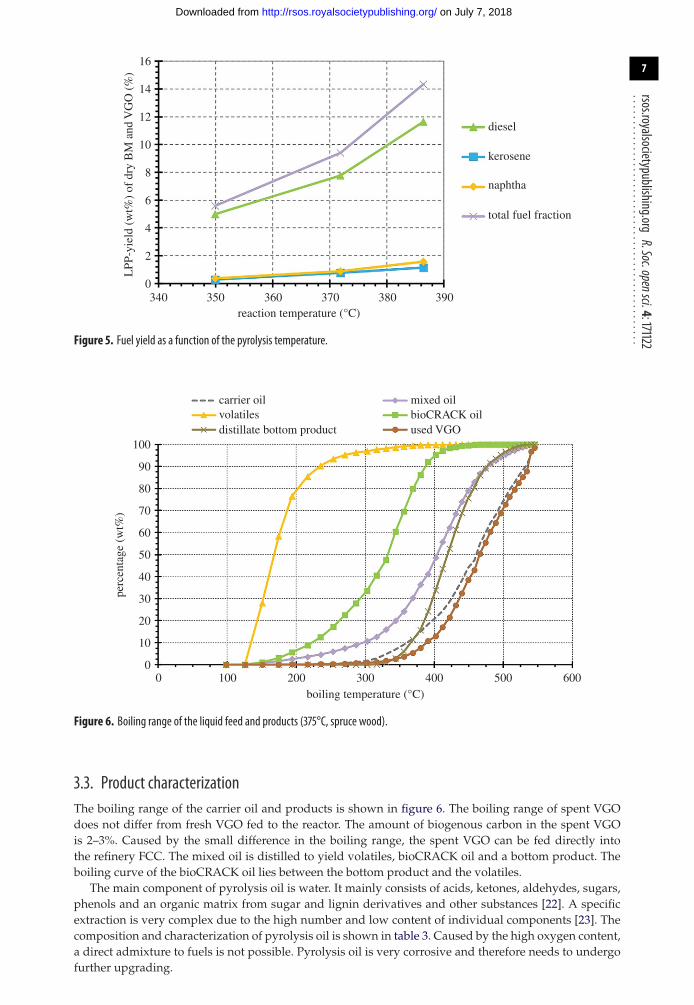
Through simulated distillation, the bioCRACK oil can be analytically separated in diesel, keroseneand naphtha. With increasing temperature, more fuel gets produced due to VGO cracking. The totalamount of fuel fraction based on biomass (BM) and VGO as a function of reaction temperature is shownin figure 5. Although the 14C amount of all fractions rises with temperature, the impact on the dieselfraction deviates strongly. The total amount of fuel is about 5–6% at 350°C. It rises up to 14–15% at 386°C.
3.2. Influence of the biomass feedstockThe bioCRACK process is not very sensitive to different lignocellulosic feedstock. The transfer ofbiogenous carbon into the fuel fraction of beech wood and wheat straw is similar to the data forspruce wood. The transfer of biogenous carbon into the non-condensable gaseous products is higherfor the feedstock wheat straw. This results in a lower CHO-content of the pyrolysis oil (about onethird compared to 50% for spruce or beech wood). The CHO-content of pyrolysis oil from miscanthusamounts to about 40%. Caused by the higher ash content of miscanthus and wheat straw, morebiochar, but with a lower heating value, is formed. There is no significant difference concerning thepower consumption.
on July 7, 2018http://rsos.royalsocietypublishing.org/Downloaded from
7
rsos.royalsocietypublishing.orgR.Soc.opensci.4:171122
................................................
LPP
-yie
ld (
wt%
) of
dry
BM
and
VG
O (
%)
0
2
4
6
8
10
12
14
16
340 350 360 370 380 390
total fuel fraction
naphtha
kerosene
diesel
reaction temperature (°C)
Figure 5. Fuel yield as a function of the pyrolysis temperature.
100
90
80
70
60
50
40
30
20
perc
enta
ge (
wt%
)
10
00 100 200 300
boiling temperature (°C)400 500 600
carrier oil mixed oilbioCRACK oilused VGO
volatilesdistillate bottom product
Figure 6. Boiling range of the liquid feed and products (375°C, spruce wood).
3.3. Product characterizationThe boiling range of the carrier oil and products is shown in figure 6. The boiling range of spent VGOdoes not differ from fresh VGO fed to the reactor. The amount of biogenous carbon in the spent VGOis 2–3%. Caused by the small difference in the boiling range, the spent VGO can be fed directly intothe refinery FCC. The mixed oil is distilled to yield volatiles, bioCRACK oil and a bottom product. Theboiling curve of the bioCRACK oil lies between the bottom product and the volatiles.
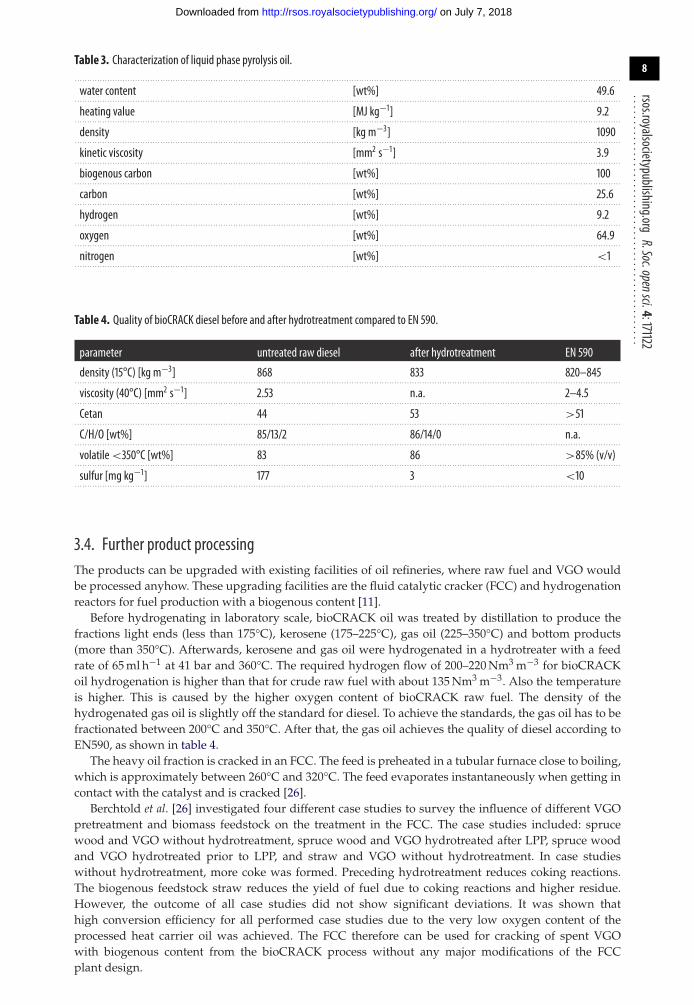
The main component of pyrolysis oil is water. It mainly consists of acids, ketones, aldehydes, sugars,phenols and an organic matrix from sugar and lignin derivatives and other substances [22]. A specificextraction is very complex due to the high number and low content of individual components [23]. Thecomposition and characterization of pyrolysis oil is shown in table 3. Caused by the high oxygen content,a direct admixture to fuels is not possible. Pyrolysis oil is very corrosive and therefore needs to undergofurther upgrading.
on July 7, 2018http://rsos.royalsocietypublishing.org/Downloaded from
8
rsos.royalsocietypublishing.orgR.Soc.opensci.4:171122
................................................Table 3. Characterization of liquid phase pyrolysis oil.. . . . . . . . . . . . . . . . . . . . . . . . . . . . . . . . . . . . . . . . . . . . . . . . . . . . . . . . . . . . . . . . . . . . . . . . . . . . . . . . . . . . . . . . . . . . . . . . . . . . . . . . . . . . . . . . . . . . . . . . . . . . . . . . . . . . . . . . . . . . . . . . . . . . . . . . . . . . . . . . . . . . . . . . . . . . . . . . . . . . . . . . . . . . . . . . . . . . . . . . . . . . . . . . . . . . . . . . .
water content [wt%] 49.6. . . . . . . . . . . . . . . . . . . . . . . . . . . . . . . . . . . . . . . . . . . . . . . . . . . . . . . . . . . . . . . . . . . . . . . . . . . . . . . . . . . . . . . . . . . . . . . . . . . . . . . . . . . . . . . . . . . . . . . . . . . . . . . . . . . . . . . . . . . . . . . . . . . . . . . . . . . . . . . . . . . . . . . . . . . . . . . . . . . . . . . . . . . . . . . . . . . . . . . . . . . . . . . . . . . . . . . . .
heating value [MJ kg−1] 9.2. . . . . . . . . . . . . . . . . . . . . . . . . . . . . . . . . . . . . . . . . . . . . . . . . . . . . . . . . . . . . . . . . . . . . . . . . . . . . . . . . . . . . . . . . . . . . . . . . . . . . . . . . . . . . . . . . . . . . . . . . . . . . . . . . . . . . . . . . . . . . . . . . . . . . . . . . . . . . . . . . . . . . . . . . . . . . . . . . . . . . . . . . . . . . . . . . . . . . . . . . . . . . . . . . . . . . . . . .
density [kg m−3] 1090. . . . . . . . . . . . . . . . . . . . . . . . . . . . . . . . . . . . . . . . . . . . . . . . . . . . . . . . . . . . . . . . . . . . . . . . . . . . . . . . . . . . . . . . . . . . . . . . . . . . . . . . . . . . . . . . . . . . . . . . . . . . . . . . . . . . . . . . . . . . . . . . . . . . . . . . . . . . . . . . . . . . . . . . . . . . . . . . . . . . . . . . . . . . . . . . . . . . . . . . . . . . . . . . . . . . . . . . .
kinetic viscosity [mm2 s−1] 3.9. . . . . . . . . . . . . . . . . . . . . . . . . . . . . . . . . . . . . . . . . . . . . . . . . . . . . . . . . . . . . . . . . . . . . . . . . . . . . . . . . . . . . . . . . . . . . . . . . . . . . . . . . . . . . . . . . . . . . . . . . . . . . . . . . . . . . . . . . . . . . . . . . . . . . . . . . . . . . . . . . . . . . . . . . . . . . . . . . . . . . . . . . . . . . . . . . . . . . . . . . . . . . . . . . . . . . . . . .
biogenous carbon [wt%] 100. . . . . . . . . . . . . . . . . . . . . . . . . . . . . . . . . . . . . . . . . . . . . . . . . . . . . . . . . . . . . . . . . . . . . . . . . . . . . . . . . . . . . . . . . . . . . . . . . . . . . . . . . . . . . . . . . . . . . . . . . . . . . . . . . . . . . . . . . . . . . . . . . . . . . . . . . . . . . . . . . . . . . . . . . . . . . . . . . . . . . . . . . . . . . . . . . . . . . . . . . . . . . . . . . . . . . . . . .
carbon [wt%] 25.6. . . . . . . . . . . . . . . . . . . . . . . . . . . . . . . . . . . . . . . . . . . . . . . . . . . . . . . . . . . . . . . . . . . . . . . . . . . . . . . . . . . . . . . . . . . . . . . . . . . . . . . . . . . . . . . . . . . . . . . . . . . . . . . . . . . . . . . . . . . . . . . . . . . . . . . . . . . . . . . . . . . . . . . . . . . . . . . . . . . . . . . . . . . . . . . . . . . . . . . . . . . . . . . . . . . . . . . . .
hydrogen [wt%] 9.2. . . . . . . . . . . . . . . . . . . . . . . . . . . . . . . . . . . . . . . . . . . . . . . . . . . . . . . . . . . . . . . . . . . . . . . . . . . . . . . . . . . . . . . . . . . . . . . . . . . . . . . . . . . . . . . . . . . . . . . . . . . . . . . . . . . . . . . . . . . . . . . . . . . . . . . . . . . . . . . . . . . . . . . . . . . . . . . . . . . . . . . . . . . . . . . . . . . . . . . . . . . . . . . . . . . . . . . . .
oxygen [wt%] 64.9. . . . . . . . . . . . . . . . . . . . . . . . . . . . . . . . . . . . . . . . . . . . . . . . . . . . . . . . . . . . . . . . . . . . . . . . . . . . . . . . . . . . . . . . . . . . . . . . . . . . . . . . . . . . . . . . . . . . . . . . . . . . . . . . . . . . . . . . . . . . . . . . . . . . . . . . . . . . . . . . . . . . . . . . . . . . . . . . . . . . . . . . . . . . . . . . . . . . . . . . . . . . . . . . . . . . . . . . .
nitrogen [wt%] <1. . . . . . . . . . . . . . . . . . . . . . . . . . . . . . . . . . . . . . . . . . . . . . . . . . . . . . . . . . . . . . . . . . . . . . . . . . . . . . . . . . . . . . . . . . . . . . . . . . . . . . . . . . . . . . . . . . . . . . . . . . . . . . . . . . . . . . . . . . . . . . . . . . . . . . . . . . . . . . . . . . . . . . . . . . . . . . . . . . . . . . . . . . . . . . . . . . . . . . . . . . . . . . . . . . . . . . . . .
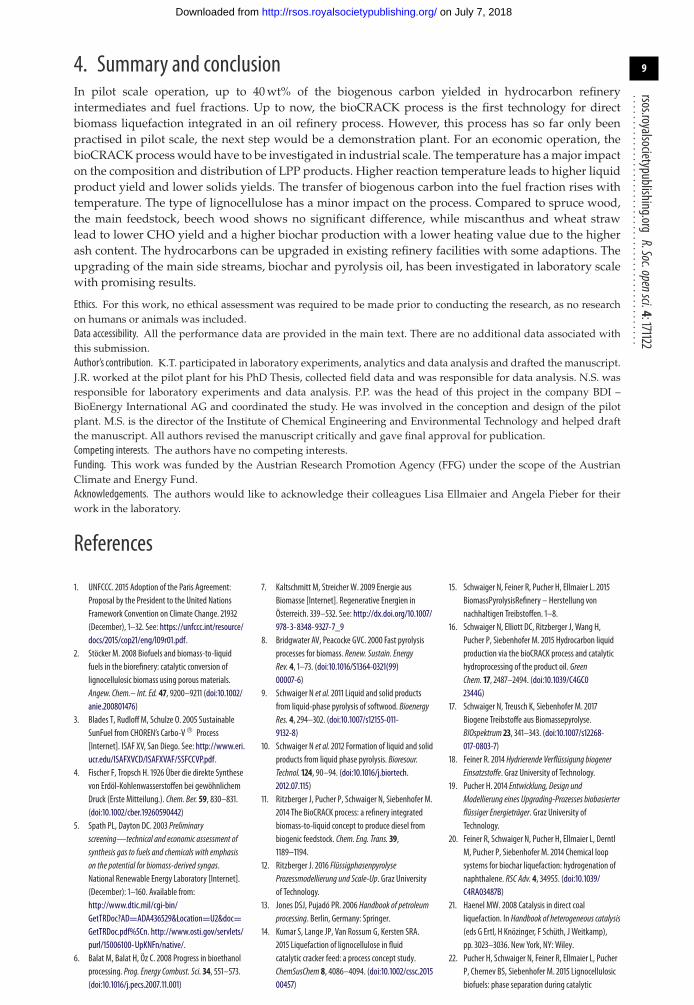
Table 4. Quality of bioCRACK diesel before and after hydrotreatment compared to EN 590.
parameter untreated raw diesel after hydrotreatment EN 590
density (15°C) [kg m−3] 868 833 820–845. . . . . . . . . . . . . . . . . . . . . . . . . . . . . . . . . . . . . . . . . . . . . . . . . . . . . . . . . . . . . . . . . . . . . . . . . . . . . . . . . . . . . . . . . . . . . . . . . . . . . . . . . . . . . . . . . . . . . . . . . . . . . . . . . . . . . . . . . . . . . . . . . . . . . . . . . . . . . . . . . . . . . . . . . . . . . . . . . . . . . . . . . . . . . . . . . . . . . . . . . . . . . . . . . . . . . . . . .
viscosity (40°C) [mm2 s−1] 2.53 n.a. 2–4.5. . . . . . . . . . . . . . . . . . . . . . . . . . . . . . . . . . . . . . . . . . . . . . . . . . . . . . . . . . . . . . . . . . . . . . . . . . . . . . . . . . . . . . . . . . . . . . . . . . . . . . . . . . . . . . . . . . . . . . . . . . . . . . . . . . . . . . . . . . . . . . . . . . . . . . . . . . . . . . . . . . . . . . . . . . . . . . . . . . . . . . . . . . . . . . . . . . . . . . . . . . . . . . . . . . . . . . . . .
Cetan 44 53 >51. . . . . . . . . . . . . . . . . . . . . . . . . . . . . . . . . . . . . . . . . . . . . . . . . . . . . . . . . . . . . . . . . . . . . . . . . . . . . . . . . . . . . . . . . . . . . . . . . . . . . . . . . . . . . . . . . . . . . . . . . . . . . . . . . . . . . . . . . . . . . . . . . . . . . . . . . . . . . . . . . . . . . . . . . . . . . . . . . . . . . . . . . . . . . . . . . . . . . . . . . . . . . . . . . . . . . . . . .
C/H/O [wt%] 85/13/2 86/14/0 n.a.. . . . . . . . . . . . . . . . . . . . . . . . . . . . . . . . . . . . . . . . . . . . . . . . . . . . . . . . . . . . . . . . . . . . . . . . . . . . . . . . . . . . . . . . . . . . . . . . . . . . . . . . . . . . . . . . . . . . . . . . . . . . . . . . . . . . . . . . . . . . . . . . . . . . . . . . . . . . . . . . . . . . . . . . . . . . . . . . . . . . . . . . . . . . . . . . . . . . . . . . . . . . . . . . . . . . . . . . .
volatile<350°C [wt%] 83 86 >85% (v/v). . . . . . . . . . . . . . . . . . . . . . . . . . . . . . . . . . . . . . . . . . . . . . . . . . . . . . . . . . . . . . . . . . . . . . . . . . . . . . . . . . . . . . . . . . . . . . . . . . . . . . . . . . . . . . . . . . . . . . . . . . . . . . . . . . . . . . . . . . . . . . . . . . . . . . . . . . . . . . . . . . . . . . . . . . . . . . . . . . . . . . . . . . . . . . . . . . . . . . . . . . . . . . . . . . . . . . . . .
sulfur [mg kg−1] 177 3 <10. . . . . . . . . . . . . . . . . . . . . . . . . . . . . . . . . . . . . . . . . . . . . . . . . . . . . . . . . . . . . . . . . . . . . . . . . . . . . . . . . . . . . . . . . . . . . . . . . . . . . . . . . . . . . . . . . . . . . . . . . . . . . . . . . . . . . . . . . . . . . . . . . . . . . . . . . . . . . . . . . . . . . . . . . . . . . . . . . . . . . . . . . . . . . . . . . . . . . . . . . . . . . . . . . . . . . . . . .
3.4. Further product processingThe products can be upgraded with existing facilities of oil refineries, where raw fuel and VGO wouldbe processed anyhow. These upgrading facilities are the fluid catalytic cracker (FCC) and hydrogenationreactors for fuel production with a biogenous content [11].
Before hydrogenating in laboratory scale, bioCRACK oil was treated by distillation to produce thefractions light ends (less than 175°C), kerosene (175–225°C), gas oil (225–350°C) and bottom products(more than 350°C). Afterwards, kerosene and gas oil were hydrogenated in a hydrotreater with a feedrate of 65 ml h−1 at 41 bar and 360°C. The required hydrogen flow of 200–220 Nm3 m−3 for bioCRACKoil hydrogenation is higher than that for crude raw fuel with about 135 Nm3 m−3. Also the temperatureis higher. This is caused by the higher oxygen content of bioCRACK raw fuel. The density of thehydrogenated gas oil is slightly off the standard for diesel. To achieve the standards, the gas oil has to befractionated between 200°C and 350°C. After that, the gas oil achieves the quality of diesel according toEN590, as shown in table 4.
The heavy oil fraction is cracked in an FCC. The feed is preheated in a tubular furnace close to boiling,which is approximately between 260°C and 320°C. The feed evaporates instantaneously when getting incontact with the catalyst and is cracked [26].
Berchtold et al. [26] investigated four different case studies to survey the influence of different VGOpretreatment and biomass feedstock on the treatment in the FCC. The case studies included: sprucewood and VGO without hydrotreatment, spruce wood and VGO hydrotreated after LPP, spruce woodand VGO hydrotreated prior to LPP, and straw and VGO without hydrotreatment. In case studieswithout hydrotreatment, more coke was formed. Preceding hydrotreatment reduces coking reactions.The biogenous feedstock straw reduces the yield of fuel due to coking reactions and higher residue.However, the outcome of all case studies did not show significant deviations. It was shown thathigh conversion efficiency for all performed case studies due to the very low oxygen content of theprocessed heat carrier oil was achieved. The FCC therefore can be used for cracking of spent VGOwith biogenous content from the bioCRACK process without any major modifications of the FCCplant design.
on July 7, 2018http://rsos.royalsocietypublishing.org/Downloaded from
9
rsos.royalsocietypublishing.orgR.Soc.opensci.4:171122
................................................4. Summary and conclusionIn pilot scale operation, up to 40 wt% of the biogenous carbon yielded in hydrocarbon refineryintermediates and fuel fractions. Up to now, the bioCRACK process is the first technology for directbiomass liquefaction integrated in an oil refinery process. However, this process has so far only beenpractised in pilot scale, the next step would be a demonstration plant. For an economic operation, thebioCRACK process would have to be investigated in industrial scale. The temperature has a major impacton the composition and distribution of LPP products. Higher reaction temperature leads to higher liquidproduct yield and lower solids yields. The transfer of biogenous carbon into the fuel fraction rises withtemperature. The type of lignocellulose has a minor impact on the process. Compared to spruce wood,the main feedstock, beech wood shows no significant difference, while miscanthus and wheat strawlead to lower CHO yield and a higher biochar production with a lower heating value due to the higherash content. The hydrocarbons can be upgraded in existing refinery facilities with some adaptions. Theupgrading of the main side streams, biochar and pyrolysis oil, has been investigated in laboratory scalewith promising results.
Ethics. For this work, no ethical assessment was required to be made prior to conducting the research, as no researchon humans or animals was included.Data accessibility. All the performance data are provided in the main text. There are no additional data associated withthis submission.Author’s contribution. K.T. participated in laboratory experiments, analytics and data analysis and drafted the manuscript.J.R. worked at the pilot plant for his PhD Thesis, collected field data and was responsible for data analysis. N.S. wasresponsible for laboratory experiments and data analysis. P.P. was the head of this project in the company BDI –BioEnergy International AG and coordinated the study. He was involved in the conception and design of the pilotplant. M.S. is the director of the Institute of Chemical Engineering and Environmental Technology and helped draftthe manuscript. All authors revised the manuscript critically and gave final approval for publication.Competing interests. The authors have no competing interests.Funding. This work was funded by the Austrian Research Promotion Agency (FFG) under the scope of the AustrianClimate and Energy Fund.Acknowledgements. The authors would like to acknowledge their colleagues Lisa Ellmaier and Angela Pieber for theirwork in the laboratory.
References
1. UNFCCC. 2015 Adoption of the Paris Agreement:Proposal by the President to the United NationsFramework Convention on Climate Change. 21932(December), 1–32. See: https://unfccc.int/resource/docs/2015/cop21/eng/l09r01.pdf.
2. Stöcker M. 2008 Biofuels and biomass-to-liquidfuels in the biorefinery: catalytic conversion oflignocellulosic biomass using porous materials.Angew. Chem.– Int. Ed. 47, 9200–9211 (doi:10.1002/anie.200801476)
3. Blades T, Rudloff M, Schulze O. 2005 SustainableSunFuel from CHOREN’s Carbo-V® Process[Internet]. ISAF XV, San Diego. See: http://www.eri.ucr.edu/ISAFXVCD/ISAFXVAF/SSFCCVP.pdf.
4. Fischer F, Tropsch H. 1926 Über die direkte Synthesevon Erdöl-Kohlenwasserstoffen bei gewöhnlichemDruck (Erste Mitteilung.). Chem. Ber. 59, 830–831.(doi:10.1002/cber.19260590442)
5. Spath PL, Dayton DC. 2003 Preliminaryscreening—technical and economic assessment ofsynthesis gas to fuels and chemicals with emphasison the potential for biomass-derived syngas.National Renewable Energy Laboratory [Internet].(December): 1–160. Available from:http://www.dtic.mil/cgi-bin/GetTRDoc?AD=ADA436529&Location=U2&doc=GetTRDoc.pdf%5Cn. http://www.osti.gov/servlets/purl/15006100-UpKNFn/native/.
6. Balat M, Balat H, Öz C. 2008 Progress in bioethanolprocessing. Prog. Energy Combust. Sci. 34, 551–573.(doi:10.1016/j.pecs.2007.11.001)
7. Kaltschmitt M, Streicher W. 2009 Energie ausBiomasse [Internet]. Regenerative Energien inÖsterreich. 339–532. See: http://dx.doi.org/10.1007/978-3-8348-9327-7_9
8. Bridgwater AV, Peacocke GVC. 2000 Fast pyrolysisprocesses for biomass. Renew. Sustain. EnergyRev. 4, 1–73. (doi:10.1016/S1364-0321(99)00007-6)
9. Schwaiger N et al. 2011 Liquid and solid productsfrom liquid-phase pyrolysis of softwood. BioenergyRes. 4, 294–302. (doi:10.1007/s12155-011-9132-8)
10. Schwaiger N et al. 2012 Formation of liquid and solidproducts from liquid phase pyrolysis. Bioresour.Technol. 124, 90–94. (doi:10.1016/j.biortech.2012.07.115)
11. Ritzberger J, Pucher P, Schwaiger N, Siebenhofer M.2014 The BioCRACK process: a refinery integratedbiomass-to-liquid concept to produce diesel frombiogenic feedstock. Chem. Eng. Trans. 39,1189–1194.
12. Ritzberger J. 2016 FlüssigphasenpyrolyseProzessmodellierung und Scale-Up. Graz Universityof Technology.
13. Jones DSJ, Pujadó PR. 2006 Handbook of petroleumprocessing. Berlin, Germany: Springer.
14. Kumar S, Lange JP, Van Rossum G, Kersten SRA.2015 Liquefaction of lignocellulose in fluidcatalytic cracker feed: a process concept study.ChemSusChem 8, 4086–4094. (doi:10.1002/cssc.201500457)
15. Schwaiger N, Feiner R, Pucher H, Ellmaier L. 2015BiomassPyrolysisRefinery – Herstellung vonnachhaltigen Treibstoffen. 1–8.
16. Schwaiger N, Elliott DC, Ritzberger J, Wang H,Pucher P, Siebenhofer M. 2015 Hydrocarbon liquidproduction via the bioCRACK process and catalytichydroprocessing of the product oil. GreenChem. 17, 2487–2494. (doi:10.1039/C4GC02344G)
17. Schwaiger N, Treusch K, Siebenhofer M. 2017Biogene Treibstoffe aus Biomassepyrolyse.BIOspektrum 23, 341–343. (doi:10.1007/s12268-017-0803-7)
18. Feiner R. 2014 Hydrierende Verflüssigung biogenerEinsatzstoffe. Graz University of Technology.
19. Pucher H. 2014 Entwicklung, Design undModellierung eines Upgrading-Prozesses biobasierterflüssiger Energieträger. Graz University ofTechnology.
20. Feiner R, Schwaiger N, Pucher H, Ellmaier L, DerntlM, Pucher P, Siebenhofer M. 2014 Chemical loopsystems for biochar liquefaction: hydrogenation ofnaphthalene. RSC Adv. 4, 34955. (doi:10.1039/C4RA03487B)
21. Haenel MW. 2008 Catalysis in direct coalliquefaction. In Handbook of heterogeneous catalysis(eds G Ertl, H Knözinger, F Schüth, J Weitkamp),pp. 3023–3036. New York, NY: Wiley.
22. Pucher H, Schwaiger N, Feiner R, Ellmaier L, PucherP, Chernev BS, Siebenhofer M. 2015 Lignocellulosicbiofuels: phase separation during catalytic
on July 7, 2018http://rsos.royalsocietypublishing.org/Downloaded from

10
rsos.royalsocietypublishing.orgR.Soc.opensci.4:171122
................................................hydrodeoxygenation of liquid phase pyrolysis oillignocellulosic biofuels. Sep. Sci. Technol. 50,2914–2919.
23. Czernik S, Bridgwater AV. 2004 Overview ofapplications of biomass fast pyrolysis oil. EnergyFuels 18, 590–598. (doi:10.1021/ef034067u)
24. Fengel D, Wegener G. 2003Wood chemistry,ultrastructure reactions. München, Germany: Kessel.
25. Bridgwater AV, Meier D, Radlein D. 1999 Anoverview of fast pyrolysis of biomass. Org. Geochem.30, 1479–1493. (doi:10.1016/S0146-6380(99)00120-5)
26. Berchtold M, Fimberger J, Reichhold A, Pucher P.2016 Upgrading of heat carrier oil derived fromliquid-phase pyrolysis via fluid catalytic cracking.Fuel Process. Technol. 142, 92–99. (doi:10.1016/j.fuproc.2015.09.028)
on July 7, 2018http://rsos.royalsocietypublishing.org/Downloaded from


![Aworldwidemodelfor boundariesofurban - CCNY · 2 rsos.royalsocietypublishing.org R.Soc.opensci. 5:180468..... to define cities through consistent mathematical models [4–15] and](https://img.pdfslide.us/doc/110x75/5f3537622ae45121fd5a64e0/aworldwidemodelfor-boundariesofurban-ccny-2-rsosroyalsocietypublishingorg-rsocopensci.jpg)
![rsos.royalsocietypublishing.org Canisaureus …rsos.royalsocietypublishing.org/content/royopensci/2/12/150450...cannot rule out the hypothesis of ancient hybridization events [10,11]](https://img.pdfslide.us/doc/110x75/5b3499c67f8b9ae1108e650d/rsosro-canisaureus-rsosro-rule-out-the-hypothesis-of-ancient-hybridization-events.jpg)


![Theperilousstateof seagrassintheBritishIslesorca.cf.ac.uk/85062/1/150596.full.pdf · 2016. 2. 4. · 2 rsos.royalsocietypublishing.org R.Soc.opensci. 3:150596..... [2,3] with anthropogenic](https://img.pdfslide.us/doc/110x75/600a90f34966be29c122c676/theperilousstateof-seagrassi-2016-2-4-2-rsosroyalsocietypublishingorg-rsocopensci.jpg)