Embed Size (px)
Citation preview
Nets
pa
r pa
nel
paper
s
panel 24
Edmund Cannon and Ian Tonks
Annuity Markets: Welfare, Money’s Worth and Policy Implications
Annuity Markets: Welfare, Money’s Worth and Policy Implications
In this Panel Paper, Edmund Cannon (University of Bristol)
and Ian Tonks (University of Bath) describe the operation
of annuity markets within the context of pension policy
in countries around the world. They focus in particular
on the UK which has the world’s largest annuity markets,
and describe time series properties of annuity rates in
both the UK’s compulsory and voluntary annuity markets.
Furthermore, they provide an overview of money’s worth
calculations in global annuities markets in this paper.

2 panel paper 24

Edmund Cannon and Ian Tonks
Annuity Markets: Welfare, Money’s Worth and Policy Implications
panel paper 24
annuity markets 3

ColophonPanel Papers is a publication of Netspar June 2011
Editorial BoardHenk Don (Chairman) – Netherlands Competition AuthorityErik Beckers – ZwitserlevenMartijn Hoogeweegen – INGArjen Hussem – PGGMFieke van der Lecq – Erasmus University Rotterdam Erik Jan van Kempen – Ministry of FinanceJan Koeman – Ministry of Social Affairs and Employability Johan Nieuwersteeg – AEGONJoos Nijtmans – Syntrus Achmea Alwin Oerlemans – APG Joeri Potters – Cardano Risk ManagementPeter Schotman – Maastricht UniversityHens Steehouwer – ORTEC Finance BVMarno Verbeek – Erasmus University Rotterdam Peter Wijn – APG
DesignB-more DesignBladvulling, Tilburg
PrintingPrinting Office Tilburg University
Editorial addressNetspar, Tilburg UniversityPO Box 90153, 5000 LE [email protected]
No reproduction of any part of this publication may take place without permission of the authors.
Network for Studies on Pensions, Aging and Retirement
4 panel paper 24

contents
Preface 7
Abstract 11
Executive Summary 12
1. Pensions and Annuity Markets 16
2. Welfare Properties of Annuity Markets 28
3. Time Series Properties of Annuity Rates 33
4. Pricing Annuities: Measuring the Money’s Worth 39
5. The Annuity Puzzle 50
6. Failure in Demand for Annuities and Policy Implications 59
7. Further Policy Issues 73
8. Conclusions 87
References 89
Summary of discussion 96
annuity markets 5

6 panel paper 24

preface
Netspar stimulates debate and fundamental research in the field of
pensions, aging and retirement. The aging of the population is
front-page news, as many baby boomers are now moving into
retirement. More generally, people live longer and in better health
while at the same time families choose to have fewer children.
Although the aging of the population often gets negative attention,
with bleak pictures painted of the doubling of the ratio of the
number of people aged 65 and older to the number of the working
population during the next decades, it must, at the same time, be a
boon to society that so many people are living longer and healthier
lives. Can the falling number of working young afford to pay the
pensions for a growing number of pensioners? Do people have to
work a longer working week and postpone retirement? Or should
the pensions be cut or the premiums paid by the working
population be raised to afford social security for a growing group of
pensioners? Should people be encouraged to take more
responsibility for their own pension? What is the changing role of
employers associations and trade unions in the organization of
pensions? Can and are people prepared to undertake investment for
their own pension, or are they happy to leave this to the pension
funds? Who takes responsibility for the pension funds? How can a
transparent and level playing field for pension funds and insurance
companies be ensured? How should an acceptable trade-off be
struck between social goals such as solidarity between young and
old, or rich and poor, and individual freedom? But most important
annuity markets 7

of all: how can the benefits of living longer and healthier be
harnessed for a happier and more prosperous society?
The Netspar Panel Papers aim to meet the demand for
understanding the ever-expanding academic literature on the
consequences of aging populations. They also aim to help give a
better scientific underpinning of policy advice. They attempt to
provide a survey of the latest and most relevant research, try to
explain this in a non-technical manner and outline the
implications for policy questions faced by Netspar’s partners. Let
there be no mistake. In many ways, formulating such a position
paper is a tougher task than writing an academic paper or an op-
ed piece. The authors have benefitted from the comments of the
Editorial Board on various drafts and also from the discussions
during the presentation of their paper at a Netspar Panel Meeting.
I hope the result helps reaching Netspar’s aim to stimulate social
innovation in addressing the challenges and opportunities raised
by aging in an efficient and equitable manner and in an
international setting.
Henk Don
Chairman of the Netspar Editorial Board
8 panel paper 24

annuity markets 9

Affiliations
Edmund Cannon – Department of Economics, University of Bristol
Ian Tonks – School of Management, University of Bath
Acknowledgements
This research was funded by Netspar. We are grateful to Rob Alessie,
Adrie Moons and another (anonymous) member of the Netspar
editorial board for useful comments.
10 panel paper 24

annuity markets: welfare, money’s worth and policy implications
Abstract
This panel paper explains the operation of annuity markets
within the context of pension policy in countries around the
world. The paper describes time-series properties of annuity
rates in the UK and the Netherlands. Following an overview of
money’s worth calculations in global annuities markets, the
paper concludes that the money’s worth tends to be very high
almost everywhere. Given the welfare benefits of annuitisation,
the fact that annuity demand is typically low constitutes the
“annuity puzzle”. The paper proceeds to examine various
reasons to explain this puzzle. An examination of various policy
issues concerning annuities wraps up the study.
annuity markets 11

Executive Summary
A life annuity enables an individual to convert a stock of wealth
(paid to an annuity provider in a single premium) into an
income stream that is received with certainty until the end of
life. The advantage of such an annuity is that it insures the
annuitant against outliving their wealth in the event of living
longer than expected. Annuities represent the decumulation
phase of a defined contribution (DC) funded pension scheme,
and form a large and growing part of pension systems around
the world. There are three ways of accessing accumulated
retirement funds by the newly retiring pensioner: a) as a lump
sum, without any restriction on their usage; b) phased
withdrawals, with limits on the amounts of the funds that the
pensioner can access; and c) annuitisation, where the
accumulated pension funds are converted into an income stream
for life. Of these three retirement income choices, only an
annuity provides longevity insurance.
Following Yaari (1965), this paper uses a stylised two-period
model to demonstrate the welfare advantages of annuitisation.
These welfare properties suggests that demand for voluntary
annuities should be strong, since (conditional on the individual
remaining alive) an annuity provides a higher return than a
standard savings product (because the annuity is an insurance
product in which individuals who die early cross-subsidise those
who survive – a phenomenon called mortality drag). This paper
describes the operation of annuity markets within the context of
12 panel paper 24

pension policy in countries around the world. We describe time-
series properties of annuity rates for both the UK and Dutch
compulsory purchase markets. The compulsory pension annuity
market in the UK had total premiums of £11.5 billion in 2010. The
following factors can be identified as determinants of annuity
prices: the value of the promised annuity payment; interest rates
at the time the annuity is purchased; information about the life
expectancy of the annuitant, (including age at time of purchase,
gender and health); the size of the premium paid for the
annuity; the type of annuity purchased; and the mark-up paid
to the life insurer to cover its costs and profits.
After calculating the money’s worth of annuities in both the
UK and the Netherlands, and providing an overview of money’s
worth calculations in global annuities markets, we conclude
that the money’s worth tends to be very high almost
everywhere.
The paper proceeds to examine various policy issues
concerning annuities. Given the welfare benefits of
annuitisation, the fact that annuity demand is typically low
constitutes the “annuity puzzle”. Reasons for the annuity puzzle
include the following: bequest motives, necessary expenditures
in old-age (such as health costs and long-term care provision),
the option value of deferral (since annuity rates may be lower
than equity returns at early ages), optimal decumulation
strategies, habit formation or other more exotic preferences.
These explanations for the annuity puzzle suggest that it may be
annuity markets 13
appropriate for individuals to avoid annuitisation, and imply no
need for any policy interventions. There are, however, two
additional sets of factors that would have implications for policy.
Additional reasons for annuity aversion may be behavioural
factors, and forms of irrationality. Also, the existence of social
welfare payments that may be claimed by individuals on low
incomes might induce individuals to run down their retirement
capital. These behavioural and moral hazard explanations would
support a policy of compulsory annuitisation.
The paper considers a number of other policy issues related to
annuities. The relatively small number of annuity providers raises
concerns about abuse of market power, although the money’s
worth evidence does not suggest that monopoly pricing is a
problem in this market. Annuity providers match the durations
of their liabilities with suitable assets by investing annuity
premiums in long-term bonds. The government’s issuance of
long-term government bonds can ensure that there are
sufficient long-term government bonds available to minimise
the risks of an asset-liability mismatch. The small number of
providers also means that the cohort longevity risk is highly
concentrated in a small number of firms, and there is a question
whether these providers have the capacity to absorb the extra
risk associated with increased annuity demand. If this limited
number of firms were not able to bear the total longevity risk,
then mechanisms would need to be found for this risk to be held
elsewhere. Possible candidates include individual investors or
14 panel paper 24

other financial institutions, which would hold mortality bonds
(issued by reinsurers) in a diversified portfolio; the government
and other bond issuers (by issuing longevity bonds); or the
annuity holders themselves (by making the annuity payments
conditional on cohort survival rates).
annuity markets 15

1. Pensions and Annuity Markets
There is a well-documented global trend away from unfunded
pay-as-you-go and funded defined benefit (DB) pension
schemes towards individual-based defined contribution (DC)
schemes.1 Examples of such schemes are the US’s 401(k) pension
plans, the UK’s personal pensions and proposed National
Employment Savings Trust (NEST), Germany’s Reister plans,
Australia’s Superannuation system, and New Zealand’s KiwiSaver
scheme. Any DC scheme requires instruments to convert the
accumulated capital into a retirement income stream. This is
what an annuity accomplishes. A life annuity converts a stock of
wealth at retirement into a flow of income that is payable to the
beneficiary (called an annuitant) until death. An annuitant pays
a premium to a life insurance company, which then undertakes
to pay an agreed income to the annuitant, usually on a monthly
basis. Because the life annuity is paid until the annuitant dies,
it insures that person against longevity risk—insuring him or her,
in other words, against running out of savings to support
consumption expenditure in old age. As countries switch to
individual-based DC schemes, it is likely that the global demand
for annuity products will increase; investigating the operation
16 panel paper 24
1 Table 1 in European Commission (2009) notes that some type of voluntary individual DC pension savings plan exists in almost all European countries, and a number of countries, such as Bulgaria, Estonia, Latvia, Lithuania, Hungary, Poland, Slovakia and Sweden, have switched part of their social security pension system into private funded schemes.

and effectiveness of existing annuity markets is thus important
for pension policy.
Annuities are nearly always purchased as part of a pension
scheme. In the standard life-cycle model, individuals make
labour supply and consumption/savings decisions during the
early part of their life to maximise permanent lifetime income.
Individuals may choose to save in a tax-efficient pension scheme
(the accumulation phase). From retirement onwards, individuals
cease working and consume by running down their savings (the
decumulation phase). There are three ways of accessing these
retirement funds by the newly retiring pensioner: a) as a lump
sum, whereby the accumulated funds are simply withdrawn by
the pensioner, without any restriction on their usage; b) in
phased withdrawals, where there are limits on the amounts of
the funds that the pensioner can access; and c) through
annuitisation, where the accumulated pension funds are
converted into an income stream for all (life annuity) or part
(temporary or term- or partial annuity) of the remainder of the
pensioner’s life. An important distinction between an annuity
and a phased withdrawal is that the former provides insurance
against exhausting one’s wealth, whereas the latter offers no
longevity insurance. In a DB group scheme, the annuitisation
may take place implicitly within the pension fund; in a DC
scheme, the annuitisation takes place explicitly through a
contract with an annuity provider.
annuity markets 17

The provision of private annuities and the size of the annuity
market in a particular country typically depend on the structure
of retirement provision in that country. James and Vittas (1999)
observed that developed countries with large state-pension
provision (Germany, France, Japan, Italy) typically have small
annuity markets, whereas countries in which the value of the
state pension is small (US, UK, Chile, Switzerland, Singapore)
have more developed annuity markets, in which compulsion
plays an important role (UK). On the other hand, developing and
under-developed countries with low state-pension provision
(India, China) also have poorly developed annuity markets.
Rusconi (2008) described three categories of annuity markets: 1)
Immediate annuity markets (purchased at retirement),
converting a lump sum into a lifetime income (in the UK, the US,
Canada, Chile and South Africa; 2) Guaranteed deferred-annuity
markets typically purchased during the working years, with a
relatively low guaranteed return throughout the accumulation
and payout phase but with bonuses added as investment returns
emerge (in Denmark, Belgium, Germany and the Netherlands);
and 3) Small annuity markets (in Hungary and Mexico), and
those with unusual characteristics (in Switzerland and
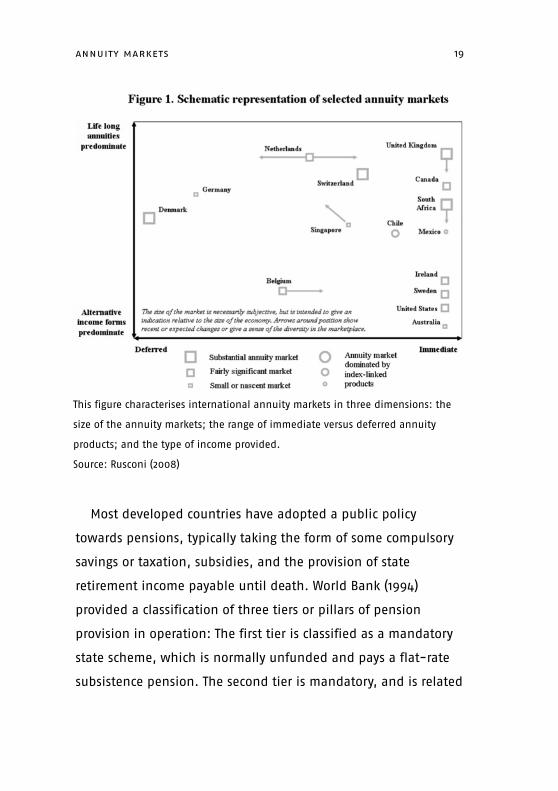
Singapore), for example. Figure 1 characterises international
annuity markets along three dimensions: the size of the market;
the range of immediate versus deferred annuity products; and
the type of income provided.
18 panel paper 24
Most developed countries have adopted a public policy
towards pensions, typically taking the form of some compulsory
savings or taxation, subsidies, and the provision of state
retirement income payable until death. World Bank (1994)
provided a classification of three tiers or pillars of pension
provision in operation: The first tier is classified as a mandatory
state scheme, which is normally unfunded and pays a flat-rate
subsistence pension. The second tier is mandatory, and is related
annuity markets 19
This figure characterises international annuity markets in three dimensions: the
size of the annuity markets; the range of immediate versus deferred annuity
products; and the type of income provided.
Source: Rusconi (2008)
to earnings over the employee’s life. The third tier represents all
forms of voluntary private pension provision, of which there are
two basic types: group (including occupational) schemes and
individual pension schemes. These third-tier schemes are
usually funded.
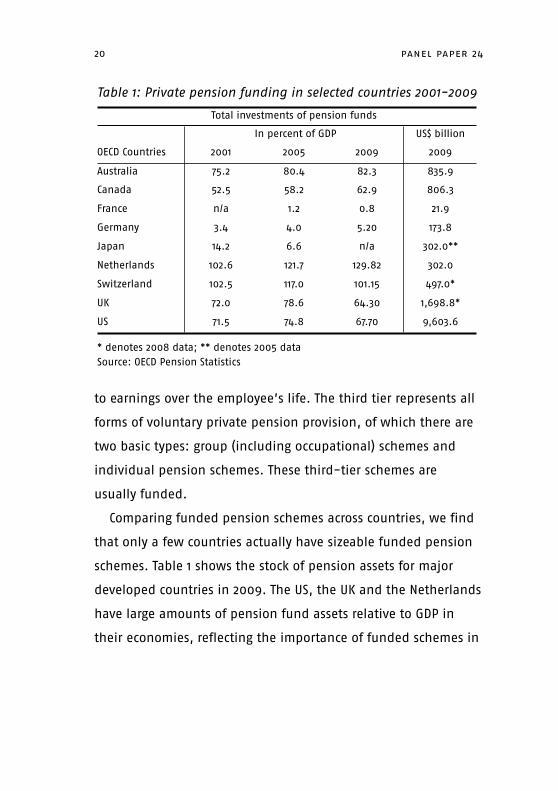
Comparing funded pension schemes across countries, we find
that only a few countries actually have sizeable funded pension
schemes. Table 1 shows the stock of pension assets for major
developed countries in 2009. The US, the UK and the Netherlands
have large amounts of pension fund assets relative to GDP in
their economies, reflecting the importance of funded schemes in
20 panel paper 24
Table 1: Private pension funding in selected countries 2001-2009
Total investments of pension funds Total investments of pension funds Total investments of pension funds In percent of GDP In percent of GDP In percent of GDP US$ billion
OECD Countries 2001 2005 2009 2009
Australia 75.2 80.4 82.3 835.9
Canada 52.5 58.2 62.9 806.3
France n/a 1.2 0.8 21.9
Germany 3.4 4.0 5.20 173.8
Japan 14.2 6.6 n/a 302.0**
Netherlands 102.6 121.7 129.82 302.0
Switzerland 102.5 117.0 101.15 497.0*
UK 72.0 78.6 64.30 1,698.8*
US 71.5 74.8 67.70 9,603.6
* denotes 2008 data; ** denotes 2005 data Source: OECD Pension Statistics

these countries.2 In contrast, major economies such as Japan,
France and Germany have a relatively small percentage of
pension fund assets, reflecting the fact that pension schemes in
these economies are predominantly unfunded pay-as-you-go
systems. Figures 2 and 3 show the rankings of OECD and non-
OECD countries by the size of pension fund assets relative to GDP.
The Netherlands, Iceland, Switzerland, and the US stand out
amongst the OECD countries as having very high ratios (and
importance) of pension assets to GDP. For non-OECD countries,
South Africa, Hong Kong and Jamaica have relatively large
amounts of pension fund assets.
Any country that switches all or part of its pension system to a
funded private pension provision will ultimately need to decide
on the methods that will be used to convert the capital that has
been accumulated in the pension funds into retirement income
streams. That country’s pension policy will need to identify
which of the three retirement income streams (lump-sum,
phased withdrawal, or annuitisation)—or combination of these
policies—it intends to adopt.
Where annuities are purchased voluntarily, the annuity market
tends to be small (Brown, et al., 2001). Not surprisingly, when
annuity markets 21
2 Palacios and Pallares-Miralles (2000) identified these countries, and Australia, South Africa, Switzerland and Iceland, as being countries with significant private pension fund assets. A combination of generous tax allowances on pension contributions (Dilnot and Johnson, 1993) and a liberal regulatory regime for pension investments (Davis, 1995) probably explains the dominance of funded pensions in these countries.

22 panel paper 24
Source: OECD Pension Statistics
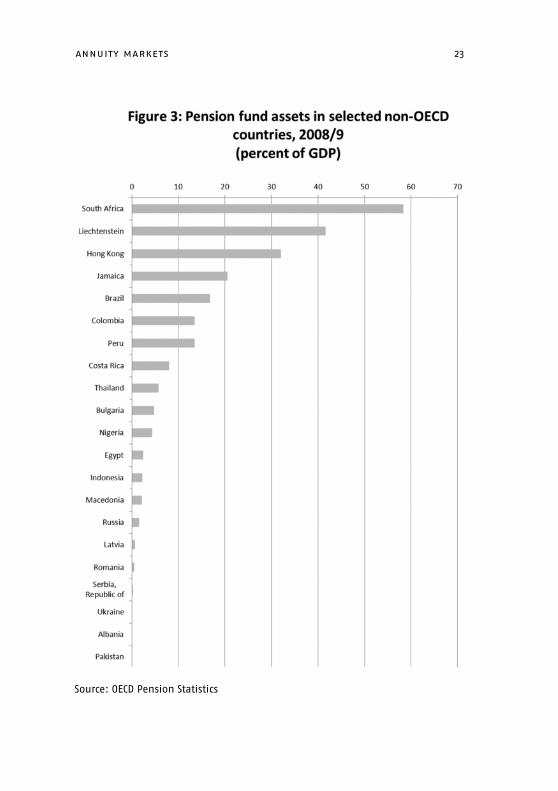
annuity markets 23
Source: OECD Pension Statistics

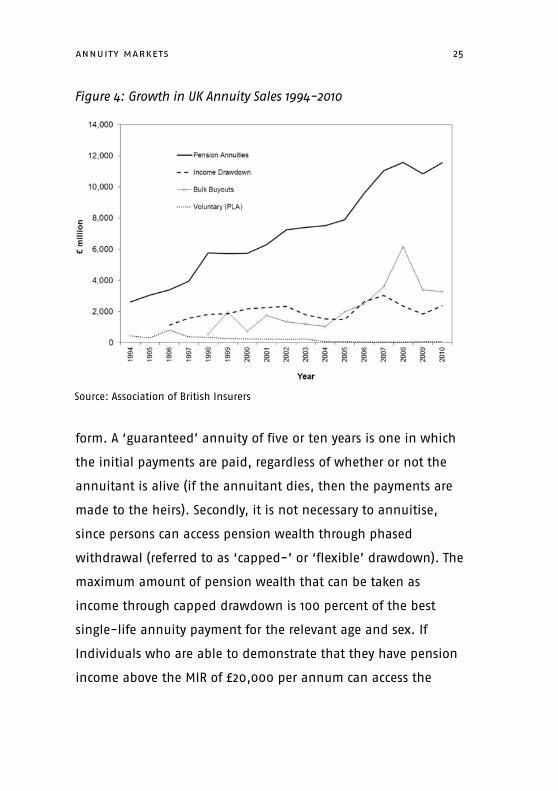
annuity purchase is compulsory the size of the market is much
larger. Figure 4 shows the pattern in sales of retirement income
products in the UK, which has the largest annuities market in the
world. The UK annuities market is so large (£11.5 billion in 20103)
because it is compulsory to use a portion of pension wealth to
purchase an annuity at or shortly after the point of retirement.
Compulsory-purchase annuities are those purchased by
individuals who have saved in a personal pension fund that has
received tax privileges: contributions to the scheme are made
before deduction of income tax, and all investment returns are
also tax-free. UK regulations effectively require anyone who has
saved in a tax-privileged private pension to annuitise 75 percent
of their pension wealth at retirement.4 Typically, the pension
fund is managed by a life insurance company during the
accumulation phase: the value of the fund at retirement is then
used by the pensioner to buy an annuity—either from the life
insurer with whom they accumulated the fund or from another
life insurer (the open market option).
The UK’s compulsory purchase rule still offers considerable
flexibility to the annuitant. First, the definition of an annuity
includes products where some of the wealth is not in annuity
24 panel paper 24
3 Source: Association of British Insurers.
4 The UK government is proposing to relax the compulsory annuitisation requirement from April 2011 for persons who can demonstrate that they have pension income above the MIR (Minimum Income Requirement) set at £20,000 per annum. The number of people with pension income above the MIR is small, and is unlikely to have a large effect on the size of CPA market.
form. A ‘guaranteed’ annuity of five or ten years is one in which
the initial payments are paid, regardless of whether or not the
annuitant is alive (if the annuitant dies, then the payments are
made to the heirs). Secondly, it is not necessary to annuitise,
since persons can access pension wealth through phased
withdrawal (referred to as ‘capped-’ or ‘flexible’ drawdown). The
maximum amount of pension wealth that can be taken as
income through capped drawdown is 100 percent of the best
single-life annuity payment for the relevant age and sex. If
Individuals who are able to demonstrate that they have pension
income above the MIR of £20,000 per annum can access the
annuity markets 25
Figure 4: Growth in UK Annuity Sales 1994-2010
Source: Association of British Insurers
remainder of their accumulated pension wealth through flexible
drawdown.
Figure 4 shows the growth in UK annuities and drawdown
products over the period 1994-2010. By 2010, the compulsory
(CPA) market had grown to £11.5 billion worth of annuity
premiums. In contrast, the voluntary (PLA) market only amounted
to £72 million worth of sales, and the diagram shows that the
PLA market has shrunk as the CPA market has grown, probably
reflecting some substitution between compulsory and voluntary
annuities. The bulk annuity market has been volatile, with a
peak in 2008, representing transfers from DB schemes to bulk
buyouts. Drawdown continues to represent a significant
alternative to annuitisation. The Pensions Commission (2005,
2006) noted the trend for pensions in the UK to be provided
through DC schemes, and as a consequence that there will be an
increased demand for life annuities. Watson-Wyatt (2003) and
Wadsworth (2005) examined a number of scenarios for the
growth of annuity demand over the ten-year period 2002-2012,
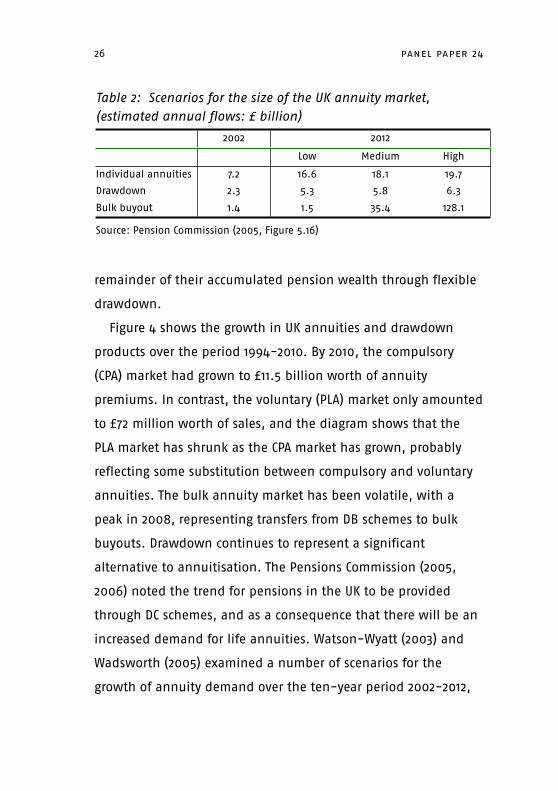
26 panel paper 24
Table 2: Scenarios for the size of the UK annuity market, (estimated annual flows: £ billion)
2002 201220122012
Low Medium High
Individual annuities 7.2 16.6 18.1 19.7
Drawdown 2.3 5.3 5.8 6.3
Bulk buyout 1.4 1.5 35.4 128.1
Source: Pension Commission (2005, Figure 5.16)

reproduced in Table 2. According to the Pension Commission’s
Second Report, and reiterated in HM Treasury (2006), the main
driver in these estimates is the maturity of individual and
company DC schemes. Table 2 suggests that the demand for
annuities could increase from about £7 billion in 2002 to
between £16-£20 billion by 2012. But these numbers could
increase dramatically if existing DB schemes are closed and
replaced by bulk buyouts of annuities. The bulk annuity market
is where an annuity provider acquires a package of individual
pension liabilities, typically from the closure of a DB occupational
scheme. Depending on the extent of this switch, the demand for
annuities in the UK could increase by up to £128 billion. The
Pensions Commission (2005) estimated that if the proposed
national pension savings scheme (NEST) successfully targets that
group of the population who currently are not provided for, this
will represent (in the steady state) an additional annual demand
for annuities of £13 billion by the year 2040 at current earnings
levels. All of this evidence suggests that the demand for
annuities in the UK will continue to rise substantially in the
coming years. The Pensions Commission noted that any capacity
problems in the annuities market could be eased by allowing a
relaxation of income drawdown rules, or by facilitating later
retirement.
annuity markets 27

2. Welfare Properties of Annuity Markets
In order to illustrate the welfare properties of annuity markets
(Yaari, 1965), this paper illustrates the benefits of annuitisation
following Kotlikoff and Spivak (1981) by considering the
consumption problem faced by a retired individual in a two-
period model with and without annuity markets.
2.1 Retirement consumption problem without annuity markets
Consider the consumption problem of an individual i who has
just retired with pensions wealth W0 and who must allocate this
wealth over the two remaining periods of his life (c0, c1). There is
uncertainty, however, over whether the individual will be alive
in the second period. In the absence of an annuities market,
individual i maximises expected utility (1) subject to a budget
constraint (2)
, (1)
subject to
, (2)
where p1 is the probability of surviving into the second period
(p0=1); δ is the rate of time preference, and r is the rate of return
on savings. The budget constraint is identical to a certain world
case, and says that initial wealth must be no less than the
present value of consumption over the consumer’s lifetime. In
28 panel paper 24

the special case where r = 0 and δ = 1, without annuities, the
consumption solution simplifies to
and
.
Thus, if p1 = 0 (there is no probability of living until next year),
then c0 = W0 and c1 = 0; and the consumer spends all of his
wealth in the first period. On the other hand, if p1 = 1 (certainty
of living until next year), then c0 = c1 = W0/2 — and since there is
no discounting, the consumer splits consumption equally
between the two periods. For intermediate values of p1, the
individual will tilt consumption between today and tomorrow,
depending on the probability of survival and his degree of risk
aversion. For example, if p1 = 0.5; and γ = 1, then c0 = 2W0/3 and
c1 = W0/3. So the individual with a 50:50 chance of living to the
second period will consume more in the first period, and less in
the second. This, however, is inefficient—for two reasons: first,
consumption is not the same in each period for those individuals
that survive; second, consumption in the second period is left
unconsumed for those individuals that die.
2.2 Retirement consumption problem with annuity markets
Now suppose that an annuities market with fairly priced
annuities exists. An annuity contract is offered by an insurance
company to an individual such that in return for a payment
(W0 - c0A) in the first period (called the annuity premium (or
annuity markets 29

annuity price)) the insurance company will pay out an income y1
in the second period—if the individual survives, but will pay out
nothing if the individual dies. This contract is fairly priced if the
insurance company breaks even, so that the price of the annuity
contract equals the expected annuity payment (W0 - c0A) = p1y1/
(1+r). Then the budget constraint facing the individual becomes
and the individual uses the promised annuity payment to fund
second-period consumption,
(3)
So the budget constraint changes according to the equality of
wealth and the expected value of consumption: the individual
exchanges wealth for a promise from the insurance company to
pay out an income stream yt as long as the annuitant lives. The
term pt/(1+r)t can be thought of as a price; since
and the existence of an annuity market is equivalent to, no-
annuity market but with lower prices of future consumption. So
access to the annuity market increases utility by expanding the
budget frontier. With fairly priced annuities, the solution to the
consumers’ maximisation problem, again for the special case
where r = 0 and δ = 1, becomes
30 panel paper 24

and
Optimal consumption in each period, with and without
annuities, is illustrated in Figure 5, and we can make a number
of observations from this diagram:
• With annuities, c0A = c1A = W0/(1+p1), and consumption is
exactly the same in each period: pure consumption
smoothing.
• Annuities do not make any difference to consumption when
the consumer knows for certain that they will live into the
next period.
annuity markets 31
Figure 5: Impact of an Annuities Market on a Consumer’s Budget Constraint

• We suggested above that if p1 = 0.5; and γ = 1, then c0 =
2W0/3 and c1 = W0/3. When annuities are available, the
comparable consumption profile is c0A = c1A = 2W0/3. This case
clearly illustrates that consumers are better off with access to
annuities markets.
• Even if an individual has a very low probability of surviving,
he is still better off annuitising his wealth: with the
implication that all individuals should annuitise.
32 panel paper 24
3. Time Series Properties of Annuity Rates
This section provides some descriptive statistics on rates in the
annuity markets of both the UK and the Netherlands. Annuity
prices are usually quoted in the form of an annual annuity
payment of £X per £10,000 purchased, which will be referred to
here as an annuity rate of X/100 percent. In the UK, legislation
allowing for individual tax-efficient pension accounts was
passed in 1956, but the market for compulsory annuities was
initially small since it takes time for pension funds to accumulate
sufficient demand. Money Facts provide data on the CPA market
from 1994 onwards. Between 20 and 25 companies were quoting
at the beginning of the period: by the end, only nine were
quoting. Figure 6 illustrates the evolution of the simple average
annuity rate for nominal and real annuities. The FSA returns
reveal that 62 companies were selling compulsory annuities in
2005.5 The five-firm concentration ratio is 72 percent, and the
largest firm, the Prudential, supplied over 23 percent of new
business. The annuity rates in the Money Facts database
represent all of the major providers.
Figure 6 also provides a comparison of annuity rates in the
compulsory market with long-term interest rates. It compares the
nominal annuity rate for 65-year-old males with the United
Kingdom government ten-year bond yield. It can be seen that
annuity markets 33
5 Insurance companies in the UK are regulated by the Financial Services Authority (FSA) and are required to submit to the regulator annual returns, which are publically available.
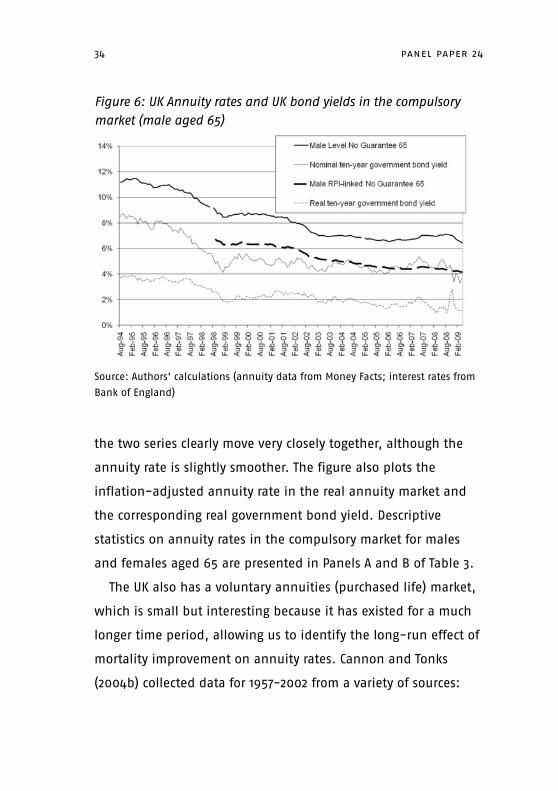
the two series clearly move very closely together, although the
annuity rate is slightly smoother. The figure also plots the
inflation-adjusted annuity rate in the real annuity market and
the corresponding real government bond yield. Descriptive
statistics on annuity rates in the compulsory market for males
and females aged 65 are presented in Panels A and B of Table 3.
The UK also has a voluntary annuities (purchased life) market,
which is small but interesting because it has existed for a much
longer time period, allowing us to identify the long-run effect of
mortality improvement on annuity rates. Cannon and Tonks
(2004b) collected data for 1957-2002 from a variety of sources:
34 panel paper 24
Figure 6: UK Annuity rates and UK bond yields in the compulsory market (male aged 65)
Source: Authors’ calculations (annuity data from Money Facts; interest rates from
Bank of England)

annuity markets 35
Tabl
e 3:
Tim
e-Se
ries
Pro
pert
ies
of U
K an
d N
eth
erla
nd
s An
nui
ty R
ates
an
d B
ond
Yie
lds
Ann
uity
rat
esAn
nui
ty r
ates
Ann
uity
rat
esAn
nui
ty r
ates
Ann
uity
rat
esAn
nui
ty r
ates
Ann
uity
rat
esG
over
nm
ent
Bon
d y
ield
sG
over
nm
ent
Bon
d y
ield
sG
over
nm
ent
Bon
d y
ield
sG
over
nm
ent
Bon
d y
ield
s
Mal
e 65
mea
nM
ale
65 s
tdev
Fem
ale
65 m
ean
Fem
ale
65 s
tdev
corr
be
twee
n
Mal
e an
d
Fem
ale
dif
f be
twee
n
Mal
e an
d
Fem
ale
mea
nst
dev
corr
wit
h
Mal
es 6
5D
iff
from
M
ale
65
Pan
el A
: U
K Co
mpu
lsor
y M
arke
t -
Nom
inal
Pan
el A
: U
K Co
mpu
lsor
y M
arke
t -
Nom
inal
Pan
el A
: U
K Co
mpu
lsor
y M
arke
t -
Nom
inal
Pan
el A
: U
K Co
mpu
lsor
y M
arke
t -
Nom
inal
Pan
el A
: U
K Co
mpu
lsor
y M
arke
t -
Nom
inal
Pan
el A
: U
K Co
mpu
lsor
y M
arke
t -
Nom
inal
Pan
el A
: U
K Co
mpu
lsor
y M
arke
t -
Nom
inal
Pan
el A
: U
K Co
mpu
lsor
y M
arke
t -
Nom
inal
Pan
el A
: U
K Co
mpu
lsor
y M
arke
t -
Nom
inal
Pan
el A
: U
K Co
mpu
lsor
y M
arke
t -
Nom
inal
Pan
el A
: U
K Co
mpu
lsor
y M
arke
t -
Nom
inal
1994
-200
98.
33%
1.60
%7.
51%
1.32
%99
.79%
0.83
%5.
43%
1.35
%92
.00%
2.90
%
2002
-200
96.
96%
0.34
%6.
41%
0.29
%98
.00%
0.55
%4.
58%
0.39
%49
.08%
2.38
%
Pan
el B
: U
K Co
mpu
lsor
y M
arke
t –
Rea
l (in
dex
ed t
o U
K’s
RPI)
Pan
el B
: U
K Co
mpu
lsor
y M
arke
t –
Rea
l (in
dex
ed t
o U
K’s
RPI)
Pan
el B
: U
K Co
mpu
lsor
y M
arke
t –
Rea
l (in
dex
ed t
o U
K’s
RPI)
Pan
el B
: U
K Co
mpu
lsor
y M
arke
t –
Rea
l (in
dex
ed t
o U
K’s
RPI)
Pan
el B
: U
K Co
mpu
lsor
y M
arke
t –
Rea
l (in
dex
ed t
o U
K’s
RPI)
Pan
el B
: U
K Co
mpu
lsor
y M
arke
t –
Rea
l (in
dex
ed t
o U
K’s
RPI)
Pan
el B
: U
K Co
mpu
lsor
y M
arke
t –
Rea
l (in
dex
ed t
o U
K’s
RPI)
Pan
el B
: U
K Co
mpu
lsor
y M
arke
t –
Rea
l (in
dex
ed t
o U
K’s
RPI)
Pan
el B
: U
K Co
mpu
lsor
y M
arke
t –
Rea
l (in
dex
ed t
o U
K’s
RPI)
Pan
el B
: U
K Co
mpu
lsor
y M
arke
t –
Rea
l (in
dex
ed t
o U
K’s
RPI)
Pan
el B
: U
K Co
mpu
lsor
y M
arke
t –
Rea
l (in
dex
ed t
o U
K’s
RPI)
2002
-200
94.
76%
0.44
%4.
22%
0.38
%99
.30%
0.53
%1.
78%
0.39
%69
.67%
2.97
%
Pan
el C
: U
K Vo
lun
tary
Mar
ket
- N
omin
alPa
nel
C:
UK
Volu
nta
ry M
arke
t -
Nom
inal
Pan
el C
: U
K Vo
lun
tary
Mar
ket
- N
omin
alPa
nel
C:
UK
Volu
nta
ry M
arke
t -
Nom
inal
Pan
el C
: U
K Vo
lun
tary
Mar
ket
- N
omin
alPa
nel
C:
UK
Volu
nta
ry M
arke
t -
Nom
inal
Pan
el C
: U
K Vo
lun
tary
Mar
ket
- N
omin
alPa
nel
C:
UK
Volu
nta
ry M
arke
t -
Nom
inal
Pan
el C
: U
K Vo
lun
tary
Mar
ket
- N
omin
alPa
nel
C:
UK
Volu
nta
ry M
arke
t -
Nom
inal
Pan
el C
: U
K Vo
lun
tary
Mar
ket
- N
omin
al
1957
-200
911
.57%
2.98
%
8.37
%3.
22%
91.7
4%3.
20%
1972
-199
314
.09%
1.68
%12
.97%
1.65
%99
.80%
1.12
%11
.54%
2.10
%92
.09%
2.56
%
1994
-200
98.
04%
1.76
%7.
29%
1.41
%99
.56%
0.75
%5.
57%
1.46
%94
.96%
2.47
%
Pan
el D
: N
eth
erla
nd
s Co
mpu
lsor
y M
arke
t -
Nom
inal
Pan
el D
: N
eth
erla
nd
s Co
mpu
lsor
y M
arke
t -
Nom
inal
Pan
el D
: N
eth
erla
nd
s Co
mpu
lsor
y M
arke
t -
Nom
inal
Pan
el D
: N
eth
erla
nd
s Co
mpu
lsor
y M
arke
t -
Nom
inal
Pan
el D
: N
eth
erla
nd
s Co
mpu
lsor
y M
arke
t -
Nom
inal
Pan
el D
: N
eth
erla
nd
s Co
mpu
lsor
y M
arke
t -
Nom
inal
Pan
el D
: N
eth
erla
nd
s Co
mpu
lsor
y M
arke
t -
Nom
inal
Pan
el D
: N
eth
erla
nd
s Co
mpu
lsor
y M
arke
t -
Nom
inal
Pan
el D
: N
eth
erla
nd
s Co
mpu
lsor
y M
arke
t -
Nom
inal
Pan
el D
: N
eth
erla
nd
s Co
mpu
lsor
y M
arke
t -
Nom
inal
Pan
el D
: N
eth
erla
nd
s Co
mpu
lsor
y M
arke
t -
Nom
inal
2001
-200
98.
31%
0.48
%4.
22%
0.53
%90
.24%
4.09
%
Sour
ce:
Auth
ors’
cal
cula
tion
s fr
om d
ata
supp
lied
by
Mon
eyFa
cts
(UK)
an
d M
oney
View
(N
eth
erla
nd
s).
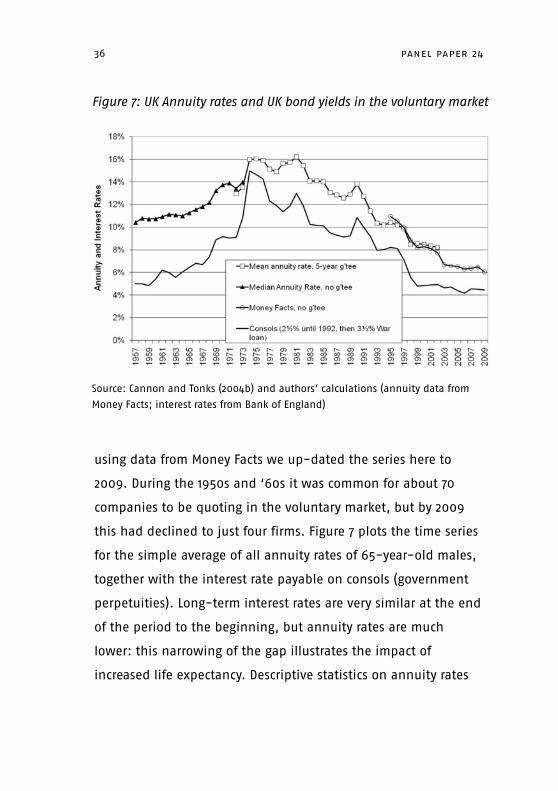
using data from Money Facts we up-dated the series here to
2009. During the 1950s and ‘60s it was common for about 70
companies to be quoting in the voluntary market, but by 2009
this had declined to just four firms. Figure 7 plots the time series
for the simple average of all annuity rates of 65-year-old males,
together with the interest rate payable on consols (government
perpetuities). Long-term interest rates are very similar at the end
of the period to the beginning, but annuity rates are much
lower: this narrowing of the gap illustrates the impact of
increased life expectancy. Descriptive statistics on annuity rates
36 panel paper 24
Figure 7: UK Annuity rates and UK bond yields in the voluntary market
Source: Cannon and Tonks (2004b) and authors’ calculations (annuity data from
Money Facts; interest rates from Bank of England)
in the UK’s voluntary market for males and females aged 65
appear in Panel C of Table 3.
Dutch annuity data were provided by Money View, which is an
organisation collecting annuity rates for price comparisons, (see
http://www.moneyview.nl/). The Dutch annuity market is a
compulsory purchase market.6 Data were provided fortnightly
between 2001-2009 for annuities for males only aged 60 and 65
for purchase prices of €50,000 and €125,000. Before 2002, the
annuity rates were for purchase prices denominated in Dutch
Guilders, with purchase prices of ƒ100,000 and ƒ250,000. Since
the exchange rate was 2.20371, this corresponds to purchase
prices in 2001 of €45,378 and €113,445. Many companies quoted
two prices: an internal price for annuitants who had also saved
their pension fund with the company (called “maatschappij”)
and another external price for annuitants who transferred their
pension fund from another company (called “elders”). Annuity
prices are reported for a total of 32 different named companies
throughout the period—but because some of the companies
merged or changed name, the total number of actual companies
is only 28 (and one of these (Univé) only quoted for a short
period).
We compare the annuity rate to the ten-year Dutch
government bond yield, with data taken from Bloomberg. The
annuity markets 37
6 Brown and Nijman (2011) provide details of the compulsory market for annuities in the Netherlands.
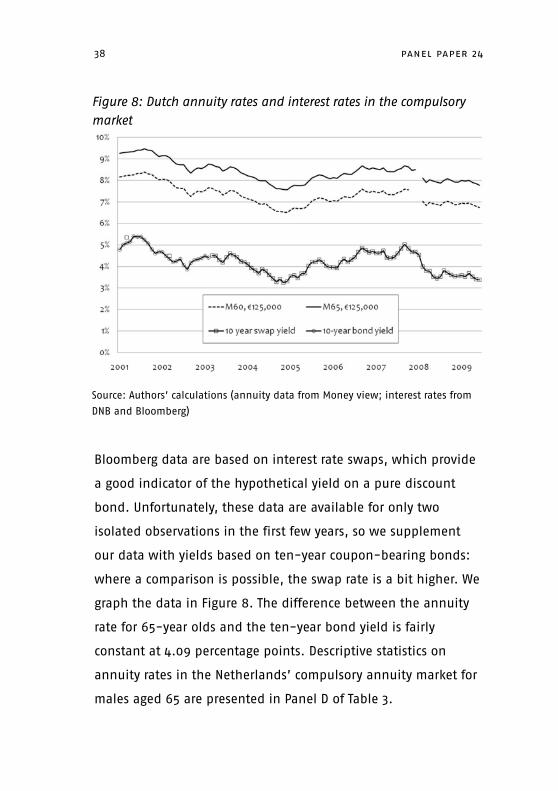
Bloomberg data are based on interest rate swaps, which provide
a good indicator of the hypothetical yield on a pure discount
bond. Unfortunately, these data are available for only two
isolated observations in the first few years, so we supplement
our data with yields based on ten-year coupon-bearing bonds:
where a comparison is possible, the swap rate is a bit higher. We
graph the data in Figure 8. The difference between the annuity
rate for 65-year olds and the ten-year bond yield is fairly
constant at 4.09 percentage points. Descriptive statistics on
annuity rates in the Netherlands’ compulsory annuity market for
males aged 65 are presented in Panel D of Table 3.
38 panel paper 24
Figure 8: Dutch annuity rates and interest rates in the compulsory market
Source: Authors’ calculations (annuity data from Money view; interest rates from
DNB and Bloomberg)

4. Pricing Annuities: Measuring the Money’s Worth
The conventional measure of assessing the value of an annuity is
the money’s worth, which is the ratio of the expected present
value of the payments to the premium paid for it (Brown et al.,
2001). Define the annuity rate A as the annual annuity payment
to be received by an individual as part of the annuity contract
agreed in year t. For a level annuity with no guarantee period,
the expected value of these payments is
,
where is the probability of someone living more periods,
believed in period . Notice that the survival probabilities
depend upon the age, gender and type (compulsory or
voluntary) of annuitant. is chosen so that and
is the appropriate discount rate in period for payments
received in period , expressed at an annual rate: typically
this is the rate on government bonds.7 To calculate EPVt in year t
it is necessary to estimate the yield curve for that year and the
most up-to-date mortality table for the relevant annuitant type
that was available. The choice of mortality table is usually the
most problematic issue, since it involves projecting mortality
annuity markets 39
7 Finkelstein and Poterba (2004) used the return on corporate bonds instead of government bonds. From the data in Figure 7, the difference between yields on UK commercial bank bonds and ten-year government bonds averaged 0.44 percentage points over the period 1994-2009.

improvements into the future. In the UK the Institute of Actuaries
and in the Netherlands the Actuarieel Genootschap and Actuarieel
Instituut collect data and produce projections of mortality tables;
these data were used in our calculations.
These mortality tables are projections of future survival (or
death) probabilities. The Continuous Mortality Investigation
Committee (CMIC) of the UK’s actuarial professional organisations
publishes actuarial projected-life tables for each year, and these
same tables are used internationally, with country-specific
adjustments. The tables differ from life tables for the general
population, and represent the life experience of individuals
40 panel paper 24
Figure 9: Changing Life Expectancy over Time in the UK
PML80 refers to Pensioner Male Lives from the 80 Tables, PML92 Pensioner Male
Lives from the 92 Tables, Pensioner Male Lives from the 92 Tables with short and
long cohort interim adjustments, and Personal Pensioner Males from the 00
Tables using a long cohort interim adjustment.
Source: Authors’ calcuations based on data from the Institute of Actuaries.

purchasing the particular insurance contracts. Figure 9 illustrates
the magnitude of the changes due to revisions to projected
mortality. In 1994, the remaining life expectancy of a 65-year-
old man was forecast to be just over 15 years using the PML80
Table; by 1999, using the PML92 Table, a 65-year-old’s life
expectancy was 17 years and two months; by 2002, it was 19 years
using the short cohort adjustment, and 21 years using the long
cohort adjustment. On a less regular basis, CMIC publishes a
statistical analysis of the data and proposes new standard tables
that include projections of future improvements in mortality. It
has not proved practicable to produce projections based on
causal models of death, and most projections consist of
extrapolations in trends in existing data.8
4.1 Money’s worth: International evidence
An international comparison of money’s worth was first provided
by James and Song (2001), who constructed consistent money’s
worth figures across a number of countries, and a summary of
their results and other country-specific studies are presented in
Table 4. The surprising aspect of this table is that although
annuity payments differ widely across countries, and by gender,
the money’s worth numbers are very similar and very high. This
annuity markets 41
8 The Board of Actuarial Standards (2008) emphasised the fact that there is no consensus on the best type of model to use for projecting future changes in mortality. Pitacco et al., 2009 surveyed recent theoretical advances in projection methods based on time series econometrics and finance theory.

42 panel paper 24
Tabl
e 4:
Sum
mar
y of
Inte
rnat
iona
l Evi
denc
e on
Mon
ey’s
wor
th a
nd S
elec
tion
Eff
ects
in A
nnui
ty M
arke
tsPa
nel
A:
65-y
ear-
old
mal
es

annuity markets 43
Tabl
e 4
(con
tinue
d):
Inte
rnat
iona
l Evi
denc
e on
Mon
ey’s
wor
th a
nd S
elec
tion
Eff
ects
in A
nnui
ty M
arke
tsPa
nel
B:
65-y
ear-
old
fem
ales
The
tabl
e su
mm
aris
es a
ser
ies
of s
tud
ies
that
hav
e ex
amin
ed t
he
mon
ey’s
wor
th o
f d
iffe
ren
t ty
pes
of a
nn
uiti
es in
a n
umbe
r
of c
oun
trie
s, u
sin
g po
pula
tion
(Po
p) a
nd
an
nui
tan
t (A
nn
) lif
e ta
bles
. *
den
otes
62
year
old
fem
ale;
**
den
otes
55
year
old
mal
e an
d f
emal
e. T
he
ann
uita
nt
life
tabl
e is
not
alw
ays
the
life
expe
rien
ce o
f th
e ac
tual
rel
evan
t an
nui
tan
ts,
but
is p
roxi
ed
for
it in
a n
umbe
r of
way
s. C
PA d
enot
es c
ompu
lsor
y pu
rch
ase
ann
uiti
es;
and
PLA
den
otes
vol
unta
ry p
urch
ased
life
an
nui
ties
.

suggests that any dispersion in annuity payments can be
explained by differences in the appropriate discount rates, and
differences in mortality assumptions. Money’s worth values using
annuitant mortality experience are typically around 97 percent in
all categories (except for index-linked). Switzerland appears to
have the highest value-for-money annuities, with money’s
worth above 100 percent. The one category that does feature a
lower money’s worth is indexed-linked annuities, and this
might be explained by the difficulty of matching these promised
payments with index-linked assets, since the supply of such
assets is limited.
Warshawsky (1988) suggested that differences in the money’s
worth calculation from using population life tables and
annuitant life tables is a measure of adverse selection in
annuity markets. Individuals who expect to live for a long time
are more likely to purchase annuities, and the annuity providers
recognise these incentives, and price annuities to incorporate
these adverse selection problems; in the process, however,
annuities are priced relatively high and may exclude from the
annuities market some low-risk (short-lived) individuals.
Table 4 includes money’s worth calculations using the survival
probabilities of both the general population and annuitants,
providing evidence on the extent of selection effects in a number
of international annuity markets for males and females aged 65
years.
44 panel paper 24
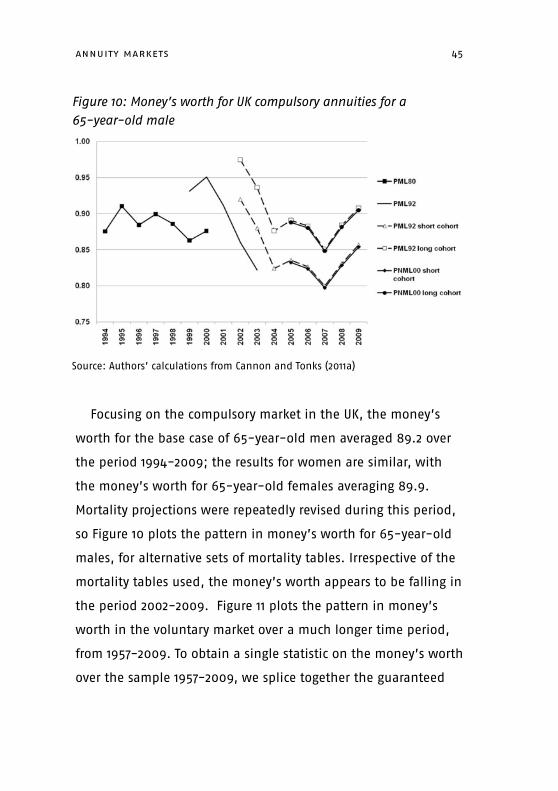
Focusing on the compulsory market in the UK, the money’s
worth for the base case of 65-year-old men averaged 89.2 over
the period 1994-2009; the results for women are similar, with
the money’s worth for 65-year-old females averaging 89.9.
Mortality projections were repeatedly revised during this period,
so Figure 10 plots the pattern in money’s worth for 65-year-old
males, for alternative sets of mortality tables. Irrespective of the
mortality tables used, the money’s worth appears to be falling in
the period 2002-2009. Figure 11 plots the pattern in money’s
worth in the voluntary market over a much longer time period,
from 1957-2009. To obtain a single statistic on the money’s worth
over the sample 1957-2009, we splice together the guaranteed
annuity markets 45
Figure 10: Money’s worth for UK compulsory annuities for a 65-year-old male
Source: Authors’ calculations from Cannon and Tonks (2011a)
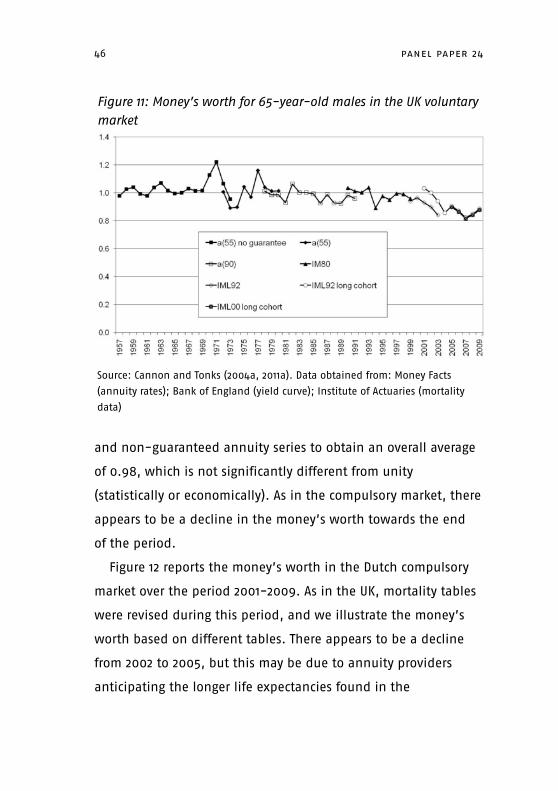
and non-guaranteed annuity series to obtain an overall average
of 0.98, which is not significantly different from unity
(statistically or economically). As in the compulsory market, there
appears to be a decline in the money’s worth towards the end
of the period.
Figure 12 reports the money’s worth in the Dutch compulsory
market over the period 2001-2009. As in the UK, mortality tables
were revised during this period, and we illustrate the money’s
worth based on different tables. There appears to be a decline
from 2002 to 2005, but this may be due to annuity providers
anticipating the longer life expectancies found in the
46 panel paper 24
Figure 11: Money’s worth for 65-year-old males in the UK voluntary market
Source: Cannon and Tonks (2004a, 2011a). Data obtained from: Money Facts
(annuity rates); Bank of England (yield curve); Institute of Actuaries (mortality
data)
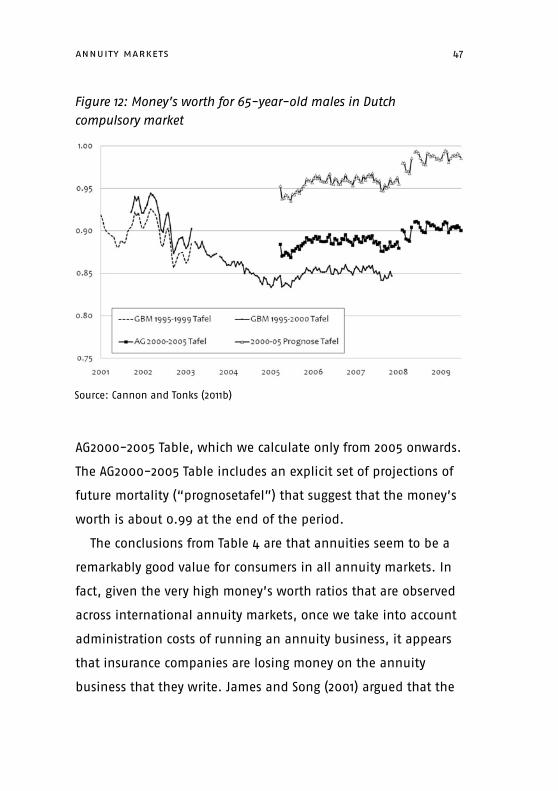
AG2000-2005 Table, which we calculate only from 2005 onwards.
The AG2000-2005 Table includes an explicit set of projections of
future mortality (“prognosetafel”) that suggest that the money’s
worth is about 0.99 at the end of the period.
The conclusions from Table 4 are that annuities seem to be a
remarkably good value for consumers in all annuity markets. In
fact, given the very high money’s worth ratios that are observed
across international annuity markets, once we take into account
administration costs of running an annuity business, it appears
that insurance companies are losing money on the annuity
business that they write. James and Song (2001) argued that the
annuity markets 47
Figure 12: Money’s worth for 65-year-old males in Dutch compulsory market
Source: Cannon and Tonks (2011b)

only way insurance companies can make positive profits is on the
spread between the risk-free rate and the returns on an equity
portfolio: insurance companies invest the annuity premiums
received in a portfolio of risky assets. They then engage in risk-
reducing and risk-shifting strategies to lock in the higher
returns.
4.2 Evaluating the money’s worth
Is the money’s worth good value? Given the presence of
unavoidable transaction costs, we should certainly expect a
money’s worth less than one, but it is difficult to know how
much less than one—as the magnitude of transaction costs is
commercially sensitive information and not revealed by life
insurers. Real annuities have a lower money’s worth, although
this may be because insuring against inflation is more costly for
life insurers. One possible benchmark for the money’s worth of
annuities is the analogous figure for other forms of insurance:
namely, the ratio of the value of claims paid by insurance
companies to the value of premiums received. Using information
provided by the Association of British Insurers for the period
1994-2006, we calculate average figures of 0.79 for motor
insurance, 0.60 for domestic property insurance and 0.57 for
commercial property insurance. These figures are much lower
than for the money’s worth of nominal annuities and
comparable to that for real annuities: except for motor insurance
48 panel paper 24

in 1997 and 1998, the insurance products we consider were
always less of a good value than nominal annuities were.
An alternative benchmark would be other long-term
investment products. James (2000) examined the cost of
investing in a variety of retail investment products in the UK, and
found that to get the market rate of return on £1, a consumer
would have to invest £1.50 in a managed fund, and between
£1.10 and £1.25 in an index tracker. These figures imply a money’s
worth of 0.66 for a managed fund, and less than 0.91 for a
tracker. Again, these figures are comparable or lower than the
money’s worth on annuities. They also suggest that it is during
the accumulation phase—and not in the decumulation phase—
that charges from the insurance companies have a significant
reduction on the effective rate of return.
A final measure of the worth of an annuity would use an
economic model to calibrate the utility gain from the insurance
provided by an annuity, sometimes referred to as annuity
equivalent wealth. Cannon and Tonks (2008) reviewed the
existing literature and provided additional calculations based on
a variety of economic models of consumer behaviour. Their
results suggest that £1 invested in an annuity typically gives the
same utility as between £1.10 and £1.50 in non-annuity form, so
that any annuity with a money’s worth of greater than 0.9
improves utility.
annuity markets 49

5. The Annuity Puzzle
Yaari’s theoretical work suggested that an annuity is the best
way for an individual with uncertain lifetime to obtain a secure
income. However, empirical work by Brown (2001) and Inkmann,
Lopes and Michaelides (2007) determined that annuity markets
are very thin, and of limited size. Brown (2001) analysed the
relationship between the value of an annuity and the
probability of annuity purchase, using a sample of 869
households in 1992 in the US Health and Retirement Study (HRS),
where the head of the household is aged between 51 and 61
years. He used this information to calibrate the annuity
equivalent wealth for each individual household, and compared
the likelihood of the household annuitising their wealth as a
function of four basic characteristics: mortality risk (proxied by
gender), risk aversion (from a series of questions), fraction of
total wealth that is pre-annuitised, and marital status. Brown
(2001) found that differences in annuity equivalent wealth can
partly explain the probability of annuitising balances in DC
pension plans. These results give some comfort to the basic life-
cycle model of savings/consumption behaviour. Inkmann et al.
(2007) examined the determinants of voluntary annuity demand
in the UK, using a sample of 5,233 retired persons from the
English Longitudinal Study of Ageing (ELSA) panel dataset for two
waves: 2002/3 and 2004/05. They found that only 4% of initial
sample voluntarily purchased annuities (5.9% in 2004/2005),
which is confirmation of the annuity puzzle. They found that the
50 panel paper 24

annuity purchase is positively related to stock ownership,
subjective survival probabilities, education, being single and
male, and wealth.
The failure of Yaari’s theory to match the evidence constitutes
the “annuity puzzle”, and Poterba (2001) and Brown (2001)
suggested a number of explanations for under-annuitisation.
The list of suggested reasons is rather long, and some of the
possible causes have more obvious policy implications than
others. This section concentrates on the causes suggesting that
annuitisation may not be optimal; the next section focuses on
reasons that suggest more obvious government intervention,
bearing in mind that the relative importance of different reasons
for low annuitisation is likely to vary between different
countries, due to other institutional factors.
Poor rates of return on annuities (due to administrative costs,
unfair annuity prices or adverse selection) comprise perhaps the
most obvious reason for low annuity demand. However, the
previous section on the money’s worth suggests that this is one
of the less important factors: money’s worth values are high, and
the utility value of insurance exceeds any load factors or
transaction costs.
5.1 Bequest motives
When individuals have a strong bequest motive they may not
wish to annuitise all of their wealth. However, there is
contradictory evidence concerning the relevance of bequests.
annuity markets 51

Research by Bernheim (1991), Laitner and Juster (1996) and
Wilhelm (1996) indicates that individuals consciously leave
wealth to their heirs, whereas Hurd (1997, 1989) and Brown (1999)
suggested that the bequest motive is unimportant. Brown (2001)
assessed the importance of the bequest motive by examining
whether the decision to annuitise is affected by whether the
household in the HRS sample has any children. If the bequest
motive is important, then we would expect to see the decision to
annuitise would be negatively related to the number of children.
In fact, Brown finds there is little relation between the
annuitisation decision and the number of children, which
suggests that bequests are unimportant. In contrast, the
Inkmann et al. (2007) paper suggested that being single increases
the probability of purchasing a voluntary annuity, which is
consistent with bequest motives being relevant.
Rowlinson and McKay (2005) undertook a survey of attitudes
to inheritance in Britain using a nationally representative sample
of 2,000 people. They concluded that although inheritance is
important to most people, it has not become entrenched either
as an expectation or a duty. Most people are willing and intend
to use their assets for themselves, and the bequests are a
residual at the time of death. Overall, there is conflicting
evidence on whether bequests are important or not to
individuals.
52 panel paper 24

5.2 Necessary expenditures in old age
One problem with Yaari’s (1965) model is that it emphasises
longevity risk at the expense of all other forms of risk. Bodie
(1990) claimed that risk in retirement also arises from the
following: the riskiness of social security payments, the riskiness
of investment returns during the accumulation phase and
riskiness in the annuity rate. These risks may turn out to be
equally important to longevity risk.9 Davidoff, Brown and
Diamond (2005) considered the effect of some of these potential
problems and extended their analysis to look at imperfect credit
markets and habit formation. They concluded that it is optimal
to annuitise less than 100 percent of one’s wealth, but that the
optimum is still very high.
Yaari’s (1965) result relied upon either a continuous spot
market where agents can both buy and go short in the annuities
market or a complete choice of annuity instruments including
both temporary and deferred annuities. A typical annuity (i.e. a
stream of payments which is constant in real terms) is
appropriate only if agents actually wish their expenditure to
follow the same pattern (i.e., to be fairly constant over time).
However, elderly people may have substantial lumpy health-
related costs, which would result in the need for non-smooth
consumption paths. Davidoff et al. (2005) discussed formally the
circumstances when conventional bonds will be preferred to
annuity markets 53
9 It is possible that longevity risk (unlike the other risks) can be insured through the extended family (Kotlikoff and Spivak, 1981).
annuities when the only annuity product available is one
providing a constant real stream of income payments. They noted
that there are various instances where consumers will not desire
smooth consumption paths, in which case agents may prefer to
under-annuitise when annuity markets are imperfect (clearly, no
issue arises if markets are perfect). However, in many countries
the most lumpy or largest expenditures (health costs and long-
term care provision) are subsidised or provided by the state, so
sufficient insurance may be available.
If there is inflation uncertainty, and index-linked annuities
are not available, then a level annuity does not insure an
individual against unanticipated high rates of inflation, and
individuals may prefer to invest in other assets that provide a
better hedge against inflation. This is not such a problem in the
UK, where RPI-indexed annuities are well developed, based on a
large market for RPI-linked government bonds. Elsewhere,
inflation-linked bond markets are much smaller.
5.3 The option value of deferral
Annuitisation is a single and irreversible decision. This means
that timing of annuitisation is important, especially if alternative
investment opportunities are available: individuals do not just
choose to consume or save but must also decide how to allocate
their savings (or wealth) between different asset classes. In Yaari
(1965), the choice was simply between investing in a bond and
investing in an actuarial note. Milevsky and Young (2002)
54 panel paper 24

suggested that if a third asset (equity) is available, this may
mean that there is value in deferring annuity purchase. The
intuition for this rests on two simple observations. First, the
mortality risk for people who have just retired is quite low
(typically, only 1 percent), so the value of insuring mortality risk
is actually relatively low at the point of retirement (it rises
thereafter). Second, the expected rate of return on equity is
much higher than can be explained by risk aversion alone: the
equity premium puzzle is well documented both internationally
and historically by Dimson, Marsh and Staunton (2002).
An individual aged 65 has the choice of annuitising
immediately or waiting one more year and annuitising at aged
66. Since the rate of return on a conventional annuity is almost
identical to the rate of return on a bond, and since the equity
premium is observed to be larger than is necessary to
compensate for risk aversion, it follows that the option value of
waiting must be positive and that the agent should wait at least
one year. Furthermore, the same logic will follow for any
individual with a relatively low mortality rate—and therefore it is
worth delaying annuitisation until one is relatively elderly. The
optimal strategy defers annuitisation until the implicit return on
an annuity exceeds the return on equities, when the mortality
drag exceeds the equity premium (Milevsky, 1998), and then it
becomes optimal to annuitise remaining wealth. Using life tables
from the US, Milevsky and Young (2002) find the optimal ages for
annuitising to be 78 for women and 73 for men. These figures are
annuity markets 55

based on a constant relative risk aversion parameter of 2, and
the assumption that the average return on risky assets is 12
percent (and a 20 percent standard deviation), compared with an
implied 6 percent internal rate of return on annuities. It is
noteworthy that although there are gains to be had by delaying,
the chances of doing worse by following this strategy are quite
high.
5.4 Optimal decumulation strategies
In the absence of annuities markets a retired person will have to
decide on a strategy in retirement to run down assets that have
been accumulated during their working life. A number of studies
have shown that the optimal decumulation investment strategy
is highly complex (Blake et al. (2003), Gerrard et al. (2004) and
Blake et al. (2009)). It will depend on factors such as anticipated
investment returns, attitude to risk, life expectancy, health status
and the desire to make bequests.
Blake, Cairns and Dowd (2003) considered three types of
decumulation distribution programs: a purchased life annuity at
65 (PLA), an equity-linked annuity (ELA) with a level annuity
purchased at 75, and an equity-linked income drawdown (ELID)
with a level annuity purchased at 75. They found that for relative
risk aversion coefficients of less than 1.25, the best program is
ELA with 100 percent in equities. For higher risk aversion
coefficients, the ELA still dominates—but with a greater
proportion of the pension fund invested in bonds, until it
56 panel paper 24

eventually approaches the PLA. Blake et al. (2003) suggested
that at higher levels of risk aversion an individual would
annuitise earlier. An interesting question is how risk aversion
changes along the life cycle. In the standard life cycle model,
Samuelson (1969, 1989) found that it is optimal to invest a
fraction of wealth in risky assets that are independent of age.
This is a counter-intuitive result, and many pension products
have a “lifecycle” asset allocation [Blake et al. (2006)]. There are
a number of ways around this surprising result, including
endogenous labour supply, mean reversion, but also changing
degrees of risk aversion along the life cycle. In experimental
work, Barsky et al. (1997) found for a sample of ‘over-50s’ that
the relation between relative risk aversion and age has an
inverse U-shape; whereas Guiso and Paiella (2001) found a
positive relation between risk aversion and age. Powell and Ansic
(1997), Jianakoplos and Bernasek (1998), and Schubert et al.
(1999) all found that women are more risk averse than men in a
number of financial decision-making contexts. Haleck and
Eisenhauer (2001) found greater relative risk aversion for women
and the elderly. Riley and Chow (1992) found that relative risk
aversion decreases with age up to 65, but they then found
greater relative risk aversion for the elderly.
As shown above, the optimal strategy might not involve the
immediate purchase of an annuity at retirement, especially if
risk aversion is low or the desire to make a bequest is high. In
this case, the optimal strategy is income drawdown. Another
annuity markets 57

strategy is to annuitise gradually. Although the studies cited here
considered optimal investment strategies at high ages, they did
not take into account the cognitive problems that elderly people
can face when dealing with investments. As FSA rules recognise,
drawdown products are risky, and are only suitable for relatively
wealthy individuals.10
5.5 Habit formation and other utility functions
We already discussed the fact that annuitisation makes
individuals better off by shifting their budget constraint out, so
that the specific functional form of their preferences does not
affect the Yaari (1967) result that full annuitisation is optimal
when annuity markets are perfect. Davidoff et al. (2005)
examined this further by considering a more general functional
form, and Cannon and Tonks (2008) and Horneff, Maurer and
Stamos (2008) extended this to Epstein-Zin preferences. Whereas
these simulations all suggest that the rational amount of
annuitisation is very high, they take no account of the issues of
health care and welfare payments raised above.
58 panel paper 24
10 The FSA MoneyMadeClear Guidelines on Income Withdrawal (January 2009) and the latest FSA guide to pension annuities and pension fund withdrawal emphasise that “Income withdrawal plans are complex and not suitable for everyone, for example if you have a small pension fund and no other assets or income to fall back on” (April, 2010). Earlier versions of the FSA guides to pension annuities recommended that “Income withdrawal involves extra costs and extra investment risk compared with buying an annuity straight away. For this reason, it is usually suitable only if you have a pension fund of over £100,000 (after taking any lump sum) or you have other assets and sources of income to fall back on” (January, 2004).

6. Failure in Demand for Annuities and Policy Implications
The previous section reviewed several reasons why it may be
appropriate for individuals to avoid annuitisation, and implies
no need for any policy interventions, since the original welfare
benefits of annuitisation did not allow for these factors. This
section considers additional reasons for the annuity puzzle,
which do have policy implications. First, it may be irrational not
to annuitise, so we review the evidence for irrationality, and
suggest a number of behavioural explanations for annuity
aversion. A related reason is that the elderly population, in
particular, may have cognitive difficulties in managing their
financial affairs. Second, while it may be rational for an
individual to avoid annuitisation, it might not be socially
optimal, because avoidance is a form of moral hazard. Most
developed countries have systems of social welfare payments
that may be claimed by individuals on low incomes. Individuals
may then have an incentive to run down their retirement capital
in order to be eligible for social welfare payments. These
explanations for the annuity puzzle provide two independent
motives for compelling individuals to annuitise.
6.1 Behavioural factors
The discussion so far has assumed that agents are rational
utility-maximising agents with risk-averse preferences. Recently,
economists have become aware that these assumptions may be
inadequate descriptions of actual behaviour, and current
annuity markets 59
research is more devoted to the insights that can be learned from
economic psychology (Rabin, 1998). Much of this research
suggests that actual behaviour is frequently irrational and that
departures from rationality are both consistent across a range of
behaviours and reliably correlated with other factors. Some
recent work on behavioural economics and pension provision
has been collected in Mitchell and Utkus (2004).
Framing Effects occur when individuals’ behaviour depends
not upon the choices available but upon the way in which they
are presented. An example is the difference between DB and DC
schemes. Members of DB schemes who receive a pension and a
tax-free lump sum do not lobby to be given their entire pension
benefits as a lump sum, but members of DC schemes who are
required to annuitise their pension fund do appear to resent the
annuitisation requirement. Again this is not a pure framing
effect, but it does appear that being given explicit information
about the size of the pension fund biases individuals from
wanting a pension. This clearly relates to our discussion of how
to characterise reference or endowment points under the
heading of loss-aversion.
The Pension Research Forum (2004) found evidence of a pure
framing effect when purchasing different types of annuity. In a
sample of about 5,000 workers in large corporations,
respondents were asked whether at age 65 they would prefer an
annuity that paid a constant £7,000 per year or one that was
initially £4,900, but rose in line with inflation. The sample was
60 panel paper 24

split into two parts: both groups received exactly the same
textual question, but one group (Group A) was shown a table of
numbers and the other (Group B) a graph. Of the group that was
shown the table, 65 percent chose the level annuity and 26
percent the inflation-linked, whereas of those shown the graph
the figures were 48 percent and 41 percent, respectively. These
annuity markets 61
Group A
Age Level Annuity Inflation-linked annuity65 7,000 4,900
70 7,000 5,500
75 7,000 6,300
80 7,000 7,100
85 7,000 8,000
90 7,000 9,000
95 7,000 10,300
100 7,000 11,600
Group B

discrepancies are due to visual impact that the different forms
of presentation have.
Other framing effects occur when the range of options is
increased. For example, the choice between two options, A and
B, may be affected by whether a third option C is also available.
The Pensions Commission (2004) cited the Benartzi and Thaler
(2001) result that the percentage that people invest in equity is
determined by the proportion of equity funds in the choice set.
Another possibility is that people prefer to avoid extremes: while
agents may choose A over B (and A may be objectively superior to
B), if an alternative C is added so that B is intermediate between
A and C, then the most likely choice is B, because it is more
“average”. The number of choices also matters with a greater
variety leading to more confusion, potential worry and greater
likelihood of avoiding any decision at all.11
Overconfidence is often cited as a possible reason for peculiar
forms of behaviour among professional investors, especially
during times of bubbles. Individuals systematically overestimate
their own individual ability: even professionals who believe in
the efficient markets hypothesis also believe that they will
(uniquely) be able to beat the market. Among pensioners who
wish to control their own pension funds rather than hand them
62 panel paper 24
11 Schwartz (2003) argued that agents would be happier at the point of decision if they had fewer choices and attempted merely to satisfice (i.e. aim for some easily achievable target level of utility) rather than maximise (i.e., aim for the maximum possible level of utility); in addition, the presence of fewer choices would lead to less delay in decision making.

over to an insurance company, this could be a major barrier to
annuitisation.
6.2 Cognitive problems of the elderly
This section extends the idea brought up in the previous section,
that individuals might be irrational, to consider the possibility
that the elderly are particularly vulnerable or that there might be
problems in selling financial products.
Recently, there have been a number of examples of ‘mis-
selling’ in the UK financial services industry. Three important
examples involved mortgage endowments and pensions mis-
selling (Financial Services Authority, 2000, 2002)12 and the sale of
payment protection insurance.13 The scale of the pensions mis-
selling was enormous: "Offers (in relation to pensions mis-selling
between 1988-1994) have been made to over one million
consumers amounting to nearly £9 billion" (Financial Services
Authority, 2002). The FSA took disciplinary action against 345
firms, which involved fines amounting to £9,507,250. The
pensions mis-selling did not end in 1994. As late as 2008, the
annuity markets 63
12 The personal pensions mis-selling scandal took place between 29 April 1988 and 30 June 1994. Individuals who would have been financially better off at retirement in their employer’s pension scheme were advised to leave their employer’s scheme and transfer their pension benefits to a personal pension plan instead.
13 The court case by the FSA was announced (20 May 2011) as we wrote the final draft of this report. Current estimates in the UK press suggest that the total cost in compensation payments will be about £9 billion.
FSA was forced to announce, "The FSA is taking action to improve
the quality of advice given to customers to switch into a personal
pension or self-invested personal pension (SIPP), following a
review which found variable standards across a sample of 30
firms" (Financial Services Authority press release, 5 December
2008). This followed an FSA review, which found that 16 percent
of 500 transfers into a new SIPP constituted poor advice.
A key point about the above mis-selling cases is that the
people involved were still in work and many of them were
relatively young. They could, therefore, have been expected to be
relatively financially aware of the implications of the decisions
they were being persuaded to take. But clearly this was not the
case. An FSA (2006) survey of financial capability found that in a
financial literacy quiz, the under-40s performed worse than
their elders, but that the over-70s performed worst of all age
groups. The problem is compounded when it involves elderly
people who are unable to return to work in order to rectify the
financial consequences of any mistakes they make. Older adults
with cognitive impairment are particularly prone to financial
abuse, and may be more susceptible to the influence of family
members and third parties (Reed, 2005; Lee and Eaton, 2009).
Banks (2010) discussed the issues in financial literacy and
financial outcomes particularly at older ages. Jappelli (2010),
presenting an international comparison of economic literacy,
found that there is substantial heterogeneity of financial
competence across countries. Cannon and Tonks (2008) noted
64 panel paper 24

that the unpopularity of annuities may relate to a lack of
understanding of the annuitisation process. Overman and
Stoudemire (1988) found that older adults can lose the capacity
to manage their financial affairs effectively as their cognitive
abilities decline. Financial decision making is a cognitively
complex activity that comprises a broad range of conceptual,
pragmatic, and judgmental abilities important to the
independent functioning of older adults (Marson, Sawrie et al.,
2000) and may be particularly vulnerable to dementia and
cognitive decline (Willis, 1996). Agarwal et al. (2009) examined
the effect that cognitive impairment had on financial decision
making and found that the susceptibility to dementia doubles
every five years after age 60. They discovered that around 50
percent of people in their 80s experienced significant cognitive
impairment (including dementia)—and this prevented them from
making sensible financial decisions.
Older adults also show a marked decline in “numeracy”, the
quantitative skill necessary to understand the meaning of
numerical information such as percentages and probabilities
(Donelle, Hoffman-Goetz and Arocha, 2007). This means that
older people have considerable difficulty with comprehending
even simple measures of risk. For example, when invited to say
which of the following involved the greatest risk of getting a
disease, 1 in 10, 1 in 100 or 1 in 1000, 29 percent of a sample of
65-94 year-olds gave an incorrect answer (Peters, 2008). Older
adults with cognitive problems often have difficulties paying bills
annuity markets 65

and handling basic financial tasks, (Overman and Stoudemire,
1988) and are at risk of making decisions that endanger assets
needed for their own long-term care or intended for distribution
to family members (Spar and Garb, 1992)
As an illustration of the confusion that people can face when
making annuity decisions, consider the framing study of Brown
et al. (2008). The study involved 1300 people over the age of 50
who were asked to select between one of two choices designed
to have the same actuarial value:
• an annuity paying $650 a month for life
• a savings account containing $100,000 and paying 4 percent
interest.
Half of the sample of participants in the study were offered the
two options in a “consumption” frame in which the annuity was
explained as a vehicle for providing a secure income of $650 a
month for life. Around 70 percent of this subsample chose the
annuity. The other half were offered the two choices in an
“investment” frame in which the annuity was explained as an
investment generating a return of $650 a month. Just 21 percent
of the second subsample chose the annuity. This is because the
annuity now appeared to be a risky investment, since it would
be lost if the individual died early: the option of having the
$100,000 “invested” in the savings account was now interpreted
as a much safer investment, even though the savings account
will not hedge an individual’s longevity risk.
66 panel paper 24

6.3 Social welfare payments
The standard optimisation problem at retirement is the
allocation of a stock of wealth to finance consumption over
several periods. In practice, virtually nobody faces this choice,
since most elderly people receive some form of income, often in
the form of state pensions or welfare payments (and some
individuals have occupational pensions).
Whether described as pensions or not, any welfare provision is
itself a form of annuity since it is paid while the agent is alive,
thereby insuring against longevity risk. So the choice facing most
individuals is how much additional lump-sum wealth to
annuitise, given the value of their pre-annuitised wealth. Under
most reasonable assumptions the marginal utility from
annuitising each extra pound of wealth is diminishing. This
means that the gains from purchasing an additional annuity
might be relatively small. Quantitatively, the amount of pre-
annuitised wealth is important: in the UK, the Pensions
Commission (2004: 210) reported that only those individuals
whose labour income exceeds about £25,000 have a significant
amount of their total wealth in assets other than their state
annuity markets 67

pension.14 Bütler, Peijnenberg and Staubli (2011) quantified the
effect of state benefits on annuitisation for Switzerland.
It is important to remember that at the point of retirement a
large part of an individual’s wealth may have been accumulated
due to tax privileges, since pension saving is often tax-exempt.
The reason for providing tax exemptions is precisely so that the
pensioner will not fall back upon the state for additional welfare
payments. In the UK, this has been seen as the rationale for
making it compulsory to purchase an annuity—although this
only applies to pension wealth, and 25% can be taken as a tax-
free lump sum.
The debate over compulsory annuitisation has a long history
in the UK.15 Hannah, (1986, p.115) noted that at the turn of the
last century, occupational pensions in the UK varied widely in
whether they paid a pension as a lump sum or as an annuity.
There were arguments that suggested a lump sum would ease
the progression from working to retirement (consumption
smoothing), but against this was the concern that a lump sum
68 panel paper 24
14 These figures were confirmed by Banks, Emmerson, Oldfield and Tetlow (2005); Banks, Blundell and Smith (2003) provided a US-UK comparison. Attanasio and Emerson (2003: 827) reported that 60% or people in the British Retirement Survey have financial wealth less than £3,000. Of course, many individuals hold additional wealth in their house, which is not annuitised wealth, but does insure against other forms of risk (such as inflation).
15 In the US, President Obama has raised the issue of compulsion and there are proposals and pilots; see http://www.annuitydigest.com/forum/compulsory-annuitisation and http://www.annuitydigest.com/news/annuities-401k-plans-under-consideration-obama-administration

would be flitted away. The Radley Commission on the Civil
Service said in 1888 “The payment … of a lump sum is open to
the obvious objection that in the event of improvidence or
misfortune in the use of it, the retired public servant may be
reduced to circumstances which might lead to his being an
applicant for public or private charity”. Under the Finance Act
1921 (¶ 32), superannuation funds (occupational pension funds)
were allowed exemption from any income tax on their
investment income. The definition of a superannuation fund was
clarified (¶ 32 (3)b) as “has for its sole purpose the provision of
annuities for persons employed in the trade”. This Act introduced
the principal that exemption from income tax during the
accumulation of the pension was linked to the provision of an
annuity at retirement. When the Finance Act 1956 introduced
tax-exempt DC pensions for the self-employed, this same
principal was upheld (¶ 22), with individuals required to
annuitise their pensions wealth between the ages of 60 and 70.
The Finance Act 1976 extended this upper age limit to 75.
The Retirement Income Working Party (Blake and Hudson,
2000) suggested that, given the unpopularity of compulsory
annuitisation, it should only be necessary to require individuals
to annuitise up to a Minimum Retirement Income. As part of its
proposals to relax the compulsory annuitisation requirement, HM
Treasury (2010a, 2010b) have set the Minimum Income
Requirement (MIR) at £20,000 to ensure that a pensioner does
not “exhaust their pension savings prematurely and
annuity markets 69
subsequently fall back on the state” (2010a, ¶ 3.2). This
calculation was based on assumptions about the future growth
of state pensions and means-tested benefits. Blake, Cannon and
Tonks (2010) discussed a variety of issues in how to calculate the
MIR based on the original proposal that pensioners would have
to buy a real annuity (that is, inflation indexed).
The key issue in the UK context is that pensions and benefits
are currently indexed to the minimum of inflation or earnings—
which means that the MIR must be set at a high level to ensure
that a pensioner does not receive benefits in the future. The
simple rule used is that a pensioner buying an annuity should
not be unlikely to receive benefits until they are 100 years old.
The probability of a 65-year old man living to be more than 100
is currently projected to be 8 percent, and the probability of a
65-year old woman living to 100 is currently projected to be 26
percent: there is an 8 percent probability that the woman could
live to 107. Blake, Cannon and Tonks (2010) showed that there is
both considerable uncertainty about the future of welfare
payments and considerable chance that the government will
have to make more welfare payments than currently anticipated.
6.4 Compulsory annuitisation
The previous discussion suggests that there are a number of
arguments in favour of compulsory annuitisation. First, annuities
insure against longevity risk, and ensure that retirement income
is maximised. These welfare benefits mean that it is in people’s
70 panel paper 24

best interests to annuitise, and if people will not do this
voluntarily for whatever reason (the annuity puzzle), the state
takes a paternalistic approach and requires compulsory
annuitisation. Second, tax relief is given on pension
contributions into the pension fund during the accumulation
phase (and on investment income generated), with the aim of
ensuring that the individual has a pension in old age—and that
compulsion is the quid pro quo of this arrangement. Third,
market failures of moral hazard and adverse selection can be
overcome by compulsion to annuitise. In the absence of the
annuitisation requirement, individuals may deliberately run
down their pension wealth and then claim means-tested state
benefits (moral hazard or “Double-dipping”).
It has long been recognised that there are selection effects in
annuity markets (Economist, 1954 (p. 554); Shalijean, 1957;
Poterba, 2001), leading to the problem of adverse selection.
Individuals who expect to live for a long time are more likely to
purchase annuities, and annuity providers recognise these
incentives, and price annuities to incorporate any selection
problems in a pooled equilibrium in which the low-risk (short-
lived) individuals cross-subsidise their high-risk (long-lived)
counterparts. In doing so, annuities are priced relatively highly
and may exclude from the annuities market some very low-risk
(short-lived) individuals (Abel, 1986; Eckstein, Eichenbaum, and
Peled, 1985). However, these selection effects may be passive
rather than active (Finkelstein and Poterba, 2002). Active (or
annuity markets 71

adverse) selection occurs when annuitants purchase annuities
because they have private information on their life expectancy
that is not available to the insurance company. In contrast,
passive selection reflects the characteristics and preferences of
people who purchase annuities being different from the general
population—and long life expectancy may be correlated with the
underlying characteristics. For example, people who purchase
annuities tend to be relatively wealthy, and Attanasio and
Emmerson (2003) found that wealth is correlated with life
expectancy.
72 panel paper 24

7. Further Policy Issues
7.1 Risk management and supply of government bonds
Interest rate risk is the risk that interest rates will change,
rendering the present value of the assets less than the present
value of the liabilities. Insurance companies may avoid this risk
by exactly matching the profile of the assets with the profile of
the liabilities. In practice, insurance companies use a
combination of existing long-, medium- and short-term
government bonds, as well as other financial instruments
(including swaps and other derivatives) to immunise the
portfolio of liabilities against interest rate risk.
Data from the FSA insurance returns show how annuity
providers manage their annuity liabilities, illustrated in Figure 13.
The most important asset class is long-dated government bonds.
When the yield curve slopes up (as it usually does), then life
insurers can take advantage of the higher yields on longer dated
debt. Other important asset classes are commercial bonds and
commercial mortgages. When valuing these assets, companies
are required to make explicit risk adjustments in the FSA returns,
and it is clear that the regulator effectively prevents life insurers
from investing in risky assets. Figure 13 shows that the mixture
of government and corporate bonds has shifted over time: in
1985, life insurance companies held five times as many
government bonds as corporate bonds; by 2005, this ratio was
almost one—although over most of the sample (1989 to 2004) the
annuity markets 73
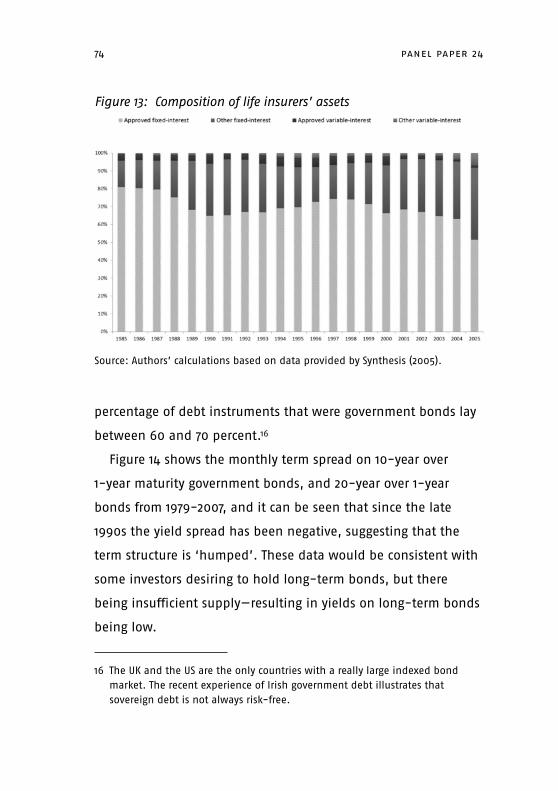
percentage of debt instruments that were government bonds lay
between 60 and 70 percent.16
Figure 14 shows the monthly term spread on 10-year over
1-year maturity government bonds, and 20-year over 1-year
bonds from 1979-2007, and it can be seen that since the late
1990s the yield spread has been negative, suggesting that the
term structure is ‘humped’. These data would be consistent with
some investors desiring to hold long-term bonds, but there
being insufficient supply—resulting in yields on long-term bonds
being low.
74 panel paper 24
16 The UK and the US are the only countries with a really large indexed bond market. The recent experience of Irish government debt illustrates that sovereign debt is not always risk-free.
Figure 13: Composition of life insurers’ assets
Source: Authors’ calculations based on data provided by Synthesis (2005).
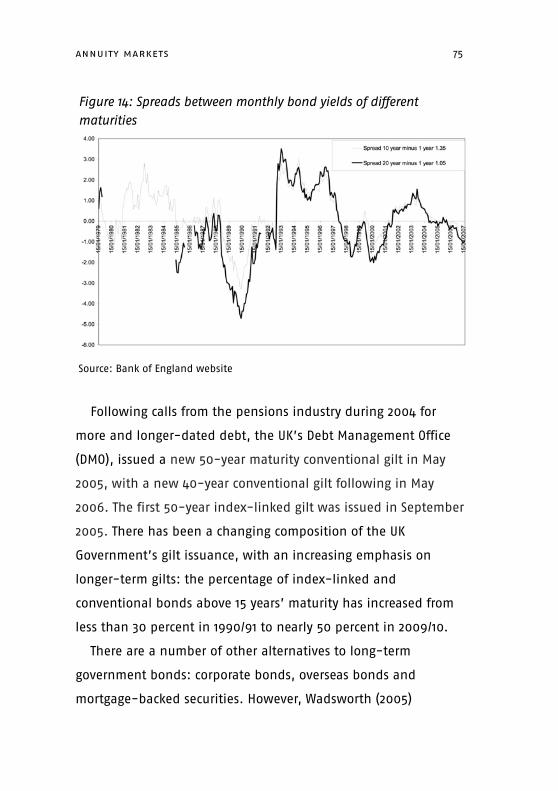
Following calls from the pensions industry during 2004 for
more and longer-dated debt, the UK’s Debt Management Office
(DMO), issued a new 50-year maturity conventional gilt in May
2005, with a new 40-year conventional gilt following in May
2006. The first 50-year index-linked gilt was issued in September
2005. There has been a changing composition of the UK
Government’s gilt issuance, with an increasing emphasis on
longer-term gilts: the percentage of index-linked and
conventional bonds above 15 years’ maturity has increased from
less than 30 percent in 1990/91 to nearly 50 percent in 2009/10.
There are a number of other alternatives to long-term
government bonds: corporate bonds, overseas bonds and
mortgage-backed securities. However, Wadsworth (2005)
annuity markets 75
Figure 14: Spreads between monthly bond yields of different maturities
Source: Bank of England website
reported on a survey by Watson Wyatt of company treasurers,
which finds there is no general desire by company treasurers to
issue long-term index-linked bonds. Specific sectors, such as the
utility industries, have issued long-term index-linked bonds. In
February 2006, United Utilities Water plc issued £50 million of
40-year index-linked bonds, and predicted that other utility
companies would follow suit, depending on the regulators’
response to utilities taking advantage of low long-term yields.17
Overseas bonds carry currency risk, and sometimes they are not
even available. For example, one of the largest potential issuers,
the US Treasury, stopped issuing bonds dated more than ten
years in 2001 (Bank for International Settlements, 2001).
Elsewhere in the Eurozone, government bond issues are also
more frequent in the short- and medium segment. European
governments do issue some long-term issues, but they constitute
a limited share of total issuance. According to Holmans, Karley
and Whitehead (2003), strong growth has taken place in the
securitization of mortgages since 1998. However, a potential
problem with mortgages as an asset for insurance companies is
that most UK residential mortgages are variable interest, with the
holder of the mortgage suffering the potential of prepayment
risk when interest rates fall.
The Pensions Commission (2005) suggested that the projected
demand for annuities in the UK might be constrained by the
76 panel paper 24
17 OFWAT/OFGEM (2006) issued a consultation paper concerning the financing of UK network utilities.

capacity of the annuity supply, and in particular with the
development of markets to pool longevity risk. The Pensions
Commission (2004) distinguished between different types of
longevity risk. First, ‘Specific longevity risk post-retirement’
relates to an individual at retirement who does not know his
exact length of life. Second, ‘average cohort longevity risk post-
retirement’ relates to the uncertainty as to the length of life of
the cohort of persons retiring. These first two risks are typically
absorbed by the pension provider, whether a DB pension scheme
or an annuity provider for DC schemes. Insurance companies
efficiently insure individuals against this first type of
idiosyncratic risk, but also bear the average cohort risk of mis-
predicting the overall position of the distribution. An important
question is who bears this cohort longevity risk.18
The standard risk-management technique is for the insurance
company to invest annuity premiums in an asset that matches
the properties of the liabilities: asset-liability management. The
trick is to identify assets with the same properties as the
liabilities. Insurance companies operate an annuity portfolio,
and given the characteristics of the annuitants in the portfolio,
annuity markets 77
18 A third type of longevity risk is ‘Long-term average longevity risks pre-retirement’, which relates to the fact that projections of life expectancy for the current employed who will retire in the future are very uncertain. In the case of DB schemes, this risk is borne by the DB providers and by the government when they agree to a pension contract that will apply to the current working population. In DC schemes, however, individuals bear this risk through changing annuity rates.
are able to estimate the likely future annuity payouts from the
portfolio. Prudential risk management dictates that the insurer
will invest the pool of annuity premium proceeds in assets
whose payouts and risk profile closely match the pool of
expected future annuity payouts in order to minimise the risk to
the insurance company that it will not be able to fund the
annuity contract. An ideal matching asset would be a longevity
bond (Blake, 1999; Blake and Burrows, 2001). In the absence of
such a matching asset, the annuity provider may choose to re-
insure these longevity risks (Borsch, 1962), or securitize them
through issuing mortality bonds (Lin and Cox, 2005; Cox and Lin,
2007) or mortality swaps (Lin and Cox, 2005; Blake, Cairns and
Dowd, 2006).
If the government is unwilling to underwrite this cohort
longevity risk through issuing longevity bonds, or if neither re-
insurers nor individual investors are willing to bear this cohort
longevity risk, then the only people who can bear this risk are
the pensioners themselves. This could be achieved either by
premiums rising to the point where re-insurers or investors are
willing to enter the market, or by annuity payments being linked
to cohort mortality. The latter solution involves pensioners
receiving annuity payments that are dependent upon cohort
survival rates, so that annuities only insure the annuitants
against their idiosyncratic mortality risk and not the cohort
mortality risk (Piggot, Valdez and Detzel, 2005; Valdez, Piggott
and Wang, 2006; Stamos, 2008)
78 panel paper 24
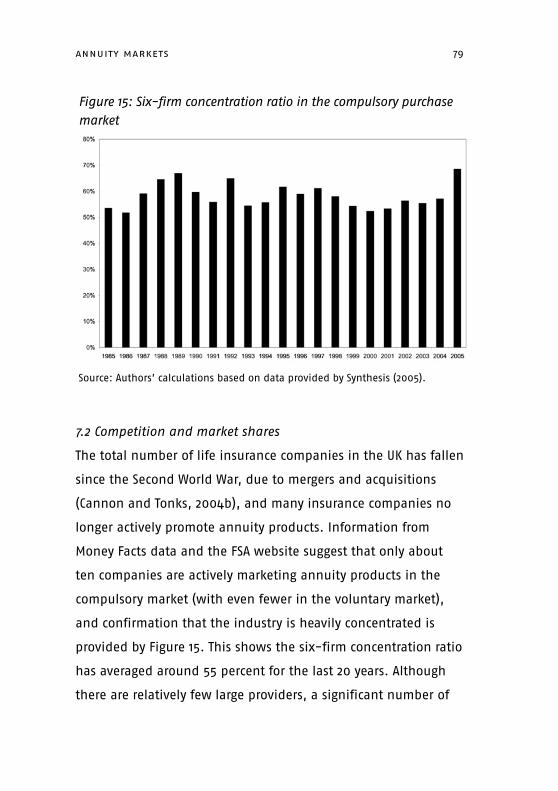
7.2 Competition and market shares
The total number of life insurance companies in the UK has fallen
since the Second World War, due to mergers and acquisitions
(Cannon and Tonks, 2004b), and many insurance companies no
longer actively promote annuity products. Information from
Money Facts data and the FSA website suggest that only about
ten companies are actively marketing annuity products in the
compulsory market (with even fewer in the voluntary market),
and confirmation that the industry is heavily concentrated is
provided by Figure 15. This shows the six-firm concentration ratio
has averaged around 55 percent for the last 20 years. Although
there are relatively few large providers, a significant number of
annuity markets 79
Figure 15: Six-firm concentration ratio in the compulsory purchase market
Source: Authors’ calculations based on data provided by Synthesis (2005).

potential entrants are present, as there are many firms who still
sell small numbers of annuities and could presumably expand
their operations fairly quickly if they thought it profitable to do
so. The FSA comparative tables provide information on annuity
rates in the compulsory market, which enables consumers to find
the best prices. So, although the small number of annuity
providers is a potential cause for concern, there is no evidence
that it is a cause of the low money’s worth.
7.3 Insurance regulation and Solvency II
Standard welfare economics suggests that industries are
candidates for regulation under several circumstances: first, if
there is abuse of market power; second, if there are externalities
in the market; third, if there is asymmetric information; and
fourth, if consumers are not fully rational As Davis (2004) noted,
the supply of annuities is heavily regulated, because in annuity
markets around the world all of these situations are likely to
apply. As Figure 15 illustrates for the UK, and as reported in
Cardinale, Findlater and Orszag (2002) for other countries, the
annuity industry is highly concentrated. Even if there is no
evidence of market power affecting prices, some life insurers
may be “too big to fail”, and so the government must be worried
about the solvency of individual companies. The Equitable Life
case illustrates that assumptions made by one annuity supplier
can impact the rest of the industry. We have previously discussed
selection effects and information asymmetries in annuity
80 panel paper 24

markets. Annuities are complex financial products, the
characteristics of which are not easily understood by consumers,
so that like ‘treatment goods’, it is only long after the event of
purchase (approximately, if the annuitant lives for longer than
his or her life expectancy) that annuitants appreciate the
benefit of an annuity product. Annuity markets appear to satisfy
each of these criteria for regulation.
Life insurers in the UK are regulated by the Financial Services
Authority (FSA), which incorporates the EU Life Directives for the
insurance industry. Prudential requirements are at the basis of
insurance regulation; the regulations require insurance
companies to have sufficient financial resources to provide for
their liabilities. The FSA’s General Prudential Sourcebook
implements the minimum EU standards for the capital resources
required to be held by an insurer undertaking business that falls
within the scope of the Consolidated Life Directive (2002/83/EC),
the Reinsurance Directive (2005/68/EC) or the First Non-Life
Directive (1973/239/EEC) as amended. In 2007, these EU Life
Directives set the base capital at €3.2 million, and the percentage
of capital that must be set against technical reserves to cover four
risk components: death risks (0.3 percent); expense risks (1
percent); market risks (3 percent) and health risks. In the case of
annuities, there are no death risks or health risks, and so the
amount of capital set aside to cover liabilities is a total of 4
percent of the mathematical reserves. Booth et al. (2005)
provided a summary of the general principles and purposes of
annuity markets 81
the provision of technical reserves (i.e., liabilities) for insurance
products.
The EU has announced changes to insurance regulation
enshrined in ‘Solvency II’, which will take effect in November
2012. Solvency II is intended to apply to the insurance industry
the risk-sensitive regulatory approach adopted in the Basel-2
reforms for the banking industry. There are three regulatory
pillars. The first consists of risk-responsive capital requirements;
the second pillar represents additional capital requirements
imposed by the regulator following individual company risk
assessments; the third pillar relates to disclosures to ensure that
market disciplines can operate.
As illustrated in Figure 13, annuity providers typically back
annuities with a mixture of safe government bonds and riskier
(but higher yielding) corporate bonds. Under Solvency II, annuity
providers will be required to hold additional funds to cover these
risks (see Telford, 2010). In anticipation of these changes, the FSA
has proceeded with its own risk-based solvency requirements
(FSA 2003, 2005). This new regime is likely to have increased the
regulatory cost associated with providing annuities, by imposing
higher levels of regulatory capital on annuity providers. An
additional incentive came directly from the regulator. In April
2007, the FSA sent a ‘Dear CEO’ letter to chief executives of
annuity providers, reflecting on the debate over future
annuitant longevity improvements. The letter recognised that
companies would usually make assumptions based on their own
82 panel paper 24

mortality experiences: “However, if this is not possible we would
expect firms to consider the different industry views in this area
and to err on the side of caution” (FSA Dear CEO letter, April
2007). In other words, annuity providers, according to the
regulator, should price annuities conservatively to reflect the risk
of mortality improvements.
7.4 Impaired lives and selection effects
It is possible to buy ‘enhanced’ annuities or annuities on
‘impaired lives’. These offer better rates to smokers or to
individuals with health problems such as diabetes. Since the
annuity rate offered depends upon the circumstances of the
individual, these are often sold through specialist brokers. These
annuities form an increasingly large part of the market. A
consequence of this is that the remaining annuities sold are
increasingly sold only to relatively healthy individuals.
According to Quinton (2003), there was a 23 percent increase in
the impaired life market between 2001 and 2002. In 2005, the
Synthesis database reported that of £8.5 billion sales of CPA
annuities in the UK, only £386 million (4.5 percent) were
impaired life. This growth in the impaired-life market would
have resulted in the remaining annuitants in the conventional
market having higher average life expectancy, which would mean
that life insurers would have to lower annuity rates to remain
profitable. Our estimates of money’s worth above make no
allowance for any growth in the impaired-life market, since the
annuity markets 83

life tables that we use are unable to distinguish between
impaired and non-impaired lives. This means that our money’s
worth calculations would be based on annuitants systematically
different from those buying in the non-impaired market, biasing
our results downwards.
Traditionally, the only health-related predictors of longevity
risks used to price annuity contracts have been age and gender,
although annuity providers do have information on causes of
death of annuitants (CMI, 2009). More recent developments in
annuity provision have, however, incorporated a wider range of
medical markers correlated with longevity risk (Telford, 2010). For
example, from 2007, some life insurers also started to price
annuities based on the annuitant’s address (postcode), since this
is a good predictor of life expectancy and the variations by
location are large (up to ten years). The largest companies now
price annuities on this basis. Other examples include the
following: lifestyle (the simplest example is the Smoker annuity);
enhanced markers (blood pressure, cholesterol); and impaired
life (Diabetes). These trends presage the development of ‘full’
medical underwriting of longevity risk, with extensive
questionnaires including disease or condition-specific
extensions. Cannon and Tonks (2008) distinguish between time-
series models and causal models for forecasting longevity. Girosi
and King (2008) suggested that using a wide range of social,
behavioural and medical factors to forecast mortalities could
improve forecasting accuracy, leading to reduced uncertainty
84 panel paper 24

about mortality projections, and allowing life insurance
companies to hold less regulatory capital—which is becoming
increasingly important in light of the proposed Solvency-II
regulations (FSA, 2008).
More accurate pricing will affect life insurers’ aptitude for risk,
and hence the supply of annuities. An interesting feature of such
separating equilibria is that annuitants with long life expectancy
(generally, the more wealthy) will face higher annuity prices than
those with lower life expectancy (generally, the less well-off). In
contrast to a pooled equilibrium in which the poor cross-
subsidise the rich, the separating equilibria will represent a
transfer from the rich to the poor. There will be welfare gains to
society from such a transfer.
7.5 Unisex annuities
In March 2011, the European Court of Justice ruled that insurance
policies within the EU could not be sold at different prices based
on gender discrimination. This has implications for annuity
policies, since annuity providers up until now have been able to
offer males higher annuity rates than females on the basis that
female life expectancy is longer than that of males. The new
gender-neutral annuity contract will be a pooled equilibrium in
which we might expect that unisex annuity rates are a weighted
average of those in the current separating equilibria, assuming
that both genders continue to purchase annuities in the same
proportions. Within compulsory purchase annuity markets, the
annuity markets 85

assumption of no effect on demand is reasonable, but at the
margin with the MIR, some males might now find drawdown
more attractive, and some females might now be inclined to
choose annuitisation over drawdown—though this will also
depend on income and substitution effects.
86 panel paper 24
8. Conclusions
This paper has provided an overview of the importance of
annuity markets in the general context of pension policy around
the world. We have described the operation of annuity markets,
demonstrated the welfare benefits of annuitising pension wealth
at retirement, and provided estimates of annuity rates in UK and
Dutch markets over time. A comparison of international evidence
suggests that money’s worth numbers using annuitant mortality
experience, are typically around 97 percent for single-life 65-
year-old males. In contrast, money’s worth using population life
tables is around 88 percent, suggesting selection effects of 9
percent.
The paper has also examined the factors that determine
annuity prices, and showed that the price of annuities depends
on interest rates, projections of life expectancy, size of the
pension fund, type of annuity and the annuity providers’ mark-
up. The seminal paper by Yaari (1965), which demonstrates the
welfare benefits of annuitising one’s wealth to insure against
longevity risk, sits rather uncomfortably with the fact that
voluntary annuity markets are small. We considered a range of
factors that could explain this puzzle. These included bequests,
habit formation, the existence of state pension benefits, means-
testing, selection effects, deferred annuitisation and behavioural
aspects. Combinations of these factors may explain why the
demand for annuity products is low.
annuity markets 87

A number of policy issues are thus open to debate: The number
of annuity providers is relatively small, which raises concerns
about abuse of market power (although the money’s worth
evidence does not suggest monopoly pricing is a problem in this
market). The small number of providers also means that the
cohort longevity risk is highly concentrated in a small number of
firms, and there is some question whether these providers have
the capacity to absorb the extra risk associated with increased
annuity demand. If this limited number of firms would not be
able to bear the total longevity risk, then mechanisms would
need to be found for this risk to be held elsewhere. Possible
candidates include the following: individual investors or other
financial institutions, who would hold mortality bonds (issued
by reinsurers) in a diversified portfolio; the government and
other bond issuers, by issuing longevity bonds; or the annuity
holders themselves, by making the annuity payments conditional
on cohort survival rates. Annuity providers are better able to
minimise the risks of an asset-liability mismatch, by the
availability of long-term government bonds. Governments
should ensure that there are sufficient quantities of corporate or
government debt to satisfy the demand by annuity providers.
88 panel paper 24

References
Abel, A.B. (1986) ‘Capital accumulation and uncertain lifetimes with adverse selection.’ Econometrica, 54(5), 1079-98.
Agarwal, S., Driscoll, J., Gabaix, X. and Laibson, D. (2009) ‘The age of reason: Financial decisions over the life cycle and implications for regulation,’ Brookings Papers on Economic Activity, 2, 51-117.
Ainslie, R. (2000) ‘Annuity and Insurance products for impaired lives,’ paper presented to the Staple Inn Actuarial Society.
Attanasio, O.P. and Emmerson, C. (2003) ‘Mortality, health status and wealth,’ Journal of the European Economic Association, 1(4), 821-50.
Banks, J., Blundell, R. and Smith, J.P. (2003) ‘Understanding differences in household financial wealth between the United States and Great Britain’, Journal of Human Resources, 38(2), 241-79.
Banks, J., Emmerson, C., Oldfield, Z. and Tetlow, G. (2005) Prepared for Retirement? The Adequacy and Distribution of Retirement Resources in England (London: IFS).
Banks, J. (2010) ‘Cognitive function, financial literacy and financial outcomes at older ages: An introduction’, Economic Journal, vol. 120, F357-F362.
Barsky, R.B., Juster, F.T., Kimball, M.S. and Shapiro, M.D. (1997) ‘Preference parameters and behavioural heterogeneity: An experimental approach in the Health and Retirement Study’. The Quarterly Journal of Economics, 112(2) 537-79.
Benartzi, S. and Thaler, R.H. (2001) ‘Naive diversification in defined contribution savings plans.’ American Economic Review 91(1), 79-98.
Bernheim, D.D. (1991) ‘How strong are bequest motives? Evidence based on estimates of the demand for life insurance and annuities,’ Journal of Political Economy 99, 899–927.
Blake, D. (1999) ‘Annuity markets: Problems and solutions,’ Geneva Papers on Risk and Insurance, 24(3), 358-75.
Blake, D. and Hudson, R. (2000) Report of Retirement Income Working Party (Pensions Institute, London, UK).
Blake, D. and Burrows, W. (2001) ‘Survivor bonds: Helping to hedge mortality risk,’ Journal of Risk and Insurance, 68(2), 339-48.
Blake, D. (2003) ‘Reply to ‘Survivor bonds: A comment on Blake and Burrows’,’ Journal of Risk and Insurance, 70(2), 349-351.
Blake, D., Cairns, A.J.G. and Dowd, K., (2003) ‘Pensionmetrics 2: Stochastic pension plan design during the distribution phase’, Insurance: Mathematics and Economics, 33, 29-47.
annuity markets 89

Blake, D., Cairns, A.J.G. and Dowd, K. (2006) ‘Living with mortality: Longevity bonds and other mortality-linked securities,’ Cass Business School: Pensions Institute discussion paper 06-01.
Blake, D., Cairns, A.J.G. and Dowd, K. (2009) ‘Designing a defined-contribution plan: What to learn from aircraft designers,’ Financial Analysts Journal, 65 (1), 37-42.
Board for Actuarial Standards (2008) ‘Discussion Paper on Mortality,’ (Financial Reporting Council Ltd, London UK).
Bodie, Z. (1990) ‘Pensions as retirement income insurance’, Journal of Economic Literature, 28, 28-49.
Booth, P., Chadburn, R., Haberman, S., James, D., Khorasanee, Z., Plumb, R.H. and Rickayzen, B. (2005) Modern Actuarial Theory and Practice, 2nd edition, (Boca Raton, Florida: Chapman & Hall/CRC).
Borsch, K. (1962) ‘Equilibrium in a reinsurance market,’ Econometrica, 30, 424–44.Brander, J.A. and Finucane, S. (2007). ‘Pensions and corporate performance:
Effect of the shift from defined benefit to defined contribution pension plans.’ Xfi, University of Exeter discussion paper 07/06.
Brown, J.R. (1999) ‘Are the elderly really over-annuitised? New evidence on life insurance and Bequests’. NBER working paper 7193.
Brown, J.R., Mitchell, O.S., Poterba, J.M. and Warshawsky, M.J. (2001) The Role of Annuity Markets in Financing Retirement, (Cambridge: MIT Press).
Brown, J.R. (2001) ‘Private pensions, mortality risk, and the decision to annuitise’, Journal of Public Economics, 82(1), 29-62.
Brown, J.R. and T.E. Nijman, (2011) ‘Opportunities for improving pension wealth decumulation in the Netherlands‘, Netspar discussion paper 01/2011-008.
Bütler, M., Peijnenberg, K. and Staubli, S. (2011) ’How much do means-tested benefits reduce the demand for annuities?’ Discussion Paper University St Gallen.
Cannon, E. (2009) ‘Estimation and pricing with the Cairns-Blake-Dowd model of mortality,’ University of Verona, Dept of Economics working paper 65.
Cannon, E. and I. Tonks (2004a) ‘U.K. annuity rates, money’s worth and pension replacement ratios 1957-2002,’ The Geneva Papers on Risk and Insurance, 29(3): 394-416.
Cannon, E. and Tonks, I. (2004b) ‘U.K. annuity price series 1957 to 2002,’ Financial History Review, 11(2): 165-196.
Cannon, E. and Tonks, I. (2008) Annuity Markets, (Oxford: Oxford University Press).Cannon, E. and Tonks, I. (2011a) ‘Compulsory and voluntary annuity markets in
the UK’, in Revisiting Retirement Payouts: Market Developments and Policy Issues, edited by Mitchell, O., Piggott, J. and Takayama, N. (Oxford: Oxford University Press) forthcoming.
Cannon, E. and Tonks, I. (2011b) ‘Comparison on Dutch and UK annuity markets’, Discussion Paper, University of Bristol.
90 panel paper 24

Cardinale, M., Findlater, A. and Orszag, J.M. (2002) Paying Out Pensions: A Review of International Annuities Markets, (Watson Wyatt, London).
Cocco, J.F. and Lopes, P. (2005) ‘Defined benefit or defined contribution? An empirical study of pension choices,’ FMG/UBS London School of Economics discussion paper 505.
CMI (1990) Continuous Mortality Investigation Report, 10. Institute of Actuaries and Faculty of Actuaries, (London, UK).
CMI (1999) Continuous Mortality Investigation Report, 17. Institute of Actuaries and Faculty of Actuaries (London, UK).
CMI (2002) ‘An interim basis for adjusting the “92” Series mortality projections for cohort effects,’ Continuous Mortality Investigation working paper 1. Institute of Actuaries and Faculty of Actuaries, (London, UK).
CMI (2004) Continuous Mortality Investigation Report, 21. Institute of Actuaries and Faculty of Actuaries, (London, UK).
CMI (2006) ‘The Graduation of the CMI 1999-2002 Mortality Experience: Final “00” Series Mortality Tables – Annuitants and Pensioners,’ Continuous Mortality Investigation working paper 21. Institute of Actuaries and Faculty of Actuaries, (London, UK).
Cox, S.H. and Lin, Y. (2007) ‘Natural hedging of life insurance and annuity mortality risks,’ North American Actuarial Journal, 11(3), 1-15.
Davidoff, T., Brown, J.R. and Diamond, P.A. (2005) ‘Annuities and individual welfare.’ American Economic Review, 95(5), 1573-90.
Davis, E.P. (1995) Pension Funds: Retirement-Income Security, and Capital Markets: An International Perspective (Clarendon Press, Oxford).
Davis, E.P. (2004) ‘Issues in the regulation of annuities markets.’ in Fornero, E. and Luciano, E. (eds) Developing an Annuity Market in Europe (Cheltenham: Edward Elgar).
Dilnot, A. and Johnson, P. (1993) The Taxation of Private Pensions (London: IFS).Dimson, E., Marsh, P. and Staunton, M. (2002) Triumph of the Optimists
(Princeton: Princeton University Press).Donelle, L., L. Hoffman-Goetz and J. F. Arocha, (2007) ‘Assessing health numeracy
among community-dwelling older ddults’, Journal of Health Communication: International Perspectives, 12(7), 651-665.
Dowd, K. (2003) ‘Survivor bonds: A comment on Blake and Burrows,’ Journal of Risk and Insurance, 70(2), 339-48.
Eckstein, Z., Eichenbaum, M.S. and Peled, D. (1985) ‘Uncertain lifetimes and the welfare enhancing properties of annuity markets and social security’, Journal of Public Economics, 26, 303-26.
Economist (1954) ‘The Millard Tucker Report’, 20th February 1954European Commission Directorate-General for Economic and Financial Affairs
(2009) “Pension Schemes and pension projections in the EU-27 member states 2008-2060: Volume I – Report” European Economy occasional paper 56.
annuity markets 91

Financial Services Authority (2003) ‘Enhanced Capital Requirements and Individual Capital Assessments for Life Insurers.’ FSA consultation paper 195, (London, UK).
Financial Services Authority (2005) Insurance Sector Briefing: Delivering the Tiner Insurance Reforms, (London, UK).
Financial Services Authority (2007) ‘Annuitant longevity improvements.’ FSA Dear CEO Letter, April.
Finkelstein, A. and Poterba, J.M. (2002) ‘Selection effects in the United Kingdom individual annuities market,’ Economic Journal, 112(476): 28-50.
Finkelstein, A. and Poterba, J.M. (2004) ‘Adverse selection in insurance markets: Policyholder evidence from the U.K. annuity market’ Journal of Political Economy, 112(1): 183-208.
Gerrard, R., Haberman, S. and Vigna, E. (2004) ‘Optimal investment choices post-retirement in a defined contribution pension scheme,’ Insurance: Mathematics and Economics, 35, 321–342.
Guiso, L. and Paiella, M. (2001) ‘Risk aversion, wealth and background risk.’ CEPR discussion paper 2728. London, Centre for Economic Policy Research.
Halek, M. and Eisenhauer, J.G. (2001) ‘Demography of risk aversion’, The Journal of Risk and Insurance, 68(1), 1-24.
Hannah, L. (1986) Inventing Retirement (Cambridge University Press).Harrington, S.E. (2004) ‘Tort liability, insurance rates, and the insurance cycle,’
Brookings-Wharton Papers on Financial Services, 97-138.HM Treasury (2010a) ‘Removing the requirement to annuitise by age 75,’ HM
Treasury, London.HM Treasury (2010b) ‘Response to Consultation: Removing the requirement to
annuitise by age 75’, HM Treasury, London.Holmans, A., Karley, N.K. and Whitehead, C. (2003) ‘The mortgage backed
securities market in the UK: Overview and prospects’, Council of Mortgage Lenders Research (London, UK).
Horneff, W.J., Maurer, R.H. and Stamos, M.Z. (2008) Optimal gradual annuitisation: Quantifying the costs of switching to annuities. Journal of Risk and Insurance, 75: 1019–1038.
Hurd, M.D. (1989) ‘Mortality risk and bequests’, Econometrica 57(4), 779-813.Hurd, M.D. (1987) ‘Savings of the elderly and desired bequests’, American
Economic Review, 77 (3), 298-312.Inkmann, J., Lopes, P. and Michaelides, A. (2007) ‘How deep is the annuity
market participation puzzle?’, FMG discussion paper 593 (UBS paper 044), July.James, E. and Vittas, D. (2000) ‘Annuity markets in comparative perspective: Do
consumers get their money's worth?’ World Bank Policy Research working paper 2493.
James, K. (2000) ‘The price of retail investing in the U.K.’ Financial Services Authority occasional paper 6.
92 panel paper 24

Jappelli, T. (2010) ’Economic literacy: An international comparison,’ Economic Journal, vol. 120, F429-F451.
Jianakoplos, N.A. and Bernasek, A. (1998) ‘Are women more risk averse?’ Economic Enquiry, 36, 620-30.
Kotlikoff, L. and Spivak, A. (1981) ‘The family as an incomplete annuities market’, Journal of Political Economy, 89 (2), 372-91.
Laitner, J. and Juster, F.T. (1996) ‘New evidence on altruism: A study of TIAA-CREF retirees’, American Economic Review 86(4), 893-908.
Lee, H.Y. and Eaton, C.K. (2009) ‘Financial abuse in elderly Korean immigrants: Mixed analysis of the role of culture on perception and help-seeking intention’, Journal of Gerontological Social Work, 52, 463-88.
Lin, Y. and Cox, S. (2005) ‘Securitisation of mortality risks in life annuities’, Journal of Risk and Insurance, 72(2), 227-52.
Marson, D.C., Sawrie, S.M. and Snyder, S. et al. (2000) ‘Assessing financial capacity in patients with Alzheimer disease: A conceptual model and prototype instrument’, Archives of Neurology, 57, 877-84.
Milevsky, M.R. (1998) ‘Optimal asset allocation towards the end of the life cycle: To annuitise or not to annuitise?’ Journal of Risk and Insurance, 65(3), 401-26.
Milevsky, M.R. and Young, V. (2002) ‘Optimal asset allocation and the real option to delay annuitisation: It's not now-or-never,’ Individual Finance and Insurance Decisions Centre working paper, www.ifid.ca.
Mitchell, O.S. and Utkus, S.P. (eds) (2004) Pension Design and Structure: New Lessons from Behavioral Finance (Oxford: Oxford University Press).
Murthi, M., Orszag, J.M. and Orszag, P.R. (1999) ‘The value for money of annuities in the U.K.: Theory, experience and policy,’ Birkbeck College working paper 99-19.
Official Journal of the European Communities (2002) Directive 2002/83/EC of the European Parliament and of the Council of 5 November 2002 concerning life assurance, Vol. L 345/1, 19 December.
OFWAT / OFGEM (2006) ‘Financing networks: A discussion paper.’ available from http://www.ofwat.gov.uk
Overman W., Jr. and Stoudemire, A. (1988) ‘Guidelines for legal and financial counseling of Alzheimer's disease patients and their families’, American Journal of Psychiatry, 145, 1495-500.
Palacios, R. and Pallares-Miralles, M. (2000) ‘The social protection advisory service’, World Bank Discussion Paper
Pemberton, H. (2006) ‘Politics and pensions in post-war Britain’ in Pemberton, H., Thane, P. and Whiteside, N. (edited by) Britain’s Pension Crisis: History and Policy. British Academy occasional paper 7. (Oxford: Oxford University Press).
Pensions Commission (2004) Pensions: Challenges and choices: The First Report of the Pensions Commission (London: HMSO).
annuity markets 93

Pensions Commission (2005) A new pension settlement for the twenty-first century: The Second Report of the Pensions Commission. (London: HMSO).
Pensions Commission (2006) Implementing an integrated package of pension reforms: The Final Report of the Pensions Commission. (London: HMSO).
Pension Research Forum (2004) ‘Effective member engagement – does one size fit all?’ (Watson Wyatt, London, UK)
Piggott, J, Valdez, E. and Detzel, B. (2005) ’The simple analytics of pooled annuity funds,’ The Journal of Risk and Insurance 72 (3), 497–520.
Pitacco, E., Denuit, M., Haberman, S. and Olivieri, A. (2009) Modelling Longevity Dynamics for Pensions and Annuity Business (Oxford: Oxford University Press).
Poterba, J.M. (2001) ‘Annuity markets and retirement security’, Fiscal Studies 22(3), 249-70.
Powell, M. and Ansic, D. (1997) ‘Gender differences in risk behavior in financial decision-making: An experimental analysis’, Journal of Economic Psychology, 18 (6), 605-28.
Quinton, P. (2003) ‘Enhancing retirement income,’ Pensions Management, June.Rabin, M. (1998) ‘Psychology and economics,’ Journal of Economic Literature, 36
(1), 11-46.Reed, K. (2005) ‘When elders lose their cents: Financial abuse of the elderly’,
Clinical Geriatric Medicine, 21, 365-82.Riley, W.B., Jr. and Chow, K.V. (1992) ‘Asset allocation and individual risk
aversion.’ Financial Analysts Journal, 48(6), 32-7.Rowlingson, K. and McKay, S. (2005) Attitudes to Inheritance in Britain, Joseph
Rowntree Foundation (The Policy Press).Rusconi, R. (2008), ’National annuity markets: Features and implications,’ OECD
Working Papers on Insurance and Private Pensions, No. 24.Samuelson, P.A. (1969) ‘Lifetime portfolio selection by dynamic stochastic
programming’, Review of Economics and Statistics, 51, 239-243.Samuelson, P.A., (1989) ‘The judgment of economic science on rational portfolio
management: Indexing, timing and long-horizon effects’. The Journal of Portfolio Management, 16, 4-12.
Schubert, R., Brown, M., Gysler, M. and Brachinger, H.W. (1999) ‘Financial decision-making: Are women really more risk averse?’ American Economic Review, Papers and Proceedings, 89(2), 381-85.
Schwartz, B. (2004) The Paradox of Choice: Why More is Less (New York: Harper Collins Publishers, Inc.).
Spar, J.E. and Garb, A.S. (1992) ‘Assessing competency to make a will’, American Journal of Psychiatry, 149, 169-74.
Stamos, M.Z. (2008) `Optimal consumption and portfolio choice for pooled annuity funds’, Insurance: Mathematics and Economics 43, 56-68.
94 panel paper 24

Telford, P.G., Browne, B.A., Collinge, E.J., Fulcher, P., Johnson, B.E., Little, W., Lu, J.L.C., Nurse, J.M., Smith, D.W. and Zhang, F. (2010) ‘Developments in the management of annuity business’, paper presented to the Faculty and Institute of Actuaries (London, UK).
Valdez, E., Piggott, J. and Wang, L. (2006) `Demand and adverse selection in a pooled annuity fund’, Insurance: Mathematics and Economics 39, 251–266.
Wadsworth, M. (2005) The Pension Annuity Market, Association of British Insurers,(London, UK).
Watson-Wyatt (2003) Pension Annuities - Market Dynamics and Implications for Supply, Association of British Insurers, (London, UK).
Warshawsky, M. (1988) ‘Private annuity markets in the United States: 1919-1984’ The Journal of Risk and Insurance, vol. 55, no. 3, 518-528.
Wilhelm, M. (1996) ‘Bequest behavior and the effect of heirs earnings: Testing the altruistic model of bequests,’ American Economic Review, 86, 874–92.
Willets, R. (1999) Mortality in the Next Millennium, Staple Inn Actuarial Society, (London, UK).
Willis, S.L. (1996) ‘Everyday cognitive competence in elderly persons: Conceptual issues and empirical findings’, Gerontologist, 36, 595-601.
World Bank (1994) Averting the Old Age Crisis: Policies to Protect the Old and Promote Growth. (Washington DC: World Bank and Oxford University Press).
annuity markets 95
summary of discussionBy Tim Boonen
Annuity Markets: Welfare, Money’s Worth and Policy Implications
By Edmund Cannon (University of Bristol) and Ian Tonks
(University of Bath)
Discussants: Kim Peijnenburg (Tilburg University and Netspar) and
Alwin Oerlemans (APG).
Kim Peijnenburg stressed the importance of the annuitization
decision. There is extensive literature on this subject, and the
topic has considerable policy implications in various countries.
The paper by Cannon and Tonks describes the annuity markets in
the United Kingdom and the Netherlands in detail. A suggestion
would be to expand the research to other countries. There are
country-specific arguments that may solve the “annuity puzzle”.
For example, the role of benefits tested against personal income
is relevant in Switzerland. Furthermore, it is important to
distinguish between voluntary and mandatory annuitization.
Another recommendation by Peijnenburg would be to extend
the list of annuity puzzle explanations if possible to specific
countries. Even though the paper by Cannon and Tonks
summarizes many possible explanations, there are also other
considerations, such as family composition, the scope of benefits
tested against income, default risk of the insurer, health cost
risk and incomplete annuity markets.
96 panel paper 24

The calculations of money’s worth included in the paper yield
surprisingly high results. This implies that the price of annuities
is very low and quite close to their actuarial fair price. However,
the money’s worth is not the only unit to measure the value of
an annuity. Even annuities with a low money’s worth can
generate welfare, since welfare gains for risk-averse consumers
are substantial.
The discussion by Alwin Oerlemans focused on the relevance of
annuities for pension funds. For pension funds, the money’s
worth is remarkably high. One suggestion would be to spend
more time on examining the importance of annuities for pension
provisions in general. The Netherlands, where annuities are
mandatory, is a good example of a country where annuities
generate welfare.
The results presented by the authors depend heavily on the
underlying assumptions, and some sensitivity analysis would be
advisable. Also, a key question is: who bears the risk in a
pension fund? The issue of risk sharing in pension funds is that
it pays to sell off risk. Communicating how the risk is transferred
is a challenge. Understanding how risk is transferred in a
pension plan enables participants to take responsibility for their
decisions regarding savings. The returns generated from savings
are highly important during both the accrual phase and the
annuitization phase.
annuity markets 97

In the United Kingdom, pension funds are widespread.
However, the number of defined contribution (DC) pension plans
is considerably higher there than defined benefit (DB) plans. One
suggestion would be to discuss which system is optimal, how DC
plans can be improved, and whether DB is sustainable.
In the Netherlands, there is room for pension funds to take on
more risk. The Dutch system should allow for greater flexibility in
the second and third pillars. Selection effects are not very
pronounced since participation in the second pillar is
mandatory for most individuals. The size of the first pillar (the
state pension) is very high and already constitutes a large part of
the pension wealth of most individuals. Also, inflation-linked
bonds are recommended to hedge inflation risks.
The plenary discussion focused on three issues. First, it was
unclear how the money’s worth was calculated. The fact that an
estimate of money’s worth depends on a fixed moment in time
leads to further uncertainty as to its value. Second, it was argued
that the annuity conversion risk is underestimated. Third, it was
suggested that the individual should bear longevity risk by
making the retirement age flexible and dependent on mortality
developments.
Cannon and Tonks responded as follows. The estimated welfare
gains are much larger than the money’s worth suggests. In
nearly every plausible scenario there are utility gains of about
98 panel paper 24
20%, which more than compensates for the fact that the
money’s worth is less than unity. (The paper does not discuss
this in detail due to lack of space). The authors clarified that
their analysis had covered the compulsory annuity market in the
UK and that the voluntary market was negligible.
The authors provided some further details on the UK situation.
From their discussions with government officials they concluded
that there is virtually no chance that the UK government would
issue longevity bonds since it considers itself to bear sufficient
longevity risk already. They also confirmed that the underwriting
of annuities in the UK was highly sophisticated (using postcodes
to price annuities). Because of this, and also because few
annuity-recipients are women, the UK annuity industry does not
appear very concerned about the ECJ ruling that annuities may
no longer be priced on gender.
The authors agreed that an international comparison would be
worthwhile. They stated, however, that this would be difficult in
practice due to the small number of countries available for
analysis and the complexity of pension arrangements. They
argued that the main driver of the demand for annuities in a
particular country is whether annuitization has been declared
mandatory or not. According to the authors, it is difficult to
include conversion risk in a lifecycle model. Moreover, as there
are no longevity bonds or cohort risk in pension contracts, there
is wide discussion on how to approximate longevity risk. Proper
risk-sharing is needed to hedge longevity risk.
annuity markets 99

publications in the panel papers series
1. Saving and investing over the life cycle and the role of collective pension funds Lans bovenberg , Ralph Koijen, Theo Nijman and Coen Teulings
2. What does behavioural economics mean for policy? Challenges to savings and health policies in the Netherlands Peter Kooreman and Henriëtte Prast
3. Housing wealth and household portfolios in an aging society Jan Rouwendal
4. Birth is the sessenger of death – but policy may help to postpone the bad newsGerard van den Berg and Maarten Lindeboom
5. Phased and partial retirement: preferences and limitations Arthur van Soest and Tunga Kantarci6. Retirement Patterns in Europe and the U.S. (2008)
Arie Kapteyn and Tatiana Andreyeva7. Compression of morbidity: A promising approach to alleviate the societal
consequences of population aging? (2008) Johan Mackenbach, Wilma Nusselder, Suzanne Polinder and Anton Kunst 8. Strategic asset allocation (2008) Frank de Jong, Peter Schotman and Bas Werker9. Pension Systems, Aging and the Stability and Growth Pact (2008) Revised
versionRoel Beetsma and Heikki Oksanen
10. Life course changes in income: An exploration of age- and stage effects in a 15-year panel in the Netherlands (2008)
Matthijs Kalmijn and Rob Alessie11. Market-Consistent Valuation of Pension Liabilities (2009) Antoon Pelsser and Peter Vlaar12. Socioeconomic Differences in Health over the Life Cycle: Evidence and
Explanations (2009)Eddy van Doorslaer, Hans van Kippersluis, Owen O’Donnell and Tom Van Ourti
13. Computable Stochastic Equilibrium Models and their Use in Pension- and Ageing Research (2009)
Hans Fehr14. Longevity risk (2009)
Anja De Waegenaere, Bertrand Melenberg and Ralph Stevens
100 panel paper 24

15. Population ageing and the international capital market (2009)Yvonne Adema, Bas van Groezen and Lex Meijdam
16. Financial Literacy: Evidence and Implications for Consumer Education (2009)Annamaria Lusardi and Maarten van Rooij
17. Health, Disability and Work: Patterns for the Working-age Population (2009)Pilar García-Gómez, Hans-Martin von Gaudecker and Maarten Lindeboom
18. Retirement Expectations, Preferences, and Decisions (2010) Luc Bissonnette and Arthur van Soest19. Interactive Online Decision Aids for Complex Consumer Decisions: Opportunities
and Challenges for Pension Decision Support (2010) Benedict Dellaert20. Preferences for Redistribution and Pensions. What Can We Learn from
Experiments? (2010)Jan Potters, Arno Riedl and Franziska Tausch
21. Risk Factors in Pension Returns (2010)Peter Broer, Thijs Knaap and Ed Westerhout
22. Determinants of Health Care Expenditure in an Aging Society (2010)Marc Koopmanschap, Claudine de Meijer, Bram Wouterse and Johan Polder
23. Illiquidity: implications for investors and pension funds (2011)Frank de Jong and Frans de Roon
24. Annuity Markets: Welfare, Money’s Worth and Policy Implications (2011) Edmund Cannon and Ian Tonks
annuity markets 101
Nets
pa
r pa
nel
paper
s
panel 24
Edmund Cannon and Ian Tonks
Annuity Markets: Welfare, Money’s Worth and Policy Implications
Annuity Markets: Welfare, Money’s Worth and Policy Implications
In this Panel Paper, Edmund Cannon (University of Bristol)
and Ian Tonks (University of Bath) describe the operation
of annuity markets within the context of pension policy
in countries around the world. They focus in particular
on the UK which has the world’s largest annuity markets,
and describe time series properties of annuity rates in
both the UK’s compulsory and voluntary annuity markets.
Furthermore, they provide an overview of money’s worth
calculations in global annuities markets in this paper.