Embed Size (px)
Citation preview

RS DYNAMICSRS DYNAMICS
The Complete Solution for The Complete Solution for In-Situ Soil Contamination In-Situ Soil Contamination
SurveysSurveys
ECOPROBE 5ECOPROBE 5
www.rsdynamics.com

The resulting set of parameters is further complemented by temperature, pressure and Oxygen measurement. The ECOPROBE 5 is characterized by extreme sensitivity, outstanding zero stability of both the PID and IR analysers, a real-time soil porosity measurement capability, advanced surface logging system and a GPS position logger. Data processing is managed using software compatible with Surfer and other mainstream graphic data processing systems. All this makes the ECOPROBE 5 a true breakthrough in environmental technology.
The ECOPROBE 5 heralds a new era in flexibility, convenience, and quality for in-situ detection and analysis of VOC’s and other contaminant indicators. It is able to offer cost-effective, state-of-the-art soil contaminant surveys with an unprecedented breadth of high precision data. These are the result of its unique combination of a PID analyser (for measurement of total soil gas concentration) and a selective IR analyser (for the separate measurement of Methane, Petroleum Hydrocarbons and Carbon Dioxide).
ECOPROBE 5ECOPROBE 5 Soil Contamination Survey with Soil Contamination Survey with ECOPROBE 5ECOPROBE 5
ECOPROBE 5 ‘s methodology addresses most of natural conditions and accomplishes the difficult task of practising and interpreting soil contamination survey in a truly scientific way. The most important subsurface factors that affect in-situ soil contamination measurements are:
The presence of Methane and widely differing soil permeabilities are the two crucial distorting factors in soil contamination surveys. Both dramatically affect the resulting measured values of contaminant concentrations. Without the benefits of the new ECOPROBE method, these misleading results cause severe misinterpretation of both in-situ and laboratory measurements.
2) Soil permeability: soils with differing permeability properties create differing soil vapor evaporation conditions. Due to their inner structure, relatively impermeable soils such as clay produce soil vapors for much shorter periods of time compared to highly permeable soils such as sand.
1) Presence of Methane: as a product of natural biodegradation, Methane occurs in varying concentrations everywhere in the sub-soil environment.
Soil gas is sucked into the probe and continuously analyzed in the instrument
To avoid these subsurface factors, ECOPROBE 5 provides a separate measurement for Methane and displays sequences of measured values onscreen, thereby providing important information about the soil conditions in the given environment, and specifically about the potential capability of soils of differing permeabilities to provide soil vapor for measurement. Graphs showing sequences of measured values (below) can be stored on the instrument memory.
Sequence of measured values from poor
permeability soil - clay.Evaluated by
ECOPROBE_VIEW SoftwareThe sharp decay rate of the curve indicates the insufficient porosity
of the soil environment
Sequence of measured values from good permeability soil -
sandEvaluated by
ECOPROBE_ VIEW SoftwareThe “zero” decay rate of the curve
indicates the perfect porosity of the soil environment
To illustrate this point, the graphs below were obtained using identical quantities of clay and sand soil samples, into which identical quantities of contaminant had been mixed.
In contrast to sand, clay is able to donate vapor phase for a much shorter period of time and it is obvious that frequently used integral measurements result in misleading values by several orders. For general survey purposes, ECOPROBE 5 offers a special mode showing the highest measured value at each measured station. This mode enables measurement compensation for different soil permeabilities (see the red arrows on the graphs ).
The given combination of values measured by ECOPROBE 5 helps to distinguish various contaminants and facilitates a more accurate overall picture of them.
Methane, CO2, Oxygen and temperature levels indicate subsurface bacterial activity
Separate measurement of Methane and other hydrocarbons helps to distinguish between long-standing and new contamination.
Pressure measurement gives data relating to the
progress of micro-venting processes
The graphs above show sequences of measured values reflect soil structure and porosity
RS DYNAMICS
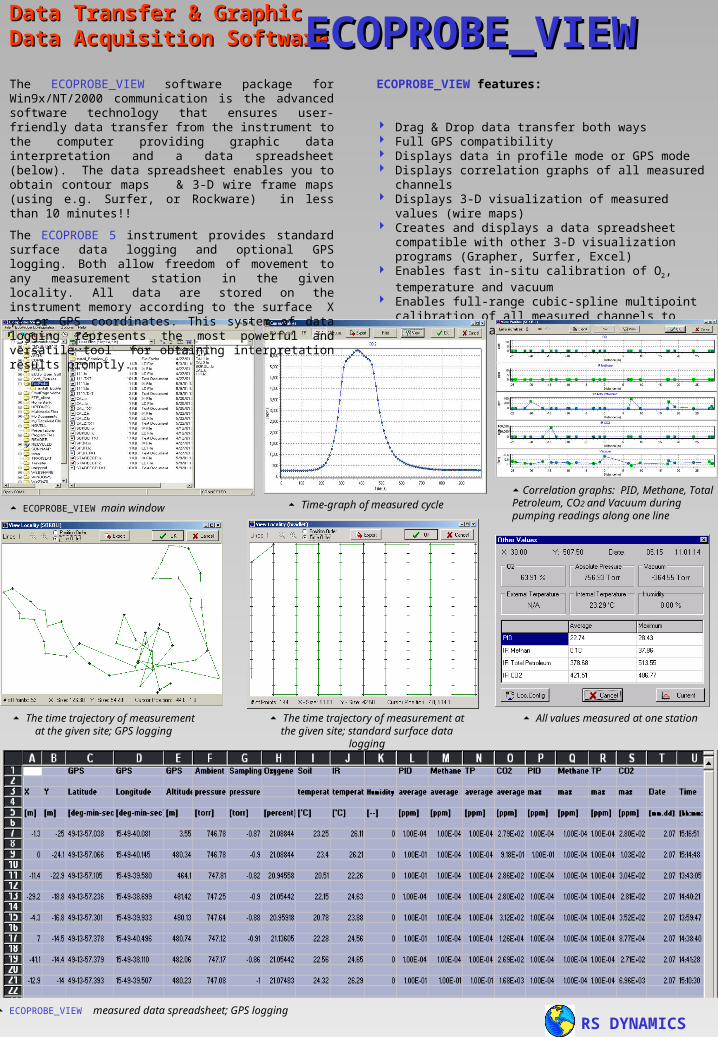
ECOPROBE_VIEW features:
Drag & Drop data transfer both ways Full GPS compatibility Displays data in profile mode or GPS mode Displays correlation graphs of all measured channels Displays 3-D visualization of measured values (wire maps) Creates and displays a data spreadsheet compatible with
other 3-D visualization programs (Grapher, Surfer, Excel) Enables fast in-situ calibration of O2, temperature and
vacuum Enables full-range cubic-spline multipoint calibration of all
measured channels to achieve high accuracy measurement
Data Transfer & GraphicData Transfer & GraphicData Acquisition SoftwareData Acquisition Software
Correlation graphs: PID, Methane, Total Petroleum, CO2 and Vacuum during pumping readings along one line
ECOPROBE_VIEW main window Time-graph of measured cycle
The time trajectory of measurement at the given site; GPS logging
All values measured at one station
ECOPROBE_VIEECOPROBE_VIEWW
RS DYNAMICS ECOPROBE_VIEW measured data spreadsheet; GPS logging
The ECOPROBE_VIEW software package for Win9x/NT/2000 communication is the advanced software technology that ensures user-friendly data transfer from the instrument to the computer providing graphic data interpretation and a data spreadsheet (below). The data spreadsheet enables you to obtain contour maps & 3-D wire frame maps (using e.g. Surfer, or Rockware) in less than 10 minutes!!
The ECOPROBE 5 instrument provides standard surface data logging and optional GPS logging. Both allow freedom of movement to any measurement station in the given locality. All data are stored on the instrument memory according to the surface X ,Y or GPS coordinates. This system of data logging represents the most powerful and versatile tool for obtaining interpretation results promptly.
The time trajectory of measurement at the given site; standard surface data logging

The ECOPROBE 5 and ECOPROBE_VIEW system software incorporate three advanced tools for the precise calibration of all measured channels, in this way ensuring high accuracy of all evaluated data.
CalibrationCalibration
1. ECOPROBE 5’s internal software enables fast single-point on site calibration of the PID and all IR channels. The ECOPROBE 5 set includes a calibration kit, consisting of a LINDE calibration standard cylinder (100 ppm Isobuthylene mixed into synthetic air) and a plastic/metal calibration bag and calibration valve (LINDE) for injecting gas from the cylinder. ECOPROBE 5 ’s simple, 3-minute calibration procedure is controlled by the instrument’s internal calibration program. That is all you need to calibrate the instrument in the field!
2. ECOPROBE_VIEW software enables fast and comfortable calibration of the external temperature probe, Oxygen channel and Pressure/vacuum channel. Values measured by the instrument (actual) are recorded in a simple menu (on the right). After inserting the requested real values, ECOPROBE_VIEW software will do the whole calibration automatically within a second.
Advanced Calibration Window - shows the whole calibration curve (blue) and its calculated replacement (red) according to newly measured values in the requested curve interval (ECOPROBE_VIEW software)
Values of measured standards
3. The ECOPROBE_VIEW advanced calibration tool enables users to modify the original factory calibration spline curve that might be affected by previous contamination by dust or other field influences. It can be used for PID and all IR measuring channels within a specific part of the curve or along the whole curve to achieve 1% accuracy. Just select the channel you want to calibrate (below left), measure the desired values from the calibration standards (4 values in the middle window below) and complete the calibration using the advanced calibration tool (bellow right). Easy, fast & accurate!!
Measuring channel selection
On site fast calibration of PID and IR channels
Fast calibration of temperature, O2 and pressure window (ECOPROBE_VIEW software)
GPS LoggingGPS Logging
Optional GPS Logging offers exceptional user friendliness while surveying large areas. GPS coordinates and all ECOPROBE 5 data are available in less than 1 minute at the touch of a button!
The The ECOPROBE 5ECOPROBE 5 is the first world class is the first world class earth-science instrument with earth-science instrument with a fully-integrated GPS positioning system !a fully-integrated GPS positioning system !
GPS satellite orbital information is referenced to WGS 84. WGS 84 is an earth-fixed global reference frame using the latitude and longitude coordinates to locate points on the Earth’s surface.
To facilitate orientation in the field, the ECOPROBE 5 also displays onscreen coordinates in surface meters. This enables the operator to move easily in the field using X and Y coordinates based on the first measured station (X=0, Y=0).
ECOPROBE 5ECOPROBE 5
Depending upon accuracy requirements, users may select from GPS systems with:
Meter precision Decimeter precision Centimeter precision
RS DYNAMICS

One test site is in the area surrounding a railway terminal, where the hydrocarbon products are transferred from tank wagons to underground storage tanks. The leakage from pipes and badly protected high volume tanks caused serious LNAPL pollution with a thick layer of kerosene at the water table. The test site is situated in permeable sandstone and alluvial sediments, very suitable for the Soil Contamination Survey. About 100 stations were measured in one day.
INTERPRETATION
The wire frame maps below were obtained within 10 minutes using the spreadsheet which ECOPROBE_VIEW program automatically creates from data saved in ECOPROBE 5. The wire frame maps show clear differences between long standing and more recent contaminations.
Mapping, Delineation & Monitoring of the Hydrocarbon Mapping, Delineation & Monitoring of the Hydrocarbon and other VOC Contamination usingand other VOC Contamination using ECOPROBE 5ECOPROBE 5
Ecological accidents where hydrocarbons have been spilt or leaked into the ground are typical and most common examples where the highly portable ECOPROBE 5 instrument offers the fastest and most cost-effective way for mapping, delineating and monitoring of the contaminant pollution.
Recent contamination:
PID indicates contamination (mostly hydrocarbon compounds)
Bacterial activity has not yet started. There is practically no Methane indication on the Methane graph.
The TP channel indicates hydrocarbon compounds present in recent contamination.
Long-standing contamination:
The PID channel indicates contamination from a wide spectrum of volatile organic compounds (excluding Methane). In case of hydrocarbon contamination PID measures mostly hydrocarbon compounds.
The Methane channel indicates extensive bacterial activity (bacteria produce Methane) typical of long standing contamination.
The TP channel measures petroleum hydrocarbons including Methane. Long standing contamination shows up mostly as Methane on the TP graph, but the hydrocarbon product is still presented (values on TP channel are higher than on the Methane channel; see also PID indication).
ECO PRO BE 5 M EASUREM ENT
The position and trajectory of the measured stations at the test site
Case StudyCase Study
Fast pollution delineation and consequent site cleaning are the most important tasks to prevent a contaminant from reaching the underground water table. Generally, the contaminant is known and there is no need to have the whole spectrum laboratory analysed from each measured station.
ECOPROBE 5ECOPROBE 5
Costly lab analyses are now a thing of the past! EPA based calibration in the field within 2 minutes. Immediate recognition between old and recent contamination!
In-situ measurement at each station (all 8 values) takes less then 1 minute ! You save by not repeating measurements!
Single man operation
The system configuration smoothes out inconsistent factors and eliminates interpretation errors: You save by having fast, reliable and precise data!
Fast in-situ mapping of contaminant spread/actual migration saves a lot of money that would otherwise need to be spent on remediation. Immediate on screen graphic results: Saves time needed for decisions where to extend/continue the survey!
A versatile and powerful Standard or GPS data logger facilitates the production of contour maps from ECOPROBE_VIEW system software in only a few minutes! (further processing by Surfer, Geosoft, RockWare, e.t.c. available) Saves time & money otherwise spent in time-consuming data interpretation!
GPS logger enables fast and accurate mapping of large sites. No geodetic location needed: You save by eliminating geodetic work!
Fast return of your investment ! Fast return of your investment !
Here is what you save…Here is what you save…
Wide-spectrum PID and 4-channel selective IR soil analytical system plus a powerful computer, all-in-one, highly portable case !
100% data PC compatibility for fast 3D mapping!
Simultaneous in-situ measurement of 8 values at one measuring station (VOC concentration from PID, Selective Methane, Total Petroleum and CO2 concentration from the IR analyzer, O2, Soil temperature, Sampling vacuum and Ambient pressure). This breadth of data considerably improves the overall quality of measurement. The response time is < 1 second !
Measured data are compensated for the effect of Methane, Soil porosity/permeability, Pressure & Soil temperature .
On screen real time measurement process, indicating soil parameters and contaminant behavior
Fully integrated GPS positioning system with an accuracy of 3 meters to centimeters (optional).
Ultra-high sensitivity of both the IR and PID analyzers enables identification of even traces of contamination!
Automatic monitoring station -- just preset the sampling interval and leave the instrument wherever needed. The ECOPROBE 5 will do the work for you. Wireless control / data download available via GSM data network (optional).
ECOPROBE 5ECOPROBE 5Benefits Benefits
Here is what you get…Here is what you get…