Embed Size (px)
Citation preview

rs


A Financial Planning Model for
Country Elevators Gary T. Devino and Herman Harrison*
As business firms become larger and the complexity ofthe environment within which they operate increases, planning becomes a more and more important function for management. The firms pass the point where institution and guesswork can provide a framework to identify where they are going and how they will get there.
Development of plans for a business can be as simple or as complex a process as a manager wishes. The manager can identify a single plan of action requiring a limited amount of analysis. Alternatively, a number of "what if" possibilities may be evaluated which may require development of work papers. While the latter procedure may be more desirable, it is also more time consuming and costly. Unless a manager is willing to spend a substantial amount of time, it would be better to limit the choices to a few alternatives.
With the use of a computerized program it is possible both to minimize time requirements for planning and to evaluate the effect of a number of alternative courses of action. The purpose of this report is to describe a model which extension personnel may use in assisting managers of country elevators in their planning function .....
Organization of the Model
A computerized model was developed to allow identification of financial conditions which would be expected to result from alternative courses of action. An overview of the model is presented in Exhibit 1. Use of the model requires:
(1) Data from the firm's accounts for the period just prior to the planning period.
(2) Projections for expected changes in selected accounts for the planning period.
(3) Identification of limits for selected financial ratios.
From this information the program generates pro-forma financial statements for each year of a five year planning period. By changing input data for projections and limits (numbers 2 and 3 above), the program's user can project results from any number of alternative plans.
The operations of the model are centered around separate analysis for each of six enterprise areas: grain, feed, fertilizer, seed, farm supplies, and other items. The user of the model can use any or all of these centers.
The model has the advantage of being flexible in the level of detail necessary for use. Options available allow the following choices:
*Gary T. Devino is an Associate Professor, Dept. of Agricultural Economics, University of Missouri. Herman Harrison is Supervisor, Data Processing, Dept. of Agricultural Economics, University of Mo., Columbia.
**The program was developed as part of the University of Missouri's contribution to NC-1 04 Systems Analysis in Grain Marketing. The model is written in Fortran IV and is available through the Department of Agricultural Economics, University of Missouri-Columbia.

/- - - - - - - - - - -.'1
Initial Most Recent -------- -' ,
(Detailed InfO: I
: for Sped fic : : I Enterprise (s) I,J L.. _______ __ to
General F_i_rm~ ________________ ~ Other
Farm Supplies Seed
Fertilizer n/a
Feed Grain
INPUT MODULE
Revenue Expenses
DATABASE FOR PARTICIPATING FIRM G Liabilities l::J UPDATE MODULE
~--------------------a
~--; '--
Earnings Statement
REPORT MODULES
Balance Sheet
Exhibit 1. COMPUTERIZED FINANCIAL PLANNING MODEL FOR COUNTRY ELEVATORS AN OVERVIEW OF THE SOFTWARE PACKAGE
2
I I I
I I
I I

(1) The firm can be treated as a unit with all revenue and expenses being treated as common to the firm.
(2) Gross margins may be identified for each enterprise area with all expenses treated as common to the firm.
(3) Net margins may be identified for each enterprise area with all expenses associated directly with the operation of that enterprise assigned to the enterprise.
Data Characteristics and Input Requirements
Firm Information
The first portion of required data is used to identify the operation of the entire firm, Exhibit 2:
Legal Business Structure of Firm (0100)t
The analysis is designed with the capability to handle any of the common forms of legal structure: Proprietorship, Partnership, Subchapter S Corporation, Regular Corporation, Cooperative.
Minimum Cash Balance on Hand at End of Year (0200)
The minimum level of cash which this business is expected to need in meeting its cash obligations is identified.
Accounts Receivable Turnover (Times per Year) (0300)
Accounts receivable turnover measures the rate at which credit sales are turned into cash . It is defined as:
cred it sales per year accounts receivable
The higher this value the greater the firm's ability to meet its cash needs from internal sources.
Planned Investment in Property, Plant and Equipment (0500-0900)
All anticipated investments in plant and equipment are identified. These include both replacement and additions to capacity. If constant replacement is assumed, depreciation expense is treated as a constant.
Accounts Payable Turnover (Times per Year) (1000)
The rates at which purchases are identified by accounts receivable turnover. It is defined as:
purchases accounts payable
The lowerthis value, the greater is the firm's reliance on outside sources offunds.
Anticipated Short Term Interest Rate (1100)
At the end of each simulated year all cash uses and all cash sources are summarized. When cash uses exceed cash sources, short term borrowing takes place automatically. The cost anticipated if borrowing is necessary is identified.
tHeadings and code identifications in this section correspond to headings used in the data input form.
3

Exhibit 2
10,11!),dl
:.JaJTIe of Farticir>ating Finn (DIDO) I ,A ,C,/I.,I, -,Bp, s,t,",£. $,$, ,I. 11. Co. (please center)
Management Guidelines for Year
10 ,211,81 1 2 3 4 5
* ~ 2, L 2., ~ Legal Busin~ss Structure of Finn (OlOO)
~inimun Cash Balance on Hand at End of Year (0200) $ 'S:OOt> sl'OI» sl'1tkJo s/toao S/~OtJD
Accounts Receivable Turnover (Times Per Year) (0300) ~ 5 S 5 " ,J::>. Credit Sales Expressed as Percent of Total Sales (0400) 90 % IS" % 80 % JS %~ %
Planned Investment in Property, Plant and Equipment
Net Cost of the Planned Investment (0500) s5iJtJtk) slolMlJ s LIt>NJ s/()N~ s2oot:Jt:, Net Annual Change in Depreciation Expense (0600) S 5()oIJ $ ~(JIJ" $ /OOD S IND S 2tJt:1O Resulting Amount Eligible for Investment Credit (0700) $ 2Dt!JM S 2DIJIJtJ siDON $ /tJDNJ St...I'J6eJID Years of Usage in Business (Investment Credit) (08005 7 yrs 7 yrs ~ ;trs ~ ~rs 7 ;trs
Cash Paid 'Jut at Time of Purchase (0900) S100IJ() S2.,OllI)D $ .51JtJ1J S ../IJIN) S't:JOIJeI
Accounts Payable Turnover (Times Per Year) (1000) // /1 10 It) /0 Anticipated Short Term Interest Rate (1100) /0 % 9 % llr% 6!..5' % /(J %
Maximum Ratio Current Liabilities to Total Assets (1200) 25' % 2' % 2,[ % 28 % 29 %
Maximum Ratio Total Liabilities to Total Assets (1300) 'I) % r5' % 50 % 50 % -So %
1 - Proprietorship, Partnership, or Sub-Chapter Si 2 - Corporation; 3 - Cooperative;
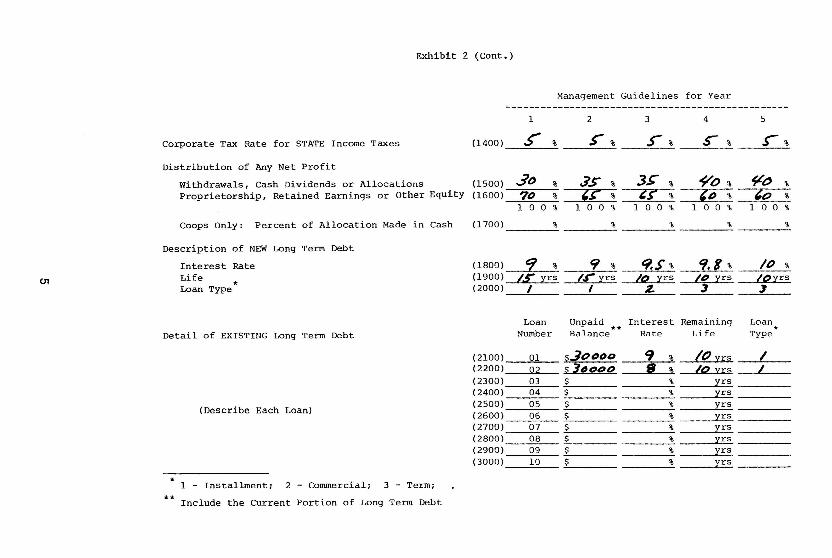
Exhibit 2 (Cont.)
Management Guidelines for Year
1 2 3 4 5
Corporate Tax Rate for STATE Income Taxes (1400) .s % >" % r % s- % r %
Distribution of Any Net Profit
Withdrawals, Cash Dividends or Allocations (1500) 3" % .75 % 3>" % ~o % ~~ %
Proprietorship, Retained Earnings or Other Equity (1600) 71> % ~~ % '$' % l..t> % lo %
100 % 100 % 100 % 100 % 100 %
Coops Only: Percent of Allocation Made in Cash (1700) % % % % %
Description of NEW Long Term Debt
Interest Rate (1801) 9 % 9 % 'lS% 'I,' % II) %
01 Life *
(1900) {r yrs Ir yrs /.12. Xrs II' yrs ~yrs Loan Type (2000) I I 2- --~- ~
Loan Unpaid ** Interest Remaining Loan * Detail of EXISTING Long Term Debt Number Balance Rate Life Type
(2100) 01 ~ j (;>I:U:>I:' 9 % to yrs _I (2200) Q2 ~ l."t:lDD II. % La. :il:S I (2300) 03 $ % :irs (2400) 04 $ % Xrs
(Describe Each Loan) (2500) 05 $ % yrs (2600) 06 $ % :t: rs (2700) 07 $ % :irs (2800) OB $ % :t:rs (2900) 09 $ % :t: rs (3000) 11) $ % vrs
* 1 - Installment; 2 - Commercial; 3 - Term;
** Include the Current Portion of Long Term Debt

Maximum Ratio Current Liabilities to Total Assets (1200)
The limit on the amount of dollars which can be borrowed from short term sources is set by the maximum ratio of current liabilities to total assets which is established for the firm. All short term borrowing is repaid automatically during the year following its incurrence.
Maximum Ratio Total Liabilities to Total Assets (1300)
This term sets the upper limit for all borrowing by the firm. Long term borrowing takes place automatically when more cash is required than can be supplied by internally generated funds and short term borrowing. When all cash requirements are greater than the amount of cash which can be generated by a firm's total borrowing capacity, the analysis is terminated.
Corporated Tax Rate for State Income Taxes (1400)
Income tax computations are conducted for private corporations (except Subchapter S) and for retained earnings held by cooperative cooperations. No calculations are made for the other business forms because tax payment would not be part of the firm's operations. Because state corporation tax rates are not all the same, the level for the state in which the firm being analyzed is located is entered. Federal taxes on corporations are included in the program's computations.
Distribution of Net Profit (1500-1600)
All after tax profits for corporations and cooperatives; and all earnings of proprietorships, partnerships, or Subchapter S corporations are either removed from the business and consequently are a use for cash (1500) or they are left in the business.
Coops Only: Percent of Allocation Made in Cash (1700)
In the case of a cooperative which plans to use allocated equities, the portion of allocations to be distributed as cash are identified.
Descrip.tion of New Long Term Debt (1800-2000)
Because long term borrowing may be required for any plan, the types of loans and anticipated interest rates are identified. The loan types available are:
1. Installment~the ~oan is repaid in equal annual payments.
2. Commercial-the loan is repaid with an even annual principal repayment.
3. Term-the loan is repaid with one principal and interest payment.
Repayment on all long term loans starts in the year after the funds are borrowed.
Detail of Existing Long Term Debt (2100-3000)
Each long term loan outstanding at the end of the base period is identified. Yearly principal and interest payments are calculated and made automatically within the model.
Cost Center Information
Separate data input forms are used for each cost center for which margin information is to be developed. When no analysis of individual enterprises is desired, a total sales figure for the firm is used. Forms for cost center data input are illustrated in, Exhibit3. Data used in Exhibit3 are for a firm where the only feed enterprise is segregated for detailed analysis.
6 ;

Sales (0101-0201)
Sales for each year may be (1) entered directly as a dollar fig ure or (2) generated by the program through the use of data which ind icate the percent change from the previous year which is to be projected for each year 's sales. Both positive and negative changes may be projected. If an item is not expected to change a 0 is entered.
Gross Margin (0301)
Gross margin for this program is defined as sales minus purchases. It represents the percentage of each sales dollar which is available to cover expenses and contribute to profits.
Purchases (0402)
Purchases are calculated by the program after the base year. The amount of purchases to be made is identified as follows :
Product Requ ired: Sales (1 - Gross Margin) Ending Inventory
Less: Product available in beginning inventory Equals: Purchases
Operating & Service Income (0804)
This category includes revenue received for functions performed by the firm. Adjustments from the base period are projected from percent change data.
Other Income (0905)
This category includes income which the firm receives from investments. Adjustments from the base period are projected from percent change data.
Other Expenses (1006)
This category includes interest expense, income taxes, and loss on the sale of assets. Interest expense and income taxes are computed d irectly by the prog ram and should not be identified after the base period.
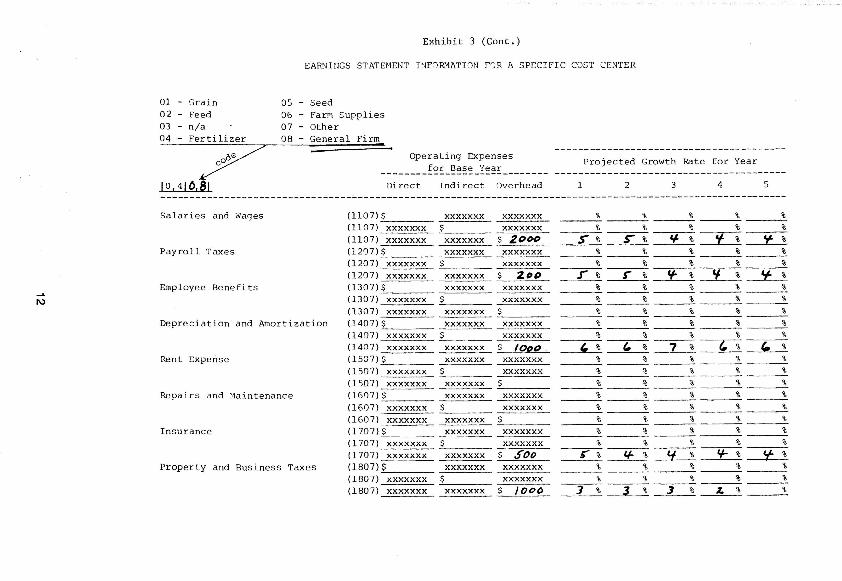
Expense Items (1107-1307) (1507-2507)
Expense items for the base year may be entered in any or all of th l'ee expense categories. When code 08 (general firm) is being used only base year overhead expenses are identified . When an enterprise is being segregated, expenses associated with that cost center-both direct and indirect-are identified.
For each expense item used in a cost center a projected growth rate from the previous year is identified . Both positive and negative changes may be projected. If an item is not expected to change a 0 is entered.
Depreciation Expense (1407)
When planned investments, item 0500, just offsets yearly depreciation , depreciation expense is held constant. When plant and equipment is being used up faster than it is replaced, depreciation expense will decline. If there is a net increase in depreciable assets used by the firm , the increase in depreciation which is caused by the assets increase is entered earlier as the net annual change in depreciation expense.
Balance Sheet I'nformation
Balance sheet information for the period just prior to the start of the analysis
7

period is required. Forms for entering this data are illustrated in Exhibit 4. These values are then generated internally by the program for each year of the study.
Computer Printout
Financial results of the analysis are printed for each of the five years simulated. Results for the first year for the data contained in Exhibit 2-4 are presented in Exhibit 5.
Pro-forma statements generated by the program include: 1. An earnings statement for each enterprise and for the firm. The detail level
presented depends upon the nature of cost data submitted for the base year.
2. A balance sheet for the firm. 3. An analysis of loans outstanding. The printout includes information on
long term debt, interest charges, and the amount of short term debt which is outstand ing.
4. An analysis of selected financial ratios for the firm. Liquidity, profitability, solvency, and operating ratios are presented.
5. A funds flow statement. This statement summarizes changes which are expected to occur in the balance sheet accounts during the years which are projected.
6. A capital statement. This statement identifies the additions and with-drawals which are expected to occur in equity accounts.
With these statements the manager can gain an understanding of the implications which a proposed course of action will have on his firm. Alternatives can be evaluated until feasible plans of action are identified.
8

CD
01 - Grain 02 - Feed 03-~ 04 - Fertilizer
_oe/ y
10 ( 310,2.,
Sales - Dollar Value
Exhibit 3
EAR!-!J~lGS ST.l"TE'·1ENT I~!FOR.""ATIO!'l FOR A SPECIFIC COST CENTER
05 - Seed 06 - Farm Supplies 07 - Other 08 - General Fi~
~,." &.r/,fI~r.r ~G (firm)
197r (applicable date)
Projected Growth Rate for Year -------------
Base 1 2 3 4
Year - --------------------------------------------
$ $ $
5
$ (0101) s2SoPa) $ (0201) xxxxxxx or r % or ~ % or Z % or ~ % ;r ~ % - Growth Factor (+/-)
- Gross ~argin
Purchases
Beginning Inventory
Ending Inventory - Dollar Value - Days Sales
Operating & Service Income
Other Income
* Other Expenses
(0301) xxxxxxx
(0402) SL212(2«:J (0503) $ Irt:Jt:Jo (0603) $ l:.oooo (0703) xxxxxxx
(0804)$ 2()()b
(0905)$ 15O/)
(1006) $ rOO
Complete A Se~arate Input Form for Each Cost Center
* When using code 08 (General Firm) this line is not used
~ % ~ % ~O % ~O % ~O %
~1arE : To vary the projected growth rate simply code a different value for each time period.
,22, d:ts 2(2 d:t s ~" dxs /8 dxs 18.. d;ts
.r % ..r % r% r % ~ % , % (. % (, % '- % ----' %
% % % % %

Exhibit 3 (Cant.)
EAR~INGS STATEHENT INFORMATION FOR A SPECIFIC COST CENTER
01 - Grain as - Seed 02 -~ 06 - Farm Supplies 03 - Other 07 - Other 04 - Fertilizer 08 - General Firm
~ Operating Expenses --------~-----GO ________ !~~_~~~~_~~~~ _____________ ~~~:~~=~~_~~~~=~_~=~_~~~_~~:~ ____ _
10,410, Direct Indirect Overhead 1 2 3 4 5 --------------------------------------------
Salaries and Wages (1107) st95'()(;) xxxxxxx xxxxxxx .)' % r % r % .r % .s- %
(1107) xxxxxxx $ J.~ xxxxxxx r % s= % S- % S' % ~ (1107) xxxxxxx xxxxxxx % % % % %
Payroll Taxes (1207) S 2DDD xxxxxxx xxxxxxx ~ % c,. % 'f. % G % - --4 -%
....a.. (1207) xxxxxxx S tDD xxxxxxx ,,% 'I % ¥ % S' % ~ o (1207) xxxxxxx xxxxxxx % % % % ___ %
Employee Benefits (1307) $ '1000 xxxxxxx xxxxxxx 1 % Cf % S- % S" % ~ (1307) xxxxxxx s ¥~ xxxxxxx ¥ % ¥ % .r % r % ~ (1307) xxxxxxx xxxxxxx $ % % % % %
Depreciation and Amortization (1407) $ 20DDtl xxxxxxx xxxxxxx -0% 0 % 0 % 0 % ~ (l407) xxxxxxx S 1./"(111 xxxxxxx 0 % 0 % 0 % 0 % ~ (1407) xxxxxxx xxxxxxx S % % % % %
Rent Expense (1507)$ xxxxxxx xxxxxxx % % % % %
(1507) xxxxxxx $ xxxxxxx % % % % %
(1507) xxxxxxx xxxxxxx $ % % % % % Repairs and Maintenance (1607) S <f"ik,~ xxxxxxx xxxxxxx 2. % 3 % Y. % s" % f %
(1607) xxxxxxx S xxxxxxx % % % % %
(1607) xxxxxxx xxxxxxx $ % % % % % Insurance (1707) $ IODO xxxxxxx xxxxxxx %.. % Z % 2. % Z. % ~
(1707) xxxxxxx $ xxxxxxx % % % % %
(1707) xxxxxxx xxxxxxx $ % % % % % Property and Business Taxes (lB07) S '1000 xxxxxxx xxxxxxx 'I- % II % r % r % ~
(lB07) xxxxxxx $ xxxxxxx % % % % %
(1807) xxxxxxx xxxxxxx $ % % % % %

-L -L
Exhibit 3 (Cont.)
EAR.:n~lGS STA':"E '·iENT I~JFO R!>lATION FOR A SPECIFIC COS T CE NTE R
Utilities
Telephone
Su::>~li~ s
Adver ti si ng Expense
Professional Serv ice s
Travel a nd Ente r tai Th~ent
~iscellaneous Expens e
Operating Expenses for Base Year
-----------------------------Direct Indirect Overhead
(l90 7) S £()()(;J xxxxxxx xxxxxxx (19 0 7) xxxxxxx 2$ ______ __ ~ (1907) xxxxxxx xxxxxxx (2:)07 ) $ rDQ xxxxxxx xxxxxxx (2 007 ) xxxxxxx $ xxxxxxx (200 7) xxxxxxx xxxxxxx ~$ ________ _
( 21 0 7 ) $ 2000 xxxxxxx xxxxxxx (21 0 7 ) xxxxxxx ~S ______ _ xxxxxxx (21 0 7) xxxxxxx xxxxxxx ~S ________ _ ( 2 207 ) $ 6$00 xxxxxxx xxxxxxx ( 2 207 ) xxxxxxx $ xxxxxxx (2 207) xxxxxxx xxxxxxx ~$ __ ~ ____ _
(23 07) s rOD xxxxxxx xxxxxxx ( 2307) xxxxxxx ~$ ______ _
(2 3 '] 7) xxxxxxx ( 240 7) ..;..S _____ _
xxxxxxx xxxxxxx -------
xxxxxxx
xxxxxxx ( 2407) xxxxxxx $ xxxxxxx (240 7 ) xxxxxxx xxxxxxx (2507 ) $ xxxxxxx xxxxxxx (2 507 ) xxxxxxx $ xxxxxxx ( 2507 ) xxxxxxx xxxxxxx ..;..$~ ______ _
Complete A Se parate I nput Form fo r Ea ch Cos t Ce nter
Projected Growth Rate for Year
1 2 3 4
% g, '7 "" o '" ~-- -o %
~ ~ '--.2 % %
--:-4f~% ---;:j:% If % 't ~ % %
-_----:.% --_% % --_% % % % % --,,-% '- % -7=---% t I %
--_% % % --_% % % % %
--,r--"-% r % r % r- .r %
% % % % ---% % % %
~ , % --2_% ----'7'--_ ~ % % % -
------:. --- --- % ------% % % % ------ ------% % % % % ------% % % % % ------% % % % % ------- ----% % % % % ------- -----% % % % % ------% % % % % ------- - - -- -----
I\)
Exhibit 3 (Cont.)
EAR"lWGS STATEt-1ENT PJFOR:>1ATION F!) R A SPECIFIC COST CENTER
05 - Seed 01 - Grain 02 - Feed 03 - n/a
06 - FarM Supplies 07 - Other
04 - Fertilizer 08 - General Firm
~ _____ ~:~;~~~~e~:~;;;:: _____ _ 10,410,81 Direct Indirect 0verhead
Salaries and ~ages
Payroll Taxes
Employee Benefits
Depreciation and Amortization
Rent Expense
Repairs a nd \1aintenance
Insurance
Property and Business Taxes
(1107).;..$ ___ _ xxxxxxx xxxxxxx (1107) xxxxxxx xxxxxxx ( 11 0 7) xxxxxxx xxxxxxx $ 2 Dt>D (1207)$ xxxxxxx xxxxxxx (1207) xxxxxxx $ xxxxxxx (1207) xxxxxxx xxxxxxx $ 2 () D (1307)$ xxxxxxx xxxxxxx (1307) xxxxxxx $ xxxxxxx (1307) xxxxxxx xxxxxxx ~$ ________ _
(1407)$ xxxxxxx xxxxxxx (14 0 7) xxxxxxx $ xxxxxxx (1407) xxxxxxx (lS07}..:...$ ___ _
xxxxxxx $ IO()o . xxxxxxx xxxxxxx
(1507) xxxxxxx _$ ______ _ xxxxxxx (ls07) xxxxxxx xxxxxxx ~$ ______ _ (1607}...;...$ ___ _ xxxxxxx xxxxxxx (1607) xxxxxxx _$ ______ __ (1607) xxxxxxx xxxxxxx (1707)$ xxxxxxx (1707) xxxxxxx ~$ ______ _ (1707) xxxxxxx xxxxxxx (1807)$ xxxxxxx (ISO 7) xxxxxxx (lS07) xxxxxxx xxxxxxx
xxx xxx x
xxxxxxx xxxxxxx
$ 500 xxxxxxx xxxxxxx $~
Projected Growth Rate for Year
1 2 3 4 5
% % % --- --~ ----=-% --_% -----% % % % %
s% $'"% 'I % Cf % 't% ----=-% % % % %
----~% % % % % .J% r% '1-% Y. % ¥o%
% % % % % --------_% % % ---_% %
% % % % % ---------=-% % % --_% %
% % % % % --,--:---% ~ ~ ~ ~
% % % % %
% % % % % ----% % % % % ----
------% % % % % % % % % % -----
-----=-% % % % % % % % % % -----% % % % %
-----::--
G'% i.f % 4 % 'I-%~ % % % % % ----
--~---'-% % % % % ~ 3% 3 % L% %

Exhibit 3 (Cont.)
EAR:n~'lGS ::::-ATE '-lENT I:JFORHATI0 ,'1 F OR A SPECIFIC C,)ST CE:-ITER
Operating Expenses Projected Growth Rate for Year
for Base Year -----------------------------Direct Indirect Overhead 1 2 3 4 5
-------------------------------------------------------------------------------------------------------
Utilities (1907 ) S xxxxxxx xxxxxxx % % % % ---_% (1907) xxxxxxx xxxxxxx % % % % % ----(19 0 7) xxxxxxx xxxxxxx $ % % % ----
Telephone (2007) $ xxxxxxx xxxxxxx % % % % ---_% -4 (200 7) xxxxxxx $ xxxxxxx % % % % ~
-,$'% ----
(200 7) xxxxxxx xxxxxxx $ lCX7 S- % S" % r % ~ Supplies ( 21 '1 7)$ xxxxxxx xxxxxxx % % % % %
(2107) xxxxxxx xxxxxxx % % % % % ----(21 0 7) xxxxxxx xxxxxxx % % % % % ----Advertising Expense (2207 )5 xxxxxxx xxxxxxx % % % ---_% (2207) xxxxxxx s xxxxxxx % % % %
(2207) xxxxxxx xxxxxxx $ 10_1} , % ~ % 7 % " 7 % Professional Services (23 07 )$ xxxxxxx xxxxxxx % % % % % ----( 2307) xxxxxxx S xxxxxxx % % % %
(23 0 7) xxxxxxx xxxxxxx $ S"OI> 2. % 3 % Y. % ':t Cf % Travel and Entertair~ent (2407)S xxxxxxx xxxxxxx % % % % %
(2407) xxxxxxx $ xxxxxxx % % % % %
(240 7) xxxxxxx xxxxxxx % % % % %
Miscellaneous Expense (2507)S xxxxxxx xxxxxxx % % % % %
(2507) xxxxxxx S xxxxxxx % % % % %
(2507) xxxxxxx xxxxxxx S % % % % % ---- --------------------------------------------------------------------------------------------
Complete A Separate Input Form for Each Cost Center

..... ~
10,510,81
CURRENT ASSETS
Cash on Hand Cash in Banks
Marketable Securities
Accounts Receivable - Customer - o ther
Notes Receivabl e Finance ~otes Rece ivable
Allowance for Doubtful Accounts ~Iargin Deposits
Advances Paid on Purchases
Accrued Storage Charges
Inventories
Pre9aid Insurance Rent Interest
Other Prepaio Expenses
Other CUrrent Assets
Exhibit 4
I:lITIAL BALANCE SHEET INFOR"'IATION
Itgtl... BI)Slltt(f ::r;.t.. (firm)
CIDre. 1'I7S Ve-Alf (ap91icable date)
(2 91)8)~()OOO (2908)
( 3008)
(3108) G'OOt>I) (310 8 )
(3108)
(3108) (3 208 )
(3108)
(33 08) ~OOtJ
(340 8)
(3508) aoO()()
(3608) (3 608 ) (3608) (3608)
(3708)
CURRENT LIABILITIES
Notes Payable - Banks - Other
CUrrent Portion Long Term Debt
Accounts Payable - Trade - Other
Outstanding Drafts Employee Taxes :"1i thheld Taxes Collected -- Sales, etc Dividends Payable
Advances Received for Sales
Accrued Property Taxes Salaries and Wages Interest Expense Payroll Taxes Storage Expenses
a ther Accrued Ex?enses
Federal Income Taxes Payable State Income Taxes Payable
Other Current Liabilities
(4310) $0000 (4310) (4310) ~
(4410) I ~()()D (4410) (4410) (4410) (4410) (4410)
(4510)
(4610) (4510) (4610) (4610) (4610) (4610)
(4710) 4/JOD (4710)
(4810)

Exhibit 4 (Cont.)
I~lITIAL BALA.t-JCE SHEET INF'JR!-1ATION
IDNG TER"1 ASSETS LONG TER~ LIABILITIES --------------------------------------------------- --------------------------------------------_.
Notes Receivable - Non CUrrent (3809) Long Term Debt (4911) SS'S"'I-Board of Trade ~-1e!l\berships (3809)
Deferred Income Tax (5011)
Land (3909) loOt>o Deferred Investment Credit (5111)
Buildings and Elevator Properties (3909) 1000/)() Accumulated Depreciation (4009) 3(>~
...L
01 SOOOO ~lachinery and Equipment (3909)
Accu~ulated Depreciation (4009) 100D(2
Autos and Trucks (3909) 20000 Accumulated Depreciation (4009) l(2 QQQ
:::ffice Furniture and Equipment (3 909) rot:} EQUITY
Accumulated ~epreciation (400 9 ) "btl
J ther Property , P lant, and Equipment (3909) Preferred Stock (5212)
Accumulated Depreciatior. (4009) Common Stock (5312) ISDtJD -Additional Paid-In Capital (5412)
Intangibles (4109) Retained Earnings (5512) 7tH IIJD Proprietorship (5612)
'J ther Long Term Assets (4209) Other Equity (5712)
----------
/9,9/C,BJ

-4
0>
EXHIBIT 5 . PRINTOur FOR FINANCIAL PLANNING MODEL FOR COUNTRY ELEVATORS
~ A L ES
C C S T CF Go e os SC L D
UEGI .. .. [ "G [ NVE "' TO"Y PUQC HASES
TUTA L G C COS AVA [ L AeL[
L ESS ENO[ I\ G [~VEN TCR Y
COST OF GOCOS SeL l)
GRCSS P ROF IT CI\ S ALES
C P I: RATI"G 4 NU SI:J; V I C E I "'C( ME
GIJ ( SS P ROF IT F C R TCT AL OPEIJ AT IO,
OP E <lATIN G EXP E I\S E S
S AL ARI E S AI\ O "A GES P AyPCLL TA X E: ~
["PL CYEE IlEI\f, f [ T5
CE P RECI AT I C " AND AMOR T llAT I C I\ ,,[" T E XPENSI:
REP A [ R S ANt; "A [ NTE:."ANC E [ "Sl;Q ANCE
PI'lOPERT Y A"O ElJSI NEsS TA XES
I.T I L[ TIES T E L E PrONE Sl;P PL [ E S
AC VE"TISING EXPE"S E F ROF E SS [ CN AL SEPV[CE5
TI< AV EL ANO E"TERT A II\"'F:"T " ISC EL LA I\EC l.. S E XP["SE
T C T AL OPER AT I "(' EXPI:I\ SE S
C~ t. ~ATl"G t:: kC f- IT
CTrE R I I\ (.)"E
C THE'« EXPI:N SE ~
1\" T t=I'lOF [T AS A PE RCE .. T CF GI:.CS S I"'CC"' !'
A G~ I- H L~ I NE <;s I NC
E AQ " I I\G S S TA TE f-' ''.N T
Yf. A P 1
F [I'D
C I" E CT I "'D [I' ~ CT
3 0 C; 7 ~ • " 1 £::0 ( •
? 12C . 2 12 . 41 2 C. ~ 1 f .
2C O~ C . 4 00 (- •
c . 0 .
'S loe. :) .
102C. r! • 4 1f·0. c . S?5< • C .
!) 2 C . OJ . 2 1.-C . r. 2~~~ • ~3 0 •
c . c . c .
7 ::a;OS 4 c. 777 Fo .
2 C J Cc. . 1/, f,QG; •
1 A~ t;r; :: .
:; 4<:; ~ .
r: V =': QHF. Ar.
'1 .
" r: .
~ . C .
". c . .. ..
2 f.. 7C:;C " • G' . 2
7 .f ~~ . C
t ~ . C
"l. €
l S 7 5 :' C . t; :). ,::
1 G~ ) (, "' . 4) . ,.
? 1 cr. ") .11
~ ) 7 1 (Ie . 4"'. ~
TCT AL l: t ~ ~ ~..:
"412 ~ . :: 1. t;
? 3 3 2. 2. . :2 4";' ~ I' • 4 . ?
~ 4 ~r:r . 2 2 . 4 r . ':, .":1
=) lr;,,:, . 4. ~
\ .:? r . I . !'" 4 1 1- .... . -~ • <:;
:: ? s (' . 4 . S ::; 2 ~" • -,:'. ~
21 2': • ~ . 0 2 ;..? ': . :l. ~
-=: ~r: . 1 . ~
1' • ~ • (l .. ':'I . ':
" I- 3 1 ~ . C. ) . f-
;; - 7 - ;' . I ; . 4
1 ~ ; ~ • 1. ':
c"" . .J . S
.? 1 ~ 7 2 . :,; .... . 4
~ . "'!

..... -....J
Exh ibit 5( Coot. )
~ALE~
C CST CF GOCC~ SCLO
'!EG [""'l"G ''''VL'''TCJ:Y Pli~CHASE S
T C TAL GCC:;S AVAILA E L f.
LESS EN C l"-G t"''' F. I\,;TC:J..Y
C [ ST Cf- t,;CCJS SCL :
C-lCSS PPCF IT (. .... SALES
:: DE;;ATI"G "''' 0 S£l'vICE I"C(" f:
<; .... [55 P~S.F IT r cr:: f e TAL C PE P AT] \..: I' ..
:"'t''i ATI''G E~PE."5f:S
SALARIES A ..... C ",.AGt:. S
PA,Y 4C LL TA)i;ES
["I'LCYf:[ t!l"EI IT S CE pr..;t::CI..lTlu'" A"'(; A"" rH .. T[l.o\TICf\
kl.NT LXi=E"oSE
~F P" tJ.?S 41\;L" "A I !\' T ~ ""A"'C [
I "SuI' ~ "Cf ~;. n;:> !:.;:;TY A"'C E:u5I NESS TAxE S ... TIL I TIl'S T[LEPt-CNE
~L.DFLI ES
.A.Cv EP 1 I 5 [N~ E )(J..I E"'~F
l'''' uFESS IC''AL SE"IIICES
TI;Allf'L "'''0 EI\TE " TAI " "E"T
"I SCLLLA"ECl.;S EXPl"SF
TCTAL CPE~ATl"G [XPf::"'~E 5
CPt.t; ATlf\. G f=R(FIT
[ T ... =~ ..... CC,.,.F..
CTHE;:; £ )(P F. "'SES
"' ::: r f:kCF IT
AS A "~"CE"T CF "" ["55 I ,,"CC "='
AGHI-r·· L.~lf\,lf SC: IN C :::.I\~N I" C5 ~T.AT l ,,£I\,T
v E A;" 1
Gl.,,~t.;\l TC Fl e w
[) I -'"CT 1 -..: 1: l ~· f C T
c . , .. c . c . c . c . ,. .. c. r . S . ( . C.
C . c . ... , . c .
:. C . ( . c . c. .: . .: .
c . ..
, .c
..... ~ " . .:.r:
~ . 1. ::'
: . "'t . ::
:.r:
t • '1. C
'l v F? ~C:- A t " ':: T AL '); 'Y.'t~~
? 1': r:- . '": 1 : f. ) .r: ~ 1': ;' 1 ... . _ , 0.
..: . :' .. : 6·:,:, :- ," f ~ . ': . ":"
) . ;) .. ; . r ': 2 c . :: . 1 . ~
1 :. : : . ) ~ "' ~ . . . : .. ' .r
"'1 : ; . ':-.. 1.("
~ ") (- ~ 1 • f. ,~ •
0 1 : :..!: . ': . (
. ' l.r
ll ··q ~ ! 1 ~ ! ': . ~ . J
-1 1 ~ I' . ..., .~
) . t:
= 1 :, . ). :
_ .... 1 __ '''' J.., . ~. ~
~. (

....1. ())
Exhibit 5 (Cant.)
SALE S
CCST CF GOC05 SCLD
REC.I ...... I"G INvn. TORY PU~CHASES
TeTAL c.eeDS AVAILAf'Lc
LESS E"DI ~G '~VE"TOI'Y
CC S T CF GCODS S OU :
G~CSS PROF 1 T ll" SALE S
(P E hATI"C A"D SEJiV ICE 'NC(ME
Gr.(5S PRCFIT FCR TCTAL ['PE k ATIC"
OPEQATI"G EXPE"SES
SALAh I ES A"C ... AGES FAYRCLL TAXES
EIIFLCVE E BE ... EF I TS CEP~EC I A TI C" AND AMORT If AT I C" kENT EXPENSE REP A I RS AND 10'11 INTE"II"CE
I "SUh""'CE FhDPERTY ANC BUS I"ESS TAXES UTILITIES
TELEPI-O"E SUPPLIES
ADVERTISING EXPE"SE F~OFESS'CNAL SERVICES
TRAVEL A"D E"TERT"''''''E'''T II I SCELL"NEeus E XPE"'SE
TeT ilL DPER,IT I"'G EXPE"SES
CPEkAT'''G PhCf IT
GTI-ER '''COME
CTHER EXPE"'SES
NET PROFIT ,I S A PERCE" T CF GReSS 'NCOME
A (. t-_ 1-"- L. ~ I ". f ~ S t ".r r . A!; t ... J ..... ( . ~ ~, '!.AT fPJ f " T
YlA ~ 1
J I"EC T 'N l) l ~ [CT
10q7 ~ . 3 I ~(. 2 1 ,, 0. 2 1 t:: . 412( • 41 6 .
20D(' C. 4 ~ O~.
O. C. 5 1(;0. C. I 02C. C. 4160. C. '=250. c.
5 2 (- . c. ~12C. c. 2f 25 . C. ~3C • C.
C • o. c. c.
7t354C. 777e.
,~ r. ;. =, .., .~ • <;G . ?
?": "'; ~ . 7. f I li 6'';C ::. e: ~ . ~
1 6 r· r;.C:; 3. ,:.. ~. f
"~ Co ~ . ~ . f
l' J 7 5 ~· ·J . F: ) . ~
1 .:: ~ J ~ ':' . 4:". :'
? 1 ).: • ) . ~
! 011 re . 4:. 5
( VF: ~ "'f At; rr: TAL ~ ~ ~ ~ ~
2 1 ['~. 1 f- ??~ • ~ 3 . ~ 2 1 c. 2 '= 42. ? .4
t;. 4 5 ~~ . 4.2 6 ,)f:C. "3 c ·::~c • 2 ~. 1
c. r. ) .C C. ~ 1 C'':" . 4. p
52 ':: • 1 5 4 <; • 1.4 1 C ~ C . ~ I t;: ':'. 4.e
C . 5 2<; ('. 4.<;
3 1 ~. e:a c: • ~. p
O . 2 1 2( • ::> . 0
IO ~ ~ • ~ E f~. ~ . 4
'" I·). 1 .J 4C. I.C c. c. v.c o. c . 0.0
11 ~ 1 C. QE 12P. ; J • c
~ <;7; • t! .4
I =SC . 1.':-
B ~ge • P..l
1 e c4. 1.7 0.7

-L
CO
Exhibit 5 (Cont.)
CUR"ENT ASSETS
CIISH "ARt<ETAdLE SECU"ITIES '<ECEIVA'lLES ADVANCES >'AID 0/1, PURCt-AScS ACCRU"D STC .... GE CHARGES l",vE"TC RI::S PR~PAIC EXPE,,",SES
CTHE':; CUHkCf\T ASS E TS
TCTAL CU"RE/I,T ASSETS
LONG T EP " . SSE TS
I"VEST"E"T5 ,oNe CTHE .. ASSETS P,,";:JDEGTY. PLA"T ."u ELLIP"c"T r,.,TANGleL ES ('HiE" LC"C TEP" ASSETS
TDT"L LtJ/I,G TEP" ASSETS
TOTAL ASSETS
!$$I~IS""S,!
ISO,)' • C.
47t;2e.
5JOO.
O. q4q~.
O.
O.
77121.
C. 150040.
C'. O.
11501)40.
227161.
A(;iH-BL S I "ES <; I "C lJ"L A"Ce St-!'FT
Y~AI; 1
,,~""''' C . (
O. C 2 \. c-
2 . " ~ .c:
4. ~
? C
C. i::
~ ~. c
C . C
H : .I J. Ci ~ . C
;'10 . I
I ClI. (.
CUJ;rct:.:NT l.IAl· ILJTI=S
fl.:fJTf:'S PA'tftF.:l F. ACCC.L'. TS ~AYAE'LF.
~()'VA"CFS I-.FCC:IVFC FCC SAL;::S
ACC;:;OUt.C> f )Ct:t-f\.S[S INCC~f TA)(~C; PAYARL£':' CTHf.~ CL"~E"T LI A!!IL IT 1[ <;
T : TAL CW''' ''''T LIA P. ILI"IE <;
LC,,"G TE~"" LJA~lLJTI!=:S
LC,,"C, l" Fr.;. .. • CEHT
( ·EFE."'~fD t .... ca v ;: T4XE~
Df"Fe=~~E-D IhVE.ST"'E",T cc;~ot T
T O TAL U ; "C, Tf~" LIA"ILITIF.S
['nul TV
TCTAL LIM!lLITIF.5 "" C feLITy
!,'fI11t'lll :t:t:t""
24<;2~ • 11.C \ ::<;22. E .1
J. 0.': O. 0.0
?C:: . 0.') O. o .c
"1: € ~ 71. \7.1
7~E~4. '] J .2 C . 0.0 C. O.C
7CE ':!4. ~l .2
1174-)'5 . 5 1.7
c.2 7161. \ CO.C

J\) o
Exhibit 5 (Cont.)
LCAN f\U"'i:Et;
I.
2 •
J •
TOTALS
TYPE
1 "ST
1"5T
1 "ST
ST
"G~l-['L~H'FSS t"C LeA>, A"t.LVSIS
'( F Ak 1
LONG Tfo"" OEf:T
CU'""E"T I\.C"-CLI-J;E"'T
2152. c5t'7 ~.
2237. CSt- ';3.
!OS I. 1 So] 1 '"-;;.
5,)7C. 70t'~4.
L. t l
r,.
'i.
15.
~CC"UU)
."-TE"EST
2~?2.
2234.
1100.
1-;[: 0: •
AS':'2.
e;:1-(CT TF.J;t-o'
",eTFS DAY~ELE
195=4.
1 gA54.

Exhibit 5 (Cont.) ~G~I-l\l;~I"E5S I .. C
'<ATI G A"ALYSIS YE~~ 1
LIQUIDITY ~ATICS SCLVf"CY PAT IIJS
CURRENT RATIIe LIAAILITI(~/ASSF.TS
LIClJlC HATIO 1.7 L 1~f<ILITlfS/E'OI.IT'r
F I Xc ·) AS~ETS/ECl.I TY
P~CFITAE:ILITY "<ATIOS MISCfLI.ANf.tl.S "ATICS
GRCSS foiETUHN
eN SALfS
4C. ~
0.0 40. )
0 . 0 IJ.'.J C .J O • • J C .0 0.0
TOTAL loLL cpn'ATICNS
G"A I N FffD
FEPTILllf~
srE:J F ~~ .. S lJ PPL I f. S
CTt-F ..
(l"E~AL TC FI""
AVERAGE
I"VE" Tr:<IY TLI:;~r:V'=~
1 (\.7
c. a 10.7
C. C C.O c. ~ 0 . 0 O. C C. ~
0.7 AVE"'t.GE' crLLECTlr:JN PEI"IJCI (DAYS)
NET .. ETURN U" A<, SET;; rpu.AT I"G E xP~"SES/G"C~S ~RGF IT
Af;FlI-hlJ~I"ESS INC FUr-OS FLC, .. S TAHM C::NT
YI: AH 1
SCL.f<CES CF FUr-OS
L:tCQ[ASl IN CASt-
I,;ECRE ASE I" ~ECF I VPfLE!>
CECr.C'ASL I" I~Vt:-. I"'ITC~ IE~
I"CREA SE I ~ L C/>,G T F. r.~ IJLt: T
INCRE ... Sl IN "ETAl"C'] tA~f\I~GS
TOTAL ~CL.~CE~
L. Sf, S CF FlJN)S
I"ChEA St:: ,,,, PRnpf.PTY. ",LA/>,T ,0."0 F.OlJIPMtNT
CECr~EASf. 1" N(TES FAVAt1Lf r.fCREASE IN ACCCU"TS PAYAbLf CECI<FA5E I" I"r::r"' .. TAX!:.S PA YA t;LE
TOTAL l.SCS
AGFJ I-~q .. ~ It\t:.r:Z INC. CAPITAL. S TATE."'!:"T
Y L~k I
~ooc • 2 ,,!? ~.
10f-C7. 14 c; ~C.
1.30!:.
1 (".I~4C .
r; 12':. 1078. 3~75.
.3411 ~.
PHEVIOlJS !lALA" CE IN ~()L. [TY Accru"T(51 11"'1 ~C.
CAS'"' "'ITI-)"A"AL~ O. CIVIOEMlS PAYAeu, ~s<; .
ALLeCAT ICN5 "'YAELf. O.
NET Ar.Jl.ST" ~"'T TO "Ql.I TY ACCClI",rc 5 I 1 ~~~.
CUOiRE"T fO AL4NCE I", ~CI;ITY ~CC:('l.NT(~1 1174,~·.
21
C .<;
l.3
73. a
91.f.


![INDEX. [core.ac.uk]](https://img.pdfslide.us/doc/110x75/61f15458aedd221aaa2dbcf6/index-coreacuk.jpg)