Embed Size (px)
Citation preview
i
RS 02
Draft-02
November 16, 2006
RS 02 – Hydrogeological – Drill Hole Monitoring and Data Collection – Phase 1
Hydrogeologic Investigation – Phase 1
PolyMet NorthMet Mine Site
RS-02
Table of Contents
Executive Summary .....................................................................................................................................iii
1.0 Introduction................................................................................................................................. 1 1.1 Background................................................................................................................................. 1 1.2 Scope of Work ............................................................................................................................ 2 1.3 Report Organization.................................................................................................................... 2
2.0 Characterization of Surficial Sediment ....................................................................................... 3 2.1 Field Activities and Data Collection Methodology .................................................................... 3
2.1.1 Soil Boring Advancement.............................................................................................. 3 2.1.2 Geotechnical Sampling .................................................................................................. 3 2.1.2 Well Installation............................................................................................................. 4 2.1.3 Aquifer Performance Testing......................................................................................... 5 2.1.4 Groundwater Sampling .................................................................................................. 5
2.2 Field Investigation Observations and Results ............................................................................. 6 2.2.1 Geology.......................................................................................................................... 6 2.2.2 Geotechnical Testing ..................................................................................................... 6 2.2.3 Aquifer Performance Testing......................................................................................... 6
2.3 Analytical Results ....................................................................................................................... 7
3.0 Characterization of the Duluth Complex .................................................................................... 8 3.1 Field Activities and Data Collection Methodology .................................................................... 8
3.1.1 Aquifer Performance Testing......................................................................................... 8 3.1.2 Groundwater Sampling .................................................................................................. 9
3.2 Field Investigation Observations and Results ............................................................................. 9 Aquifer Performance Testing ..................................................................................................... 9
3.3 Analytical Results ..................................................................................................................... 10
4.0 Quality Assurance..................................................................................................................... 11
5.0 Summary and Conclusions ....................................................................................................... 13 5.1 Surficial Aquifer ....................................................................................................................... 13 5.2 Duluth Complex........................................................................................................................ 13 5.3 Conclusions............................................................................................................................... 14
References................................................................................................................................................... 15
ii
List of Tables
Table 1 Groundwater Analytical Parameter with Analysis Method
Table 2 Surficial Aquifer Test Data
Table 3 Geotechnical Test Results, Classification, Water Content, Atterberg Limits, Specific
Gravity, and Organic Matter
Table 4 Geotechnical Test Results, Proctor and Permeability
Table 5 Surficial Aquifer Analytical Data
Table 6 Duluth Complex Aquifer Test Data
Table 7 Bedrock Aquifers Analytical Data
List of Figures
Figure 1 Site Location Map
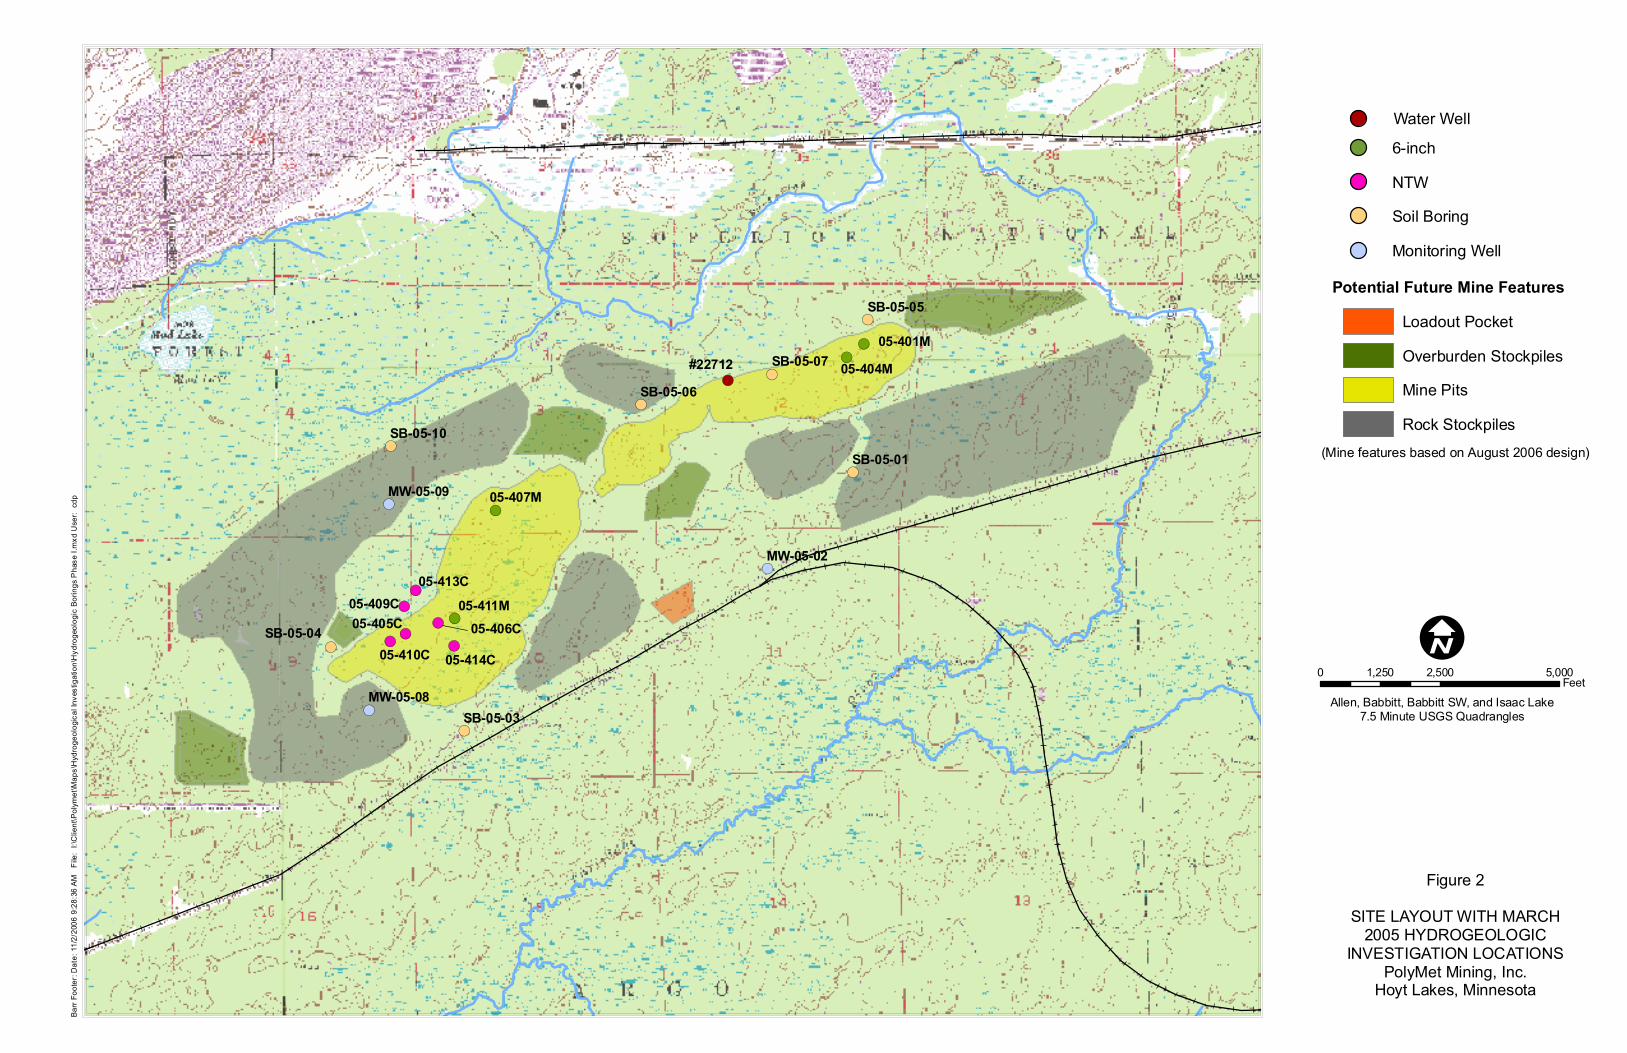
Figure 2 Site Layout with March 2005 Hydrogeologic Investigation Locations
List of Appendices
Appendix A Rotasonic Boring and Well Construction Logs
Appendix B Aquifer Performance Test Analyses
Appendix C Field Sampling Data Sheets
Appendix D Groundwater Analytical Data Reports
Appendix E Geotechnical Sample Analysis
Supplemental Electronic Data
Aquifer Test Groundwater Elevation Data
iii
Executive Summary
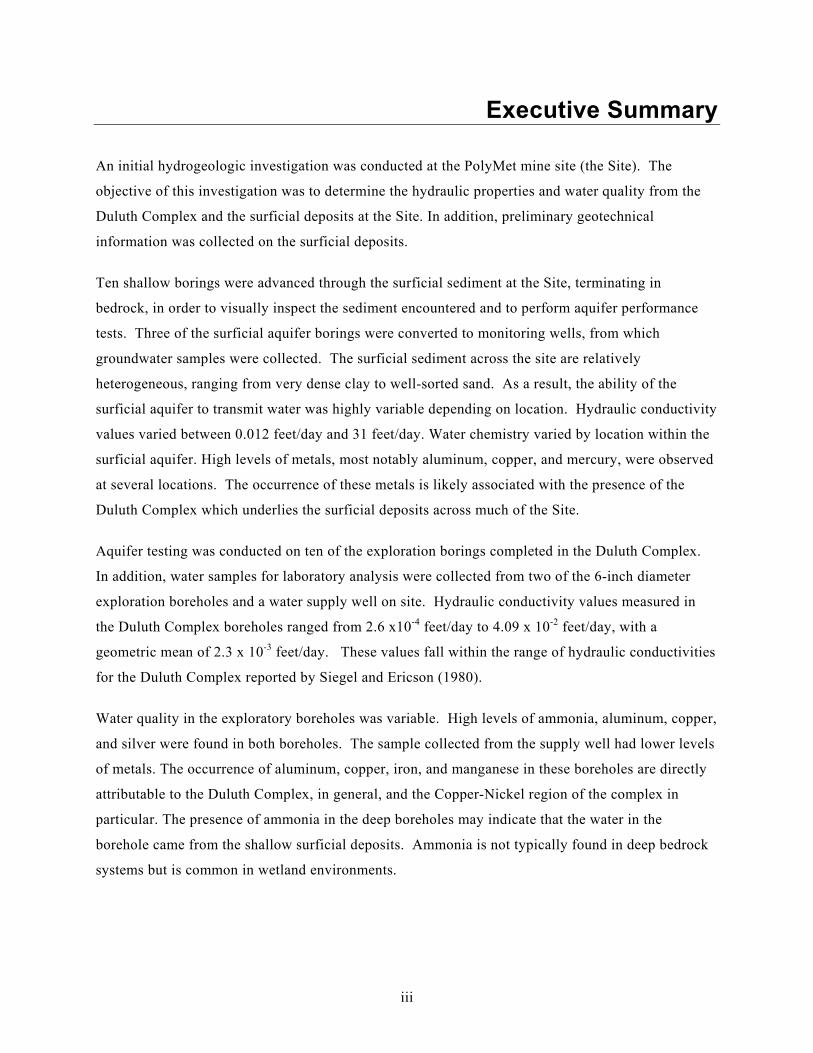
An initial hydrogeologic investigation was conducted at the PolyMet mine site (the Site). The
objective of this investigation was to determine the hydraulic properties and water quality from the
Duluth Complex and the surficial deposits at the Site. In addition, preliminary geotechnical
information was collected on the surficial deposits.
Ten shallow borings were advanced through the surficial sediment at the Site, terminating in
bedrock, in order to visually inspect the sediment encountered and to perform aquifer performance
tests. Three of the surficial aquifer borings were converted to monitoring wells, from which
groundwater samples were collected. The surficial sediment across the site are relatively
heterogeneous, ranging from very dense clay to well-sorted sand. As a result, the ability of the
surficial aquifer to transmit water was highly variable depending on location. Hydraulic conductivity
values varied between 0.012 feet/day and 31 feet/day. Water chemistry varied by location within the
surficial aquifer. High levels of metals, most notably aluminum, copper, and mercury, were observed
at several locations. The occurrence of these metals is likely associated with the presence of the
Duluth Complex which underlies the surficial deposits across much of the Site.
Aquifer testing was conducted on ten of the exploration borings completed in the Duluth Complex.
In addition, water samples for laboratory analysis were collected from two of the 6-inch diameter
exploration boreholes and a water supply well on site. Hydraulic conductivity values measured in
the Duluth Complex boreholes ranged from 2.6 x10⁻⁴ feet/day to 4.09 x 10⁻² feet/day, with a
geometric mean of 2.3 x 10⁻³ feet/day. These values fall within the range of hydraulic conductivities
for the Duluth Complex reported by Siegel and Ericson (1980).
Water quality in the exploratory boreholes was variable. High levels of ammonia, aluminum, copper,
and silver were found in both boreholes. The sample collected from the supply well had lower levels
of metals. The occurrence of aluminum, copper, iron, and manganese in these boreholes are directly
attributable to the Duluth Complex, in general, and the Copper-Nickel region of the complex in
particular. The presence of ammonia in the deep boreholes may indicate that the water in the
borehole came from the shallow surficial deposits. Ammonia is not typically found in deep bedrock
systems but is common in wetland environments.
1
1.0 Introduction
This report has been prepared for PolyMet Mining, Corporation (PolyMet) by Barr Engineering
Company (Barr) to document the results of the Hydrogeologic Investigation that was conducted at
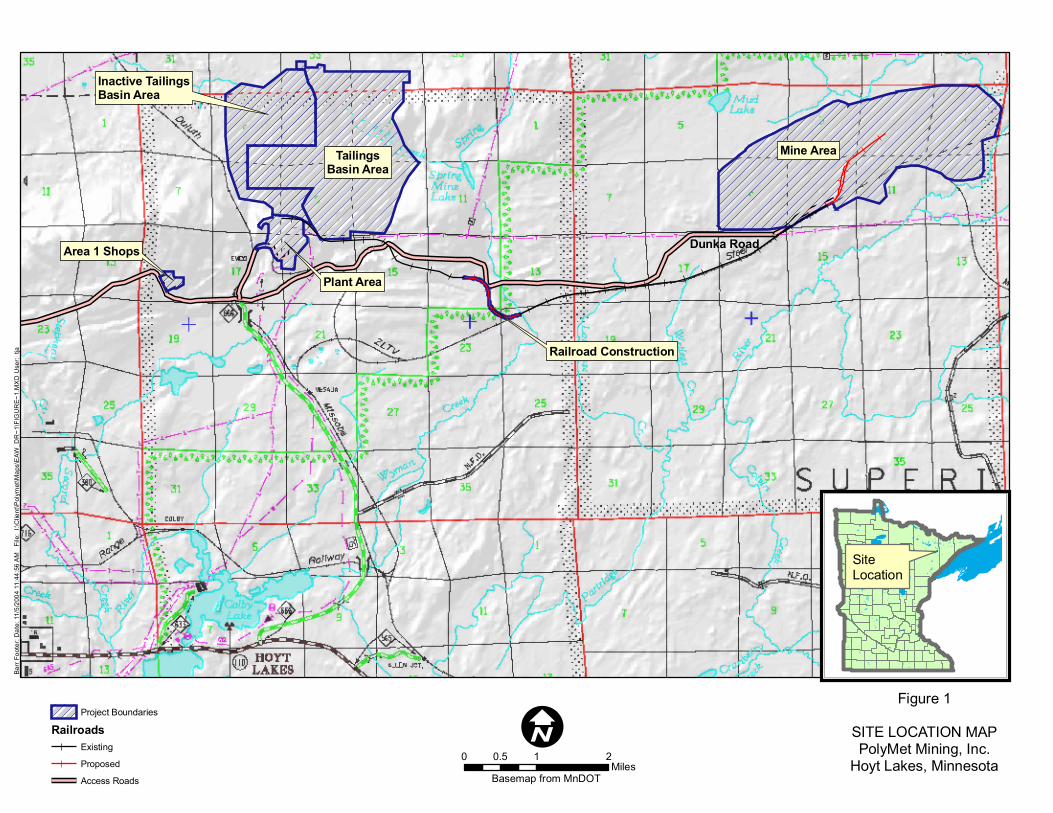
the PolyMet NorthMet mine site (the Mine Site) (Figure 1). The objective of this study was to
provide information regarding:
• The ability of the Duluth Complex rocks and the surficial sediment at the Mine Site to
transmit water into the proposed NorthMet pit (i.e., the transmissivity of the units);
• The quality of the water within the Duluth Complex rocks and the surficial sediment at the
Mine Site; and
• Preliminary geotechnical characteristics of the surficial sediment.
This information is needed for permitting purposes (i.e. water appropriations permit, NPDES permit,
permit to mine) and engineering design (i.e. stockpiles and wastewater treatment systems). These
data will also likely be used in the Environmental Impact Statement.
1.1 Background
A scoping Environmental Assessment Worksheet (EAW) was submitted in June, 2005 for PolyMet’s
proposed NorthMet Mine and Ore Processing Facilities located near Hoyt Lakes, Minnesota.
PolyMet plans to excavate and process the low grade polymetallic disseminated magmatic sulfide
NorthMet deposit in northeastern Minnesota, approximately 6 miles south of the town of Babbitt and
about 2 miles south of the operating Northshore Mining Company taconite open pit. Project plans
call for the excavation of up to 32,000 tons of ore per day, using open-pit mining methods.
Overburden and waste rock will be stripped and stockpiled. Processing of the ore will take place at
the existing Cliffs Erie processing plant.
The NorthMet deposit is located in the Duluth Complex, a large mafic intrusion that was emplaced
into flood basalts along a portion of the Middle Proterozoic Midcontinent Rift System. The NorthMet
deposit is situated along the western edge of the Complex within the Partridge River intrusion, which
has been subdivided into a least seven igneous stratigraphic units in drill core. All of these igneous
layers exhibit a shallow dip (10º-25º) to the south-southeast. Underlying the Complex at NorthMet is
the sedimentary Lower Proterozoic (1.8 million year old) Virginia Formation, which, in turn, is
2
underlain by the Biwabik Iron-Formation. The Biwabik will not be intersected in mining operations.
The Virginia may be intersected along the northern footwall of the pit.
Extensive exploratory drilling has been conducted at the NorthMet deposit to establish the extent of
the deposit. During the 2004/2005 winter, exploratory drilling was conducted to further define the
geological model of the deposit. This drilling included NTW-sized (approximately 3-inch outer-
diameter with a 2 inch rock core) exploratory borings and 6-inch outer-diameter (4 inch rock core)
exploratory borings. The NTW borings were inclined approximately 60 to 70 degrees from vertical.
The 6-inch borings were generally drilled in pairs, with one vertical boring and one inclined boring at
most drill locations. Both the NTW and 6-inch borings were cased through the unconsolidated
material.
1.2 Scope of Work
The Hydrogeologic Investigation presented in this report was designed to aid in the characterization
of the Duluth Complex and the surficial sediment located at the Mine Site. Ten shallow borings were
advanced through the surficial material, terminating in bedrock, at the Mine Site to characterize the
surficial sediment via visual inspection and aquifer performance testing. Three of the shallow
borings were converted to monitoring wells from which groundwater samples were collected.
Geotechnical samples were collected from the soil borings located beneath or near the proposed
waste rock stockpiles. These samples were collected to provide preliminary information on the
geotechnical properties of the surficial sediment.
Aquifer performance tests were conducted in ten exploratory borings at the Mine Site open to the
Duluth Complex. Groundwater samples were collected from two of these borings, as well as from
the water supply well at the Mine Site. This work provides information on the ability of the Duluth
Complex and the surficial sediment to transmit water into the proposed NorthMet pit (i.e. the
transmissivity of the units) and the quality of the water within these units.
1.3 Report Organization
This report is organized into four sections including this introduction. Section 2 summarizes the
characterization of the surficial sediment, Section 3 summarizes the characterization of the Duluth
Complex and Section 4 provides the investigation conclusions and recommendations.
3
2.0 Characterization of Surficial Sediment
Understanding the ability of the surficial sediment to transmit water into the pit and the chemical
characteristics of that water is critical in understanding both the overall quality and quantity of water
that can be expected in the pit. The information collected as part of this investigation will be used in
conjunction with data collected during future investigations to help predict the effects the proposed
mine will have on area surface water features. In addition, the geotechnical properties of the surficial
sediment will have affect the design of the waste rock stockpiles and the ability of the sediment to be
used as construction material.
All work was done in accordance with the Hydrogeologic Investigation Work Plan for the PolyMet
NorthMet Mine Site – March 29, 2005 (Work Plan) (Barr, 2005) except where noted below.
2.1 Field Activities and Data Collection Methodology
2.1.1 Soil Boring Advancement
Ten soil borings (SB-05-01 – SB-05-10) were installed by WDC using Rotasonic drilling techniques.
Borings were installed at the proposed locations provided in the Work Plan (Figure 2). All soil
borings were installed in accordance with the Work Plan specifications with the exception of SB-05-
08. Difficult drilling conditions at this location (heaving sand and highly compacted till) required the
boring to be terminated before bedrock was encountered. Due to the high bedrock elevation in boring
SB-05-10, an additional boring (SB-05-10A) was advanced adjacent to SB-05-10 to allow installation
of a temporary well. Soil samples were collected continuously to the termination depth of the
boreholes using a 4-inch diameter, 5-foot long Rotasonic core barrel. Boring logs are included in
Appendix A.
2.1.2 Geotechnical Sampling
Geotechnical samples were collected from four of the soil boring (SB-05-01, SB-05-04, SB-05-09
and SB-05-10). Four samples were delivered to Soil Engineering Testing (SET) for the analysis.
Two samples were sent to the University of Minnesota, Soil Testing Laboratory for organic soil
testing.
Parameters analyzed for include:
• Soil classification
4
• Natural water content
• Atterberg limits
• Particle size distribution
• Specific gravity
• Standard Proctor density
• Organic soil fertility test
• Permeability of remolded samples
Not all tests were run on all samples; tests were selected based on the soil classification of each
sample. Identification of the samples tested are provided in Tables 3 and 4.
2.1.2 Well Installation
Permanent Well Installation
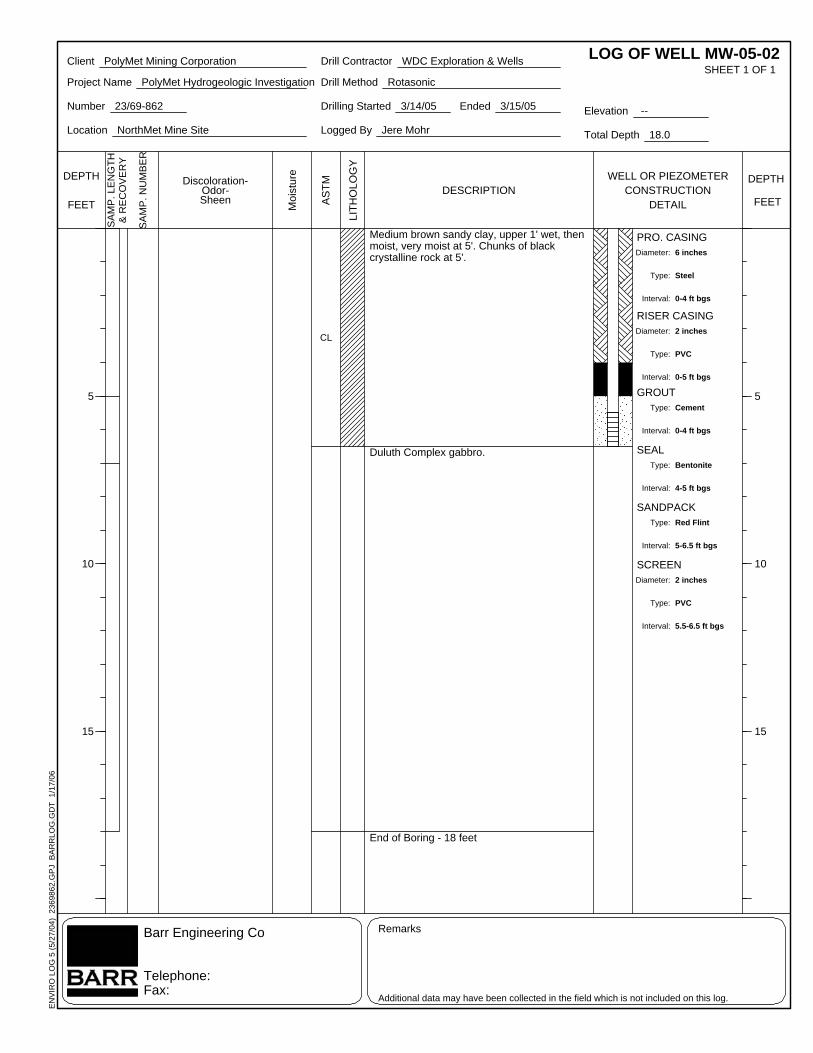
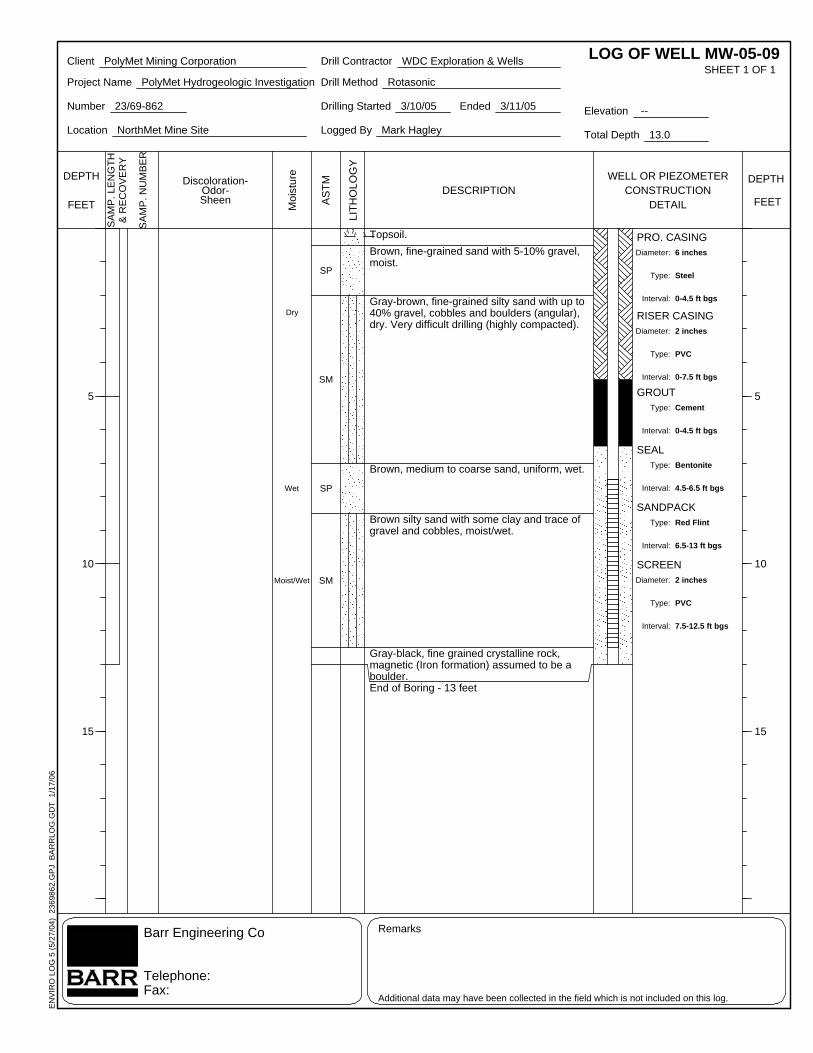
Three permanent monitoring wells (MW-05-02, MW-05-08, and MW-05-09) were constructed inside
the Rotasonic borings of the same numbers (i.e., MW-05-02 was constructed in boring SB-05-02)
(Figure 2). Wells were constructed using 2-inch diameter, number 10 slot PVC screens with 2-inch
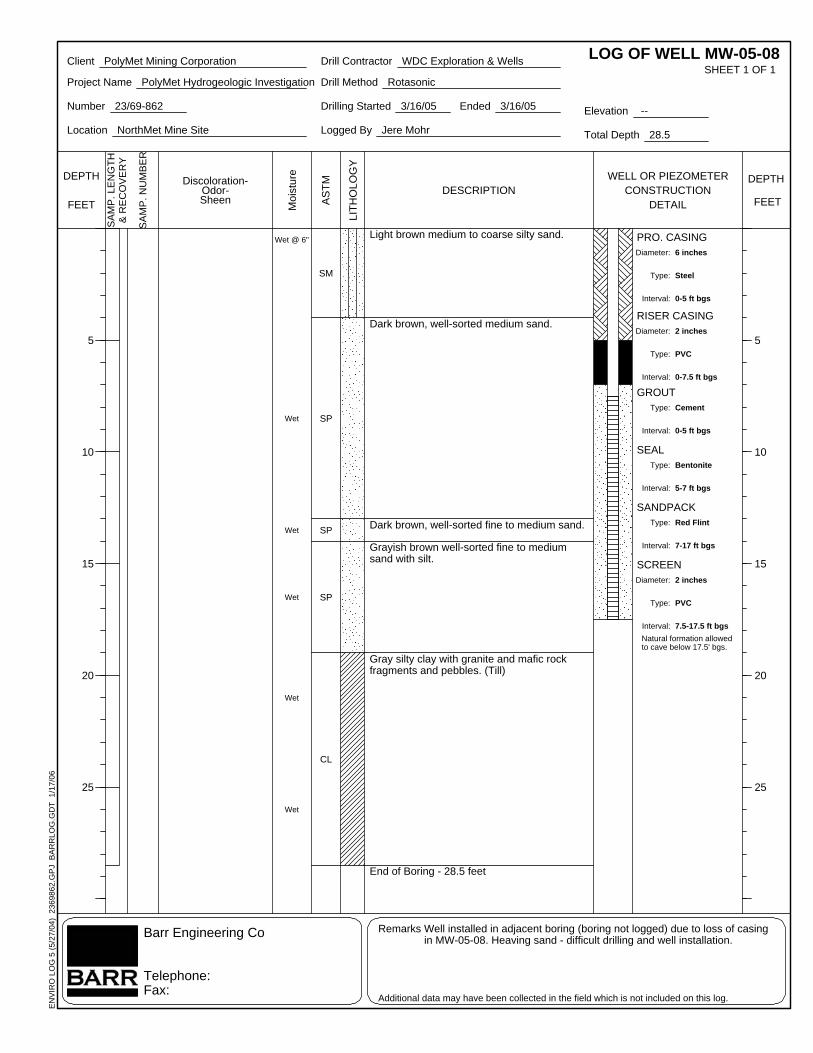
diameter PVC riser casing. Two of the wells, MW-05-08 and MW-05-09, were installed in
accordance with the Work Plan specifications. The construction of MW-05-02 was modified from
the Work Plan specifications due to the high bedrock elevation at the location. MW-05-02 was
constructed with a one foot screen, rather than the proposed 5 or 10 foot screen. Coarse sand was
added to a height of 0.5 feet above the screened interval. The remaining portion of the annulus was
sealed with a combination of bentonite chips (1 foot) and neat cement (4 feet). Monitoring wells
MW-05-08 and MW-05-09 were constructed with 10-foot and 5-foot long screens respectively. The
remaining portion of the annulus was sealed with a combination of bentonite chips (2 feet) and neat
cement (4.5 to 5 feet). All wells were completed above-grade with locking steel protective covers.
Additional well construction information is provided on the boring logs in Appendix A.
Permanent monitoring wells were developed by surging and overpumping. The development process
continued until the discharge appeared relatively free of suspended sediment. At MW-05-08, a total
of 65 gallons (approximately 23 well volumes) were purged during development. This well was
screened in a very fine sand and silt unit and contained large amounts of suspended sediment, and
required extensive pumping and surging before clear discharge was obtained. Three well volumes
were pumped from MW-05-02 and MW-05-09, since they did not contain as much suspended
sediment as MW-05-08 and discharge appeared clear following purging of three well volumes.
5
Temporary Well Installation
Six temporary wells were installed in the remaining boreholes for the purpose of performing aquifer
performance tests (see Section 2.1.3). Temporary wells were constructed using 5-foot long, 2-inch
diameter PVC screens, with the exception of SB-05-06 and SB-05-10A, which were competed with
4-foot long screens due to shallow borehole depths at these locations. Where possible, the screened
interval was placed across the stratigraphic unit in each borehole expected to have the highest
transmissivity, based on field observations. At each location, the natural formation was allowed to
collapse to an elevation of approximately two feet above the top of the screen. Bentonite chips were
placed above the collapsed formation, as necessary, to act as a seal. Temporary well construction
details are provided on the boring logs in Appendix A. Since the temporary wells were used only for
aquifer testing and no analytical samples were collected, they were not developed.
2.1.3 Aquifer Performance Testing
In order to estimate the transmissivity of the surficial units, aquifer tests were performed at each
permanent and temporary well location. Each aquifer test consisted of drawing the water level in the
well down with a peristaltic or whale pump at a nearly constant rate, turning off and removing the
pump assembly, and monitoring the recovery of the water level in the well. Water level recovery
data were collected using a pressure transducer connected to a datalogger to allow for high frequency
data collection. Data collection continued until at least 90% of the drawdown had been recovered.
Water level data are included in Appendix B. Following completion of aquifer testing at the
temporary well locations, the screens and risers were removed and the boreholes were backfilled with
either bentonite chips or cement grout.
2.1.4 Groundwater Sampling
Groundwater samples were collected from the three permanent monitoring wells on March 23, 2005.
The wells were developed during monitoring well construction, prior to sampling. All wells were
purged prior to sampling, with purging considered complete when the field measurements stabilized
or when three borehole volumes of water were evacuated. Field sampling data sheets are included in
Appendix C.
Groundwater samples were collected and placed into laboratory-supplied containers and submitted to
Northeast Technical Services (Virginia, Minnesota) for laboratory analysis of total metals, dissolved
metals and general chemistry parameters. Groundwater laboratory parameters and methods are
provided in Table 1.
6
2.2 Field Investigation Observations and Results
2.2.1 Geology
The surficial sediment across the site are relatively heterogeneous, ranging from very dense clay to
well-sorted sand. In general, the surficial units are poorly sorted and contain numerous cobbles and
boulders. A highly compacted gray clay unit with numerous pebbles was encountered just above the
bedrock surface in several of the borings. Bedrock was encountered at depths ranging from four feet
below grade at SB-B-10 to 17 feet below grade at SB-05-03. With the exception of SB-05-05,
groundwater was encountered in all of the borings. The depth to groundwater across the site is
generally less than five feet below grade. Details on the geology encountered in each boring are
contained on the boring logs in Appendix A.
2.2.2 Geotechnical Testing
Geotechnical tests were run on soil samples collected from four of the soil borings at the Site.
Identification of the samples tested and results of the testing are provided in Tables 3 and 4. Figure 2
shows the sampling locations. Test results are provided in Appendix E.
The test results indicate that there are silty sands (SM and SC-SM), clays (CL-ML), and organic soils
(OH and PT/OH) on site. The silty sands and clay soils could be used for buffer material to level
subgrade below a liner that may be required for reactive waste mine rock stockpiles. They could also
be used for cover soils where needed. The silty sands are not permeable enough to use as drainage
sand. The clay soils are too permeable to meet liner design requirements, but could meet cover
design requirements. The organic soils could be salvaged and used, either as-is (with soil
amendments) or mixed with other soils to enhance establishment of vegetation on stockpiles or in
other locations, where needed.
2.2.3 Aquifer Performance Testing
Water-level recovery data were collected during each of the pumping tests. The data were analyzed
using the Theis Recovery Method (Theis, 1935). This method calculates the transmissivity of a
confined, homogeneous aquifer based on changes in water levels through time in a fully penetrating
well due to constant pumping. This method has also been shown to be applicable in unconfined
aquifers and in partially penetrating wells as long as the late time data is analyzed, as was done in
this case (Kruseman and de Ridder, 2000). Because the tests were single-well test, it was not
possible to obtain storativity values. Transmissivities were converted to average hydraulic
7
conductivities by dividing each transmissivity value by the aquifer thickness at the location.
Aquifer-test data are presented in Table 2 and are shown in Appendix B.
Hydraulic conductivity values varied between 31 ft/day and 0.012 ft/day. The largest values of
hydraulic conductivities were measured in MW-05-02 (31 ft/day) and SB-05-01 (26 ft/day). The
hydraulic conductivity values measured in MW-05-02 is higher than would be expected considering
the well is screened in sandy clay at the contact of the clay and the underlying Duluth Complex. The
remaining hydraulic conductivity values fall within the ranges of values expected for the given
material that was tested (Freeze and Cherry, 1979).
In several of the borings, thick sequences of sand were encountered (MW-05-08, MW-05-09, SB-05-
07). However, aquifer tests at these locations found hydraulic conductivities (0.061, 0.027, 3.6 ft/day
respectively) that were on the low end of the range for silty sand. Hydraulic conductivity values for
silty sand generally range from 0.01 to 100 ft/day (Freeze and Cherry, 1979).
2.3 Analytical Results
Groundwater samples were collected from the three Site monitoring wells (MW-05-02, MW-05-08,
MW-05-09) in March 2005. The analytical results are presented in Table 5. Since the ultimate fate
of the mine pit water is not known, analytical results are compared to the Minnesota Surface Water
Quality Class 2B Chronic and the Lake Superior Basin Water Quality Class 2B Chronic criteria for
the sake of comparison. The Minnesota Surface Water Quality Class 2B Chronic standards are
designed to be protective of surface water used for recreation and support cool or warm water sport
or commercial fish and associated aquatic life. Class 2B surface water is not protected as a drinking
water source. The Lake Superior Basin water quality standards protect Class 2B waters within the
Lake Superior watershed. Because a receiving water has not been identified at this time, a hardness
of 50 mg/l was used to derive the criteria.
The water sample from well MW-05-02 exceeded criteria for ammonia (240 ug/l), pH (10),
aluminum (322 ug/l), and copper (11.2 ug/l). The sample from MW-05-08 exceeded criteria for
aluminum (1,040 ug/l), copper (10 ug/l), and mercury (0.0053 ug/L). The sample from MW-05-09
exceeded criteria for aluminum (4,640 ug/L), chromium (28.6 ug/l), cobalt (5.4 ug/l), copper (72.2
ug/l), lead (5.6 ug/l), and mercury (0.0181 ug/l).
8
3.0 Characterization of the Duluth Complex
Understanding the ability of the Duluth Complex to transmit water into the proposed mine pit and the
quality of that water is critical in understanding both the overall quality and quantity of future pit
water. Exploratory borings at the Site were used to test the transmissivity of the Duluth Complex
and to collect groundwater samples representative of the portion of the Complex that will be
intersected by the proposed mine pit.
All work was done in accordance with the Hydrogeologic Investigation Work Plan for the PolyMet
NorthMet Mine Site – March 29, 2005 (Work Plan) (Barr, 2005) except where noted below.
3.1 Field Activities and Data Collection Methodology
3.1.1 Aquifer Performance Testing
Aquifer performance tests were conducted in 10 of the new exploratory boreholes drilled during 2005
by Boart Longyear and Idea Drilling at the Mine Site. Four of the tests were conducted in 6-inch
diameter boreholes and six of the tests were conducted in NTW boreholes (Figure 2). Each aquifer
test consisted of dewatering the borehole to create approximately 200 feet of drawdown and
measuring the recovery of the water level following dewatering.
The 6-inch boreholes were dewatered using an electric pump with the intake set at a depth of 200 feet
below ground surface. The pumping rates were held nearly constant for the period of dewatering,
which ranged from approximately 40 to 80 minutes. Following dewatering, the pump was shut off
and a pressure transducer connected to a datalogger was installed in the borehole to record water-
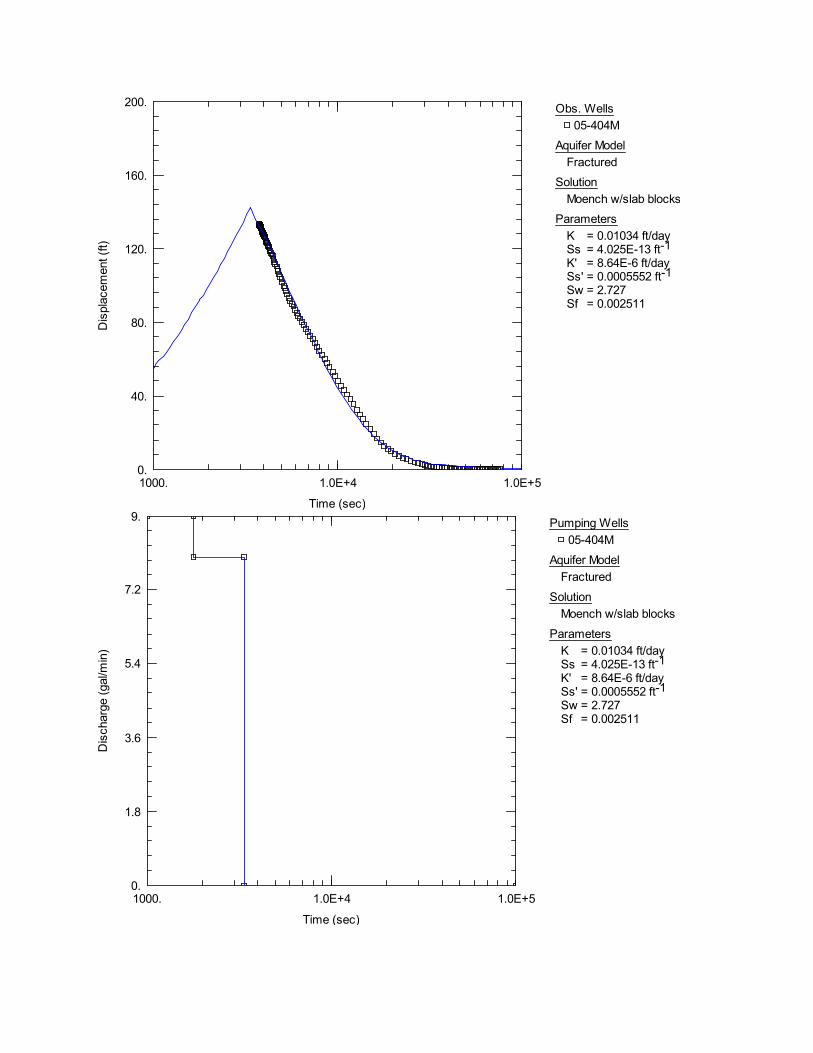
level recovery data. With the exception of boring 05-404M, the pump assembly remained in the
borehole during the water-level recovery period. Because boring 05-404M was an angled boring, it
was not possible to install the pressure transducer without removing the pump assembly.
The NTW boreholes were dewatered by inserting tubing into the well to a depth of approximately
200 feet and blowing high-pressure air supplied by an air compressor into the borehole to displace
water from the borehole. This process allowed for the rapid removal (less than one minute) of water
from the borehole resulting in a slug-test. Following dewatering, the tubing assembly was quickly
removed from the borehole, a pressure transducer was installed, and the water level was allowed to
recover. Additional details on the testing are provided in Table 4.
9
3.1.2 Groundwater Sampling
Groundwater samples were collected from three of the deep borings at the site. Two of the samples
were collected from 6-in diameter exploratory boreholes. The remaining sample was collected from
the water supply well (Unique Well Number 717972). This well is open to both the Duluth Complex
(20-150 feet below ground surface) and the Virginia Formation (150-200 feet below ground surface).
The 6-inch boreholes contained large quantities of drilling fluid and were developed to the extent
possible by overpumping prior to sampling. The sample from 05-401M was collected after the
borehole had been dewatered 5 times despite the fact that it still had a cloudy appearance. Following
development, groundwater samples were collected into laboratory supplied containers and submitted
to Northeast Technical Services for laboratory analysis of total metals, dissolved metals and general
chemistry parameters. Groundwater laboratory parameters and methods are provided in Table 1.
3.2 Field Investigation Observations and Results
Aquifer Performance Testing
Results from the ten aquifer performance tests that were conducted in the exploratory borings are
shown in Table 6. Data and results from aquifer testing are presented in Appendix B. The aquifer
tests that were conducted in the 6-inch diameter boreholes (05-401M, 05-404M, 05-407M, 05-411M)
were analyzed using the Moench solution for a pumping test in a fractured aquifer with slab blocks
(Moench, 1984). The Moench solution (1984) is an analytical solution for predicting water-level
displacements in response to pumping in a fractured aquifer assuming a double-porosity model with
slab-shaped matrix blocks with fracture skin and wellbore skin. The method solves for the hydraulic
conductivity and storage for both the fractures and the rock matrix and provides information on the
wellbore skin and fracture skin.
The aquifer tests that were conducted in the NTW holes were analyzed using the Bouwer-Rice
solution for a slug test (Bouwer and Rice, 1976), with the exception of the test conducted in borehole
05-414C. At this location, the Bouwer and Rice solution could not match the observed water level
data. That is, the Bouwer and Rice solution is a straight line solution, requiring data plotted on log
paper lie on a straight line. The data from borehole 05-414C did not meat this requirement. This test
was instead analyzed using the KGS model (Hyder et al., 1994). Unlike the Bouwer and Rice
solution, the KGS model assumes that flow into the well is unsteady.
Hydraulic conductivity values measured in the Duluth Complex boreholes ranged from 2.6 x10⁻⁴
feet/day to 4.1 x 10⁻² feet/day, with a geometric mean of 2.3 x 10⁻³ feet/day. It is worth noting that
10
eight of the ten boreholes terminate in the Virginia Formation, which is generally more permeable.
However, because less the 5% of the borehole length was within the Virginia Formation, it likely
does not significantly affect the results of the aquifer testing.
These values fall within the expected range of hydraulic conductivities for the Duluth Complex.
Siegel and Ericson (1980) report specific capacities of 0.11 and 0.02 (gal/min)/ft for two Duluth
Complex wells located between 10-20 miles northeast of the Site. Hydraulic conductivities can be
estimated from this data using the methodology of Razack and Huntley (1991). The results are
hydraulic conductivity values of 1.6 x10⁻² feet/day and 2.8 x10⁻³ feet/day respectively.
3.3 Analytical Results
Groundwater samples were collected from two 6-inch diameter exploratory boreholes open to the
Duluth Complex (05-407M and 05-401M) and a water supply well at the site open to the Duluth
Complex and the Virginia Formation (Unique Well Number 717972) in March 2005. The analytical
results are presented in Table 7. Since the ultimate fate of the mine pit water is not known, analytical
results are compared to the Minnesota Surface Water Quality Class 2B Chronic and the Lake
Superior Basin Water Quality Class 2B Chronic criteria for the sake of comparison. Because a
receiving water has not been identified at this time, a hardness of 50 mg/l was used to derive the
criteria.
The water sample from boring 05-407M exceeded the criteria for ammonia (1,900 ug/l), pH (9.8),
aluminum (39,900 ug/l), chromium (42 ug/l), cobalt (19.9 ug/l), copper (587 ug/l), lead (9.5 ug/l),
mercury (0.0034 ug/l), nickel (172 ug/l), and silver (7.4 ug/l). The sample from boring 05-401M
exceeded criteria for ammonia (610 ug/l), aluminum (3170 ug/l), copper (53.3 ug/l), and silver (1.1
ug/l).
11
4.0 Quality Assurance
A quality assurance and quality control review was performed on the analytical results from the sampling
event. This review was performed in accordance with the Barr Engineering Standard Operating
Procedure for data validation, which is based on “The National Functional Guidelines for Organic and
Inorganic Data Review” (EPA 1999/2004). All methyl mercury analysis was performed by Frontier
Geosciences, Inc. located in Seattle, Washington and all other analysis was performed by Northeast
Technical Services located in Virginia, Minnesota.
Field procedures were evaluated using an equipment blank (mercury only) and a trip blank (methyl
mercury only) and laboratory procedures were evaluated utilizing technical holding times, accuracy and
precision data, masked duplicate samples and data package completeness.
The equipment blank had a detection of mercury near the reporting limit. All data within five times the
blank value were qualified as potentially false positive. The trip blank was non-detect for methyl mercury.
Technical holding times were evaluated for each sample and target parameter, based on the EPA
recommendations listed in 40 CFR SW8-46 “Test Methods for Evaluating Hazardous Waste”. All
holding times were met. No laboratory accuracy and precision data were included in the data packages
for examination, however the laboratory indicated that the laboratory control sample (LCS) for
molybdenum and the matrix spike (MS) for potassium were not within control limits. All molybdenum
data associated with this LCS were qualified and should be considered potentially biased low. All
potassium data associated with this MS were qualified and should be considered potentially biased high.
No remaining data was qualified.
One masked duplicate was collected and submitted to the laboratory with the project samples. The
precision between this duplicate and the original sample was evaluated by comparing the data and
calculating the relative percent difference (RPD) according the equation below.
RPD = Amount in Spike 1 - Amount in Spike 2 X 100
0.5(Amount in Spike 1 + Amount in Spike 2)
The boron analysis showed the sample at <3.5µg/L while its masked duplicate had a value of
3.8µg/L. In addition, the sample had a nitrate plus nitrite value of 0.1 mg/L while the masked
duplicate had a value of 0.9mg/L. Since all of these values are near the analytical detection limit, it
12
does not represent a large data variability problem and no data was qualified. All remaining RPD’s
fell within acceptable laboratory control limits (<30%) for all remaining target compounds.
Data completeness is evaluated by comparing the analysis requested with the data package as
received. The laboratory chain of custody listed the sample collection date as 2/10/05 when the
actual date was 3/10/05. The laboratory report contains the correct date. All data was received
complete.
All data met the data project requirements and is deemed acceptable with the previously mentioned
qualifications for the purposes of this project.
13
5.0 Summary and Conclusions
The purpose of the Hydrogeologic Investigation was to gather information on the ability of the
surficial sediment and the Duluth Complex to transmit water to the proposed NorthMet pit, to
characterize the quality of the water found in these formations, and to gather preliminary information
on the geotechnical properties of the surficial sediment.
5.1 Surficial Aquifer
Ten shallow borings were advanced through the surficial sediment at the Site, terminating in
bedrock, in order to visually inspect the sediment encountered and to perform aquifer performance
tests. Three of the surficial aquifer borings were converted to monitoring wells, from which
groundwater samples were collected. The surficial sediment across the site are relatively
heterogeneous, ranging from very dense clay to well-sorted sand. As a result, the ability of the
surficial aquifer to transmit water was highly variable depending on location. Hydraulic conductivity
values varied between 0.012 feet/day and 31 feet/day. With the exception of MW-05-02, values of
hydraulic conductivity determined at each location were within the expected range of values for the
material these wells were screened in.
Water chemistry varied by location within the surficial aquifer. Water quality criteria (2B Cronic)
were exceeded at more than one location for a select group of metals, most notably aluminum,
copper, and mercury. The occurrence of these metals is likely associated with the presence of the
Duluth-Complex bedrock as described further in Section 5.2.
5.2 Duluth Complex
Aquifer testing was conducted on ten of the exploration borings completed in the Duluth Complex.
In addition, water samples for laboratory analysis were collected from two of the 6-inch diameter
exploration boreholes and the water supply well. Hydraulic conductivity values measured in the
Duluth Complex boreholes ranged from 2.6 x10⁻⁴ feet/day to 4.1 x 10⁻² feet/day, with a geometric
mean of 2.3 x 10⁻³ feet/day. These values fall within the range of hydraulic conductivities for the
Duluth Complex reported by Siegel and Ericson (1980).
Water quality in the exploratory boreholes was variable. Water quality criteria were exceeded for
ammonia, aluminum, copper, and silver in both boreholes. The sample collected from the supply
14
well did not exceed water quality standards. The occurrence of aluminum, copper, iron, and
manganese in these boreholes are directly attributable to the Duluth Complex, in general, and the
Copper-Nickel region of the complex in particular. These results are consistent with the findings
presented in the U.S. Geological Survey Copper-Nickel Study Region report (Siegel and Ericson,
1980), which found elevated copper (up to 190 ug/L), cobalt (up to 46 ug/L), and nickel (up to 120
ug/L) concentrations in groundwater samples collected from the surficial material directly over the
mineralized zone of the Duluth Complex. The study also found elevated concentrations of iron (up to
67 mg/L), aluminum (up to 200 ug/L), and manganese (up to 26 mg/L) in the region (Siegel and
Ericson, 1980). The presence of ammonia in the deep boreholes may indicate that the water in the
borehole came from the shallow surficial deposits. Ammonia is not typically found in deep bedrock
systems but is common in wetland environments.
5.3 Conclusions
The results of this study provide information on the hydrogeologic properties of the surficial aquifer
system and the Duluth Complex. The data collected as part of this study are consistent with the
assumptions that were used in the initial mine pit water balance that was presented in the EAW. That
is, the average value of hydraulic conductivity of the Duluth Complex found as part of this study
(0.0023 feet/day) is similar to the lower value that was used in the preliminary SEEP modeling of the
pits (0.0017 feet/day). In addition, the preliminary conceptual model assumed that the surficial
material is relatively thin (less than 20 feet) and does not have a high bulk transmissivity. This is
consistent with the finding from this investigation, where the average depth to bedrock was
approximately 13.5 feet and the hydraulic conductivity ranged from 31 to 0.012 feet/day.
Additional data is needed to determine the overall water balance for the mine pit. A Phase II
Hydrogeologic Investigation, conducted in the winter of 2005/2006, will help determine the aquifer
properties for the Virginia Formation, which will likely be encountered along portions of the northern
mine pit wall. This investigation involved aquifer tests and groundwater sampling. Following the
completion of the Phase II Hydrogeologic Investigation, a more detailed water balance for the mine
pit will be conducted.
15
References
Barr Engineering Company (Barr), 2005. Hydrogeologic Investigation Work Plan for the PolyMet
NorthMet Mine Site. Prepared on behalf of PolyMet Mining, Inc., March 29, 2005.
Bouwer, H. and R.C. Rice, 1976. A slug test method for determining hydraulic conductivity of
unconfined aquifers with completely or partially penetrating wells, Water Resources Research, vol.
12, no. 3, pp. 423-428.
Freeze, R.A., and J.A. Cherry, 1979. Groundwater. Englewood Cliffs, N.J.: Prentice Hall.
Kruseman, G.P. and N.A. DeRidder, 2000. Analysis and Evaluation of Pumping Test Data (2nd ed.),
Publication 47, Intern. Inst. for Land Reclamation and Improvement, Wageningen, The Netherlands,
370p.
Hyder, Z, J.J. Butler, Jr., C.D. McElwee and W. Liu, 1994. Slug tests in partially penetrating wells,
Water Resources Research, vol. 30, no. 11, pp. 2945-2957.
Moench, A.F., 1984. Double-porosity models for a fissured groundwater reservoir with fracture skin,
Water Resources Research, vol. 20, no. 7, pp. 831-846.
Razack, M. and D. Huntley, 1991. Assessing transmissivity from specific capacity in a large and
heterogeneous alluvial aquifer, Ground Water, vol. 29, no. 6, pp. 856-861.
Siegel, D.I., and D.W. Ericson, 1980. Hydrology and water quality of the copper-nickel study
region, Northeastern Minnesota, U.S. Geological Survey, Water-Resources Investigations 80-739.
Theis, C.V., 1935. The relation between the lowering of the piezometric surface and the rate and
duration of discharge of a well using groundwater storage, Am. Geophys. Union Trans., vol. 16, pp.
519-524.

Tables
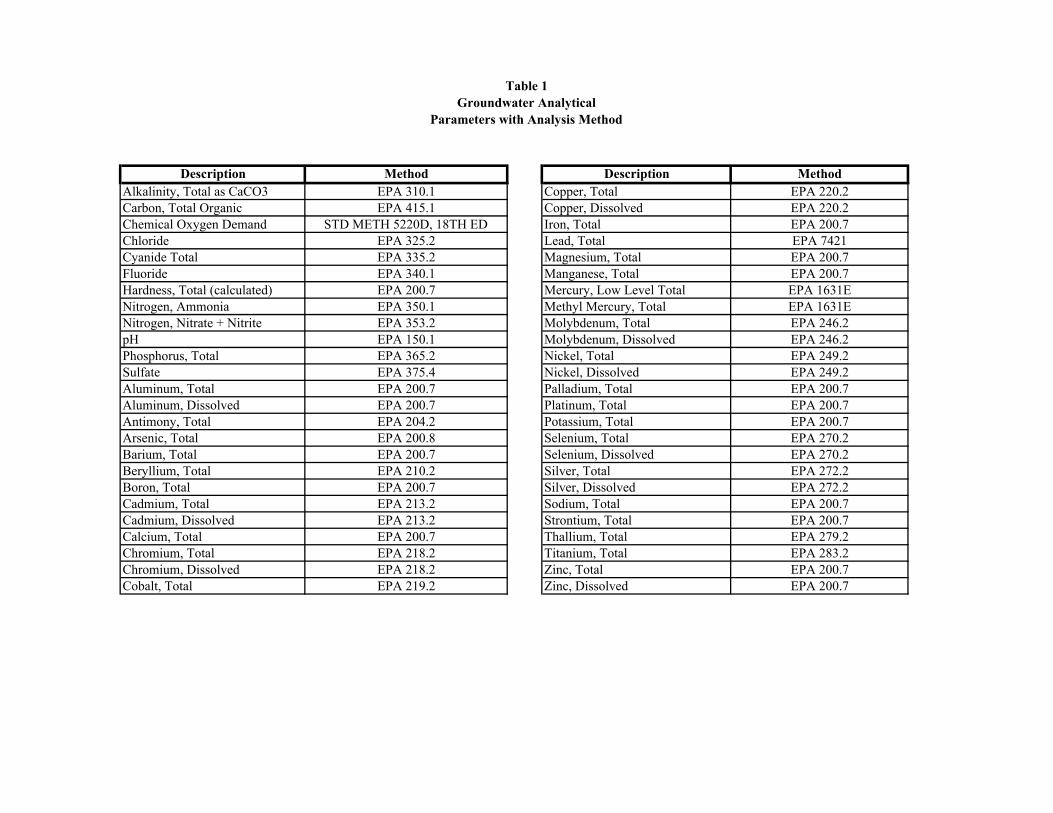
Table 1
Groundwater Analytical
Parameters with Analysis Method
Description Method Description Method
Alkalinity, Total as CaCO3 EPA 310.1 Copper, Total EPA 220.2
Carbon, Total Organic EPA 415.1 Copper, Dissolved EPA 220.2
Chemical Oxygen Demand STD METH 5220D, 18TH ED Iron, Total EPA 200.7
Chloride EPA 325.2 Lead, Total EPA 7421
Cyanide Total EPA 335.2 Magnesium, Total EPA 200.7
Fluoride EPA 340.1 Manganese, Total EPA 200.7
Hardness, Total (calculated) EPA 200.7 Mercury, Low Level Total EPA 1631E
Nitrogen, Ammonia EPA 350.1 Methyl Mercury, Total EPA 1631E
Nitrogen, Nitrate + Nitrite EPA 353.2 Molybdenum, Total EPA 246.2
pH EPA 150.1 Molybdenum, Dissolved EPA 246.2
Phosphorus, Total EPA 365.2 Nickel, Total EPA 249.2
Sulfate EPA 375.4 Nickel, Dissolved EPA 249.2
Aluminum, Total EPA 200.7 Palladium, Total EPA 200.7
Aluminum, Dissolved EPA 200.7 Platinum, Total EPA 200.7
Antimony, Total EPA 204.2 Potassium, Total EPA 200.7
Arsenic, Total EPA 200.8 Selenium, Total EPA 270.2
Barium, Total EPA 200.7 Selenium, Dissolved EPA 270.2
Beryllium, Total EPA 210.2 Silver, Total EPA 272.2
Boron, Total EPA 200.7 Silver, Dissolved EPA 272.2
Cadmium, Total EPA 213.2 Sodium, Total EPA 200.7
Cadmium, Dissolved EPA 213.2 Strontium, Total EPA 200.7
Calcium, Total EPA 200.7 Thallium, Total EPA 279.2
Chromium, Total EPA 218.2 Titanium, Total EPA 283.2
Chromium, Dissolved EPA 218.2 Zinc, Total EPA 200.7
Cobalt, Total EPA 219.2 Zinc, Dissolved EPA 200.7
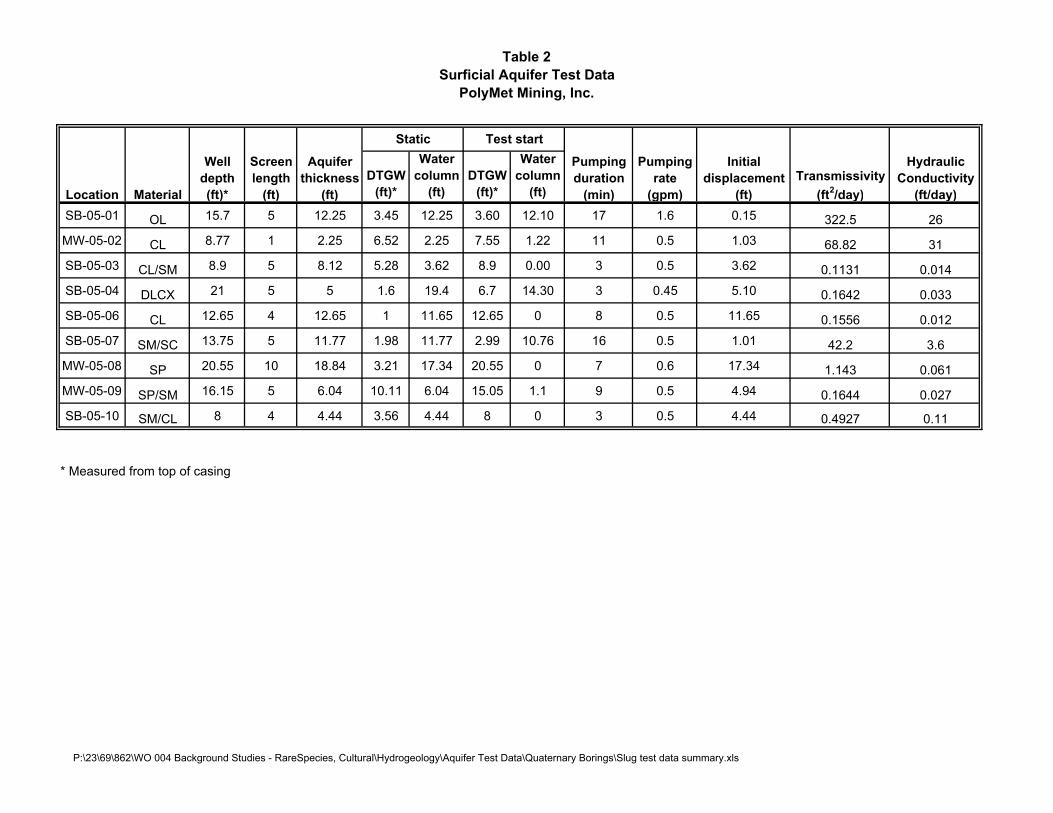
Table 2
Surficial Aquifer Test Data
PolyMet Mining, Inc.
DTGW
(ft)*
Water
column
(ft)
DTGW
(ft)*
Water
column
(ft)
SB-05-01 OL 15.7 5 12.25 3.45 12.25 3.60 12.10 17 1.6 0.15 322.5 26
MW-05-02 CL 8.77 1 2.25 6.52 2.25 7.55 1.22 11 0.5 1.03 68.82 31
SB-05-03 CL/SM 8.9 5 8.12 5.28 3.62 8.9 0.00 3 0.5 3.62 0.1131 0.014
SB-05-04 DLCX 21 5 5 1.6 19.4 6.7 14.30 3 0.45 5.10 0.1642 0.033
SB-05-06 CL 12.65 4 12.65 1 11.65 12.65 0 8 0.5 11.65 0.1556 0.012
SB-05-07 SM/SC 13.75 5 11.77 1.98 11.77 2.99 10.76 16 0.5 1.01 42.2 3.6
MW-05-08 SP 20.55 10 18.84 3.21 17.34 20.55 0 7 0.6 17.34 1.143 0.061
MW-05-09 SP/SM 16.15 5 6.04 10.11 6.04 15.05 1.1 9 0.5 4.94 0.1644 0.027
SB-05-10 SM/CL 8 4 4.44 3.56 4.44 8 0 3 0.5 4.44 0.4927 0.11
* Measured from top of casing
Location
Static Test start
Well
depth
(ft)*
Screen
length
(ft)
Aquifer
thickness
(ft)Material
Pumping
duration
(min)
Pumping
rate
(gpm)
Initial
displacement
(ft)
Hydraulic
Conductivity
(ft/day)
Transmissivity
(ft2/day)
P:\23\69\862\WO 004 Background Studies - RareSpecies, Cultural\Hydrogeology\Aquifer Test Data\Quaternary Borings\Slug test data summary.xls
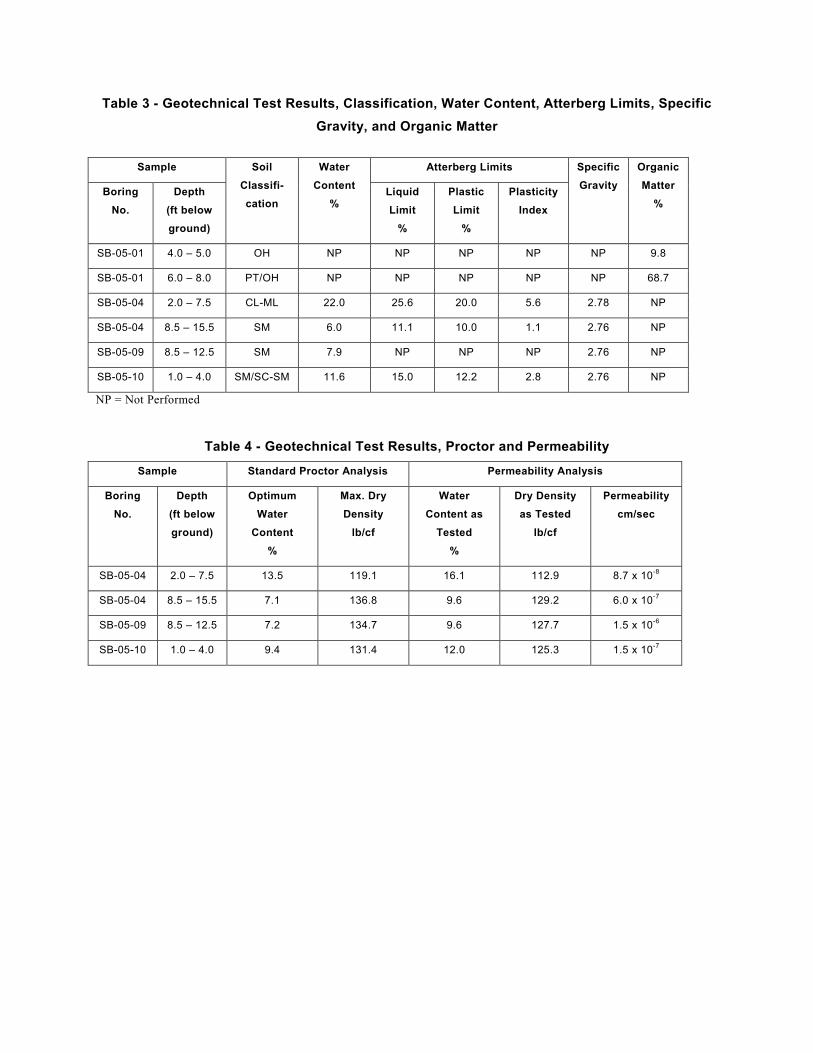
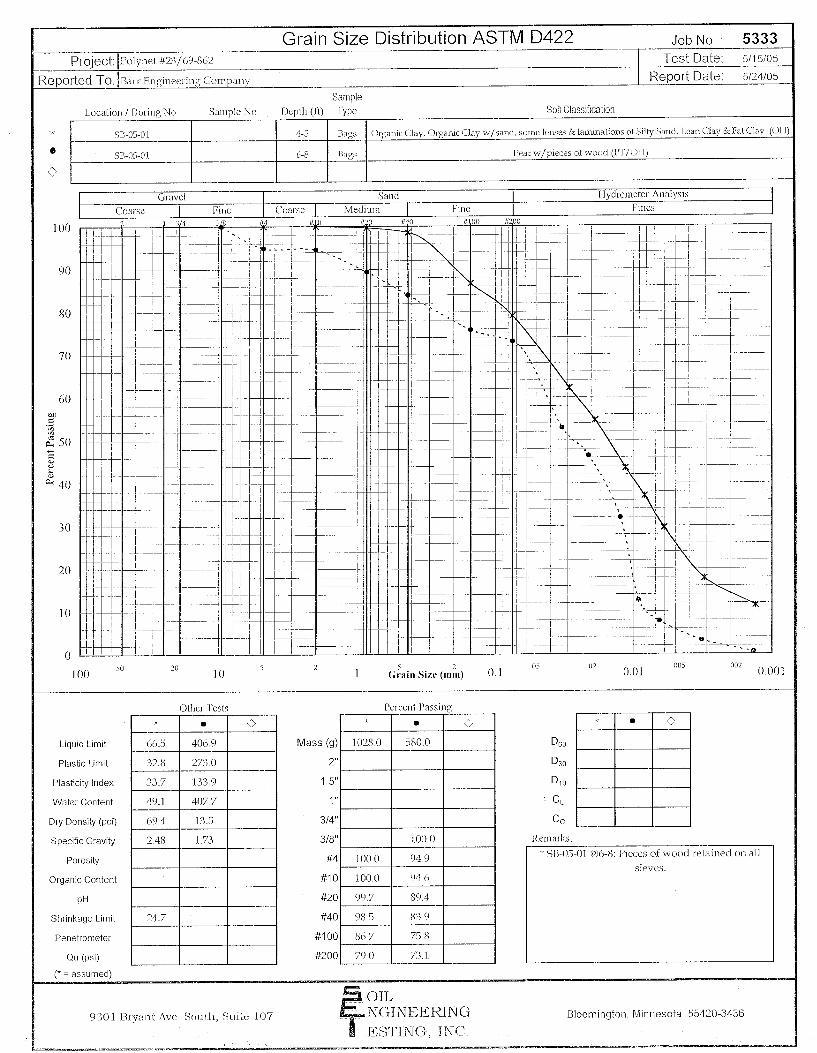
Table 3 - Geotechnical Test Results, Classification, Water Content, Atterberg Limits, Specific
Gravity, and Organic Matter
Sample Atterberg Limits
Boring
No.
Depth
(ft below
ground)
Soil
Classifi-
cation
Water
Content
% Liquid
Limit
%
Plastic
Limit
%
Plasticity
Index
Specific
Gravity
Organic
Matter
%
SB-05-01 4.0 – 5.0 OH NP NP NP NP NP 9.8
SB-05-01 6.0 – 8.0 PT/OH NP NP NP NP NP 68.7
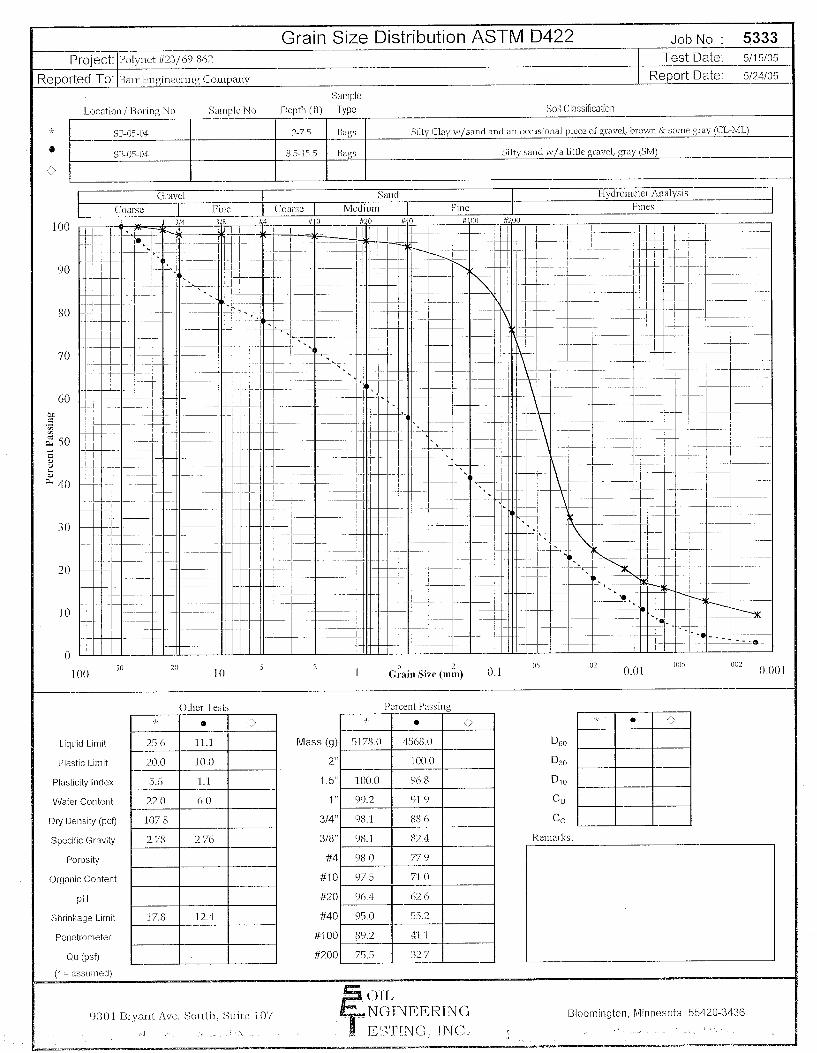
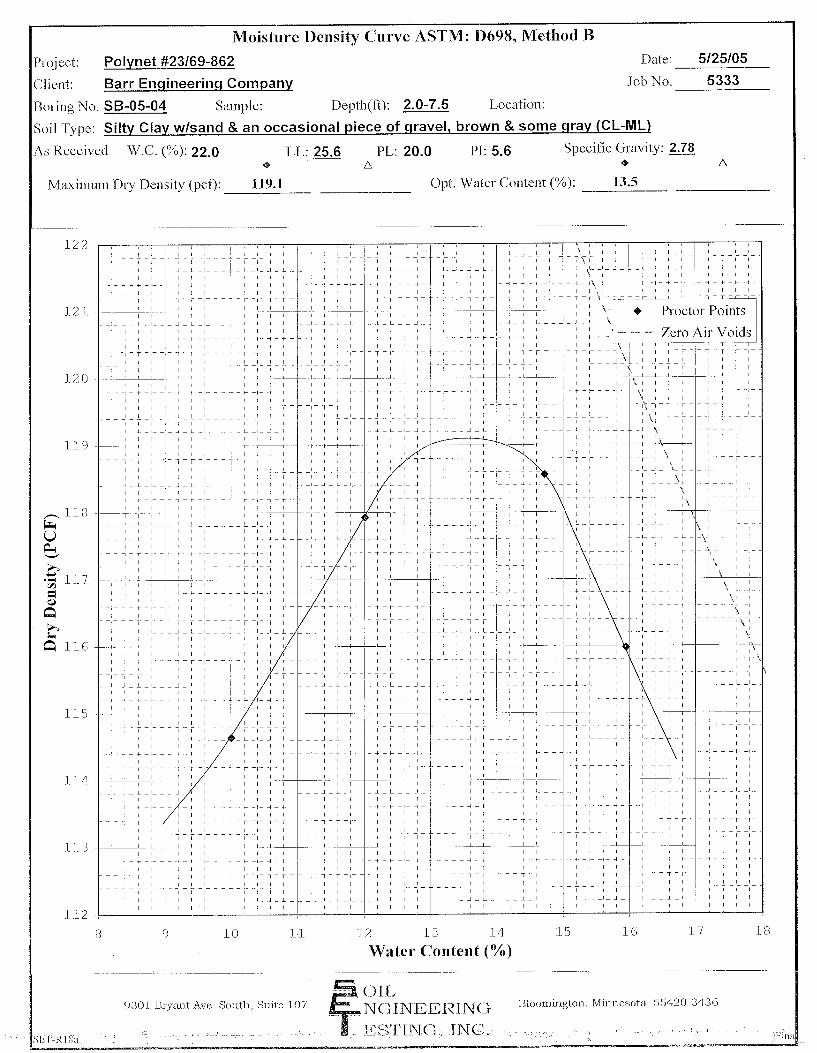
SB-05-04 2.0 – 7.5 CL-ML 22.0 25.6 20.0 5.6 2.78 NP
SB-05-04 8.5 – 15.5 SM 6.0 11.1 10.0 1.1 2.76 NP
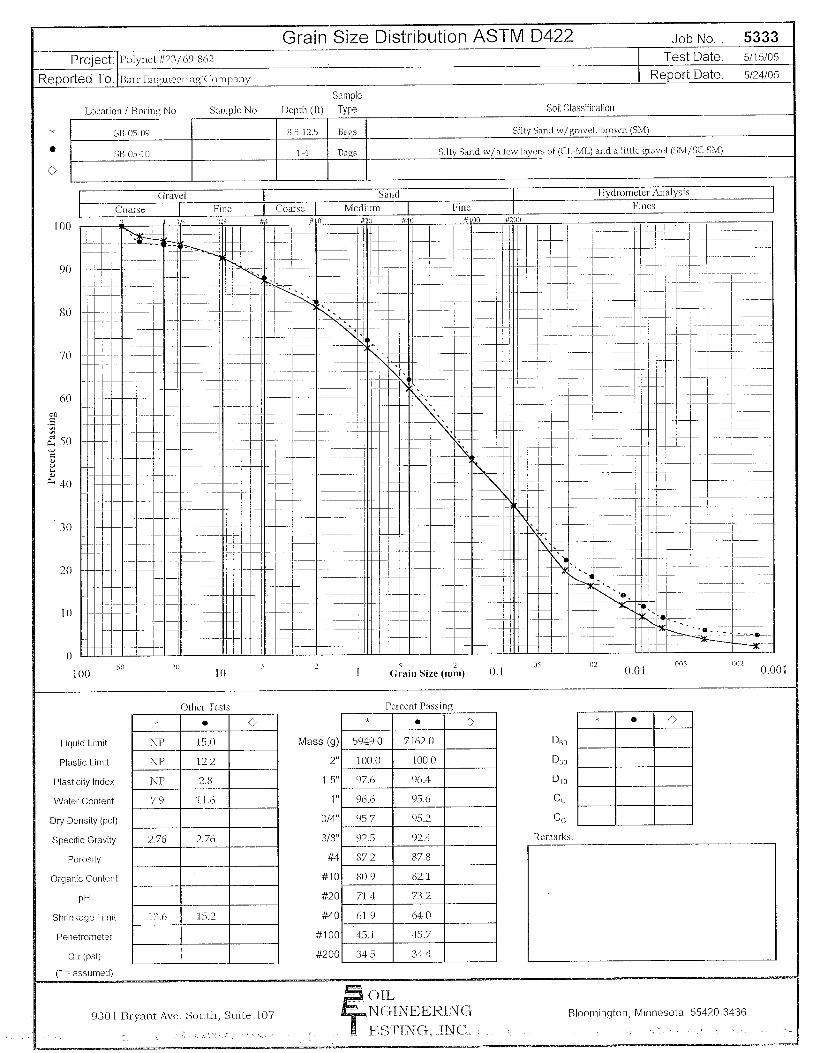
SB-05-09 8.5 – 12.5 SM 7.9 NP NP NP 2.76 NP
SB-05-10 1.0 – 4.0 SM/SC-SM 11.6 15.0 12.2 2.8 2.76 NP
NP = Not Performed
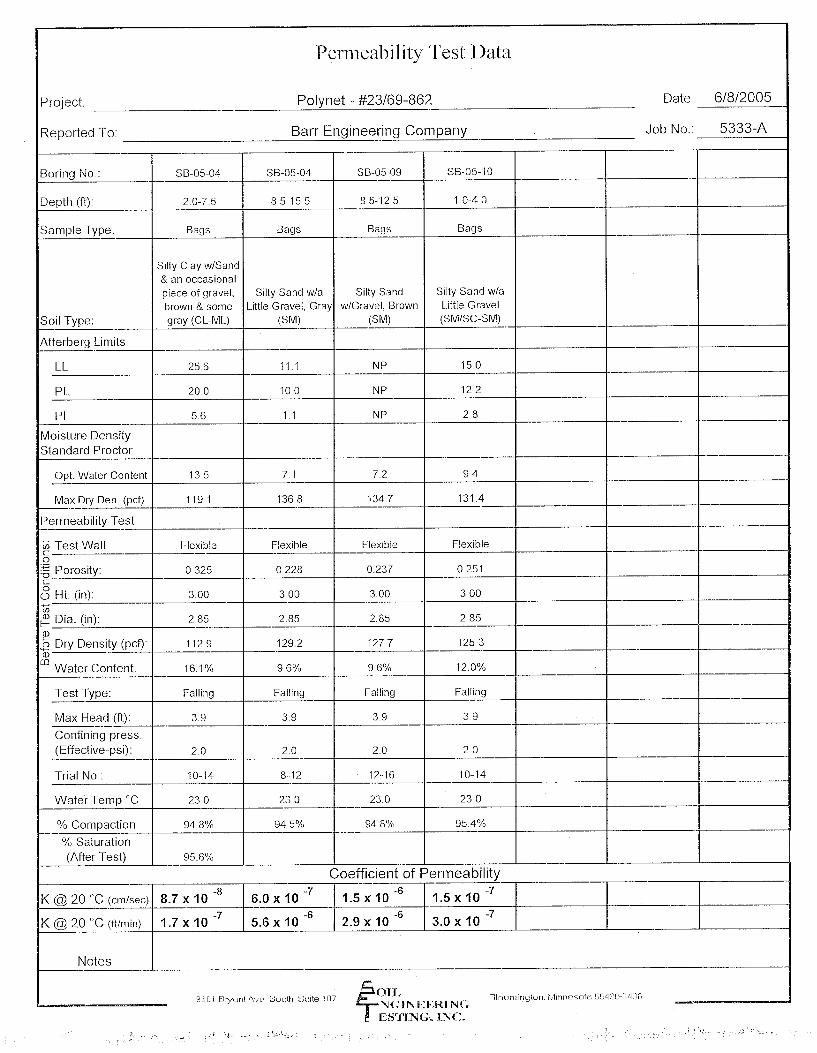
Table 4 - Geotechnical Test Results, Proctor and Permeability
Sample Standard Proctor Analysis Permeability Analysis
Boring
No.
Depth
(ft below
ground)
Optimum
Water
Content
%
Max. Dry
Density
lb/cf
Water
Content as
Tested
%
Dry Density
as Tested
lb/cf
Permeability
cm/sec
SB-05-04 2.0 – 7.5 13.5 119.1 16.1 112.9 8.7 x 10⁻⁸
SB-05-04 8.5 – 15.5 7.1 136.8 9.6 129.2 6.0 x 10⁻⁷
SB-05-09 8.5 – 12.5 7.2 134.7 9.6 127.7 1.5 x 10⁻⁶
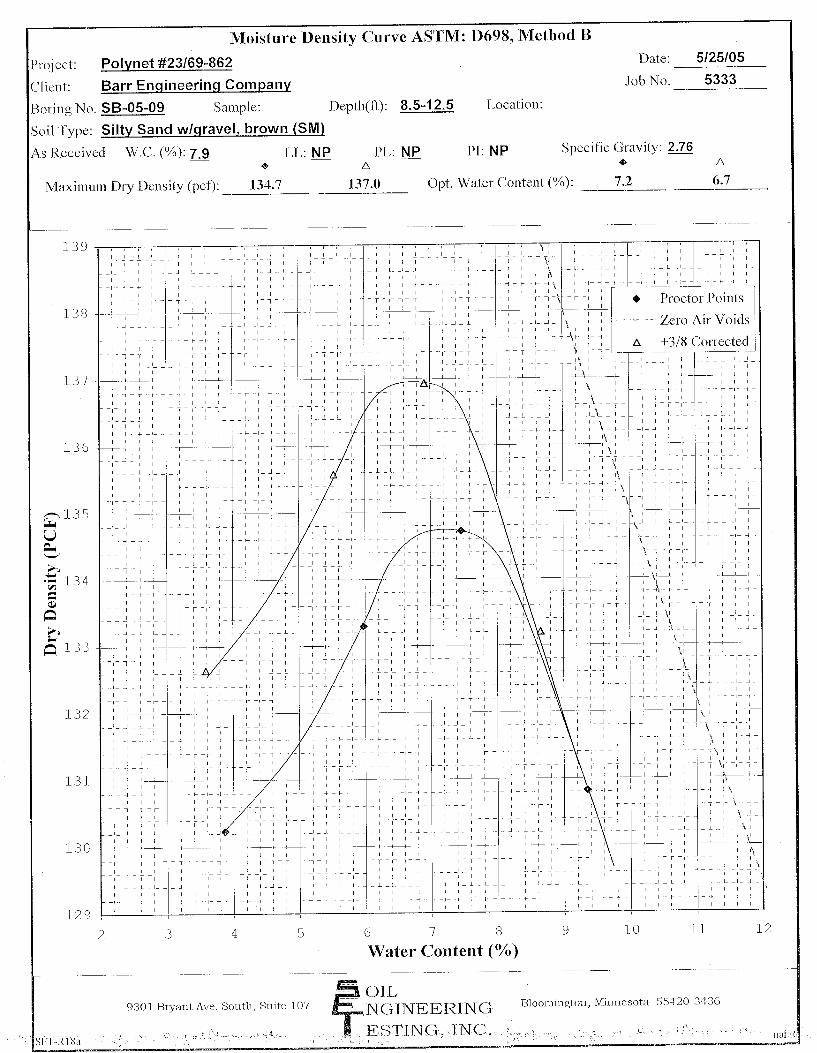
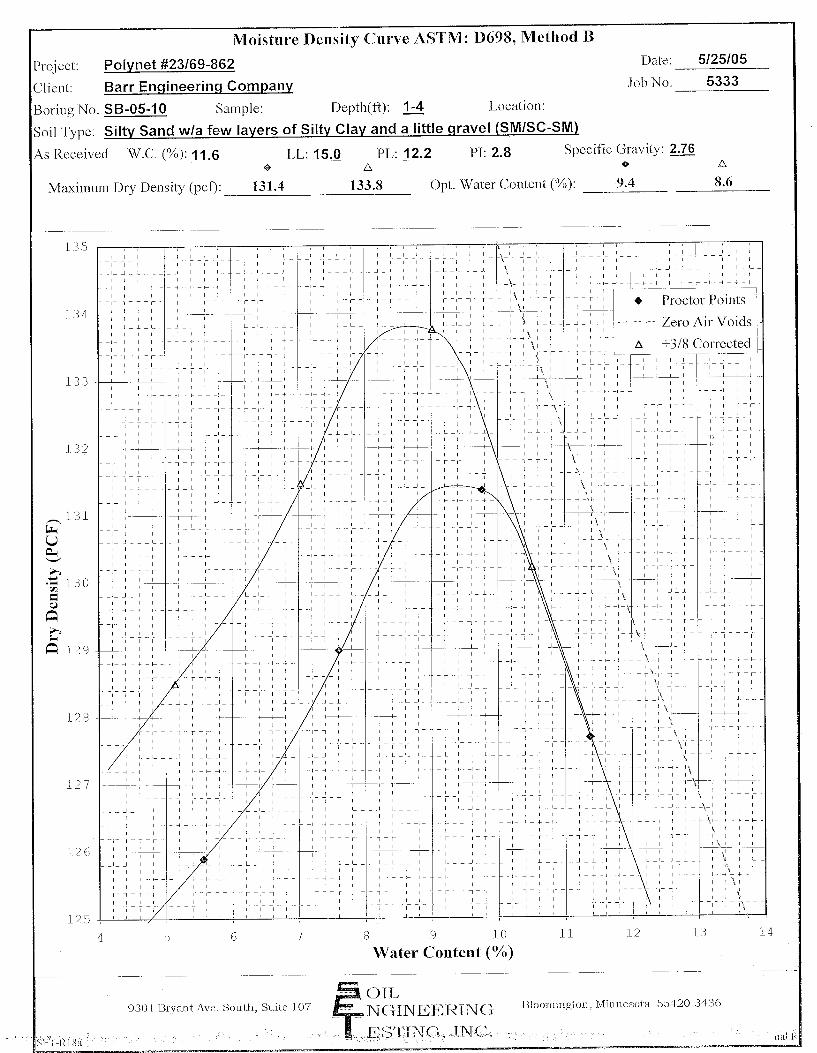
SB-05-10 1.0 – 4.0 9.4 131.4 12.0 125.3 1.5 x 10⁻⁷
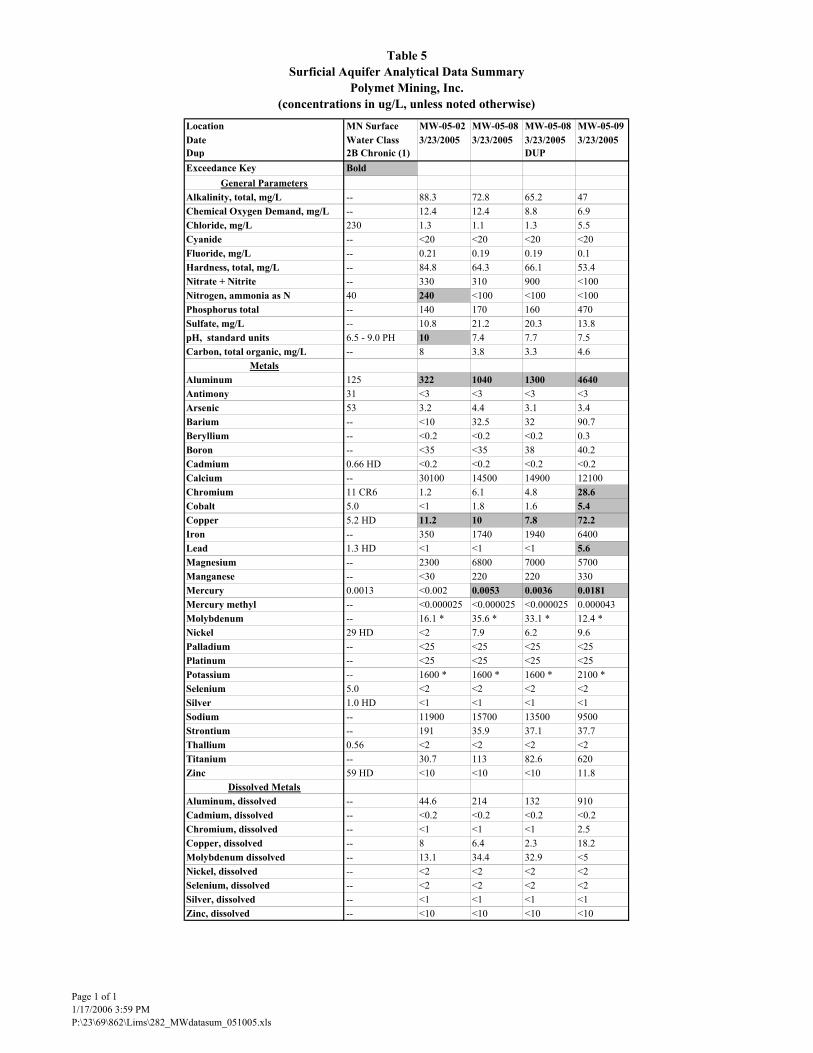
Table 5
Surficial Aquifer Analytical Data Summary
Polymet Mining, Inc.
(concentrations in ug/L, unless noted otherwise)
Location MN Surface MW-05-02 MW-05-08 MW-05-08 MW-05-09
Date Water Class 3/23/2005 3/23/2005 3/23/2005 3/23/2005
Dup 2B Chronic (1) DUP
Exceedance Key Bold
General Parameters
Alkalinity, total, mg/L -- 88.3 72.8 65.2 47
Chemical Oxygen Demand, mg/L -- 12.4 12.4 8.8 6.9
Chloride, mg/L 230 1.3 1.1 1.3 5.5
Cyanide -- <20 <20 <20 <20
Fluoride, mg/L -- 0.21 0.19 0.19 0.1
Hardness, total, mg/L -- 84.8 64.3 66.1 53.4
Nitrate + Nitrite -- 330 310 900 <100
Nitrogen, ammonia as N 40 240 <100 <100 <100
Phosphorus total -- 140 170 160 470
Sulfate, mg/L -- 10.8 21.2 20.3 13.8
pH, standard units 6.5 - 9.0 PH 10 7.4 7.7 7.5
Carbon, total organic, mg/L -- 8 3.8 3.3 4.6
Metals
Aluminum 125 322 1040 1300 4640
Antimony 31 <3 <3 <3 <3
Arsenic 53 3.2 4.4 3.1 3.4
Barium -- <10 32.5 32 90.7
Beryllium -- <0.2 <0.2 <0.2 0.3
Boron -- <35 <35 38 40.2
Cadmium 0.66 HD <0.2 <0.2 <0.2 <0.2
Calcium -- 30100 14500 14900 12100
Chromium 11 CR6 1.2 6.1 4.8 28.6
Cobalt 5.0 <1 1.8 1.6 5.4
Copper 5.2 HD 11.2 10 7.8 72.2
Iron -- 350 1740 1940 6400
Lead 1.3 HD <1 <1 <1 5.6
Magnesium -- 2300 6800 7000 5700
Manganese -- <30 220 220 330
Mercury 0.0013 <0.002 0.0053 0.0036 0.0181
Mercury methyl -- <0.000025 <0.000025 <0.000025 0.000043
Molybdenum -- 16.1 * 35.6 * 33.1 * 12.4 *
Nickel 29 HD <2 7.9 6.2 9.6
Palladium -- <25 <25 <25 <25
Platinum -- <25 <25 <25 <25
Potassium -- 1600 * 1600 * 1600 * 2100 *
Selenium 5.0 <2 <2 <2 <2
Silver 1.0 HD <1 <1 <1 <1
Sodium -- 11900 15700 13500 9500
Strontium -- 191 35.9 37.1 37.7
Thallium 0.56 <2 <2 <2 <2
Titanium -- 30.7 113 82.6 620
Zinc 59 HD <10 <10 <10 11.8
Dissolved Metals
Aluminum, dissolved -- 44.6 214 132 910
Cadmium, dissolved -- <0.2 <0.2 <0.2 <0.2
Chromium, dissolved -- <1 <1 <1 2.5
Copper, dissolved -- 8 6.4 2.3 18.2
Molybdenum dissolved -- 13.1 34.4 32.9 <5
Nickel, dissolved -- <2 <2 <2 <2
Selenium, dissolved -- <2 <2 <2 <2
Silver, dissolved -- <1 <1 <1 <1
Zinc, dissolved -- <10 <10 <10 <10
Page 1 of 1
1/17/2006 3:59 PM
P:\23\69\862\Lims\282_MWdatasum_051005.xls
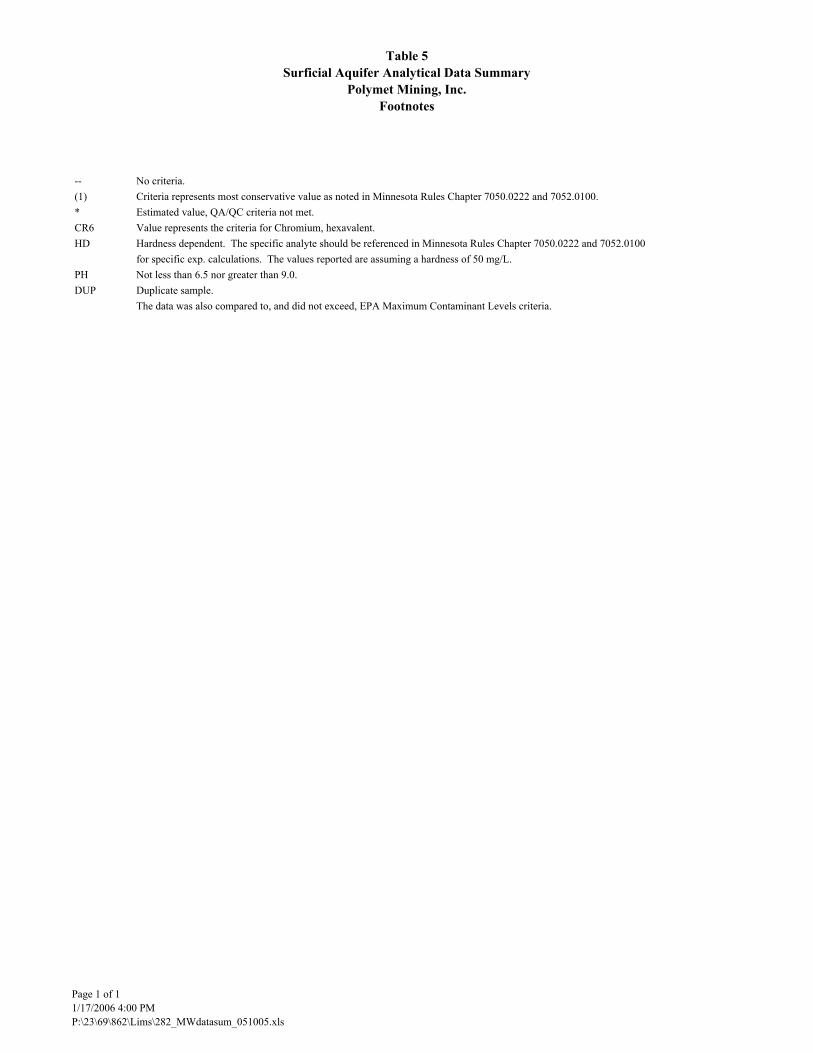
Table 5
Surficial Aquifer Analytical Data Summary
Polymet Mining, Inc.
Footnotes
-- No criteria.
(1) Criteria represents most conservative value as noted in Minnesota Rules Chapter 7050.0222 and 7052.0100.
* Estimated value, QA/QC criteria not met.
CR6 Value represents the criteria for Chromium, hexavalent.
HD Hardness dependent. The specific analyte should be referenced in Minnesota Rules Chapter 7050.0222 and 7052.0100
for specific exp. calculations. The values reported are assuming a hardness of 50 mg/L.
PH Not less than 6.5 nor greater than 9.0.
DUP Duplicate sample.
The data was also compared to, and did not exceed, EPA Maximum Contaminant Levels criteria.
Page 1 of 1
1/17/2006 4:00 PM
P:\23\69\862\Lims\282_MWdatasum_051005.xls
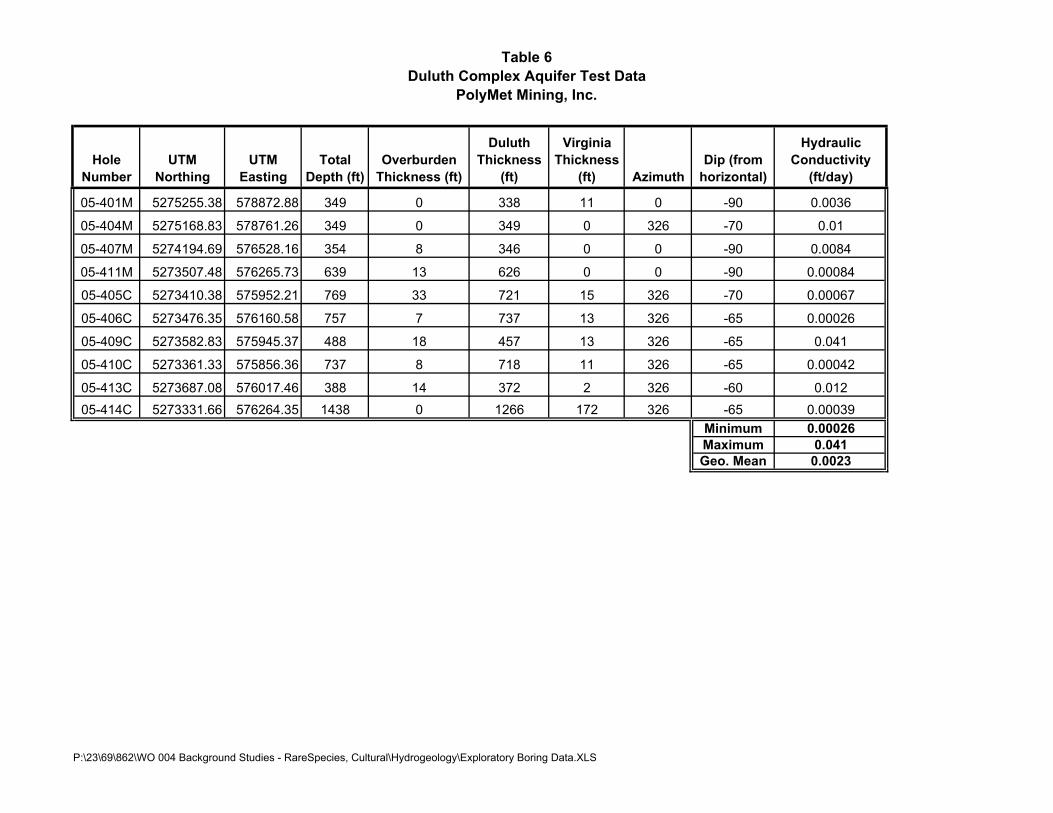
Table 6
Duluth Complex Aquifer Test Data
PolyMet Mining, Inc.
Hole
Number
UTM
Northing
UTM
Easting
Total
Depth (ft)
Overburden
Thickness (ft)
Duluth
Thickness
(ft)
Virginia
Thickness
(ft) Azimuth
Dip (from
horizontal)
Hydraulic
Conductivity
(ft/day)
05-401M 5275255.38 578872.88 349 0 338 11 0 -90 0.0036
05-404M 5275168.83 578761.26 349 0 349 0 326 -70 0.01
05-407M 5274194.69 576528.16 354 8 346 0 0 -90 0.0084
05-411M 5273507.48 576265.73 639 13 626 0 0 -90 0.00084
05-405C 5273410.38 575952.21 769 33 721 15 326 -70 0.00067
05-406C 5273476.35 576160.58 757 7 737 13 326 -65 0.00026
05-409C 5273582.83 575945.37 488 18 457 13 326 -65 0.041
05-410C 5273361.33 575856.36 737 8 718 11 326 -65 0.00042
05-413C 5273687.08 576017.46 388 14 372 2 326 -60 0.012
05-414C 5273331.66 576264.35 1438 0 1266 172 326 -65 0.00039
Minimum 0.00026
Maximum 0.041
Geo. Mean 0.0023
P:\23\69\862\WO 004 Background Studies - RareSpecies, Cultural\Hydrogeology\Exploratory Boring Data.XLS
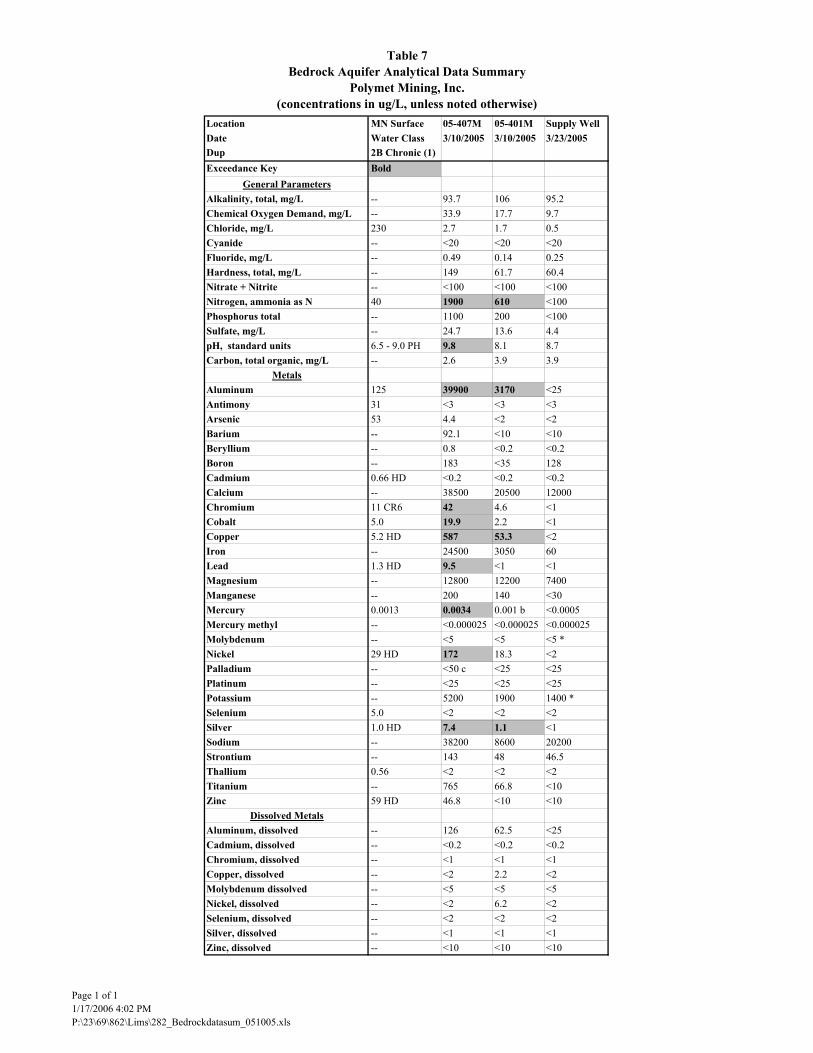
Table 7
Bedrock Aquifer Analytical Data Summary
Polymet Mining, Inc.
(concentrations in ug/L, unless noted otherwise)
Location MN Surface 05-407M 05-401M Supply Well
Date Water Class 3/10/2005 3/10/2005 3/23/2005
Dup 2B Chronic (1)
Exceedance Key Bold
General Parameters
Alkalinity, total, mg/L -- 93.7 106 95.2
Chemical Oxygen Demand, mg/L -- 33.9 17.7 9.7
Chloride, mg/L 230 2.7 1.7 0.5
Cyanide -- <20 <20 <20
Fluoride, mg/L -- 0.49 0.14 0.25
Hardness, total, mg/L -- 149 61.7 60.4
Nitrate + Nitrite -- <100 <100 <100
Nitrogen, ammonia as N 40 1900 610 <100
Phosphorus total -- 1100 200 <100
Sulfate, mg/L -- 24.7 13.6 4.4
pH, standard units 6.5 - 9.0 PH 9.8 8.1 8.7
Carbon, total organic, mg/L -- 2.6 3.9 3.9
Metals
Aluminum 125 39900 3170 <25
Antimony 31 <3 <3 <3
Arsenic 53 4.4 <2 <2
Barium -- 92.1 <10 <10
Beryllium -- 0.8 <0.2 <0.2
Boron -- 183 <35 128
Cadmium 0.66 HD <0.2 <0.2 <0.2
Calcium -- 38500 20500 12000
Chromium 11 CR6 42 4.6 <1
Cobalt 5.0 19.9 2.2 <1
Copper 5.2 HD 587 53.3 <2
Iron -- 24500 3050 60
Lead 1.3 HD 9.5 <1 <1
Magnesium -- 12800 12200 7400
Manganese -- 200 140 <30
Mercury 0.0013 0.0034 0.001 b <0.0005
Mercury methyl -- <0.000025 <0.000025 <0.000025
Molybdenum -- <5 <5 <5 *
Nickel 29 HD 172 18.3 <2
Palladium -- <50 c <25 <25
Platinum -- <25 <25 <25
Potassium -- 5200 1900 1400 *
Selenium 5.0 <2 <2 <2
Silver 1.0 HD 7.4 1.1 <1
Sodium -- 38200 8600 20200
Strontium -- 143 48 46.5
Thallium 0.56 <2 <2 <2
Titanium -- 765 66.8 <10
Zinc 59 HD 46.8 <10 <10
Dissolved Metals
Aluminum, dissolved -- 126 62.5 <25
Cadmium, dissolved -- <0.2 <0.2 <0.2
Chromium, dissolved -- <1 <1 <1
Copper, dissolved -- <2 2.2 <2
Molybdenum dissolved -- <5 <5 <5
Nickel, dissolved -- <2 6.2 <2
Selenium, dissolved -- <2 <2 <2
Silver, dissolved -- <1 <1 <1
Zinc, dissolved -- <10 <10 <10
Page 1 of 1
1/17/2006 4:02 PM
P:\23\69\862\Lims\282_Bedrockdatasum_051005.xls
Table 7
Bedrock Aquifer Analytical Data Summary
Polymet Mining, Inc.
Footnotes
-- No criteria.
(1) Criteria represents most conservative value as noted in Minnesota Rules Chapter 7050.0222 and 7052.0100.
* Estimated value, QA/QC criteria not met.
b Potential false positive value based on blank data validation procedure.
c Coeluting compound.
CR6 Value represents the criteria for Chromium, hexavalent.
HD Hardness dependent. The specific analyte should be referenced in Minnesota Rules Chapter 7050.0222 and 7052.0100
for specific exp. calculations. The values reported are assuming a hardness of 50 mg/L.
PH Not less than 6.5 nor greater than 9.0.
The data was also compared to, and did not exceed, EPA Maximum Contaminant Levels criteria.
Page 1 of 1
1/17/2006 4:02 PM
P:\23\69\862\Lims\282_Bedrockdatasum_051005.xls

Figures
Dunka Road
Mine AreaTailingsBasin Area
Inactive TailingsBasin Area
Plant Area
Area 1 Shops
Railroad Construction
SiteLocation
Barr
Foote
r: Date
: 11/5
/2004
11:44
:56 AM
File
: I:\C
lient\
Polym
et\Ma
ps\EA
W_D
R~1\F
IGUR
E~1.M
XD U
ser:
tja
0 1 20.5Miles
IFigure 1
SITE LOCATION MAPPolyMet Mining, Inc.
Hoyt Lakes, MinnesotaBasemap from MnDOT
Project BoundariesRailroads
ExistingProposedAccess Roads
!(!(
!(!( !(
!( !(
!(
!(!(
!(
!(
!(
!(
!(
!(
!(
!(
!(
!(
!(
05-414C
05-411M05-406C
05-410C05-405C05-409C
05-413C
05-407M
05-401M05-404M#22712
SB-05-03MW-05-08
SB-05-04
MW-05-09
SB-05-10
SB-05-06
MW-05-02
SB-05-01
SB-05-05
SB-05-07
0 2,500 5,0001,250 Feet
Figure 2SITE LAYOUT WITH MARCH
2005 HYDROGEOLOGICINVESTIGATION LOCATIONS
PolyMet Mining, Inc.Hoyt Lakes, Minnesota
IAllen, Babbitt, Babbitt SW, and Isaac Lake
7.5 Minute USGS Quadrangles
Barr
Foote
r: Date
: 11/2
/2006
9:28
:36 AM
File
: I:\C
lient\
Polym
et\Ma
ps\H
ydrog
eolog
ical In
vesti
gatio
n\Hyd
rogeo
logic
Borin
gs P
hase
I.mxd
Use
r: cd
p
Potential Future Mine Features
6-inch
Soil BoringMonitoring Well
Water Well
Loadout PocketOverburden StockpilesMine PitsRock Stockpiles
NTW
(Mine features based on August 2006 design)

Appendices

Appendix A
Red Flint
PRO. CASING
Type:
Interval:
GROUT
RISER CASING
Diameter:
Type:
Interval:
Cement
0-4 ft bgs
4-5 ft bgs
5-6.5 ft bgs
Barr Engineering Co
Telephone:Fax:
Bentonite
Type:
Interval:
6 inches
2 inchesDiameter:
Type:
Interval:
Medium brown sandy clay, upper 1' wet, thenmoist, very moist at 5'. Chunks of blackcrystalline rock at 5'.
0-4 ft bgs
Discoloration-Odor-Sheen
0-5 ft bgs
DEPTH
FEET
PVC
CL
Duluth Complex gabbro.
End of Boring - 18 feet
Diameter:
Type:
Interval:
Type:
Interval:
2 inches
5.5-6.5 ft bgs
SEAL
SANDPACK
SCREEN
PVC
Additional data may have been collected in the field which is not included on this log.
SHEET 1 OF 1Drill Contractor WDC Exploration & Wells
Steel
SA
MP
. LE
NG
TH&
RE
CO
VE
RY
LITH
OLO
GY
LOG OF WELL MW-05-02Project Name PolyMet Hydrogeologic Investigation
Remarks
5
10
15
SA
MP
. NU
MB
ER
EN
VIR
O L
OG
5 (5
/27/
04)
2369
862.
GP
J B
AR
RLO
G.G
DT
1/1
7/06
WELL OR PIEZOMETERCONSTRUCTION
DETAILMoi
stur
e
AS
TM DESCRIPTIONDEPTH
FEET
Drill Method Rotasonic
Logged By Jere Mohr
Drilling Started 3/14/05Number 23/69-862
Location NorthMet Mine Site
5
10
15
Total Depth 18.0
Elevation --
Client PolyMet Mining Corporation
Ended 3/15/05
SANDPACK
PVC
Wet @ 6"
Wet
Wet
Wet
Wet
Wet
2 inches
SP
SEAL
SP
SCREEN
Light brown medium to coarse silty sand.
Type:
Interval:
Discoloration-Odor-Sheen
PRO. CASING
Type:
Interval:
GROUT
RISER CASING
Diameter:
Type:
Interval:
Cement
0-5 ft bgs
5-7 ft bgs
7-17 ft bgs
7.5-17.5 ft bgs
Dark brown, well-sorted medium sand.
Dark brown, well-sorted fine to medium sand.
Grayish brown well-sorted fine to mediumsand with silt.
Gray silty clay with granite and mafic rockfragments and pebbles. (Till)
End of Boring - 28.5 feet
CL
Diameter:
Type:
Interval:
SM
SP
Project Name PolyMet Hydrogeologic Investigation
Elevation --
Client PolyMet Mining Corporation
WELL OR PIEZOMETERCONSTRUCTION
DETAIL
Natural formation allowedto cave below 17.5' bgs.
Bentonite
EN
VIR
O L
OG
5 (5
/27/
04)
2369
862.
GP
J B
AR
RLO
G.G
DT
1/1
7/06
Type:
Interval:
5
10
15
20
25
Remarks Well installed in adjacent boring (boring not logged) due to loss of casingin MW-05-08. Heaving sand - difficult drilling and well installation.
Additional data may have been collected in the field which is not included on this log.
LOG OF WELL MW-05-08
LITH
OLO
GY
SA
MP
. LE
NG
TH&
RE
CO
VE
RY
SHEET 1 OF 1
SA
MP
. NU
MB
ER
Logged By Jere Mohr
Red Flint
6 inches
2 inchesDiameter:
Type:
Interval:
Steel
0-5 ft bgs
PVC
0-7.5 ft bgs
DEPTH
FEET
Barr Engineering Co
Telephone:Fax:
Drill Contractor WDC Exploration & Wells
Total Depth 28.5
Ended 3/16/05
Drill Method Rotasonic
5
10
15
20
25
Location NorthMet Mine Site
Number 23/69-862 Drilling Started 3/16/05
AS
TM DESCRIPTIONDEPTH
FEETMoi
stur
e
Type:
Interval:
Bentonite
SM
Dry
Wet
Moist/Wet 2 inches
7.5-12.5 ft bgs
SEAL
SM
SCREEN
SP
Type:
Interval:
Diameter:
Type:
Interval:
PRO. CASING
Type:
Interval:
Topsoil.
RISER CASING
Discoloration-Odor-Sheen
Cement
0-4.5 ft bgs
4.5-6.5 ft bgs
6.5-13 ft bgs
PVC
SANDPACK
Brown, fine-grained sand with 5-10% gravel,moist.
Gray-brown, fine-grained silty sand with up to40% gravel, cobbles and boulders (angular),dry. Very difficult drilling (highly compacted).
Brown, medium to coarse sand, uniform, wet.
Brown silty sand with some clay and trace ofgravel and cobbles, moist/wet.
Gray-black, fine grained crystalline rock,magnetic (Iron formation) assumed to be aboulder.End of Boring - 13 feet
SP
Diameter:
Type:
Interval:
LITH
OLO
GY
Elevation --
Red Flint
WELL OR PIEZOMETERCONSTRUCTION
DETAIL
GROUT
EN
VIR
O L
OG
5 (5
/27/
04)
2369
862.
GP
J B
AR
RLO
G.G
DT
1/1
7/06
SA
MP
. NU
MB
ER
5
10
15
Remarks
Additional data may have been collected in the field which is not included on this log.
SHEET 1 OF 1LOG OF WELL MW-05-09
Project Name PolyMet Hydrogeologic Investigation
SA
MP
. LE
NG
TH&
RE
CO
VE
RY
Client PolyMet Mining Corporation
6 inches
2 inchesDiameter:
Type:
Interval:
Steel
0-4.5 ft bgs
PVC
0-7.5 ft bgs
DEPTH
FEET
Barr Engineering Co
Telephone:Fax:
Drill Contractor WDC Exploration & Wells
Drilling Started 3/10/05
Total Depth 13.0Logged By Mark Hagley
DEPTH
FEETDESCRIPTION
Drill Method Rotasonic
Moi
stur
e
AS
TM
Number 23/69-862
Location NorthMet Mine Site
5
10
15
Ended 3/11/05
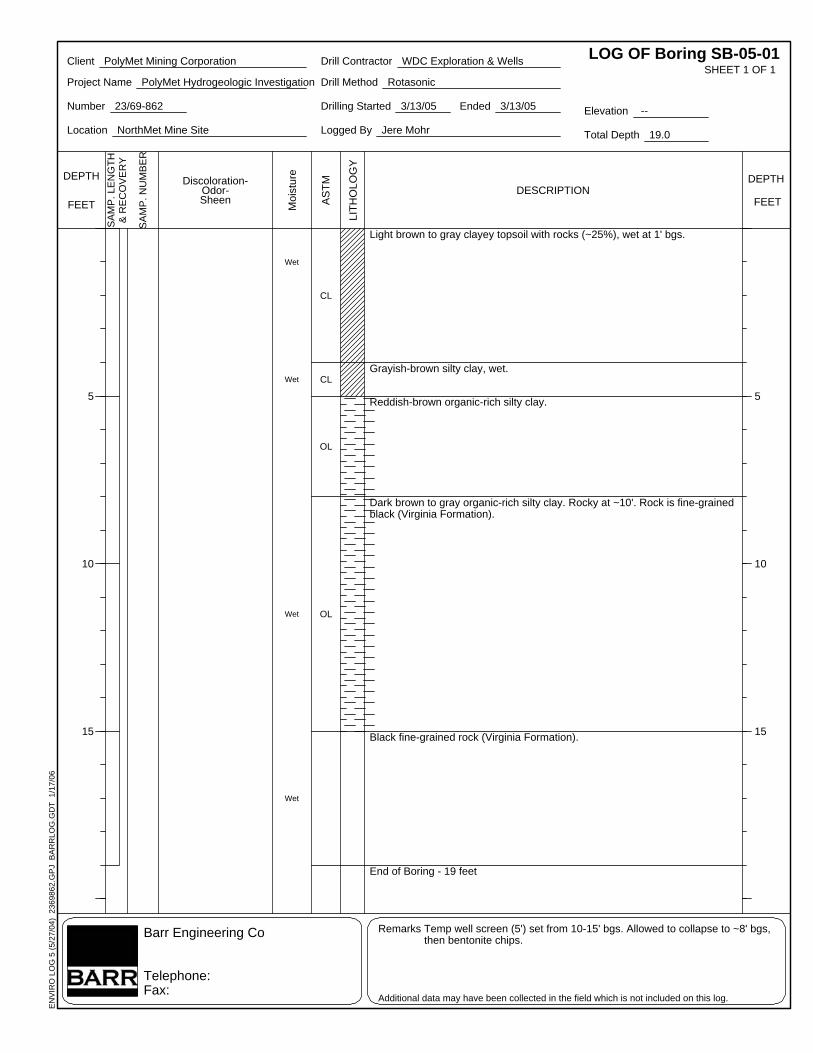
Light brown to gray clayey topsoil with rocks (~25%), wet at 1' bgs.
Logged By Jere Mohr
CL
CL
OL
Wet
Wet
Discoloration-Odor-Sheen
DEPTH
FEET
Barr Engineering Co
Telephone:Fax:
Drill Contractor WDC Exploration & Wells
Drilling Started 3/13/05 Ended 3/13/05
OL
Grayish-brown silty clay, wet.
Reddish-brown organic-rich silty clay.
Dark brown to gray organic-rich silty clay. Rocky at ~10'. Rock is fine-grainedblack (Virginia Formation).
Black fine-grained rock (Virginia Formation).
End of Boring - 19 feet
Wet
LOG OF Boring SB-05-01
Remarks Temp well screen (5') set from 10-15' bgs. Allowed to collapse to ~8' bgs,then bentonite chips.
Additional data may have been collected in the field which is not included on this log.
Client PolyMet Mining Corporation
5
10
15
SA
MP
. NU
MB
ER
LITH
OLO
GY
SA
MP
. LE
NG
TH&
RE
CO
VE
RY
SHEET 1 OF 1Project Name PolyMet Hydrogeologic Investigation
Wet
5
10
15
DEPTH
FEETDESCRIPTION
Drill Method Rotasonic
AS
TM
Location NorthMet Mine Site Total Depth 19.0
Moi
stur
e
EN
VIR
O L
OG
5 (5
/27/
04)
2369
862.
GP
J B
AR
RLO
G.G
DT
1/1
7/06
Elevation --Number 23/69-862
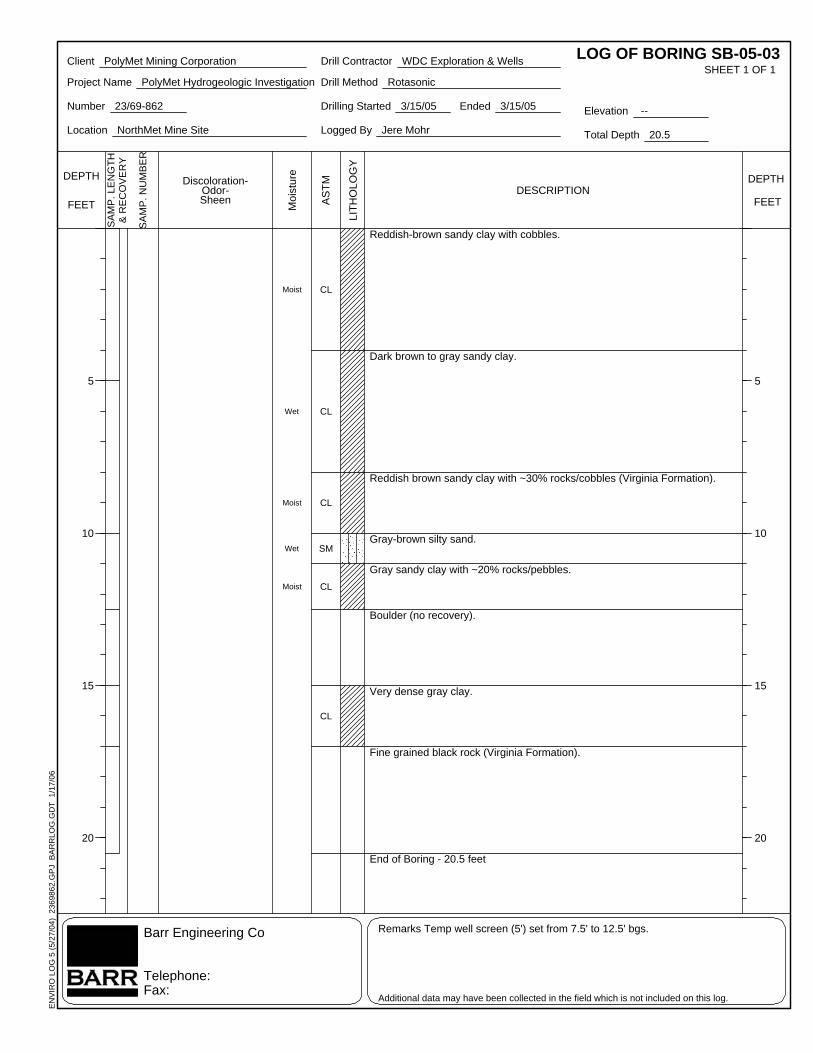
Reddish brown sandy clay with ~30% rocks/cobbles (Virginia Formation).
End of Boring - 20.5 feet
Fine grained black rock (Virginia Formation).
Very dense gray clay.
Boulder (no recovery).
Gray sandy clay with ~20% rocks/pebbles.
Reddish-brown sandy clay with cobbles.
Wet
Discoloration-Odor-Sheen
Dark brown to gray sandy clay.
CL
CL
CL
SM
CL
CL
Moist
Wet
Gray-brown silty sand.
Moist
LOG OF BORING SB-05-03Client PolyMet Mining CorporationSHEET 1 OF 1
Project Name PolyMet Hydrogeologic Investigation
Moist
LITH
OLO
GY
Total Depth 20.5
Additional data may have been collected in the field which is not included on this log.
Remarks Temp well screen (5') set from 7.5' to 12.5' bgs.
5
10
15
20
SA
MP
. NU
MB
ER
EN
VIR
O L
OG
5 (5
/27/
04)
2369
862.
GP
J B
AR
RLO
G.G
DT
1/1
7/06
Moi
stur
e
SA
MP
. LE
NG
TH&
RE
CO
VE
RY
DESCRIPTIONDEPTH
FEET
Barr Engineering Co
Telephone:Fax:
Drill Contractor WDC Exploration & Wells
Drilling Started 3/15/05 Ended 3/15/05
Logged By Jere Mohr
DEPTH
FEET
Elevation --
Drill Method Rotasonic
AS
TM
Number 23/69-862
Location NorthMet Mine Site
5
10
15
20
CL
Logged By Mark Hagley
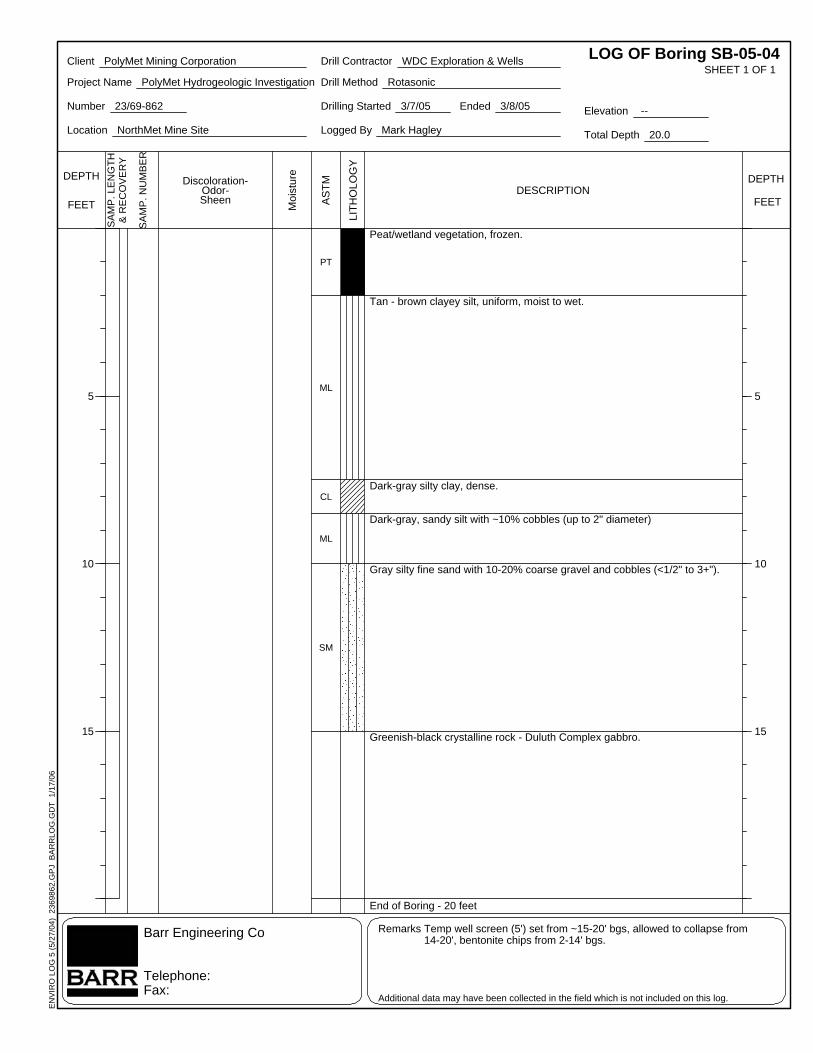
Peat/wetland vegetation, frozen.
Discoloration-Odor-Sheen
SM
DEPTH
FEET
Barr Engineering Co
Telephone:Fax:
Drill Contractor WDC Exploration & Wells
Drilling Started 3/7/05 Ended 3/8/05
PT
Tan - brown clayey silt, uniform, moist to wet.
Dark-gray silty clay, dense.
Dark-gray, sandy silt with ~10% cobbles (up to 2" diameter)
Gray silty fine sand with 10-20% coarse gravel and cobbles (<1/2" to 3+").
Greenish-black crystalline rock - Duluth Complex gabbro.
End of Boring - 20 feet
ML
LOG OF Boring SB-05-04
LITH
OLO
GY
Total Depth 20.0
ML
Client PolyMet Mining Corporation
Project Name PolyMet Hydrogeologic InvestigationSHEET 1 OF 1
SA
MP
. LE
NG
TH&
RE
CO
VE
RY
5
10
15
DEPTH
FEETDESCRIPTION
Drill Method Rotasonic
AS
TM
Additional data may have been collected in the field which is not included on this log.
Location NorthMet Mine Site
Remarks Temp well screen (5') set from ~15-20' bgs, allowed to collapse from14-20', bentonite chips from 2-14' bgs.
Moi
stur
e
EN
VIR
O L
OG
5 (5
/27/
04)
2369
862.
GP
J B
AR
RLO
G.G
DT
1/1
7/06
SA
MP
. NU
MB
ER
5
10
15
Elevation --Number 23/69-862
Barr Engineering Co
Telephone:Fax:
CL
SM
Moist
Dry
Dry
DEPTH
FEET
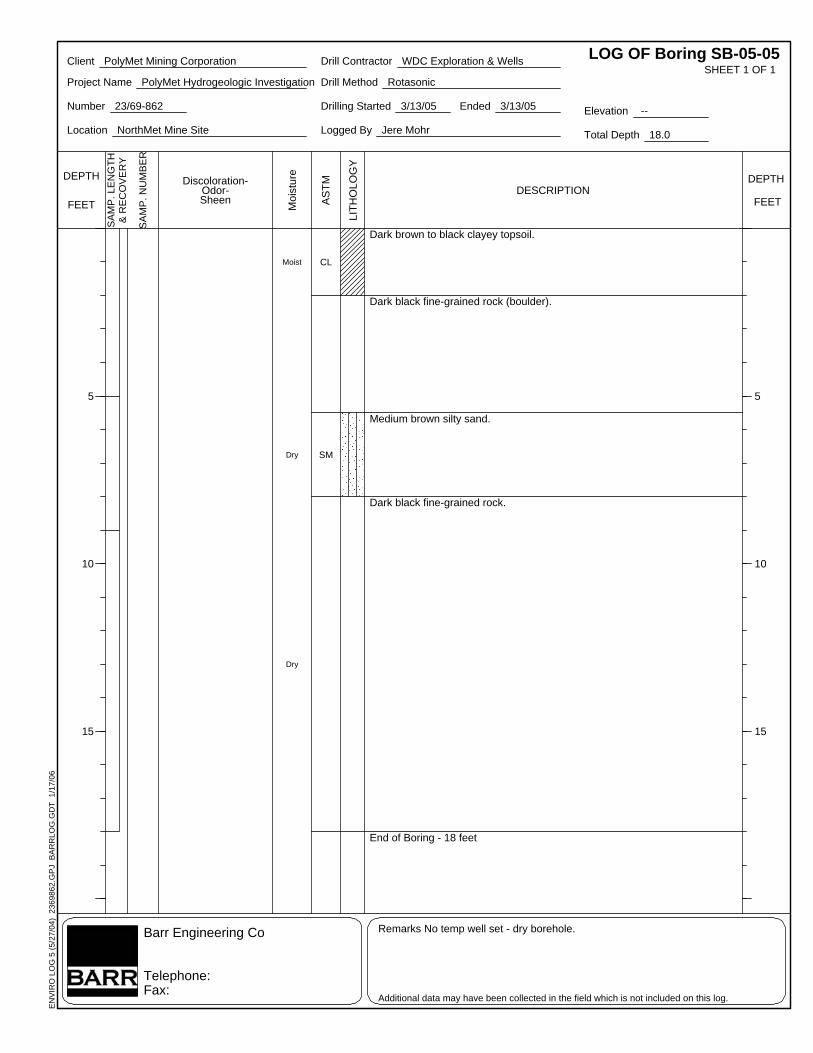
Dark brown to black clayey topsoil.
Drilling Started 3/13/05
Discoloration-Odor-Sheen
Logged By Jere Mohr
DEPTH
FEET
Dark black fine-grained rock (boulder).
Medium brown silty sand.
Dark black fine-grained rock.
End of Boring - 18 feet
Ended 3/13/05
SHEET 1 OF 1
SA
MP
. NU
MB
ER
5
10
15
Remarks No temp well set - dry borehole.
SA
MP
. LE
NG
TH&
RE
CO
VE
RY
Additional data may have been collected in the field which is not included on this log.
Moi
stur
e
Project Name PolyMet Hydrogeologic Investigation
LOG OF Boring SB-05-05
LITH
OLO
GY
Drill Contractor WDC Exploration & Wells
DESCRIPTION
Drill Method Rotasonic
AS
TM
Number 23/69-862
Location NorthMet Mine Site
5
10
15
EN
VIR
O L
OG
5 (5
/27/
04)
2369
862.
GP
J B
AR
RLO
G.G
DT
1/1
7/06
Total Depth 18.0
Elevation --
Client PolyMet Mining Corporation
CL
OL
Ended 3/14/05
SM
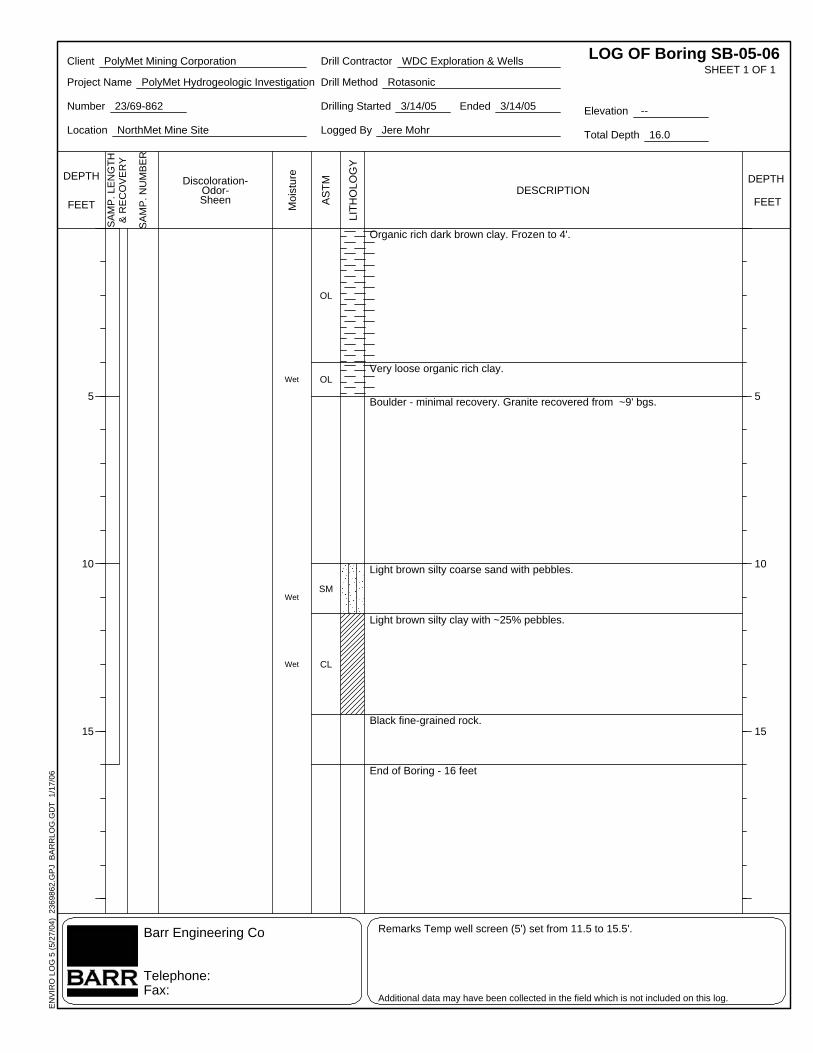
Organic rich dark brown clay. Frozen to 4'.
Wet
Discoloration-Odor-Sheen
DEPTH
FEET
Barr Engineering Co
Telephone:Fax:
Drill Contractor WDC Exploration & Wells
Drilling Started 3/14/05
OLVery loose organic rich clay.
Boulder - minimal recovery. Granite recovered from ~9' bgs.
Light brown silty coarse sand with pebbles.
Light brown silty clay with ~25% pebbles.
Black fine-grained rock.
End of Boring - 16 feet
Wet
LITH
OLO
GY
Wet
Client PolyMet Mining CorporationSHEET 1 OF 1
Project Name PolyMet Hydrogeologic Investigation
Logged By Jere Mohr
SA
MP
. LE
NG
TH&
RE
CO
VE
RY
Elevation --
LOG OF Boring SB-05-06
Additional data may have been collected in the field which is not included on this log.
Remarks Temp well screen (5') set from 11.5 to 15.5'.
5
10
15
SA
MP
. NU
MB
ER
EN
VIR
O L
OG
5 (5
/27/
04)
2369
862.
GP
J B
AR
RLO
G.G
DT
1/1
7/06
Moi
stur
e
5
10
15
Location NorthMet Mine Site
Number 23/69-862
AS
TM
Drill Method Rotasonic
DESCRIPTIONDEPTH
FEET
Total Depth 16.0
SM
SM
ML
DEPTH
FEET
Brown silty sand with 10-20% cobbles and boulders (up to 4" diameter). Frostto 1.5', moist below.
Discoloration-Odor-Sheen
Barr Engineering Co
Telephone:Fax:
Drill Contractor WDC Exploration & Wells
Drilling Started 3/12/05 Ended 3/12/05
Logged By Mark Hagley
SC
Gray/brown silty sand with trace of clay and 10-20% cobbles (<1/2" to 4").
Dark gray sandy silt with cobbles.Very dense brown clayey sand with ~15% gravel and cobbles (to 1"). (Till)
Green/black coarse crystalline rock (Duluth Complex gabbro).
End of Boring - 17 feet
DEPTH
FEET
LITH
OLO
GY
Remarks Temp well screen (5') set from 8-13' bgs, allowed to collapse up to 6.2',then bentonite chips above.
Additional data may have been collected in the field which is not included on this log.
Client PolyMet Mining Corporation
Moist
SA
MP
. NU
MB
ER
SA
MP
. LE
NG
TH&
RE
CO
VE
RY
Project Name PolyMet Hydrogeologic InvestigationSHEET 1 OF 1
LOG OF Boring SB-05-07
DESCRIPTION
Drill Method Rotasonic
AS
TM
Number 23/69-862
5
10
15
5
10
15
Total Depth 17.0
Moi
stur
e
EN
VIR
O L
OG
5 (5
/27/
04)
2369
862.
GP
J B
AR
RLO
G.G
DT
1/1
7/06
Elevation --
Location NorthMet Mine Site
Drill Method Rotasonic
DEPTH
FEET
Barr Engineering Co
Telephone:Fax:
Drill Contractor WDC Exploration & Wells
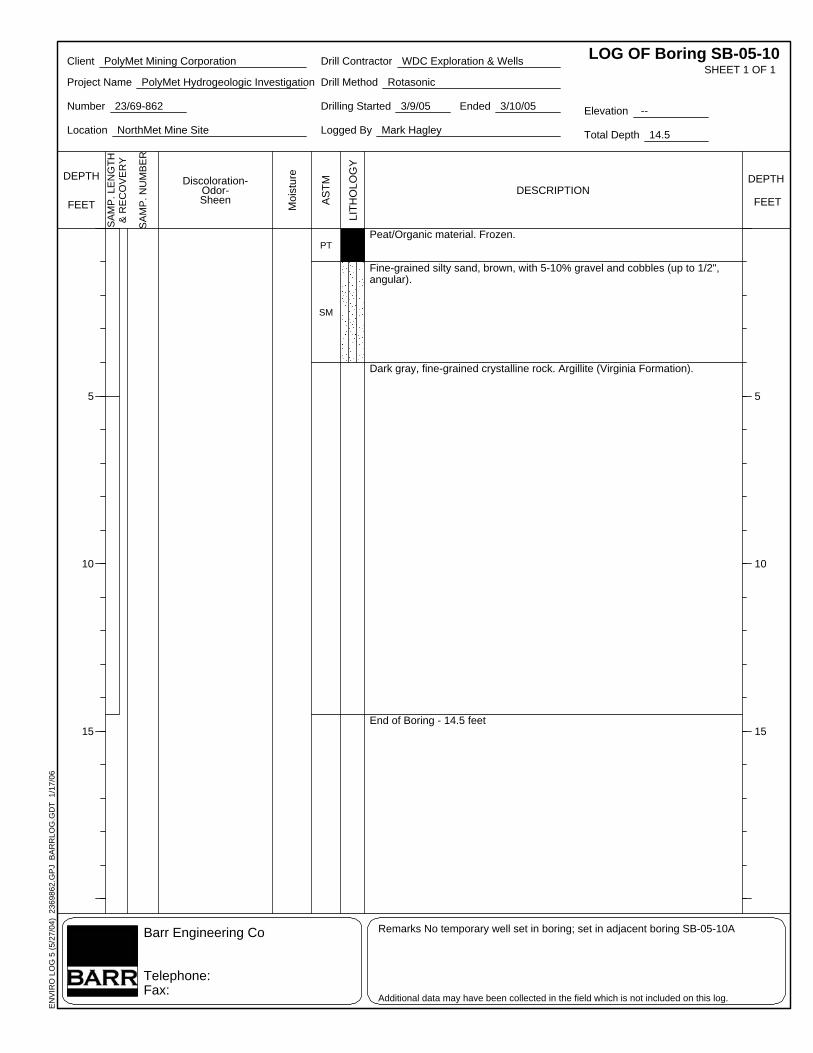
Drilling Started 3/9/05
SM
Logged By Mark Hagley
PT
DEPTH
FEET
Peat/Organic material. Frozen.
Discoloration-Odor-Sheen
DESCRIPTION
Ended 3/10/05
Fine-grained silty sand, brown, with 5-10% gravel and cobbles (up to 1/2",angular).
Dark gray, fine-grained crystalline rock. Argillite (Virginia Formation).
End of Boring - 14.5 feet
SA
MP
. LE
NG
TH&
RE
CO
VE
RY
Moi
stur
e
AS
TM
EN
VIR
O L
OG
5 (5
/27/
04)
2369
862.
GP
J B
AR
RLO
G.G
DT
1/1
7/06
5
10
15
SHEET 1 OF 1
LITH
OLO
GY
Remarks No temporary well set in boring; set in adjacent boring SB-05-10A
LOG OF Boring SB-05-10
Additional data may have been collected in the field which is not included on this log.
SA
MP
. NU
MB
ER
Number 23/69-862
Location NorthMet Mine Site
5
10
15
Project Name PolyMet Hydrogeologic Investigation
Elevation --
Client PolyMet Mining Corporation
Total Depth 14.5
DEPTH
FEET
Barr Engineering Co
Telephone:Fax:
Drill Contractor WDC Exploration & Wells
Drilling Started 3/10/05
Drill Method Rotasonic
Logged By Mark Hagley
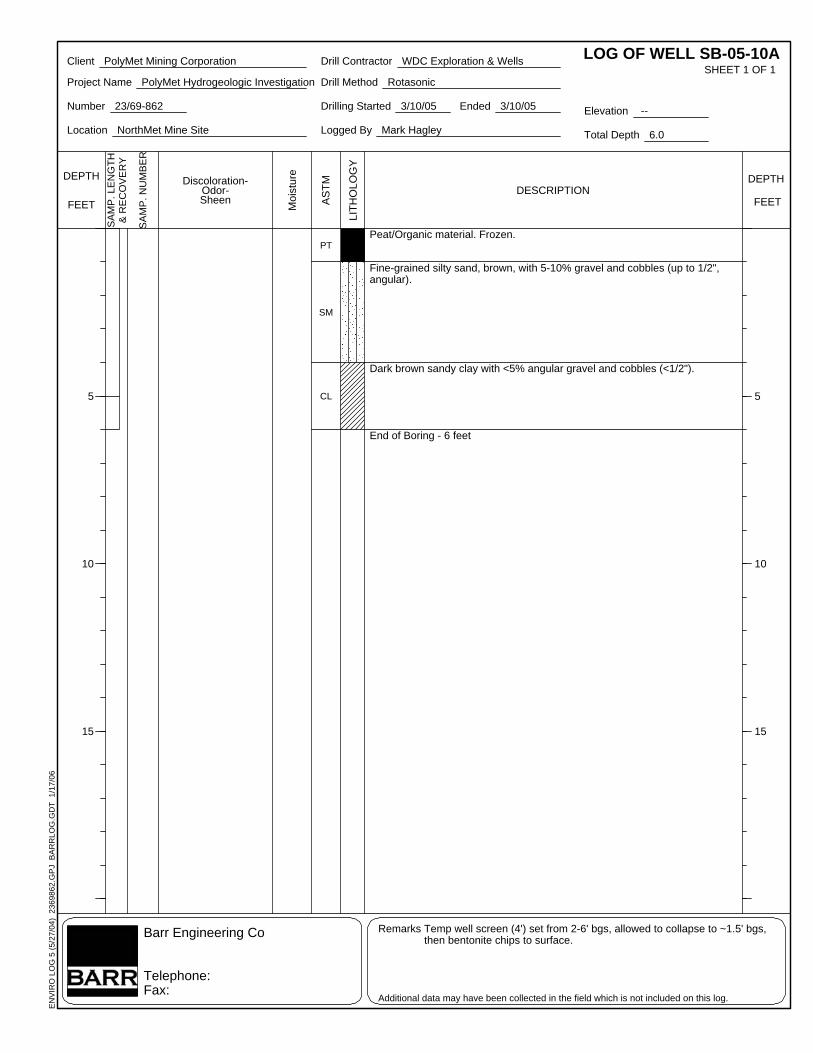
PT
DEPTH
FEET
Peat/Organic material. Frozen.
Discoloration-Odor-Sheen
DESCRIPTION
Ended 3/10/05
Fine-grained silty sand, brown, with 5-10% gravel and cobbles (up to 1/2",angular).
Dark brown sandy clay with <5% angular gravel and cobbles (<1/2").
End of Boring - 6 feet
CL
SM
SA
MP
. LE
NG
TH&
RE
CO
VE
RY
Moi
stur
e
AS
TM
EN
VIR
O L
OG
5 (5
/27/
04)
2369
862.
GP
J B
AR
RLO
G.G
DT
1/1
7/06
5
10
15
SHEET 1 OF 1
LITH
OLO
GY
Remarks Temp well screen (4') set from 2-6' bgs, allowed to collapse to ~1.5' bgs,then bentonite chips to surface.
LOG OF WELL SB-05-10A
Additional data may have been collected in the field which is not included on this log.
SA
MP
. NU
MB
ER
Number 23/69-862
Location NorthMet Mine Site
5
10
15
Project Name PolyMet Hydrogeologic Investigation
Elevation --
Client PolyMet Mining Corporation
Total Depth 6.0

Appendix B
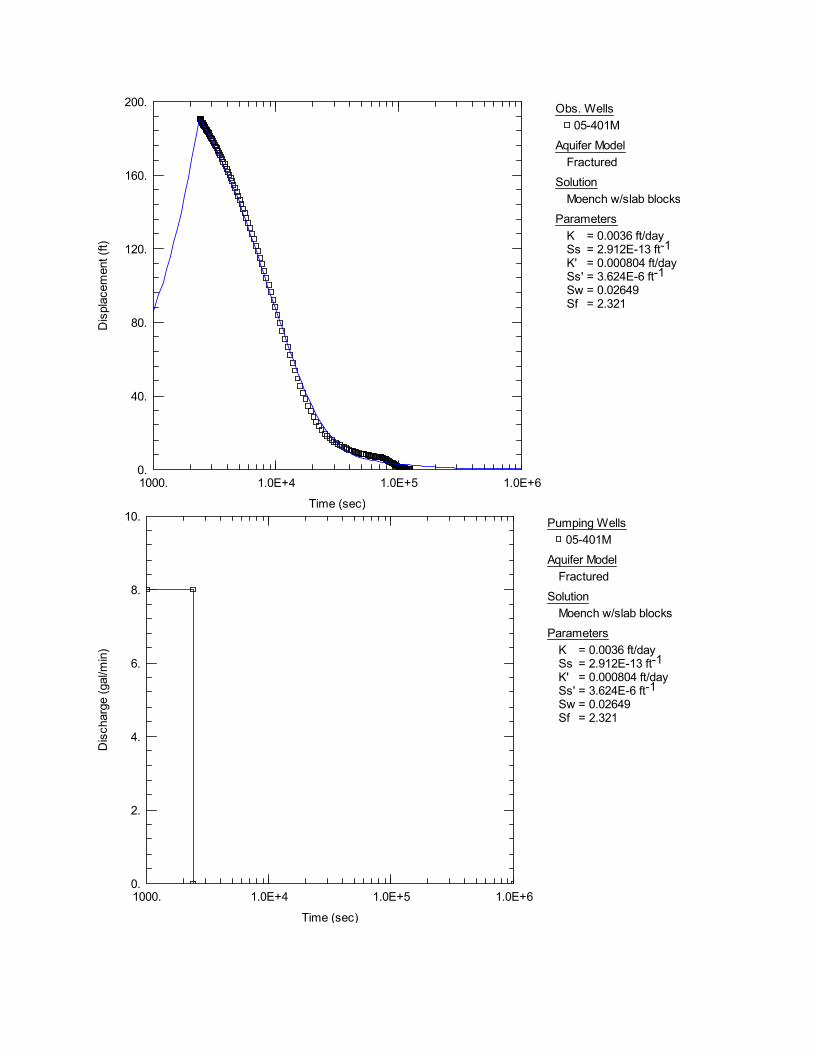
1000. 1.0E+4 1.0E+5 1.0E+60.
40.
80.
120.
160.
200.
Time (sec)
Displacement (ft)
Obs. Wells
05-401M
Aquifer Model
Fractured
Solution
Moench w/slab blocks
Parameters
K = 0.0036 ft/daySs = 2.912E-13 ft-1
K' = 0.000804 ft/daySs' = 3.624E-6 ft-1
Sw = 0.02649Sf = 2.321
1000. 1.0E+4 1.0E+5 1.0E+60.
2.
4.
6.
8.
10.
Time (sec)
Discharge (gal/min)
Pumping Wells
05-401M
Aquifer Model
Fractured
Solution
Moench w/slab blocks
Parameters
K = 0.0036 ft/daySs = 2.912E-13 ft-1
K' = 0.000804 ft/daySs' = 3.624E-6 ft-1
Sw = 0.02649Sf = 2.321
1000. 1.0E+4 1.0E+50.
40.
80.
120.
160.
200.
Time (sec)
Displacement (ft)
Obs. Wells
05-404M
Aquifer Model
Fractured
Solution
Moench w/slab blocks
Parameters
K = 0.01034 ft/daySs = 4.025E-13 ft-1
K' = 8.64E-6 ft/daySs' = 0.0005552 ft-1
Sw = 2.727Sf = 0.002511
1000. 1.0E+4 1.0E+50.
1.8
3.6
5.4
7.2
9.
Time (sec)
Discharge (gal/min)
Pumping Wells
05-404M
Aquifer Model
Fractured
Solution
Moench w/slab blocks
Parameters
K = 0.01034 ft/daySs = 4.025E-13 ft-1
K' = 8.64E-6 ft/daySs' = 0.0005552 ft-1
Sw = 2.727Sf = 0.002511
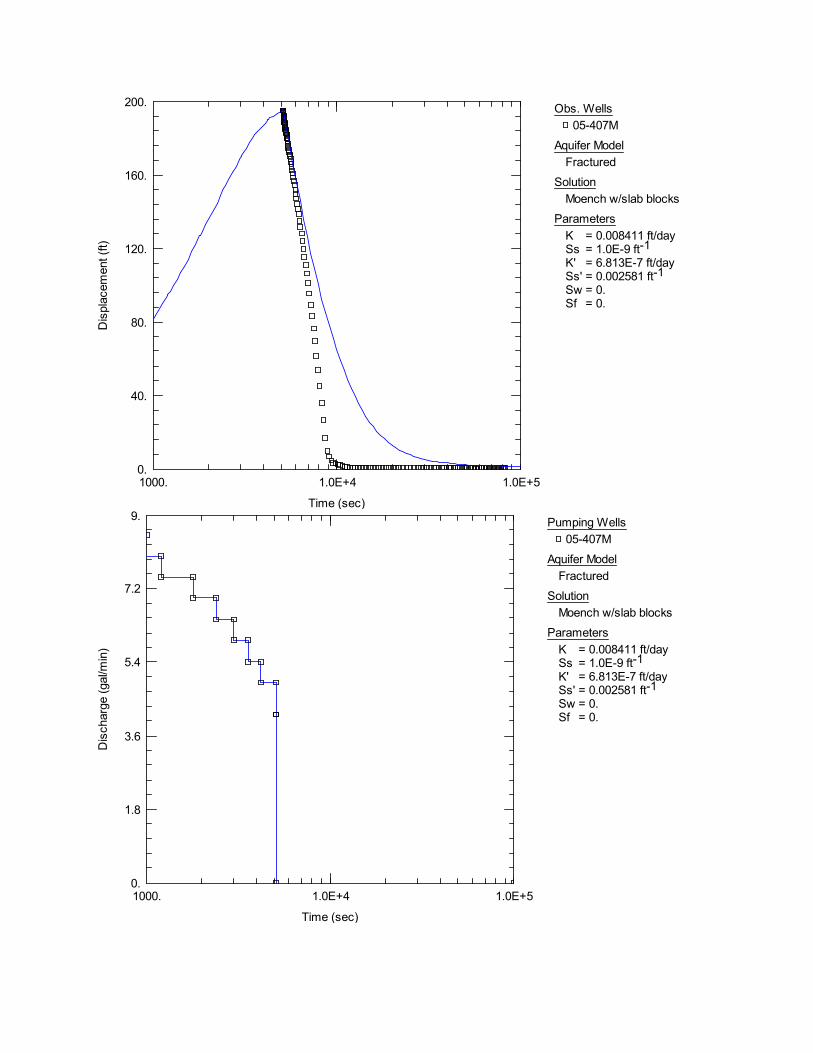
1000. 1.0E+4 1.0E+50.
40.
80.
120.
160.
200.
Time (sec)
Displacement (ft)
Obs. Wells
05-407M
Aquifer Model
Fractured
Solution
Moench w/slab blocks
Parameters
K = 0.008411 ft/daySs = 1.0E-9 ft-1
K' = 6.813E-7 ft/daySs' = 0.002581 ft-1
Sw = 0.Sf = 0.
1000. 1.0E+4 1.0E+50.
1.8
3.6
5.4
7.2
9.
Time (sec)
Discharge (gal/min)
Pumping Wells
05-407M
Aquifer Model
Fractured
Solution
Moench w/slab blocks
Parameters
K = 0.008411 ft/daySs = 1.0E-9 ft-1
K' = 6.813E-7 ft/daySs' = 0.002581 ft-1
Sw = 0.Sf = 0.
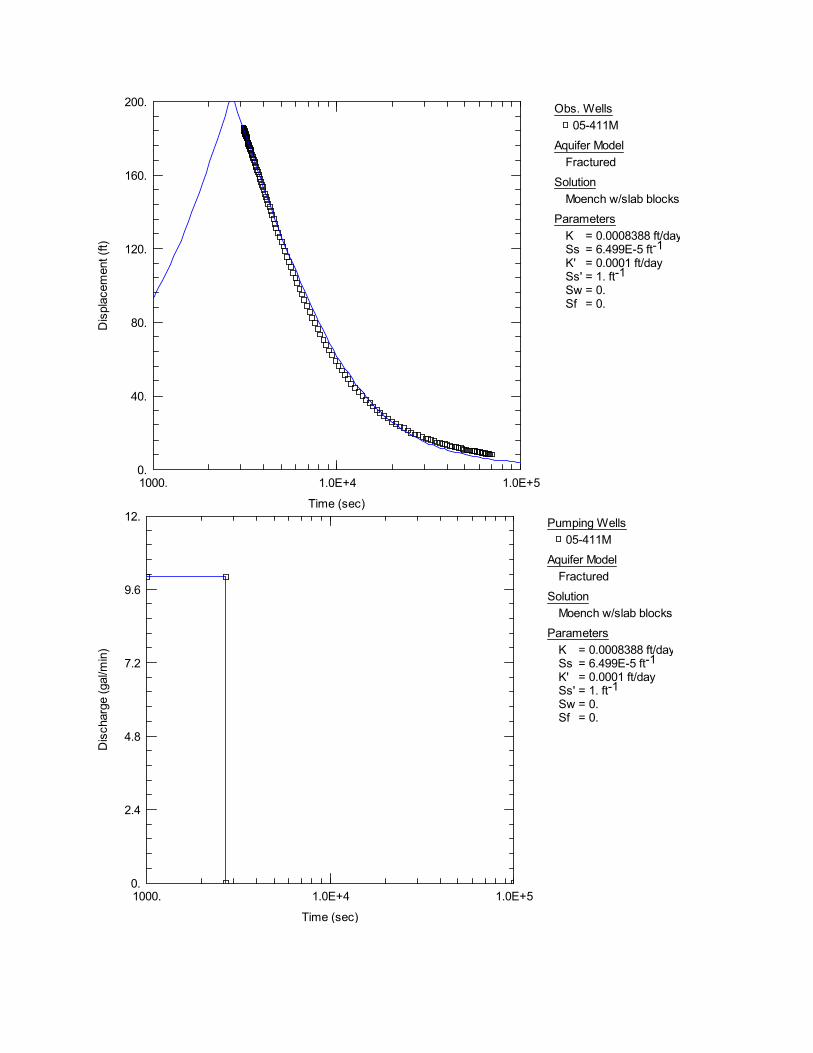
1000. 1.0E+4 1.0E+50.
40.
80.
120.
160.
200.
Time (sec)
Displacement (ft)
Obs. Wells
05-411M
Aquifer Model
Fractured
Solution
Moench w/slab blocks
Parameters
K = 0.0008388 ft/daySs = 6.499E-5 ft-1
K' = 0.0001 ft/daySs' = 1. ft-1
Sw = 0.Sf = 0.
1000. 1.0E+4 1.0E+50.
2.4
4.8
7.2
9.6
12.
Time (sec)
Discharge (gal/min)
Pumping Wells
05-411M
Aquifer Model
Fractured
Solution
Moench w/slab blocks
Parameters
K = 0.0008388 ft/daySs = 6.499E-5 ft-1
K' = 0.0001 ft/daySs' = 1. ft-1
Sw = 0.Sf = 0.
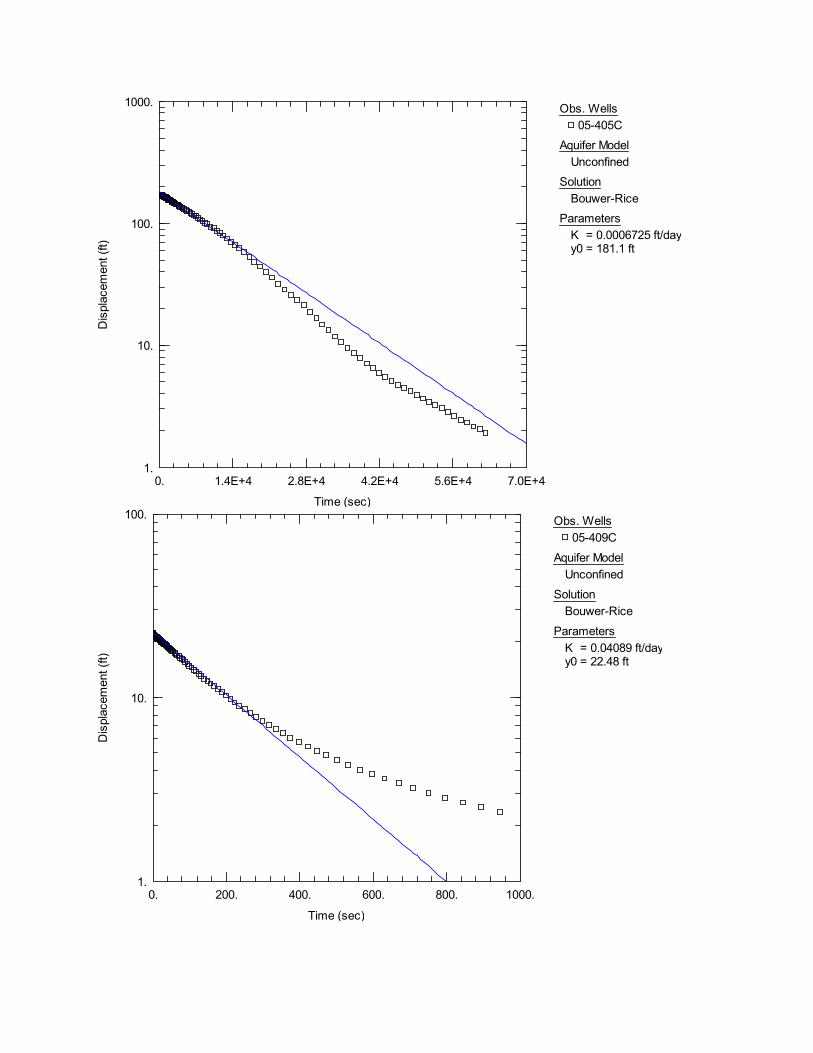
0. 1.4E+4 2.8E+4 4.2E+4 5.6E+4 7.0E+41.
10.
100.
1000.
Time (sec)
Displacement (ft)
Obs. Wells
05-405C
Aquifer Model
Unconfined
Solution
Bouwer-Rice
Parameters
K = 0.0006725 ft/dayy0 = 181.1 ft
0. 200. 400. 600. 800. 1000.1.
10.
100.
Time (sec)
Displacement (ft)
Obs. Wells
05-409C
Aquifer Model
Unconfined
Solution
Bouwer-Rice
Parameters
K = 0.04089 ft/dayy0 = 22.48 ft
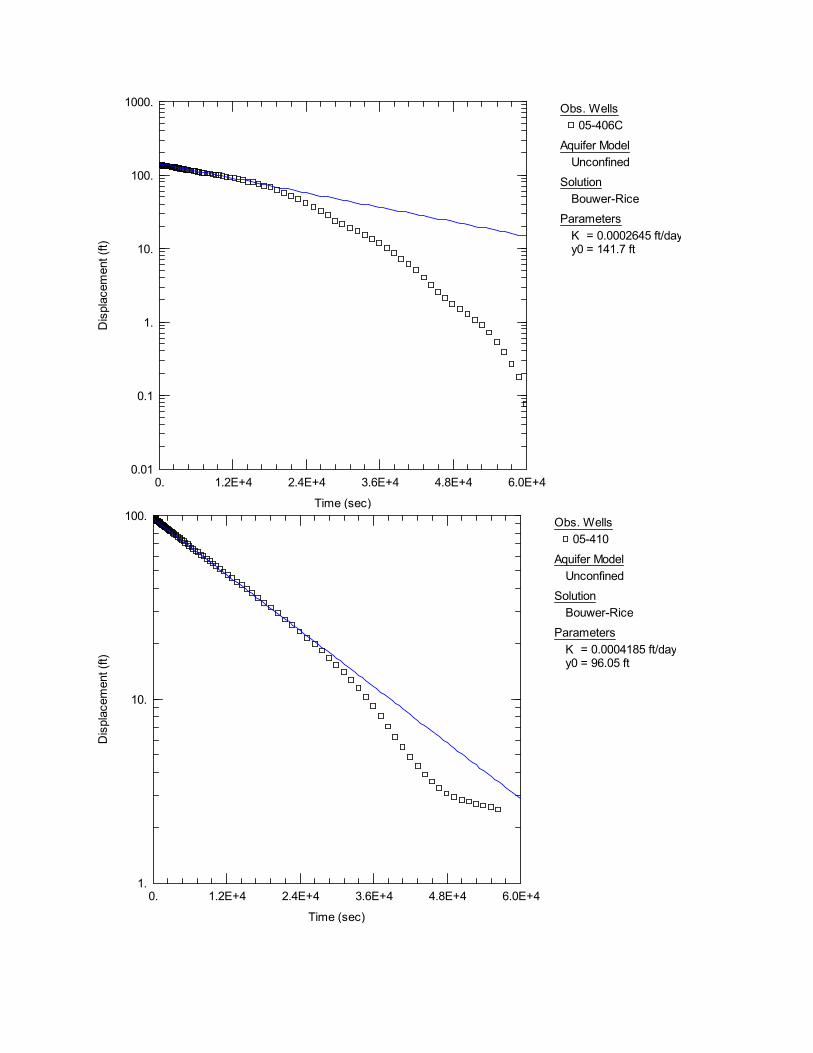
0. 1.2E+4 2.4E+4 3.6E+4 4.8E+4 6.0E+40.01
0.1
1.
10.
100.
1000.
Time (sec)
Displacement (ft)
Obs. Wells
05-406C
Aquifer Model
Unconfined
Solution
Bouwer-Rice
Parameters
K = 0.0002645 ft/dayy0 = 141.7 ft
0. 1.2E+4 2.4E+4 3.6E+4 4.8E+4 6.0E+41.
10.
100.
Time (sec)
Displacement (ft)
Obs. Wells
05-410
Aquifer Model
Unconfined
Solution
Bouwer-Rice
Parameters
K = 0.0004185 ft/dayy0 = 96.05 ft
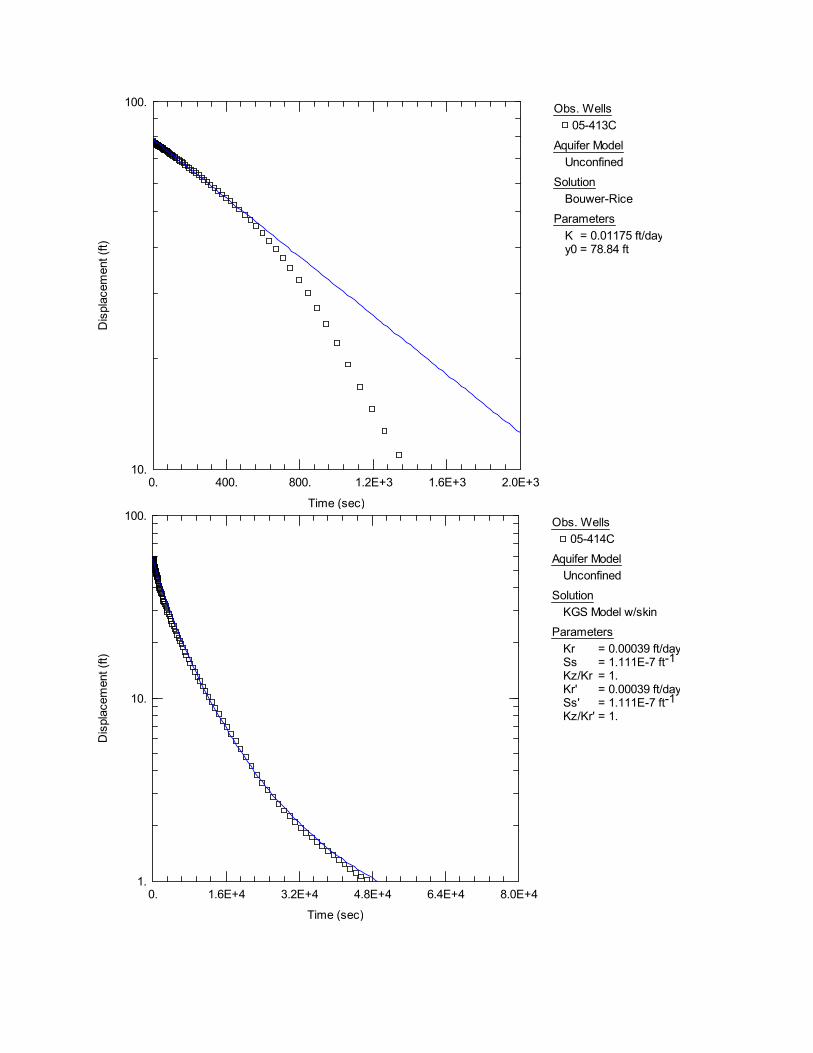
0. 400. 800. 1.2E+3 1.6E+3 2.0E+310.
100.
Time (sec)
Displacement (ft)
Obs. Wells
05-413C
Aquifer Model
Unconfined
Solution
Bouwer-Rice
Parameters
K = 0.01175 ft/dayy0 = 78.84 ft
0. 1.6E+4 3.2E+4 4.8E+4 6.4E+4 8.0E+41.
10.
100.
Time (sec)
Displacement (ft)
Obs. Wells
05-414C
Aquifer Model
Unconfined
Solution
KGS Model w/skin
Parameters
Kr = 0.00039 ft/daySs = 1.111E-7 ft-1
Kz/Kr = 1.Kr' = 0.00039 ft/daySs' = 1.111E-7 ft-1
Kz/Kr' = 1.
1. 10. 100. 1000. 1.0E+40.
0.1
0.2
0.3
0.4
0.5
Time, t/t'
Resid
ual D
raw
dow
n (ft)
Obs. Wells
SB-05-01
Aquifer Model
Confined
Solution
Theis (Recovery)
Parameters
T = 322.5 ft2/dayS/S' = 1.213
1. 10. 100. 1000. 1.0E+40.
0.4
0.8
1.2
1.6
2.
Time, t/t'
Resid
ual D
raw
dow
n (ft)
Obs. Wells
MW-05-02
Aquifer Model
Confined
Solution
Theis (Recovery)
Parameters
T = 68.82 ft2/dayS/S' = 0.07259
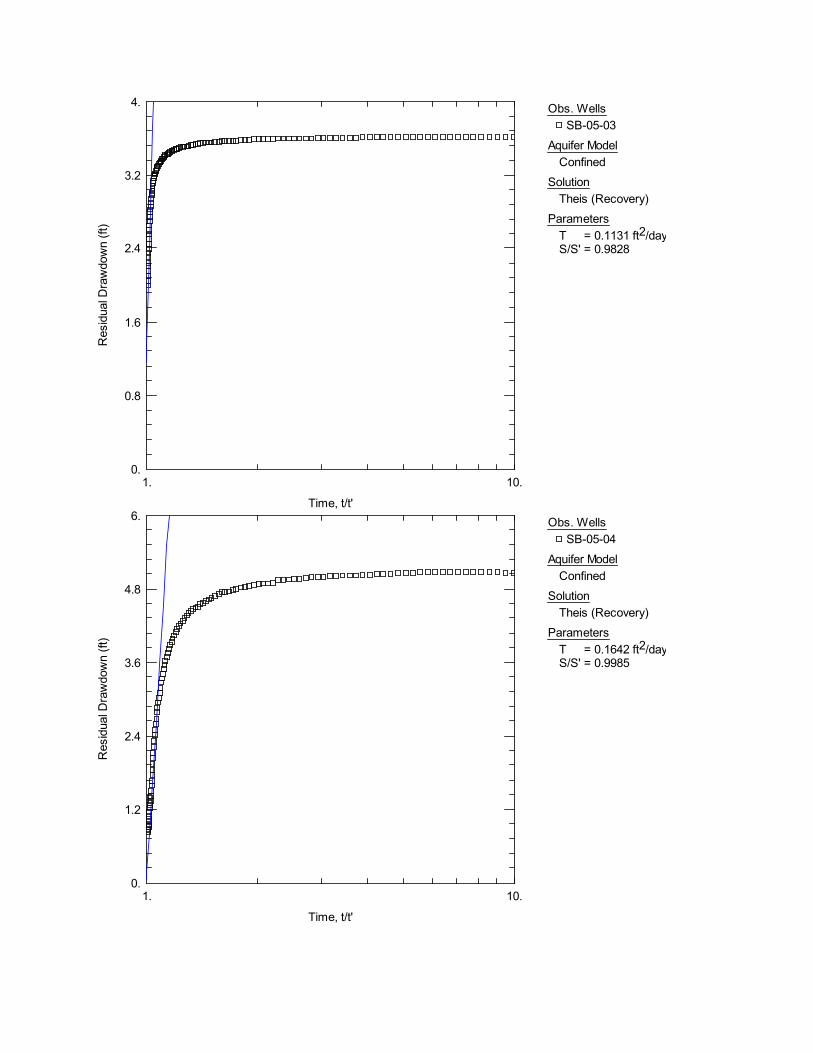
1. 10.0.
0.8
1.6
2.4
3.2
4.
Time, t/t'
Resid
ual D
raw
dow
n (ft)
Obs. Wells
SB-05-03
Aquifer Model
Confined
Solution
Theis (Recovery)
Parameters
T = 0.1131 ft2/dayS/S' = 0.9828
1. 10.0.
1.2
2.4
3.6
4.8
6.
Time, t/t'
Resid
ual D
raw
dow
n (ft)
Obs. Wells
SB-05-04
Aquifer Model
Confined
Solution
Theis (Recovery)
Parameters
T = 0.1642 ft2/dayS/S' = 0.9985
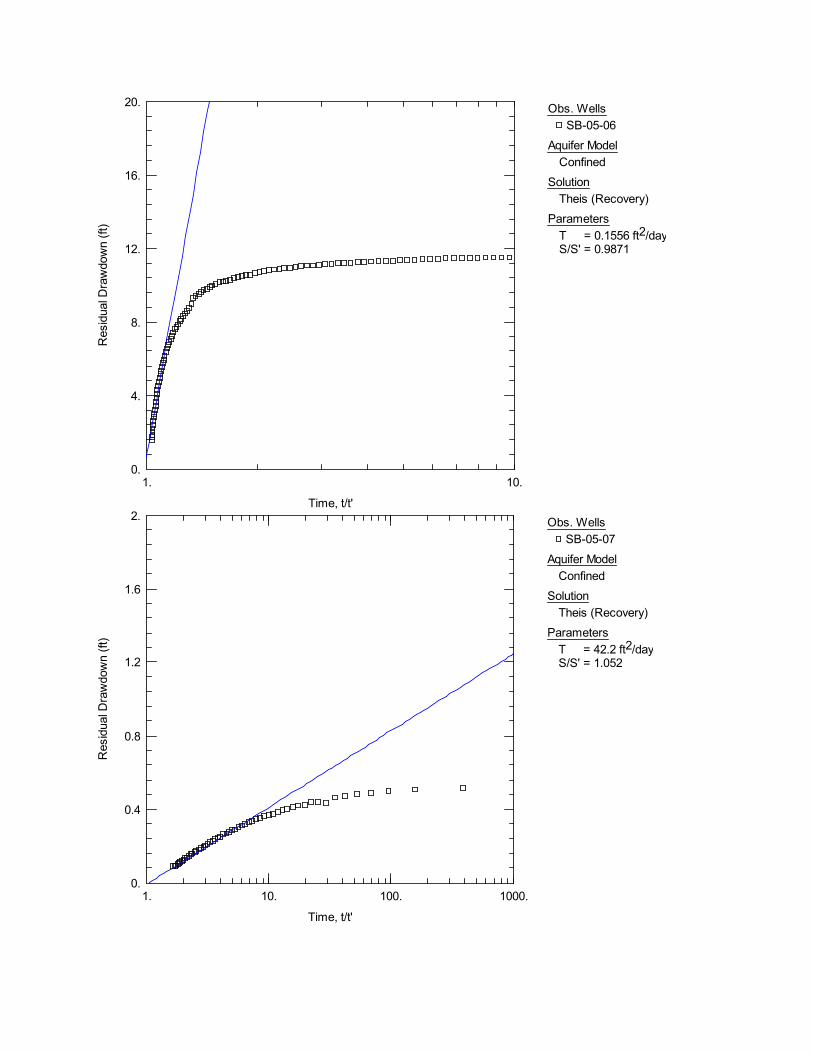
1. 10.0.
4.
8.
12.
16.
20.
Time, t/t'
Resid
ual D
raw
dow
n (ft)
Obs. Wells
SB-05-06
Aquifer Model
Confined
Solution
Theis (Recovery)
Parameters
T = 0.1556 ft2/dayS/S' = 0.9871
1. 10. 100. 1000.0.
0.4
0.8
1.2
1.6
2.
Time, t/t'
Resid
ual D
raw
dow
n (ft)
Obs. Wells
SB-05-07
Aquifer Model
Confined
Solution
Theis (Recovery)
Parameters
T = 42.2 ft2/dayS/S' = 1.052
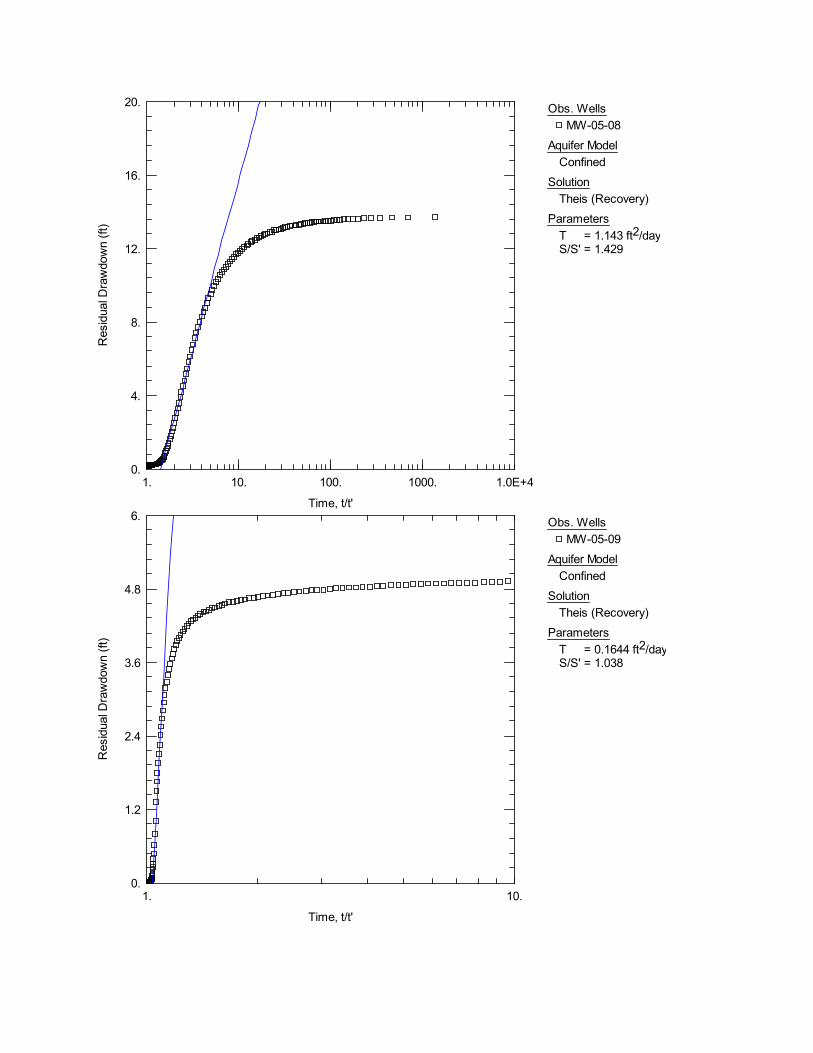
1. 10. 100. 1000. 1.0E+40.
4.
8.
12.
16.
20.
Time, t/t'
Resid
ual D
raw
dow
n (ft)
Obs. Wells
MW-05-08
Aquifer Model
Confined
Solution
Theis (Recovery)
Parameters
T = 1.143 ft2/dayS/S' = 1.429
1. 10.0.
1.2
2.4
3.6
4.8
6.
Time, t/t'
Resid
ual D
raw
dow
n (ft)
Obs. Wells
MW-05-09
Aquifer Model
Confined
Solution
Theis (Recovery)
Parameters
T = 0.1644 ft2/dayS/S' = 1.038
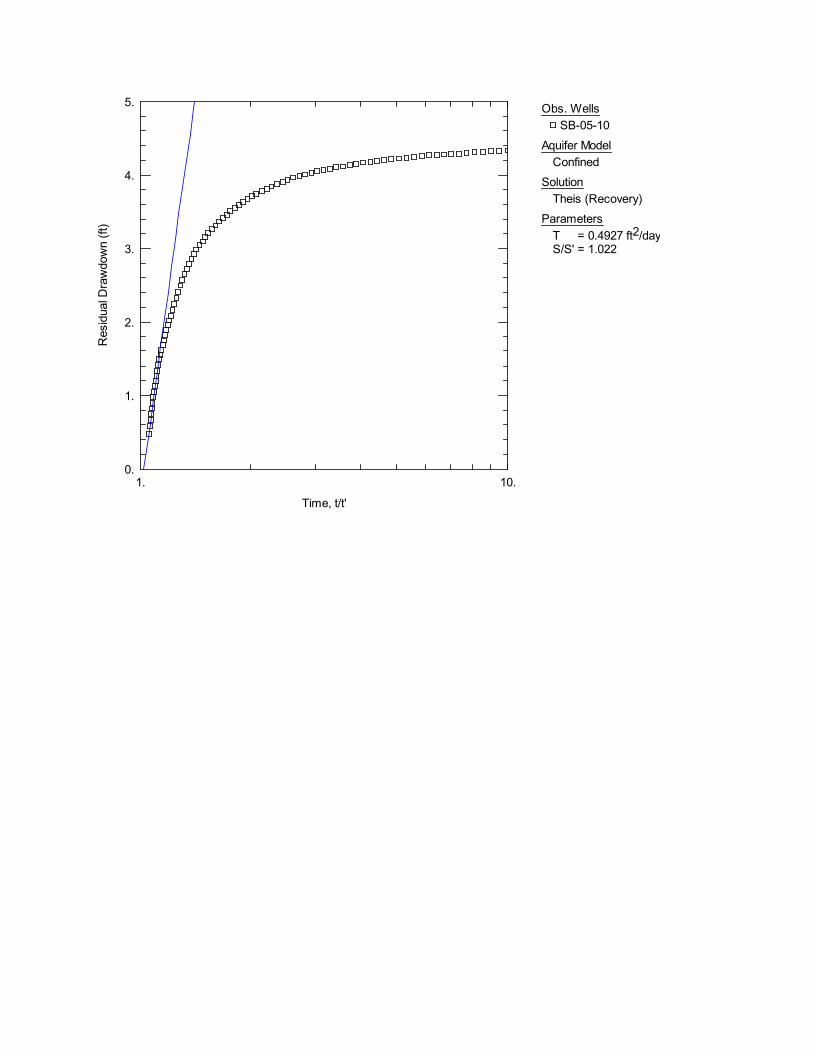
1. 10.0.
1.
2.
3.
4.
5.
Time, t/t'
Resid
ual D
raw
dow
n (ft)
Obs. Wells
SB-05-10
Aquifer Model
Confined
Solution
Theis (Recovery)
Parameters
T = 0.4927 ft2/dayS/S' = 1.022

Appendix C
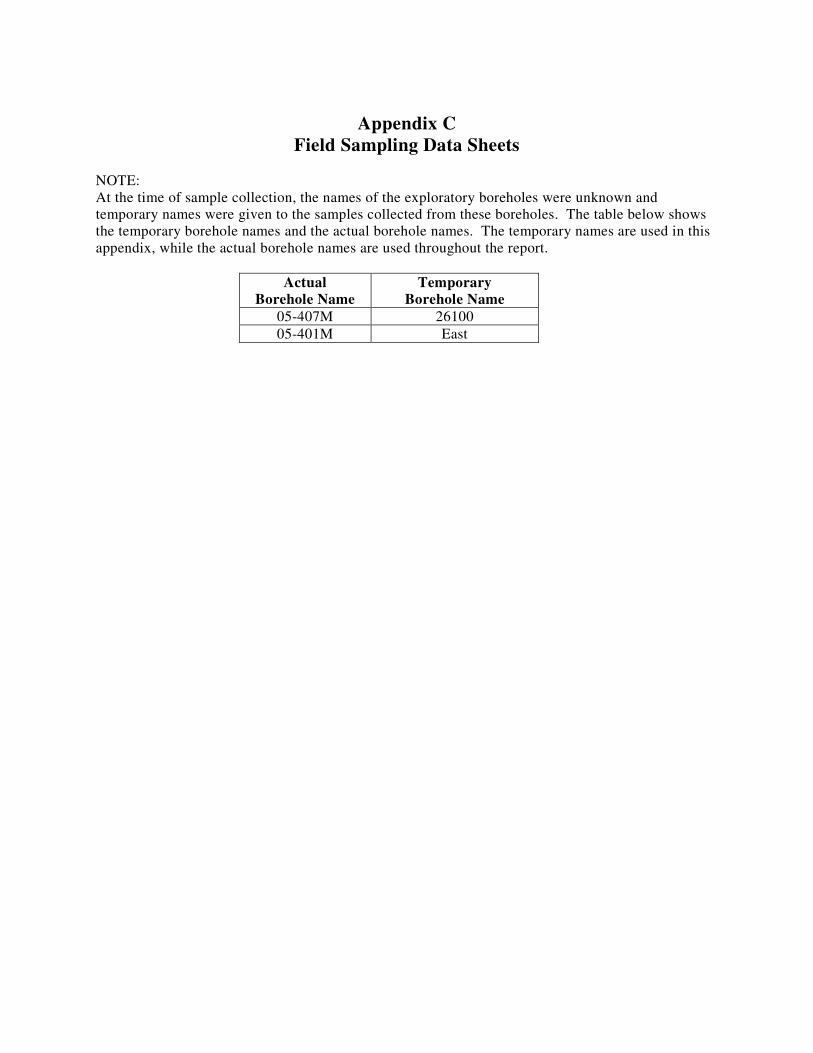
Appendix C
Field Sampling Data Sheets NOTE: At the time of sample collection, the names of the exploratory boreholes were unknown and temporary names were given to the samples collected from these boreholes. The table below shows the temporary borehole names and the actual borehole names. The temporary names are used in this appendix, while the actual borehole names are used throughout the report.
Actual Borehole Name
Temporary Borehole Name
05-407M 26100 05-401M East
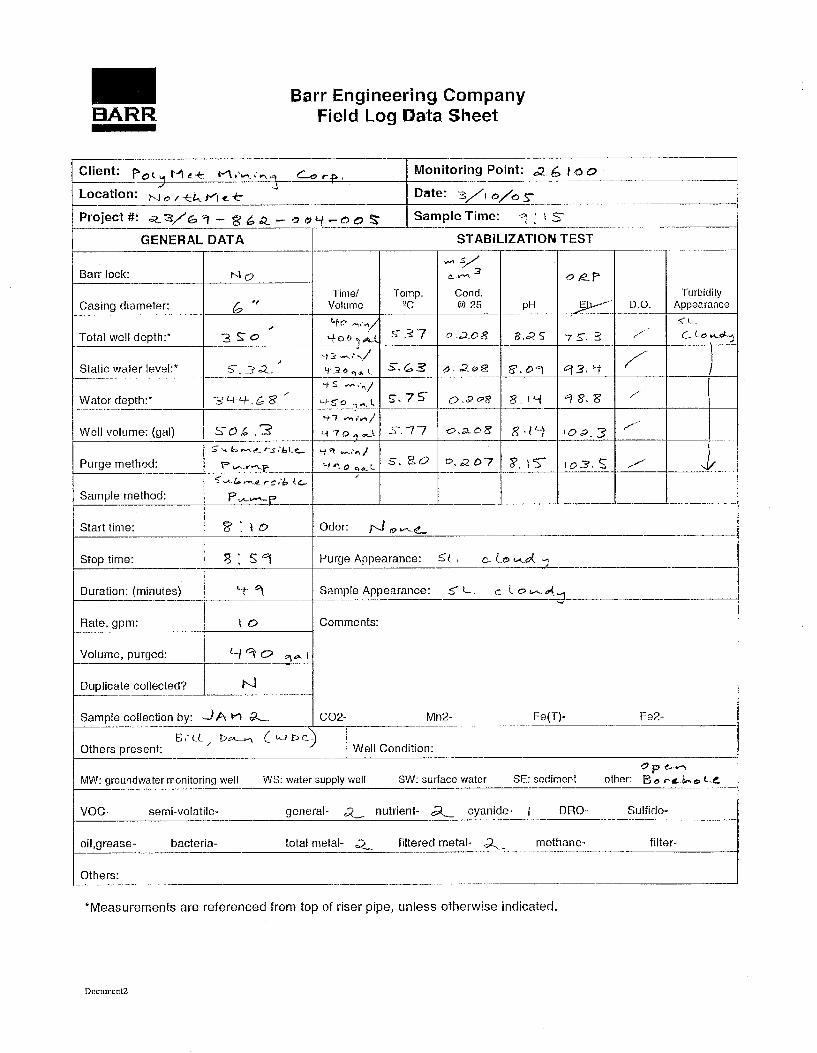
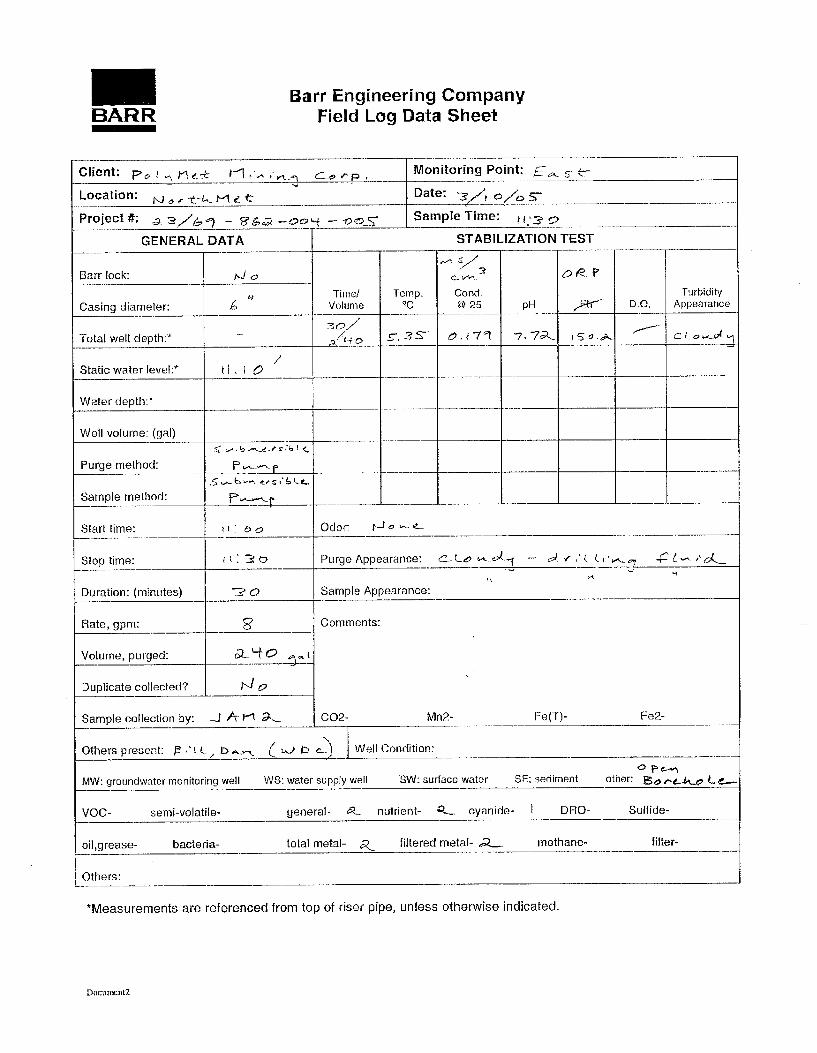
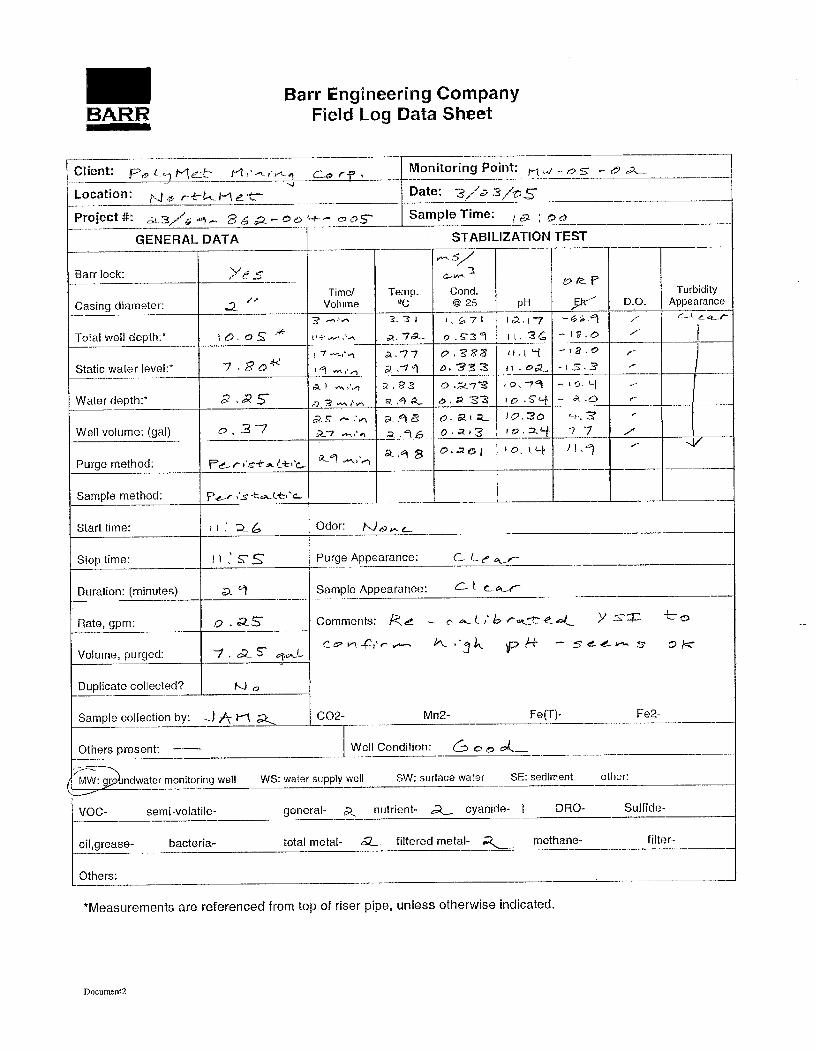
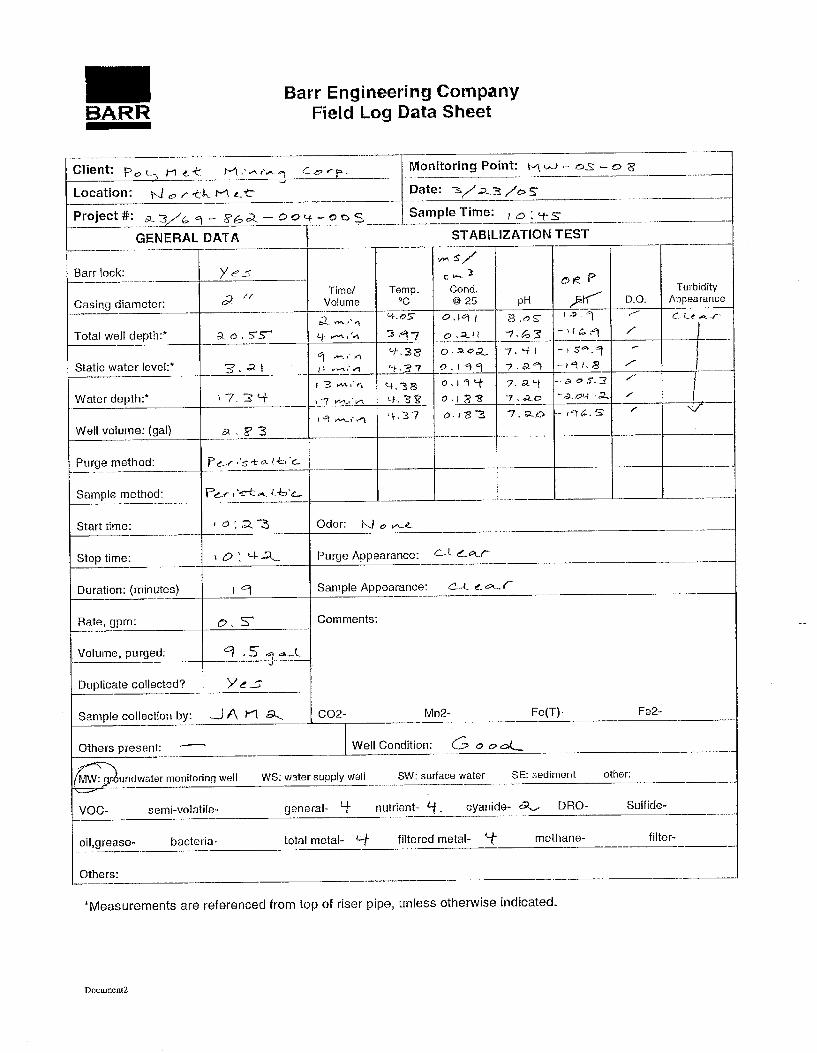
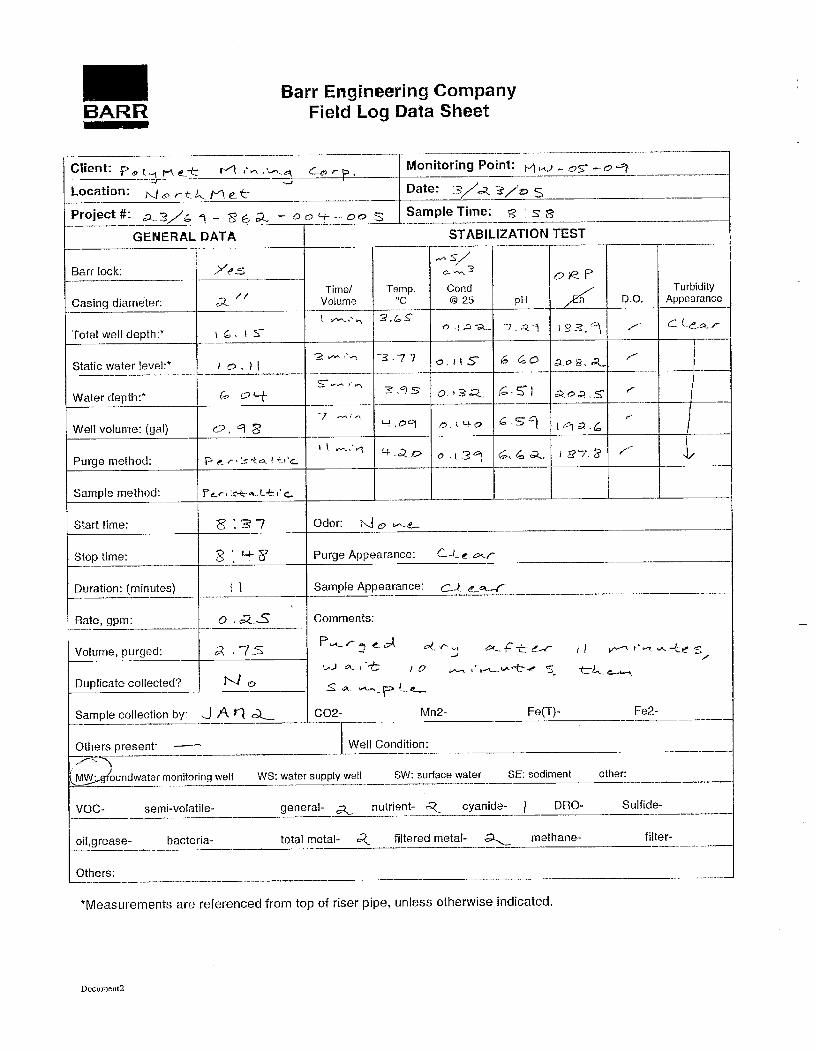

Appendix D
Appendix D
Groundwater Analytical Data Reports
NOTE:
At the time of sample collection, the names of the exploratory boreholes were unknown and
temporary names were given to the samples collected from these boreholes. The table below shows
the temporary borehole names and the actual borehole names. The temporary names are used in this
appendix, while the actual borehole names are used throughout the report.
Actual
Borehole Name
Temporary
Borehole Name
05-407M 26100
05-401M East
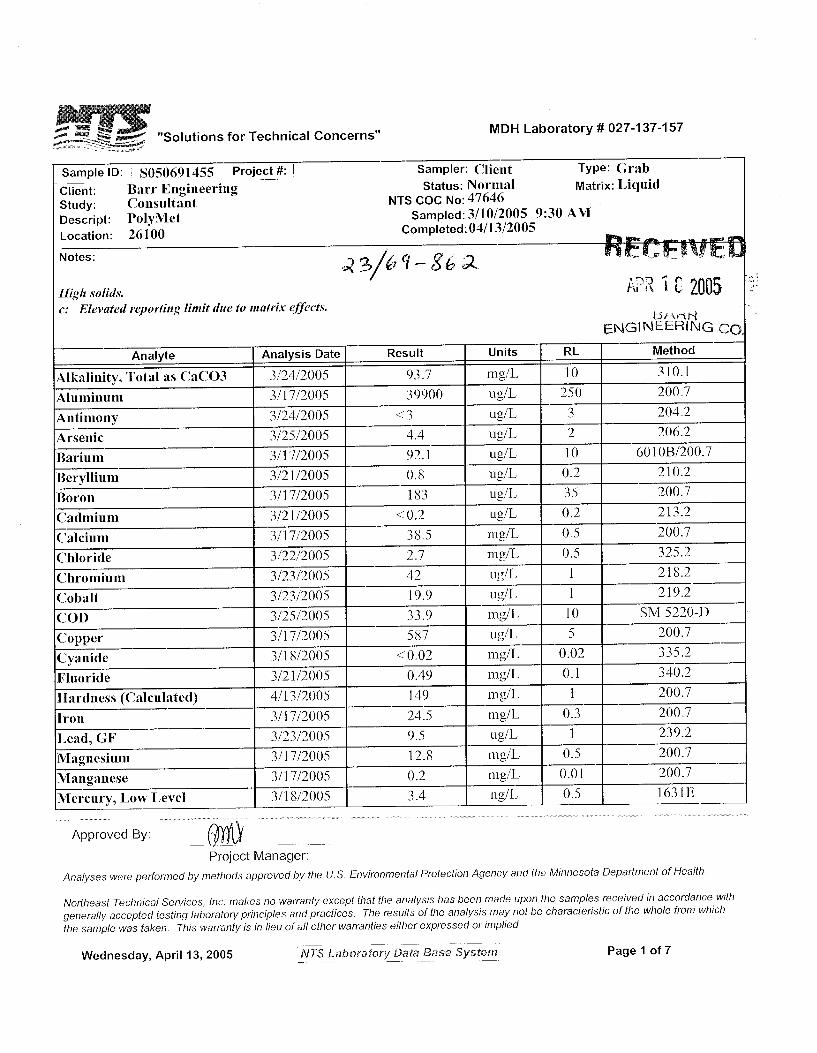
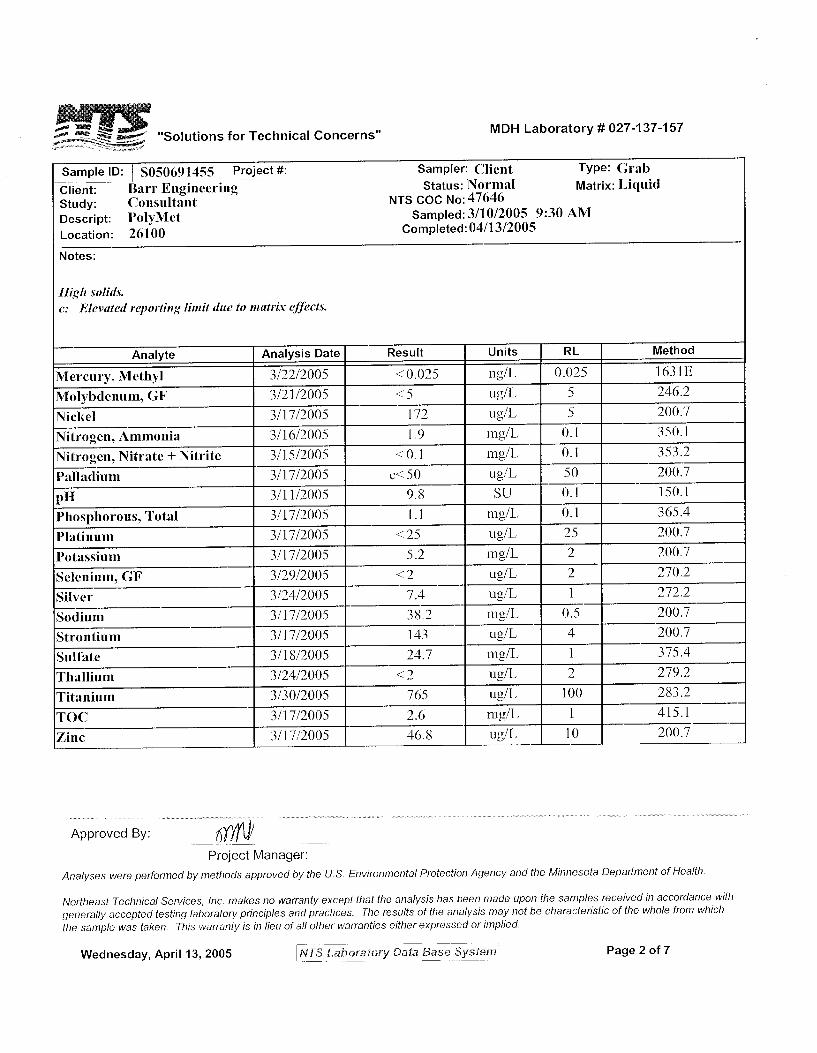
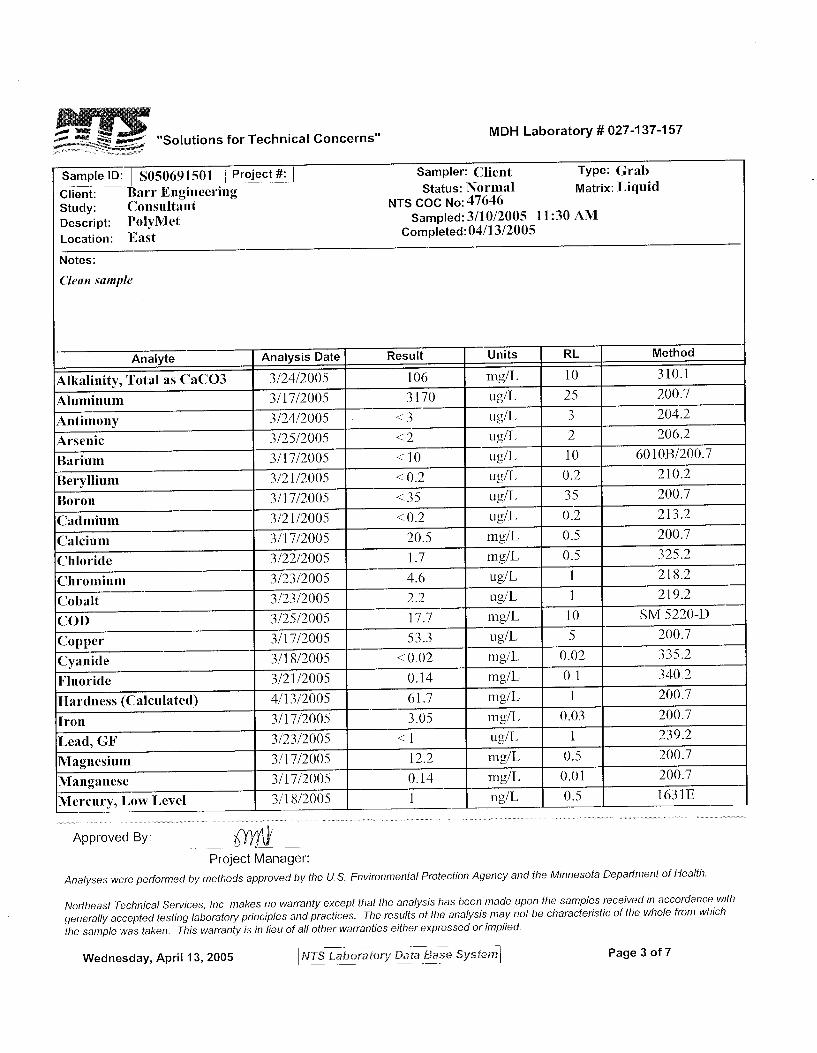
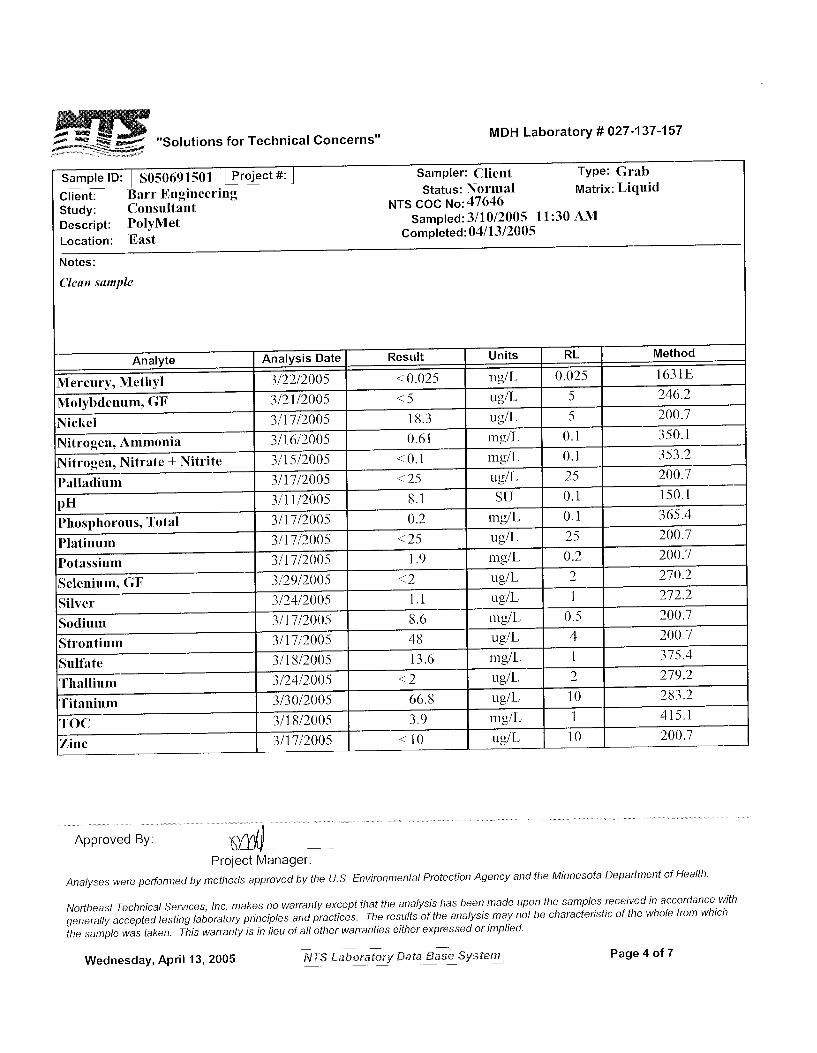
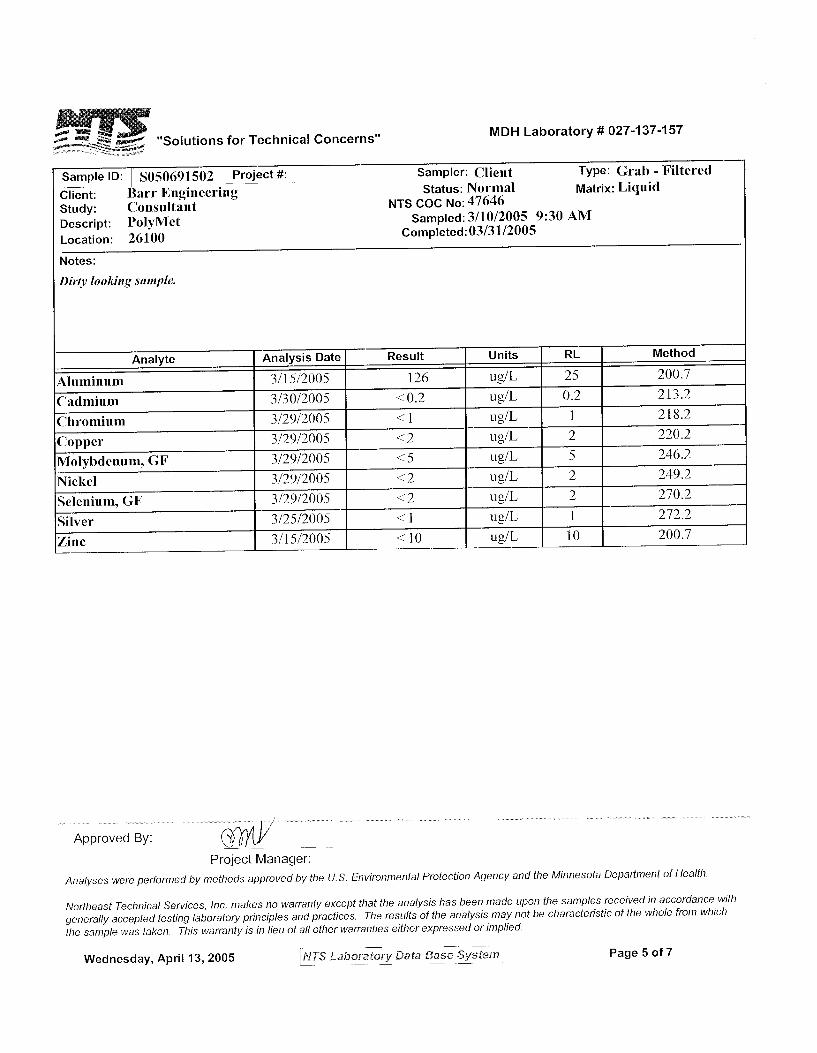
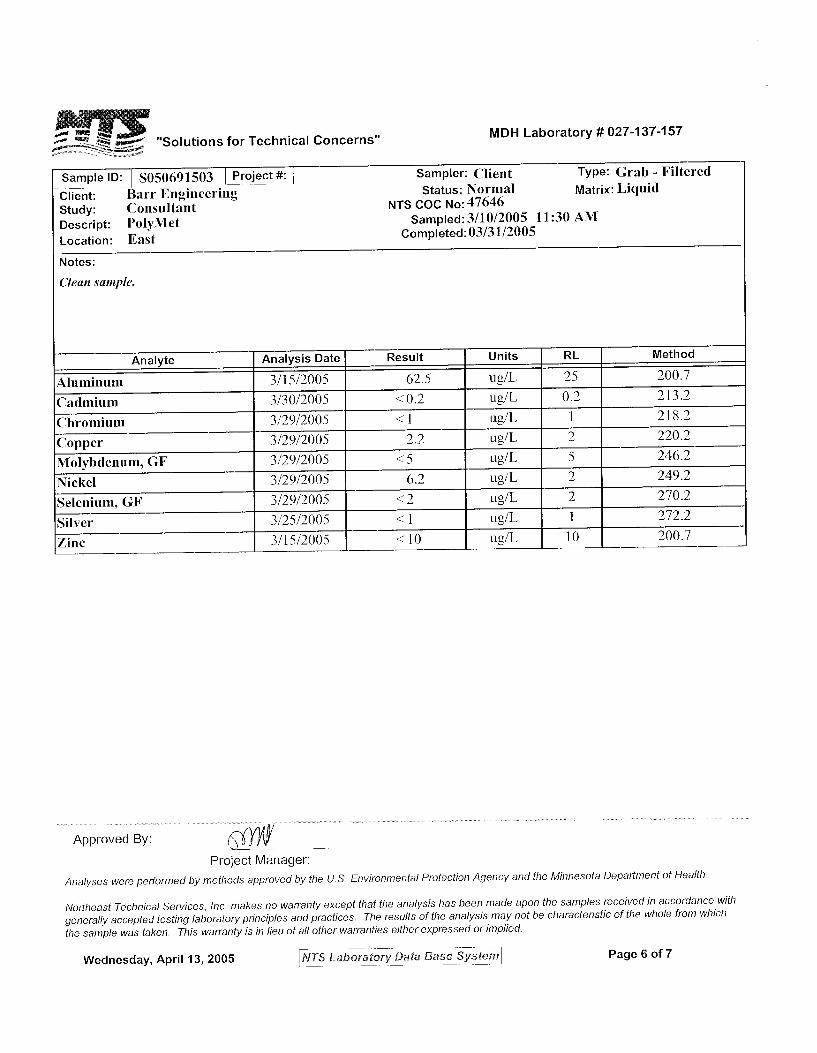
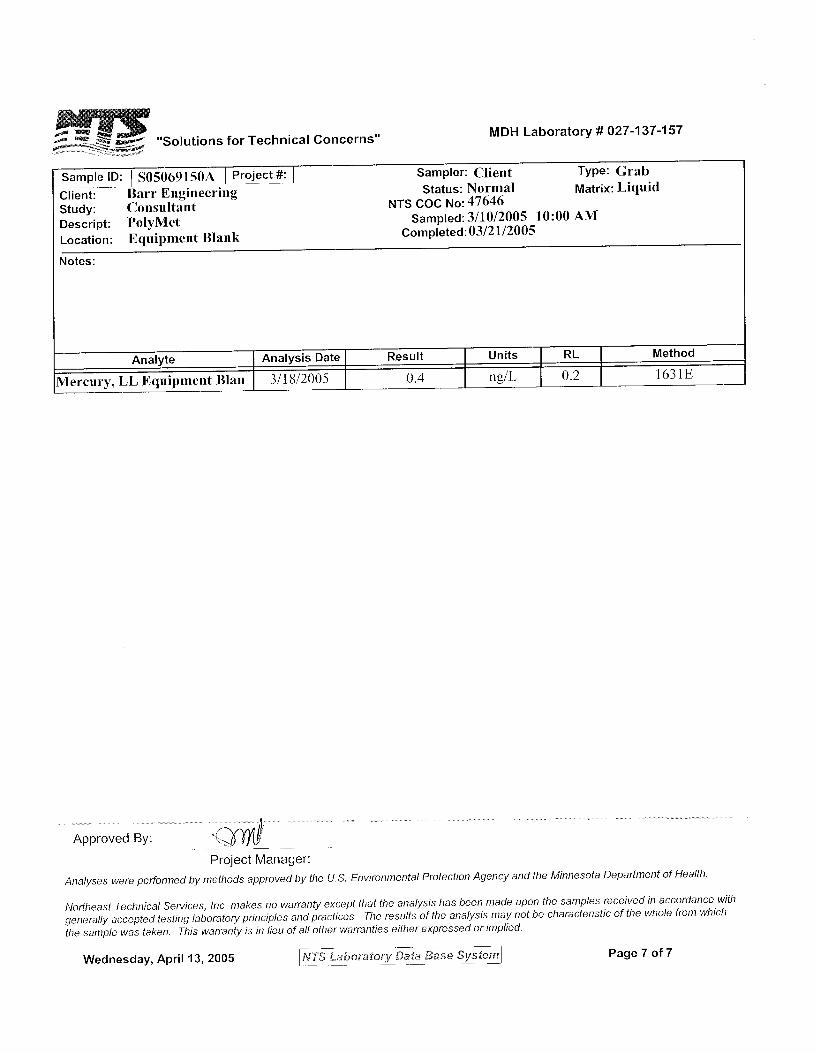
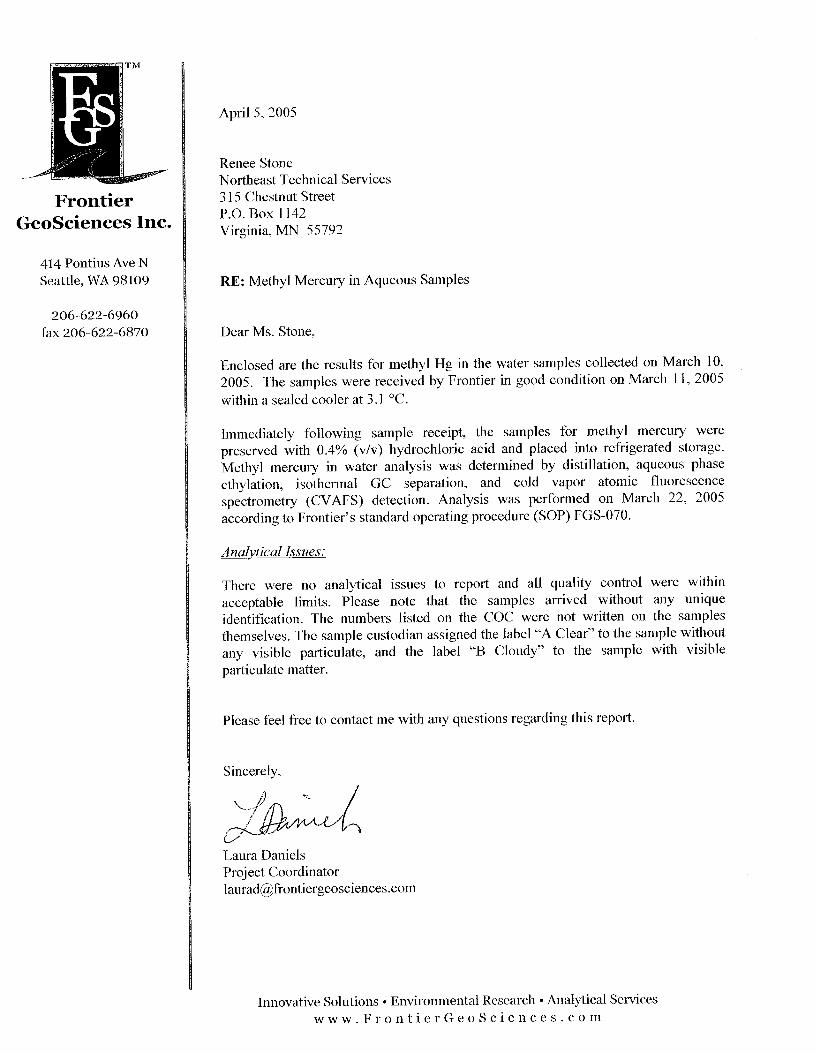
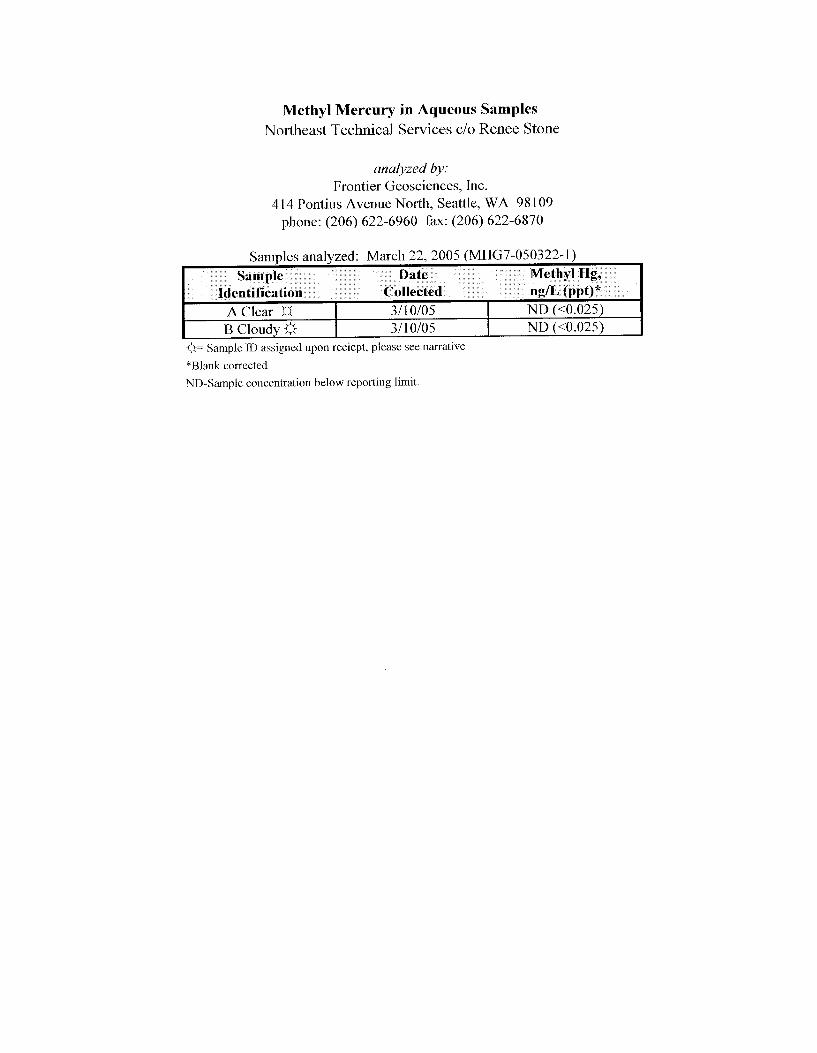
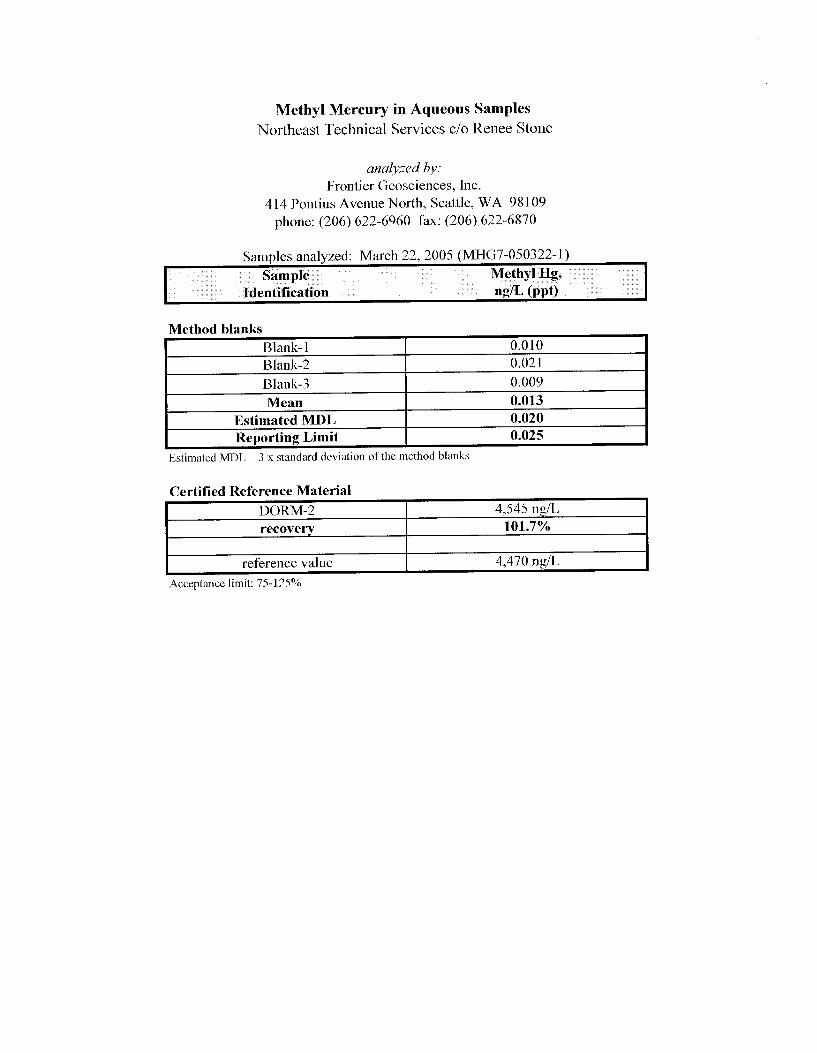
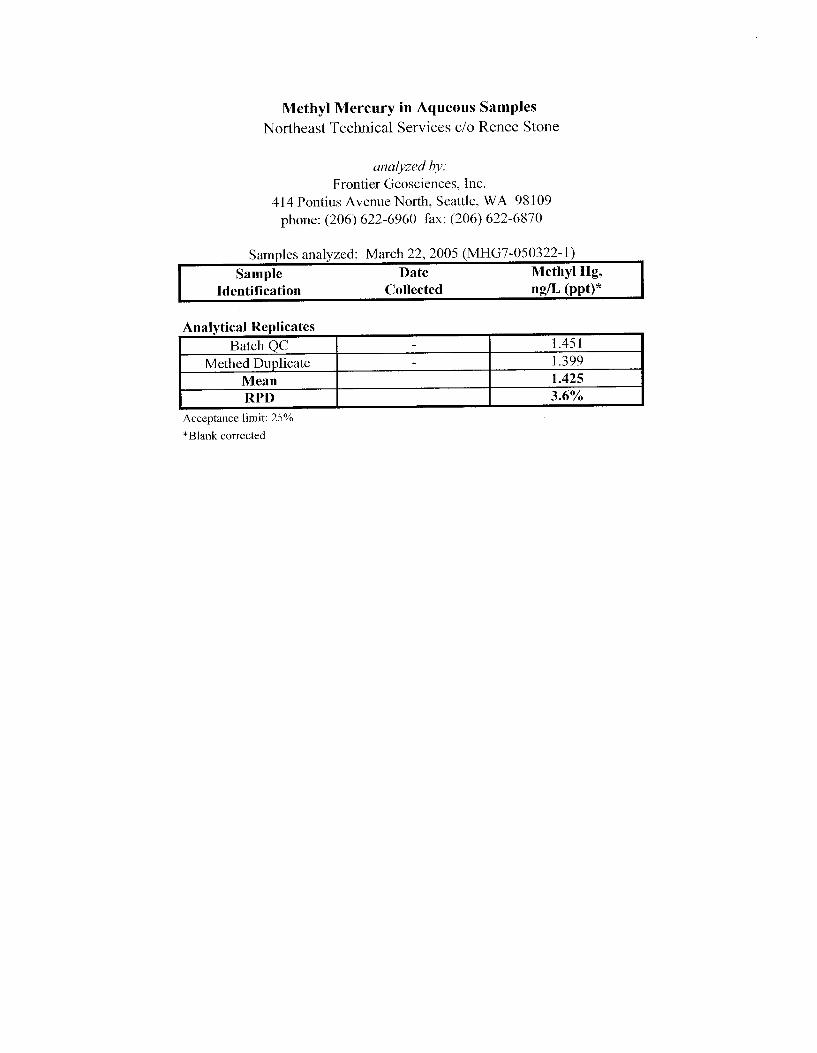
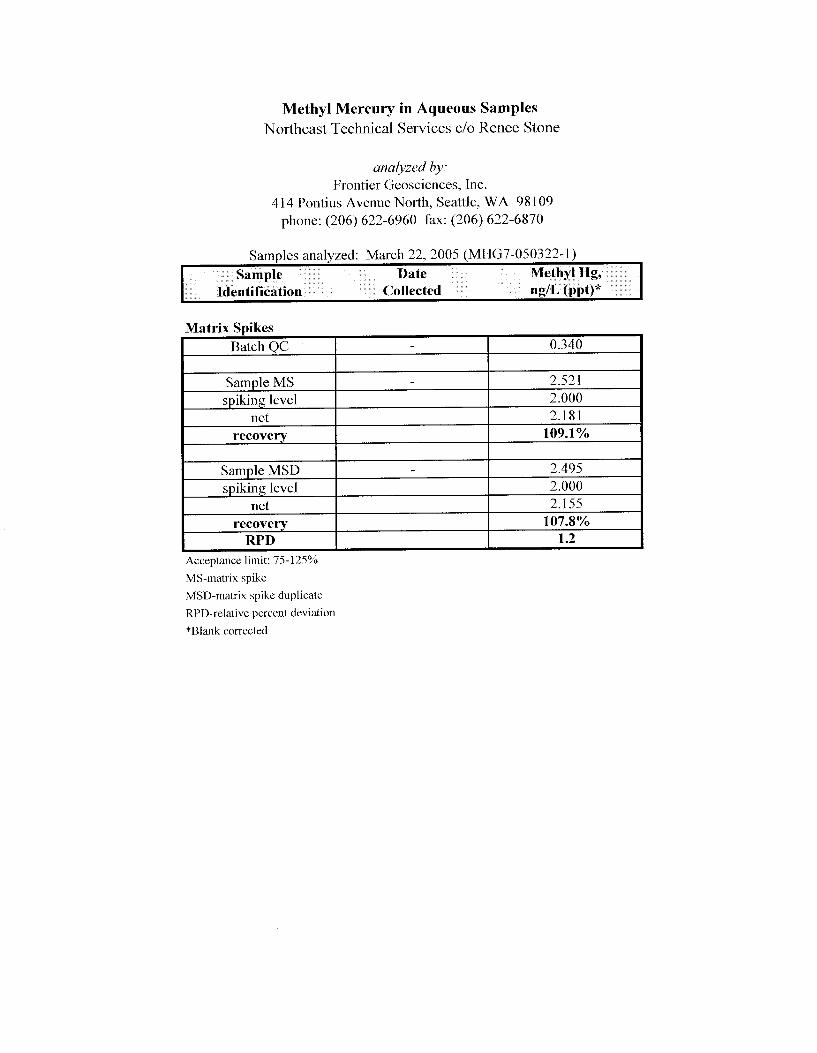
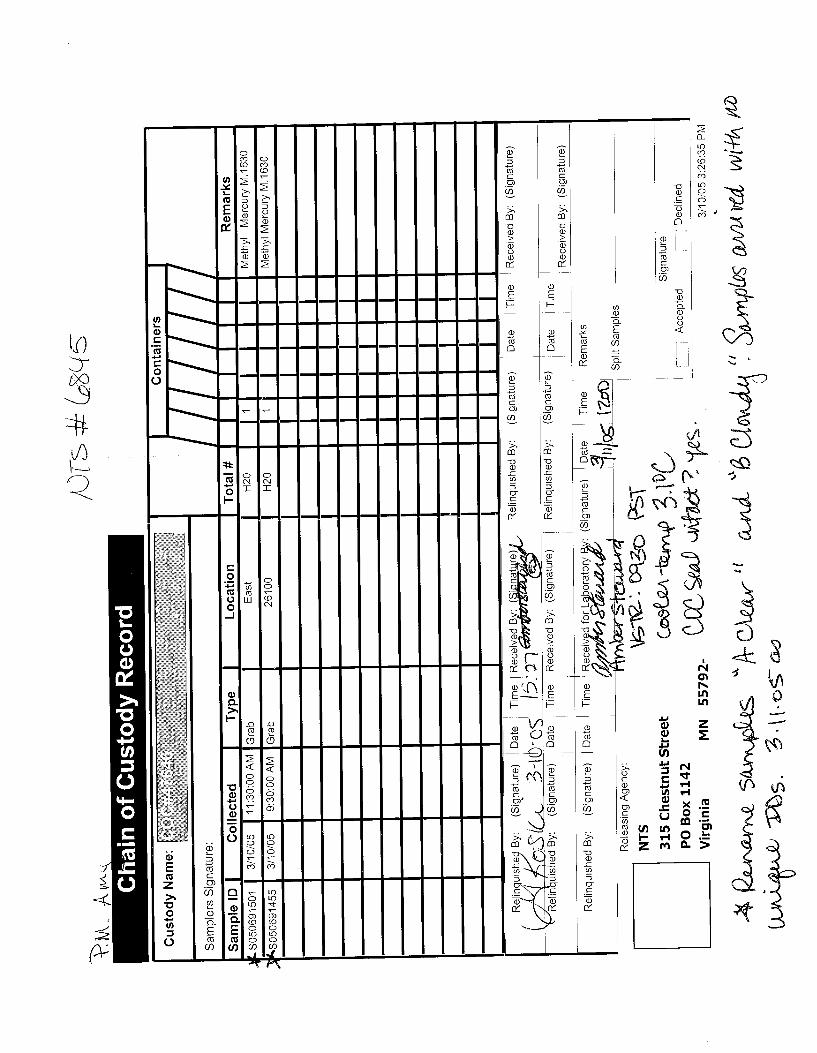
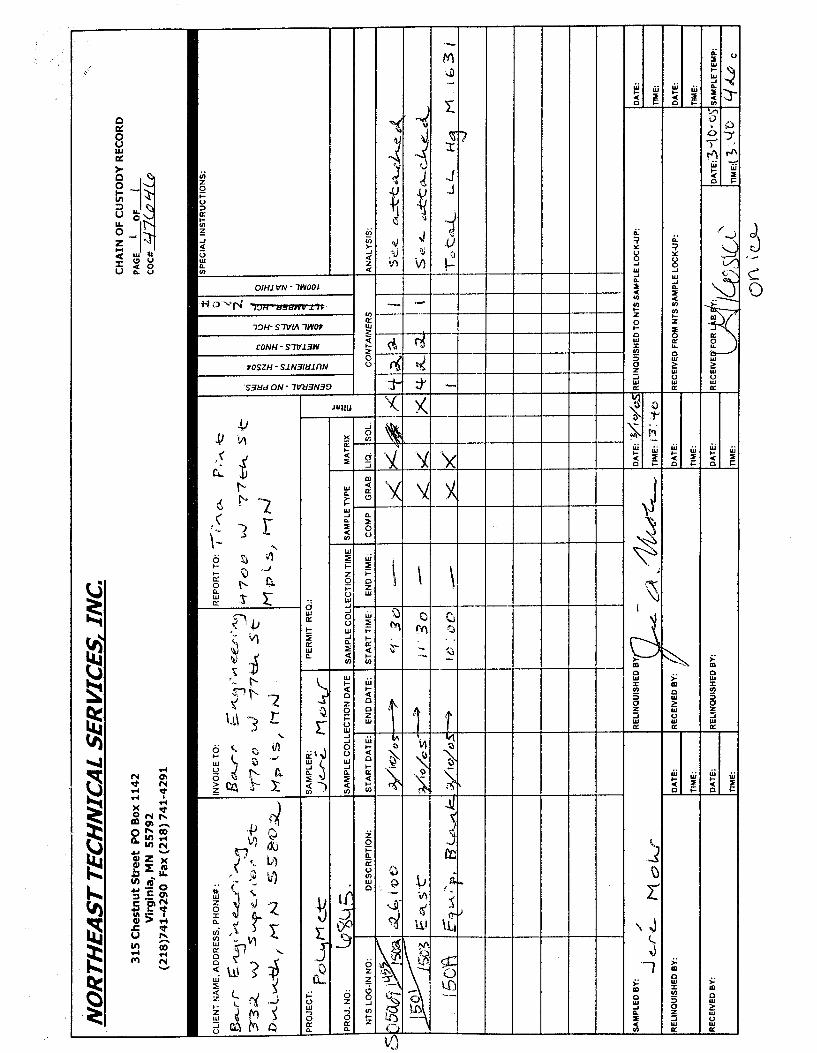
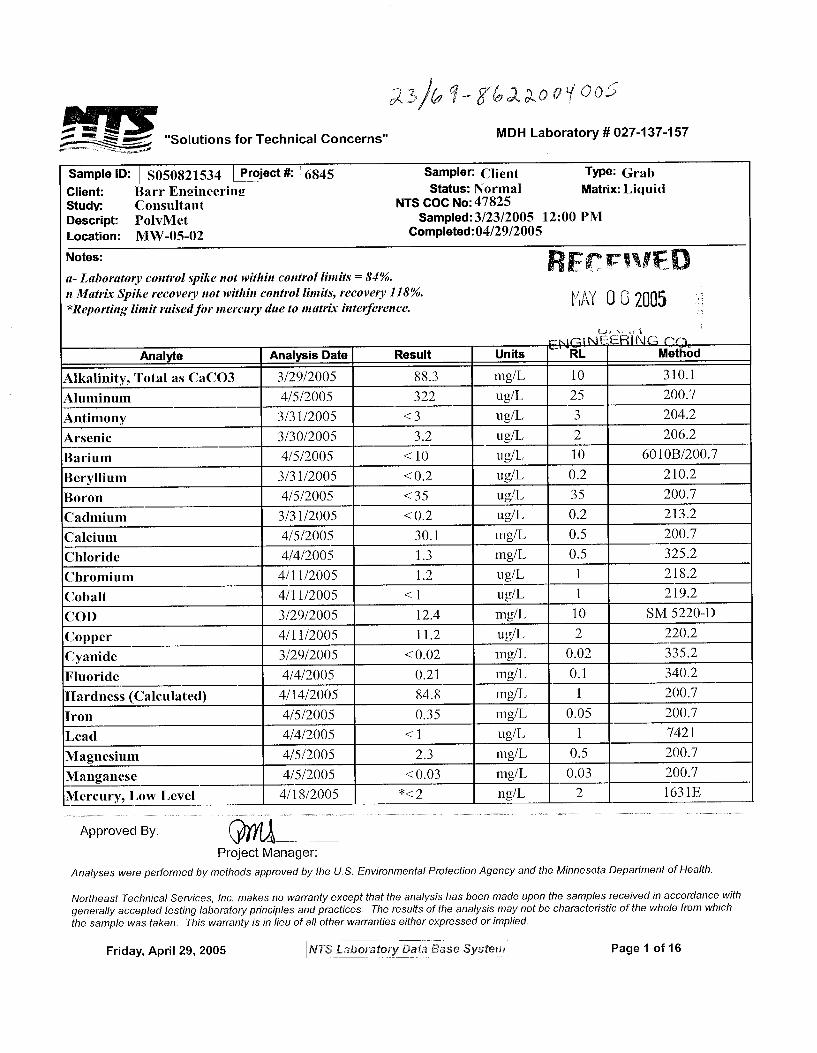


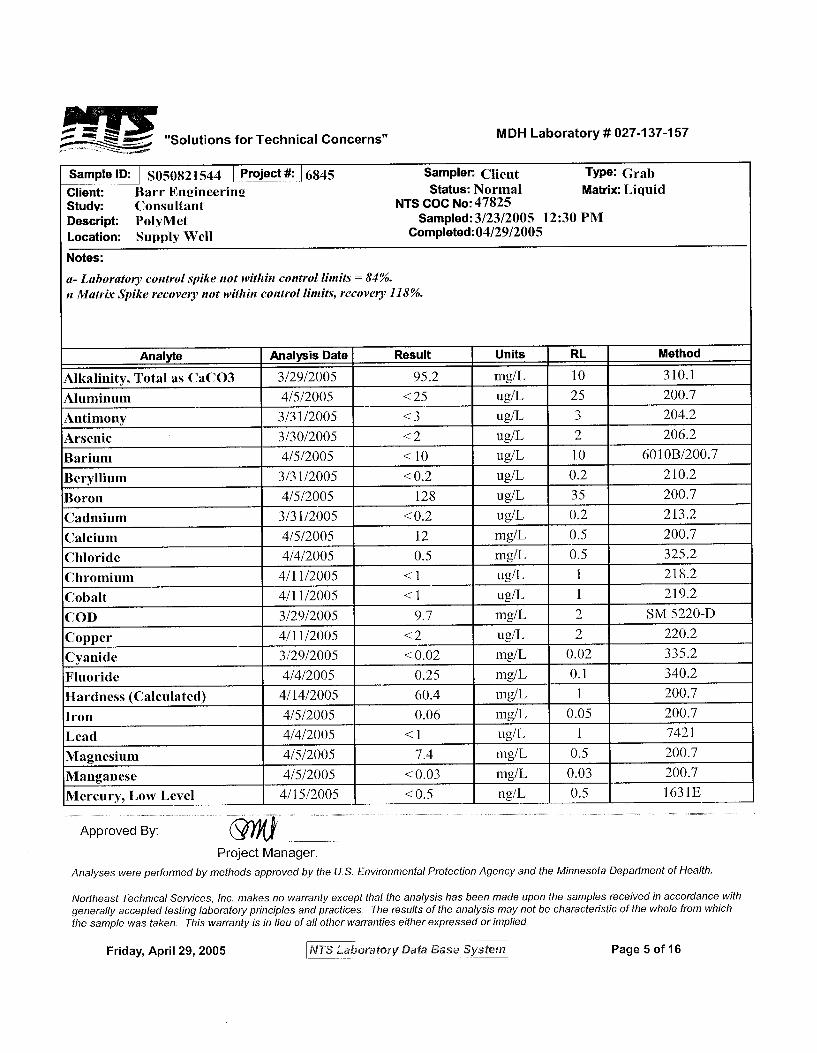


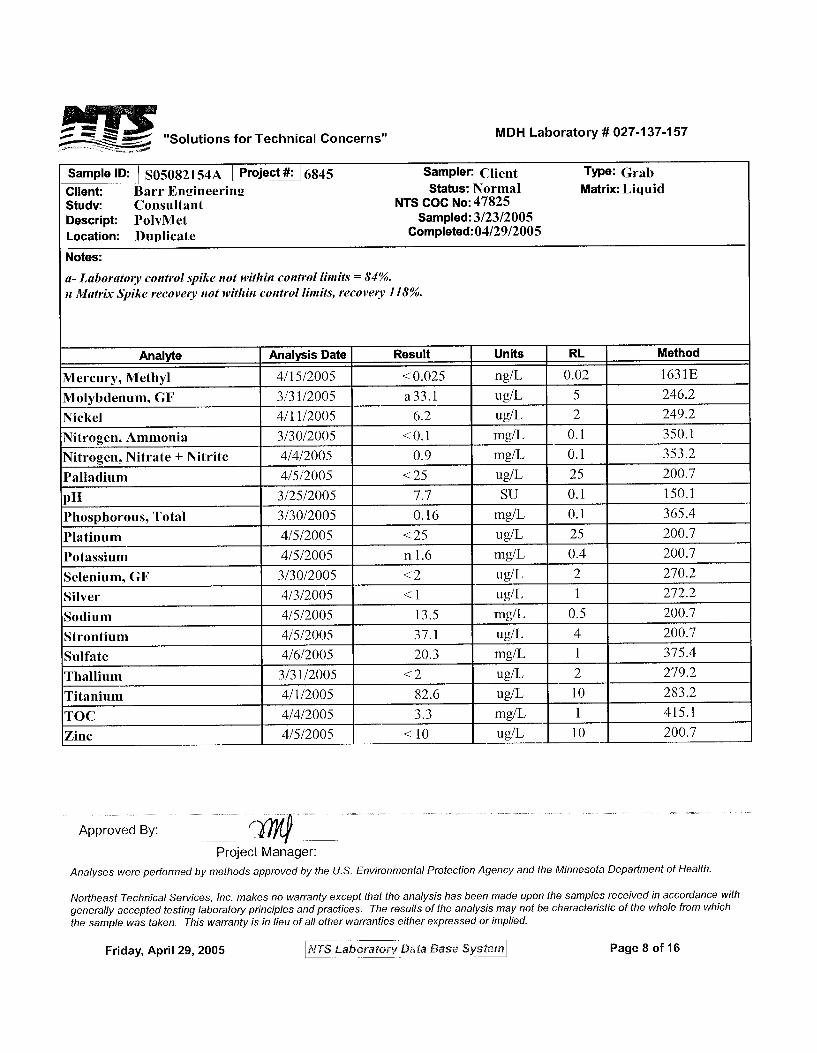

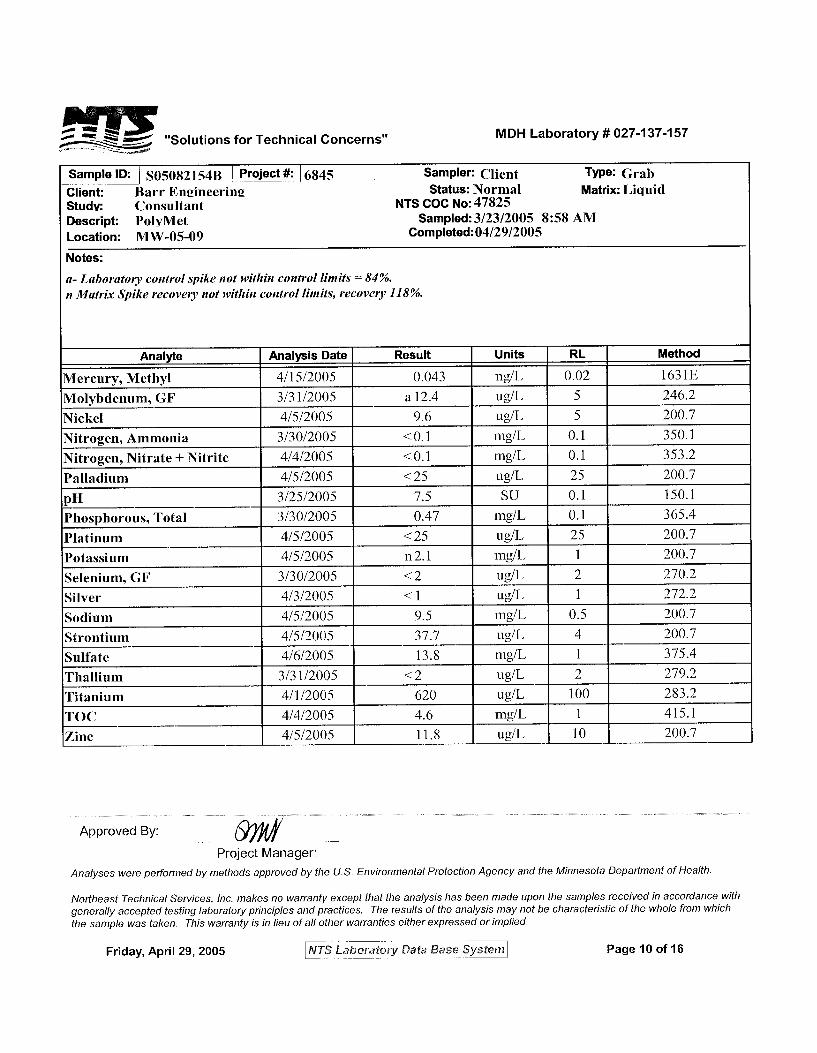
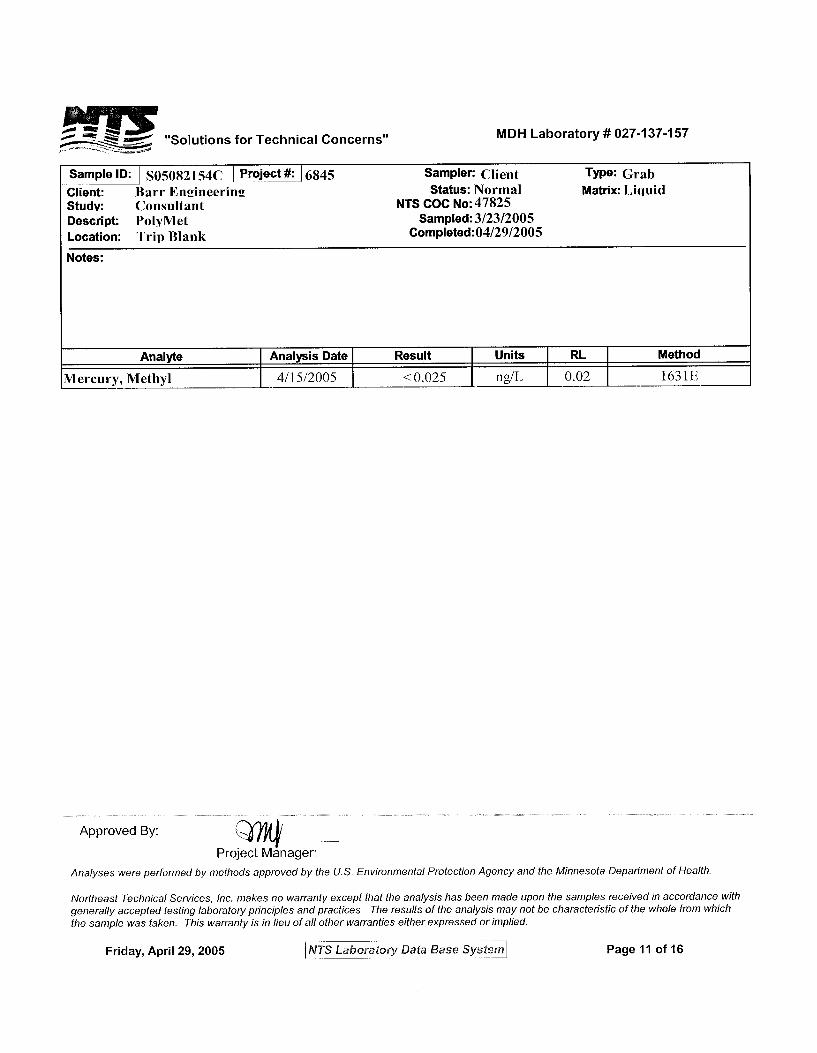
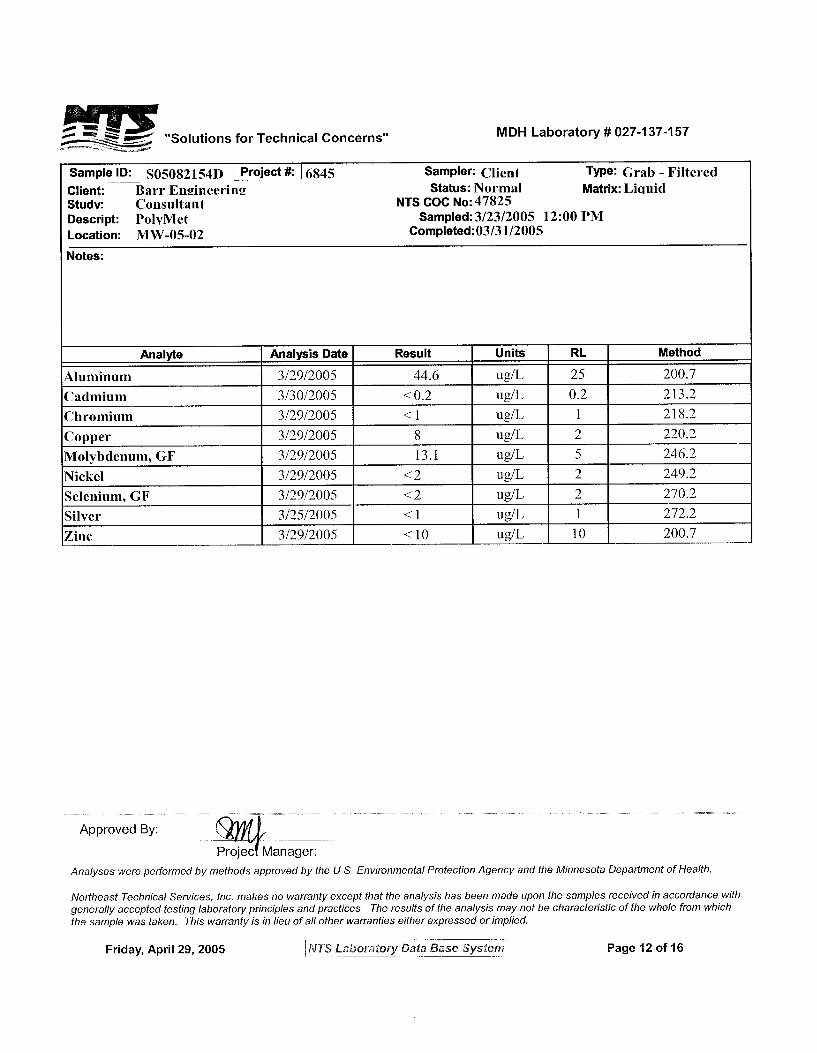
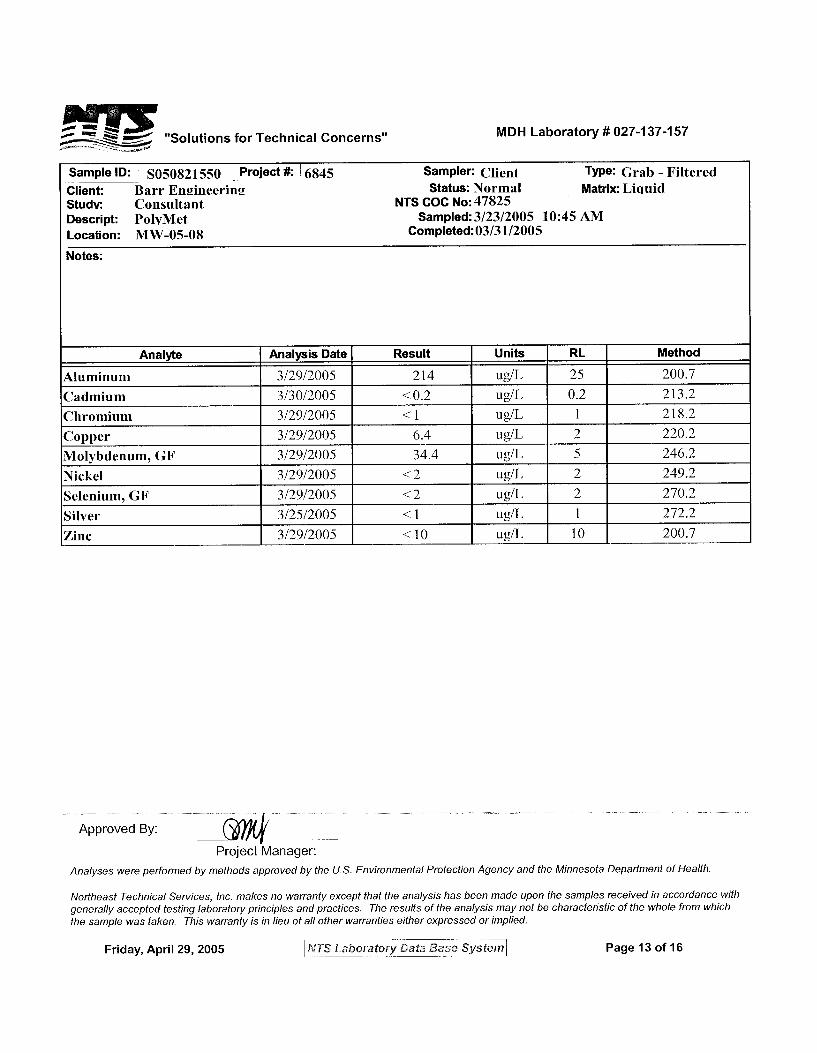


Appendix E