Embed Size (px)
Citation preview
2011:4
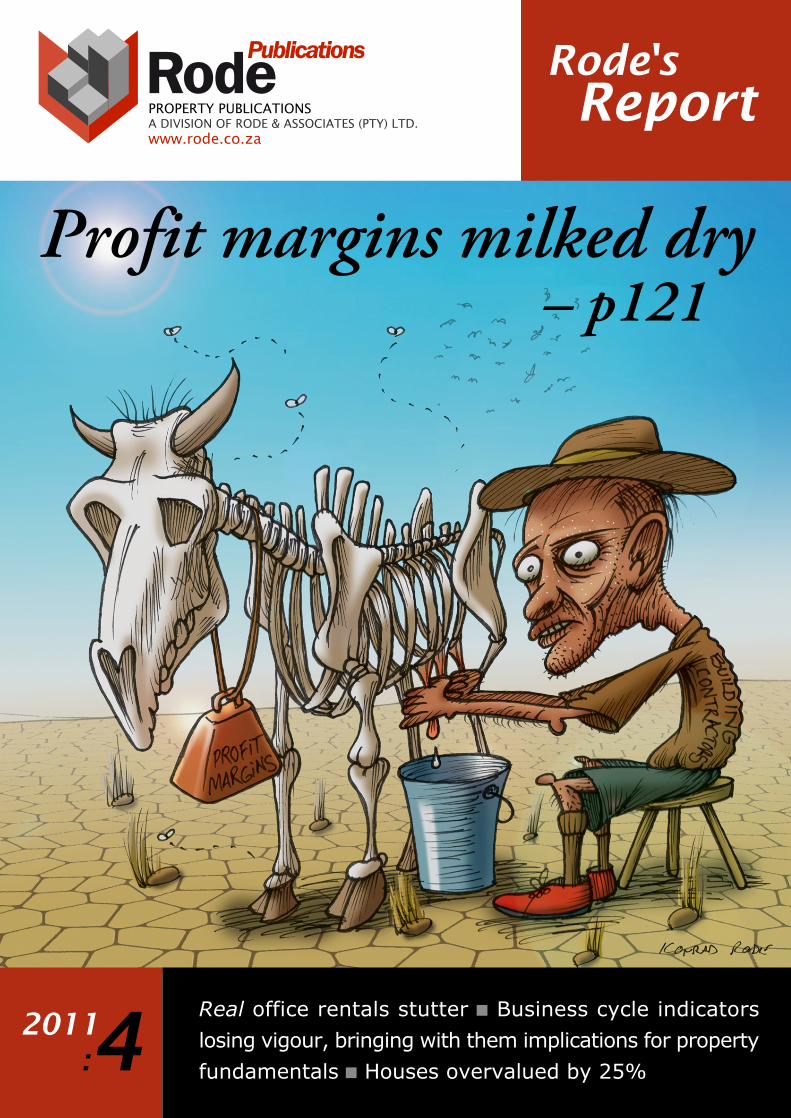
Real office rentals stutter Business cycle indicators
losing vigour, bringing with them implications for property
fundamentals Houses overvalued by 25%
PROPERTY PUBLICATIONSA DIVISION OF RODE & ASSOCIATES (PTY) LTD.www.rode.co.za


Editor-in-chiefErwin G. Rode
EditorJohn S. Lottering
Survey administratorJuwayra Januarie
AdvertisingLynette Smit
012-664 4159
SubscriptionsAngelique Claasen
021-946 2480
Annual subscription:
4 issues: R4.500,00 (excl. VAT)
Published byRode & Associates (Pty) Ltd.
Reg. No: 2009/005600/07
PO Box 1566, Bellville 7535
Tel. 021-946 2480
Fax 021-946 1238
E-mail: [email protected]
Website: www.rode.co.za
Cover illustrationKonrad Rode
082 44 66 526
www.rodegraphics.com
PrintingRSAM Printers
082 418 4878
© Rode & Associates (Pty) Ltd., December 2011. All rights reserved. No part of this publicationmay be reproduced, stored in a retrieval system, or transmitted in any form or by any means,electronic, mechanical, photocopying, recording or otherwise, without the prior permissionof the publisher. While all reasonable precaution is taken to ensure the accuracy of information,Rode & Associates (Pty) Ltd. shall not be liable to any person for inaccurate information oropinions contained in this publication. Portions of this report may be reproduced for legitimateacademic or review purposes provided due attribution is cited.
Vol. 22 no. 4
Erwin G. Rode(editor-in-chief)
John S. Lottering(editor)
on the South African Property Market2011:4
iRode’s Report 2011:4

Property is constantly in the limelight and
investors are searching for meaningful,
property-specific information. This makes
a compelling argument for finely-targeted
advertising in the Rode’s Report on the SA
Property Market. This independent analysis
is one of the most widely-read publications
of its kind.
Target audience: Rode’s Report is targeted
at investors and property practitioners such
as property developers, property managers,
landlords, merchant banks, commercial banks
and non-residential property brokers.
Continued exposure: A quarterly publication,
Rode’s Report is used as a reference source
with a long shelf life.
Rates and special advertising offers: Take
advantage of Rode’s special advertising offer:
a “first-timer” offer of 10% less on our list
price. Normal rates appear on the Rode
website.
Advertise on Rode’s website: For an
extension of your marketing, also con-
sider an advertisement on the Rode
website.
Telephone012 664 4159
Websitewww.rode.co.za


Services offered by RodeivRode’s Report 2011:4
RodePlan specialises in town and regional planning to foster pathways to enablesustainable development. This includes:
Land-use control: rezoning, subdivision, departure, consent use, removal oftitle restrictions, zoning schemesSpatial planning: spatial development frameworks (SDFs) and plans (SDPs)Governmental integrated development planning (IDP): processes andproducts, supported by a geographic information system (GIS).
RodePlan focuses on town and development planning processes and products atmacro, meso and micro level. RodePlan considers an in-depth understanding ofthe social, economic, political and environmental elements that underpin present-day society as fundamental to an SDF in order for spatial planning to complementeconomic growth and development.
Rode also advises private clients on the development potential of specific propertiesand/or land disposal strategies. This is done in collaboration with our expertiseas property economists. RodePlan's clients include property owners, developers,engineering companies and government institutions.
www.rode.co.za
SPATIAL & DEVELOPMENT PLANNERS & ECONOMISTSA DIVISION OF RODE & ASSOCIATES (PTY) LTD.
As one of South Africa's largest valuation firms, Rode annually values propertyportfolios which include shopping centres, agricultural property, residential,commercial and industrial property. Rode also undertakes municipal propertyvaluations, as well as specialized valuations such as bare dominiums.
Rode's property valuation services are underpinned by the rigorous surveying of,inter alia, market rental levels and capitalization rates. Rode's valuation servicesalso rely extensively on techniques such as regression models, as well as theopportunity cash flow (OCF) method. This ensures uniform and realistic marketvaluations, and is Rode's competitive edge.
Farm valuations
Rode's agricultural valuation department specialises in the valuation of farmsand smallholdings, and understands the value-drivers within this sector.
Bare dominiums
Rode is widely regarded by lending institutions as the authority on the valuationof bare dominiums (leased fee estates in the USA). A bare dominium propertyis usually a property with a long lease, where the cash flow of the lease has
"been" "stripped out" – e.g. by selling the present value of the cash flow of alease to a third party.
Rode Consult provides forecasts, overviews and expert opinions for corporates,government departments and private clients on a wide range of property issues.Recent outputs include:
Writing a macro overview of the South African housing market for the nationalDepartment of HousingProducing demand forecasts for specific office nodes and flats marketsProducing forecasts of rental levels using econometric modellingAnalysing property portfoliosProducing long-term forecasts of property values in South AfricaAnalysing the property market in Bloemfontein and other Free State townsActing as expert witness in arbitration and litigationConsulting for spatial and development planners and economists.
Services offered by RodevRode’s Report 2011:4
PROPERTY VALUATION & RESEARCHA DIVISION OF RODE & ASSOCIATES (PTY) LTD.
PROPERTY CONSULTANTSA DIVISION OF RODE & ASSOCIATES (PTY) LTD.
Services offered by RodeviRode’s Report 2011:4
Rode's Report on the South African Property Market
The Rode Report analyses and reports on mostsectors of the property market. It covers, amongothers, trends and levels of rentals and standardcapitalization rates by property type, grade,node/township, the listed real estate market, andbuilding construction costs and building activity.Quarterly updated; print or electronic version.
Rode's South African Property Trends
Trends is aimed at general managers with strategicdecision-making power and property investment analystswho are involved in asset allocation and viability studies.It offers a statistically-based analysis and forecast byproperty type of all key indicators affecting the propertymarket, and it covers all the major metropolitan areas toprovide a complete framework for property investmentplanning. The forecasts include those for standard capitalizationrates, prime industrial and office rentals, office take-up, officevacancies, building costs, the property cycle and expected totalreturns on a notional office-building portfolio. Biannual CD publication.
Rode's Retail Report on South Africa
Rode's Retail Report contains analyses and reports onretail property, including shop rentals, operating ex-penses and escalation rates. It covers about 100 shop-ping centres and 120 street-front micro locations (high-street shops) in six metropolitan areas. Retail sales datais presented by magisterial district and by merchandisecategory. It also contains data on new shopping centres,mooted developments and extensions to existing centres.Quarterly CD publication.
PROPERTY PUBLICATIONSA DIVISION OF RODE & ASSOCIATES (PTY) LTD.
Services offered by RodeviiRode’s Report 2011:4
Rode's Time Series database
Rode updates and rents out approximately 5 000
property time series, which offer property researchers
and analysts a unique opportunity to analyse sub-
markets – from office, industrial and residential rentals
to capitalization rates and house prices covering more
than two decades. A Pro and a Lite database is available.
The main difference between the Pro and the Lite database
is that the former contains the disaggregated or nodal data.
Electronic publication on CD, updated quarterly.
Rode's Growth Points
Target market: CEOs, general management, fund in-
vestment managers, analysts
Identifies areas of growth and stagnation in order
to direct investment strategy
Nine South African cities are included: Johannesburg,
Pretoria, Cape Town, Durban, Port Elizabeth, East London,
Bloemfontein, Nelspruit, Polokwane
Updated once a year
Price on enquiry
Rode's Sales
Target market: anyone who has to estimate market
values of commercial and industrial properties, as well
as vacant land. The report analyses and reports on actual
transactions. It estimates capitalization rates and calculates
sales prices per square metre that are based on actual
transactions in contrast to the opinion surveys underlying
Rode’s Report. Users of Rode’s Sales are advised to make use
of this information in conjunction with Rode’s Report. Monthly
electronic publication.

Rode staff
Erwin RodeBA, MBA (Stell): CEO
Garth JohnsonBCom (Stell), BComHons(Econ) (UNISA), NDREES (UNISA)
Juliana DommisseBEconHons (Stell)
John S LotteringBCom(Finance)(UWC), BComHons(Econ)(UWC),MCom(Econ) (UWC)
Angelique Claasen
Abigail Jaftha
Biancé JohnsonJournalism (City Varsity)
Elizma Hawksley
Lynette Smit
Juwayra Januarie
Karen E ScottBComHons (Stell), BComHons (UCT)
Monique VernooyBTech(QS) (Cape Tech), NDREES (UNISA)
Tobi RetiefBA (Stell), NDREES (UNISA)
Madeniah JappieBScHons (Property Studies) (UCT)
Anneke MeijersBCom(Stell), BCom Hons(Econ) (Stell)
Berchtwald RodeBA (Stell), MTRP (UOFS)
Tanya Lendis
Stephan van der WaltMA (Stell)
Janelle Van HarteParalegal (School of Paralegal Studies)
Martin CarstensB Iuris, B Admin Hons (Mun Admin), M Admin (UNISA), D Admin (UP)
Rode’s Report 2011:4 Rode staffix
Contents
State of the property market
State of the property market in quarter 3 of 2011 1
Capitalization rates
Investment demand at risk of being dampened further 4
How to estimate capitalization rates – anywhere 14
Listed property
A double whammy for listed property prices 17
Office rentals, operating expenses, and office demand &vacancies
Rental office rentals stutter 21
Low confidence suppressing demand for space 37
Non-industrial land values
Office, shopping-centre and filling-station stand value 49
Industrial rentals and vacancies and industrial stand values
Business cycle indicators losing vigour 54
Values of industrial stands are struggling 81
Residential market
What’s up? Residential rentals stutter while retail sales are booming 104
Houses overvalued by 25% 117
Building activity & building costs
Tender prices accelerate as profit margins are milked dry 121
Rode’s Report 2011:4 Contentsxi
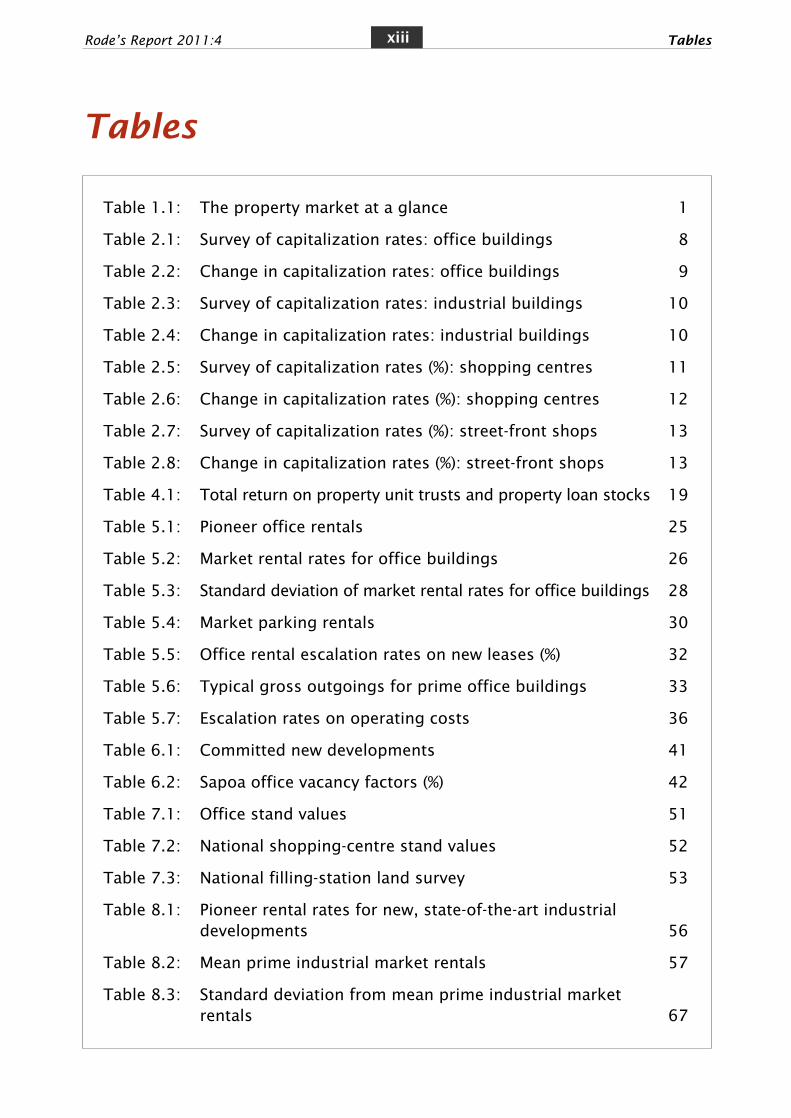
Tables
Table 1.1: The property market at a glance 1
Table 2.1: Survey of capitalization rates: office buildings 8
Table 2.2: Change in capitalization rates: office buildings 9
Table 2.3: Survey of capitalization rates: industrial buildings 10
Table 2.4: Change in capitalization rates: industrial buildings 10
Table 2.5: Survey of capitalization rates (%): shopping centres 11
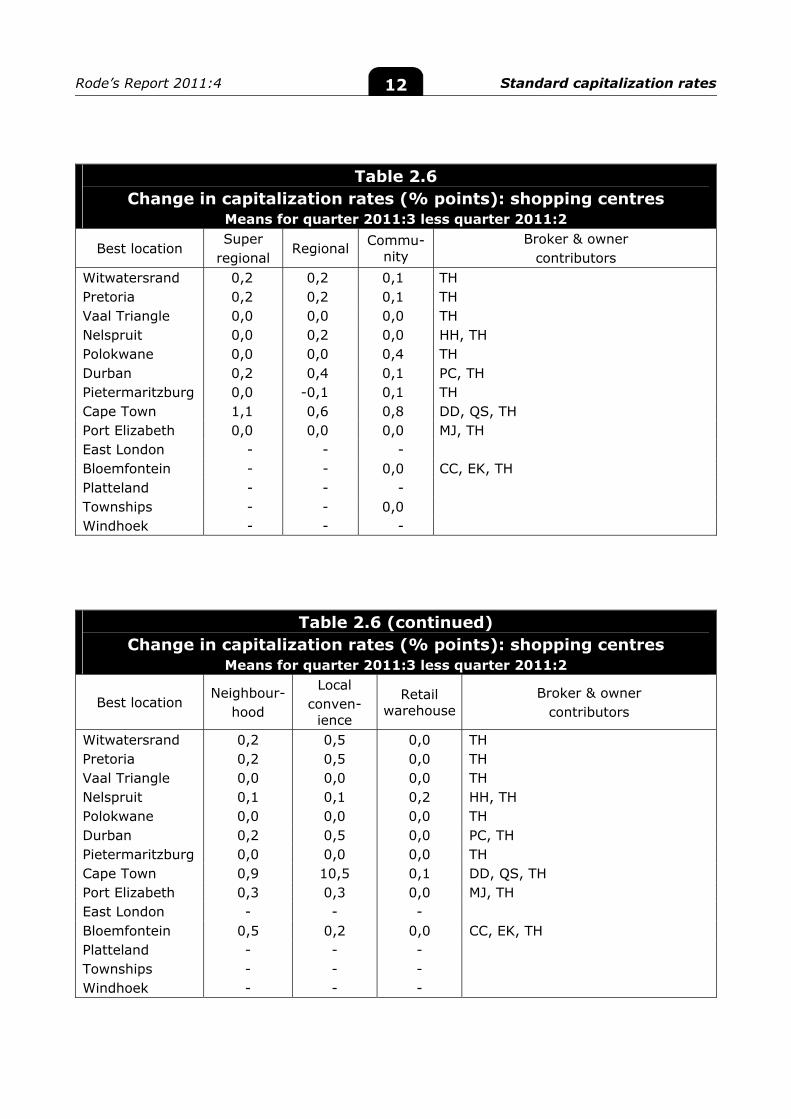
Table 2.6: Change in capitalization rates (%): shopping centres 12
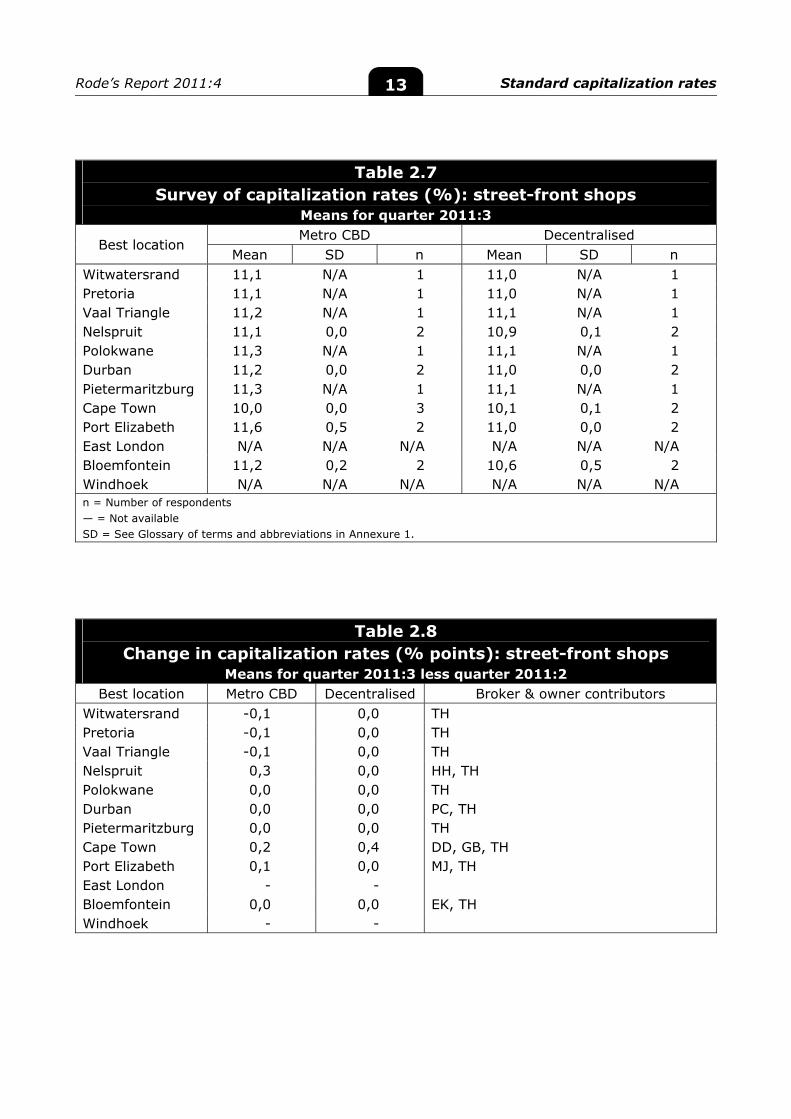
Table 2.7: Survey of capitalization rates (%): street-front shops 13
Table 2.8: Change in capitalization rates (%): street-front shops 13
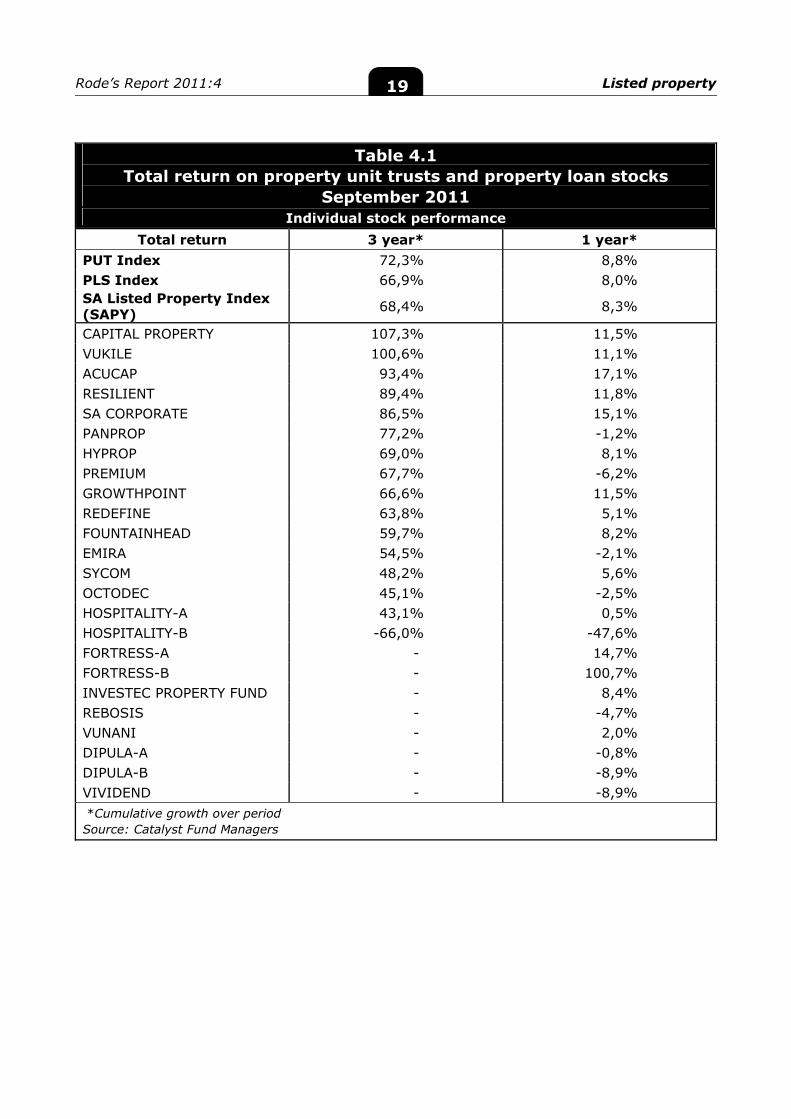
Table 4.1: Total return on property unit trusts and property loan stocks 19
Table 5.1: Pioneer office rentals 25
Table 5.2: Market rental rates for office buildings 26
Table 5.3: Standard deviation of market rental rates for office buildings 28
Table 5.4: Market parking rentals 30
Table 5.5: Office rental escalation rates on new leases (%) 32
Table 5.6: Typical gross outgoings for prime office buildings 33
Table 5.7: Escalation rates on operating costs 36
Table 6.1: Committed new developments 41
Table 6.2: Sapoa office vacancy factors (%) 42
Table 7.1: Office stand values 51
Table 7.2: National shopping-centre stand values 52
Table 7.3: National filling-station land survey 53
Table 8.1: Pioneer rental rates for new, state-of-the-art industrialdevelopments 56
Table 8.2: Mean prime industrial market rentals 57
Table 8.3: Standard deviation from mean prime industrial market rentals 67
Rode’s Report 2011:4 Tablesxiii
Tables
Table 8.4: Predominant market escalation rates (%) for industrial leases 79
Table 8.5: Indicative operating expenses for industrial buildings 80
Table 9.1: Market values for industrial stands 83
Table 9.2: Standard deviation from industrial stands 93
Table 10.1: Gross-income yields (%): Flats 106
Table 10.2: Flat rentals: standard-quality block of flats 107
Table 10.3: Flat rentals: upmarket-quality block of flats 112
Table 11.1: Gross-income yields (%) on houses by price class 119
Table 11.2: Gross-income yields (%) of townhouses by price class 120
Table 12.1: New buildings completed (private sector)(m2) 123
Table 12.2: New residential buildings (private sector)(m2) 123
Rode’s Report 2011:4 xiv
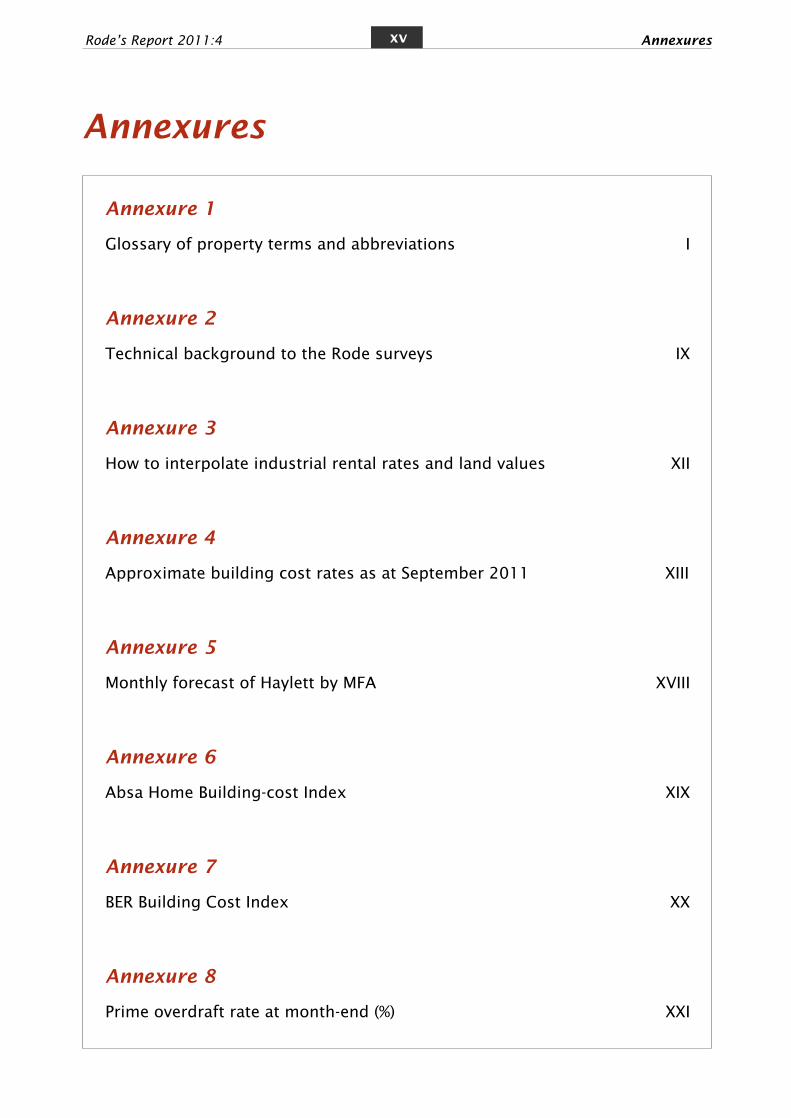
Annexures
Annexure 1
Glossary of property terms and abbreviations I
Annexure 2
Technical background to the Rode surveys IX
Annexure 3
How to interpolate industrial rental rates and land values XII
Annexure 4
Approximate building cost rates as at September 2011 XIII
Annexure 5
Monthly forecast of Haylett by MFA XVIII
Annexure 6
Absa Home Building-cost Index XIX
Annexure 7
BER Building Cost Index XX
Annexure 8
Prime overdraft rate at month-end (%) XXI
Rode’s Report 2011:4 Annexuresxv
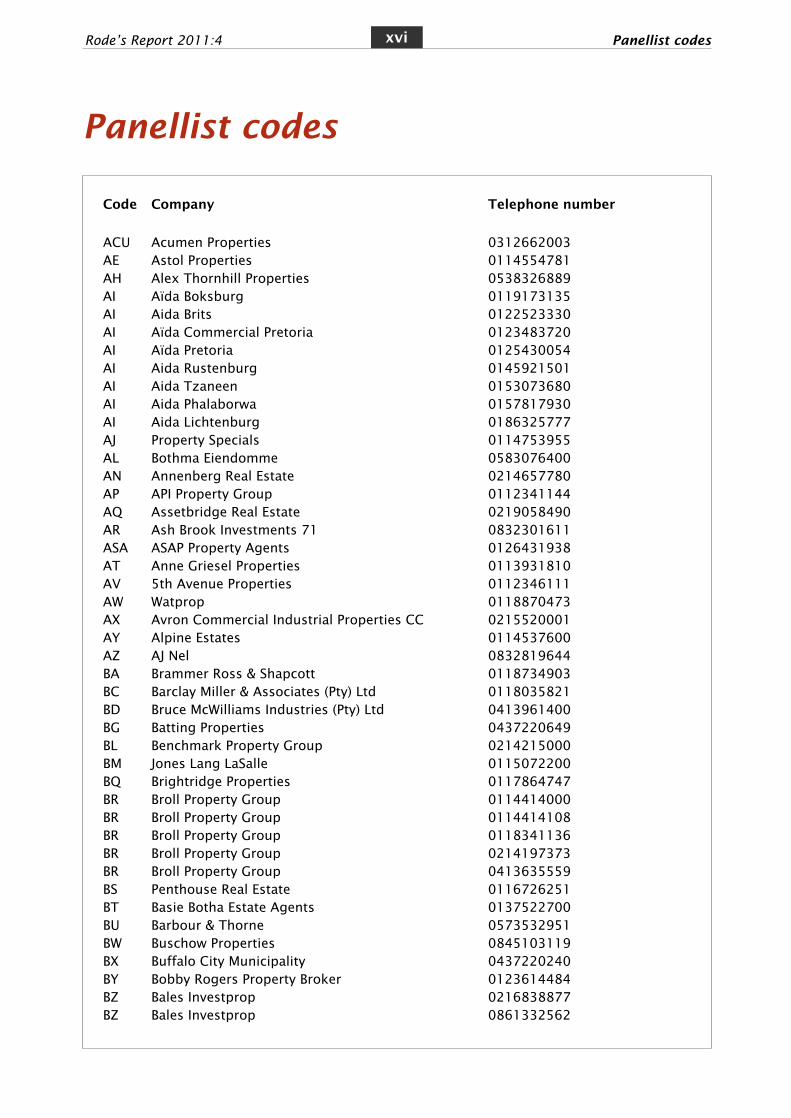
Panellist codes
Code Company Telephone number
ACU Acumen Properties 0312662003AE Astol Properties 0114554781AH Alex Thornhill Properties 0538326889AI Aïda Boksburg 0119173135AI Aida Brits 0122523330AI Aïda Commercial Pretoria 0123483720AI Aïda Pretoria 0125430054AI Aida Rustenburg 0145921501AI Aida Tzaneen 0153073680AI Aida Phalaborwa 0157817930AI Aida Lichtenburg 0186325777AJ Property Specials 0114753955AL Bothma Eiendomme 0583076400AN Annenberg Real Estate 0214657780AP API Property Group 0112341144AQ Assetbridge Real Estate 0219058490AR Ash Brook Investments 71 0832301611ASA ASAP Property Agents 0126431938AT Anne Griesel Properties 0113931810AV 5th Avenue Properties 0112346111AW Watprop 0118870473AX Avron Commercial Industrial Properties CC 0215520001AY Alpine Estates 0114537600AZ AJ Nel 0832819644BA Brammer Ross & Shapcott 0118734903BC Barclay Miller & Associates (Pty) Ltd 0118035821BD Bruce McWilliams Industries (Pty) Ltd 0413961400BG Batting Properties 0437220649BL Benchmark Property Group 0214215000BM Jones Lang LaSalle 0115072200BQ Brightridge Properties 0117864747BR Broll Property Group 0114414000BR Broll Property Group 0114414108BR Broll Property Group 0118341136BR Broll Property Group 0214197373BR Broll Property Group 0413635559BS Penthouse Real Estate 0116726251BT Basie Botha Estate Agents 0137522700BU Barbour & Thorne 0573532951BW Buschow Properties 0845103119BX Buffalo City Municipality 0437220240BY Bobby Rogers Property Broker 0123614484BZ Bales Investprop 0216838877BZ Bales Investprop 0861332562
Rode’s Report 2011:4 Panellist codesxvi
CB Centurion Letting & Sales 0126536180CC CCI Properties CC 0828211214CD Chris van der Walt Properties 0415821110CE Cenprop Real Estate 0333949595CF Cathy Cordier Eiendomme 0562121518CI City Property Administration 0123198811CL Cleomic Property Consultants 0117061591CM Capitol Commercial Properties 0219141840CN Citynet 0114833930CP Citiprop Real Estate 0214658391CQ Connaught Properties (Pty) Ltd 0117252780CR Colliers International 0215915067CR Colliers International 0312672001CR Colliers International 0413742205CS Chase & Sons 0164213170CU Africape Property Investments (Pty) Ltd. 0219144533CV Chris Hearn and Associates 0314629270DA Dallas Properties CC 0118273417DC Dave Furness Properties 0136536330DD Diamond Properties 0214340001DE Dedekind Real Estate 0366372297DG DG Ladegaard Real Estate 0169339633DK Direct @ Home Estates 0186320269DL Delta Real Estate 0219302343DN David Newham Property Management 0219480934DO Bainprop (Pty) Ltd 0116092542DP De la Porte Property Group 0215519777DQ DesKay Real Estate 0437484252DT DTZ Leadenhall (Pty) Ltd 0112742300DV Dan Viljoen Estates 0116832345DW Divaris Property Brokers 0215311551EB ERA Real Estate 0145974977EB ERA Bundu Properties 0157810589EB ERA Ermelo 0178192398EB ERA Sun Properties 0436433024EB ERA National George 0448741113EB ERA Kuruman 0537123503EC EVS Elite Valuation Services 0741922667ED Edric Trust 0514489431EH Ermelo Homenet 0178192880EJ Erasmus JoosteIng 0184734511EK Ellenberger & Kahts 0514301511EL East London Estates & Auctioneering 0437351662EM Property Management & Rental Specialist CC 0217901991EP Ecclesiate Property Specialists 0458381131ER Associated Property Brokers 0437260501ES Eli StröhEdmsBpk 0152975890EV Engel & Völkers Commercial Properties 0123467777FN Fine & Country Bethlehem 0583032333FN Fine & Country Kellaprince 0137544400
Panellist codesxviiRode’s Report 2011:4
FO Fosprops Properties/ Homenet 0357898583FP PPA Property Development CC 0123429099FR Fraser & Hurd (Pty) Ltd/Fraser Properties 0413654445GB Galetti Commercial and Industrial 0214186308GB Galetti Commercial and Industrial 0117831195GE Gustrouw Estates (Pty) Ltd 0218547220GO Pam Golding 0218711480GO Pam Golding 0583035565GO Pam Golding Commercial 0214177878GO Pam Golding Commercial 0437054040GW Goldswain Investments 0437222876GY Guy de la Porte Property Solutions 0217948879HE Homelet Grahamstown 0466222839HH Hendrik Tryhou Property Consultants 0137441671HK Huurkor 0124008600HN Harcourts Heloman 0118246028HN Harcourts Jana-Marie Real Estates 0155161526HN Harcourts Excellence 0184687089HN Harcourts Queenstown 0458382560HN Harcourts Parklane 0333423340HS Summerton Edelson Commercial CC 0415811768IP InvestPro 0437263116JL Just Letting Randburg/ Northcliff 0117932757JL Just Letting Potchefstroom 0182931858JL Just Letting City Bowl 0214233344JP John Price Estates 0415833903KA Kailas Property Bureau 0114826461KC Keith Roux Properties 0437213465KE Keydom Real Estate 0132826187KI Kitchings Agencies 0419229870KM Kirchmann-Hurry Investments Ltd 0117067131LA Landlords “We do Rentals” 0219751770LD Lendac Property Brokers 0732148655LF Louis Group Properties 0214223030LH Leader Homes 0538313955LM Louis Kruger Property Management 0219033101LP Les' Property and Rentals 0437266933LS Lock Sloane & Partners 0317011010MD Mont Blanc Projects & Properties (Pty) Ltd 0826005326MI Platinum Global 0514474711MJ Majola & Boyd (Pty) Ltd 0861111789ML Mindry Properties CC 0317834307MO Moolman Group of Companies 0152914700MP Monarch Rentals (Kingdom of Rentals) 0118494211MR Marder Properties 0114531220MW Mc William Murray Realty 0312674800NE Newbridge Property Services 0219139131NR National Real Estate 0514059933OC Omnicron Commercial Property Brokers (Pty) Ltd 0219147363OD Oudtshoorn Eiendomme 0442725895
Panellist codesxviiiRode’s Report 2011:4
OG Oscar Saunderson Group 0215914499OM Old Mutual Investment Group Property Investments 0313661811OM Old Mutual Properties 0437270990OP Omnipark Pty (Ltd) 0216836077PA Pace Property Group 0112175959PC Propco (1985) (Pty) Ltd 0312090161PE Property Scene Group 0413734146PF Permanent Trust Property Group 0214418800PG Proximo 0176312033PH President Estate & General Agents (Pty) Ltd 0118738707PI PHG Property Group 0514488831PJ Profile Property Solutions 0333472786PK Philips Property Brokers 0117826007PL Pears Property Consultants (Pty) Ltd 0217623474PM PDL Property Management (Pty) Ltd 0137527333PN Propergation Estates 0219146444PQ Pro-Net Estates 0132433113PR Harcourts Polla Scheepers 0343125841PS Property Scene Real Estate 0357923217QC Cosmoprop Commercial Property Brokers 0219148035QS Commercial Space 0216714343QU Quadrant Properties 0115309840RA Real Estate & Property Services 0878081578RD Redefine Income Fund 0112830028REW Real Estate @ Work 0836328011RF Rent-A-Flat 0117891007RM Remax Kuruman 0537123123RO Reef Property Consultants 0116821827RQ Realty Value 0357891376RR Realnet 0137532544RS Rawson Properties Milnerton 0215587102RY Rita Stipec Properties 0152954537RZ Oriprops 0137528091SC Stockton Property Consultants 0114259857SF Seeff Durbanville & Brackenfell 0219755290SO Simmons & Associates 0437221705SN Selection Estates 0867555545SQ Steer & Company 0214261026SX Status-Mark 0116680100TE Trust & Estate Co. 0026461231224TG Theo Goosen Estate Agents 0152959014TH Trevor Hosioski Investment Properties 0117834569TR Trafalgar Property Services 0112145200TR Trafalgar Property Services 0123265963TR Trafalgar Property Southern Suburbs 0214105500TR Trafalgar Property & Financial Services 0313017017TR Trafalgar Property Management 0437266066UN Unified Properties 0437482323VD Van der Westuizen Eiendomme 0536310846WA Wall & Smith Property Consultants 0217972552
Panellist codesxixRode’s Report 2011:4
WJ Warren Jack Property Group 0413656200WK Wakefields Property Management (Pty) Ltd 0312047400ZB Sotheby's International Realty PE 0413630168ZB Sotheby's International Realty George 0448732519ZB Sotheby's International Realty 0466361388ZE Zenith Properties 0562123207ZZ Anon
Panellist codesxxRode’s Report 2011:4
Acknowledgements
The writers of Rode's Report express their sincere thanks to:
1. Sapoa, for use of the basic data from their office vacancy surveys, which
we analysed further.
2. Medium-Term Forecasting Associates (MFA) of Stellenbosch, for the use
of their monthly forecast of building-input costs (Haylett), as well as
their leading indicator of building activity. Also for their kind permission
to publish the Bureau for Economic Research’s building-cost index, to
which they hold the marketing rights.
3. Absa for the use of their home-building-cost index.
4. Davis Langdon, an AECOM company, for the use of their building cost
data for various building types.
5. Juwayra Januarie, who manages the surveys and compiles the annexures
and Lynette Smit and Angelique Claasen for their technical assistance.
6. All the panellists who so kindly gave of their time and expertise in
responding to our surveys. The complete list of panellists who contribute
to the RR, together with their codes, appears on the following page.
For each of the survey tables in the RR you will find, listed against every
node or area, the codes for all the panellists who contributed information
this quarter.
7. Ken Gardner, who has the task of making sure that all gross grammar
mistakes are corrected.
8. The JSE Securities Exchange, Statistics South Africa and the Bond Exchange
of South Africa for the use of their data.
9. Other property practitioners throughout South Africa, experts in their
fields, too numerous to mention individually. Without the generous
assistance of these professionals, much of our research would be
impossible.
AcknowledgmentsxxiRode’s Report 2011:4

Foreword
Dear Reader
Welcome to the fourth issue of Rode’s Report on theSouth African Property Market (RR) for 2011, whichreports on surveys conducted in the third quarter of2011.
As usual, we report on movements of a number of criticalproperty variables, ranging from capitalization rates,rentals, escalation rates, land values, and operating costsfor the non-residential property market, to changes inhouse prices and flat rentals in the residential property market.
Readers are again reminded of our website – www.rode.co.za – which containsinteresting and relevant property-related articles, most of which are publishedin our monthly e-newsletter, to which readers can subscribe through ourwebsite. It’s free of charge.
If you want to communicate with a specific niche market, you can contactLynette on 082-323 5799 for RR advertising rates.
Juwayra Januarie and Biancé Johnson are in charge of expanding our surveypanel; their job is to give you access to the opinions of as many propertyexperts as possible. We appeal to all market participants who feel they havewhat it takes to become an RR panellist, to please contact Juwayra or Biancéon 021-946 2480 – it’s for the benefit of everyone in the industry. As apanellist you will also get invaluable exposure.
Happy reading!
Sincerely
John S. LotteringEditor
8 December 2011
ForewordxxiiRode’s Report 2011:4
Rode’s Report 2011:4 State of the property market
1
Chapter 1: State of the property market
State of the property market
in quarter 3 of 2011
The following are the significant findings or
conclusions made in this issue of Rode’s Report:
• Real office rentals stutter
• Business cycle indicators losing vigour,
bringing with them implications for property fundamentals
• Houses overvalued by 25%
Quantitative overview of the property market
Table 1.1 provides a snapshot of how the
property market has performed over the
past four quarters by comparing the latest
information (quarter 2011:3) with that col-
lected a year earlier.
Table 1.1
The property market at a glance at quarter 2011:3* % growth on four quarters earlier (on smoothed data)
Nominal Real**
A-grade CBD office rents
Johannesburg +1,4 -4,0
Pretoria +13,9 7,9
Durban +2,0 -3,4
Cape Town +12,3 6,3
A-grade decentralized office rents
Sandton CBD +7,8 2,1
Randburg Ferndale -5,7 -10,7
Brooklyn/Waterkloof (Pta) -8,8 -13,6
Hatfield -2,0 -7,2
Berea (Durban) -2,7 -7,9
La Lucia Ridge +2,9 -2,6
Claremont (CT) -0,7 -6,0
Tyger Valley +14,4 8,3 * Unless otherwise specified
** Nominal values deflated by BER Building Cost Index; however, flat rentals are deflated using the Consumer Price Index.
Rode’s Report 2011:4 State of the property market
2
Capitalization rates
The South African business-cycle indicators
have been losing some of their steam in
recent months and, read together with
what has been happening in the world
economy, are prompting a growing number
of economists to scale down their rather
upbeat outlook for the economy. The non-
residential property market is a derivative
of the economy, so this development has
the very real potential to impact on the rat-
ing of the property market, that is capitali-
zation rates.
During the upswing phase of the business
cycle, property fundamentals are likely to
do well. In turn, this will stimulate invest-
ment demand and lead to an improvement
in the market ratings of property; that is,
capitalization rates are likely to fall. Should
the current cooling in the composite lead-ing business-cycle indicator1 lead to an
1 Published by the Reserve Bank, the index is used to predict the direction of the economy's movements in the months to come. In the case of South Africa, the
actual decline in economic activity, the out-
come could be upward pressure on capitali-
zation rates. Nonetheless, in the third
quarter of 2011, capitalization rates for re-
tail, prime office and industrial property
still managed to remain at roughly the
same level they were in the previous quar-
ter. The market for prime property is still
inherently healthy.
Office rentals
Moderating economic activity and flounder-
ing business confidence, and its debilitating
effect on office demand and vacancies, at
the moment do not augur well for office rentals.
In fact, in the third quarter of 2011, mar-
ket rentals could — on a national basis —
only muster modest growth of 4%. This
comes after having achieved an unsustain-
leading economic indicator provides a guideline for economic growth for at least six months ahead.
Table 1.1 (continued)
The property market at a glance at quarter 2011:3* % growth on four quarters earlier (on smoothed data)
Nominal Real**
Prime industrial rentals (500 m² units)
Central Witwatersrand +4,6 -0,9
Port Elizabeth -1,2 -6,4
Durban metro +5,1 -0,5
Cape Peninsula +4,2 -1,3
Flat rentals (standard quality, all sizes)
Johannesburg metro +1,5 -3,3
Pretoria metro +4,8 -0,2
Durban metro +1,5 -3,3
Cape Town metro +4,2 -0,8
Port Elizabeth +3,0 -1,9 * Unless otherwise specified
** Nominal values deflated by BER Building Cost Index; however, flat rentals are deflated using the Consumer Price Index.
Rode’s Report 2011:4 State of the property market
3
able growth of about 11% in the first quar-
ter. Meanwhile, building-cost inflation (the
cost to construct buildings, as measured by
the BER Building Cost Index) is again
growing and is clocking about 6%. This im-
plies that, in real terms, office rentals have
actually contracted. Thus, we see the busi-
ness-cycle slowdown is already a strong
depressing force on the upswing phase of the long office cycle.
The acceleration in building-cost inflation
can be explained by building contractors
having now milked their profit margins dry.
Therefore, they now have no option but to
pass on higher input costs in the form of
higher tender prices. This comes after in-
tensive tendering competition over the past
two years has forced contractors to cut
their profit margins to the bone. The result
of this was weaker growth in overall tender
prices — which includes profit margins —
relative to the growth in building-input costs (as measured by the Haylett Index).
Industrial market
Slack in the demand for industrial space is
currently displayed by the poor to moder-
ate growth in market rentals. In the third
quarter of 2011, market rentals on the
Central Witwatersrand and in Durban mus-
tered growth of 5% − the best regional
performance. The Cape Peninsula followed
with growth of 4%, while in Port Elizabeth
market rentals were actually somewhat
lower (-1%) than they were a year ago.
Bearing in mind the fact that building costs
grew by 6% (y-o-y), this implies that in
real terms industrial rentals in all of these
industrial areas are actually lower than
they were a year ago.
Prospects for industrial rentals remain
weak, this as a result of an economy
struggling to find its feet amidst uncertain
global economic conditions – not to men-
tion the adverse impact that the current
slowdown in manufacturing output is likely
to have on the demand for industrial prop-erty.
Flat rentals
Residential rentals continue to cruise along,
showing mediocre growth below that of consumer inflation.
Although flats are still outperforming both
houses and townhouses, growth remained
moderate at 2% year-on-year in the third
quarter of 2011. Over the same period,
rentals on townhouses showed growth of
about 1%, while those on houses remained
at roughly the same level as a year ago.
Discouraging for investors in the buy-to-let
market is that these growth rates were well
below the rate of consumer inflation, which
stood at 5% (excluding housing) in the third quarter of 2011.
The house market
For now, no vigorous growth in house pric-
es can be expected until the magnitudes of
the key drivers of demand change signifi-
cantly. One such driver is, of course, inter-
est rates.
In the meantime, house prices remain far
above their long-term replacement-cost
trend line. In fact, houses are still 25%
more expensive than what is suggested by
their long-term trend line. Considering that
asset prices are mean-reverting, the impli-
cation is that a resumption in the down
trend in real houses prices is inevitable –
it’s only a question of time and speed. A
real decline in house prices does not neces-
sarily mean the nominal prices will decline;
a more likely outcome is that nominal pric-
es might grow at, say, 2% per annum for a
few years while inflation is at, say, 6%. �
Rode’s Report 2011:4 Standard capitalization rates 4
9
10
11
12
13
14
80
100
120
140
160
94 95 96 97 98 99 00 01 02 03 04 05 06 07 08 09 10 11
Capitalization rates (smoothed)Business cycle indicator
Industrial leaseback capitalization ratesvs
Coincident business cycle indicator
r = -0,8
Cap
italiz
atio
n ra
tes
(%) B
usiness cycle indicator(2000=
100)
Source of data: Rode's Time Series; SARB
7
8
9
10
11
12
13
80
100
120
140
160
94 95 96 97 98 99 00 01 02 03 04 05 06 07 08 09 10 11
Capitalization rates (smoothed)Business cycle indicator
Regional-shopping-centre capitalization ratesvs
Coincident business cycle indicator
r = -0,8
Cap
italiz
atio
n ra
tes
(%) B
usiness cycle indicator(2000=
100)
Source of data: Rode's Time Series; SARB
Chapter 2: Capitalization rates
Investment demand at risk of being dampened further
Written by John S. Lottering
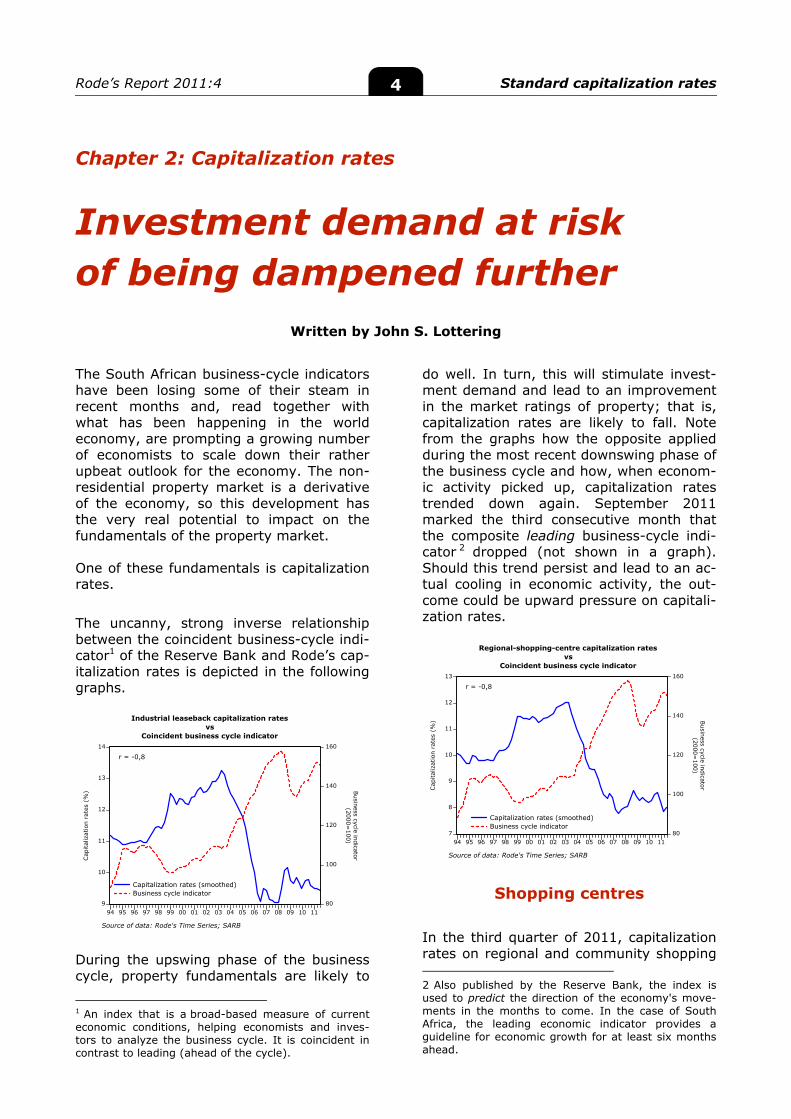
The South African business-cycle indicators have been losing some of their steam in recent months and, read together with what has been happening in the world economy, are prompting a growing number of economists to scale down their rather upbeat outlook for the economy. The non-residential property market is a derivative of the economy, so this development has the very real potential to impact on the fundamentals of the property market. One of these fundamentals is capitalization rates.
The uncanny, strong inverse relationship between the coincident business-cycle indi-cator1 of the Reserve Bank and Rode’s cap-italization rates is depicted in the following graphs.
During the upswing phase of the business cycle, property fundamentals are likely to
1 An index that is a broad-based measure of current economic conditions, helping economists and inves-tors to analyze the business cycle. It is coincident in contrast to leading (ahead of the cycle).
do well. In turn, this will stimulate invest-ment demand and lead to an improvement in the market ratings of property; that is, capitalization rates are likely to fall. Note from the graphs how the opposite applied during the most recent downswing phase of the business cycle and how, when econom-ic activity picked up, capitalization rates trended down again. September 2011 marked the third consecutive month that the composite leading business-cycle indi-cator 2 dropped (not shown in a graph). Should this trend persist and lead to an ac-tual cooling in economic activity, the out-come could be upward pressure on capitali-zation rates.
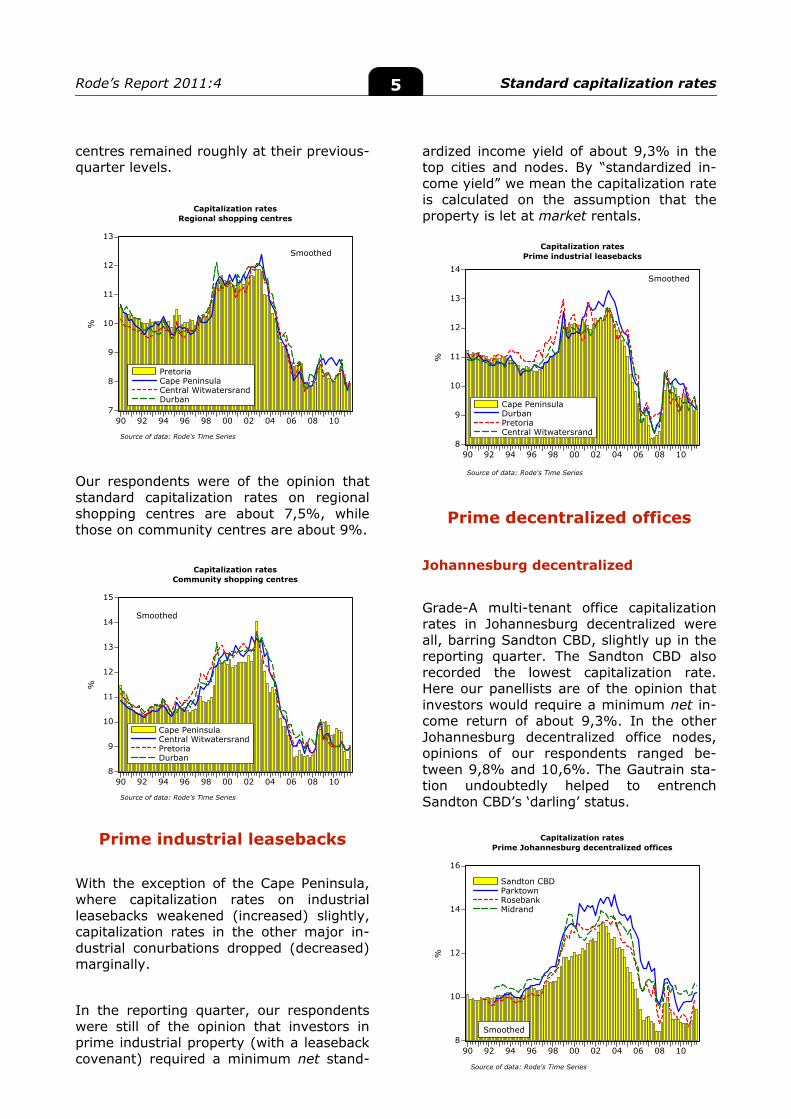
Shopping centres
In the third quarter of 2011, capitalization rates on regional and community shopping 2 Also published by the Reserve Bank, the index is used to predict the direction of the economy's move-ments in the months to come. In the case of South Africa, the leading economic indicator provides a guideline for economic growth for at least six months ahead.
Rode’s Report 2011:4 Standard capitalization rates 5
7
8
9
10
11
12
13
90 92 94 96 98 00 02 04 06 08 10
PretoriaCape PeninsulaCentral WitwatersrandDurban
Capitalization ratesRegional shopping centres
%
Source of data: Rode's Time Series
Smoothed
8
9
10
11
12
13
14
15
90 92 94 96 98 00 02 04 06 08 10
Cape PeninsulaCentral WitwatersrandPretoriaDurban
Capitalization ratesCommunity shopping centres
%
Source of data: Rode's Time Series
Smoothed
8
9
10
11
12
13
14
90 92 94 96 98 00 02 04 06 08 10
Cape PeninsulaDurbanPretoriaCentral Witwatersrand
Capitalization ratesPrime industrial leasebacks
%
Source of data: Rode's Time Series
Smoothed
8
10
12
14
16
90 92 94 96 98 00 02 04 06 08 10
Sandton CBDParktownRosebankMidrand
Capitalization ratesPrime Johannesburg decentralized offices
%
Source of data: Rode's Time Series
Smoothed
centres remained roughly at their previous-quarter levels. Our respondents were of the opinion that standard capitalization rates on regional shopping centres are about 7,5%, while those on community centres are about 9%.
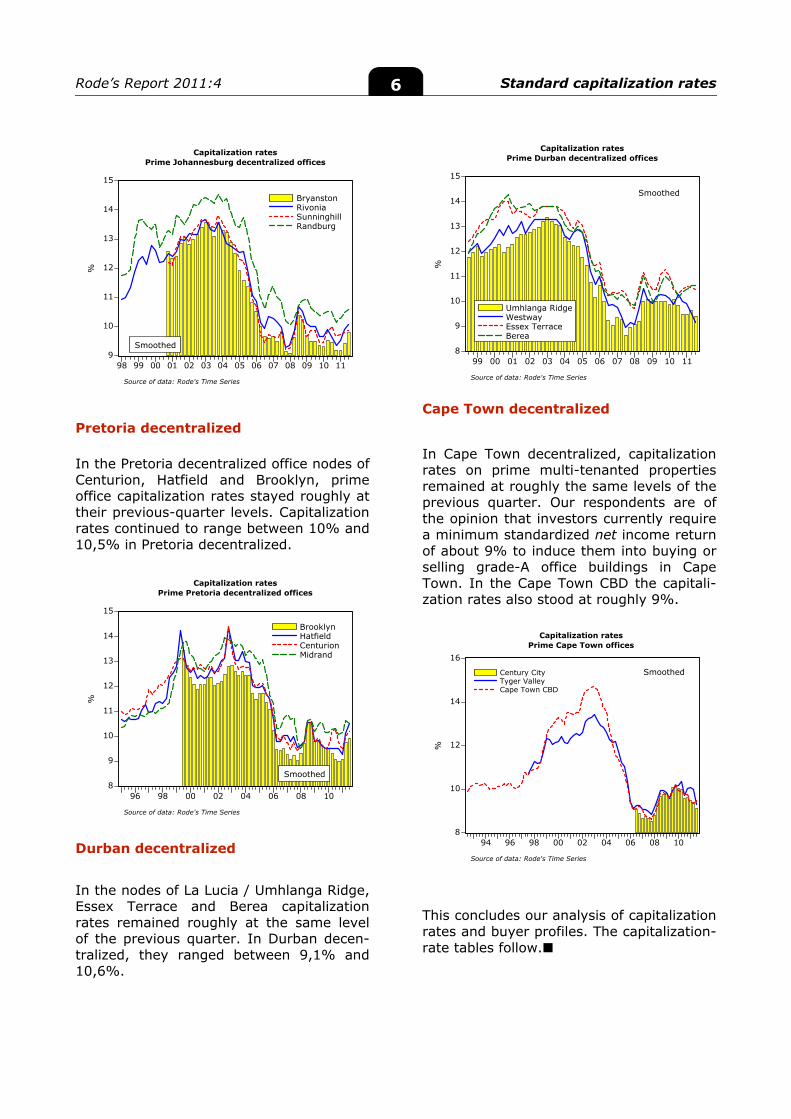
Prime industrial leasebacks
With the exception of the Cape Peninsula, where capitalization rates on industrial leasebacks weakened (increased) slightly, capitalization rates in the other major in-dustrial conurbations dropped (decreased) marginally.
In the reporting quarter, our respondents were still of the opinion that investors in prime industrial property (with a leaseback covenant) required a minimum net stand-
ardized income yield of about 9,3% in the top cities and nodes. By “standardized in-come yield” we mean the capitalization rate is calculated on the assumption that the property is let at market rentals.
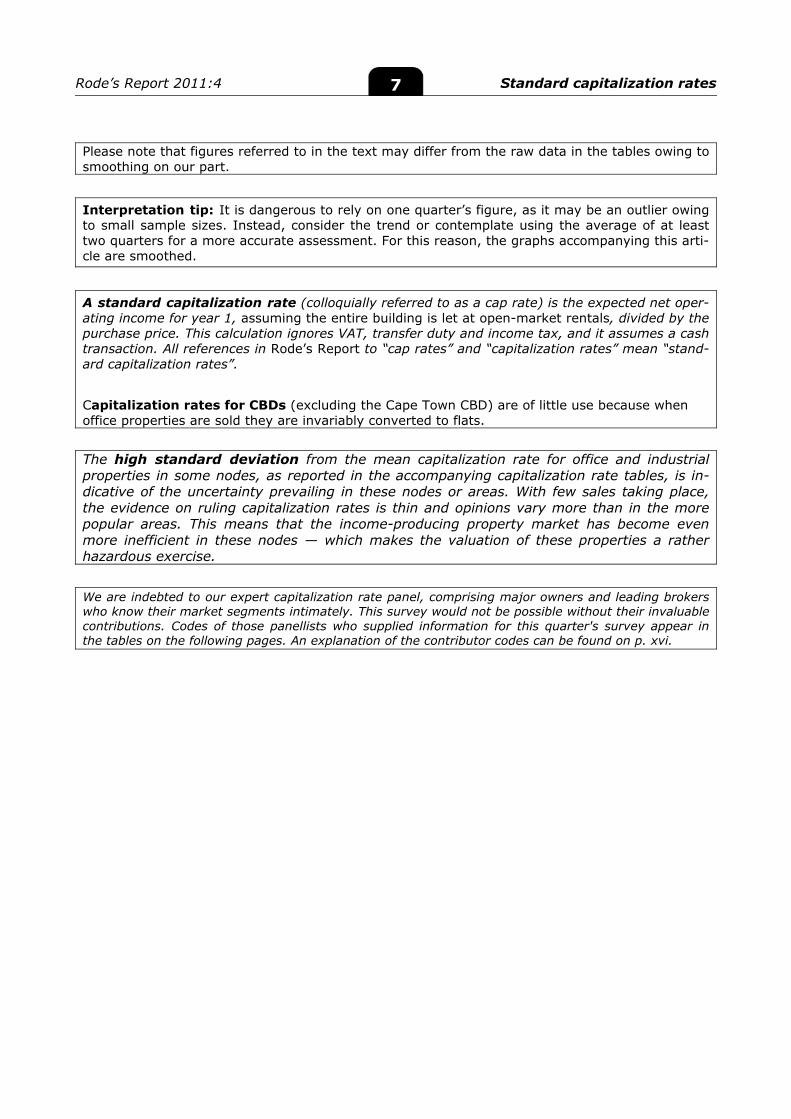
Prime decentralized offices
Johannesburg decentralized
Grade-A multi-tenant office capitalization rates in Johannesburg decentralized were all, barring Sandton CBD, slightly up in the reporting quarter. The Sandton CBD also recorded the lowest capitalization rate. Here our panellists are of the opinion that investors would require a minimum net in-come return of about 9,3%. In the other Johannesburg decentralized office nodes, opinions of our respondents ranged be-tween 9,8% and 10,6%. The Gautrain sta-tion undoubtedly helped to entrench Sandton CBD’s ‘darling’ status.
Rode’s Report 2011:4 Standard capitalization rates 6
9
10
11
12
13
14
15
98 99 00 01 02 03 04 05 06 07 08 09 10 11
BryanstonRivoniaSunninghillRandburg
Capitalization ratesPrime Johannesburg decentralized offices
%
Source of data: Rode's Time Series
Smoothed
8
9
10
11
12
13
14
15
96 98 00 02 04 06 08 10
BrooklynHatfieldCenturionMidrand
Capitalization ratesPrime Pretoria decentralized offices
%
Source of data: Rode's Time Series
Smoothed
8
9
10
11
12
13
14
15
99 00 01 02 03 04 05 06 07 08 09 10 11
Umhlanga RidgeWestwayEssex TerraceBerea
Capitalization ratesPrime Durban decentralized offices
%
Source of data: Rode's Time Series
Smoothed
8
10
12
14
16
94 96 98 00 02 04 06 08 10
Century CityTyger ValleyCape Town CBD
Capitalization ratesPrime Cape Town offices
%
Source of data: Rode's Time Series
Smoothed
Pretoria decentralized In the Pretoria decentralized office nodes of Centurion, Hatfield and Brooklyn, prime office capitalization rates stayed roughly at their previous-quarter levels. Capitalization rates continued to range between 10% and 10,5% in Pretoria decentralized.
Durban decentralized
In the nodes of La Lucia / Umhlanga Ridge, Essex Terrace and Berea capitalization rates remained roughly at the same level of the previous quarter. In Durban decen-tralized, they ranged between 9,1% and 10,6%.
Cape Town decentralized
In Cape Town decentralized, capitalization rates on prime multi-tenanted properties remained at roughly the same levels of the previous quarter. Our respondents are of the opinion that investors currently require a minimum standardized net income return of about 9% to induce them into buying or selling grade-A office buildings in Cape Town. In the Cape Town CBD the capitali-zation rates also stood at roughly 9%.
This concludes our analysis of capitalization rates and buyer profiles. The capitalization-rate tables follow.
Rode’s Report 2011:4 Standard capitalization rates 7
Please note that figures referred to in the text may differ from the raw data in the tables owing to smoothing on our part.
Interpretation tip: It is dangerous to rely on one quarter’s figure, as it may be an outlier owing to small sample sizes. Instead, consider the trend or contemplate using the average of at least two quarters for a more accurate assessment. For this reason, the graphs accompanying this arti-cle are smoothed.
A standard capitalization rate (colloquially referred to as a cap rate) is the expected net oper-ating income for year 1, assuming the entire building is let at open-market rentals, divided by the purchase price. This calculation ignores VAT, transfer duty and income tax, and it assumes a cash transaction. All references in Rode’s Report to “cap rates” and “capitalization rates” mean “stand-ard capitalization rates”.
Capitalization rates for CBDs (excluding the Cape Town CBD) are of little use because when office properties are sold they are invariably converted to flats.
The high standard deviation from the mean capitalization rate for office and industrial properties in some nodes, as reported in the accompanying capitalization rate tables, is in-dicative of the uncertainty prevailing in these nodes or areas. With few sales taking place, the evidence on ruling capitalization rates is thin and opinions vary more than in the more popular areas. This means that the income-producing property market has become even more inefficient in these nodes — which makes the valuation of these properties a rather hazardous exercise.
We are indebted to our expert capitalization rate panel, comprising major owners and leading brokers who know their market segments intimately. This survey would not be possible without their invaluable contributions. Codes of those panellists who supplied information for this quarter's survey appear in the tables on the following pages. An explanation of the contributor codes can be found on p. xvi.
Rode’s Report 2011:4 Standard capitalization rates 8
Table 2.1 Survey of capitalization rates (%)
Office buildings Means for quarter 2011:3
Best location Grade A:
Multi-tenant Grade A: Leaseback
Grade B: Multi-tenant
Grade C: Multi-tenant
Mean SD n Mean SD n Mean SD n Mean SD n Johannesburg CBD 11,2 0,3 2 10,6 0,4 2 12,1 0,0 2 13,4 0,0 2 Braamfontein 10,6 0,1 2 10,1 0,0 2 11,7 0,2 2 12,4 0,5 2 Parktown 10,2 0,2 2 9,7 - 1 11,2 - 1 12,8 - 1 Rosebank 9,8 0,2 2 9,2 0,2 2 10,5 0,5 2 11,8 0,8 2 Sandton CBD 9,3 0,3 2 8,6 0,4 2 10,6 - 1 12,3 - 1 Rivonia 10,1 0,0 2 9,5 0,0 2 11,4 0,5 2 12,5 - 1 Bryanston 9,9 - 1 9,4 - 1 10,7 0,9 2 12,4 - 1 Sunninghill 9,9 - 1 9,4 - 1 11,6 - 1 12,4 - 1 Randburg Ferndale 10,6 - 1 10,1 - 1 12,2 - 1 12,9 - 1 Midrand 10,4 0,4 2 9,9 0,0 2 11,5 0,5 2 12,4 0,5 2 Germiston CBD 11,3 - 1 11,0 - 1 12,4 - 1 13,5 - 1 Pretoria CBD 10,9 - 1 10,2 - 1 11,1 0,9 2 13,1 - 1 Hatfield 10,5 - 1 9,7 - 1 11,2 - 1 12,6 - 1 Brooklyn 9,9 - 1 9,2 - 1 11,0 - 1 12,3 - 1 Centurion 10,2 - 1 9,5 - 1 11,2 - 1 12,8 - 1 Menlyn/Lynnwood 10,1 - 1 9,2 - 1 11,1 - 1 12,4 - 1 Vaal Triangle 10,4 - 1 9,6 - 1 12,1 - 1 13,2 - 1 Nelspruit 10,0 0,3 2 10,0 0,2 2 11,7 0,2 2 12,4 0,4 2 Polokwane 10,2 - 1 10,0 - 1 11,9 - 1 13,0 - 1 Durban CBD 11,3 0,5 3 10,7 0,2 2 11,9 0,8 3 13,5 0,4 3 Berea 10,6 0,1 2 10,2 0,2 2 11,0 0,0 2 12,7 0,2 2 Essex Terrace 10,5 - 1 10,0 - 1 11,0 - 1 12,5 - 1 Westway 9,1 0,1 2 8,9 0,1 2 10,0 - 1 - - - La Lucia/ Umhlan-ga Ridge
9,3 0,3 3 8,9 0,1 3 10,6 0,4 3 12,5 - 1
Pietermaritzburg 10,2 - 1 10,2 - 1 11,2 - 1 13,0 - 1 Cape Town CBD 9,5 0,4 4 9,5 0,4 3 10,3 0,2 5 11,0 0,8 3 Bellville CBD - - - - - - - - - - - - Bellville Tyger Val-ley
9,0 - 1 9,0 - 1 10,0 - 1 - - -
Claremont - - - - - - - - - - - - Port Elizabeth 10,3 0,2 2 10,0 0,0 2 11,5 - 1 12,8 0,2 2 East London - - - - - - - - - - - - Bloemfontein CBD 9,5 0,4 3 9,5 0,5 2 11,1 0,1 3 12,3 0,4 3 Windhoek - - - - - - - - - - - - n = Number of respondents — = Not available – fewer than two respondents SD = See Glossary of terms and abbreviations in Annexure 1.
Rode’s Report 2011:4 Standard capitalization rates 9
Table 2.2 Change in capitalization rates (% points)
Office buildings Means for quarter 2011:3 less quarter 2011:2
Best location Grade A: multi
Grade A: leaseback
Grade B: multi
Grade C: multi
Broker & owner contributors
Johannesburg CBD 0,0 0,3 0,3 0,1 BM, TH, ZZ Braamfontein 0,3 0,0 -0,1 -0,5 BM, TH Parktown -0,1 0,0 0,0 - BM, TH Rosebank -0,2 0,1 -0,5 -0,8 BM, TH Sandton CBD -0,4 -0,3 0,0 - BM, TH Rivonia 0,1 0,6 0,8 - BM, TH Bryanston 0,4 0,2 -1,0 - BM, TH Sunninghill 0,1 0,1 -0,1 - TH Randburg Ferndale 0,1 0,0 0,0 0,1 TH Midrand -0,4 -0,5 -0,1 0,1 AW, TH Germiston CBD - - 0,2 0,0 TH Pretoria CBD 0,2 -2,0 -0,7 0,1 TH, ZZ Hatfield 0,0 -0,1 0,2 0,1 TH Brooklyn -0,1 0,2 0,0 0,0 TH Centurion 0,0 -0,4 0,1 - TH Menlyn/Lynnwood 0,0 0,0 0,0 0,2 TH Vaal Triangle 0,1 0,1 0,0 0,0 TH Nelspruit -0,1 0,0 0,3 0,0 HH, TH Polokwane 0,0 0,0 0,0 0,0 TH Durban CBD 0,3 0,0 0,6 0,5 MW, PC, TH, ZZ Berea -0,1 0,0 0,0 0,0 PC, TH Essex Terrace 0,0 0,0 0,0 0,0 PC Westway -0,2 -0,1 - - MW, PC La Lucia Ridge -0,4 0,0 -0,2 0,0 MW, PC, TH Pietermaritzburg 0,0 -0,1 0,0 0,0 TH Cape Town CBD 0,1 0,0 0,1 0,0 DD, GY, QS, TH, ZZ Bellville CBD - - - - Bellville Tyger Valley
-1,0 -0,8 -0,2 - DD
Century City -0,4 -0,3 0,5 - DA Westlake - - - - Claremont - - - - Port Elizabeth 0,2 0,1 -0,5 -0,3 MJ, TH East London - - - - Bloemfontein CBD -0,1 0,0 0,0 0,0 CC, EK, TH Windhoek - - - - NB: The number of broker/owner codes does not necessarily match the sample size as indicated by the n in the table on page 10. This is so because several of our owner contributors wish to remain anonymous, but we do not show multiple ZZ codes in the table.
Rode’s Report 2011:4 Standard capitalization rates 10
Table 2.3 Survey of capitalization rates (%)
Industrial buildings Means for quarter 2011:3
Best location Prime leaseback (AAA Tenant)
Prime quality non-leaseback
Prime industrial park
Secondary quality building
Mean SD n Mean SD n Mean SD n Mean SD n Central Wits 9,1 0,3 3 10,2 0,2 2 10,0 0,6 3 11,3 0,3 2 West Rand 9,9 - 1 10,8 - 1 10,7 - 1 11,9 - 1 East Rand 10,2 0,8 2 9,9 0,4 2 10,5 - 1 10,9 0,4 2 Far East Rand 9,6 - 1 10,5 - 1 10,6 - 1 11,5 - 1 Pretoria 9,2 0,4 2 10,6 - 1 9,9 0,7 2 11,6 - 1 Vaal Triangle 9,8 - 1 10,7 - 1 10,7 - 1 11,7 - 1 Nelspruit 9,7 - 1 10,5 0,0 2 10,8 0,2 2 11,8 0,2 2 Polokwane 9,8 - 1 10,9 - 1 10,8 - 1 11,8 - 1 Durban 9,2 0,3 4 10,0 0,4 3 10,0 0,5 4 11,1 0,1 3 Pietermaritzburg 9,7 - 1 10,7 - 1 10,7 - 1 11,3 - 1 Cape Peninsula 9,4 0,5 4 9,8 0,2 2 9,7 0,3 3 10,6 0,0 2 Port Elizabeth 9,6 0,1 2 10,4 0,0 2 10,2 0,2 2 12,1 0,5 2 East London - - - - - - - - - - - - Bloemfontein 9,9 0,1 2 10,7 - 1 11,4 0,3 3 10,4 0,3 3 Windhoek - - - - - - - - - - - - n = Number of respondents — = Not available – fewer than two respondents SD = See Glossary of terms and abbreviations in Annexure 1.
Table 2.4 Change in capitalization rates (% points)
Industrial buildings Means for quarter 2011:3 less quarter 2011:2
Best location Prime leaseback
Prime non-leaseback
Prime
industrial park
Secondary quality building
Broker & owner
contributors
Central Wits -0,6 -0,2 1,0 -1,3 AW, TH, ZZ West Rand 0,1 0,4 1,6 -0,8 TH East Rand 0,7 -0,5 0,1 -1,6 HN, REW, TH Far East Rand 0,0 0,0 0,7 -1,5 TH, ZZ Pretoria -0,4 0,0 1,0 -1,7 TH, ZZ Vaal Triangle 0,0 0,0 -1,0 1,1 TH Nelspruit 0,1 0,0 0,9 -1,1 HH, TH Polokwane 0,0 -0,1 1,0 -1,0 TH Durban 0,0 -0,1 0,8 -1,0 MW, PC, TH, ZZ Pietermaritzburg 0,0 0,0 0,6 -0,4 TH Cape Peninsula 0,3 0,5 1,0 -0,5 GY, QS, TH, ZZ Port Elizabeth 0,0 0,1 1,9 -1,6 MJ, TH East London - - - - Bloemfontein 0,0 - 0,0 0,0 CC, EK, TH Windhoek - - - - NB: The number of broker/owner codes does not necessarily match the sample size as indicated by the n in the ta-ble on page 11. This is so because several of our owner contributors wish to remain anonymous, but we do not show multiple ZZ codes in the table.
Rode’s Report 2011:4 Standard capitalization rates 11
Table 2.5 Survey of capitalization rates (%): shopping centres
Means for quarter 2011:3
Best location Super regional Regional Community
Mean SD n Mean SD n Mean SD n Witwatersrand 7,6 - 1 8,0 - 1 9,0 - 1 Pretoria 7,6 - 1 8,0 - 1 9,0 - 1 Vaal Triangle 7,8 - 1 8,2 - 1 9,1 - 1 Nelspruit 7,6 - 1 8,2 0,1 2 9,0 0,0 2 Polokwane 7,8 - 1 8,2 - 1 9,5 - 1 Durban 7,6 - 1 8,2 0,1 2 9,0 0,0 2 Pietermaritzburg 7,9 - 1 8,3 - 1 9,2 - 1 Cape Town 8,3 0,7 3 8,2 0,5 3 9,3 0,7 2 Port Elizabeth 8,4 0,5 2 8,6 0,4 2 9,9 0,5 2 East London - - - - - - - - - Bloemfontein - - - 8,2 0,2 2 9,5 0,4 3 Platteland - - - - - - - - - Townships - - - - - - 10,5 - 1 Windhoek - - - - - - - - - n = Number of respondents — = Not available SD = See Glossary of terms and abbreviations in Annexure 1.
Table 2.5 (continued) Survey of capitalization rates (%): shopping centres
Means for quarter 2011:3
Best location Neighbourhood Local convenience Retail warehouse
Mean SD n Mean SD n Mean SD n Witwatersrand 10,0 - 1 11,0 - 1 9,5 - 1 Pretoria 10,0 - 1 11,0 - 1 9,5 - 1 Vaal Triangle 10,2 - 1 11,2 - 1 9,6 - 1 Nelspruit 10,0 0,0 2 10,8 0,3 2 9,8 0,2 2 Polokwane 10,2 - 1 11,2 - 1 9,6 - 1 Durban 10,0 - 1 11,0 - 1 9,5 0,0 2 Pietermaritzburg 10,1 - 1 11,1 - 1 9,6 - 1 Cape Town 10,3 0,7 2 10,5 0,4 3 9,1 0,0 2 Port Elizabeth 10,5 0,5 2 11,2 0,3 2 10,2 0,3 2 East London - - - - - - - - - Bloemfontein 10,2 0,6 3 11,2 0,6 3 11,1 1,0 2 Platteland - - - - - - - - - Townships - - - - - - - - - Windhoek - - - - - - - - - n = Number of respondents — = Not available SD = See Glossary of terms and abbreviations in Annexure 1.
Rode’s Report 2011:4 Standard capitalization rates 12
Table 2.6 Change in capitalization rates (% points): shopping centres
Means for quarter 2011:3 less quarter 2011:2
Best location Super
regional Regional Commu-
nity Broker & owner
contributors Witwatersrand 0,2 0,2 0,1 TH Pretoria 0,2 0,2 0,1 TH Vaal Triangle 0,0 0,0 0,0 TH Nelspruit 0,0 0,2 0,0 HH, TH Polokwane 0,0 0,0 0,4 TH Durban 0,2 0,4 0,1 PC, TH Pietermaritzburg 0,0 -0,1 0,1 TH Cape Town 1,1 0,6 0,8 DD, QS, TH Port Elizabeth 0,0 0,0 0,0 MJ, TH East London - - - Bloemfontein - - 0,0 CC, EK, TH Platteland - - - Townships - - 0,0 Windhoek - - -
Table 2.6 (continued) Change in capitalization rates (% points): shopping centres
Means for quarter 2011:3 less quarter 2011:2
Best location Neighbour-
hood
Local conven-
ience
Retail warehouse
Broker & owner contributors
Witwatersrand 0,2 0,5 0,0 TH Pretoria 0,2 0,5 0,0 TH Vaal Triangle 0,0 0,0 0,0 TH Nelspruit 0,1 0,1 0,2 HH, TH Polokwane 0,0 0,0 0,0 TH Durban 0,2 0,5 0,0 PC, TH Pietermaritzburg 0,0 0,0 0,0 TH Cape Town 0,9 10,5 0,1 DD, QS, TH Port Elizabeth 0,3 0,3 0,0 MJ, TH East London - - - Bloemfontein 0,5 0,2 0,0 CC, EK, TH Platteland - - - Townships - - - Windhoek - - -
Rode’s Report 2011:4 Standard capitalization rates 13
Table 2.7
Survey of capitalization rates (%): street-front shops Means for quarter 2011:3
Best location Metro CBD Decentralised
Mean SD n Mean SD n Witwatersrand 11,1 N/A 1 11,0 N/A 1 Pretoria 11,1 N/A 1 11,0 N/A 1 Vaal Triangle 11,2 N/A 1 11,1 N/A 1 Nelspruit 11,1 0,0 2 10,9 0,1 2 Polokwane 11,3 N/A 1 11,1 N/A 1 Durban 11,2 0,0 2 11,0 0,0 2 Pietermaritzburg 11,3 N/A 1 11,1 N/A 1 Cape Town 10,0 0,0 3 10,1 0,1 2 Port Elizabeth 11,6 0,5 2 11,0 0,0 2 East London N/A N/A N/A N/A N/A N/A Bloemfontein 11,2 0,2 2 10,6 0,5 2 Windhoek N/A N/A N/A N/A N/A N/A n = Number of respondents — = Not available SD = See Glossary of terms and abbreviations in Annexure 1.
Table 2.8 Change in capitalization rates (% points): street-front shops
Means for quarter 2011:3 less quarter 2011:2 Best location Metro CBD Decentralised Broker & owner contributors
Witwatersrand -0,1 0,0 TH Pretoria -0,1 0,0 TH Vaal Triangle -0,1 0,0 TH Nelspruit 0,3 0,0 HH, TH Polokwane 0,0 0,0 TH Durban 0,0 0,0 PC, TH Pietermaritzburg 0,0 0,0 TH Cape Town 0,2 0,4 DD, GB, TH Port Elizabeth 0,1 0,0 MJ, TH East London - - Bloemfontein 0,0 0,0 EK, TH Windhoek - -
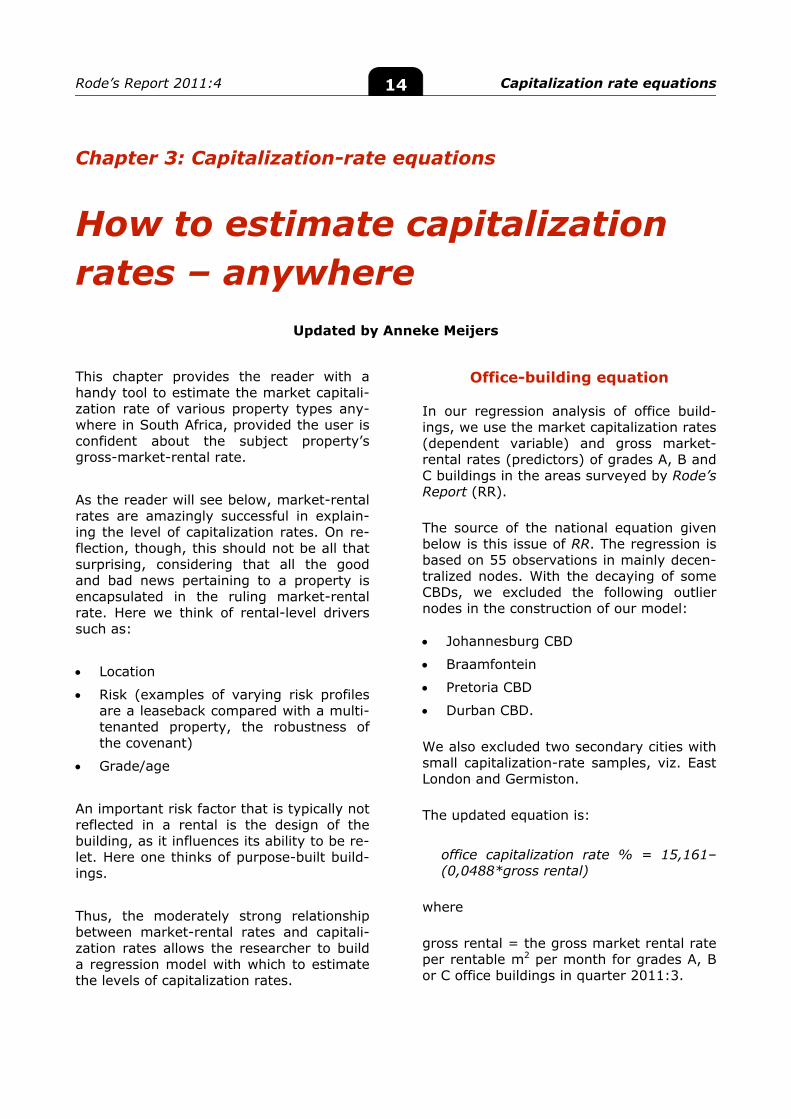
Rode’s Report 2011:4 Capitalization rate equations 14
Chapter 3: Capitalization-rate equations
How to estimate capitalization rates – anywhere
Updated by Anneke Meijers
This chapter provides the reader with a handy tool to estimate the market capitali-zation rate of various property types any-where in South Africa, provided the user is confident about the subject property’s gross-market-rental rate.
As the reader will see below, market-rental rates are amazingly successful in explain-ing the level of capitalization rates. On re-flection, though, this should not be all that surprising, considering that all the good and bad news pertaining to a property is encapsulated in the ruling market-rental rate. Here we think of rental-level drivers such as:
Location
Risk (examples of varying risk profiles are a leaseback compared with a multi-tenanted property, the robustness of the covenant)
Grade/age
An important risk factor that is typically not reflected in a rental is the design of the building, as it influences its ability to be re-let. Here one thinks of purpose-built build-ings.
Thus, the moderately strong relationship between market-rental rates and capitali-zation rates allows the researcher to build a regression model with which to estimate the levels of capitalization rates.
Office-building equation
In our regression analysis of office build-ings, we use the market capitalization rates (dependent variable) and gross market-rental rates (predictors) of grades A, B and C buildings in the areas surveyed by Rode’s Report (RR).
The source of the national equation given below is this issue of RR. The regression is based on 55 observations in mainly decen-tralized nodes. With the decaying of some CBDs, we excluded the following outlier nodes in the construction of our model:
Johannesburg CBD
Braamfontein
Pretoria CBD
Durban CBD.
We also excluded two secondary cities with small capitalization-rate samples, viz. East London and Germiston.
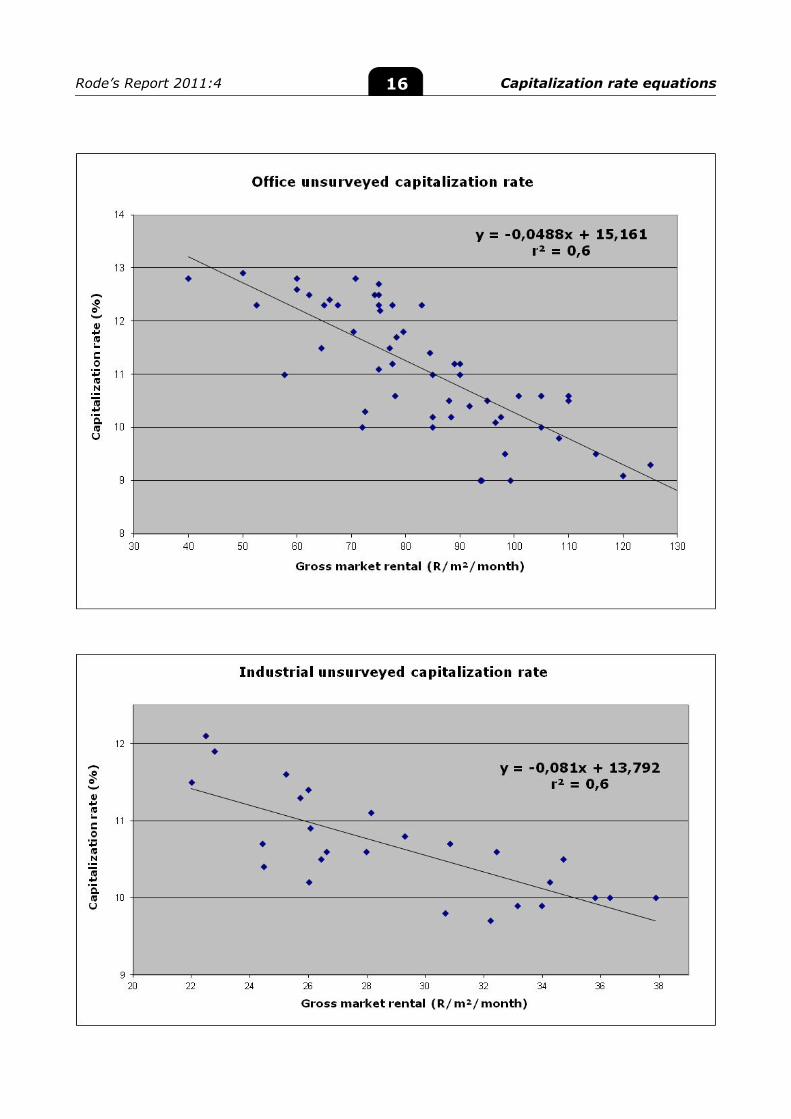
The updated equation is:
office capitalization rate % = 15,161– (0,0488*gross rental)
where
gross rental = the gross market rental rate per rentable m2 per month for grades A, B or C office buildings in quarter 2011:3.
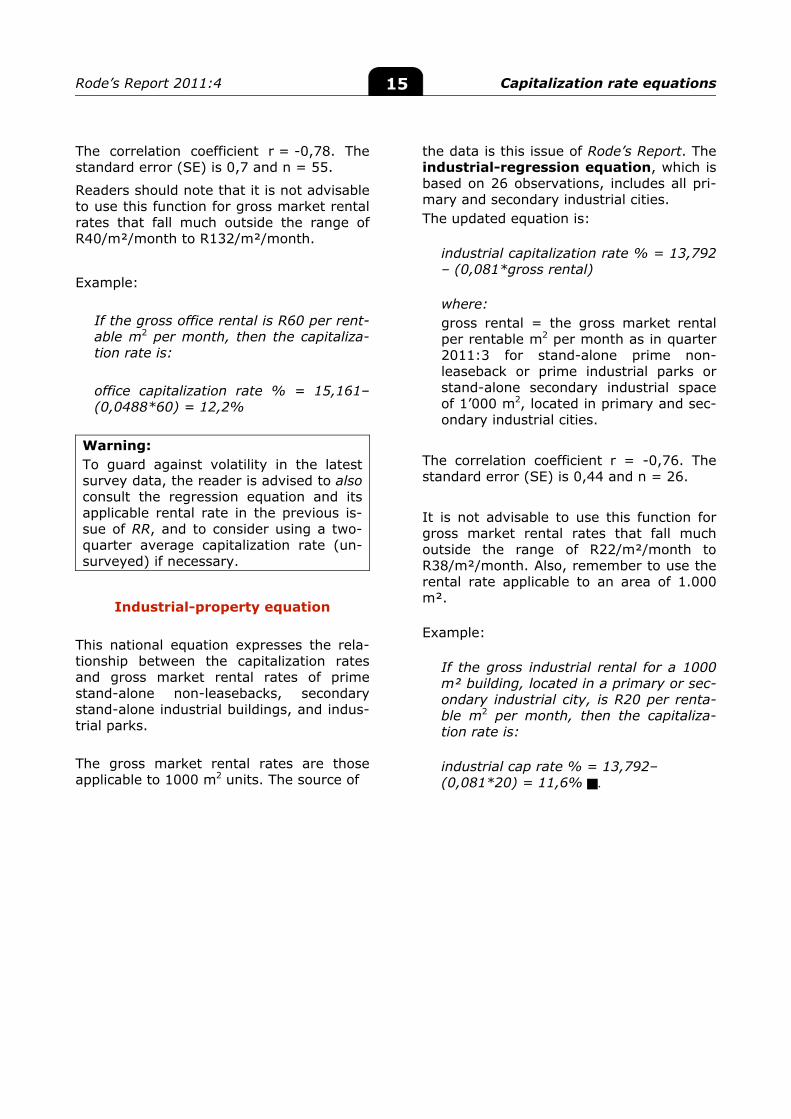
Rode’s Report 2011:4 Capitalization rate equations 15
The correlation coefficient r = -0,78. The standard error (SE) is 0,7 and n = 55.
Readers should note that it is not advisable to use this function for gross market rental rates that fall much outside the range of R40/m²/month to R132/m²/month.
Example:
If the gross office rental is R60 per rent-able m2 per month, then the capitaliza-tion rate is: office capitalization rate % = 15,161– (0,0488*60) = 12,2%
Warning: To guard against volatility in the latest survey data, the reader is advised to also consult the regression equation and its applicable rental rate in the previous is-sue of RR, and to consider using a two-quarter average capitalization rate (un-surveyed) if necessary.
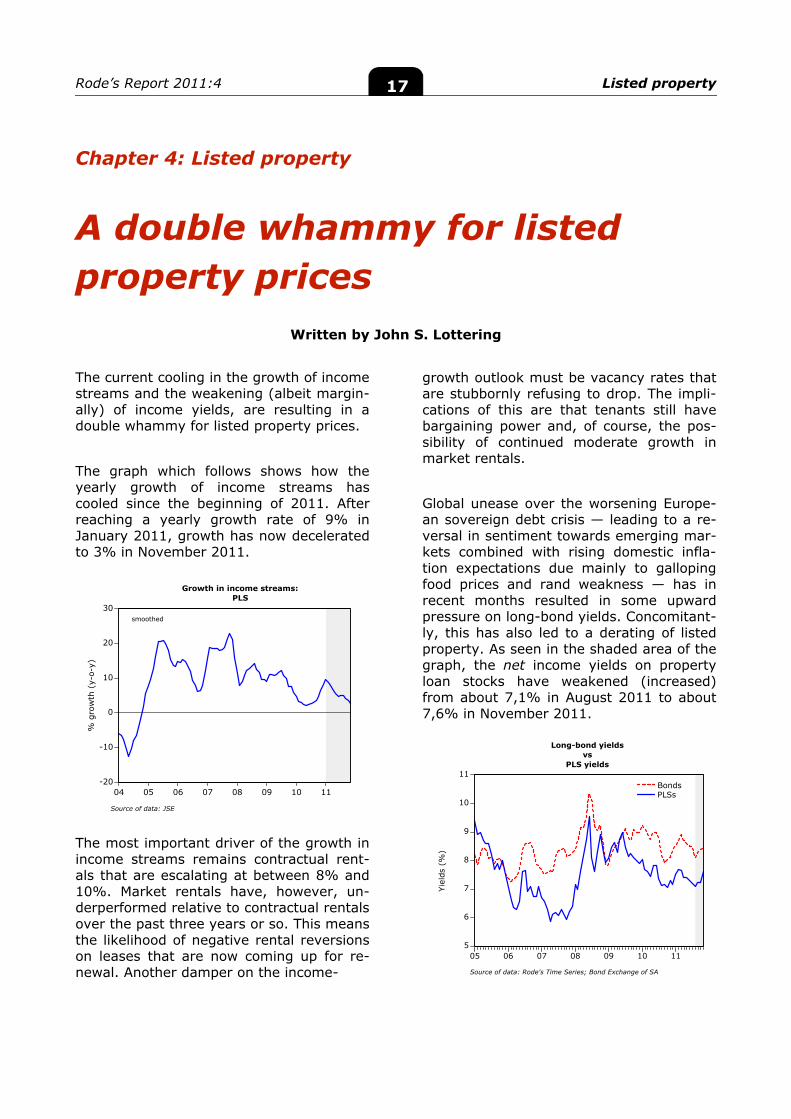
Industrial-property equation
This national equation expresses the rela-tionship between the capitalization rates and gross market rental rates of prime stand-alone non-leasebacks, secondary stand-alone industrial buildings, and indus-trial parks. The gross market rental rates are those applicable to 1000 m2 units. The source of
the data is this issue of Rode’s Report. The industrial-regression equation, which is based on 26 observations, includes all pri-mary and secondary industrial cities. The updated equation is:
industrial capitalization rate % = 13,792 – (0,081*gross rental)
where: gross rental = the gross market rental per rentable m2 per month as in quarter 2011:3 for stand-alone prime non-leaseback or prime industrial parks or stand-alone secondary industrial space of 1’000 m2, located in primary and sec-ondary industrial cities.
The correlation coefficient r = -0,76. The standard error (SE) is 0,44 and n = 26.
It is not advisable to use this function for gross market rental rates that fall much outside the range of R22/m²/month to R38/m²/month. Also, remember to use the rental rate applicable to an area of 1.000 m².
Example:
If the gross industrial rental for a 1000 m² building, located in a primary or sec-ondary industrial city, is R20 per renta-ble m2 per month, then the capitaliza-tion rate is:
industrial cap rate % = 13,792– (0,081*20) = 11,6% .
Rode’s Report 2011:4 Capitalization rate equations 16
Rode’s Report 2011:4 Listed property 17
-20
-10
0
10
20
30
04 05 06 07 08 09 10 11
Growth in income streams:PLS
% g
row
th (
y-o-
y)
Source of data: JSE
smoothed
5
6
7
8
9
10
11
05 06 07 08 09 10 11
BondsPLSs
Long-bond yieldsvs
PLS yields
Yiel
ds (
%)
Source of data: Rode's Time Series; Bond Exchange of SA
Chapter 4: Listed property
A double whammy for listed property prices
Written by John S. Lottering
The current cooling in the growth of income streams and the weakening (albeit margin-ally) of income yields, are resulting in a double whammy for listed property prices.
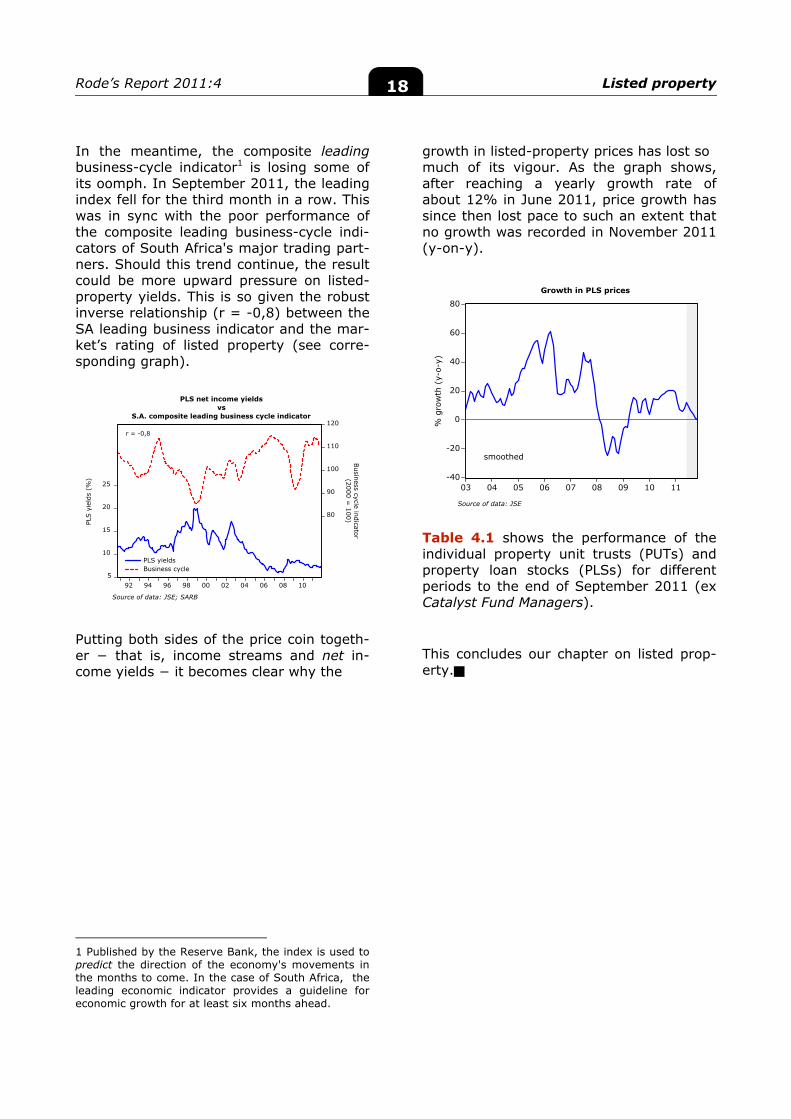
The graph which follows shows how the yearly growth of income streams has cooled since the beginning of 2011. After reaching a yearly growth rate of 9% in January 2011, growth has now decelerated to 3% in November 2011. The most important driver of the growth in income streams remains contractual rent-als that are escalating at between 8% and 10%. Market rentals have, however, un-derperformed relative to contractual rentals over the past three years or so. This means the likelihood of negative rental reversions on leases that are now coming up for re-newal. Another damper on the income-
growth outlook must be vacancy rates that are stubbornly refusing to drop. The impli-cations of this are that tenants still have bargaining power and, of course, the pos-sibility of continued moderate growth in market rentals.
Global unease over the worsening Europe-an sovereign debt crisis — leading to a re-versal in sentiment towards emerging mar-kets combined with rising domestic infla-tion expectations due mainly to galloping food prices and rand weakness — has in recent months resulted in some upward pressure on long-bond yields. Concomitant-ly, this has also led to a derating of listed property. As seen in the shaded area of the graph, the net income yields on property loan stocks have weakened (increased) from about 7,1% in August 2011 to about 7,6% in November 2011.
Rode’s Report 2011:4 Listed property 18
-40
-20
0
20
40
60
80
03 04 05 06 07 08 09 10 11
Growth in PLS prices
% g
row
th (
y-o-
y)
Source of data: JSE
smoothed
5
10
15
20
25
80
90
100
110
120
92 94 96 98 00 02 04 06 08 10
PLS yieldsBusiness cycle
PLS net income yieldsvs
S.A. composite leading business cycle indicator
r = -0,8
PLS y
ield
s (%
)
Business cycle indicator
(2000 = 100)
Source of data: JSE; SARB
In the meantime, the composite leading business-cycle indicator1 is losing some of its oomph. In September 2011, the leading index fell for the third month in a row. This was in sync with the poor performance of the composite leading business-cycle indi-cators of South Africa's major trading part-ners. Should this trend continue, the result could be more upward pressure on listed-property yields. This is so given the robust inverse relationship (r = -0,8) between the SA leading business indicator and the mar-ket’s rating of listed property (see corre-sponding graph). Putting both sides of the price coin togeth-er − that is, income streams and net in-come yields − it becomes clear why the
1 Published by the Reserve Bank, the index is used to predict the direction of the economy's movements in the months to come. In the case of South Africa, the leading economic indicator provides a guideline for economic growth for at least six months ahead.
growth in listed-property prices has lost so much of its vigour. As the graph shows, after reaching a yearly growth rate of about 12% in June 2011, price growth has since then lost pace to such an extent that no growth was recorded in November 2011 (y-on-y).
Table 4.1 shows the performance of the individual property unit trusts (PUTs) and property loan stocks (PLSs) for different periods to the end of September 2011 (ex Catalyst Fund Managers).
This concludes our chapter on listed prop-erty.
Rode’s Report 2011:4 Listed property 19
Table 4.1 Total return on property unit trusts and property loan stocks
September 2011 Individual stock performance
Total return 3 year* 1 year* PUT Index 72,3% 8,8% PLS Index 66,9% 8,0% SA Listed Property Index (SAPY) 68,4% 8,3%
CAPITAL PROPERTY 107,3% 11,5% VUKILE 100,6% 11,1% ACUCAP 93,4% 17,1% RESILIENT 89,4% 11,8% SA CORPORATE 86,5% 15,1% PANPROP 77,2% -1,2% HYPROP 69,0% 8,1% PREMIUM 67,7% -6,2% GROWTHPOINT 66,6% 11,5% REDEFINE 63,8% 5,1% FOUNTAINHEAD 59,7% 8,2% EMIRA 54,5% -2,1% SYCOM 48,2% 5,6% OCTODEC 45,1% -2,5% HOSPITALITY-A 43,1% 0,5% HOSPITALITY-B -66,0% -47,6% FORTRESS-A - 14,7% FORTRESS-B - 100,7% INVESTEC PROPERTY FUND - 8,4% REBOSIS - -4,7% VUNANI - 2,0% DIPULA-A - -0,8% DIPULA-B - -8,9% VIVIDEND - -8,9% *Cumulative growth over period Source: Catalyst Fund Managers

Rode’s Report 2011:4 Office rentals 21
20
40
60
80
100
120
94 96 98 00 02 04 06 08 10
PretoriaJohannesburgDurbanCape Town
Nominal decentralized grade-A office rentals
Smoothed
R/m
² (l
og s
cale
)
Source of data: Rode's Time Series
20
40
60
80
100
94 96 98 00 02 04 06 08 10
JohannesburgPretoriaDurbanCape Town
Nominal CBD grade-A office rentals
Smoothed
R/m
² (l
og s
cale
)
Source of data: Rode's Time Series
Chapter 5: Office rentals
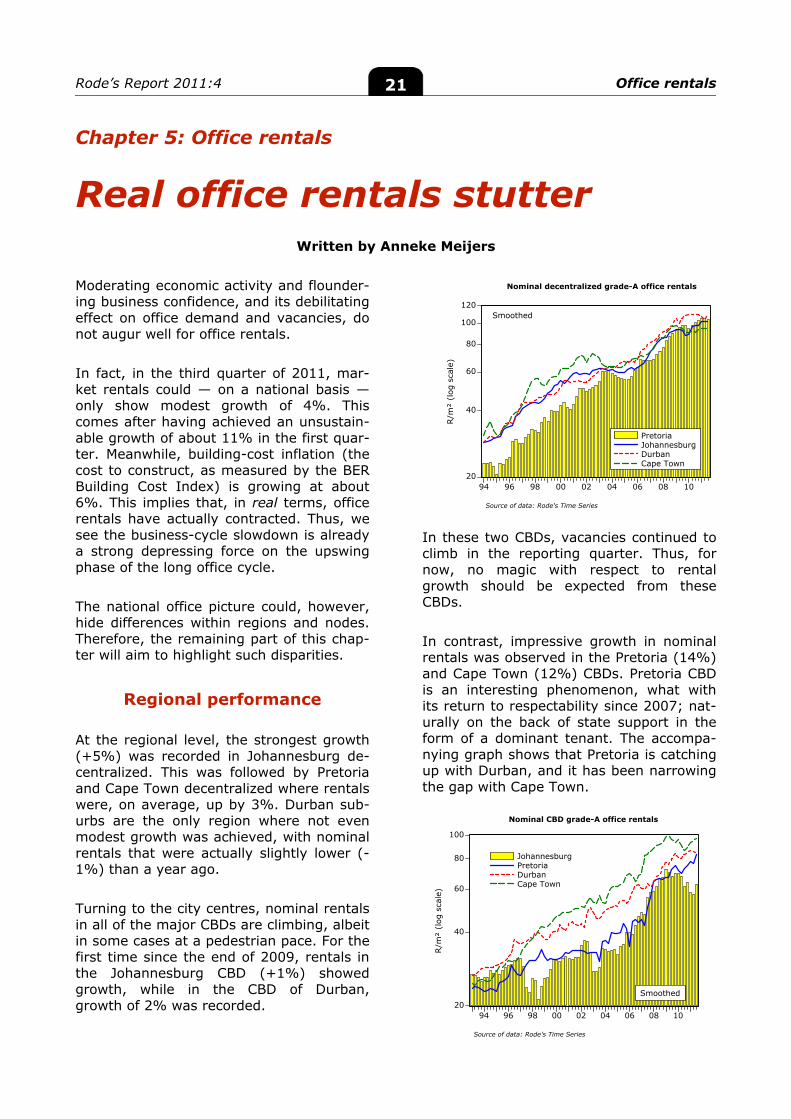
Real office rentals stutter
Written by Anneke Meijers Moderating economic activity and flounder-ing business confidence, and its debilitating effect on office demand and vacancies, do not augur well for office rentals. In fact, in the third quarter of 2011, mar-ket rentals could — on a national basis — only show modest growth of 4%. This comes after having achieved an unsustain-able growth of about 11% in the first quar-ter. Meanwhile, building-cost inflation (the cost to construct, as measured by the BER Building Cost Index) is growing at about 6%. This implies that, in real terms, office rentals have actually contracted. Thus, we see the business-cycle slowdown is already a strong depressing force on the upswing phase of the long office cycle. The national office picture could, however, hide differences within regions and nodes. Therefore, the remaining part of this chap-ter will aim to highlight such disparities.
Regional performance At the regional level, the strongest growth (+5%) was recorded in Johannesburg de-centralized. This was followed by Pretoria and Cape Town decentralized where rentals were, on average, up by 3%. Durban sub-urbs are the only region where not even modest growth was achieved, with nominal rentals that were actually slightly lower (-1%) than a year ago. Turning to the city centres, nominal rentals in all of the major CBDs are climbing, albeit in some cases at a pedestrian pace. For the first time since the end of 2009, rentals in the Johannesburg CBD (+1%) showed growth, while in the CBD of Durban, growth of 2% was recorded.
In these two CBDs, vacancies continued to climb in the reporting quarter. Thus, for now, no magic with respect to rental growth should be expected from these CBDs. In contrast, impressive growth in nominal rentals was observed in the Pretoria (14%) and Cape Town (12%) CBDs. Pretoria CBD is an interesting phenomenon, what with its return to respectability since 2007; nat-urally on the back of state support in the form of a dominant tenant. The accompa-nying graph shows that Pretoria is catching up with Durban, and it has been narrowing the gap with Cape Town.
Rode’s Report 2011:4 Office rentals 22
20
40
60
80
100
120
140
94 96 98 00 02 04 06 08 10
ParktownRosebankRivoniaSandton CBD
Nominal Johannesburg decentralized grade-A office rentals
Smoothed
R/m
² (l
og s
cale
)
Source of data: Rode's Time Series
20
40
60
80
100
120
140
94 96 98 00 02 04 06 08 10
Randburg FerndaleBryanstonIllovoSandton CBD
Nominal Johannesburg decentralized grade-A office rentals
Smoothed
R/m
² (l
og s
cale
)
Source of data: Rode's Time Series
40
60
80
100
120
140
160
94 96 98 00 02 04 06 08 10
ParktownRosebankRivoniaSandton CBD
Real Johannesburg decentralized grade-A office rentals2005 rands
Smoothed
2005
R/m
² (l
og s
cale
)
Deflated by BER BCI (2005=100)
Source of data: Rode's Time Series; BER
40
60
80
100
120
140
160
94 96 98 00 02 04 06 08 10
Randburg FerndaleBryanston IllovoSandton CBD
Real Johannesburg decentralized grade-A office rentals2005 rands
Smoothed
2005
R/m
² (l
og s
cale
)
Deflated by BER BCI (2005=100)
Source of data: Rode's Time Series; BER
30
40
50
60
70
80
90
94 96 98 00 02 04 06 08 10
JohannesburgPretoriaDurbanCape Town
Real CBD grade-A office rentals2005 rands
Smoothed
2005
R/m
² (l
og s
cale
)
Deflated by BER BCI (2005=100)
Source of data: Rode's Time Series; BER
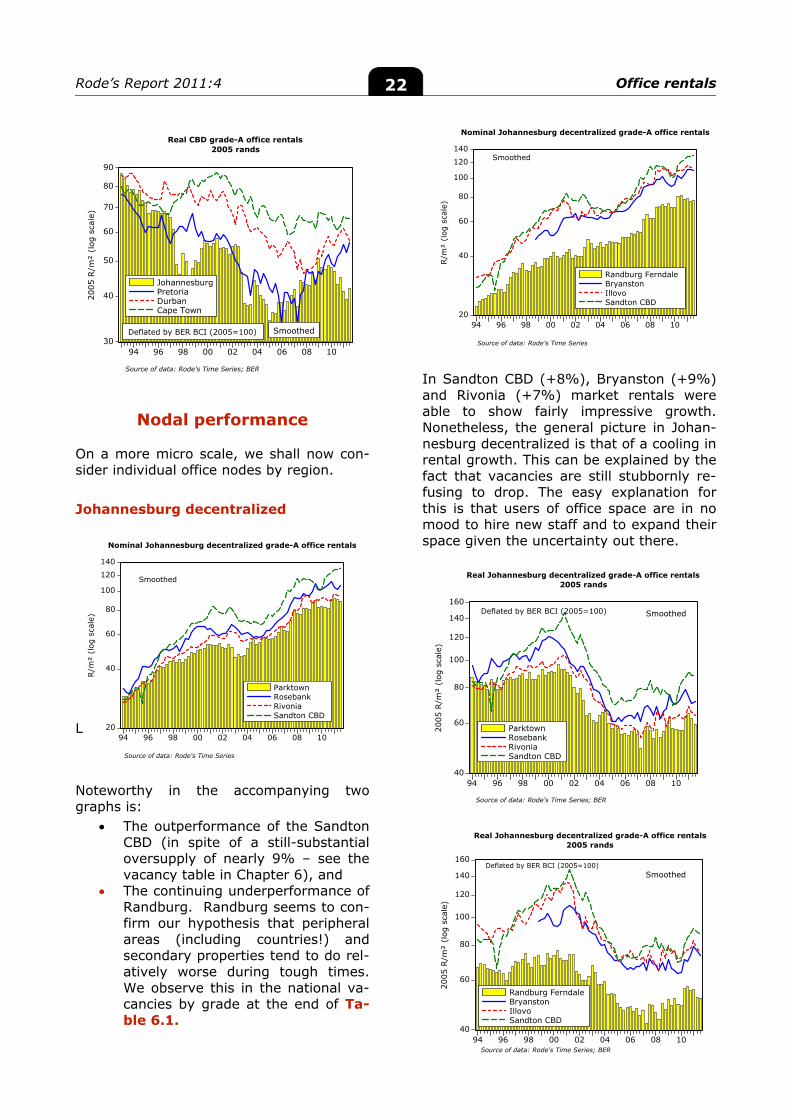
Nodal performance
On a more micro scale, we shall now con-sider individual office nodes by region. Johannesburg decentralized L Noteworthy in the accompanying two graphs is:
The outperformance of the Sandton CBD (in spite of a still-substantial oversupply of nearly 9% – see the vacancy table in Chapter 6), and
The continuing underperformance of Randburg. Randburg seems to con-firm our hypothesis that peripheral areas (including countries!) and secondary properties tend to do rel-atively worse during tough times. We observe this in the national va-cancies by grade at the end of Ta-ble 6.1.
In Sandton CBD (+8%), Bryanston (+9%) and Rivonia (+7%) market rentals were able to show fairly impressive growth. Nonetheless, the general picture in Johan-nesburg decentralized is that of a cooling in rental growth. This can be explained by the fact that vacancies are still stubbornly re-fusing to drop. The easy explanation for this is that users of office space are in no mood to hire new staff and to expand their space given the uncertainty out there.
Rode’s Report 2011:4 Office rentals 23
20
40
60
80
100
120140
94 96 98 00 02 04 06 08 10
CenturionBrooklyn/WaterkloofHatfieldMenlyn
Nominal Pretoria decentralized grade-A office rentals
R/m
² (l
og s
cale
)
Source of data: Rode's Time Series
Smoothed
50
60
70
80
90
100
110
94 96 98 00 02 04 06 08 10
CenturionBrooklyn/WaterkloofHatfieldMenlyn
Real Pretoria decentralized grade-A office rentals2005 rands
Smoothed
2005
R/m
² (l
og s
cale
)
Deflated by BER BCI (2005=100)
Source of data: Rode's Time Series; BER
20
40
60
80
100
120
140
94 96 98 00 02 04 06 08 10
Tyger ValleyClaremontCentury CityWestlake
Nominal Cape Town decentralized grade-A office rentals
Smoothed
R/m
² (l
og s
cale
)
Source of data: Rode's Time Series
40
60
80
100
120
140
94 96 98 00 02 04 06 08 10
Tyger ValleyClaremontCentury CityWestlake
Real Cape Town decentralized grade-A office rentals2005 rands
Smoothed
2005
R/m
² (l
og s
cale
)
Deflated by BER BCI (2005=100)
Source of data: Rode's Time Series; BER
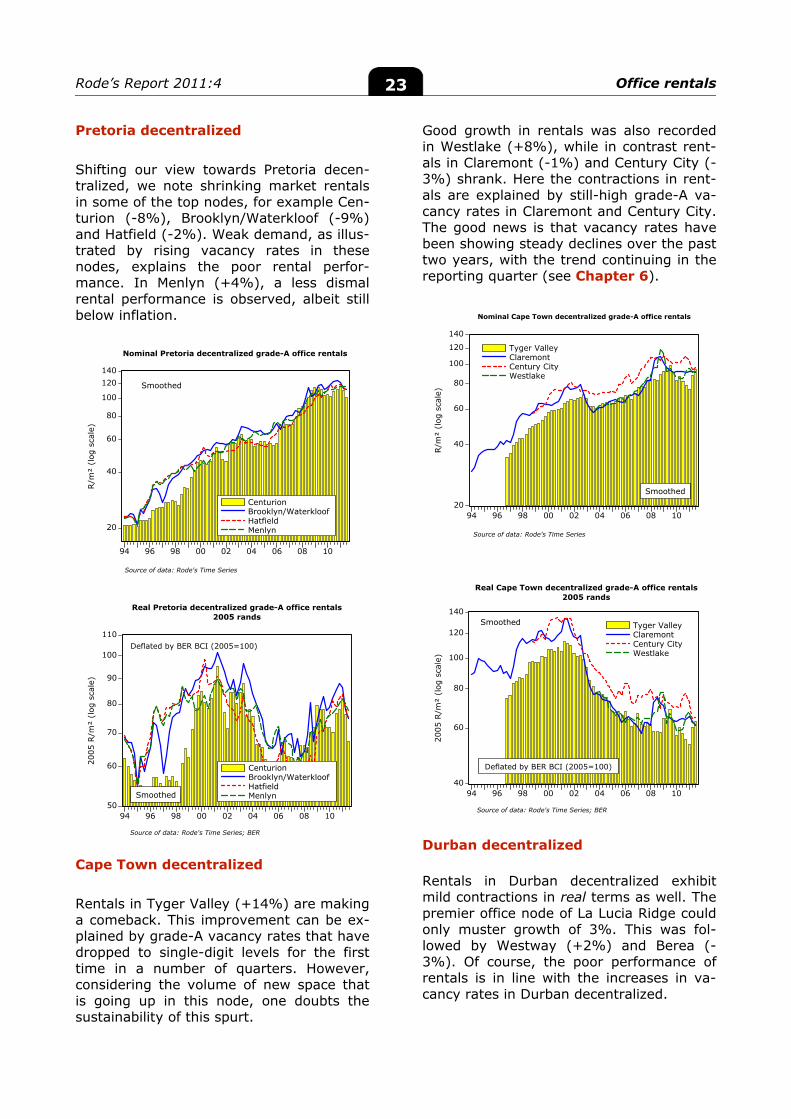
Pretoria decentralized Shifting our view towards Pretoria decen-tralized, we note shrinking market rentals in some of the top nodes, for example Cen-turion (-8%), Brooklyn/Waterkloof (-9%) and Hatfield (-2%). Weak demand, as illus-trated by rising vacancy rates in these nodes, explains the poor rental perfor-mance. In Menlyn (+4%), a less dismal rental performance is observed, albeit still below inflation. Cape Town decentralized Rentals in Tyger Valley (+14%) are making a comeback. This improvement can be ex-plained by grade-A vacancy rates that have dropped to single-digit levels for the first time in a number of quarters. However, considering the volume of new space that is going up in this node, one doubts the sustainability of this spurt.
Good growth in rentals was also recorded in Westlake (+8%), while in contrast rent-als in Claremont (-1%) and Century City (-3%) shrank. Here the contractions in rent-als are explained by still-high grade-A va-cancy rates in Claremont and Century City. The good news is that vacancy rates have been showing steady declines over the past two years, with the trend continuing in the reporting quarter (see Chapter 6). Durban decentralized
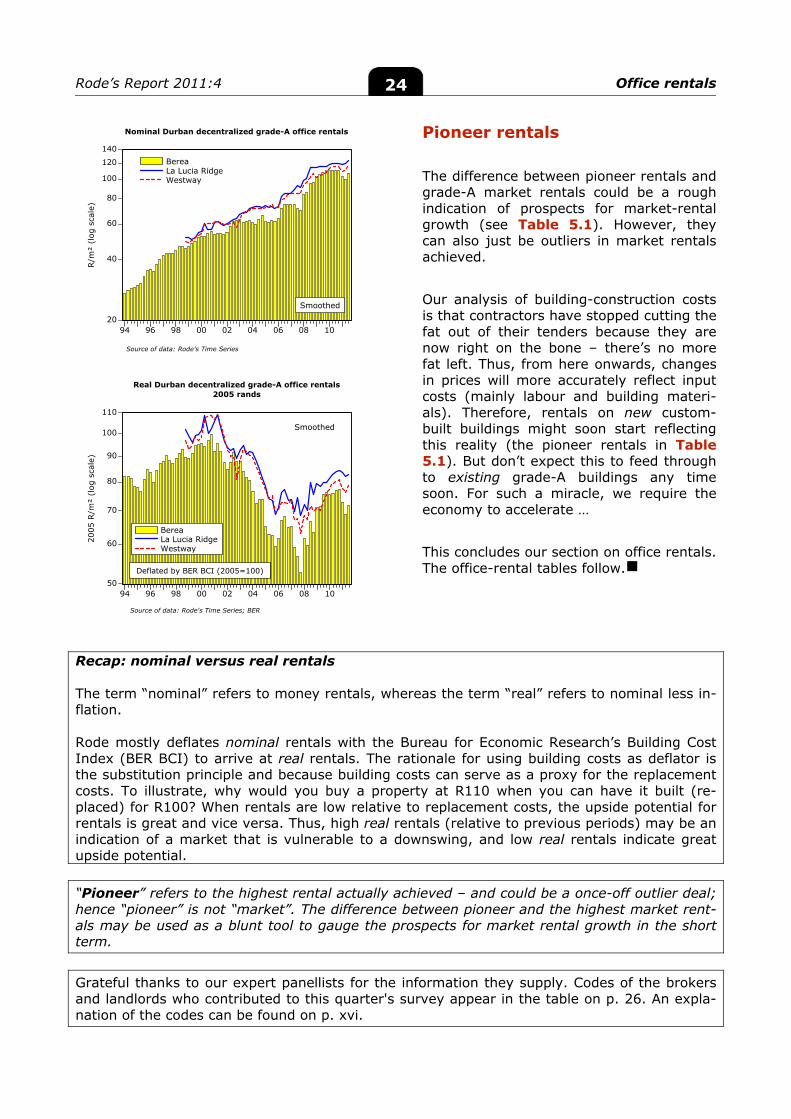
Rentals in Durban decentralized exhibit mild contractions in real terms as well. The premier office node of La Lucia Ridge could only muster growth of 3%. This was fol-lowed by Westway (+2%) and Berea (-3%). Of course, the poor performance of rentals is in line with the increases in va-cancy rates in Durban decentralized.
Rode’s Report 2011:4 Office rentals 24
20
40
60
80
100
120
140
94 96 98 00 02 04 06 08 10
BereaLa Lucia RidgeWestway
Nominal Durban decentralized grade-A office rentals
Smoothed
R/m
² (l
og s
cale
)
Source of data: Rode's Time Series
50
60
70
80
90
100
110
94 96 98 00 02 04 06 08 10
BereaLa Lucia RidgeWestway
Real Durban decentralized grade-A office rentals2005 rands
Smoothed
2005
R/m
² (l
og s
cale
)
Deflated by BER BCI (2005=100)
Source of data: Rode's Time Series; BER
Pioneer rentals The difference between pioneer rentals and grade-A market rentals could be a rough indication of prospects for market-rental growth (see Table 5.1). However, they can also just be outliers in market rentals achieved. Our analysis of building-construction costs is that contractors have stopped cutting the fat out of their tenders because they are now right on the bone – there’s no more fat left. Thus, from here onwards, changes in prices will more accurately reflect input costs (mainly labour and building materi-als). Therefore, rentals on new custom-built buildings might soon start reflecting this reality (the pioneer rentals in Table 5.1). But don’t expect this to feed through to existing grade-A buildings any time soon. For such a miracle, we require the economy to accelerate … This concludes our section on office rentals. The office-rental tables follow.
Recap: nominal versus real rentals The term “nominal” refers to money rentals, whereas the term “real” refers to nominal less in-flation. Rode mostly deflates nominal rentals with the Bureau for Economic Research’s Building Cost Index (BER BCI) to arrive at real rentals. The rationale for using building costs as deflator is the substitution principle and because building costs can serve as a proxy for the replacement costs. To illustrate, why would you buy a property at R110 when you can have it built (re-placed) for R100? When rentals are low relative to replacement costs, the upside potential for rentals is great and vice versa. Thus, high real rentals (relative to previous periods) may be an indication of a market that is vulnerable to a downswing, and low real rentals indicate great upside potential.
“Pioneer” refers to the highest rental actually achieved – and could be a once-off outlier deal; hence “pioneer” is not “market”. The difference between pioneer and the highest market rent-als may be used as a blunt tool to gauge the prospects for market rental growth in the short term.
Grateful thanks to our expert panellists for the information they supply. Codes of the brokers and landlords who contributed to this quarter's survey appear in the table on p. 26. An expla-nation of the codes can be found on p. xvi.
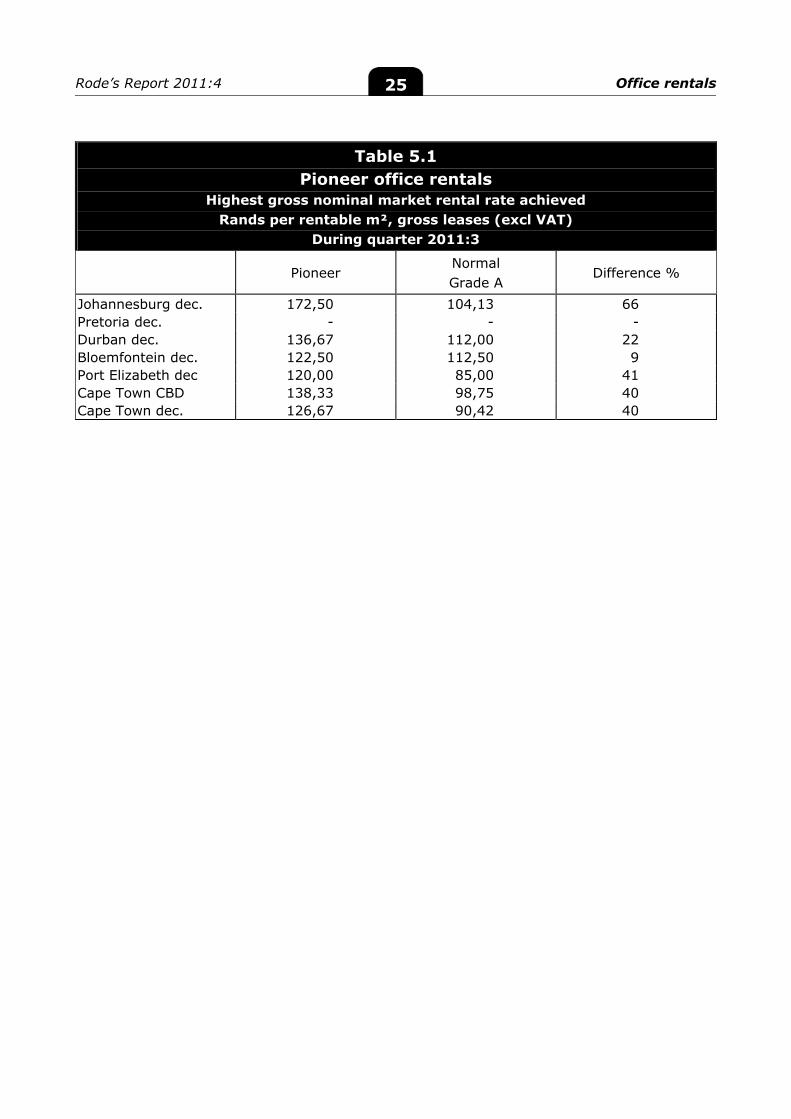
Rode’s Report 2011:4 Office rentals 25
Table 5.1 Pioneer office rentals
Highest gross nominal market rental rate achieved Rands per rentable m², gross leases (excl VAT)
During quarter 2011:3
Pioneer Normal Grade A
Difference %
Johannesburg dec. 172,50 104,13 66 Pretoria dec. - - - Durban dec. 136,67 112,00 22 Bloemfontein dec. 122,50 112,50 9 Port Elizabeth dec 120,00 85,00 41 Cape Town CBD 138,33 98,75 40 Cape Town dec. 126,67 90,42 40
Rode’s Report 2011:4 Office rentals 26
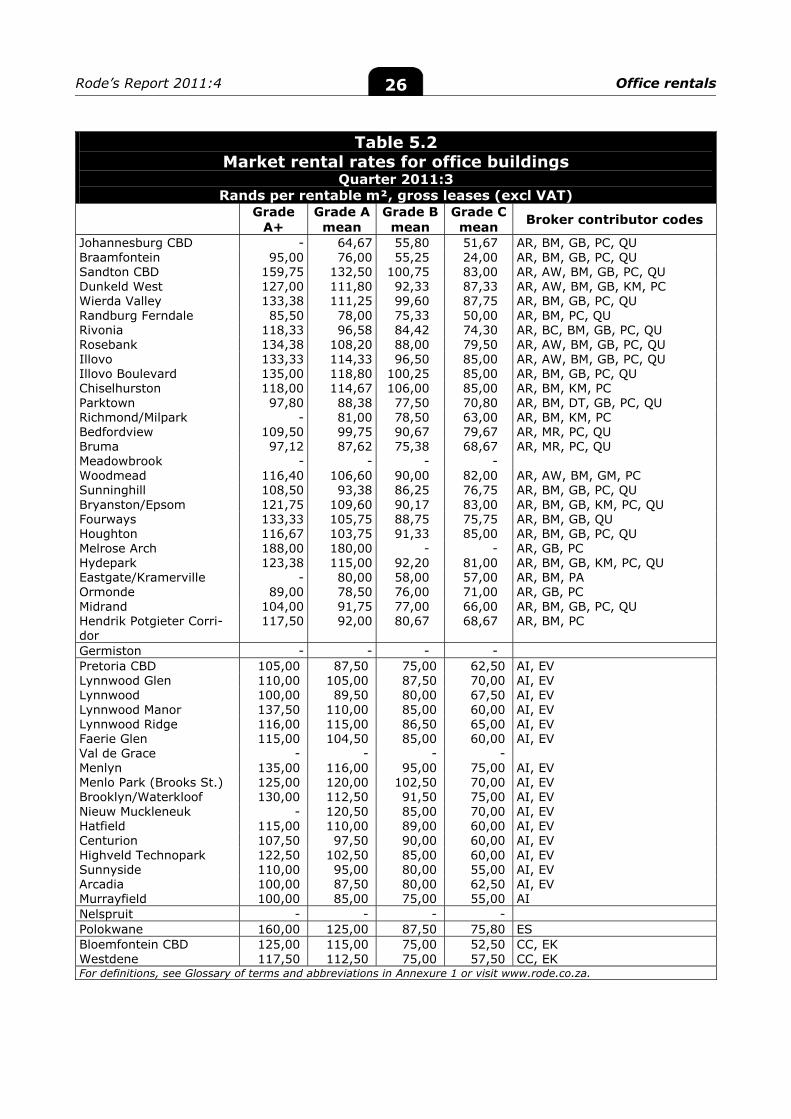
Table 5.2 Market rental rates for office buildings
Quarter 2011:3 Rands per rentable m², gross leases (excl VAT)
Grade A+
Grade A mean
Grade B mean
Grade C mean Broker contributor codes
Johannesburg CBD - 64,67 55,80 51,67 AR, BM, GB, PC, QU Braamfontein 95,00 76,00 55,25 24,00 AR, BM, GB, PC, QU Sandton CBD 159,75 132,50 100,75 83,00 AR, AW, BM, GB, PC, QU Dunkeld West 127,00 111,80 92,33 87,33 AR, AW, BM, GB, KM, PC Wierda Valley 133,38 111,25 99,60 87,75 AR, BM, GB, PC, QU Randburg Ferndale 85,50 78,00 75,33 50,00 AR, BM, PC, QU Rivonia 118,33 96,58 84,42 74,30 AR, BC, BM, GB, PC, QU Rosebank 134,38 108,20 88,00 79,50 AR, AW, BM, GB, PC, QU Illovo 133,33 114,33 96,50 85,00 AR, AW, BM, GB, PC, QU Illovo Boulevard 135,00 118,80 100,25 85,00 AR, BM, GB, PC, QU Chiselhurston 118,00 114,67 106,00 85,00 AR, BM, KM, PC Parktown 97,80 88,38 77,50 70,80 AR, BM, DT, GB, PC, QU Richmond/Milpark - 81,00 78,50 63,00 AR, BM, KM, PC Bedfordview 109,50 99,75 90,67 79,67 AR, MR, PC, QU Bruma 97,12 87,62 75,38 68,67 AR, MR, PC, QU Meadowbrook - - - - Woodmead 116,40 106,60 90,00 82,00 AR, AW, BM, GM, PC Sunninghill 108,50 93,38 86,25 76,75 AR, BM, GB, PC, QU Bryanston/Epsom 121,75 109,60 90,17 83,00 AR, BM, GB, KM, PC, QU Fourways 133,33 105,75 88,75 75,75 AR, BM, GB, QU Houghton 116,67 103,75 91,33 85,00 AR, BM, GB, PC, QU Melrose Arch 188,00 180,00 - - AR, GB, PC Hydepark 123,38 115,00 92,20 81,00 AR, BM, GB, KM, PC, QU Eastgate/Kramerville - 80,00 58,00 57,00 AR, BM, PA Ormonde 89,00 78,50 76,00 71,00 AR, GB, PC Midrand 104,00 91,75 77,00 66,00 AR, BM, GB, PC, QU Hendrik Potgieter Corri-dor
117,50 92,00 80,67 68,67 AR, BM, PC
Germiston - - - - Pretoria CBD 105,00 87,50 75,00 62,50 AI, EV Lynnwood Glen 110,00 105,00 87,50 70,00 AI, EV Lynnwood 100,00 89,50 80,00 67,50 AI, EV Lynnwood Manor 137,50 110,00 85,00 60,00 AI, EV Lynnwood Ridge 116,00 115,00 86,50 65,00 AI, EV Faerie Glen 115,00 104,50 85,00 60,00 AI, EV Val de Grace - - - - Menlyn 135,00 116,00 95,00 75,00 AI, EV Menlo Park (Brooks St.) 125,00 120,00 102,50 70,00 AI, EV Brooklyn/Waterkloof 130,00 112,50 91,50 75,00 AI, EV Nieuw Muckleneuk - 120,50 85,00 70,00 AI, EV Hatfield 115,00 110,00 89,00 60,00 AI, EV Centurion 107,50 97,50 90,00 60,00 AI, EV Highveld Technopark 122,50 102,50 85,00 60,00 AI, EV Sunnyside 110,00 95,00 80,00 55,00 AI, EV Arcadia 100,00 87,50 80,00 62,50 AI, EV Murrayfield 100,00 85,00 75,00 55,00 AI Nelspruit - - - - Polokwane 160,00 125,00 87,50 75,80 ES Bloemfontein CBD 125,00 115,00 75,00 52,50 CC, EK Westdene 117,50 112,50 75,00 57,50 CC, EK For definitions, see Glossary of terms and abbreviations in Annexure 1 or visit www.rode.co.za.
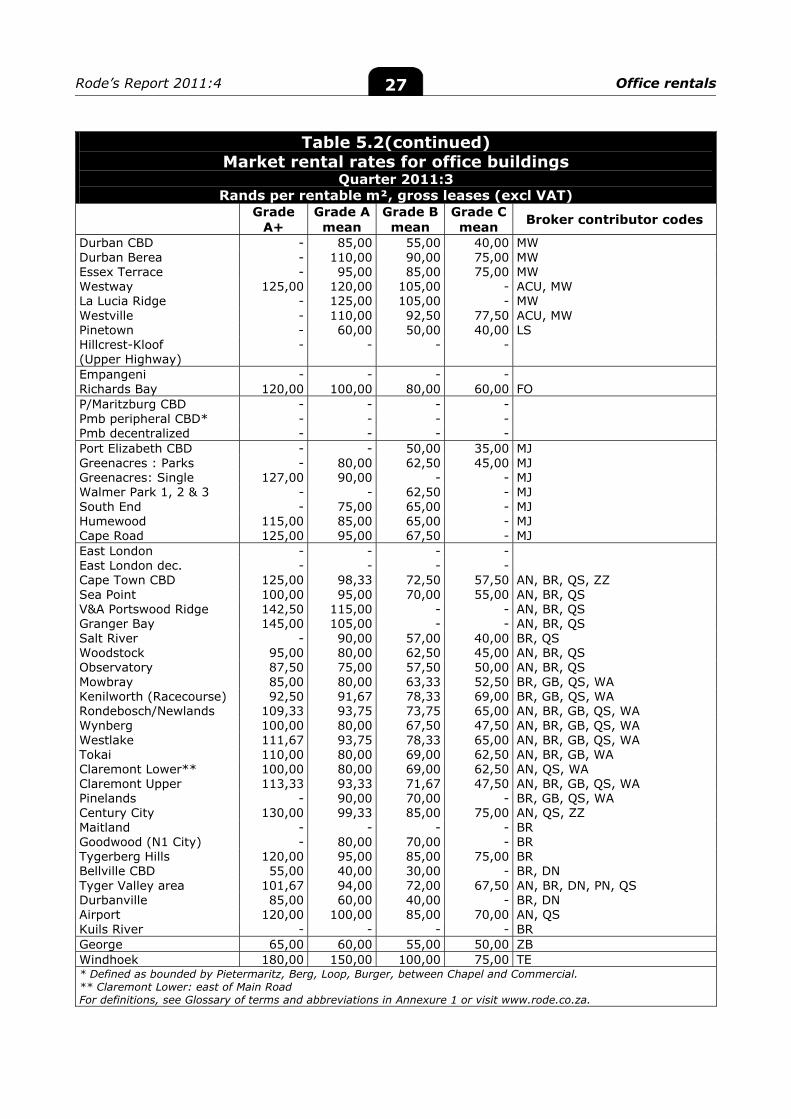
Rode’s Report 2011:4 Office rentals 27
Table 5.2(continued) Market rental rates for office buildings
Quarter 2011:3 Rands per rentable m², gross leases (excl VAT)
Grade A+
Grade A mean
Grade B mean
Grade C mean Broker contributor codes
Durban CBD - 85,00 55,00 40,00 MW Durban Berea - 110,00 90,00 75,00 MW Essex Terrace - 95,00 85,00 75,00 MW Westway 125,00 120,00 105,00 - ACU, MW La Lucia Ridge - 125,00 105,00 - MW Westville - 110,00 92,50 77,50 ACU, MW Pinetown - 60,00 50,00 40,00 LS Hillcrest-Kloof (Upper Highway)
- - - -
Empangeni - - - - Richards Bay 120,00 100,00 80,00 60,00 FO P/Maritzburg CBD - - - - Pmb peripheral CBD* - - - - Pmb decentralized - - - - Port Elizabeth CBD - - 50,00 35,00 MJ Greenacres : Parks - 80,00 62,50 45,00 MJ Greenacres: Single 127,00 90,00 - - MJ Walmer Park 1, 2 & 3 - - 62,50 - MJ South End - 75,00 65,00 - MJ Humewood 115,00 85,00 65,00 - MJ Cape Road 125,00 95,00 67,50 - MJ East London - - - - East London dec. - - - - Cape Town CBD 125,00 98,33 72,50 57,50 AN, BR, QS, ZZ Sea Point 100,00 95,00 70,00 55,00 AN, BR, QS V&A Portswood Ridge 142,50 115,00 - - AN, BR, QS Granger Bay 145,00 105,00 - - AN, BR, QS Salt River - 90,00 57,00 40,00 BR, QS Woodstock 95,00 80,00 62,50 45,00 AN, BR, QS Observatory 87,50 75,00 57,50 50,00 AN, BR, QS Mowbray 85,00 80,00 63,33 52,50 BR, GB, QS, WA Kenilworth (Racecourse) 92,50 91,67 78,33 69,00 BR, GB, QS, WA Rondebosch/Newlands 109,33 93,75 73,75 65,00 AN, BR, GB, QS, WA Wynberg 100,00 80,00 67,50 47,50 AN, BR, GB, QS, WA Westlake 111,67 93,75 78,33 65,00 AN, BR, GB, QS, WA Tokai 110,00 80,00 69,00 62,50 AN, BR, GB, WA Claremont Lower** 100,00 80,00 69,00 62,50 AN, QS, WA Claremont Upper 113,33 93,33 71,67 47,50 AN, BR, GB, QS, WA Pinelands - 90,00 70,00 - BR, GB, QS, WA Century City 130,00 99,33 85,00 75,00 AN, QS, ZZ Maitland - - - - BR Goodwood (N1 City) - 80,00 70,00 - BR Tygerberg Hills 120,00 95,00 85,00 75,00 BR Bellville CBD 55,00 40,00 30,00 - BR, DN Tyger Valley area 101,67 94,00 72,00 67,50 AN, BR, DN, PN, QS Durbanville 85,00 60,00 40,00 - BR, DN Airport 120,00 100,00 85,00 70,00 AN, QS Kuils River - - - - BR George 65,00 60,00 55,00 50,00 ZB Windhoek 180,00 150,00 100,00 75,00 TE * Defined as bounded by Pietermaritz, Berg, Loop, Burger, between Chapel and Commercial. ** Claremont Lower: east of Main Road For definitions, see Glossary of terms and abbreviations in Annexure 1 or visit www.rode.co.za.
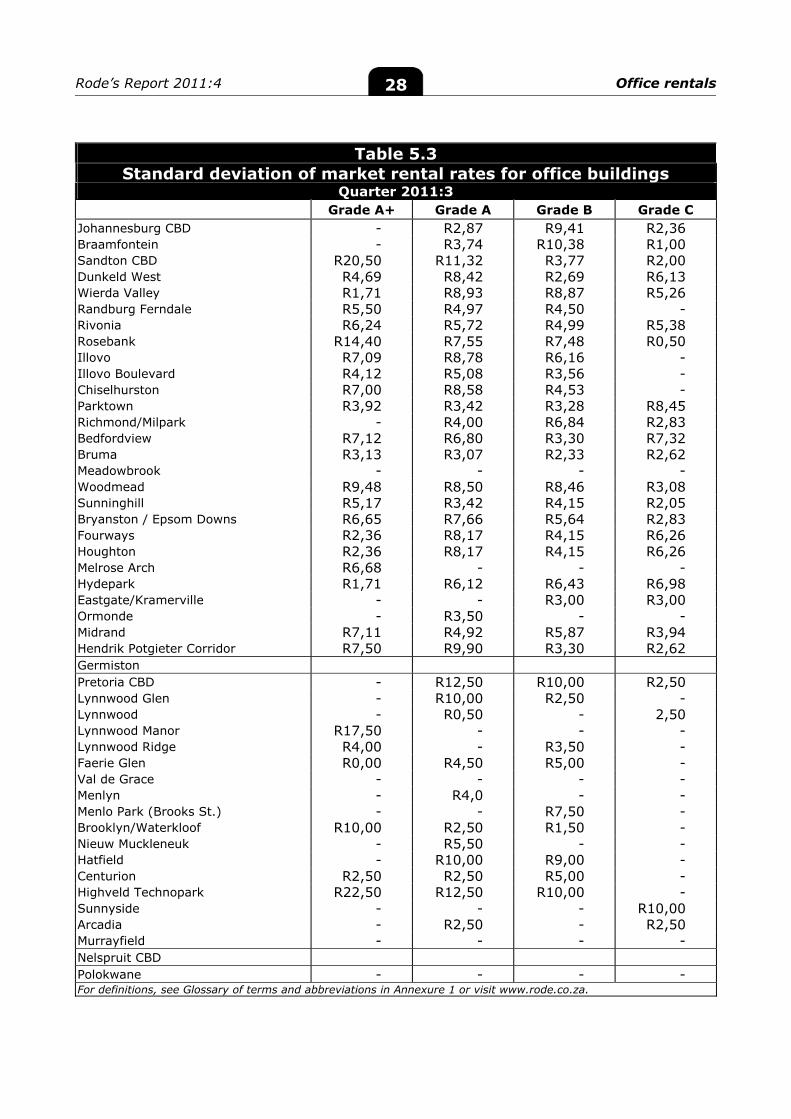
Rode’s Report 2011:4 Office rentals 28
Table 5.3 Standard deviation of market rental rates for office buildings
Quarter 2011:3 Grade A+ Grade A Grade B Grade C
Johannesburg CBD - R2,87 R9,41 R2,36 Braamfontein - R3,74 R10,38 R1,00 Sandton CBD R20,50 R11,32 R3,77 R2,00 Dunkeld West R4,69 R8,42 R2,69 R6,13 Wierda Valley R1,71 R8,93 R8,87 R5,26 Randburg Ferndale R5,50 R4,97 R4,50 - Rivonia R6,24 R5,72 R4,99 R5,38 Rosebank R14,40 R7,55 R7,48 R0,50 Illovo R7,09 R8,78 R6,16 - Illovo Boulevard R4,12 R5,08 R3,56 - Chiselhurston R7,00 R8,58 R4,53 - Parktown R3,92 R3,42 R3,28 R8,45 Richmond/Milpark - R4,00 R6,84 R2,83 Bedfordview R7,12 R6,80 R3,30 R7,32 Bruma R3,13 R3,07 R2,33 R2,62 Meadowbrook - - - - Woodmead R9,48 R8,50 R8,46 R3,08 Sunninghill R5,17 R3,42 R4,15 R2,05 Bryanston / Epsom Downs R6,65 R7,66 R5,64 R2,83 Fourways R2,36 R8,17 R4,15 R6,26 Houghton R2,36 R8,17 R4,15 R6,26 Melrose Arch R6,68 - - - Hydepark R1,71 R6,12 R6,43 R6,98 Eastgate/Kramerville - - R3,00 R3,00 Ormonde - R3,50 - - Midrand R7,11 R4,92 R5,87 R3,94 Hendrik Potgieter Corridor R7,50 R9,90 R3,30 R2,62 Germiston Pretoria CBD - R12,50 R10,00 R2,50 Lynnwood Glen - R10,00 R2,50 - Lynnwood - R0,50 - 2,50 Lynnwood Manor R17,50 - - - Lynnwood Ridge R4,00 - R3,50 - Faerie Glen R0,00 R4,50 R5,00 - Val de Grace - - - - Menlyn - R4,0 - - Menlo Park (Brooks St.) - - R7,50 - Brooklyn/Waterkloof R10,00 R2,50 R1,50 - Nieuw Muckleneuk - R5,50 - - Hatfield - R10,00 R9,00 - Centurion R2,50 R2,50 R5,00 - Highveld Technopark R22,50 R12,50 R10,00 - Sunnyside - - - R10,00 Arcadia - R2,50 - R2,50 Murrayfield - - - - Nelspruit CBD Polokwane - - - - For definitions, see Glossary of terms and abbreviations in Annexure 1 or visit www.rode.co.za.
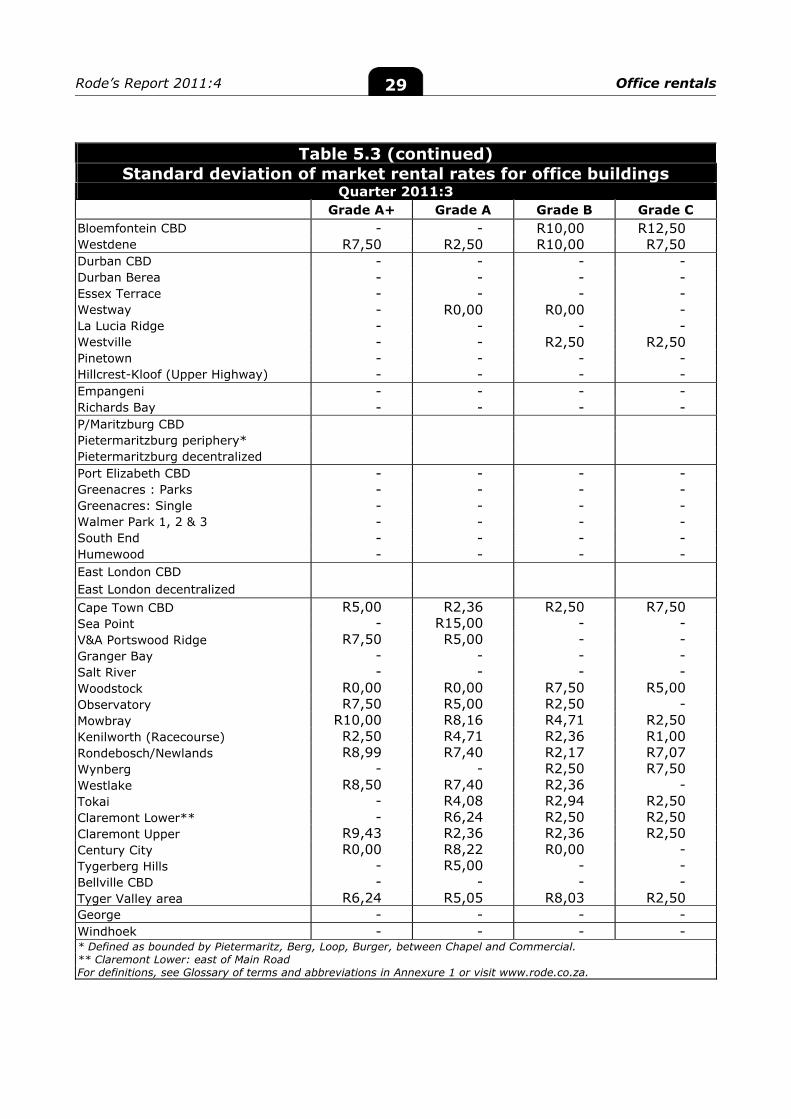
Rode’s Report 2011:4 Office rentals 29
Table 5.3 (continued) Standard deviation of market rental rates for office buildings
Quarter 2011:3 Grade A+ Grade A Grade B Grade C
Bloemfontein CBD - - R10,00 R12,50 Westdene R7,50 R2,50 R10,00 R7,50 Durban CBD - - - - Durban Berea - - - - Essex Terrace - - - - Westway - R0,00 R0,00 - La Lucia Ridge - - - - Westville - - R2,50 R2,50 Pinetown - - - - Hillcrest-Kloof (Upper Highway) - - - - Empangeni - - - - Richards Bay - - - - P/Maritzburg CBD Pietermaritzburg periphery* Pietermaritzburg decentralized Port Elizabeth CBD - - - - Greenacres : Parks - - - - Greenacres: Single - - - - Walmer Park 1, 2 & 3 - - - - South End - - - - Humewood - - - - East London CBD East London decentralized Cape Town CBD R5,00 R2,36 R2,50 R7,50 Sea Point - R15,00 - - V&A Portswood Ridge R7,50 R5,00 - - Granger Bay - - - - Salt River - - - - Woodstock R0,00 R0,00 R7,50 R5,00 Observatory R7,50 R5,00 R2,50 - Mowbray R10,00 R8,16 R4,71 R2,50 Kenilworth (Racecourse) R2,50 R4,71 R2,36 R1,00 Rondebosch/Newlands R8,99 R7,40 R2,17 R7,07 Wynberg - - R2,50 R7,50 Westlake R8,50 R7,40 R2,36 - Tokai - R4,08 R2,94 R2,50 Claremont Lower** - R6,24 R2,50 R2,50 Claremont Upper R9,43 R2,36 R2,36 R2,50 Century City R0,00 R8,22 R0,00 - Tygerberg Hills - R5,00 - - Bellville CBD - - - - Tyger Valley area R6,24 R5,05 R8,03 R2,50 George - - - - Windhoek - - - - * Defined as bounded by Pietermaritz, Berg, Loop, Burger, between Chapel and Commercial. ** Claremont Lower: east of Main Road For definitions, see Glossary of terms and abbreviations in Annexure 1 or visit www.rode.co.za.
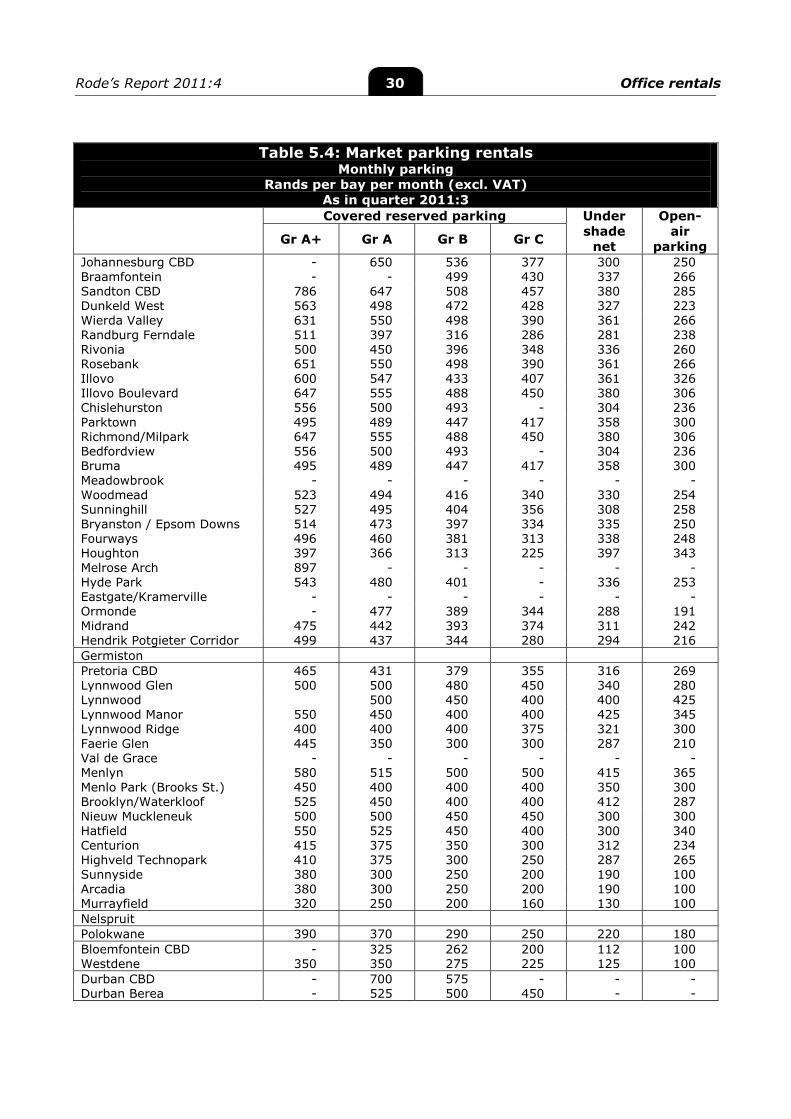
Rode’s Report 2011:4 30 Office rentals0
Table 5.4: Market parking rentals Monthly parking
Rands per bay per month (excl. VAT) As in quarter 2011:3
Covered reserved parking Under shade
net
Open-air
parking Gr A+ Gr A Gr B Gr C
Johannesburg CBD - 650 536 377 300 250 Braamfontein - - 499 430 337 266 Sandton CBD 786 647 508 457 380 285 Dunkeld West 563 498 472 428 327 223 Wierda Valley 631 550 498 390 361 266 Randburg Ferndale 511 397 316 286 281 238 Rivonia 500 450 396 348 336 260 Rosebank 651 550 498 390 361 266 Illovo 600 547 433 407 361 326 Illovo Boulevard 647 555 488 450 380 306 Chislehurston 556 500 493 - 304 236 Parktown 495 489 447 417 358 300 Richmond/Milpark 647 555 488 450 380 306 Bedfordview 556 500 493 - 304 236 Bruma 495 489 447 417 358 300 Meadowbrook - - - - - - Woodmead 523 494 416 340 330 254 Sunninghill 527 495 404 356 308 258 Bryanston / Epsom Downs 514 473 397 334 335 250 Fourways 496 460 381 313 338 248 Houghton 397 366 313 225 397 343 Melrose Arch 897 - - - - - Hyde Park 543 480 401 - 336 253 Eastgate/Kramerville - - - - - - Ormonde - 477 389 344 288 191 Midrand 475 442 393 374 311 242 Hendrik Potgieter Corridor 499 437 344 280 294 216 Germiston Pretoria CBD 465 431 379 355 316 269 Lynnwood Glen 500 500 480 450 340 280 Lynnwood 500 450 400 400 425 Lynnwood Manor 550 450 400 400 425 345 Lynnwood Ridge 400 400 400 375 321 300 Faerie Glen 445 350 300 300 287 210 Val de Grace - - - - - - Menlyn 580 515 500 500 415 365 Menlo Park (Brooks St.) 450 400 400 400 350 300 Brooklyn/Waterkloof 525 450 400 400 412 287 Nieuw Muckleneuk 500 500 450 450 300 300 Hatfield 550 525 450 400 300 340 Centurion 415 375 350 300 312 234 Highveld Technopark 410 375 300 250 287 265 Sunnyside 380 300 250 200 190 100 Arcadia 380 300 250 200 190 100 Murrayfield 320 250 200 160 130 100 Nelspruit Polokwane 390 370 290 250 220 180 Bloemfontein CBD - 325 262 200 112 100 Westdene 350 350 275 225 125 100 Durban CBD - 700 575 - - - Durban Berea - 525 500 450 - -
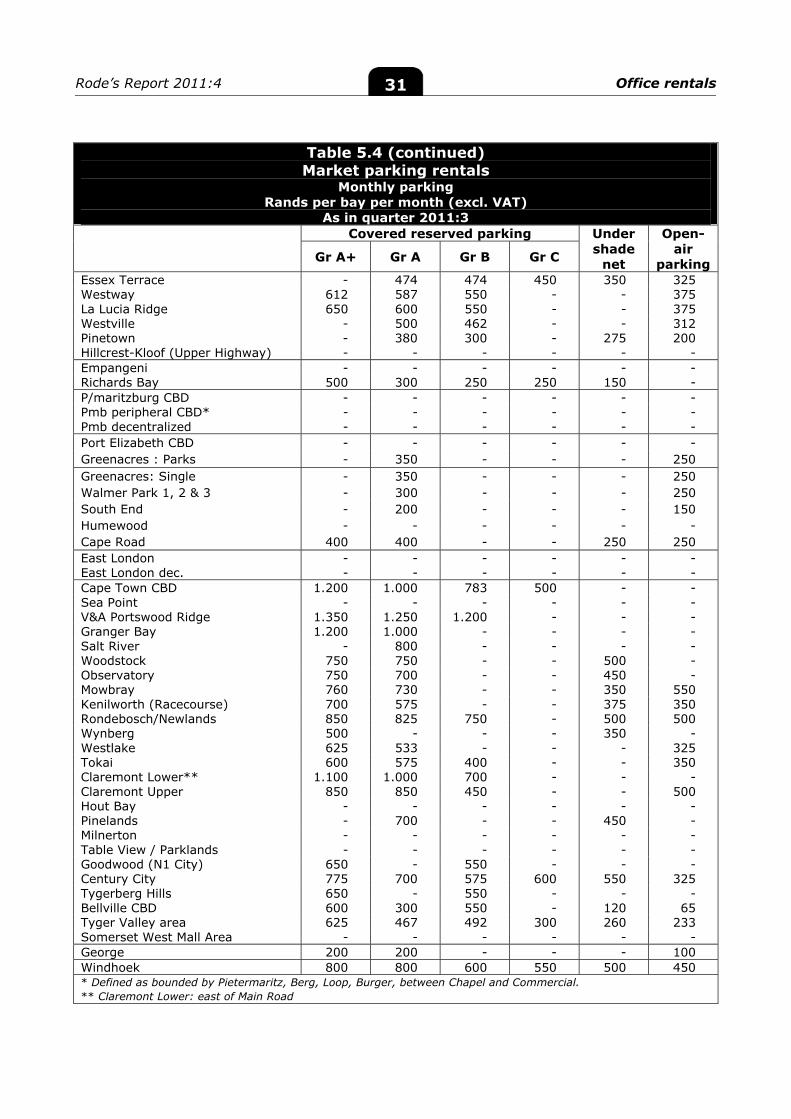
Rode’s Report 2011:4 Office rentals 31
Table 5.4 (continued) Market parking rentals
Monthly parking Rands per bay per month (excl. VAT)
As in quarter 2011:3 Covered reserved parking Under
shade net
Open-air
parking Gr A+ Gr A Gr B Gr C
Essex Terrace - 474 474 450 350 325 Westway 612 587 550 - - 375 La Lucia Ridge 650 600 550 - - 375 Westville - 500 462 - - 312 Pinetown - 380 300 - 275 200 Hillcrest-Kloof (Upper Highway) - - - - - - Empangeni - - - - - - Richards Bay 500 300 250 250 150 - P/maritzburg CBD - - - - - - Pmb peripheral CBD* - - - - - - Pmb decentralized - - - - - - Port Elizabeth CBD - - - - - - Greenacres : Parks - 350 - - - 250 Greenacres: Single - 350 - - - 250 Walmer Park 1, 2 & 3 - 300 - - - 250 South End - 200 - - - 150 Humewood - - - - - - Cape Road 400 400 - - 250 250 East London - - - - - - East London dec. - - - - - - Cape Town CBD 1.200 1.000 783 500 - - Sea Point - - - - - - V&A Portswood Ridge 1.350 1.250 1.200 - - - Granger Bay 1.200 1.000 - - - - Salt River - 800 - - - - Woodstock 750 750 - - 500 - Observatory 750 700 - - 450 - Mowbray 760 730 - - 350 550 Kenilworth (Racecourse) 700 575 - - 375 350 Rondebosch/Newlands 850 825 750 - 500 500 Wynberg 500 - - - 350 - Westlake 625 533 - - - 325 Tokai 600 575 400 - - 350 Claremont Lower** 1.100 1.000 700 - - - Claremont Upper 850 850 450 - - 500 Hout Bay - - - - - - Pinelands - 700 - - 450 - Milnerton - - - - - - Table View / Parklands - - - - - - Goodwood (N1 City) 650 - 550 - - - Century City 775 700 575 600 550 325 Tygerberg Hills 650 - 550 - - - Bellville CBD 600 300 550 - 120 65 Tyger Valley area 625 467 492 300 260 233 Somerset West Mall Area - - - - - - George 200 200 - - - 100 Windhoek 800 800 600 550 500 450 * Defined as bounded by Pietermaritz, Berg, Loop, Burger, between Chapel and Commercial. ** Claremont Lower: east of Main Road
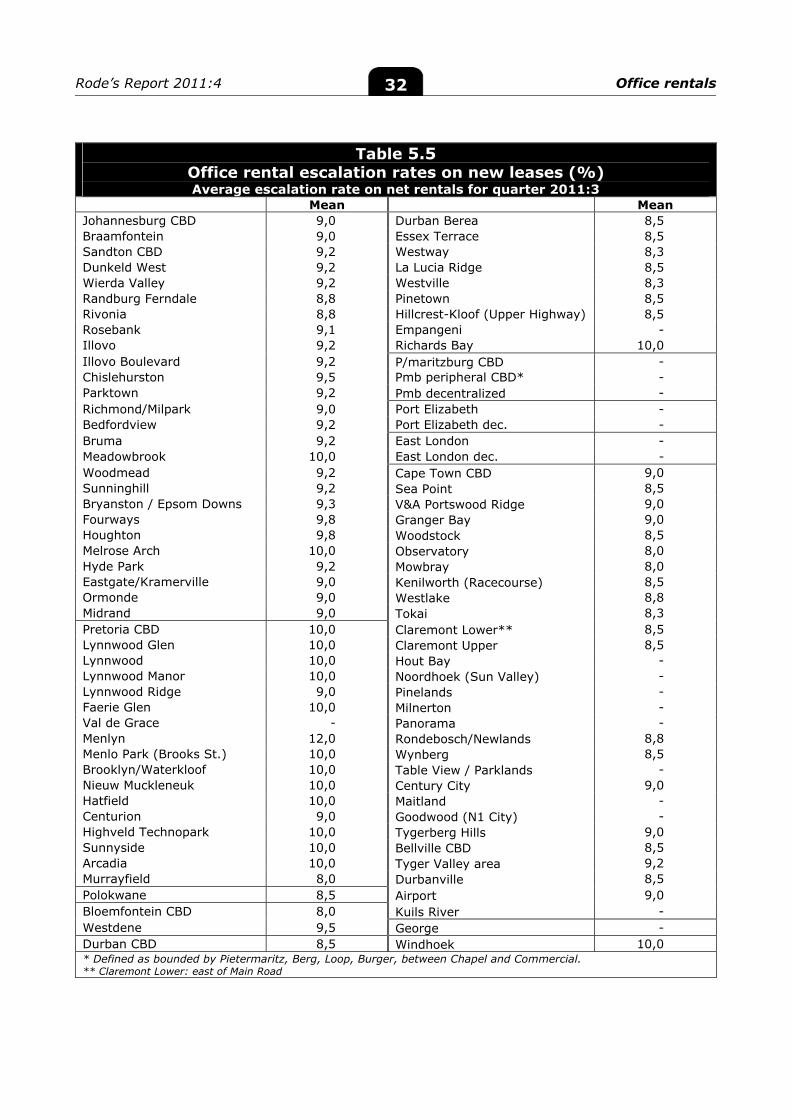
Rode’s Report 2011:4 Office rentals 32
Table 5.5 Office rental escalation rates on new leases (%) Average escalation rate on net rentals for quarter 2011:3
Mean Mean Johannesburg CBD 9,0 Durban Berea 8,5 Braamfontein 9,0 Essex Terrace 8,5 Sandton CBD 9,2 Westway 8,3 Dunkeld West 9,2 La Lucia Ridge 8,5 Wierda Valley 9,2 Westville 8,3 Randburg Ferndale 8,8 Pinetown 8,5 Rivonia 8,8 Hillcrest-Kloof (Upper Highway) 8,5 Rosebank 9,1 Empangeni - Illovo 9,2 Richards Bay 10,0 Illovo Boulevard 9,2 P/maritzburg CBD - Chislehurston 9,5 Pmb peripheral CBD* - Parktown 9,2 Pmb decentralized - Richmond/Milpark 9,0 Port Elizabeth - Bedfordview 9,2 Port Elizabeth dec. - Bruma 9,2 East London - Meadowbrook 10,0 East London dec. - Woodmead 9,2 Cape Town CBD 9,0 Sunninghill 9,2 Sea Point 8,5 Bryanston / Epsom Downs 9,3 V&A Portswood Ridge 9,0 Fourways 9,8 Granger Bay 9,0 Houghton 9,8 Woodstock 8,5 Melrose Arch 10,0 Observatory 8,0 Hyde Park 9,2 Mowbray 8,0 Eastgate/Kramerville 9,0 Kenilworth (Racecourse) 8,5 Ormonde 9,0 Westlake 8,8 Midrand 9,0 Tokai 8,3 Pretoria CBD 10,0 Claremont Lower** 8,5 Lynnwood Glen 10,0 Claremont Upper 8,5 Lynnwood 10,0 Hout Bay - Lynnwood Manor 10,0 Noordhoek (Sun Valley) - Lynnwood Ridge 9,0 Pinelands - Faerie Glen 10,0 Milnerton - Val de Grace - Panorama - Menlyn 12,0 Rondebosch/Newlands 8,8 Menlo Park (Brooks St.) 10,0 Wynberg 8,5 Brooklyn/Waterkloof 10,0 Table View / Parklands - Nieuw Muckleneuk 10,0 Century City 9,0 Hatfield 10,0 Maitland - Centurion 9,0 Goodwood (N1 City) - Highveld Technopark 10,0 Tygerberg Hills 9,0 Sunnyside 10,0 Bellville CBD 8,5 Arcadia 10,0 Tyger Valley area 9,2 Murrayfield 8,0 Durbanville 8,5 Polokwane 8,5 Airport 9,0 Bloemfontein CBD 8,0 Kuils River - Westdene 9,5 George - Durban CBD 8,5 Windhoek 10,0 * Defined as bounded by Pietermaritz, Berg, Loop, Burger, between Chapel and Commercial. ** Claremont Lower: east of Main Road
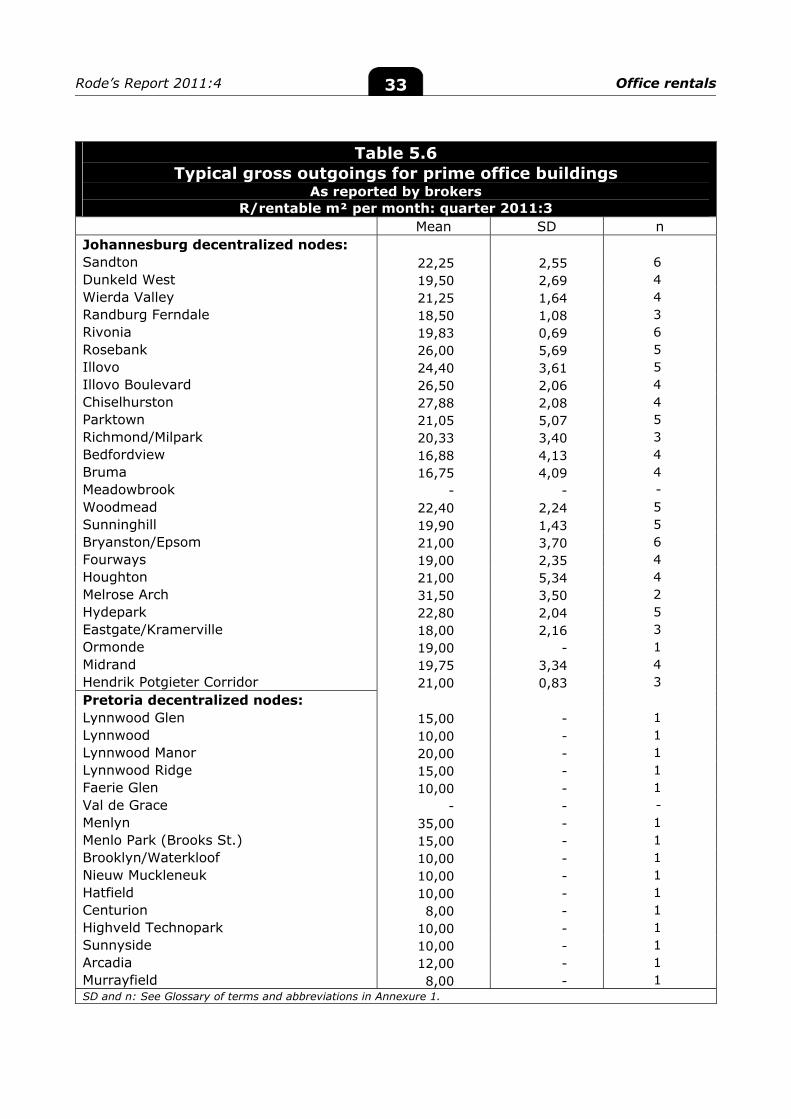
Rode’s Report 2011:4 Office rentals 33
Table 5.6 Typical gross outgoings for prime office buildings
As reported by brokers R/rentable m² per month: quarter 2011:3
Mean SD n Johannesburg decentralized nodes: Sandton 22,25 2,55 6 Dunkeld West 19,50 2,69 4 Wierda Valley 21,25 1,64 4 Randburg Ferndale 18,50 1,08 3 Rivonia 19,83 0,69 6 Rosebank 26,00 5,69 5 Illovo 24,40 3,61 5 Illovo Boulevard 26,50 2,06 4 Chiselhurston 27,88 2,08 4 Parktown 21,05 5,07 5 Richmond/Milpark 20,33 3,40 3 Bedfordview 16,88 4,13 4 Bruma 16,75 4,09 4 Meadowbrook - - - Woodmead 22,40 2,24 5 Sunninghill 19,90 1,43 5 Bryanston/Epsom 21,00 3,70 6 Fourways 19,00 2,35 4 Houghton 21,00 5,34 4 Melrose Arch 31,50 3,50 2 Hydepark 22,80 2,04 5 Eastgate/Kramerville 18,00 2,16 3 Ormonde 19,00 - 1 Midrand 19,75 3,34 4 Hendrik Potgieter Corridor 21,00 0,83 3 Pretoria decentralized nodes: Lynnwood Glen 15,00 - 1 Lynnwood 10,00 - 1 Lynnwood Manor 20,00 - 1 Lynnwood Ridge 15,00 - 1 Faerie Glen 10,00 - 1 Val de Grace - - - Menlyn 35,00 - 1 Menlo Park (Brooks St.) 15,00 - 1 Brooklyn/Waterkloof 10,00 - 1 Nieuw Muckleneuk 10,00 - 1 Hatfield 10,00 - 1 Centurion 8,00 - 1 Highveld Technopark 10,00 - 1 Sunnyside 10,00 - 1 Arcadia 12,00 - 1 Murrayfield 8,00 - 1 SD and n: See Glossary of terms and abbreviations in Annexure 1.
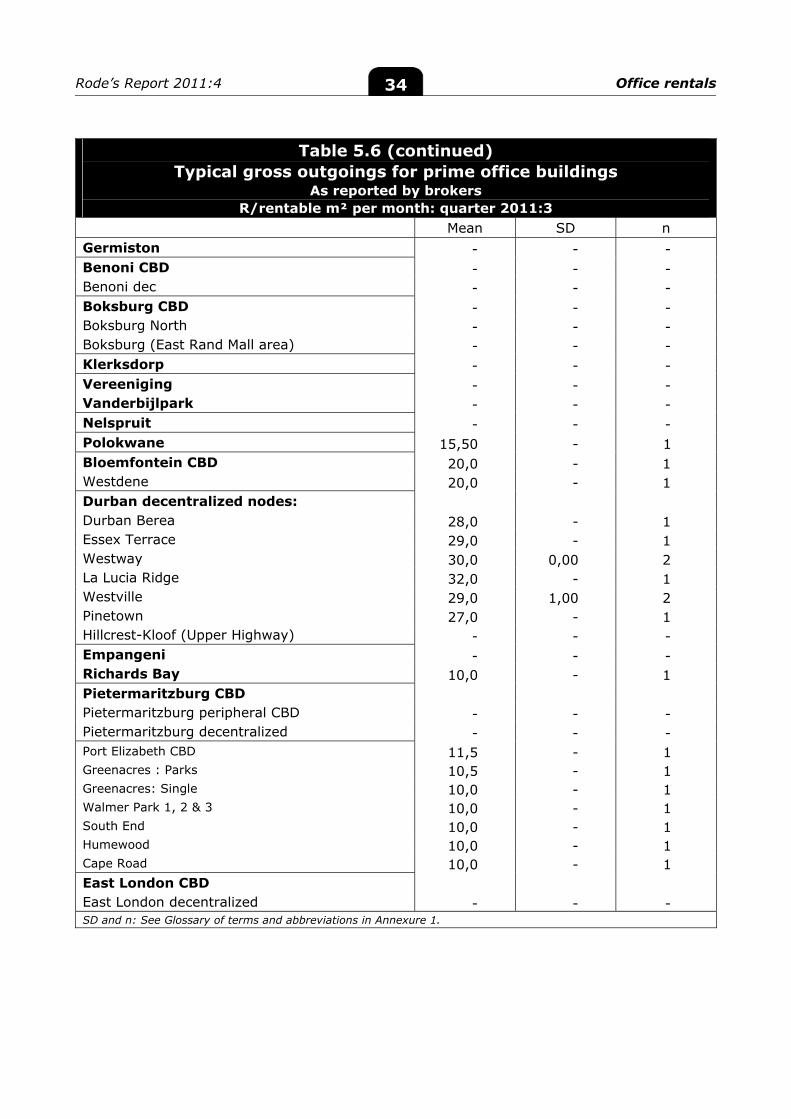
Rode’s Report 2011:4 Office rentals 34
Table 5.6 (continued) Typical gross outgoings for prime office buildings
As reported by brokers R/rentable m² per month: quarter 2011:3
Mean SD n Germiston - - - Benoni CBD - - - Benoni dec - - - Boksburg CBD - - - Boksburg North - - - Boksburg (East Rand Mall area) - - - Klerksdorp - - - Vereeniging - - - Vanderbijlpark - - - Nelspruit - - - Polokwane 15,50 - 1 Bloemfontein CBD 20,0 - 1 Westdene 20,0 - 1 Durban decentralized nodes: Durban Berea 28,0 - 1 Essex Terrace 29,0 - 1 Westway 30,0 0,00 2 La Lucia Ridge 32,0 - 1 Westville 29,0 1,00 2 Pinetown 27,0 - 1 Hillcrest-Kloof (Upper Highway) - - - Empangeni - - - Richards Bay 10,0 - 1 Pietermaritzburg CBD Pietermaritzburg peripheral CBD - - - Pietermaritzburg decentralized - - - Port Elizabeth CBD 11,5 - 1 Greenacres : Parks 10,5 - 1 Greenacres: Single 10,0 - 1 Walmer Park 1, 2 & 3 10,0 - 1 South End 10,0 - 1 Humewood 10,0 - 1 Cape Road 10,0 - 1 East London CBD East London decentralized - - - SD and n: See Glossary of terms and abbreviations in Annexure 1.
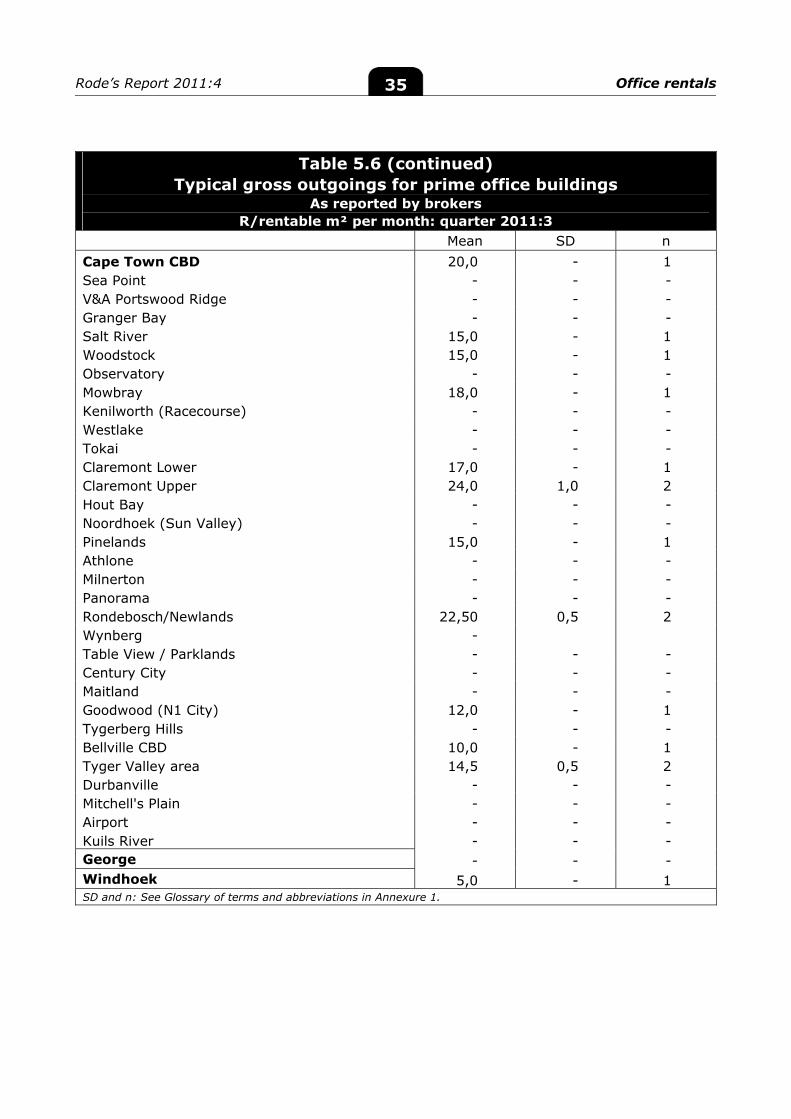
Rode’s Report 2011:4 Office rentals 35
Table 5.6 (continued) Typical gross outgoings for prime office buildings
As reported by brokers R/rentable m² per month: quarter 2011:3
Mean SD n Cape Town CBD 20,0 - 1 Sea Point - - - V&A Portswood Ridge - - - Granger Bay - - - Salt River 15,0 - 1 Woodstock 15,0 - 1 Observatory - - - Mowbray 18,0 - 1 Kenilworth (Racecourse) - - - Westlake - - - Tokai - - - Claremont Lower 17,0 - 1 Claremont Upper 24,0 1,0 2 Hout Bay - - - Noordhoek (Sun Valley) - - - Pinelands 15,0 - 1 Athlone - - - Milnerton - - - Panorama - - - Rondebosch/Newlands 22,50 0,5 2 Wynberg - Table View / Parklands - - - Century City - - - Maitland - - - Goodwood (N1 City) 12,0 - 1 Tygerberg Hills - - - Bellville CBD 10,0 - 1 Tyger Valley area 14,5 0,5 2 Durbanville - - - Mitchell's Plain - - - Airport - - - Kuils River - - - George - - - Windhoek 5,0 - 1 SD and n: See Glossary of terms and abbreviations in Annexure 1.
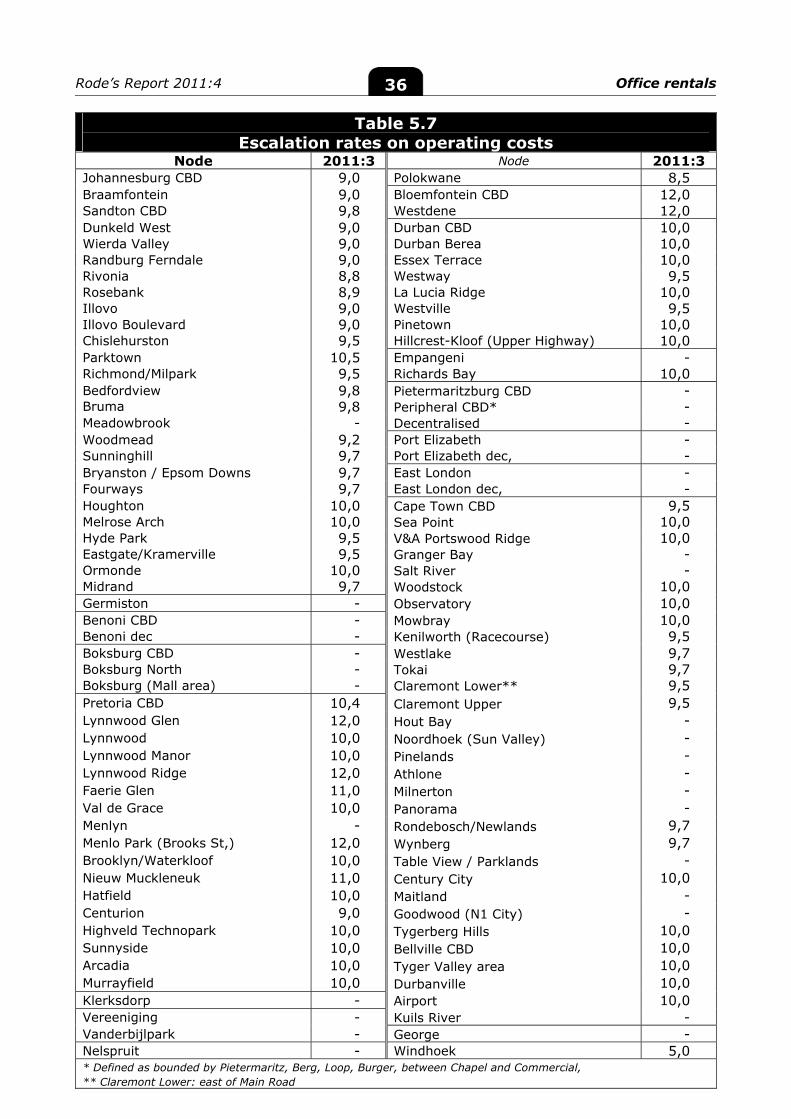
Rode’s Report 2011:4 Office rentals 36
Table 5.7 Escalation rates on operating costs
Node 2011:3 Node 2011:3 Johannesburg CBD 9,0 Polokwane 8,5 Braamfontein 9,0 Bloemfontein CBD 12,0 Sandton CBD 9,8 Westdene 12,0 Dunkeld West 9,0 Durban CBD 10,0 Wierda Valley 9,0 Durban Berea 10,0 Randburg Ferndale 9,0 Essex Terrace 10,0 Rivonia 8,8 Westway 9,5 Rosebank 8,9 La Lucia Ridge 10,0 Illovo 9,0 Westville 9,5 Illovo Boulevard 9,0 Pinetown 10,0 Chislehurston 9,5 Hillcrest-Kloof (Upper Highway) 10,0 Parktown 10,5 Empangeni - Richmond/Milpark 9,5 Richards Bay 10,0 Bedfordview 9,8 Pietermaritzburg CBD - Bruma 9,8 Peripheral CBD* - Meadowbrook - Decentralised - Woodmead 9,2 Port Elizabeth - Sunninghill 9,7 Port Elizabeth dec, - Bryanston / Epsom Downs 9,7 East London - Fourways 9,7 East London dec, - Houghton 10,0 Cape Town CBD 9,5 Melrose Arch 10,0 Sea Point 10,0 Hyde Park 9,5 V&A Portswood Ridge 10,0 Eastgate/Kramerville 9,5 Granger Bay - Ormonde 10,0 Salt River - Midrand 9,7 Woodstock 10,0 Germiston - Observatory 10,0 Benoni CBD - Mowbray 10,0 Benoni dec - Kenilworth (Racecourse) 9,5 Boksburg CBD - Westlake 9,7 Boksburg North - Tokai 9,7 Boksburg (Mall area) - Claremont Lower** 9,5 Pretoria CBD 10,4 Claremont Upper 9,5 Lynnwood Glen 12,0 Hout Bay - Lynnwood 10,0 Noordhoek (Sun Valley) - Lynnwood Manor 10,0 Pinelands - Lynnwood Ridge 12,0 Athlone - Faerie Glen 11,0 Milnerton - Val de Grace 10,0 Panorama - Menlyn - Rondebosch/Newlands 9,7 Menlo Park (Brooks St,) 12,0 Wynberg 9,7 Brooklyn/Waterkloof 10,0 Table View / Parklands - Nieuw Muckleneuk 11,0 Century City 10,0 Hatfield 10,0 Maitland - Centurion 9,0 Goodwood (N1 City) - Highveld Technopark 10,0 Tygerberg Hills 10,0 Sunnyside 10,0 Bellville CBD 10,0 Arcadia 10,0 Tyger Valley area 10,0 Murrayfield 10,0 Durbanville 10,0 Klerksdorp - Airport 10,0 Vereeniging - Kuils River - Vanderbijlpark - George - Nelspruit - Windhoek 5,0 * Defined as bounded by Pietermaritz, Berg, Loop, Burger, between Chapel and Commercial, ** Claremont Lower: east of Main Road
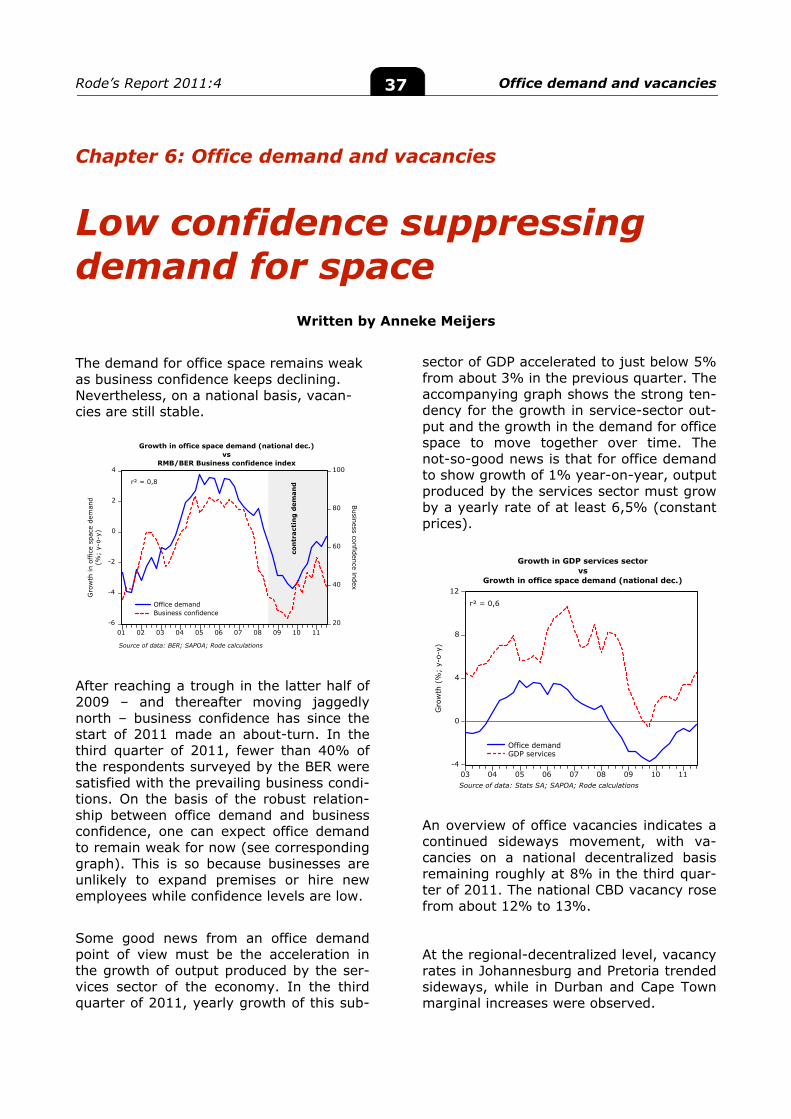
Rode’s Report 2011:4 Office demand and vacancies 37
-6
-4
-2
0
2
4
20
40
60
80
100
01 02 03 04 05 06 07 08 09 10 11
Office demandBusiness confidence
Growth in office space demand (national dec.)vs
RMB/BER Business confidence index
con
trac
tin
g d
eman
d
Gro
wth
in o
ffic
e sp
ace
dem
and
(%;
y-o-
y)
Business confidence index
Source of data: BER; SAPOA; Rode calculations
r² = 0,8
-4
0
4
8
12
03 04 05 06 07 08 09 10 11
Office demandGDP services
Growth in GDP services sectorvs
Growth in office space demand (national dec.)
r² = 0,6
Gro
wth
(%
; y-
o-y)
Source of data: Stats SA; SAPOA; Rode calculations
Chapter 6: Office demand and vacancies
Low confidence suppressing demand for space
Written by Anneke Meijers The demand for office space remains weak as business confidence keeps declining. Nevertheless, on a national basis, vacan-cies are still stable. After reaching a trough in the latter half of 2009 – and thereafter moving jaggedly north – business confidence has since the start of 2011 made an about-turn. In the third quarter of 2011, fewer than 40% of the respondents surveyed by the BER were satisfied with the prevailing business condi-tions. On the basis of the robust relation-ship between office demand and business confidence, one can expect office demand to remain weak for now (see corresponding graph). This is so because businesses are unlikely to expand premises or hire new employees while confidence levels are low. Some good news from an office demand point of view must be the acceleration in the growth of output produced by the ser-vices sector of the economy. In the third quarter of 2011, yearly growth of this sub-
sector of GDP accelerated to just below 5% from about 3% in the previous quarter. The accompanying graph shows the strong ten-dency for the growth in service-sector out-put and the growth in the demand for office space to move together over time. The not-so-good news is that for office demand to show growth of 1% year-on-year, output produced by the services sector must grow by a yearly rate of at least 6,5% (constant prices).
An overview of office vacancies indicates a continued sideways movement, with va-cancies on a national decentralized basis remaining roughly at 8% in the third quar-ter of 2011. The national CBD vacancy rose from about 12% to 13%. At the regional-decentralized level, vacancy rates in Johannesburg and Pretoria trended sideways, while in Durban and Cape Town marginal increases were observed.
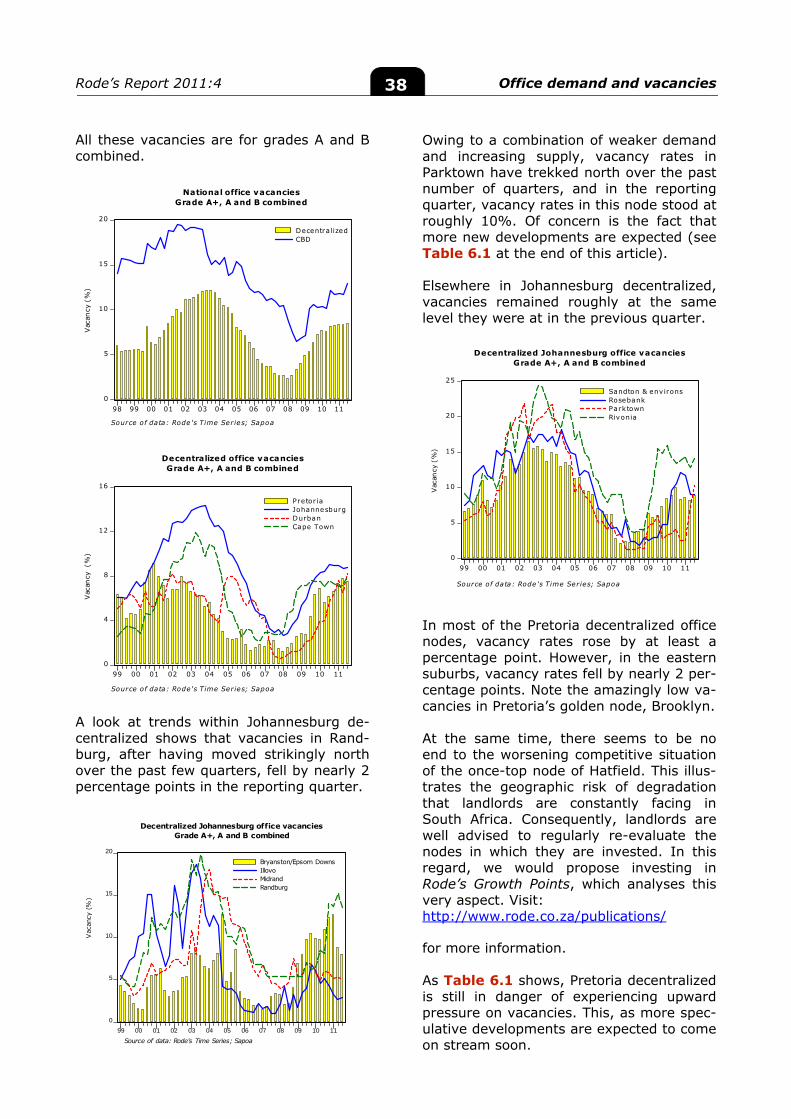
Rode’s Report 2011:4 Office demand and vacancies 38
0
4
8
12
16
99 00 01 02 03 04 05 06 07 08 09 10 11
Pretor iaJohannesburgDurbanCape Town
Decentralized office vacanciesGrade A+, A and B combined
Source of data: Rode's Time Series; Sapoa
Vac
ancy
(%
)
0
5
10
15
20
98 99 00 01 02 03 04 05 06 07 08 09 10 11
DecentralizedCBD
National office vacanciesGrade A+, A and B combined
Vac
ancy
(%
)
Source of data: Rode's Time Series; Sapoa
0
5
10
15
20
99 00 01 02 03 04 05 06 07 08 09 10 11
Bryanston/Epsom DownsIllovoMidrandRandburg
Decentralized Johannesburg office vacanciesGrade A+, A and B combined
Source of data: Rode's Time Series; Sapoa
Vac
ancy
(%
)
0
5
10
15
20
25
99 00 01 02 03 04 05 06 07 08 09 10 11
Sandton & env ironsRosebankParktownRivonia
Decentralized Johannesburg office vacanciesGrade A+, A and B combined
Source of data: Rode's Time Series; Sapoa
Vac
ancy
(%
)
All these vacancies are for grades A and B combined. A look at trends within Johannesburg de-centralized shows that vacancies in Rand-burg, after having moved strikingly north over the past few quarters, fell by nearly 2 percentage points in the reporting quarter.
Owing to a combination of weaker demand and increasing supply, vacancy rates in Parktown have trekked north over the past number of quarters, and in the reporting quarter, vacancy rates in this node stood at roughly 10%. Of concern is the fact that more new developments are expected (see Table 6.1 at the end of this article). Elsewhere in Johannesburg decentralized, vacancies remained roughly at the same level they were at in the previous quarter. In most of the Pretoria decentralized office nodes, vacancy rates rose by at least a percentage point. However, in the eastern suburbs, vacancy rates fell by nearly 2 per-centage points. Note the amazingly low va-cancies in Pretoria’s golden node, Brooklyn. At the same time, there seems to be no end to the worsening competitive situation of the once-top node of Hatfield. This illus-trates the geographic risk of degradation that landlords are constantly facing in South Africa. Consequently, landlords are well advised to regularly re-evaluate the nodes in which they are invested. In this regard, we would propose investing in Rode’s Growth Points, which analyses this very aspect. Visit: http://www.rode.co.za/publications/ for more information. As Table 6.1 shows, Pretoria decentralized is still in danger of experiencing upward pressure on vacancies. This, as more spec-ulative developments are expected to come on stream soon.
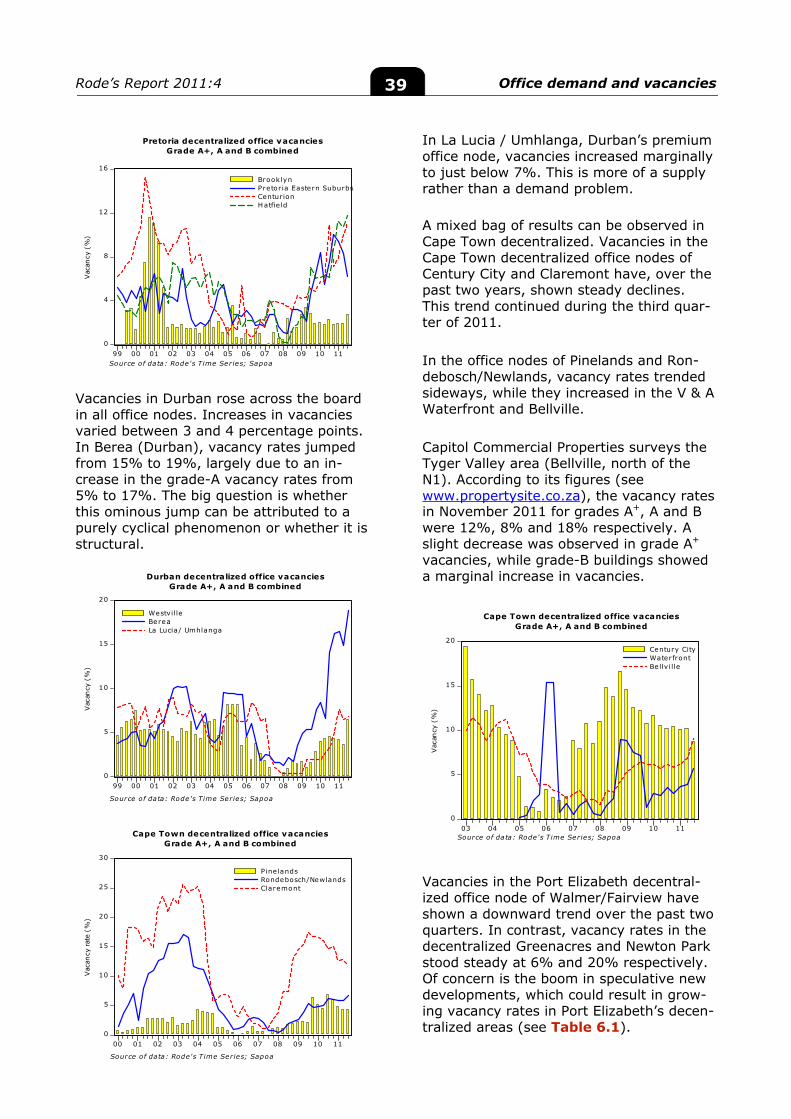
Rode’s Report 2011:4 Office demand and vacancies 39
0
4
8
12
16
99 00 01 02 03 04 05 06 07 08 09 10 11
BrooklynPretor ia Eastern SuburbsCenturionHatfie ld
Pretoria decentralized office vacanciesGrade A+, A and B combined
Source of data: Rode's Time Series; Sapoa
Vac
ancy
(%
)
0
5
10
15
20
99 00 01 02 03 04 05 06 07 08 09 10 11
WestvilleBereaLa Lucia/ Umhlanga
Durban decentralized office vacanciesGrade A+, A and B combined
Source of data: Rode's Time Series; Sapoa
Vac
ancy
(%
)
0
5
10
15
20
03 04 05 06 07 08 09 10 11
Century CityWaterfrontBellv i lle
Cape Town decentralized office vacanciesGrade A+, A and B combined
Vac
ancy
(%
)
Source of data: Rode's Time Series; Sapoa
0
5
10
15
20
25
30
00 01 02 03 04 05 06 07 08 09 10 11
Pine landsRondebosch/NewlandsClaremont
Cape Town decentralized office vacanciesGrade A+, A and B combined
Vac
ancy
rat
e (%
)
Source of data: Rode's T ime Series; Sapoa
Vacancies in Durban rose across the board in all office nodes. Increases in vacancies varied between 3 and 4 percentage points. In Berea (Durban), vacancy rates jumped from 15% to 19%, largely due to an in-crease in the grade-A vacancy rates from 5% to 17%. The big question is whether this ominous jump can be attributed to a purely cyclical phenomenon or whether it is structural.
In La Lucia / Umhlanga, Durban’s premium office node, vacancies increased marginally to just below 7%. This is more of a supply rather than a demand problem. A mixed bag of results can be observed in Cape Town decentralized. Vacancies in the Cape Town decentralized office nodes of Century City and Claremont have, over the past two years, shown steady declines. This trend continued during the third quar-ter of 2011. In the office nodes of Pinelands and Ron-debosch/Newlands, vacancy rates trended sideways, while they increased in the V & A Waterfront and Bellville. Capitol Commercial Properties surveys the Tyger Valley area (Bellville, north of the N1). According to its figures (see www.propertysite.co.za), the vacancy rates in November 2011 for grades A+, A and B were 12%, 8% and 18% respectively. A slight decrease was observed in grade A+ vacancies, while grade-B buildings showed a marginal increase in vacancies. Vacancies in the Port Elizabeth decentral-ized office node of Walmer/Fairview have shown a downward trend over the past two quarters. In contrast, vacancy rates in the decentralized Greenacres and Newton Park stood steady at 6% and 20% respectively. Of concern is the boom in speculative new developments, which could result in grow-ing vacancy rates in Port Elizabeth’s decen-tralized areas (see Table 6.1).
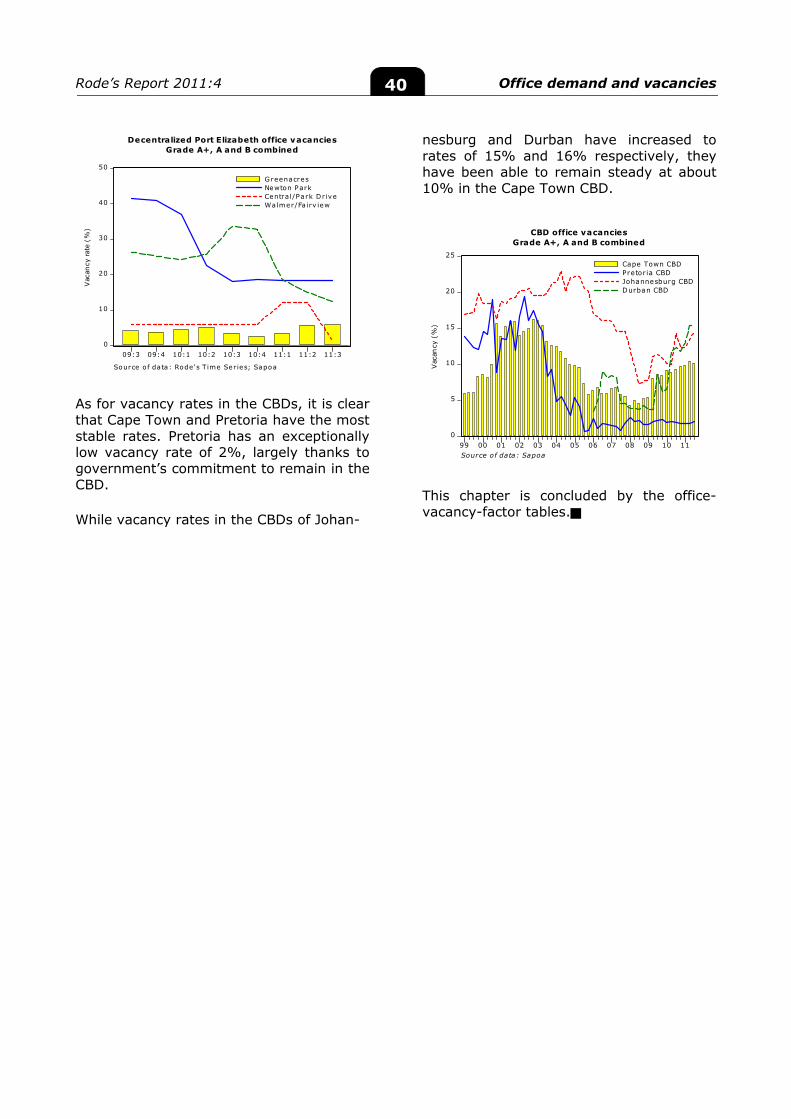
Rode’s Report 2011:4 Office demand and vacancies 40
0
5
10
15
20
25
99 00 01 02 03 04 05 06 07 08 09 10 11
Cape Town CBDPretor ia CBDJohannesburg CBDDurban CBD
CBD office vacanciesGrade A+, A and B combined
Vac
ancy
(%
)
Source of data: Sapoa
0
10
20
30
40
50
09:3 09:4 10:1 10:2 10:3 10:4 11:1 11:2 11:3
GreenacresNewton ParkCentra l/Park D r iveWalmer/Fa irv iew
Decentralized Port Elizabeth office vacanciesGrade A+, A and B combined
Vac
ancy
rat
e (%
)
Source of data: Rode's Time Ser ies; Sapoa
As for vacancy rates in the CBDs, it is clear that Cape Town and Pretoria have the most stable rates. Pretoria has an exceptionally low vacancy rate of 2%, largely thanks to government’s commitment to remain in the CBD.
While vacancy rates in the CBDs of Johan-
nesburg and Durban have increased to rates of 15% and 16% respectively, they have been able to remain steady at about 10% in the Cape Town CBD. This chapter is concluded by the office-vacancy-factor tables.
Rode’s Report 2011:4 Office demand and vacancies 41
Table 6.1 Committed new developments
As in 2011:3 Source: Sapoa
Total rentable area m2
Area available
for leasing m2
% unlet
Committed develop-
ments as % of existing
stock Johannesburg & Environs Braamfontein 2.400 2.400 100% 0% Bryanston / Epsom Downs 15.340 6.240 41% 3% Cresta/Blackheath to Randpark 30.600 3.700 12% 18% Parktown 7.400 3.500 47% 2% Fourways 10.842 5.656 52% 7% Hyde Park / Dunkeld 5.000 5.000 100% 6% Randburg 26.000 9.000 35% 6% Rosebank 88.051 18.051 21% 32% Sandton & Environs 72.407 63.407 88% 5% Sunninghill 23.191 23.191 100% 7% Cape Town & Environs CBD Cape Town 16.000 16.000 100% 2% Century City 10.500 0 0% 5% Durban & Environs Umhlanga / La Lucia 24.900 7.200 29% 10% Hillcrest/Gillits 1.559 1.559 100% 5% Westville 8.800 4.800 55% 5% Pretoria & Environs Brooklyn / Nieuw Muckleneuk / Groenkloof 4.792 3.192 67% 2%
Centurion 27.777 19.277 69% 8% Hatfield/Hillcrest - - - - Highveld Technopark & Extensions - - - - Lynwood / Menlo Park / Presequor Park - - - -
Menlyn / Faerue Glen / Ashlea Gar-dens 75.382 28.332 38% 36%
Pretoria Eastern Surburbs/Route 21 29.311 29.071 99% 8% Port Elizabeth & Environs Greenacres 4.465 3.220 72% 7% Newton Park 6.237 6.237 100% 45% Walmer/Fairview 8.900 8.900 100% 54%
Rode’s Report 2011:4 Office demand and vacancies 42
Table 6.2 Sapoa office vacancy factors (%)
Grades A+, A & B Source: Sapoa
Septem-ber 2010
December 2010
March 2011
June 2011
Septem-ber 2011
Johannesburg Bedfordview Grade A+ N/A N/A N/A N/A N/A Grade A 11,6 12,3 11,2 11,2 13,7 Grade B 17,8 17,0 17,7 17,7 25,8 Total 14,6 14,6 14,4 14,4 17,6 Braamfontein Grade A+ N/A N/A N/A N/A N/A Grade A 11,4 13,5 15,3 11,9 14,6 Grade B 14,3 15,7 13,3 1,2 14,6 Total 12,8 14,5 14,4 6,9 14,6 Bryanston / Epsom Downs
Grade A+ N/A N/A N/A N/A N/A Grade A 9,8 11,4 11,7 7,2 6,9 Grade B 27,9 28,3 28,2 33,5 26,3 Total 11,0 12,4 12,7 8,8 8,0 Bruma Grade A+ N/A N/A N/A N/A N/A Grade A 0,0 2,0 2,0 2,0 3,8 Grade B 18,9 18,9 18,9 18,9 15,4 Total 12,3 13,0 13,0 13,0 10,9 CBD Johannesburg Grade A+ 0,0 0,0 0,0 0,0 0,0 Grade A 6,6 6,8 6,9 7,1 8,3 Grade B 26,0 20,6 20,1 22,0 23,3 Total 14,3 12,3 12,3 13,4 14,5 Constantia Kloof Basin Grade A+ N/A N/A N/A N/A N/A Grade A 8,9 10,3 10,2 8,4 8,0 Grade B 11,5 12,5 4,6 4,3 9,5 Total 9,0 10,4 9,9 8,2 8,1 Fourways Grade A+ N/A N/A N/A N/A N/A Grade A 13,3 8,9 10,5 10,5 9,8 Grade B 11,5 15,5 0,0 0,0 0,0 Total 13,2 9,2 10,0 10,0 9,3 Houghton/Killarney Grade A+ N/A N/A N/A N/A N/A Grade A 3,7 2,1 1,0 2,7 0,7 Grade B 1,7 10,3 12,7 13,8 6,4 Total 3,2 4,3 4,2 5,7 2,2 Source of data: Sapoa
Rode’s Report 2011:4 Office demand and vacancies 43
Table 6.2 (continued) Sapoa office vacancy factors (%)
Grades A+, A & B
Septem-ber 2010
December 2010
March 2011
June 2011
Septem-ber 2011
Hyde Park / Dunkeld Grade A+ N/A N/A N/A N/A N/A Grade A 13,3 17,1 19,2 15,8 11,2 Grade B 11,1 8,5 8,5 10,6 13,6 Total 11,7 10,9 11,5 12,1 12,9 Illovo Grade A+ N/A N/A 5,0 5,9 5,9 Grade A 3,1 2,3 2,1 1,2 1,0 Grade B 15,3 14,5 8,6 10,2 12,1 Total 5,1 4,2 3,2 2,7 2,9 Melrose/Waverley Grade A+ 4,0 3,4 3,1 3,2 1,9 Grade A 15,6 15,6 13,2 13,2 11,0 Grade B 6,1 6,2 5,3 5,3 8,3 Total 6,7 6,3 5,5 5,6 4,6 Midrand Grade A+ 0,0 0,0 0,0 0,0 0,0 Grade A 4,5 3,9 2,8 2,5 3,6 Grade B 11,7 11,7 10,9 11,7 10,0 Total 6,0 5,8 5,1 5,3 5,0 Milpark Grade A+ N/A N/A N/A N/A N/A Grade A 0,0 0,0 0,0 0,0 0,0 Grade B 4,3 3,6 3,5 5,0 5,0 Total 3,8 3,2 3,0 4,4 4,3 Morningside Grade A+ N/A N/A N/A N/A N/A Grade A 5,1 3,7 4,3 4,9 6,6 Grade B N/A N/A N/A N/A N/A Total 5,1 3,7 4,3 4,9 6,6 Parktown Grade A+ N/A N/A N/A N/A N/A Grade A 3,4 2,2 1,1 4,1 3,4 Grade B 4,7 2,9 3,2 8,6 13,9 Total 4,3 2,6 2,4 7,2 10,3 Randburg Grade A+ N/A N/A N/A N/A N/A Grade A 12,6 24,6 17,9 17,9 8,2 Grade B 7,9 13,2 13,4 15,0 14,1 Total 8,2 14,1 13,7 15,2 13,6 Source of data: Sapoa
Rode’s Report 2011:4 Office demand and vacancies 44
Table 6.2 (continued)
Sapoa office vacancy factors (%) Grades A+, A & B
Septem-ber 2010
Decem-ber 2010
March 2011
June 2011
Septem-ber 2011
Rivonia Grade A+ 0,0 0,0 0,0 0,0 0,0 Grade A 20,4 20,7 17,7 13,8 13,8 Grade B 11,0 10,8 13,0 12,5 14,4 Total 13,5 13,8 14,5 12,9 14,2 Rosebank Grade A+ N/A N/A N/A N/A N/A Grade A 20,1 21,0 23,2 16,6 14,0 Grade B 3,4 5,4 2,6 3,0 5,0 Total 10,7 12,2 11,7 9,1 9,1 Sandton & environs Grade A+ 0,8 0,8 0,0 0,0 4,0 Grade A 10,2 8,6 8,4 8,4 7,0 Grade B 16,2 13,5 16,0 15,5 13,8 Total 10,0 8,4 8,6 8,3 8,9 Sunninghill Grade A+ N/A N/A N/A N/A N/A Grade A 8,8 7,0 7,3 7,9 7,3 Grade B N/A N/A N/A N/A N/A Total 8,8 7,0 7,3 7,9 7,3 Woodmead Grade A+ N/A N/A N/A N/A N/A Grade A 10,7 10,4 10,4 9,2 8,5 Grade B 24,6 23,1 21,9 24,0 24,4 Total 11,4 11,1 11,0 9,9 9,3
Cape Town
Bellville (incl. Tyger V) Grade A+ 1,4 0,2 N/A N/A N/A Grade A 5,8 5,5 5,5 6,3 7,2 Grade B 8,7 8,5 7,8 8,1 13,9 Total 6,2 5,9 6,2 6,8 9,2 CBD Cape Town Grade A+ 1,9 1,1 0,0 0,0 0,0 Grade A 10,3 10,8 10,8 11,6 11,5 Grade B 8,7 9,2 8,8 9,0 8,5 Total 9,3 9,7 9,8 10,4 10,2 Century City Grade A+ 14,6 14,6 N/A N/A N/A Grade A 9,8 10,1 10,7 10,6 9,3 Grade B 7,6 8,3 5,9 7,4 4,4 Total 10,2 10,5 10,2 10,2 8,7 Source of data: Sapoa
Rode’s Report 2011:4 Office demand and vacancies 45
Table 6.2 (continued) Sapoa office vacancy factors (%)
Grades A+, A & B
Septem-ber 2010
Decem-ber 2010
March 2011
June 2011
Septem-ber 2011
Claremont Grade A+ N/A N/A N/A N/A N/A Grade A 17,0 17,4 14,7 15,1 11,9 Grade B 4,0 4,7 3,4 2,4 11,8 Total 14,7 15,1 12,7 12,8 11,9 Pinelands Grade A+ N/A N/A N/A N/A N/A Grade A 7,3 6,5 5,0 4,3 4,3 Grade B 1,6 1,1 1,8 3,8 4,8 Total 6,8 6,1 4,8 4,3 4,3 Rondebosch/Newlands Grade A+ N/A N/A N/A N/A N/A Grade A 6,7 4,8 4,8 5,7 6,5 Grade B 4,6 9,3 8,6 6,2 7,6 Total 6,1 6,1 5,9 5,9 6,8 V&A Waterfront Grade A+ 0,0 0,0 0,0 0,0 4,3 Grade A 5,4 4,2 4,8 6,8 6,4 Grade B 10,4 8,7 15,0 6,7 8,8 Total 3,6 2,9 3,7 3,9 5,7
Durban
Berea Grade A+ N/A N/A N/A N/A N/A Grade A 1,6 4,4 4,7 4,7 17,0 Grade B 23,5 25,3 24,7 22,8 20,6 Total 14,1 16,3 16,5 14,9 18,9 CBD Durban Grade A+ N/A N/A N/A N/A N/A Grade A 18,4 18,1 19,0 19,8 19,8 Grade B 7,7 6,7 8,3 11,8 12,2 Total 12,3 11,7 13,0 15,3 15,6 Umhlanga / La Lucia Grade A+ 3,9 2,9 2,1 2,1 2,1 Grade A 3,5 4,9 8,0 6,4 7,5 Grade B 2,4 6,3 6,3 7,4 2,8 Total 3,4 5,0 7,7 6,5 6,8 Westville Grade A+ N/A N/A N/A N/A N/A Grade A 2,3 2,4 2,2 1,4 4,3 Grade B 6,8 6,3 5,8 5,4 8,3 Total 4,6 4,4 4,2 3,6 6,5 Source of data: Sapoa
Rode’s Report 2011:4 Office demand and vacancies 46
Table 6.2 (continued) Sapoa office vacancy factors (%)
Grades A+, A & B
Septem-ber 2010
December 2010
March 2011
June 2011
Septem-ber 2011
Pretoria Arcadia Grade A+ N/A N/A N/A N/A N/A Grade A 4,9 3,3 5,0 5,0 5,1 Grade B 8,0 6,0 3,8 3,8 6,7 Total 5,7 4,0 4,7 4,7 5,5 Brooklyn Grade A+ 1,4 3,7 N/A N/A N/A Grade A 2,1 2,0 1,2 1,5 1,8 Grade B 3,6 0,7 4,2 3,4 5,8 Total 2,3 1,9 1,9 2,0 2,7 CBD Pretoria Grade A+ N/A N/A N/A N/A N/A Grade A 0,7 0,7 0,7 0,7 0,9 Grade B 2,4 2,4 2,4 2,4 2,6 Total 1,8 1,8 1,8 1,8 2,0 Centurion Grade A+ N/A N/A N/A N/A N/A Grade A 6,7 6,3 6,2 8,2 9,4 Grade B 13,8 7,7 9,1 11,3 12,4 Total 10,9 7,1 7,9 9,9 11,1 Hatfield/Hillcrest Grade A+ N/A N/A N/A N/A N/A Grade A 2,2 3,0 5,8 7,7 8,9 Grade B 8,9 12,6 14,8 12,8 13,7 Total 6,1 8,9 11,3 10,7 11,8 Highveld Technopark Grade A+ N/A N/A N/A N/A N/A Grade A 4,1 7,0 7,6 9,0 7,1 Grade B 4,2 4,2 8,2 10,5 8,5 Total 4,1 6,4 7,7 9,4 7,5 Menlyn Grade A+ N/A N/A N/A N/A N/A Grade A 3,3 4,4 5,0 4,0 4,0 Grade B 16,6 18,0 19,3 25,4 9,1 Total 6,3 7,5 8,3 10,1 5,1 Source of data: Sapoa
Rode’s Report 2011:4 Office demand and vacancies 47
Table 6.2 (continued)
Sapoa office vacancy factors (%) Grades A+, A & B
Septem-ber 2010
December 2010
March 2011
June 2011
Septem-ber 2011
Pretoria Eastern Suburbs Grade A+ N/A N/A N/A N/A N/A Grade A 9,0 13,5 13,0 10,5 9,6 Grade B 5,9 6,1 5,3 5,3 1,7 Total 7,6 10,1 9,4 8,3 6,2 Lynnwood Grade A+ N/A N/A N/A 1,3 1,3 Grade A 4,5 4,6 2,9 8,2 8,4 Grade B 6,4 6,7 6,4 6,6 9,8 Total 5,5 5,7 4,6 6,5 8,0
Port Elizabeth
Greenacres Grade A+ N/A N/A 0,00 0,00 0,00 Grade A 1,5 2,08 3,85 0,00 0,00 Grade B 5,0 2,99 2,99 6,90 7,07 Total 3,4 2,6 3,4 5,8 5,9 Newton Park Grade A+ N/A N/A 17,56 17,56 17,56 Grade A 18,2 18,25 13,34 13,34 13,34 Grade B 17,7 19,84 22,89 22,89 22,89 Total 18,1 18,5 18,2 18,2 18,2 Central / Park Drive Grade A+ N/A N/A N/A N/A N/A Grade A N/A N/A N/A N/A N/A Grade B 5,9 5,93 12,10 12,13 1,22 Total 5,9 5,9 12,1 12,1 1,2 Walmer/Fairview Grade A+ N/A N/A N/A N/A N/A Grade A 35,2 33,61 13,50 13,50 11,04 Grade B 30,5 31,20 28,82 17,93 14,92 Total 33,7 32,8 18,6 15,00 12,3 Johannesburg central Grade A+ 0,0 0,00 0,00 0,00 0,00 Grade A 7,8 8,28 8,81 8,29 9,78 Grade B 23,2 19,44 18,52 17,37 21,39 Total 14,0 12,7 12,7 12,0 14,5 Source of data: Sapoa
Rode’s Report 2011:4 Office demand and vacancies 48
Table 6.2 (continued)
Sapoa office vacancy factors (%) Grades A+, A & B
Johannesburg decentral-ized
Grade A+ 1,0 0,86 0,59 0,58 1,92 Grade A 9,2 8,86 8,77 7,75 7,09 Grade B 9,9 10,50 10,75 12,04 12,59 Total 9,0 9,00 9,00 8,7 8,8 Pretoria decentralized Grade A+ 1,1 1,59 1,73 1,33 1,31 Grade A 6,5 8,14 8,16 9,78 8,47 Grade B 8,8 7,83 8,90 9,96 9,06 Total 6,2 6,6 7,16 8,06 7,5 Durban decentralized Grade A+ 3,9 2,89 2,12 2,12 2,12 Grade A 2,8 4,09 6,00 4,90 7,45 Grade B 10,7 11,31 10,36 9,50 9,82 Total 5,6 6,5 7,6 6,5 8,3 Cape Town decentralized Grade A+ 4,5 4,0 0,0 0,0 4,3 Grade A 8,1 7,7 7,3 7,6 7,4 Grade B 7,2 7,7 7,08 6,9 11,0 Total 7,6 7,4 7,0 7,2 8,0
National summaries
National decentralised
Grade A+ 1,4 1,5 1,1 0,9 1,7 Grade A 8,3 8,3 8,3 7,9 7,4 Grade B 9,4 9,5 10,0 10,9 11,3 Total 8,2 8,2 8,3 8,3 8,4 National CBDs
Grade A+ 0,3 0,16 0,00 0,00 0,00 Grade A 8,8 9,2 9,6 9,6 10,4 Grade B 14,7 12,9 12,6 12,6 14,6 Total 12,1 11,7 11,8 11,7 13,0 Source of data: Sapoa
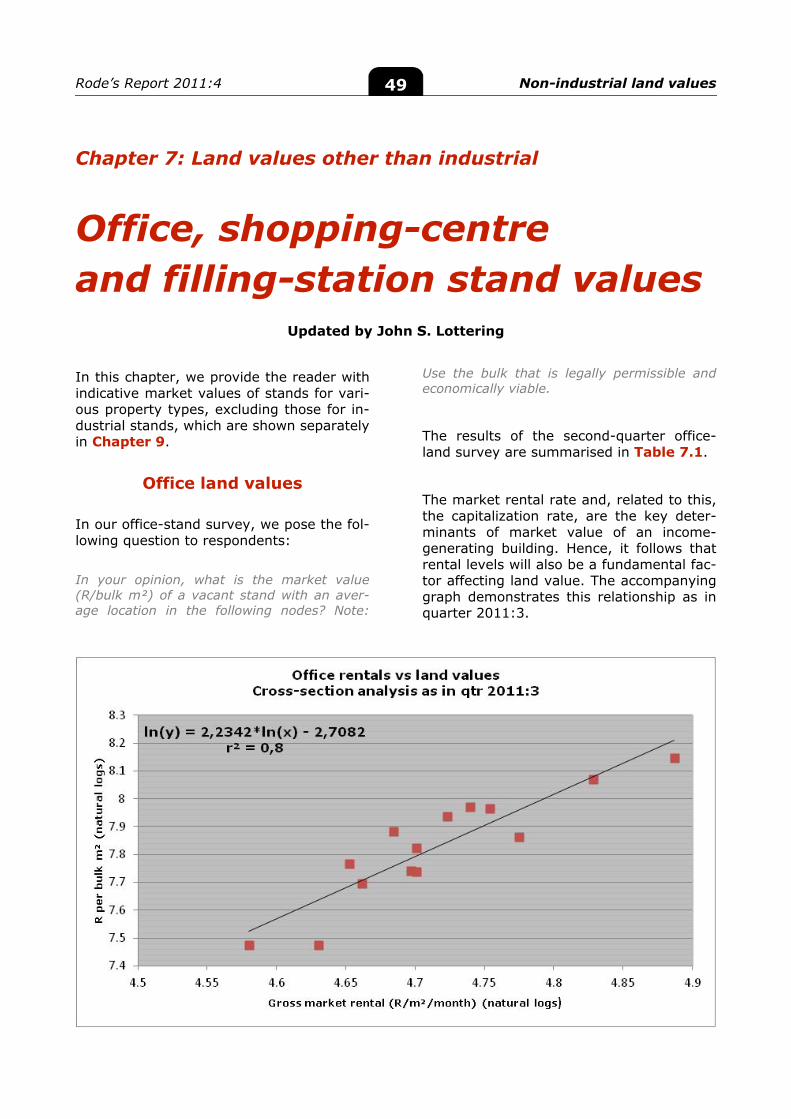
Rode’s Report 2011:4 Non-industrial land values 49
Chapter 7: Land values other than industrial
Office, shopping-centre and filling-station stand values
Updated by John S. Lottering
In this chapter, we provide the reader with indicative market values of stands for vari-ous property types, excluding those for in-dustrial stands, which are shown separately in Chapter 9.
Office land values
In our office-stand survey, we pose the fol-lowing question to respondents:
In your opinion, what is the market value (R/bulk m²) of a vacant stand with an aver-age location in the following nodes? Note:
Use the bulk that is legally permissible and economically viable.
The results of the second-quarter office-land survey are summarised in Table 7.1.
The market rental rate and, related to this, the capitalization rate, are the key deter-minants of market value of an income-generating building. Hence, it follows that rental levels will also be a fundamental fac-tor affecting land value. The accompanying graph demonstrates this relationship as in quarter 2011:3.
Rode’s Report 2011:4 Non-industrial land values 50
Bulk explained
The market value of office land and shopping-centre land is generally expressed as the value per bulk square metre.
Bulk square metre refers to the gross building area (GBA) of a building. According to The Sapoa Method for Measuring Floor Areas in Commercial and Industrial Buildings, GBA covers:
“The entire building area, but it excludes patios, plant boxes, sun-screening, escape stairs, machine rooms, parking (basements or above ground), lift-motor rooms, service rooms, caretakers’ flats, etc.
“GBA is mainly used by planning consultants in order to plan and execute a building in ac-cordance with the permissible Floor Area Ratio (FAR) as derived from the zoning of the prop-erty.
“GBA is fixed for the life of the building but it should be noted that different local authorities may interpret the National Building Regulations that regulate the FAR definition in a slightly different manner.”
The reader will note that we regressed the natural logs of the market-rental rates of existing prime office buildings in the vari-ous office nodes (see Chapter 5) on their corresponding land values (as reported in this article), also in natural log form. When using natural logs, the beta coefficient of the independent or predictor variable (i.e. gross market rental), is a handy tool to gauge the impact of a change in the pre-dictor on the dependent variable (land val-ue).
The regression line (or line of best fit) has the following equation:
Bulk land value = 2,342*ln(gross mar-ket rental) – 2,7082
where
bulk land value = land value in rands per bulk m²
gross market rental = gross market rental per rentable m² per month achieved on existing prime office build-ings in a node.
The regression equation is based on the information from 14 office nodes.
Consider, for example, the case of a node where grade-A office rentals for existing buildings are currently around R90/m²/month. What is the most likely of-fice-land value for this node? First, the reader would have to calculate the natural log of R90, which is roughly equal to 4,5; and then plug this into our regression equation as below.
Bulk land value = exp((2,342*4,5) – 2,7082) ≈ R1549/bulk m²
Note that this equation should rather not be used to estimate the land values for nodes with average grade-A office rentals of less than R97/m², or greater than R132/m².
The function exp is also an Excel func-tion, and is represented as ex on most scientific or business calculators ― where e (≈ 2,718) is the base of the natural logarithm (ln).
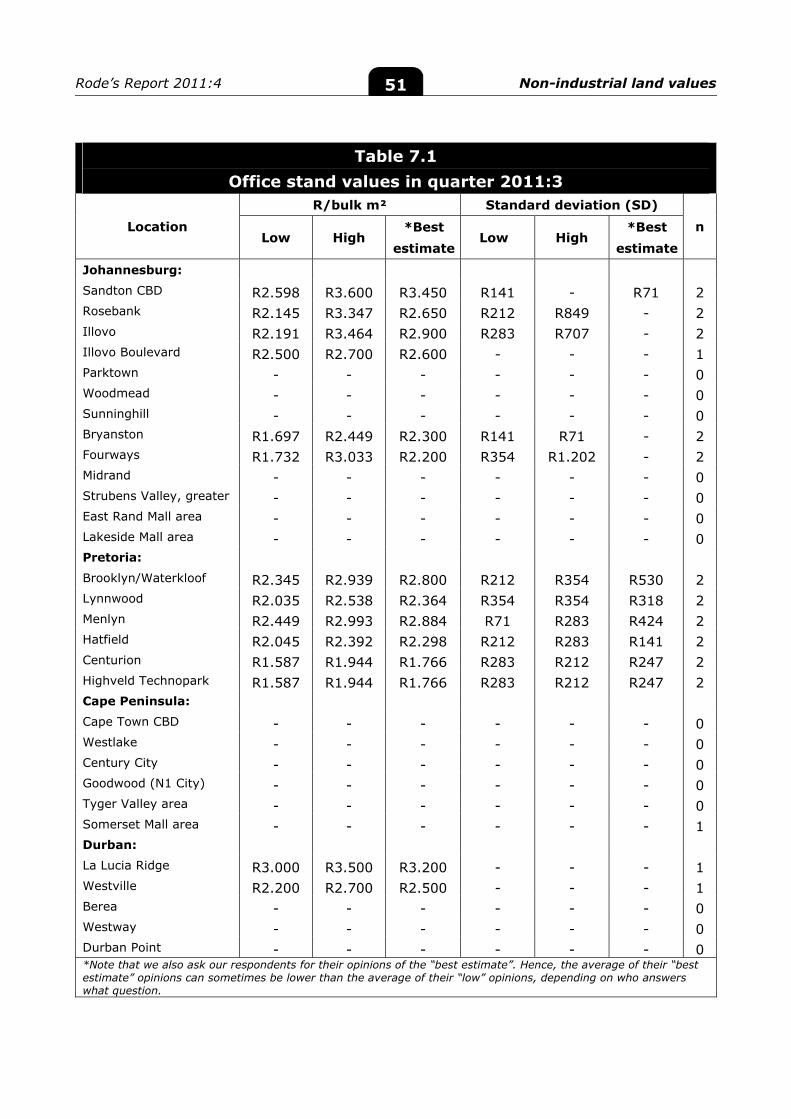
Rode’s Report 2011:4 Non-industrial land values 51
Table 7.1 Office stand values in quarter 2011:3
Location
R/bulk m² Standard deviation (SD)
n Low High
*Best estimate
Low High *Best
estimate Johannesburg:
Sandton CBD R2.598 R3.600 R3.450 R141 - R71 2 Rosebank R2.145 R3.347 R2.650 R212 R849 - 2 Illovo R2.191 R3.464 R2.900 R283 R707 - 2 Illovo Boulevard R2.500 R2.700 R2.600 - - - 1 Parktown - - - - - - 0 Woodmead - - - - - - 0 Sunninghill - - - - - - 0 Bryanston R1.697 R2.449 R2.300 R141 R71 - 2 Fourways R1.732 R3.033 R2.200 R354 R1.202 - 2 Midrand - - - - - - 0 Strubens Valley, greater - - - - - - 0 East Rand Mall area - - - - - - 0 Lakeside Mall area - - - - - - 0 Pretoria: Brooklyn/Waterkloof R2.345 R2.939 R2.800 R212 R354 R530 2 Lynnwood R2.035 R2.538 R2.364 R354 R354 R318 2 Menlyn R2.449 R2.993 R2.884 R71 R283 R424 2 Hatfield R2.045 R2.392 R2.298 R212 R283 R141 2 Centurion R1.587 R1.944 R1.766 R283 R212 R247 2 Highveld Technopark R1.587 R1.944 R1.766 R283 R212 R247 2 Cape Peninsula: Cape Town CBD - - - - - - 0 Westlake - - - - - - 0 Century City - - - - - - 0 Goodwood (N1 City) - - - - - - 0 Tyger Valley area - - - - - - 0 Somerset Mall area - - - - - - 1 Durban: La Lucia Ridge R3.000 R3.500 R3.200 - - - 1 Westville R2.200 R2.700 R2.500 - - - 1 Berea - - - - - - 0 Westway - - - - - - 0 Durban Point - - - - - - 0 *Note that we also ask our respondents for their opinions of the “best estimate”. Hence, the average of their “best estimate” opinions can sometimes be lower than the average of their “low” opinions, depending on who answers what question.
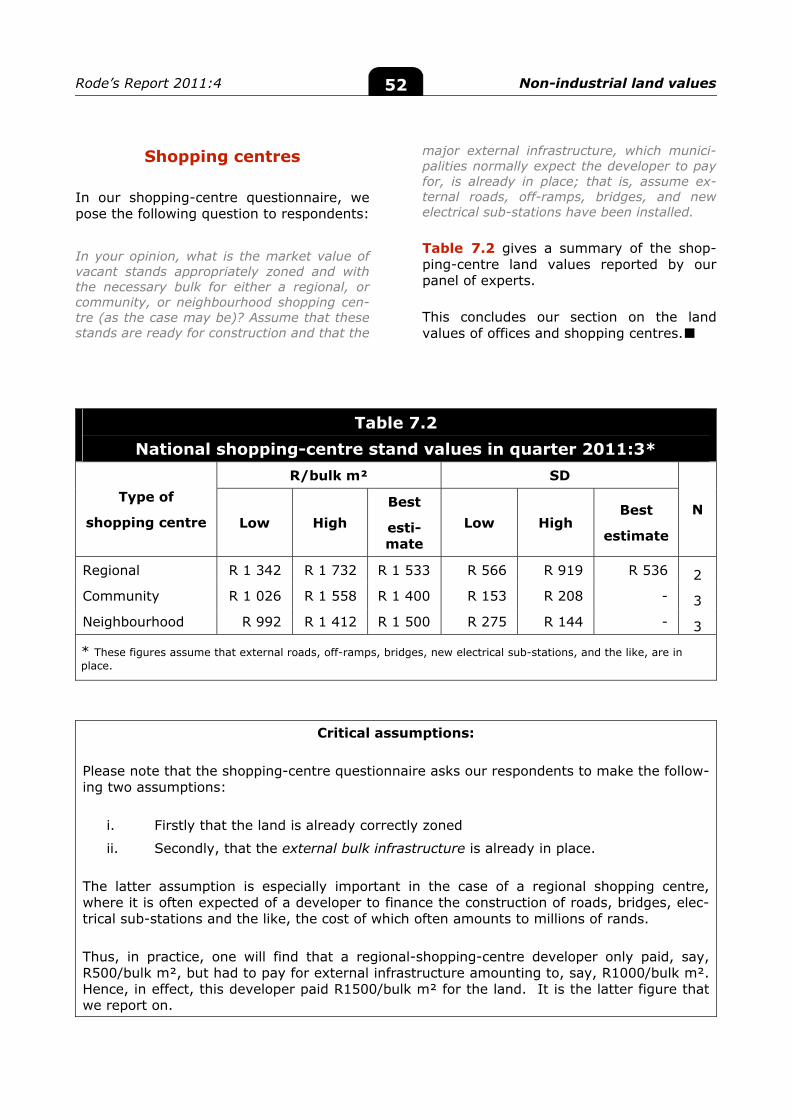
Rode’s Report 2011:4 Non-industrial land values 52
Shopping centres
In our shopping-centre questionnaire, we pose the following question to respondents:
In your opinion, what is the market value of vacant stands appropriately zoned and with the necessary bulk for either a regional, or community, or neighbourhood shopping cen-tre (as the case may be)? Assume that these stands are ready for construction and that the
major external infrastructure, which munici-palities normally expect the developer to pay for, is already in place; that is, assume ex-ternal roads, off-ramps, bridges, and new electrical sub-stations have been installed.
Table 7.2 gives a summary of the shop-ping-centre land values reported by our panel of experts.
This concludes our section on the land values of offices and shopping centres.■
Table 7.2 National shopping-centre stand values in quarter 2011:3*
Type of
shopping centre
R/bulk m² SD
N Low High
Best
esti-mate
Low High Best
estimate
Regional R 1 342 R 1 732 R 1 533 R 566 R 919 R 536 2 Community R 1 026 R 1 558 R 1 400 R 153 R 208 - 3 Neighbourhood R 992 R 1 412 R 1 500 R 275 R 144 - 3
* These figures assume that external roads, off-ramps, bridges, new electrical sub-stations, and the like, are in place.
Critical assumptions:
Please note that the shopping-centre questionnaire asks our respondents to make the follow-ing two assumptions:
i. Firstly that the land is already correctly zoned
ii. Secondly, that the external bulk infrastructure is already in place.
The latter assumption is especially important in the case of a regional shopping centre, where it is often expected of a developer to finance the construction of roads, bridges, elec-trical sub-stations and the like, the cost of which often amounts to millions of rands.
Thus, in practice, one will find that a regional-shopping-centre developer only paid, say, R500/bulk m², but had to pay for external infrastructure amounting to, say, R1000/bulk m². Hence, in effect, this developer paid R1500/bulk m² for the land. It is the latter figure that we report on.
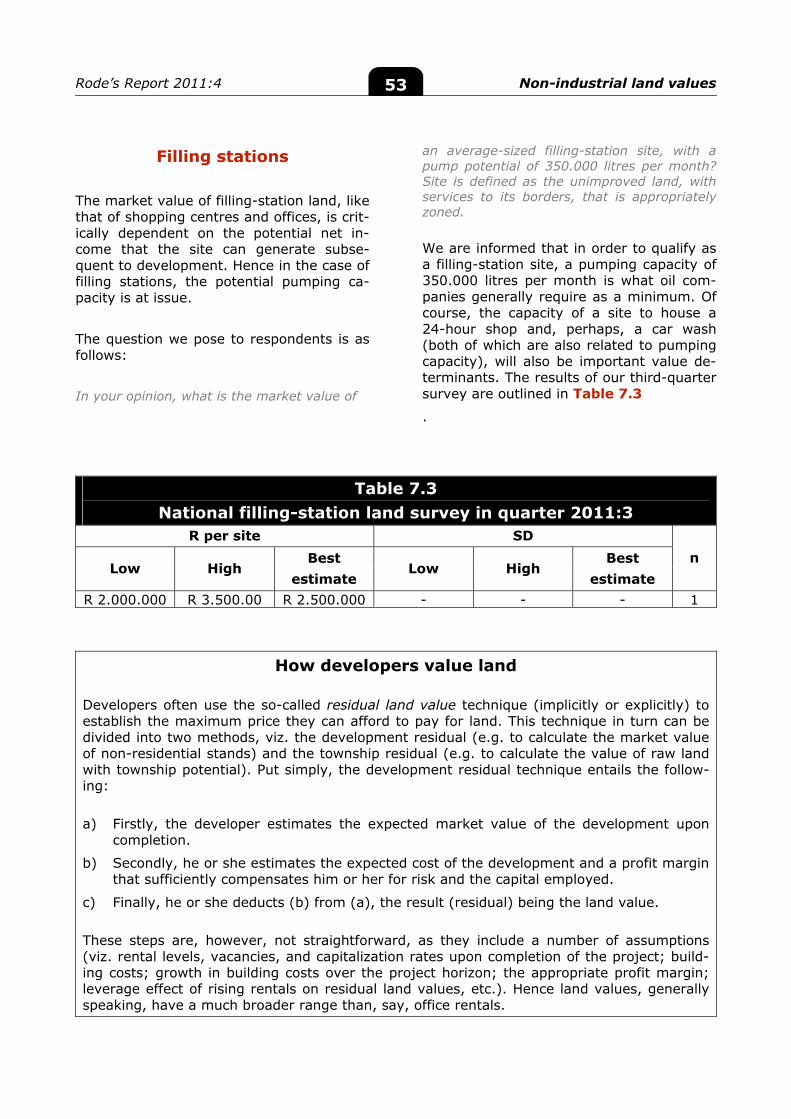
Rode’s Report 2011:4 Non-industrial land values 53
Filling stations
The market value of filling-station land, like that of shopping centres and offices, is crit-ically dependent on the potential net in-come that the site can generate subse-quent to development. Hence in the case of filling stations, the potential pumping ca-pacity is at issue.
The question we pose to respondents is as follows:
In your opinion, what is the market value of
an average-sized filling-station site, with a pump potential of 350.000 litres per month? Site is defined as the unimproved land, with services to its borders, that is appropriately zoned.
We are informed that in order to qualify as a filling-station site, a pumping capacity of 350.000 litres per month is what oil com-panies generally require as a minimum. Of course, the capacity of a site to house a 24-hour shop and, perhaps, a car wash (both of which are also related to pumping capacity), will also be important value de-terminants. The results of our third-quarter survey are outlined in Table 7.3
.
Table 7.3
National filling-station land survey in quarter 2011:3 R per site SD
n Low High
Best estimate
Low High Best
estimate R 2.000.000 R 3.500.00 R 2.500.000 - - - 1
How developers value land
Developers often use the so-called residual land value technique (implicitly or explicitly) to establish the maximum price they can afford to pay for land. This technique in turn can be divided into two methods, viz. the development residual (e.g. to calculate the market value of non-residential stands) and the township residual (e.g. to calculate the value of raw land with township potential). Put simply, the development residual technique entails the follow-ing:
a) Firstly, the developer estimates the expected market value of the development upon completion.
b) Secondly, he or she estimates the expected cost of the development and a profit margin that sufficiently compensates him or her for risk and the capital employed.
c) Finally, he or she deducts (b) from (a), the result (residual) being the land value.
These steps are, however, not straightforward, as they include a number of assumptions (viz. rental levels, vacancies, and capitalization rates upon completion of the project; build-ing costs; growth in building costs over the project horizon; the appropriate profit margin; leverage effect of rising rentals on residual land values, etc.). Hence land values, generally speaking, have a much broader range than, say, office rentals.
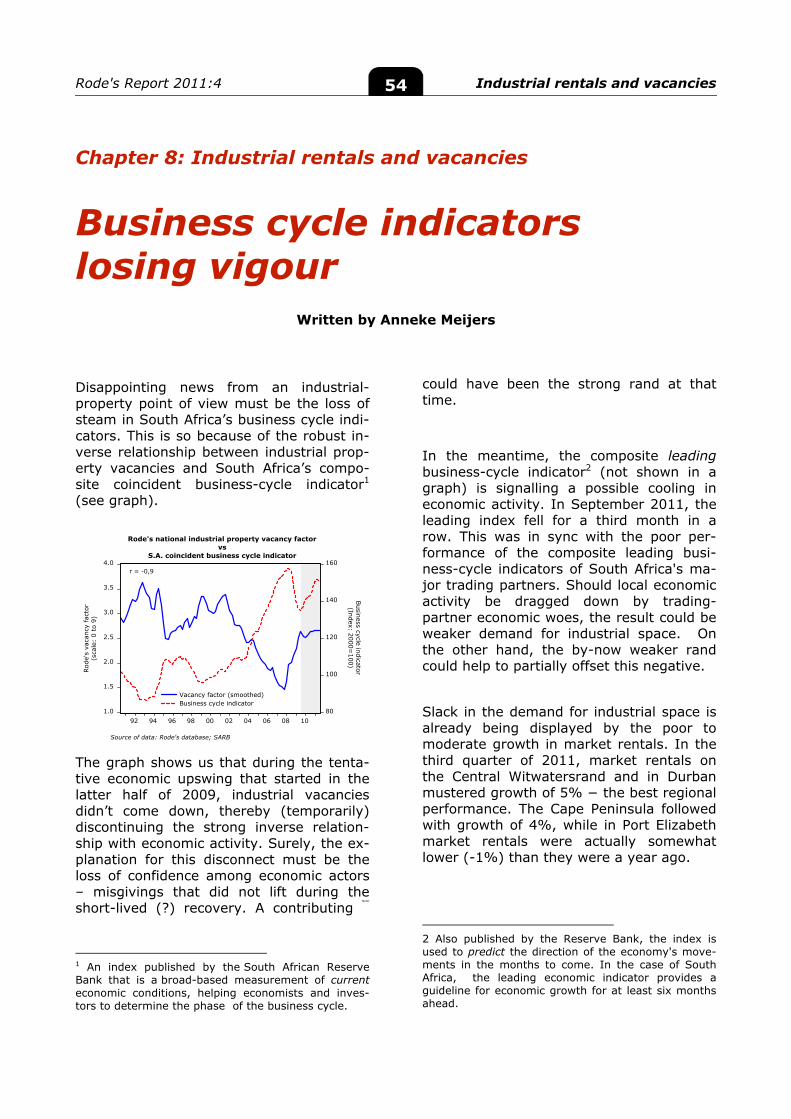
Rode's Report 2011:4 Industrial rentals and vacancies 54
1.0
1.5
2.0
2.5
3.0
3.5
4.0
80
100
120
140
160
92 94 96 98 00 02 04 06 08 10
Vacancy factor (smoothed)Business cycle indicator
Rode's national industrial property vacancy factorvs
S.A. coincident business cycle indicator
r = -0,9
Rod
e's
vaca
ncy
fact
or(s
cale
: 0
to 9
)
Business cycle indicator(Index: 2000=
100)
Source of data: Rode's database; SARB
Chapter 8: Industrial rentals and vacancies
Business cycle indicators losing vigour
Written by Anneke Meijers
Disappointing news from an industrial-property point of view must be the loss of steam in South Africa’s business cycle indi-cators. This is so because of the robust in-verse relationship between industrial prop-erty vacancies and South Africa’s compo-site coincident business-cycle indicator1 (see graph).
The graph shows us that during the tenta-tive economic upswing that started in the latter half of 2009, industrial vacancies didn’t come down, thereby (temporarily) discontinuing the strong inverse relation-ship with economic activity. Surely, the ex-planation for this disconnect must be the loss of confidence among economic actors – misgivings that did not lift during the short-lived (?) recovery. A contributing
factor
1 An index published by the South African Reserve Bank that is a broad-based measurement of current economic conditions, helping economists and inves-tors to determine the phase of the business cycle.
could have been the strong rand at that time.
In the meantime, the composite leading business-cycle indicator2 (not shown in a graph) is signalling a possible cooling in economic activity. In September 2011, the leading index fell for a third month in a row. This was in sync with the poor per-formance of the composite leading busi-ness-cycle indicators of South Africa's ma-jor trading partners. Should local economic activity be dragged down by trading-partner economic woes, the result could be weaker demand for industrial space. On the other hand, the by-now weaker rand could help to partially offset this negative.
Slack in the demand for industrial space is already being displayed by the poor to moderate growth in market rentals. In the third quarter of 2011, market rentals on the Central Witwatersrand and in Durban mustered growth of 5% − the best regional performance. The Cape Peninsula followed with growth of 4%, while in Port Elizabeth market rentals were actually somewhat lower (-1%) than they were a year ago.
2 Also published by the Reserve Bank, the index is used to predict the direction of the economy's move-ments in the months to come. In the case of South Africa, the leading economic indicator provides a guideline for economic growth for at least six months ahead.
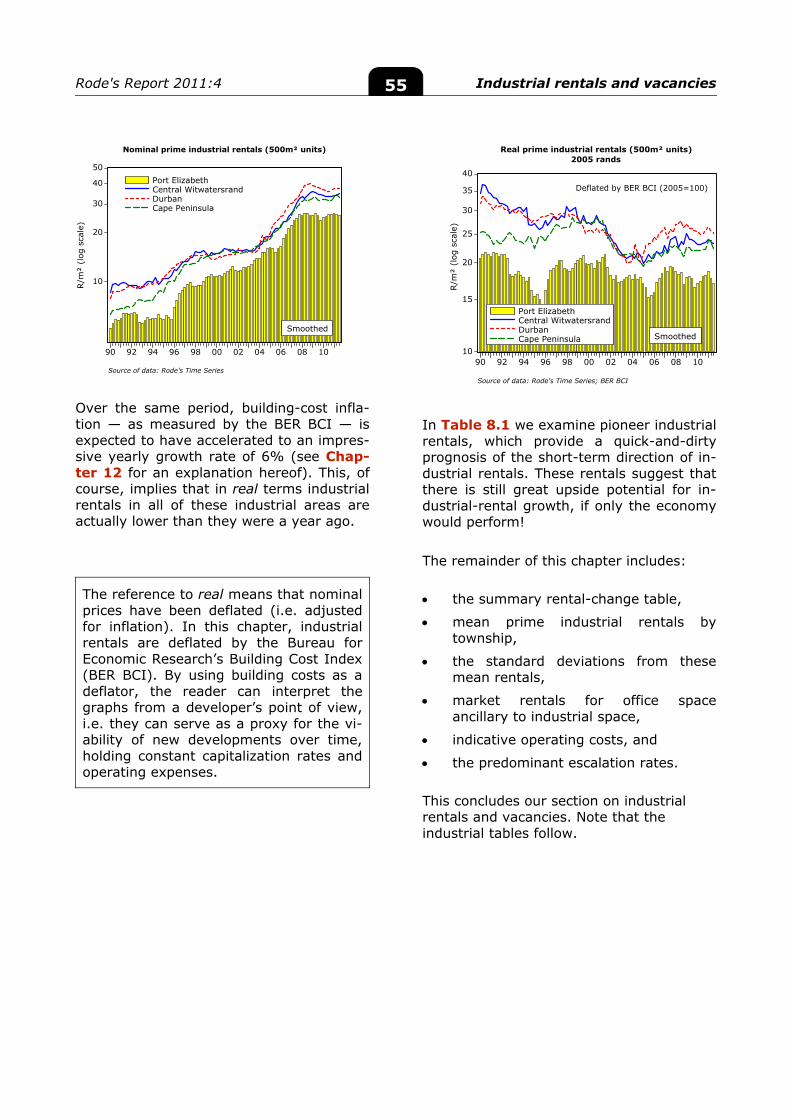
Rode's Report 2011:4 Industrial rentals and vacancies 55
10
20
30
40
50
90 92 94 96 98 00 02 04 06 08 10
Port ElizabethCentral WitwatersrandDurbanCape Peninsula
Nominal prime industrial rentals (500m² units)
R/m
² (l
og s
cale
)
Source of data: Rode's Time Series
Smoothed
10
15
20
25
30
35
40
90 92 94 96 98 00 02 04 06 08 10
Port ElizabethCentral WitwatersrandDurbanCape Peninsula
Real prime industrial rentals (500m² units)2005 rands
R/m
² (l
og s
cale
)
Source of data: Rode's Time Series; BER BCI
Smoothed
Deflated by BER BCI (2005=100)
Over the same period, building-cost infla-tion — as measured by the BER BCI — is expected to have accelerated to an impres-sive yearly growth rate of 6% (see Chap-ter 12 for an explanation hereof). This, of course, implies that in real terms industrial rentals in all of these industrial areas are actually lower than they were a year ago.
The reference to real means that nominal prices have been deflated (i.e. adjusted for inflation). In this chapter, industrial rentals are deflated by the Bureau for Economic Research’s Building Cost Index (BER BCI). By using building costs as a deflator, the reader can interpret the graphs from a developer’s point of view, i.e. they can serve as a proxy for the vi-ability of new developments over time, holding constant capitalization rates and operating expenses.
In Table 8.1 we examine pioneer industrial rentals, which provide a quick-and-dirty prognosis of the short-term direction of in-dustrial rentals. These rentals suggest that there is still great upside potential for in-dustrial-rental growth, if only the economy would perform!
The remainder of this chapter includes:
the summary rental-change table,
mean prime industrial rentals by township,
the standard deviations from these mean rentals,
market rentals for office space ancillary to industrial space,
indicative operating costs, and
the predominant escalation rates.
This concludes our section on industrial rentals and vacancies. Note that the industrial tables follow.
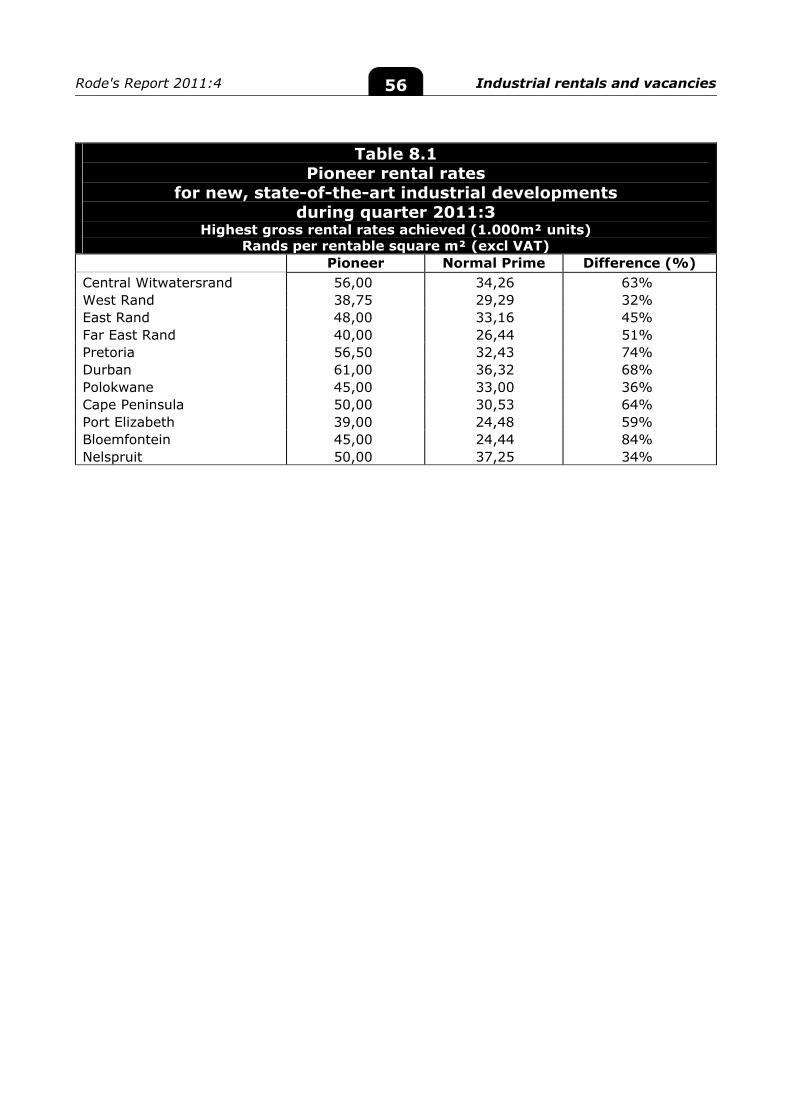
Rode's Report 2011:4 Industrial rentals and vacancies 56
Table 8.1 Pioneer rental rates
for new, state-of-the-art industrial developments during quarter 2011:3
Highest gross rental rates achieved (1.000m² units) Rands per rentable square m² (excl VAT)
Pioneer Normal Prime Difference (%) Central Witwatersrand 56,00 34,26 63% West Rand 38,75 29,29 32% East Rand 48,00 33,16 45% Far East Rand 40,00 26,44 51% Pretoria 56,50 32,43 74% Durban 61,00 36,32 68% Polokwane 45,00 33,00 36% Cape Peninsula 50,00 30,53 64% Port Elizabeth 39,00 24,48 59% Bloemfontein 45,00 24,44 84% Nelspruit 50,00 37,25 34%
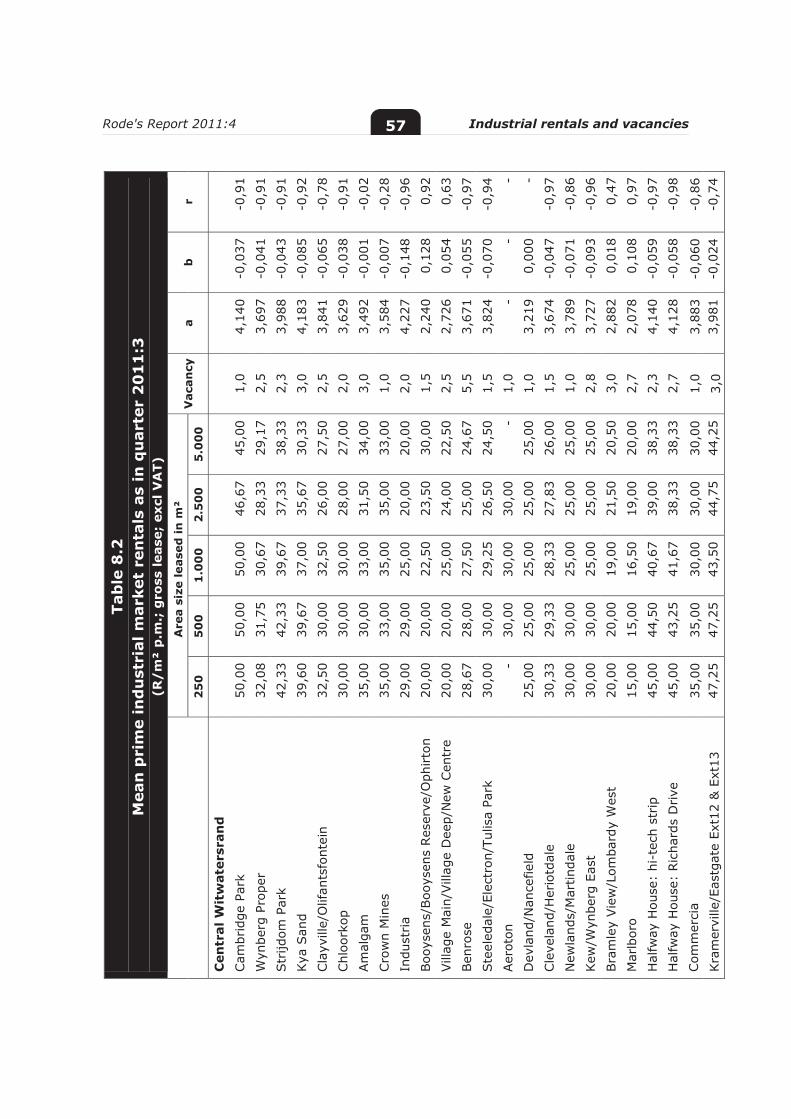
Rode's Report 2011:4 Industrial rentals and vacancies 57
Tab
le 8
.2
Mea
n p
rim
e in
du
stri
al m
arke
t re
nta
ls a
s in
qu
arte
r 2
01
1:3
(R
/m
² p
.m.;
gro
ss le
ase;
exc
l VA
T)
A
rea
size
leas
ed in
m²
Vac
ancy
a
b
r 2
50
5
00
1
.00
0
2.5
00
5
.00
0
Cen
tral
Wit
wat
ersr
and
Cam
brid
ge P
ark
50
,00
50,0
0 50
,00
46,6
7 45
,00
1,0
4,14
0 -0
,037
-0
,91
Wyn
berg
Pro
per
32
,08
31,7
5 30
,67
28,3
3 29
,17
2,5
3,69
7 -0
,041
-0
,91
Str
ijdom
Par
k
42,3
3 42
,33
39,6
7 37
,33
38,3
3 2,
3 3,
988
-0,0
43
-0,9
1 Kya
San
d
39,6
0 39
,67
37,0
0 35
,67
30,3
3 3,
0 4,
183
-0,0
85
-0,9
2
Cla
yvill
e/O
lifan
tsfo
ntei
n
32,5
0 30
,00
32,5
0 26
,00
27,5
0 2,
5 3,
841
-0,0
65
-0,7
8
Chl
oork
op
30,0
0 30
,00
30,0
0 28
,00
27,0
0 2,
0 3,
629
-0,0
38
-0,9
1
Am
alga
m
35,0
0 30
,00
33,0
0 31
,50
34,0
0 3,
0 3,
492
-0,0
01
-0,0
2
Cro
wn
Min
es
35,0
0 33
,00
35,0
0 35
,00
33,0
0 1,
0 3,
584
-0,0
07
-0,2
8
Indu
stria
29
,00
29,0
0 25
,00
20,0
0 20
,00
2,0
4,22
7 -0
,148
-0
,96
Boo
ysen
s/Boo
ysen
s Res
erve
/Oph
irto
n
20,0
0 20
,00
22,5
0 23
,50
30,0
0 1,
5 2,
240
0,12
8 0,
92
Vill
age
Mai
n/Vill
age
Dee
p/N
ew C
entr
e
20,0
0 20
,00
25,0
0 24
,00
22,5
0 2,
5 2,
726
0,05
4 0,
63
Ben
rose
28
,67
28,0
0 27
,50
25,0
0 24
,67
5,5
3,67
1 -0
,055
-0
,97
Ste
eled
ale/
Elec
tron
/Tul
isa
Park
30
,00
30,0
0 29
,25
26,5
0 24
,50
1,5
3,82
4 -0
,070
-0
,94
Aer
oton
-
30,0
0 30
,00
30,0
0 -
1,0
- -
- D
evla
nd/N
ance
field
25
,00
25,0
0 25
,00
25,0
0 25
,00
1,0
3,21
9 0,
000
-
Cle
vela
nd/H
erio
tdal
e
30,3
3 29
,33
28,3
3 27
,83
26,0
0 1,
5 3,
674
-0,0
47
-0,9
7
New
land
s/M
artin
dale
30
,00
30,0
0 25
,00
25,0
0 25
,00
1,0
3,78
9 -0
,071
-0
,86
Kew
/Wyn
berg
Eas
t
30,0
0 30
,00
25,0
0 25
,00
25,0
0 2,
8 3,
727
-0,0
93
-0,9
6
Bra
mle
y Vie
w/L
omba
rdy
Wes
t
20,0
0 20
,00
19,0
0 21
,50
20,5
0 3,
0 2,
882
0,01
8 0,
47
Mar
lbor
o
15,0
0 15
,00
16,5
0 19
,00
20,0
0 2,
7 2,
078
0,10
8 0,
97
Hal
fway
Hou
se:
hi-t
ech
strip
45
,00
44,5
0 40
,67
39,0
0 38
,33
2,3
4,14
0 -0
,059
-0
,97
Hal
fway
Hou
se:
Ric
hard
s D
rive
45
,00
43,2
5 41
,67
38,3
3 38
,33
2,7
4,12
8 -0
,058
-0
,98
Com
mer
cia
35
,00
35,0
0 30
,00
30,0
0 30
,00
1,0
3,88
3 -0
,060
-0
,86
Kra
mer
ville
/Eas
tgat
e Ex
t12
& E
xt13
47
,25
47,2
5 43
,50
44,7
5 44
,25
3,0
3,98
1 -0
,024
-0
,74
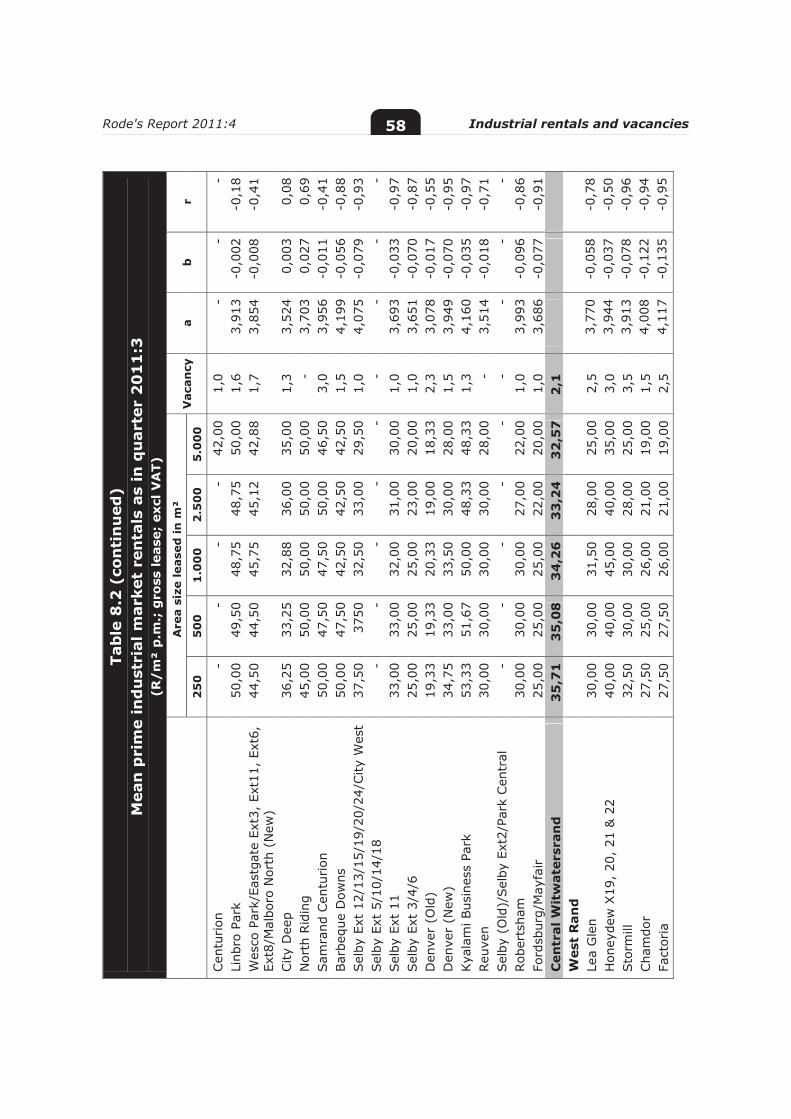
Rode's Report 2011:4 Industrial rentals and vacancies 58
Tab
le 8
.2 (
con
tin
ued
) M
ean
pri
me
ind
ust
rial
mar
ket
ren
tals
as
in q
uar
ter
20
11
:3
(R/
m²
p.m
.; g
ross
leas
e; e
xcl V
AT)
Are
a si
ze le
ased
in m
² V
acan
cy
a b
r
25
0
50
0
1.0
00
2
.50
0
5.0
00
Cen
turion
-
- -
- 42
,00
1,0
- -
- Li
nbro
Par
k
50,0
0 49
,50
48,7
5 48
,75
50,0
0 1,
6 3,
913
-0,0
02
-0,1
8 W
esco
Par
k/Ea
stga
te E
xt3,
Ext
11,
Ext6
, Ex
t8/M
albo
ro N
orth
(N
ew)
44
,50
44,5
0 45
,75
45,1
2 42
,88
1,7
3,85
4 -0
,008
-0
,41
City
Dee
p
36,2
5 33
,25
32,8
8 36
,00
35,0
0 1,
3 3,
524
0,00
3 0,
08
Nor
th R
idin
g
45,0
0 50
,00
50,0
0 50
,00
50,0
0 -
3,70
3 0,
027
0,69
Sam
rand
Cen
turion
50
,00
47,5
0 47
,50
50,0
0 46
,50
3,0
3,95
6 -0
,011
-0
,41
Bar
bequ
e D
owns
50
,00
47,5
0 42
,50
42,5
0 42
,50
1,5
4,19
9 -0
,056
-0
,88
Sel
by E
xt 1
2/13
/15/
19/2
0/24
/City
Wes
t
37,5
0 37
50
32,5
0 33
,00
29,5
0 1,
0 4,
075
-0,0
79
-0,9
3 Sel
by E
xt 5
/10/
14/1
8
- -
- -
- -
- -
- Sel
by E
xt 1
1
33,0
0 33
,00
32,0
0 31
,00
30,0
0 1,
0 3,
693
-0,0
33
-0,9
7 Sel
by E
xt 3
/4/6
25
,00
25,0
0 25
,00
23,0
0 20
,00
1,0
3,65
1 -0
,070
-0
,87
Den
ver
(Old
)
19,3
3 19
,33
20,3
3 19
,00
18,3
3 2,
3 3,
078
-0,0
17
-0,5
5 D
enve
r (N
ew)
34
,75
33,0
0 33
,50
30,0
0 28
,00
1,5
3,94
9 -0
,070
-0
,95
Kya
lam
i Bus
ines
s Pa
rk
53,3
3 51
,67
50,0
0 48
,33
48,3
3 1,
3 4,
160
-0,0
35
-0,9
7 Reu
ven
30
,00
30,0
0 30
,00
30,0
0 28
,00
- 3,
514
-0,0
18
-0,7
1 Sel
by (
Old
)/Sel
by E
xt2/
Park
Cen
tral
-
- -
- -
- -
- -
Rob
erts
ham
30
,00
30,0
0 30
,00
27,0
0 22
,00
1,0
3,99
3 -0
,096
-0
,86
Ford
sbur
g/M
ayfa
ir
25,0
0 25
,00
25,0
0 22
,00
20,0
0 1,
0 3,
686
-0,0
77
-0,9
1 C
entr
al W
itw
ater
sran
d
35
,71
3
5,0
8
34
,26
3
3,2
4
32
,57
2
,1
W
est
Ran
d
Le
a G
len
30,0
0 30
,00
31,5
0 28
,00
25,0
0 2,
5 3,
770
-0,0
58
-0,7
8 H
oney
dew
X19
, 20
, 21
& 2
2 40
,00
40,0
0 45
,00
40,0
0 35
,00
3,0
3,94
4 -0
,037
-0
,50
Sto
rmill
32
,50
30,0
0 30
,00
28,0
0 25
,00
3,5
3,91
3 -0
,078
-0
,96
Cha
mdo
r 27
,50
25,0
0 26
,00
21,0
0 19
,00
1,5
4,00
8 -0
,122
-0
,94
Fact
oria
27
,50
27,5
0 26
,00
21,0
0 19
,00
2,5
4,11
7 -0
,135
-0
,95
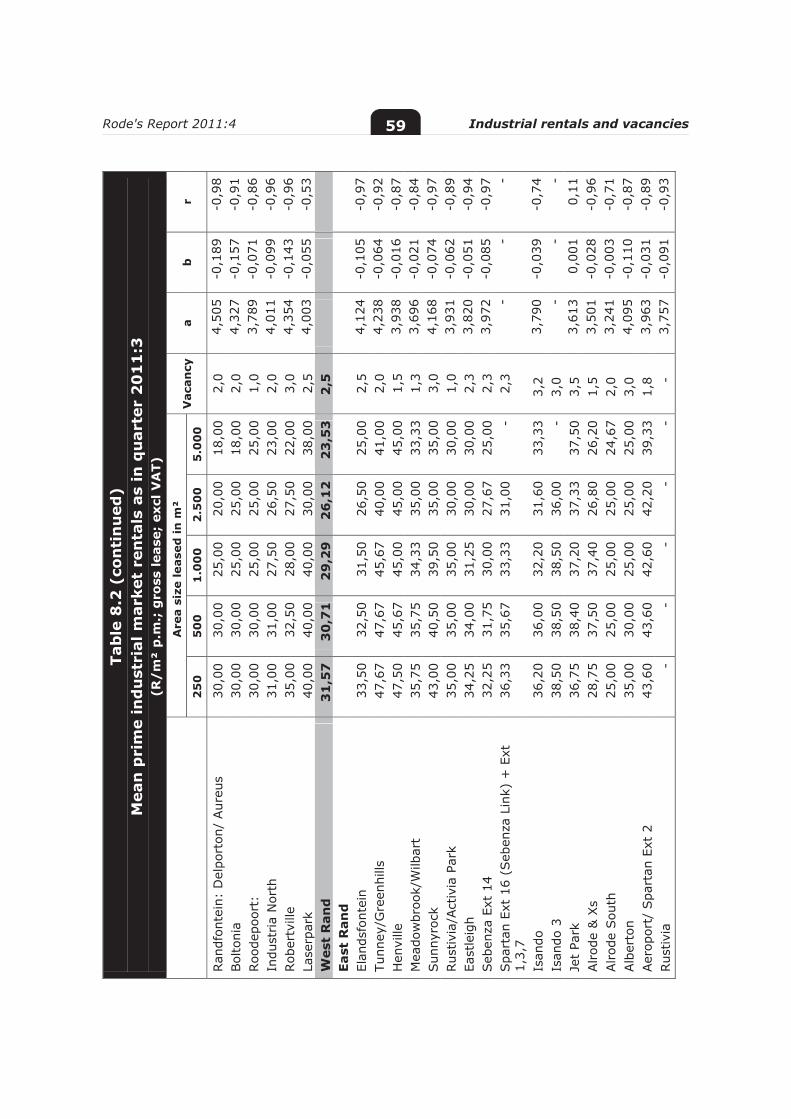
Rode's Report 2011:4 Industrial rentals and vacancies 59
Tab
le 8
.2 (
con
tin
ued
) M
ean
pri
me
ind
ust
rial
mar
ket
ren
tals
as
in q
uar
ter
20
11
:3
(R/
m²
p.m
.; g
ross
leas
e; e
xcl V
AT)
Are
a si
ze le
ased
in m
² V
acan
cy
a b
r
25
0
50
0
1.0
00
2
.50
0
5.0
00
Ran
dfon
tein
: D
elpo
rton
/ Aur
eus
30,0
0 30
,00
25,0
0 20
,00
18,0
0 2,
0 4,
505
-0,1
89
-0,9
8 Bol
toni
a 30
,00
30,0
0 25
,00
25,0
0 18
,00
2,0
4,32
7 -0
,157
-0
,91
Roo
depo
ort:
30
,00
30,0
0 25
,00
25,0
0 25
,00
1,0
3,78
9 -0
,071
-0
,86
Indu
stria
Nor
th
31,0
0 31
,00
27,5
0 26
,50
23,0
0 2,
0 4,
011
-0,0
99
-0,9
6 Rob
ertv
ille
35,0
0 32
,50
28,0
0 27
,50
22,0
0 3,
0 4,
354
-0,1
43
-0,9
6 La
serp
ark
40,0
0 40
,00
40,0
0 30
,00
38,0
0 2,
5 4,
003
-0,0
55
-0,5
3 W
est
Ran
d
31
,57
3
0,7
1
29
,29
2
6,1
2
23
,53
2
,5
Ea
st R
and
El
ands
font
ein
33,5
0 32
,50
31,5
0 26
,50
25,0
0 2,
5 4,
124
-0,1
05
-0,9
7 Tu
nney
/Gre
enhi
lls
47,6
7 47
,67
45,6
7 40
,00
41,0
0 2,
0 4,
238
-0,0
64
-0,9
2 H
envi
lle
47,5
0 45
,67
45,0
0 45
,00
45,0
0 1,
5 3,
938
-0,0
16
-0,8
7 M
eado
wbr
ook/
Wilb
art
35,7
5 35
,75
34,3
3 35
,00
33,3
3 1,
3 3,
696
-0,0
21
-0,8
4 Sun
nyro
ck
43,0
0 40
,50
39,5
0 35
,00
35,0
0 3,
0 4,
168
-0,0
74
-0,9
7 Rus
tivia
/Act
ivia
Par
k 35
,00
35,0
0 35
,00
30,0
0 30
,00
1,0
3,93
1 -0
,062
-0
,89
East
leig
h 34
,25
34,0
0 31
,25
30,0
0 30
,00
2,3
3,82
0 -0
,051
-0
,94
Seb
enza
Ext
14
32,2
5 31
,75
30,0
0 27
,67
25,0
0 2,
3 3,
972
-0,0
85
-0,9
7 Spa
rtan
Ext
16
(Seb
enza
Lin
k) +
Ext
1,
3,7
36,3
3 35
,67
33,3
3 31
,00
- 2,
3 -
- -
Isan
do
36,2
0 36
,00
32,2
0 31
,60
33,3
3 3,
2 3,
790
-0,0
39
-0,7
4 Is
ando
3
38,5
0 38
,50
38,5
0 36
,00
- 3,
0 -
- -
Jet
Park
36
,75
38,4
0 37
,20
37,3
3 37
,50
3,5
3,61
3 0,
001
0,11
Alrod
e &
Xs
28,7
5 37
,50
37,4
0 26
,80
26,2
0 1,
5 3,
501
-0,0
28
-0,9
6 Alrod
e Sou
th
25,0
0 25
,00
25,0
0 25
,00
24,6
7 2,
0 3,
241
-0,0
03
-0,7
1 Alb
erto
n 35
,00
30,0
0 25
,00
25,0
0 25
,00
3,0
4,09
5 -0
,110
-0
,87
Aer
opor
t/ S
part
an E
xt 2
43
,60
43,6
0 42
,60
42,2
0 39
,33
1,8
3,96
3 -0
,031
-0
,89
Rus
tivia
-
- -
- -
- 3,
757
-0,0
91
-0,9
3
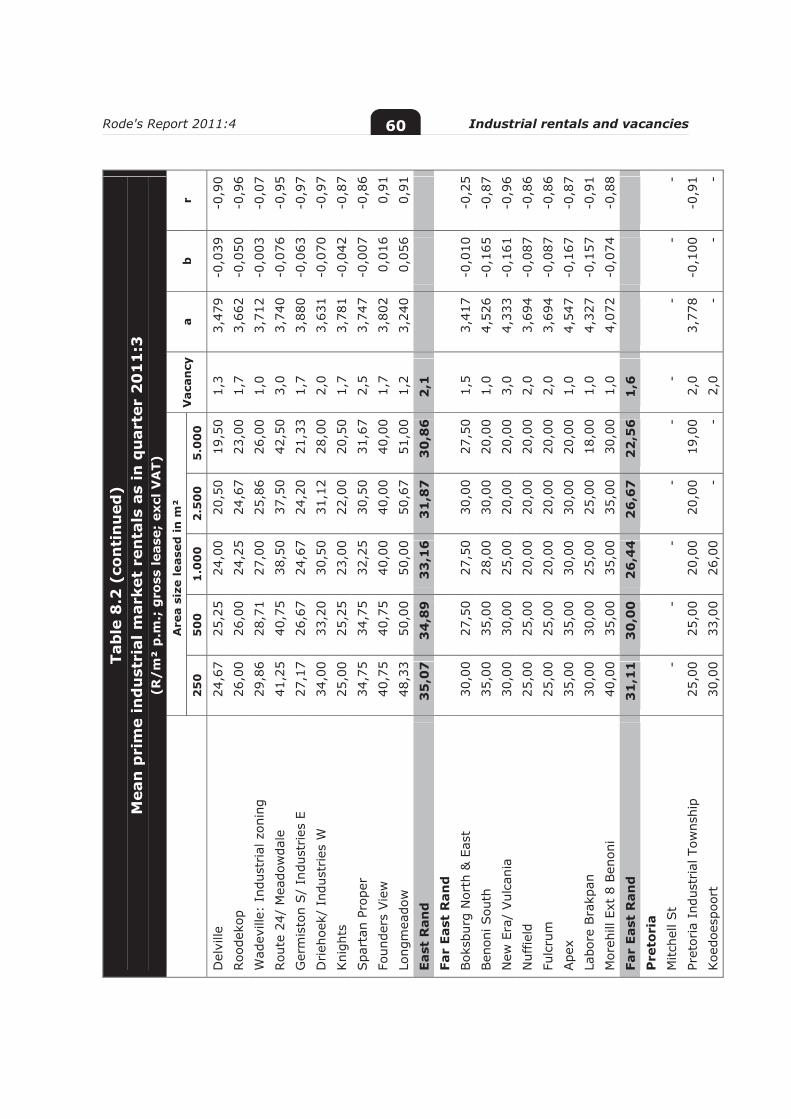
Rode's Report 2011:4 Industrial rentals and vacancies 60
Tab
le 8
.2 (
con
tin
ued
) M
ean
pri
me
ind
ust
rial
mar
ket
ren
tals
as
in q
uar
ter
20
11
:3
(R/
m²
p.m
.; g
ross
leas
e; e
xcl V
AT)
Are
a si
ze le
ased
in m
² V
acan
cy
a b
r
25
0
50
0
1.0
00
2
.50
0
5.0
00
Del
ville
24
,67
25,2
5 24
,00
20,5
0 19
,50
1,3
3,47
9 -0
,039
-0
,90
Roo
deko
p 26
,00
26,0
0 24
,25
24,6
7 23
,00
1,7
3,66
2 -0
,050
-0
,96
Wad
evill
e: I
ndus
tria
l zon
ing
29,8
6 28
,71
27,0
0 25
,86
26,0
0 1,
0 3,
712
-0,0
03
-0,0
7
Rou
te 2
4/ M
eado
wda
le
41,2
5 40
,75
38,5
0 37
,50
42,5
0 3,
0 3,
740
-0,0
76
-0,9
5 G
erm
isto
n S/
Indu
stries
E
27,1
7 26
,67
24,6
7 24
,20
21,3
3 1,
7 3,
880
-0,0
63
-0,9
7
Drieh
oek/
Ind
ustr
ies
W
34,0
0 33
,20
30,5
0 31
,12
28,0
0 2,
0 3,
631
-0,0
70
-0,9
7
Kni
ghts
25
,00
25,2
5 23
,00
22,0
0 20
,50
1,7
3,78
1 -0
,042
-0
,87
Spa
rtan
Pro
per
34,7
5 34
,75
32,2
5 30
,50
31,6
7 2,
5 3,
747
-0,0
07
-0,8
6
Foun
ders
Vie
w
40,7
5 40
,75
40,0
0 40
,00
40,0
0 1,
7 3,
802
0,01
6 0,
91
Long
mea
dow
48
,33
50,0
0 50
,00
50,6
7 51
,00
1,2
3,24
0 0,
056
0,91
East
Ran
d
35
,07
3
4,8
9
33
,16
3
1,8
7
30
,86
2
,1
Fa
r Ea
st R
and
Bok
sbur
g N
orth
& E
ast
30,0
0 27
,50
27,5
0 30
,00
27,5
0 1,
5 3,
417
-0,0
10
-0,2
5
Ben
oni S
outh
35
,00
35,0
0 28
,00
30,0
0 20
,00
1,0
4,52
6 -0
,165
-0
,87
New
Era
/ Vul
cani
a 30
,00
30,0
0 25
,00
20,0
0 20
,00
3,0
4,33
3 -0
,161
-0
,96
Nuf
field
25
,00
25,0
0 20
,00
20,0
0 20
,00
2,0
3,69
4 -0
,087
-0
,86
Fulc
rum
25
,00
25,0
0 20
,00
20,0
0 20
,00
2,0
3,69
4 -0
,087
-0
,86
Ape
x 35
,00
35,0
0 30
,00
30,0
0 20
,00
1,0
4,54
7 -0
,167
-0
,87
Labo
re B
rakp
an
30,0
0 30
,00
25,0
0 25
,00
18,0
0 1,
0 4,
327
-0,1
57
-0,9
1
Mor
ehill
Ext
8 B
enon
i 40
,00
35,0
0 35
,00
35,0
0 30
,00
1,0
4,07
2 -0
,074
-0
,88
Far
East
Ran
d
31
,11
3
0,0
0
26
,44
2
6,6
7
22
,56
1
,6
Pre
tori
a
Mitc
hell
St
- -
- -
- -
- -
-
Pret
oria
Ind
ustr
ial T
owns
hip
25,0
0 25
,00
20,0
0 20
,00
19,0
0 2,
0 3,
778
-0,1
00
-0,9
1 Koe
does
poor
t 30
,00
33,0
0 26
,00
- -
2,0
- -
-
Rode's Report 2011:4 Industrial rentals and vacancies 61
Tab
le 8
.2 (
con
tin
ued
) M
ean
pri
me
ind
ust
rial
mar
ket
ren
tals
as
in q
uar
ter
20
11
:3
(R/
m²
p.m
.; g
ross
leas
e; e
xcl V
AT)
Are
a si
ze le
ased
in m
² V
acan
cy
a b
r
25
0
50
0
1.0
00
2
.50
0
5.0
00
Wal
tloo/
Des
patc
h 30
,00
30,0
0 30
,00
45,0
0 40
,00
3,0
2,60
6 0,
133
0,83
Silv
erto
n/ S
ilver
tond
ale
37,5
0 37
,50
37,5
0 38
,00
- 3,
0 -
- -
Sam
cor
Park
35
,00
35,0
0 35
,00
40,0
0 40
,00
3,0
3,23
0 0,
054
0,89
Sun
derlan
d Rid
ge
35,0
0 35
,00
35,0
0 32
,50
25,0
0 3,
0 4,
165
-0,0
99
-0,8
2 H
erm
anst
ad
- 35
,00
30,0
0 30
,00
- -
- -
- Kirkn
ey
- 35
,00
30,0
0 -
- -
- -
- H
enno
pspa
rk X
15 &
X7
45,0
0 45
,00
40,0
0 40
,00
35,0
0 4,
0 4,
276
-0,0
81
-0,9
3 G
atew
ay
45,0
0 50
,00
45,0
0 45
,00
35,0
0 3,
0 4,
339
-0,0
80
-0,7
3 Ly
ttle
ton
Man
or X
4/X6
35,0
0 35
,00
37,5
0 30
,00
30,0
0 2,
0 3,
952
-0,0
64
-0,7
6 Pr
etor
ia N
orth
30
,00
25,0
0 20
,00
20,0
0 20
,00
3,0
4,05
5 -0
,133
-0
,87
Silv
erto
ndal
e X1
35,0
0 40
,00
37,5
0 -
- 3,
0 -
- -
Brits
-
- -
- -
- -
- -
Kle
rkso
ord
25,0
0 25
,00
20,0
0 20
,00
20,0
0 4,
0 3,
694
-0,0
87
-0,8
6 Ros
slyn
27
,50
25,0
0 22
,50
20,0
0 20
,00
4,0
3,91
9 -0
,113
-0
,97
Pre
tori
a 3
3,3
3
34
,06
3
2,4
3
31
,87
2
7,5
5
3,0
Pol
okw
ane
Le
bow
akgo
mo
- -
- -
- -
- -
- Sup
erbi
a 42
,00
35,0
0 32
,00
25,0
0 -
2,0
- -
- In
dust
ria
43,0
0 37
,00
32,0
0 25
,00
- 2,
0 -
- -
Ladi
ne
45,0
0 37
,00
32,0
0 28
,00
- 2,
0 -
- -
Futu
ra
40,0
0 35
,00
30,0
0 22
,00
- 2,
0 -
- -
Labo
ria
45,0
0 35
,00
30,0
0 30
,00
- 2,
0 -
- -
Mag
na V
ia
42,0
0 45
,00
42,0
0 40
,00
- 2,
0 -
- -
Ses
hego
-
- -
- -
- -
- -
Pol
okw
ane
42
,83
3
7,3
3
33
,00
2
8,3
3
- 2
,0
Rode's Report 2011:4 Industrial rentals and vacancies 62
Tab
le 8
.2 (
con
tin
ued
) M
ean
pri
me
ind
ust
rial
mar
ket
ren
tals
as
in q
uar
ter
20
11
:3
(R/
m²
p.m
.; g
ross
leas
e; e
xcl V
AT)
Are
a si
ze le
ased
in m
² V
acan
cy
a b
r
25
0
50
0
1.0
00
2
.50
0
5.0
00
Nel
spru
it
Nel
spru
it Ea
st
42,
00
35,
00
32,
00
25,
00
22,
00
4,0
4,
918
-0,2
15
-1,0
0
Nel
spru
it W
est
42,
00
40,
00
40,
00
38,
00
35,
00
2,0
4,
045
-0,0
55
-0,9
5
Roc
ky's
Drift
3
7,00
3
6,00
3
5,00
3
0,00
2
6,00
2
,0
4,30
7 -0
,118
-0
,95
Riv
ersi
de P
ark
55,
00
45,
00
42,
00
38,
00
35,
00
4,0
4,
730
-0,1
40
-0,9
7
Nel
spru
it
44
,00
3
9,0
0
37
,25
3
2,7
5
29
,50
3
,0
Du
rban
Spr
ingf
ield
Par
k 41
,67
41,6
7 39
,50
38,3
3 37
,00
4,0
3,97
4 -0
,042
-0
,98
May
ville
30
,00
32,0
0 31
,50
31,0
0 30
,00
3,0
3,46
4 -0
,005
-0
,20
Phoe
nix
31,0
0 31
,33
31,3
3 30
,67
29,3
3 3,
7 3,
549
-0,0
18
-0,7
8
Nor
th C
oast
Rd
/ Briar
dene
41
,50
41,0
0 41
,00
40,0
0 40
,00
3,0
- -
- Briar
dene
Ind
ustr
ial P
ark
44,0
0 44
,00
42,5
0 40
,67
40,0
0 3,
3 -
- -
Um
geni
Rd/
Sta
mfo
rd H
ill
36,5
0 36
,50
36,5
0 36
,50
35,0
0 3,
0 3,
666
-0,0
11
-0,7
1
Um
bilo
/ Syd
ney
Rd/
Gal
e St
35,0
0 35
,00
35,0
0 37
,50
37,5
0 4,
0 3,
387
0,02
8 0,
89
Jaco
bs
36,8
3 36
,83
36,6
7 36
,00
36,0
0 4,
0 3,
661
-0,0
09
-0,9
3 M
oben
i 35
,00
35,0
0 35
,00
36,0
0 36
,00
3,3
- -
-
Pros
pect
on
37,5
0 37
,33
37,3
3 37
,33
37,6
7 3,
3 3,
614
0,00
1 0,
36
Itha
la I
ndus
tria
l Est
ate
41,0
0 39
,50
39,5
0 38
,50
38,5
0 3,
5 3,
813
-0,0
20
-0,9
3 Pi
neto
wn
Cen
tral
39
,75
39,0
0 37
,50
37,7
5 37
,25
3,8
3,79
0 -0
,021
-0
,90
New
Ger
man
y 37
,67
35,5
0 34
,25
34,0
0 33
,75
4,3
3,79
3 -0
,034
-0
,90
Isip
ingo
-
- -
- -
- -
- -
Ros
sbur
gh/
Sou
th C
oast
Rd
37,5
0 37
,50
37,5
0 37
,50
37,5
0 3,
0 -
- -
Edw
in S
wal
es D
rive
40
,00
40,0
0 40
,00
40,0
0 40
,00
2,5
3,68
9 0,
000
-
Gle
n Ani
l 40
,50
40,5
0 40
,00
40,0
0 40
,50
4,0
3,70
7 -0
,002
-0
,28
Brick
field
Rd
31,5
0 31
,50
28,0
0 28
,00
28,0
0 2,
5 3,
701
-0,0
46
-0,8
6
Rode's Report 2011:4 Industrial rentals and vacancies 63
Tab
le 8
.2 (
con
tin
ued
) M
ean
pri
me
ind
ust
rial
mar
ket
ren
tals
as
in q
uar
ter
20
11
:3
(R/
m²
p.m
.; g
ross
leas
e; e
xcl V
AT)
Are
a si
ze le
ased
in m
² V
acan
cy
a b
r
25
0
50
0
1.0
00
2
.50
0
5.0
00
Ver
ulam
-
- -
- -
2,5
- -
-
Can
elan
ds
- -
- -
- 2,
5 -
- -
Tong
aat
35,5
0 35
,50
33,0
0 31
,00
31,0
0 2,
0 3,
877
-0,0
54
-0,9
5
New
Wes
tmea
d/ M
ahog
any
41
,00
39,5
0 38
,25
37,7
5 38
,25
3,3
3,82
9 -0
,024
-0
,86
Wes
tmea
d 40
,25
39,0
0 37
,25
37,0
0 36
,75
4,0
3,85
1 -0
,030
-0
,93
Mar
iann
Par
k/ S
outh
mea
d 32
,00
33,5
0 34
,00
33,3
3 31
,00
2,7
3,55
6 -0
,010
-0
,30
Max
mea
d 41
,00
40,5
0 39
,00
38,2
5 37
,75
2,3
3,87
5 -0
,029
-0
,98
Rin
groa
d In
dust
rial
Par
k 40
,00
40,0
0 40
,00
- -
2,0
- -
-
Avo
ca/
Red
Hill
/ N
orth
gate
-
38,0
0 38
,00
40,0
0 40
,00
3,0
- -
-
Falc
on P
ark
37,0
0 36
,50
35,5
0 35
,00
34,5
0 3,
0 3,
741
-0,0
24
-0,9
9
Riv
er H
orse
Val
ley
Bus
ines
s
51,6
7 51
,67
49,6
7 49
,67
48,0
0 3,
7 4,
085
-0,0
24
-0,9
4 M
ount
Edg
ecom
be
41,0
0 40
,33
39,3
3 39
,33
39,3
3 3,
7 3,
783
-0,0
14
-0,8
8
Um
bogi
ntw
ini/
Sou
thga
te
40,0
0 40
,00
38,0
0 38
,00
38,0
0 3,
0 3,
798
-0,0
20
-0,8
6
Sou
thga
te I
ndus
tria
l Par
k -
40,0
0 39
,00
38,0
0 38
,00
3,0
- -
-
Um
geni
Par
k -
40,0
0 40
,00
- -
2,0
- -
- H
amm
ersd
ale
25,0
0 25
,00
23,1
3 22
,50
22,2
5 4,
0 3,
470
-0,0
44
-0,9
5 Cat
o Rid
ge
24,0
0 24
,00
23,3
3 23
,75
23,7
5 3,
0 3,
195
-0,0
04
-0,4
0 D
urb
an
38
,34
37
,69
36
,32
35
,77
35
,51
3,4
Low
er U
mfo
lozi
Empa
ngen
i -
- -
- -
- -
- -
Ric
hard
s Bay
35
,00
28,0
0 25
,00
25,0
0 -
3,0
- -
-
Ric
hard
s Bay
CBD
(D
olla
r D
rive
) 50
,00
45,0
0 35
,00
- -
1,0
- -
-
Low
er U
mfo
lozi
4
2,5
0
36
,50
3
0,0
0
25
,00
-
2,0
Cap
e P
enin
sula
Vik
ing
Plac
e 3
5,67
3
3,67
3
2,50
3
3,25
-
2,7
- -
-
Rode's Report 2011:4 Industrial rentals and vacancies 64
Tab
le 8
.2 (
con
tin
ued
) M
ean
pri
me
ind
ust
rial
mar
ket
ren
tals
as
in q
uar
ter
20
11
:3
(R/
m²
p.m
.; g
ross
leas
e; e
xcl V
AT)
Are
a si
ze le
ased
in m
² V
acan
cy
a b
r
25
0
50
0
1.0
00
2
.50
0
5.0
00
Glo
sder
ry
43,
00
43,
00
39,
67
37,
00
- 1,
5 -
- -
Paar
den
Eila
nd/
Met
ro
37,
25
36,
80
35,
00
34,
00
31,
00
2,3
3,95
8 -0
,059
-0
,96
Mon
tagu
e G
arde
ns
35,
00
34,
50
33,
00
33,
25
30,
50
3,2
3,78
7 -0
,041
-0
,91
Mar
coni
Bea
m
39,
60
37,
67
37,
67
35,
00
32,
50
1,3
4,02
8 -0
,062
-0
,97
Kill
arne
y G
arde
ns
29,
50
29,
40
28,
33
27,
67
27,
00
4,0
3,56
4 -0
,031
-0
,98
Rac
ing
Park
2
8,75
2
8,25
2
4,67
2
4,67
2
5,00
5,
0 3,
642
-0,0
54
-0,8
4
Atla
ntis
1
8,00
1
8,00
1
6,00
1
6,00
1
6,00
-
3,14
1 -0
,046
-0
,86
Woo
dsto
ck/
Sal
t Riv
er/
Obs
erva
tory
3
3,00
3
3,00
3
5,00
-
- 3,
0 -
- -
Ath
lone
1 &
2
30,
00
30,
00
30,
00
25,
00
25,
00
5,0
3,84
5 -0
,074
-0
,89
Lans
dow
ne N
eris
sa
31,
00
31,
00
31,
00
30,
00
30,
00
4,5
3,51
4 -0
,013
-0
,89
San
d In
dust
ria
- -
- -
- -
- -
-
Ott
ery
Hill
star
3
7,00
3
6,00
3
5,33
3
2,67
3
0,00
3,
7 4,
008
-0,0
68
-0,9
6 O
tter
y Sun
set
36,
50
35,
50
35,
50
33,
00
30,
00
3,0
3,95
8 -0
,062
-0
,93
Die
p Riv
er
43,
50
42,
50
41,
50
38,
00
- 2,
5 -
- -
Elfin
dale
4
3,50
4
2,50
4
0,50
4
0,00
4
0,00
3,
5 3,
928
-0,0
30
-0,9
3
Mon
woo
d/ P
hilip
pi E
ast
30,
00
30,
00
30,
00
25,
00
25,
00
- 3,
845
-0,0
74
-0,8
9
Ret
reat
/ Ste
enbe
rg
44,
00
42,
50
41,
50
40,
00
40,
00
2,5
3,95
9 -0
,033
-0
,97
Cap
rico
rn P
ark
41,
00
40,
00
37,
50
37,
50
- 5,
5 -
- -
Mai
tland
3
1,33
3
1,00
2
7,33
-
- 3,
7 -
- -
Nda
beni
3
6,00
3
4,00
3
2,00
3
0,00
3
0,00
2,
5 3,
926
-0,0
64
-0,9
7
Airpo
rt
36,
00
35,
00
33,
20
31,
75
27,
50
3,2
4,06
7 -0
,084
-0
,95
Eppi
ng 1
& 2
3
1,33
3
0,20
2
7,90
2
5,38
2
5,12
4,
2 3,
897
-0,0
81
-0,9
8
WP
Park
3
8,40
3
7,00
3
4,00
3
3,00
3
2,67
1,
7 3,
954
-0,0
57
-0,9
6
Elsi
es R
iver
(ex
cl.
Cen
tral
Par
k)
24,
92
24,
62
23,
25
21,
33
22,
00
4,2
3,50
9 -0
,052
-0
,92
Paro
w B
eaco
nval
e 3
1,00
3
0,17
2
9,20
2
4,67
2
4,33
3,
8 3,
963
-0,0
92
-0,9
6
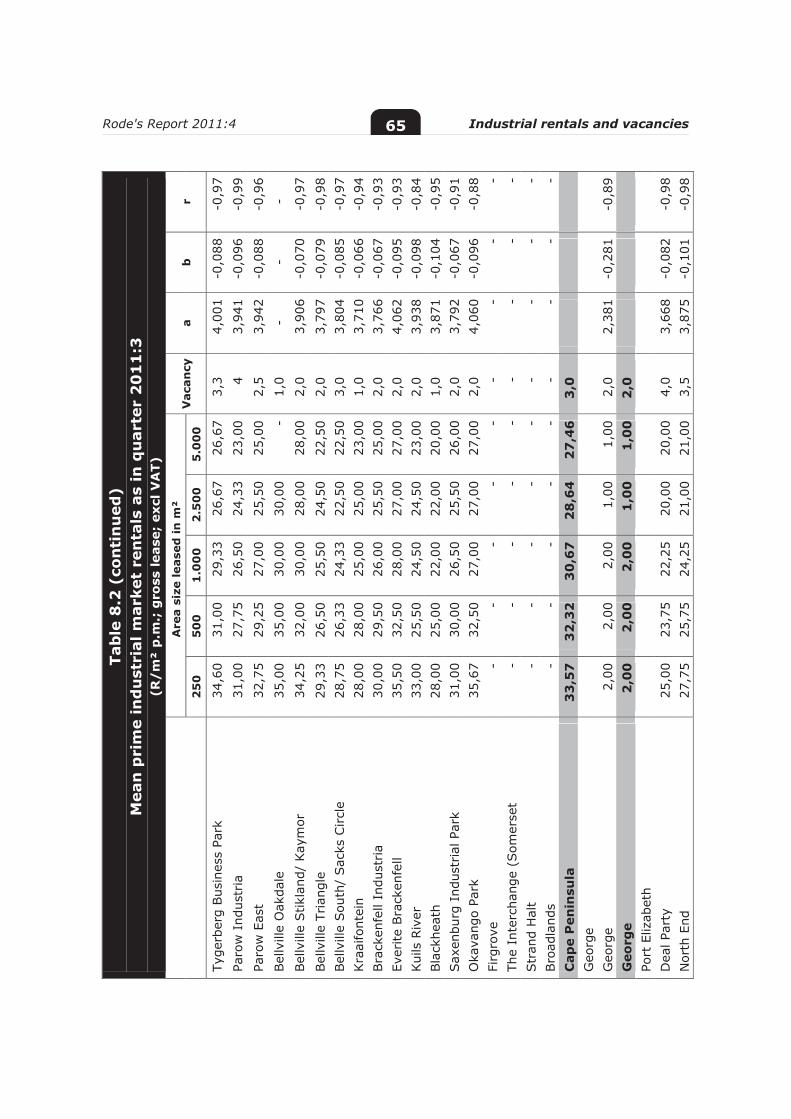
Rode's Report 2011:4 Industrial rentals and vacancies 65
Tab
le 8
.2 (
con
tin
ued
) M
ean
pri
me
ind
ust
rial
mar
ket
ren
tals
as
in q
uar
ter
20
11
:3
(R/
m²
p.m
.; g
ross
leas
e; e
xcl V
AT)
Are
a si
ze le
ased
in m
² V
acan
cy
a b
r
25
0
50
0
1.0
00
2
.50
0
5.0
00
Tyge
rber
g Bus
ines
s Pa
rk
34,
60
31,
00
29,
33
26,
67
26,
67
3,3
4,00
1 -0
,088
-0
,97
Paro
w I
ndus
tria
3
1,00
2
7,75
2
6,50
2
4,33
2
3,00
4
3,94
1 -0
,096
-0
,99
Paro
w E
ast
32,
75
29,
25
27,
00
25,
50
25,
00
2,5
3,94
2 -0
,088
-0
,96
Bel
lvill
e O
akda
le
35,
00
35,
00
30,
00
30,
00
- 1,
0 -
- -
Bel
lvill
e Stik
land
/ Kay
mor
3
4,25
3
2,00
3
0,00
2
8,00
2
8,00
2,
0 3,
906
-0,0
70
-0,9
7 Bel
lvill
e Tr
iang
le
29,
33
26,
50
25,
50
24,
50
22,
50
2,0
3,79
7 -0
,079
-0
,98
Bel
lvill
e Sou
th/
Sac
ks C
ircl
e 2
8,75
2
6,33
2
4,33
2
2,50
2
2,50
3,
0 3,
804
-0,0
85
-0,9
7 Kra
aifo
ntei
n 2
8,00
2
8,00
2
5,00
2
5,00
2
3,00
1,
0 3,
710
-0,0
66
-0,9
4 Bra
cken
fell
Indu
stria
30,
00
29,
50
26,
00
25,
50
25,
00
2,0
3,76
6 -0
,067
-0
,93
Ever
ite B
rack
enfe
ll 3
5,50
3
2,50
2
8,00
2
7,00
2
7,00
2,
0 4,
062
-0,0
95
-0,9
3 Kui
ls R
iver
3
3,00
2
5,50
2
4,50
2
4,50
2
3,00
2,
0 3,
938
-0,0
98
-0,8
4 Bla
ckhe
ath
28,
00
25,
00
22,
00
22,
00
20,
00
1,0
3,87
1 -0
,104
-0
,95
Sax
enbu
rg I
ndus
tria
l Par
k 3
1,00
3
0,00
2
6,50
2
5,50
2
6,00
2,
0 3,
792
-0,0
67
-0,9
1 O
kava
ngo
Park
3
5,67
3
2,50
2
7,00
2
7,00
2
7,00
2,
0 4,
060
-0,0
96
-0,8
8 Fi
rgro
ve
- -
- -
- -
- -
- Th
e In
terc
hang
e (S
omer
set
-
- -
- -
- -
- -
Str
and
Hal
t -
- -
- -
- -
- -
Bro
adla
nds
- -
- -
- -
- -
- C
ape
Pen
insu
la
33
,57
3
2,3
2
30
,67
2
8,6
4
27
,46
3
,0
G
eorg
e
Geo
rge
2,0
0 2
,00
2,0
0 1
,00
1,0
0 2
,0
2,38
1 -0
,281
-0
,89
Geo
rge
2,0
0
2,0
0
2,0
0
1,0
0
1,0
0
2,0
Port
Eliz
abet
h
Dea
l Par
ty
25,0
0 23
,75
22,2
5 20
,00
20,0
0 4,
0 3,
668
-0,0
82
-0,9
8 N
orth
End
27
,75
25,7
5 24
,25
21,0
0 21
,00
3,5
3,87
5 -0
,101
-0
,98
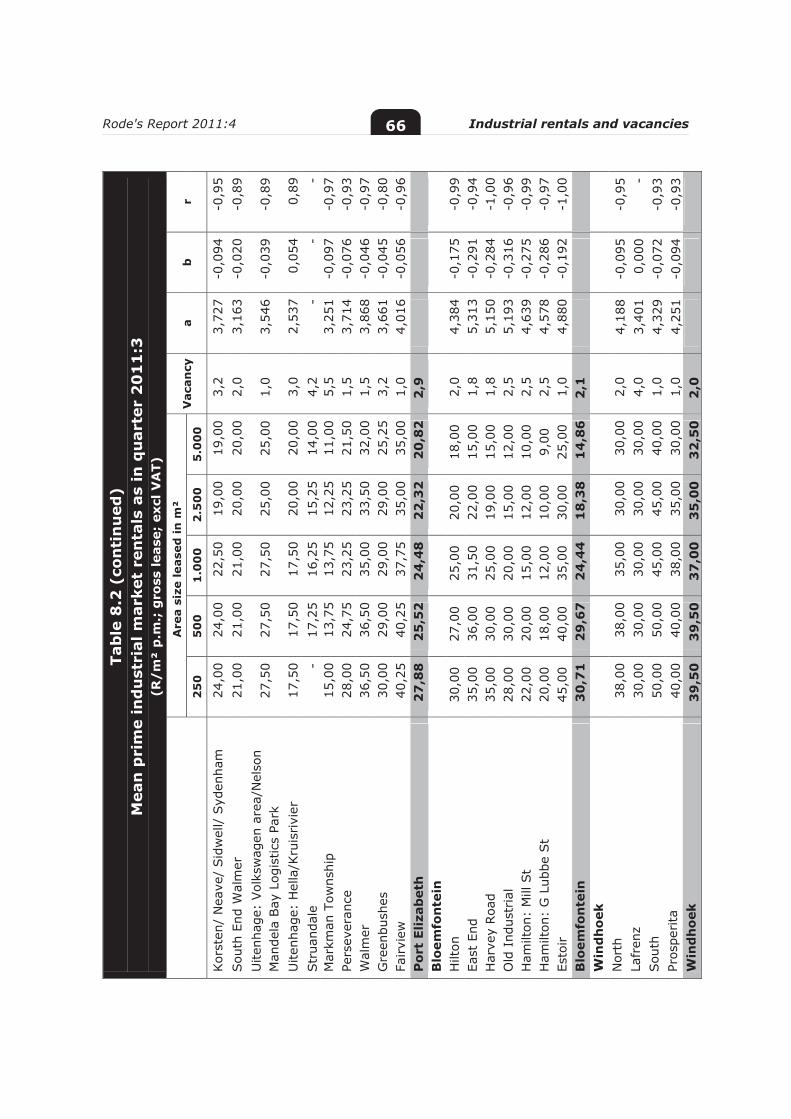
Rode's Report 2011:4 Industrial rentals and vacancies 66
Tab
le 8
.2 (
con
tin
ued
) M
ean
pri
me
ind
ust
rial
mar
ket
ren
tals
as
in q
uar
ter
20
11
:3
(R/
m²
p.m
.; g
ross
leas
e; e
xcl V
AT)
Are
a si
ze le
ased
in m
² V
acan
cy
a b
r
25
0
50
0
1.0
00
2
.50
0
5.0
00
Kor
sten
/ N
eave
/ Sid
wel
l/ S
yden
ham
24
,00
24,0
0 22
,50
19,0
0 19
,00
3,2
3,72
7 -0
,094
-0
,95
Sou
th E
nd W
alm
er
21,0
0 21
,00
21,0
0 20
,00
20,0
0 2,
0 3,
163
-0,0
20
-0,8
9 U
itenh
age:
Vol
ksw
agen
are
a/N
elso
n
Man
dela
Bay
Log
istic
s Pa
rk
27,5
0 27
,50
27,5
0 25
,00
25,0
0 1,
0 3,
546
-0,0
39
-0,8
9
Uite
nhag
e: H
ella
/Kru
isrivi
er
17,5
0 17
,50
17,5
0 20
,00
20,0
0 3,
0 2,
537
0,05
4 0,
89
Str
uand
ale
- 17
,25
16,2
5 15
,25
14,0
0 4,
2 -
- -
Mar
kman
Tow
nshi
p 15
,00
13,7
5 13
,75
12,2
5 11
,00
5,5
3,25
1 -0
,097
-0
,97
Pers
ever
ance
28
,00
24,7
5 23
,25
23,2
5 21
,50
1,5
3,71
4 -0
,076
-0
,93
Wal
mer
36
,50
36,5
0 35
,00
33,5
0 32
,00
1,5
3,86
8 -0
,046
-0
,97
Gre
enbu
shes
30
,00
29,0
0 29
,00
29,0
0 25
,25
3,2
3,66
1 -0
,045
-0
,80
Fairvi
ew
40,2
5 40
,25
37,7
5 35
,00
35,0
0 1,
0 4,
016
-0,0
56
-0,9
6 P
ort
Eliz
abet
h
27
,88
2
5,5
2
24
,48
2
2,3
2
20
,82
2
,9
B
loem
fon
tein
Hilt
on
30,
00
27,
00
25,
00
20,
00
18,
00
2,0
4,38
4 -0
,175
-0
,99
East
End
3
5,00
3
6,00
3
1,50
2
2,00
1
5,00
1,
8 5,
313
-0,2
91
-0,9
4 H
arve
y Roa
d 3
5,00
3
0,00
2
5,00
1
9,00
1
5,00
1,
8 5,
150
-0,2
84
-1,0
0 O
ld I
ndus
tria
l 2
8,00
3
0,00
2
0,00
1
5,00
1
2,00
2,
5 5,
193
-0,3
16
-0,9
6 H
amilt
on:
Mill
St
22,
00
20,
00
15,
00
12,
00
10,
00
2,5
4,63
9 -0
,275
-0
,99
Ham
ilton
: G
Lub
be S
t 2
0,00
1
8,00
1
2,00
1
0,00
9
,00
2,5
4,57
8 -0
,286
-0
,97
Esto
ir
45,
00
40,
00
35,
00
30,
00
25,
00
1,0
4,88
0 -0
,192
-1
,00
Blo
emfo
nte
in
30
,71
2
9,6
7
24
,44
1
8,3
8
14
,86
2
,1
W
ind
ho
ek
N
orth
38
,00
38,0
0 35
,00
30,0
0 30
,00
2,0
4,18
8 -0
,095
-0
,95
Lafr
enz
30,0
0 30
,00
30,0
0 30
,00
30,0
0 4,
0 3,
401
0,00
0 -
Sou
th
50,0
0 50
,00
45,0
0 45
,00
40,0
0 1,
0 4,
329
-0,0
72
-0,9
3 Pr
ospe
rita
40
,00
40,0
0 38
,00
35,0
0 30
,00
1,0
4,25
1 -0
,094
-0
,93
Win
dh
oek
3
9,5
0
39
,50
3
7,0
0
35
,00
3
2,5
0
2,0
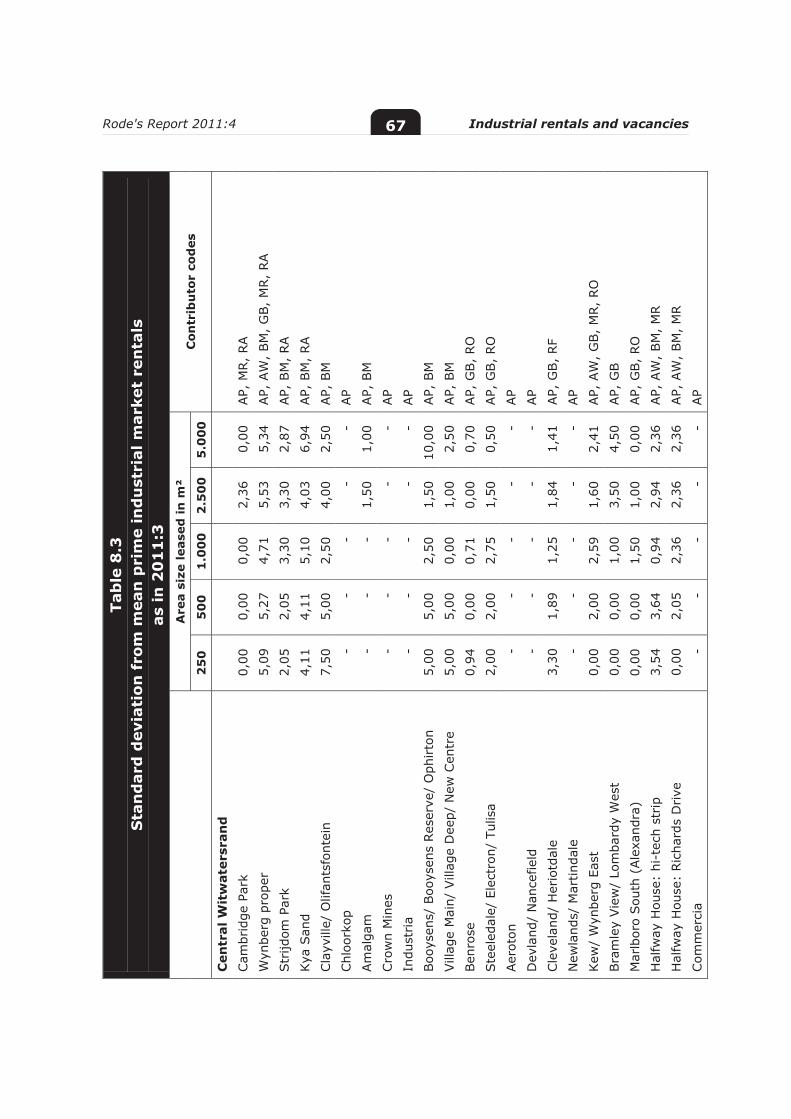
Rode's Report 2011:4 Industrial rentals and vacancies 67
Tab
le 8
.3
Sta
nd
ard
dev
iati
on f
rom
mea
n p
rim
e in
du
stri
al m
arke
t re
nta
ls
as in
20
11
:3
A
rea
size
leas
ed in
m²
Con
trib
uto
r co
des
2
50
5
00
1
.00
0
2.5
00
5
.00
0
Cen
tral
Wit
wat
ersr
and
Cam
brid
ge P
ark
0,00
0,
00
0,00
2,
36
0,00
AP,
MR,
RA
Wyn
berg
pro
per
5,09
5,
27
4,71
5,
53
5,34
AP,
AW
, BM
, G
B,
MR,
RA
Str
ijdom
Par
k 2,
05
2,05
3,
30
3,30
2,
87
AP,
BM
, RA
Kya
San
d 4,
11
4,11
5,
10
4,03
6,
94
AP,
BM
, RA
Cla
yvill
e/ O
lifan
tsfo
ntei
n 7,
50
5,00
2,
50
4,00
2,
50
AP,
BM
Chl
oork
op
- -
- -
- AP
Am
alga
m
- -
- 1,
50
1,00
AP,
BM
Cro
wn
Min
es
- -
- -
- AP
Indu
stria
- -
- -
- AP
Boo
ysen
s/ B
ooys
ens
Res
erve
/ O
phirto
n 5,
00
5,00
2,
50
1,50
10
,00
AP,
BM
Vill
age
Mai
n/ V
illag
e D
eep/
New
Cen
tre
5,00
5,
00
0,00
1,
00
2,50
AP,
BM
Ben
rose
0,
94
0,00
0,
71
0,00
0,
70
AP,
GB,
RO
Ste
eled
ale/
Ele
ctro
n/ T
ulis
a
2,00
2,
00
2,75
1,
50
0,50
AP,
GB,
RO
Aer
oton
-
- -
- -
AP
Dev
land
/ N
ance
field
-
- -
- -
AP
Cle
vela
nd/
Her
iotd
ale
3,30
1,
89
1,25
1,
84
1,41
AP,
GB,
RF
New
land
s/ M
artin
dale
-
- -
- -
AP
Kew
/ W
ynbe
rg E
ast
0,00
2,
00
2,59
1,
60
2,41
AP,
AW
, G
B,
MR,
RO
Bra
mle
y Vie
w/
Lom
bard
y W
est
0,00
0,
00
1,00
3,
50
4,50
AP,
GB
Mar
lbor
o Sou
th (
Ale
xand
ra)
0,00
0,
00
1,50
1,
00
0,00
AP,
GB,
RO
H
alfw
ay H
ouse
: hi
-tec
h st
rip
3,54
3,
64
0,94
2,
94
2,36
AP,
AW
, BM
, M
R
Hal
fway
Hou
se:
Ric
hard
s D
rive
0,
00
2,05
2,
36
2,36
2,
36
AP,
AW
, BM
, M
R
Com
mer
cia
- -
- -
- AP
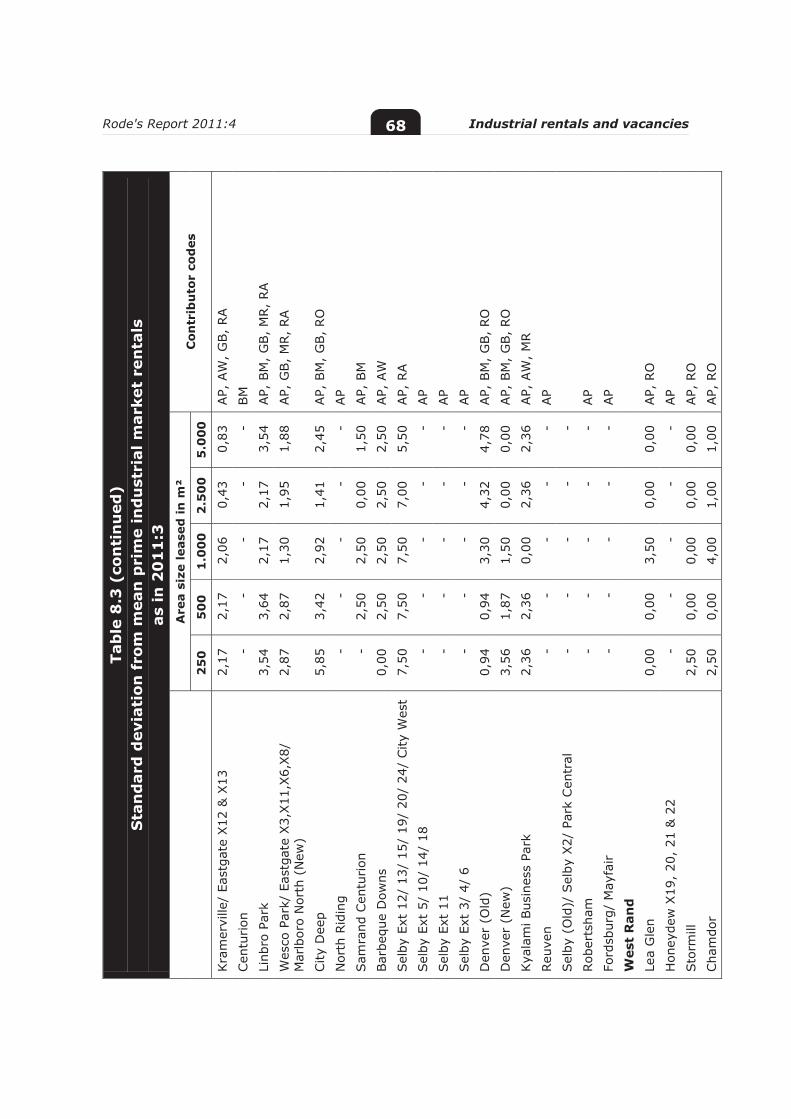
Rode's Report 2011:4 Industrial rentals and vacancies 68
Tab
le 8
.3 (
con
tin
ued
) S
tan
dar
d d
evia
tion
fro
m m
ean
pri
me
ind
ust
rial
mar
ket
ren
tals
as
in 2
01
1:3
A
rea
size
leas
ed in
m²
Con
trib
uto
r co
des
2
50
5
00
1
.00
0
2.5
00
5
.00
0
Kra
mer
ville
/ Ea
stga
te X
12 &
X13
2,
17
2,17
2,
06
0,43
0,
83
AP,
AW
, G
B,
RA
Cen
turion
-
- -
- -
BM
Linb
ro P
ark
3,54
3,
64
2,17
2,
17
3,54
AP,
BM
, G
B,
MR,
RA
Wes
co P
ark/
Eas
tgat
e X3,
X11
,X6,
X8/
M
arlb
oro
Nor
th (
New
) 2,
87
2,87
1,
30
1,95
1,
88
AP,
GB,
MR,
RA
City
Dee
p 5,
85
3,42
2,
92
1,41
2,
45
AP,
BM
, G
B,
RO
N
orth
Rid
ing
- -
- -
- AP
Sam
rand
Cen
turion
-
2,50
2,
50
0,00
1,
50
AP,
BM
Bar
bequ
e D
owns
0,
00
2,50
2,
50
2,50
2,
50
AP,
AW
Sel
by E
xt 1
2/ 1
3/ 1
5/ 1
9/ 2
0/ 2
4/ C
ity W
est
7,50
7,
50
7,50
7,
00
5,50
AP,
RA
Sel
by E
xt 5
/ 10
/ 14
/ 18
-
- -
- -
AP
Sel
by E
xt 1
1 -
- -
- -
AP
Sel
by E
xt 3
/ 4/
6
- -
- -
- AP
Den
ver
(Old
) 0,
94
0,94
3,
30
4,32
4,
78
AP,
BM
, G
B,
RO
Den
ver
(New
) 3,
56
1,87
1,
50
0,00
0,
00
AP,
BM
, G
B,
RO
Kya
lam
i Bus
ines
s Pa
rk
2,36
2,
36
0,00
2,
36
2,36
AP,
AW
, M
R
Reu
ven
- -
- -
- AP
Sel
by (
Old
)/ S
elby
X2/
Par
k C
entr
al
- -
- -
-
Rob
erts
ham
-
- -
- -
AP
Ford
sbur
g/ M
ayfa
ir
- -
- -
- AP
Wes
t R
and
Le
a G
len
0,00
0,
00
3,50
0,
00
0,00
AP,
RO
Hon
eyde
w X
19,
20,
21 &
22
- -
- -
- AP
Sto
rmill
2,
50
0,00
0,
00
0,00
0,
00
AP,
RO
Cha
mdo
r 2,
50
0,00
4,
00
1,00
1,
00
AP,
RO
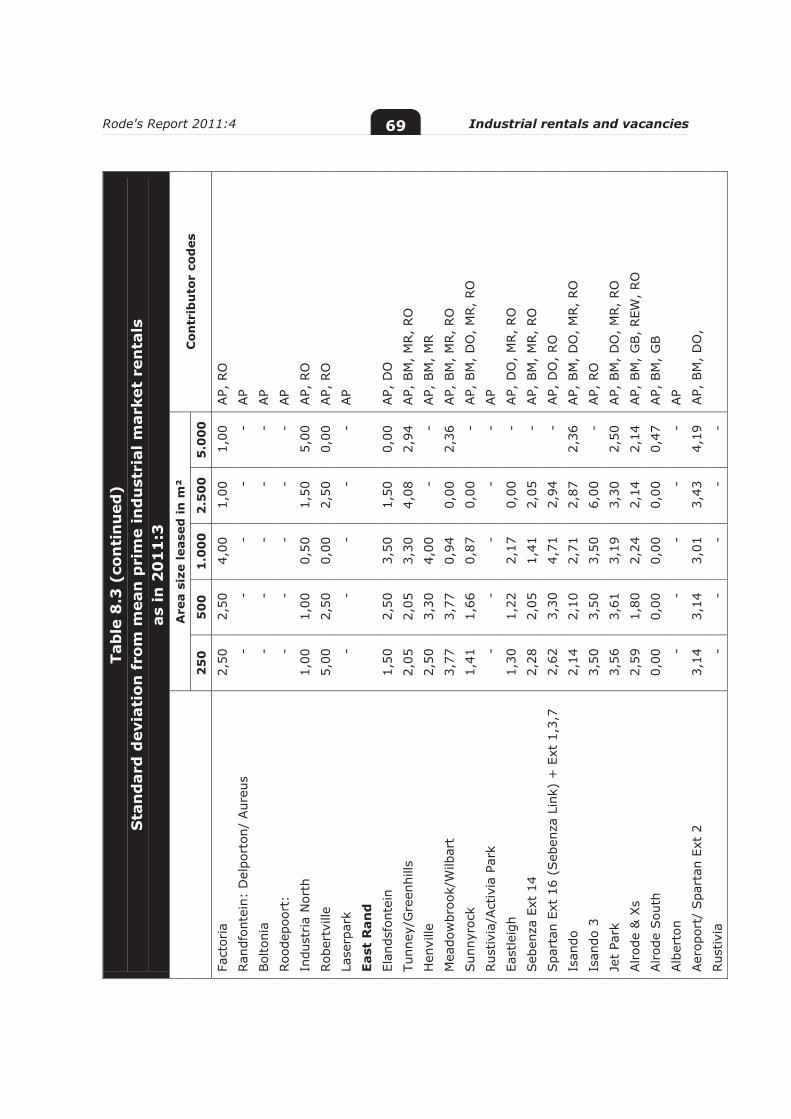
Rode's Report 2011:4 Industrial rentals and vacancies 69
Tab
le 8
.3 (
con
tin
ued
) S
tan
dar
d d
evia
tion
fro
m m
ean
pri
me
ind
ust
rial
mar
ket
ren
tals
as
in 2
01
1:3
A
rea
size
leas
ed in
m²
Con
trib
uto
r co
des
2
50
5
00
1
.00
0
2.5
00
5
.00
0
Fact
oria
2,
50
2,50
4,
00
1,00
1,
00
AP,
RO
Ran
dfon
tein
: D
elpo
rton
/ Aur
eus
- -
- -
- AP
Bol
toni
a -
- -
- -
AP
Roo
depo
ort:
-
- -
- -
AP
Indu
stria
Nor
th
1,00
1,
00
0,50
1,
50
5,00
AP,
RO
Rob
ertv
ille
5,00
2,
50
0,00
2,
50
0,00
AP,
RO
La
serp
ark
- -
- -
- AP
East
Ran
d
Elan
dsfo
ntei
n 1,
50
2,50
3,
50
1,50
0,
00
AP,
DO
Tunn
ey/G
reen
hills
2,
05
2,05
3,
30
4,08
2,
94
AP,
BM
, M
R,
RO
H
envi
lle
2,50
3,
30
4,00
-
- AP,
BM
, M
R
Mea
dow
broo
k/W
ilbar
t 3,
77
3,77
0,
94
0,00
2,
36
AP,
BM
, M
R,
RO
Sun
nyro
ck
1,41
1,
66
0,87
0,
00
- AP,
BM
, D
O,
MR,
RO
Rus
tivia
/Act
ivia
Par
k -
- -
- -
AP
East
leig
h 1,
30
1,22
2,
17
0,00
-
AP,
DO
, M
R,
RO
Seb
enza
Ext
14
2,28
2,
05
1,41
2,
05
- AP,
BM
, M
R,
RO
Spa
rtan
Ext
16
(Seb
enza
Lin
k) +
Ext
1,3
,7
2,62
3,
30
4,71
2,
94
- AP,
DO
, RO
Is
ando
2,
14
2,10
2,
71
2,87
2,
36
AP,
BM
, D
O,
MR,
RO
Isan
do 3
3,
50
3,50
3,
50
6,00
-
AP,
RO
Jet
Park
3,
56
3,61
3,
19
3,30
2,
50
AP,
BM
, D
O,
MR,
RO
Alrod
e &
Xs
2,59
1,
80
2,24
2,
14
2,14
AP,
BM
, G
B,
REW
, RO
Alrod
e Sou
th
0,00
0,
00
0,00
0,
00
0,47
AP,
BM
, G
B
Alb
erto
n -
- -
- -
AP
Aer
opor
t/ S
part
an E
xt 2
3,
14
3,14
3,
01
3,43
4,
19
AP,
BM
, D
O,
Rus
tivia
-
- -
- -
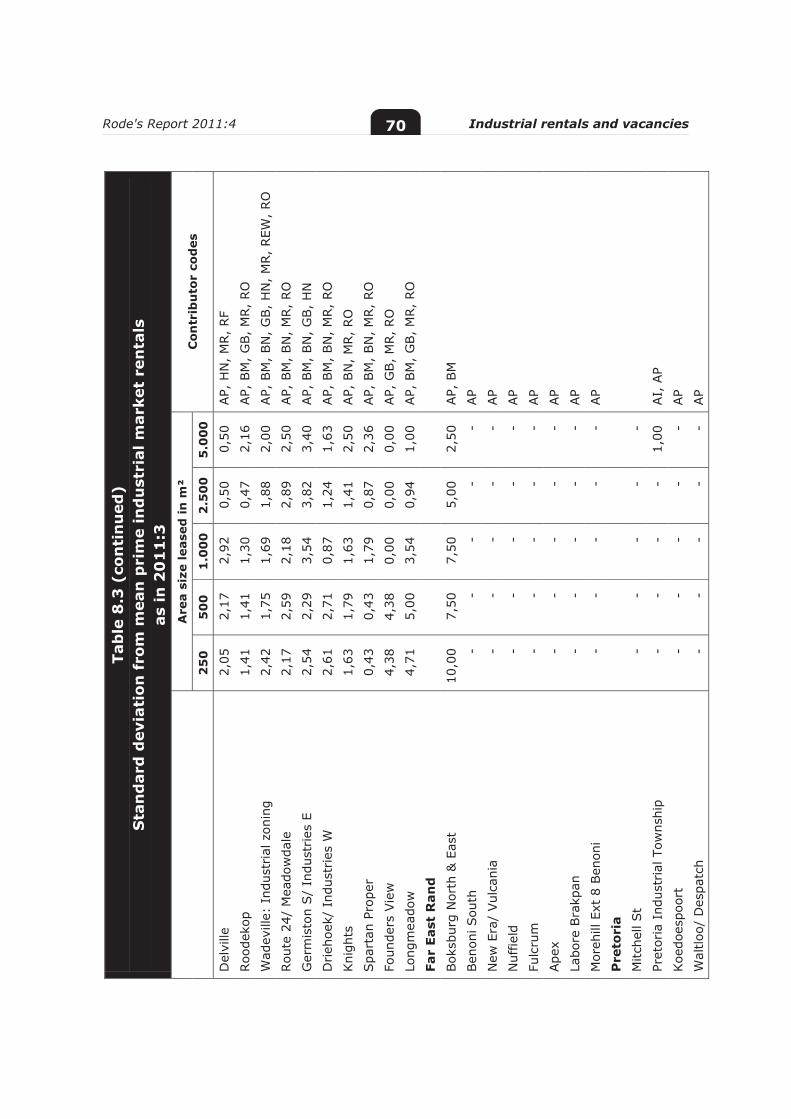
Rode's Report 2011:4 Industrial rentals and vacancies 70
Tab
le 8
.3 (
con
tin
ued
) S
tan
dar
d d
evia
tion
fro
m m
ean
pri
me
ind
ust
rial
mar
ket
ren
tals
as
in 2
01
1:3
A
rea
size
leas
ed in
m²
Con
trib
uto
r co
des
2
50
5
00
1
.00
0
2.5
00
5
.00
0
Del
ville
2,
05
2,17
2,
92
0,50
0,
50
AP,
HN
, M
R,
RF
Roo
deko
p 1,
41
1,41
1,
30
0,47
2,
16
AP,
BM
, G
B,
MR,
RO
Wad
evill
e: I
ndus
tria
l zon
ing
2,42
1,
75
1,69
1,
88
2,00
AP,
BM
, BN
, G
B,
HN
, M
R,
REW
, RO
Rou
te 2
4/ M
eado
wda
le
2,17
2,
59
2,18
2,
89
2,50
AP,
BM
, BN
, M
R,
RO
Ger
mis
ton
S/
Indu
stries
E
2,54
2,
29
3,54
3,
82
3,40
AP,
BM
, BN
, G
B,
HN
D
rieh
oek/
Ind
ustr
ies
W
2,61
2,
71
0,87
1,
24
1,63
AP,
BM
, BN
, M
R,
RO
Kni
ghts
1,
63
1,79
1,
63
1,41
2,
50
AP,
BN
, M
R,
RO
Spa
rtan
Pro
per
0,43
0,
43
1,79
0,
87
2,36
AP,
BM
, BN
, M
R,
RO
Foun
ders
Vie
w
4,38
4,
38
0,00
0,
00
0,00
AP,
GB,
MR,
RO
Lo
ngm
eado
w
4,71
5,
00
3,54
0,
94
1,00
AP,
BM
, G
B,
MR,
RO
Far
East
Ran
d
Bok
sbur
g N
orth
& E
ast
10,0
0 7,
50
7,50
5,
00
2,50
AP,
BM
Ben
oni S
outh
-
- -
- -
AP
New
Era
/ Vul
cani
a -
- -
- -
AP
Nuf
field
-
- -
- -
AP
Fulc
rum
-
- -
- -
AP
Ape
x -
- -
- -
AP
Labo
re B
rakp
an
- -
- -
- AP
Mor
ehill
Ext
8 B
enon
i -
- -
- -
AP
Pre
tori
a
M
itche
ll St
- -
- -
-
Pret
oria
Ind
ustr
ial T
owns
hip
- -
- -
1,00
AI,
AP
Koe
does
poor
t -
- -
- -
AP
Wal
tloo/
Des
patc
h -
- -
- -
AP
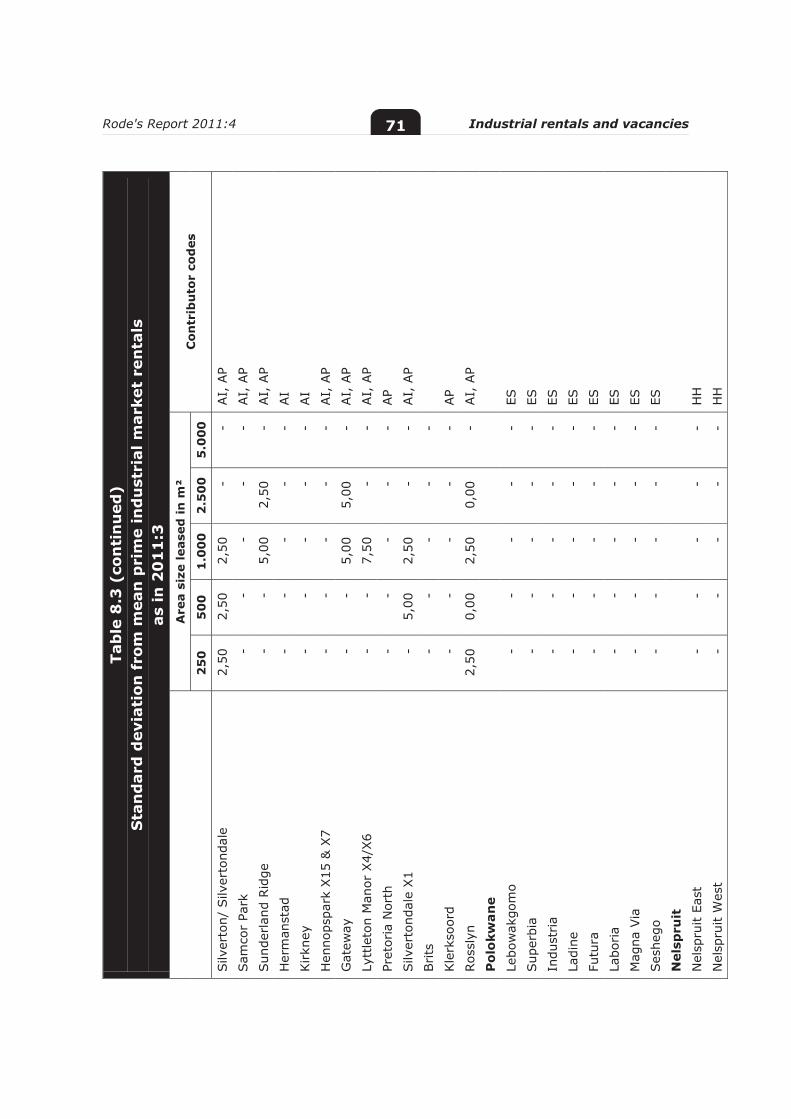
Rode's Report 2011:4 Industrial rentals and vacancies 71
Tab
le 8
.3 (
con
tin
ued
) S
tan
dar
d d
evia
tion
fro
m m
ean
pri
me
ind
ust
rial
mar
ket
ren
tals
as
in 2
01
1:3
A
rea
size
leas
ed in
m²
Con
trib
uto
r co
des
2
50
5
00
1
.00
0
2.5
00
5
.00
0
Silv
erto
n/ S
ilver
tond
ale
2,50
2,
50
2,50
-
- AI,
AP
Sam
cor
Park
-
- -
- -
AI,
AP
Sun
derlan
d Rid
ge
- -
5,00
2,
50
- AI,
AP
Her
man
stad
-
- -
- -
AI
Kirkn
ey
- -
- -
- AI
Hen
nops
park
X15
& X
7 -
- -
- -
AI,
AP
Gat
eway
-
- 5,
00
5,00
-
AI,
AP
Lytt
leto
n M
anor
X4/
X6
- -
7,50
-
- AI,
AP
Pret
oria
Nor
th
- -
- -
- AP
Silv
erto
ndal
e X1
- 5,
00
2,50
-
- AI,
AP
Brits
-
- -
- -
Kle
rkso
ord
- -
- -
- AP
Ros
slyn
2,
50
0,00
2,
50
0,00
-
AI,
AP
Pol
okw
ane
Lebo
wak
gom
o -
- -
- -
ES
Sup
erbi
a -
- -
- -
ES
Indu
stria
- -
- -
- ES
La
dine
-
- -
- -
ES
Futu
ra
- -
- -
- ES
Labo
ria
- -
- -
- ES
Mag
na V
ia
- -
- -
- ES
Ses
hego
-
- -
- -
ES
Nel
spru
it
Nel
spru
it Ea
st
- -
- -
- H
H
Nel
spru
it W
est
- -
- -
- H
H
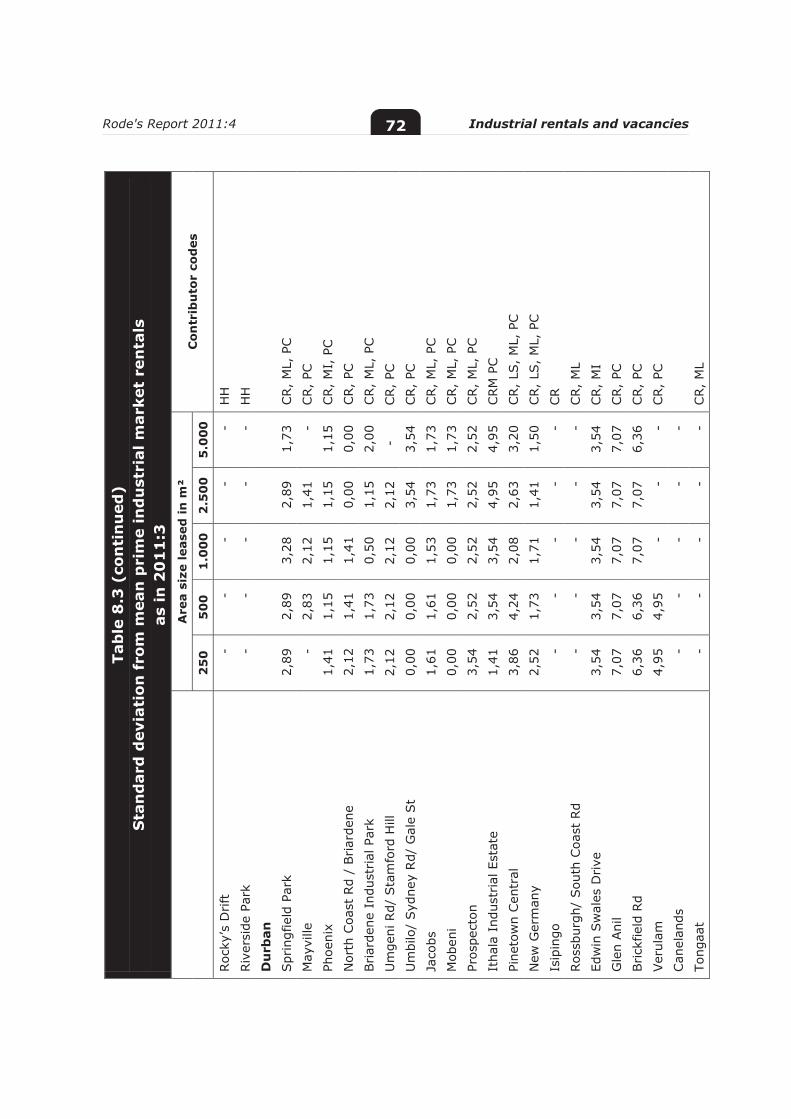
Rode's Report 2011:4 Industrial rentals and vacancies 72
Tab
le 8
.3 (
con
tin
ued
) S
tan
dar
d d
evia
tion
fro
m m
ean
pri
me
ind
ust
rial
mar
ket
ren
tals
as
in 2
01
1:3
A
rea
size
leas
ed in
m²
Con
trib
uto
r co
des
2
50
5
00
1
.00
0
2.5
00
5
.00
0
Roc
ky’s
Drift
-
- -
- -
HH
Riv
ersi
de P
ark
- -
- -
- H
H
Du
rban
Spr
ingf
ield
Par
k 2,
89
2,89
3,
28
2,89
1,
73
CR,
ML,
PC
May
ville
-
2,83
2,
12
1,41
-
CR,
PC
Phoe
nix
1,41
1,
15
1,15
1,
15
1,15
CR,
MI,
PC
Nor
th C
oast
Rd
/ Briar
dene
2,
12
1,41
1,
41
0,00
0,
00
CR,
PC
Briar
dene
Ind
ustr
ial P
ark
1,73
1,
73
0,50
1,
15
2,00
CR,
ML,
PC
Um
geni
Rd/
Sta
mfo
rd H
ill
2,12
2,
12
2,12
2,
12
- CR,
PC
Um
bilo
/ Syd
ney
Rd/
Gal
e St
0,00
0,
00
0,00
3,
54
3,54
CR,
PC
Jaco
bs
1,61
1,
61
1,53
1,
73
1,73
CR,
ML,
PC
Mob
eni
0,00
0,
00
0,00
1,
73
1,73
CR,
ML,
PC
Pros
pect
on
3,54
2,
52
2,52
2,
52
2,52
CR,
ML,
PC
Itha
la I
ndus
tria
l Est
ate
1,41
3,
54
3,54
4,
95
4,95
CRM
PC
Pine
tow
n C
entr
al
3,86
4,
24
2,08
2,
63
3,20
CR,
LS,
ML,
PC
New
Ger
man
y 2,
52
1,73
1,
71
1,41
1,
50
CR,
LS,
ML,
PC
Isip
ingo
-
- -
- -
CR
Ros
sbur
gh/
Sou
th C
oast
Rd
- -
- -
- CR,
ML
Edw
in S
wal
es D
rive
3,
54
3,54
3,
54
3,54
3,
54
CR,
MI
Gle
n Ani
l 7,
07
7,07
7,
07
7,07
7,
07
CR,
PC
Brick
field
Rd
6,36
6,
36
7,07
7,
07
6,36
CR,
PC
Ver
ulam
4,
95
4,95
-
- -
CR,
PC
Can
elan
ds
- -
- -
-
Tong
aat
- -
- -
- CR,
ML
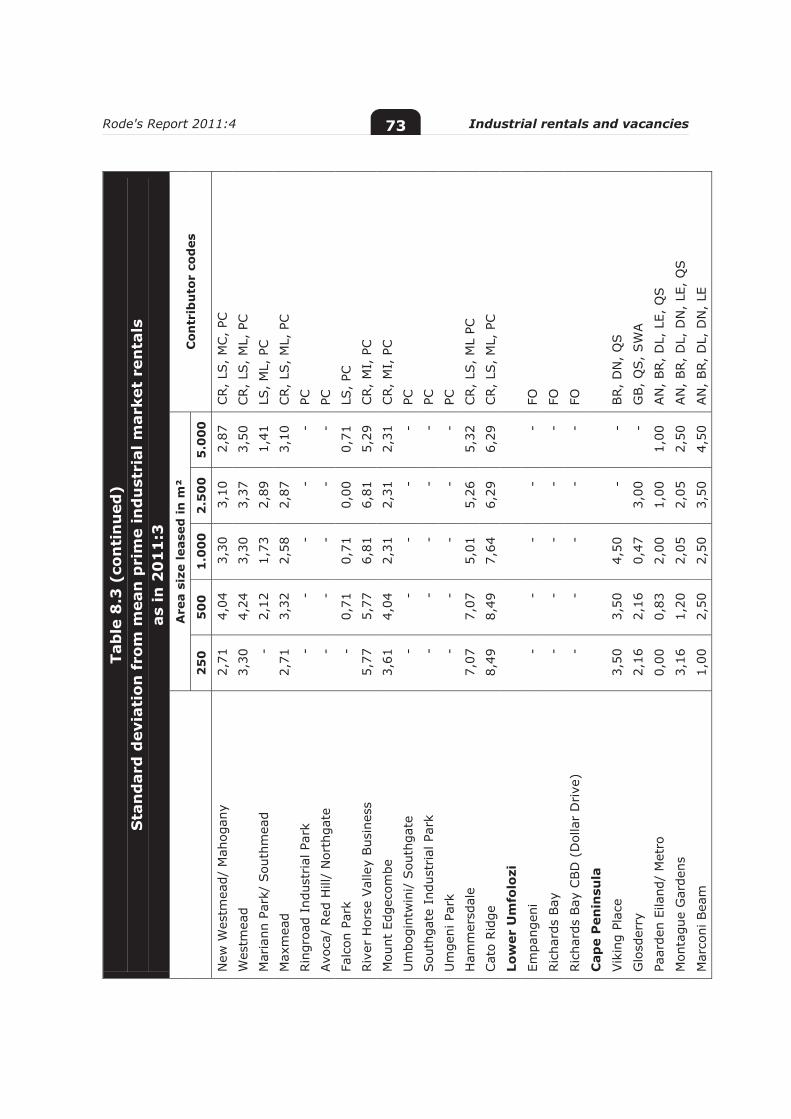
Rode's Report 2011:4 Industrial rentals and vacancies 73
Tab
le 8
.3 (
con
tin
ued
) S
tan
dar
d d
evia
tion
fro
m m
ean
pri
me
ind
ust
rial
mar
ket
ren
tals
as
in 2
01
1:3
A
rea
size
leas
ed in
m²
Con
trib
uto
r co
des
2
50
5
00
1
.00
0
2.5
00
5
.00
0
New
Wes
tmea
d/ M
ahog
any
2,
71
4,04
3,
30
3,10
2,
87
CR,
LS,
MC,
PC
Wes
tmea
d 3,
30
4,24
3,
30
3,37
3,
50
CR,
LS,
ML,
PC
Mar
iann
Par
k/ S
outh
mea
d -
2,12
1,
73
2,89
1,
41
LS,
ML,
PC
Max
mea
d 2,
71
3,32
2,
58
2,87
3,
10
CR,
LS,
ML,
PC
Rin
groa
d In
dust
rial
Par
k -
- -
- -
PC
Avo
ca/
Red
Hill
/ N
orth
gate
-
- -
- -
PC
Falc
on P
ark
- 0,
71
0,71
0,
00
0,71
LS
, PC
Riv
er H
orse
Val
ley
Bus
ines
s
5,77
5,
77
6,81
6,
81
5,29
CR,
MI,
PC
Mou
nt E
dgec
ombe
3,
61
4,04
2,
31
2,31
2,
31
CR,
MI,
PC
Um
bogi
ntw
ini/
Sou
thga
te
- -
- -
- PC
Sou
thga
te I
ndus
tria
l Par
k -
- -
- -
PC
Um
geni
Par
k -
- -
- -
PC
Ham
mer
sdal
e 7,
07
7,07
5,
01
5,26
5,
32
CR,
LS,
ML
PC
Cat
o Rid
ge
8,49
8,
49
7,64
6,
29
6,29
CR,
LS,
ML,
PC
Low
er U
mfo
lozi
Empa
ngen
i -
- -
- -
FO
Ric
hard
s Bay
-
- -
- -
FO
Ric
hard
s Bay
CBD
(D
olla
r D
rive
) -
- -
- -
FO
Cap
e P
enin
sula
Vik
ing
Plac
e 3,
50
3,50
4,
50
- -
BR,
DN
, Q
S
Glo
sder
ry
2,16
2,
16
0,47
3,
00
- G
B,
QS,
SW
A
Paar
den
Eila
nd/
Met
ro
0,00
0,
83
2,00
1,
00
1,00
AN
, BR,
DL,
LE,
QS
Mon
tagu
e G
arde
ns
3,16
1,
20
2,05
2,
05
2,50
AN
, BR,
DL,
DN
, LE
, Q
S
Mar
coni
Bea
m
1,00
2,
50
2,50
3,
50
4,50
AN
, BR,
DL,
DN
, LE
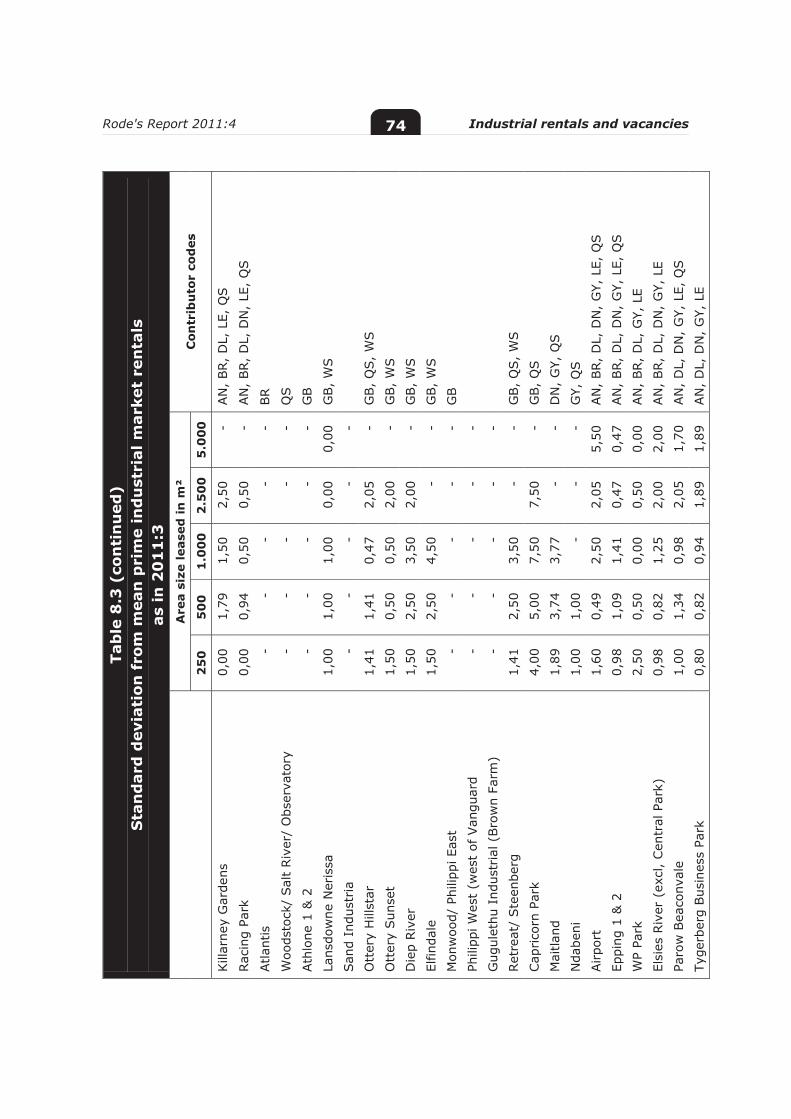
Rode's Report 2011:4 Industrial rentals and vacancies 74
Tab
le 8
.3 (
con
tin
ued
) S
tan
dar
d d
evia
tion
fro
m m
ean
pri
me
ind
ust
rial
mar
ket
ren
tals
as
in 2
01
1:3
A
rea
size
leas
ed in
m²
Con
trib
uto
r co
des
2
50
5
00
1
.00
0
2.5
00
5
.00
0
Kill
arne
y G
arde
ns
0,00
1,
79
1,50
2,
50
- AN
, BR,
DL,
LE,
QS
Rac
ing
Park
0,
00
0,94
0,
50
0,50
-
AN
, BR,
DL,
DN
, LE
, Q
S
Atla
ntis
-
- -
- -
BR
Woo
dsto
ck/
Sal
t Riv
er/
Obs
erva
tory
-
- -
- -
QS
Ath
lone
1 &
2
- -
- -
- G
B
Lans
dow
ne N
eris
sa
1,00
1,
00
1,00
0,
00
0,00
G
B,
WS
San
d In
dust
ria
- -
- -
-
Ott
ery
Hill
star
1,
41
1,41
0,
47
2,05
-
GB,
QS,
WS
Ott
ery
Sun
set
1,50
0,
50
0,50
2,
00
- G
B,
WS
Die
p Riv
er
1,50
2,
50
3,50
2,
00
- G
B,
WS
Elfin
dale
1,
50
2,50
4,
50
- -
GB,
WS
Mon
woo
d/ P
hilip
pi E
ast
- -
- -
- G
B
Phili
ppi W
est
(wes
t of
Van
guar
d
- -
- -
-
Gug
ulet
hu I
ndus
tria
l (Bro
wn
Farm
) -
- -
- -
Ret
reat
/ Ste
enbe
rg
1,41
2,
50
3,50
-
- G
B,
QS,
WS
Cap
rico
rn P
ark
4,00
5,
00
7,50
7,
50
- G
B,
QS
Mai
tland
1,
89
3,74
3,
77
- -
DN
, G
Y, Q
S
Nda
beni
1,
00
1,00
-
- -
GY,
QS
Airpo
rt
1,60
0,
49
2,50
2,
05
5,50
AN
, BR,
DL,
DN
, G
Y, L
E, Q
S
Eppi
ng 1
& 2
0,
98
1,09
1,
41
0,47
0,
47
AN
, BR,
DL,
DN
, G
Y, L
E, Q
S
WP
Park
2,
50
0,50
0,
00
0,50
0,
00
AN
, BR,
DL,
GY,
LE
Elsi
es R
iver
(ex
cl,
Cen
tral
Par
k)
0,98
0,
82
1,25
2,
00
2,00
AN
, BR,
DL,
DN
, G
Y, L
E
Paro
w B
eaco
nval
e 1,
00
1,34
0,
98
2,05
1,
70
AN
, D
L, D
N,
GY,
LE,
QS
Tyge
rber
g Bus
ines
s Pa
rk
0,80
0,
82
0,94
1,
89
1,89
AN
, D
L, D
N,
GY,
LE
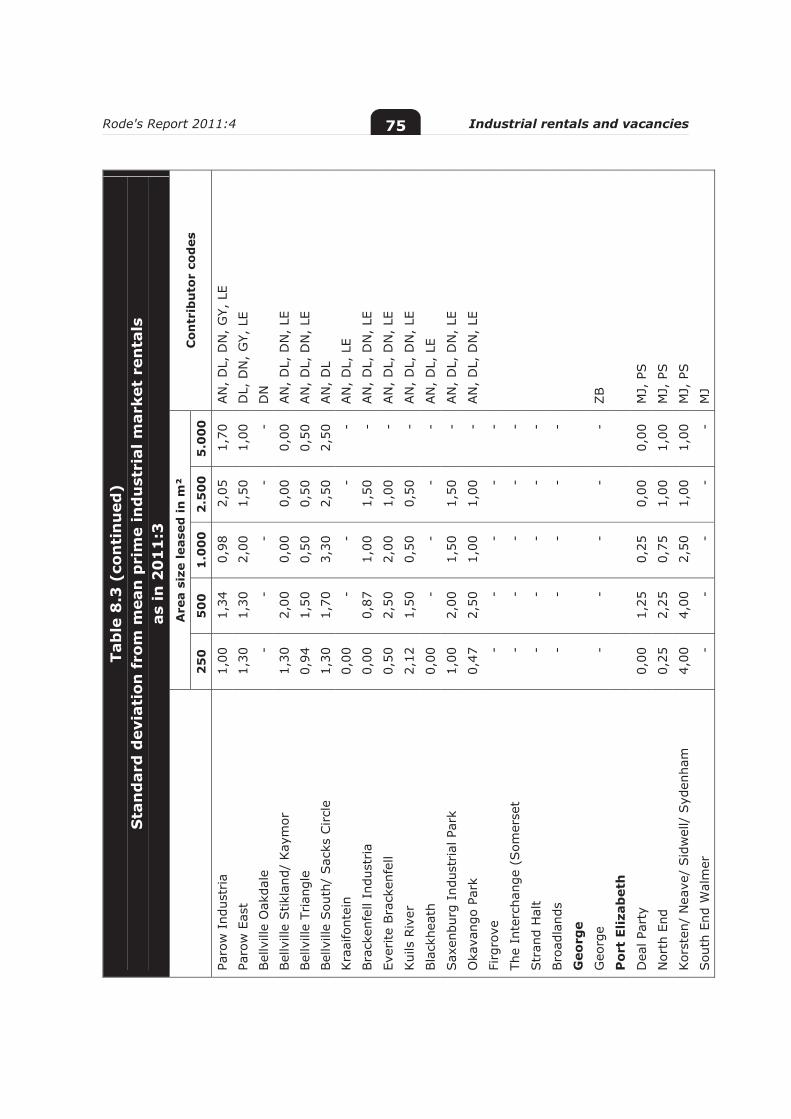
Rode's Report 2011:4 Industrial rentals and vacancies 75
Tab
le 8
.3 (
con
tin
ued
) S
tan
dar
d d
evia
tion
fro
m m
ean
pri
me
ind
ust
rial
mar
ket
ren
tals
as
in 2
01
1:3
A
rea
size
leas
ed in
m²
Con
trib
uto
r co
des
2
50
5
00
1
.00
0
2.5
00
5
.00
0
Paro
w I
ndus
tria
1,
00
1,34
0,
98
2,05
1,
70
AN
, D
L, D
N,
GY,
LE
Paro
w E
ast
1,30
1,
30
2,00
1,
50
1,00
D
L, D
N,
GY,
LE
Bel
lvill
e O
akda
le
- -
- -
- D
N
Bel
lvill
e Stik
land
/ Kay
mor
1,
30
2,00
0,
00
0,00
0,
00
AN
, D
L, D
N,
LE
Bel
lvill
e Tr
iang
le
0,94
1,
50
0,50
0,
50
0,50
AN
, D
L, D
N,
LE
Bel
lvill
e Sou
th/
Sac
ks C
ircl
e 1,
30
1,70
3,
30
2,50
2,
50
AN
, D
L
Kra
aifo
ntei
n 0,
00
- -
- -
AN
, D
L, L
E
Bra
cken
fell
Indu
stria
0,00
0,
87
1,00
1,
50
- AN
, D
L, D
N,
LE
Ever
ite B
rack
enfe
ll 0,
50
2,50
2,
00
1,00
-
AN
, D
L, D
N,
LE
Kui
ls R
iver
2,
12
1,50
0,
50
0,50
-
AN
, D
L, D
N,
LE
Bla
ckhe
ath
0,00
-
- -
- AN
, D
L, L
E
Sax
enbu
rg I
ndus
tria
l Par
k 1,
00
2,00
1,
50
1,50
-
AN
, D
L, D
N,
LE
Oka
vang
o Pa
rk
0,47
2,
50
1,00
1,
00
- AN
, D
L, D
N,
LE
Firg
rove
-
- -
- -
The
Inte
rcha
nge
(Som
erse
t
- -
- -
-
Str
and
Hal
t -
- -
- -
Bro
adla
nds
- -
- -
-
Geo
rge
Geo
rge
- -
- -
- ZB
Po
rt E
lizab
eth
Dea
l Par
ty
0,00
1,
25
0,25
0,
00
0,00
M
J, P
S
Nor
th E
nd
0,25
2,
25
0,75
1,
00
1,00
M
J, P
S
Kor
sten
/ N
eave
/ Sid
wel
l/ S
yden
ham
4,
00
4,00
2,
50
1,00
1,
00
MJ,
PS
Sou
th E
nd W
alm
er
- -
- -
- M
J
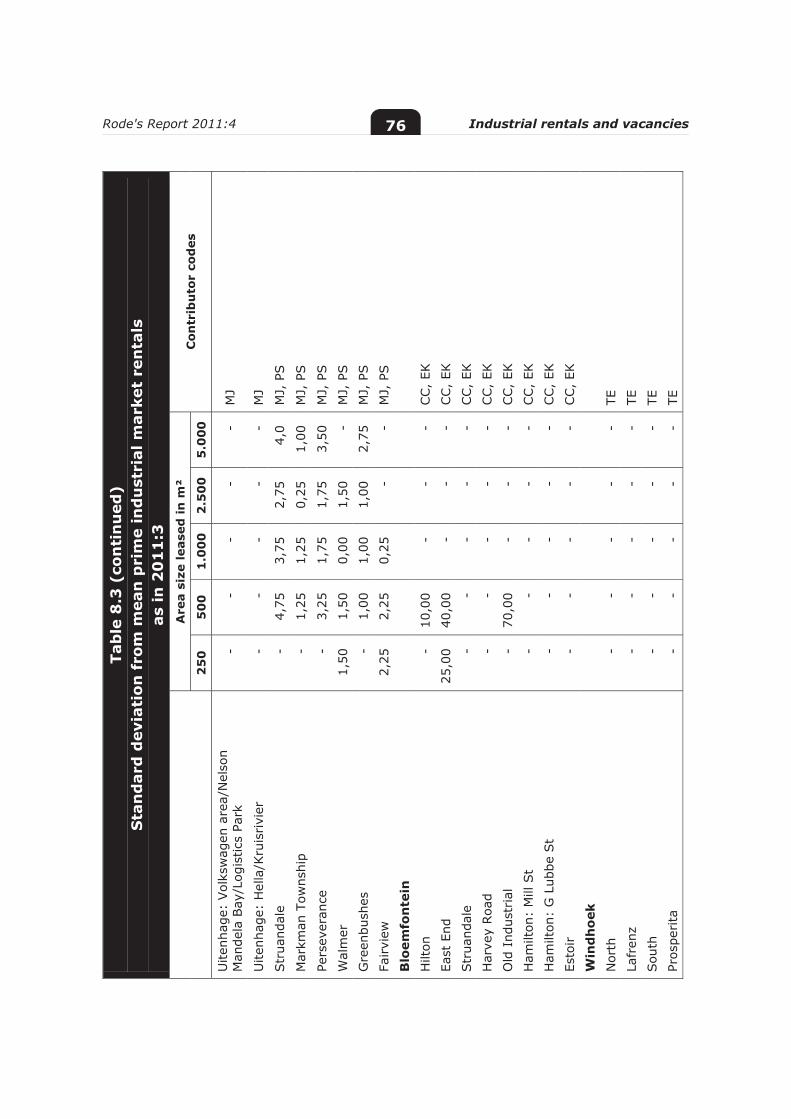
Rode's Report 2011:4 Industrial rentals and vacancies 76
Tab
le 8
.3 (
con
tin
ued
) S
tan
dar
d d
evia
tion
fro
m m
ean
pri
me
ind
ust
rial
mar
ket
ren
tals
as
in 2
01
1:3
A
rea
size
leas
ed in
m²
Con
trib
uto
r co
des
2
50
5
00
1
.00
0
2.5
00
5
.00
0
Uite
nhag
e: V
olks
wag
en a
rea/
Nel
son
Man
dela
Bay
/Log
istic
s Pa
rk
- -
- -
- M
J
Uite
nhag
e: H
ella
/Kru
isrivi
er
- -
- -
- M
J
Str
uand
ale
- 4,
75
3,75
2,
75
4,0
MJ,
PS
Mar
kman
Tow
nshi
p -
1,25
1,
25
0,25
1,
00
MJ,
PS
Pers
ever
ance
-
3,25
1,
75
1,75
3,
50
MJ,
PS
Wal
mer
1,
50
1,50
0,
00
1,50
-
MJ,
PS
Gre
enbu
shes
-
1,00
1,
00
1,00
2,
75
MJ,
PS
Fairvi
ew
2,25
2,
25
0,25
-
- M
J, P
S
Blo
emfo
nte
in
Hilt
on
- 10
,00
- -
- CC,
EK
East
End
25
,00
40,0
0 -
- -
CC,
EK
Str
uand
ale
- -
- -
- CC,
EK
Har
vey
Roa
d -
- -
- -
CC,
EK
Old
Ind
ustr
ial
- 70
,00
- -
- CC,
EK
Ham
ilton
: M
ill S
t -
- -
- -
CC,
EK
Ham
ilton
: G
Lub
be S
t -
- -
- -
CC,
EK
Esto
ir
- -
- -
- CC,
EK
Win
dh
oek
Nor
th
- -
- -
- TE
La
fren
z -
- -
- -
TE
Sou
th
- -
- -
- TE
Pr
ospe
rita
-
- -
- -
TE

Rode's Report 2011:4 Industrial rentals and vacancies 77
Notes to the industrial rental tables
1. The rentals are the achievable or market rates for the quarter shown in the table heading, and apply to industrial and warehouse space for the area sizes indicated. The rentals are the averages of the rates as per our panels of experts in the various cities.
2. The rental rates assume gross leases, market escalation rates and leases of 3 to 5 years.
3. In terms of a gross lease, the tenant in a stand-alone building typically pays only for his refuse removal, water and electricity, as well as internal maintenance and increases in rates and taxes. He provides and pays for his own security. All other expenses are for the account of the landlord. In a park the tenant pays, in addition to his gross rental, his pro rata share of security costs, security lighting and landscaping.
4. The rental rates also apply to the office portion, where this is less than 10% of the total building area. For larger office portions, the office rental is, as a rule of thumb, about 150% of the industrial rental rate.
5. Prime space is space that is easily lettable because it satisfies each of the following prerequisites:
a. • generally in a good condition;
b. • satisfactory macro access (i.e. access to freeway);
c. • satisfactory micro access (i.e. from street to building);
d. • proper loading facilities;
e. • eaves >4,0m (excluding micro/mini units);
f. • on ground level;
g. • adequate three-phase electrical power;
h. • clear spans.
The eight conditions above are prerequisites for space to be considered prime. However, a building may possess additional enhancements that could improve lettability through increasing the size of the potential tenant pool. Such enhancements could include suffi-cient office accommodation, adequate parking, sprinkler systems, masonry up to sill height, adequate floor loadings, roof insulation, sufficient yardspace and a good location (as opposed to access).
6. Secondary space is space which is not classifiable as prime because it does not satisfy all eight prerequisites for prime space listed above. Such space is typically old buildings or structures which have been haphazardly renovated. They would have poor access, too little yardspace or office accommodation, inadequate goods lifts, no three-phase power and obsolete electrics and ablution facilities. Such space is often (but not exclusively) found in highly urbanised areas.
Rode's Report 2011:4 Industrial rentals and vacancies 78
7. Vacancy scale for industrial townships. The vacancy levels are based on a scale of 0 to 9 as shown below:
0 1 2 3 4 5 6 7 8 9
Nil Low Medium High
The scale should be interpreted as follows:
0 = no vacancy
1 = ‘low–’ vacancy;
2 = ‘low’ vacancy
3 = ‘low+’ vacancy
4 = ‘medium–’ vacancy;
5 = ‘medium’ vacancy
6 = ‘medium+’ vacancy
7 = ‘high–’ vacancy;
8 = ‘high’ vacancy
9 = ‘high+’ vacancy
where: low = <10% vacancy;
medium = 10% - 20% vacancy;
high = >20% vacancy.
8. For notes on how to use a regression equation in order to interpolate a rental rate, see Annexure 3.
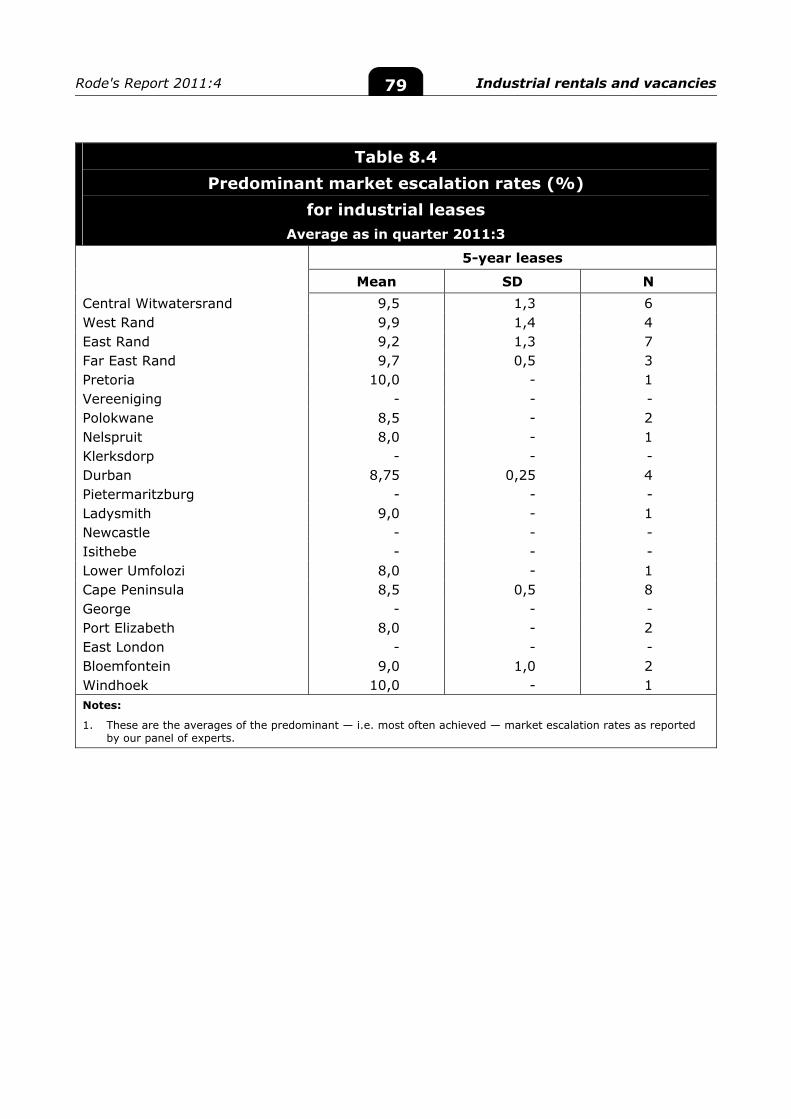
Rode's Report 2011:4 Industrial rentals and vacancies 79
Table 8.4 Predominant market escalation rates (%)
for industrial leases Average as in quarter 2011:3
5-year leases
Mean SD N Central Witwatersrand 9,5 1,3 6 West Rand 9,9 1,4 4 East Rand 9,2 1,3 7 Far East Rand 9,7 0,5 3 Pretoria 10,0 - 1 Vereeniging - - - Polokwane 8,5 - 2 Nelspruit 8,0 - 1 Klerksdorp - - - Durban 8,75 0,25 4 Pietermaritzburg - - - Ladysmith 9,0 - 1 Newcastle - - - Isithebe - - - Lower Umfolozi 8,0 - 1 Cape Peninsula 8,5 0,5 8 George - - - Port Elizabeth 8,0 - 2 East London - - - Bloemfontein 9,0 1,0 2 Windhoek 10,0 - 1 Notes:
1. These are the averages of the predominant — i.e. most often achieved — market escalation rates as reported by our panel of experts.
Rode's Report 2011:4 Industrial rentals and vacancies 80
Table 8.5 Indicative operating expenses
for industrial buildings As in quarter 2011:3 in rands per m² per month
Stand-alone Park
R/m² SD N R/m² SD N Central Witwatersrand 5,60 1,16 5 8,42 0,93 6 West Rand 5,38 1,52 4 6,83 1,31 3 East Rand 4,84 0,21 5 7,88 0,22 4 Far East Rand 4,00 0 2 5,75 0,75 2 Pretoria 4,50 - 1 8,00 - 1 Vereeniging - - - - - - Polokwane 5,50 - 1 9,00 - 1 Nelspruit 7,00 - 1 10,00 - 1 Klerksdorp - - - - - - Durban 9,88 1,67 4 11,85 1,65 3 Pietermaritzburg - - - - - - Ladysmith - - - - - - Newcastle - - - - - - Isithebe - - - - - - Lower Umfolozi 2,40 - 1 3,50 - 1 Cape Peninsula 5,00 1,15 6 6,88 0,89 6 George 2,50 - 1 2,20 - 1 Port Elizabeth 15,00 - 1 - - - East London - - - - - - Bloemfontein 4,75 4,75 2 0,00 - 1 Windhoek 10,00 - 1 10,00 - 1 Notes: The operating expenses are estimates for the past 12 months and are as per our expert panellists in the various cities, The following items are included:
stand-alone buildings: rates and taxes and insurance (incl, Sasria) and
park buildings: as above, plus security, security lighting, landscaping and management,
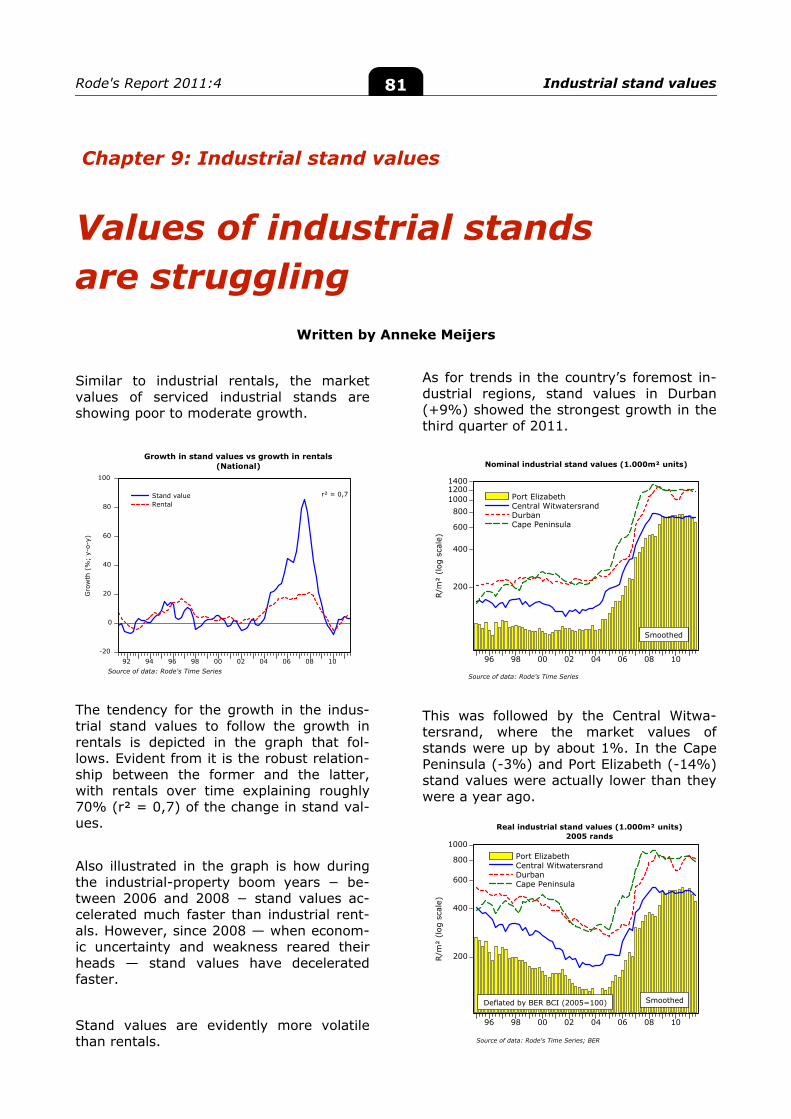
Rode's Report 2011:4 Industrial stand values 81
200
400
600
800
1000
96 98 00 02 04 06 08 10
Port ElizabethCentral WitwatersrandDurbanCape Peninsula
Real industrial stand values (1.000m² units)2005 rands
R/m
² (l
og s
cale
)
Source of data: Rode's Time Series; BER
SmoothedDeflated by BER BCI (2005=100)
200
400
600
800100012001400
96 98 00 02 04 06 08 10
Port ElizabethCentral WitwatersrandDurbanCape Peninsula
Nominal industrial stand values (1.000m² units)
R/m
² (l
og s
cale
)
Source of data: Rode's Time Series
Smoothed
-20
0
20
40
60
80
100
92 94 96 98 00 02 04 06 08 10
Stand valueRental
r² = 0,7
Growth in stand values vs growth in rentals(National)
Gro
wth
(%
; y-
o-y)
Source of data: Rode's Time Series
Chapter 9: Industrial stand values
Values of industrial stands are struggling
Written by Anneke Meijers
Similar to industrial rentals, the market values of serviced industrial stands are showing poor to moderate growth.
The tendency for the growth in the indus-trial stand values to follow the growth in rentals is depicted in the graph that fol-lows. Evident from it is the robust relation-ship between the former and the latter, with rentals over time explaining roughly 70% (r² = 0,7) of the change in stand val-ues.
Also illustrated in the graph is how during the industrial-property boom years − be-tween 2006 and 2008 − stand values ac-celerated much faster than industrial rent-als. However, since 2008 — when econom-ic uncertainty and weakness reared their heads — stand values have decelerated faster.
Stand values are evidently more volatile than rentals.
As for trends in the country’s foremost in-dustrial regions, stand values in Durban (+9%) showed the strongest growth in the third quarter of 2011.
This was followed by the Central Witwa-tersrand, where the market values of stands were up by about 1%. In the Cape Peninsula (-3%) and Port Elizabeth (-14%) stand values were actually lower than they were a year ago.
Rode's Report 2011:4 Industrial stand values 82
Over the same period, building-cost infla-tion — as measured by the BER BCI — is expected to have accelerated to a yearly rate of 6% (see Chapter 12 for an expla-nation hereof). This, of course, implies that in real terms industrial rentals in all of the-se industrial areas are actually lower than they were a year ago.
Naturally, a strong recovery in stand values will only come on the back of a sustained improvement in industrial rentals. This is so given the strong tendency for these two variables to move together over time. For now, however, prospects for industrial rentals remain weak as a result of an econ-omy struggling to find its feet amidst un-certain global economic conditions – not to mention the adverse impact that the cur-rent slowdown in manufacturing output is likely to have on the demand for industrial property.
The remainder of this chapter includes market values for level, serviced stands in named industrial townships. The industrial-land-value tables contain regression pa-rameters in order to allow readers to inter-polate land values for area sizes other than those given in the tables. This is necessary because the relationship between price and stand size is not linear. For more details on how to use these equations, refer to An-nexure 3 (annexure-page XII).
This concludes our chapter on industrial stand values.
PS: If you do not understand a term used in this article, please consult the Glossary (Annexure 1).
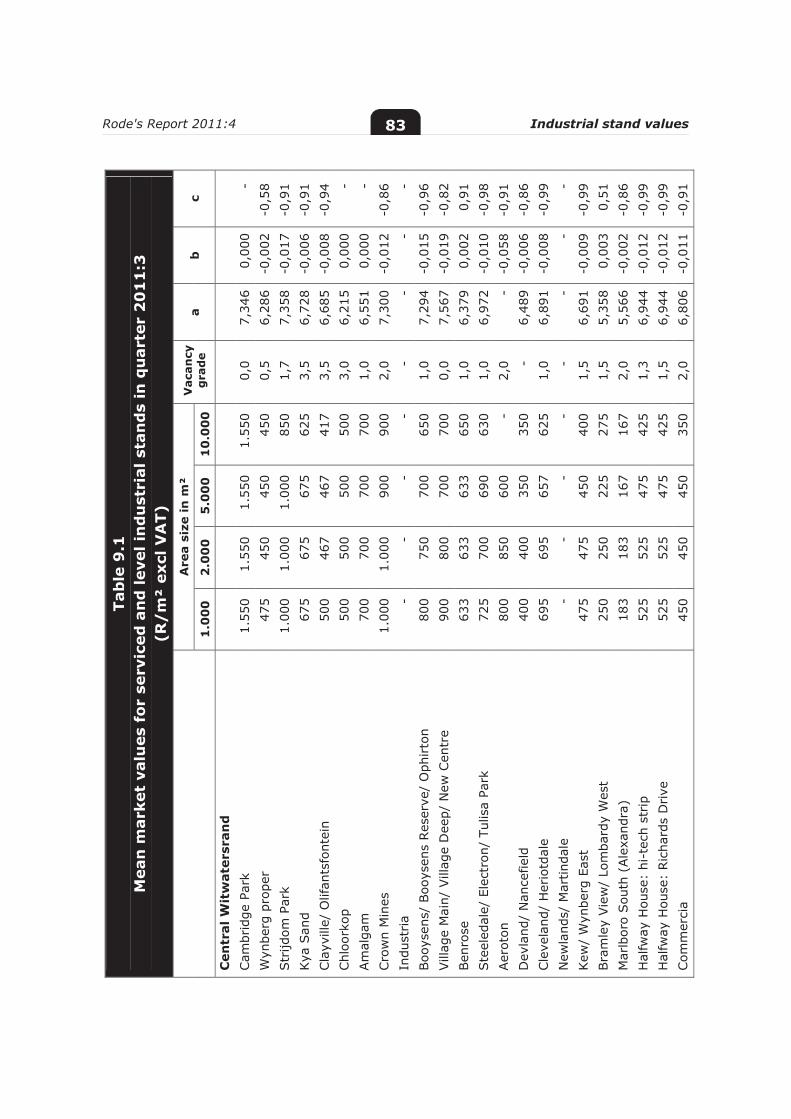
Rode's Report 2011:4 Industrial stand values 83
Tab
le 9
.1
Mea
n m
arke
t va
lues
for
ser
vice
d a
nd
leve
l in
du
stri
al s
tan
ds
in q
uar
ter
20
11
:3
(R/
m²
excl
VA
T)
A
rea
size
in m
² V
acan
cy
gra
de
a b
c
1.0
00
2
.00
0
5.0
00
1
0.0
00
Cen
tral
Wit
wat
ersr
and
Cam
brid
ge P
ark
1.55
0 1.
550
1.55
0 1.
550
0,0
7,34
6 0,
000
- W
ynbe
rg p
rope
r 47
5 45
0 45
0 45
0 0,
5 6,
286
-0,0
02
-0,5
8 Str
ijdom
Par
k 1.
000
1.00
0 1.
000
850
1,7
7,35
8 -0
,017
-0
,91
Kya
San
d 67
5 67
5 67
5 62
5 3,
5 6,
728
-0,0
06
-0,9
1 Cla
yvill
e/ O
lifan
tsfo
ntei
n 50
0 46
7 46
7 41
7 3,
5 6,
685
-0,0
08
-0,9
4 Chl
oork
op
500
500
500
500
3,0
6,21
5 0,
000
- Am
alga
m
700
700
700
700
1,0
6,55
1 0,
000
- Cro
wn
Min
es
1.00
0 1.
000
900
900
2,0
7,30
0 -0
,012
-0
,86
Indu
stria
- -
- -
- -
- -
Boo
ysen
s/ B
ooys
ens
Res
erve
/ O
phirto
n 80
0 75
0 70
0 65
0 1,
0 7,
294
-0,0
15
-0,9
6 Vill
age
Mai
n/ V
illag
e D
eep/
New
Cen
tre
900
800
700
700
0,0
7,56
7 -0
,019
-0
,82
Ben
rose
63
3 63
3 63
3 65
0 1,
0 6,
379
0,00
2 0,
91
Ste
eled
ale/
Ele
ctro
n/ T
ulis
a Pa
rk
725
700
690
630
1,0
6,97
2 -0
,010
-0
,98
Aer
oton
80
0 85
0 60
0 -
2,0
- -0
,058
-0
,91
Dev
land
/ N
ance
field
40
0 40
0 35
0 35
0 -
6,48
9 -0
,006
-0
,86
Cle
vela
nd/
Her
iotd
ale
695
695
657
625
1,0
6,89
1 -0
,008
-0
,99
New
land
s/ M
artin
dale
-
- -
- -
- -
- Kew
/ W
ynbe
rg E
ast
475
475
450
400
1,5
6,69
1 -0
,009
-0
,99
Bra
mle
y Vie
w/
Lom
bard
y W
est
250
250
225
275
1,5
5,35
8 0,
003
0,51
M
arlb
oro
Sou
th (
Ale
xand
ra)
183
183
167
167
2,0
5,56
6 -0
,002
-0
,86
Hal
fway
Hou
se:
hi-t
ech
strip
525
525
475
425
1,3
6,94
4 -0
,012
-0
,99
Hal
fway
Hou
se:
Ric
hard
s D
rive
52
5 52
5 47
5 42
5 1,
5 6,
944
-0,0
12
-0,9
9 Com
mer
cia
450
450
450
350
2,0
6,80
6 -0
,011
-0
,91
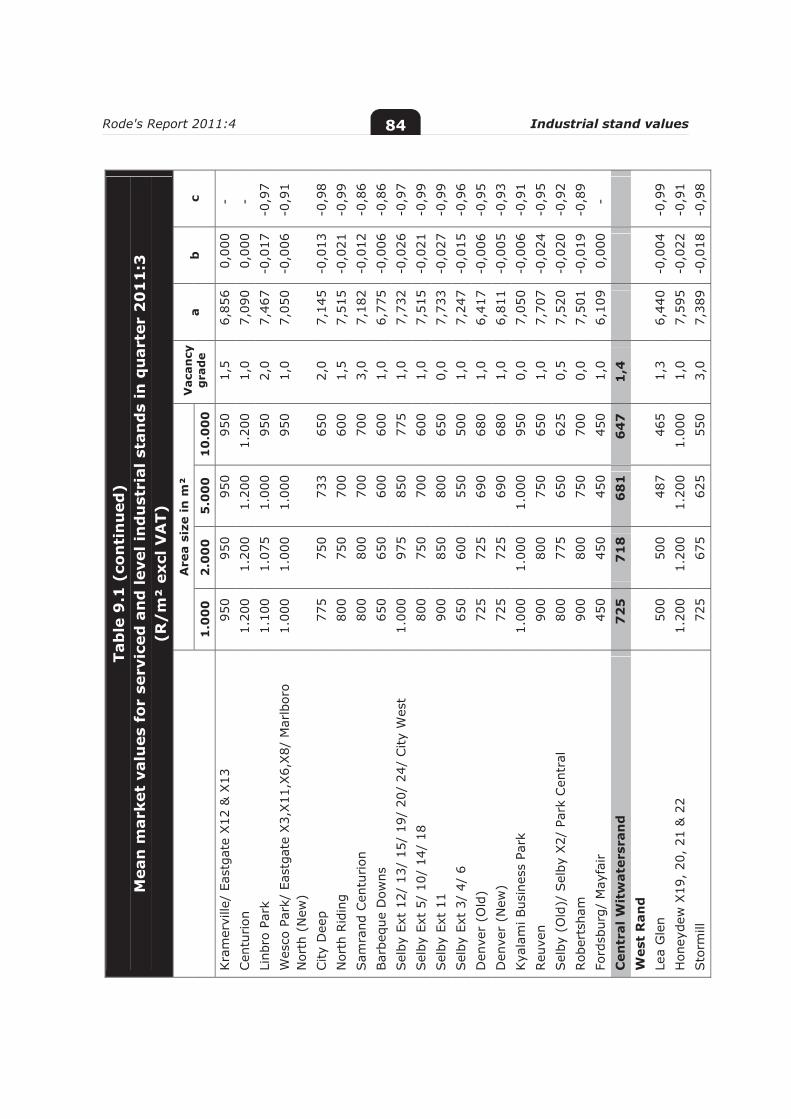
Rode's Report 2011:4 Industrial stand values 84
Tab
le 9
.1 (
con
tin
ued
) M
ean
mar
ket
valu
es f
or s
ervi
ced
an
d le
vel i
nd
ust
rial
sta
nd
s in
qu
arte
r 2
01
1:3
(R
/m
² ex
cl V
AT)
A
rea
size
in m
² V
acan
cy
gra
de
a b
c
1.0
00
2
.00
0
5.0
00
1
0.0
00
Kra
mer
ville
/ Ea
stga
te X
12 &
X13
95
0 95
0 95
0 95
0 1,
5 6,
856
0,00
0 -
Cen
turion
1.
200
1.20
0 1.
200
1.20
0 1,
0 7,
090
0,00
0 -
Linb
ro P
ark
1.10
0 1.
075
1.00
0 95
0 2,
0 7,
467
-0,0
17
-0,9
7 W
esco
Par
k/ E
astg
ate
X3,
X11
,X6,
X8/
Mar
lbor
o N
orth
(N
ew)
1.00
0 1.
000
1.00
0 95
0 1,
0 7,
050
-0,0
06
-0,9
1
City
Dee
p 77
5 75
0 73
3 65
0 2,
0 7,
145
-0,0
13
-0,9
8 N
orth
Rid
ing
800
750
700
600
1,5
7,51
5 -0
,021
-0
,99
Sam
rand
Cen
turion
80
0 80
0 70
0 70
0 3,
0 7,
182
-0,0
12
-0,8
6 Bar
bequ
e D
owns
65
0 65
0 60
0 60
0 1,
0 6,
775
-0,0
06
-0,8
6 Sel
by E
xt 1
2/ 1
3/ 1
5/ 1
9/ 2
0/ 2
4/ C
ity W
est
1.00
0 97
5 85
0 77
5 1,
0 7,
732
-0,0
26
-0,9
7 Sel
by E
xt 5
/ 10
/ 14
/ 18
80
0 75
0 70
0 60
0 1,
0 7,
515
-0,0
21
-0,9
9 Sel
by E
xt 1
1 90
0 85
0 80
0 65
0 0,
0 7,
733
-0,0
27
-0,9
9 Sel
by E
xt 3
/ 4/
6
650
600
550
500
1,0
7,24
7 -0
,015
-0
,96
Den
ver
(Old
) 72
5 72
5 69
0 68
0 1,
0 6,
417
-0,0
06
-0,9
5 D
enve
r (N
ew)
725
725
690
680
1,0
6,81
1 -0
,005
-0
,93
Kya
lam
i Bus
ines
s Pa
rk
1.00
0 1.
000
1.00
0 95
0 0,
0 7,
050
-0,0
06
-0,9
1 Reu
ven
900
800
750
650
1,0
7,70
7 -0
,024
-0
,95
Sel
by (
Old
)/ S
elby
X2/
Par
k C
entr
al
800
775
650
625
0,5
7,52
0 -0
,020
-0
,92
Rob
erts
ham
90
0 80
0 75
0 70
0 0,
0 7,
501
-0,0
19
-0,8
9 Fo
rdsb
urg/
May
fair
450
450
450
450
1,0
6,10
9 0,
000
- C
entr
al W
itw
ater
sran
d
72
5
71
8
68
1
64
7
1,4
Wes
t R
and
Le
a G
len
500
500
487
465
1,3
6,44
0 -0
,004
-0
,99
Hon
eyde
w X
19,
20,
21 &
22
1.20
0 1.
200
1.20
0 1.
000
1,0
7,59
5 -0
,022
-0
,91
Sto
rmill
72
5 67
5 62
5 55
0 3,
0 7,
389
-0,0
18
-0,9
8
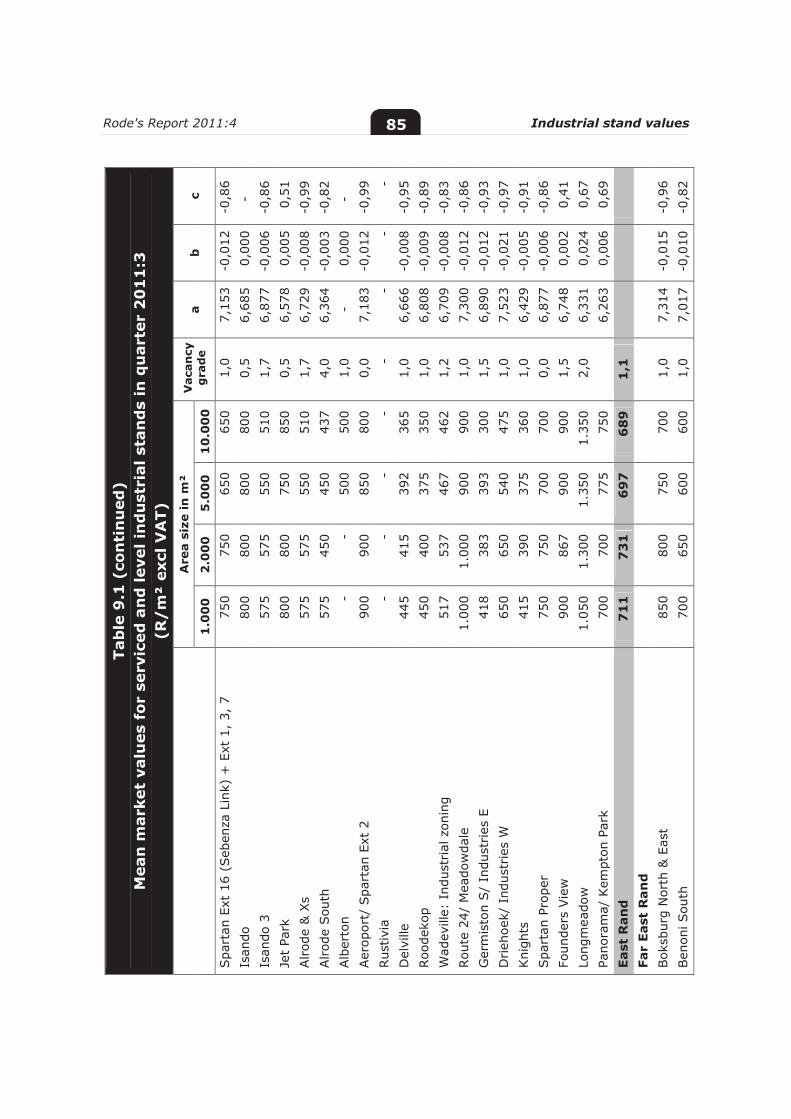
Rode's Report 2011:4 Industrial stand values 85
Tab
le 9
.1 (
con
tin
ued
) M
ean
mar
ket
valu
es f
or s
ervi
ced
an
d le
vel i
nd
ust
rial
sta
nd
s in
qu
arte
r 2
01
1:3
(R
/m
² ex
cl V
AT)
A
rea
size
in m
² V
acan
cy
gra
de
a b
c
1.0
00
2
.00
0
5.0
00
1
0.0
00
Spa
rtan
Ext
16
(Seb
enza
Lin
k) +
Ext
1,
3, 7
75
0 75
0 65
0 65
0 1,
0 7,
153
-0,0
12
-0,8
6 Is
ando
80
0 80
0 80
0 80
0 0,
5 6,
685
0,00
0 -
Isan
do 3
57
5 57
5 55
0 51
0 1,
7 6,
877
-0,0
06
-0,8
6 Je
t Pa
rk
800
800
750
850
0,5
6,57
8 0,
005
0,51
Alrod
e &
Xs
575
575
550
510
1,7
6,72
9 -0
,008
-0
,99
Alrod
e Sou
th
575
450
450
437
4,0
6,36
4 -0
,003
-0
,82
Alb
erto
n -
- 50
0 50
0 1,
0 -
0,00
0 -
Aer
opor
t/ S
part
an E
xt 2
90
0 90
0 85
0 80
0 0,
0 7,
183
-0,0
12
-0,9
9 Rus
tivia
-
- -
- -
- -
- D
elvi
lle
445
415
392
365
1,0
6,66
6 -0
,008
-0
,95
Roo
deko
p 45
0 40
0 37
5 35
0 1,
0 6,
808
-0,0
09
-0,8
9 W
adev
ille:
Ind
ustr
ial z
onin
g 51
7 53
7 46
7 46
2 1,
2 6,
709
-0,0
08
-0,8
3 Rou
te 2
4/ M
eado
wda
le
1.00
0 1.
000
900
900
1,0
7,30
0 -0
,012
-0
,86
Ger
mis
ton
S/
Indu
stries
E
418
383
393
300
1,5
6,89
0 -0
,012
-0
,93
Drieh
oek/
Ind
ustr
ies
W
650
650
540
475
1,0
7,52
3 -0
,021
-0
,97
Kni
ghts
41
5 39
0 37
5 36
0 1,
0 6,
429
-0,0
05
-0,9
1 Spa
rtan
Pro
per
750
750
700
700
0,0
6,87
7 -0
,006
-0
,86
Foun
ders
Vie
w
900
867
900
900
1,5
6,74
8 0,
002
0,41
Lo
ngm
eado
w
1.05
0 1.
300
1.35
0 1.
350
2,0
6,33
1 0,
024
0,67
Pa
nora
ma/
Kem
pton
Par
k 70
0 70
0 77
5 75
0
6,26
3 0,
006
0,69
Ea
st R
and
7
11
7
31
6
97
6
89
1
,1
Fa
r Ea
st R
and
Bok
sbur
g N
orth
& E
ast
850
800
750
700
1,0
7,31
4 -0
,015
-0
,96
Ben
oni S
outh
70
0 65
0 60
0 60
0 1,
0 7,
017
-0,0
10
-0,8
2
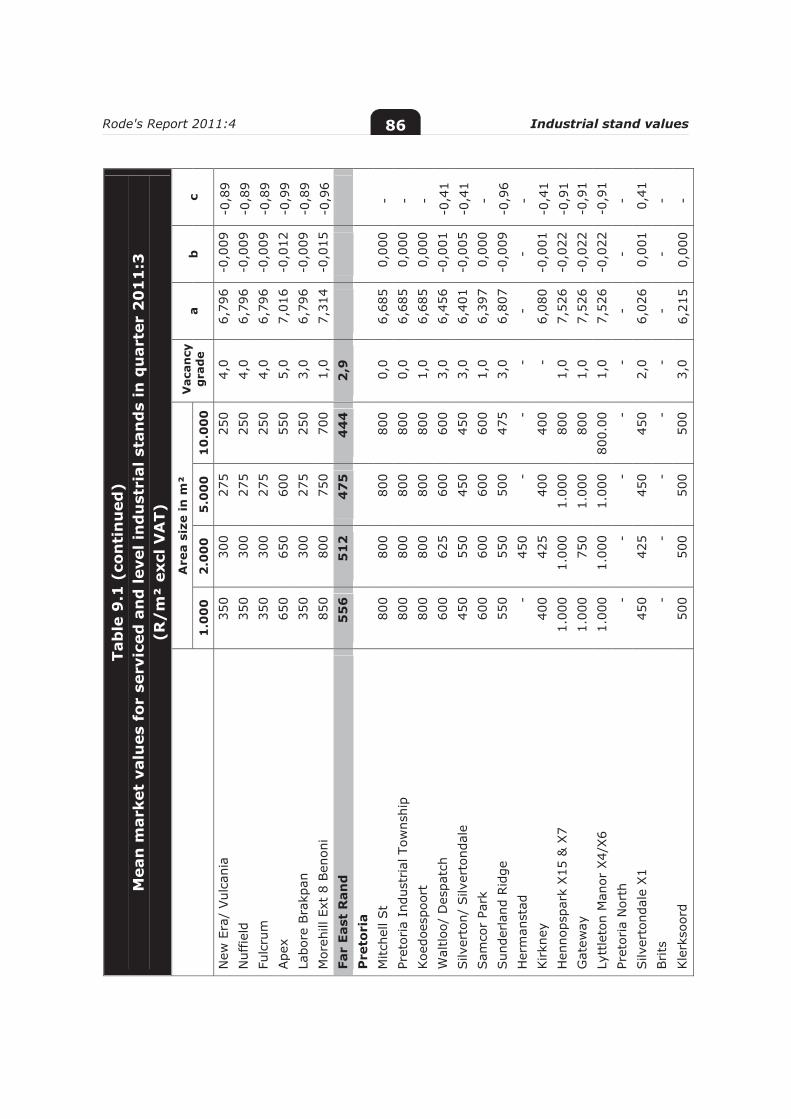
Rode's Report 2011:4 Industrial stand values 86
Tab
le 9
.1 (
con
tin
ued
) M
ean
mar
ket
valu
es f
or s
ervi
ced
an
d le
vel i
nd
ust
rial
sta
nd
s in
qu
arte
r 2
01
1:3
(R
/m
² ex
cl V
AT)
A
rea
size
in m
² V
acan
cy
gra
de
a b
c
1.0
00
2
.00
0
5.0
00
1
0.0
00
New
Era
/ Vul
cani
a 35
0 30
0 27
5 25
0 4,
0 6,
796
-0,0
09
-0,8
9 N
uffie
ld
350
300
275
250
4,0
6,79
6 -0
,009
-0
,89
Fulc
rum
35
0 30
0 27
5 25
0 4,
0 6,
796
-0,0
09
-0,8
9 Ape
x 65
0 65
0 60
0 55
0 5,
0 7,
016
-0,0
12
-0,9
9 La
bore
Bra
kpan
35
0 30
0 27
5 25
0 3,
0 6,
796
-0,0
09
-0,8
9 M
oreh
ill E
xt 8
Ben
oni
850
800
750
700
1,0
7,31
4 -0
,015
-0
,96
Far
East
Ran
d
55
6
51
2
47
5
44
4
2,9
Pre
tori
a
M
itche
ll St
800
800
800
800
0,0
6,68
5 0,
000
- Pr
etor
ia I
ndus
tria
l Tow
nshi
p 80
0 80
0 80
0 80
0 0,
0 6,
685
0,00
0 -
Koe
does
poor
t 80
0 80
0 80
0 80
0 1,
0 6,
685
0,00
0 -
Wal
tloo/
Des
patc
h 60
0 62
5 60
0 60
0 3,
0 6,
456
-0,0
01
-0,4
1 Silv
erto
n/ S
ilver
tond
ale
450
550
450
450
3,0
6,40
1 -0
,005
-0
,41
Sam
cor
Park
60
0 60
0 60
0 60
0 1,
0 6,
397
0,00
0 -
Sun
derlan
d Rid
ge
550
550
500
475
3,0
6,80
7 -0
,009
-0
,96
Her
man
stad
-
450
- -
- -
- -
Kirkn
ey
400
425
400
400
- 6,
080
-0,0
01
-0,4
1 H
enno
pspa
rk X
15 &
X7
1.00
0 1.
000
1.00
0 80
0 1,
0 7,
526
-0,0
22
-0,9
1 G
atew
ay
1.00
0 75
0 1.
000
800
1,0
7,52
6 -0
,022
-0
,91
Lytt
leto
n M
anor
X4/
X6
1.00
0 1.
000
1.00
0 80
0.00
1,
0 7,
526
-0,0
22
-0,9
1 Pr
etor
ia N
orth
-
- -
- -
- -
- Silv
erto
ndal
e X1
450
425
450
450
2,0
6,02
6 0,
001
0,41
Brits
-
- -
- -
- -
- Kle
rkso
ord
500
500
500
500
3,0
6,21
5 0,
000
-
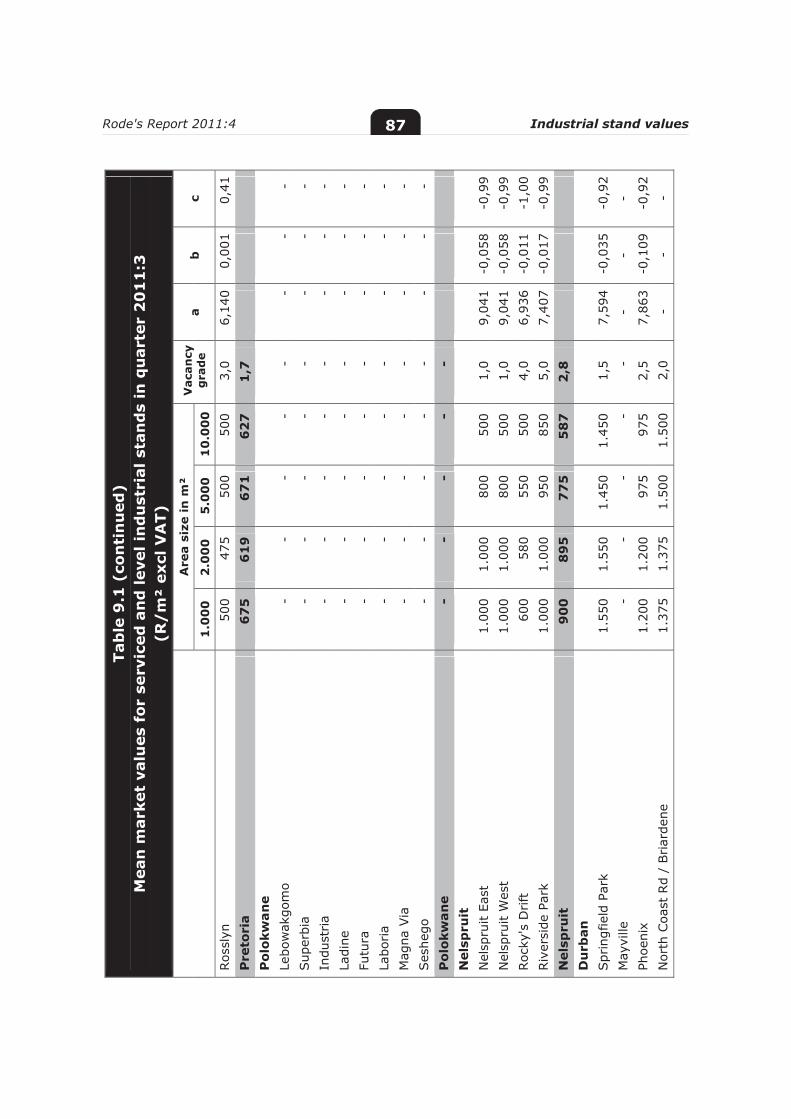
Rode's Report 2011:4 Industrial stand values 87
Tab
le 9
.1 (
con
tin
ued
) M
ean
mar
ket
valu
es f
or s
ervi
ced
an
d le
vel i
nd
ust
rial
sta
nd
s in
qu
arte
r 2
01
1:3
(R
/m
² ex
cl V
AT)
A
rea
size
in m
² V
acan
cy
gra
de
a b
c
1.0
00
2
.00
0
5.0
00
1
0.0
00
Ros
slyn
50
0 47
5 50
0 50
0 3,
0 6,
140
0,00
1 0,
41
Pre
tori
a 6
75
6
19
6
71
6
27
1
,7
P
olok
wan
e
Le
bow
akgo
mo
- -
- -
- -
- -
Sup
erbi
a -
- -
- -
- -
- In
dust
ria
- -
- -
- -
- -
Ladi
ne
- -
- -
- -
- -
Futu
ra
- -
- -
- -
- -
Labo
ria
- -
- -
- -
- -
Mag
na V
ia
- -
- -
- -
- -
Ses
hego
-
- -
- -
- -
- P
olok
wan
e -
- -
- -
N
elsp
ruit
N
elsp
ruit
East
1
.000
1
.000
8
00
500
1,
0
9,04
1 -0
,058
-0
,99
Nel
spru
it W
est
1.0
00
1.0
00
800
5
00
1,0
9,
041
-0,0
58
-0,9
9 Roc
ky's
Drift
6
00
580
5
50
500
4,
0
6,93
6 -0
,011
-1
,00
Riv
ersi
de P
ark
1.0
00
1.0
00
950
8
50
5,0
7,
407
-0,0
17
-0,9
9 N
elsp
ruit
9
00
8
95
7
75
5
87
2
,8
D
urb
an
Spr
ingf
ield
Par
k 1.
550
1.55
0 1.
450
1.45
0 1,
5 7,
594
-0,0
35
-0,9
2 M
ayvi
lle
- -
- -
- -
- -
Phoe
nix
1.20
0 1.
200
975
975
2,5
7,86
3 -0
,109
-0
,92
Nor
th C
oast
Rd
/ Briar
dene
1.
375
1.37
5 1.
500
1.50
0 2,
0 -
- -
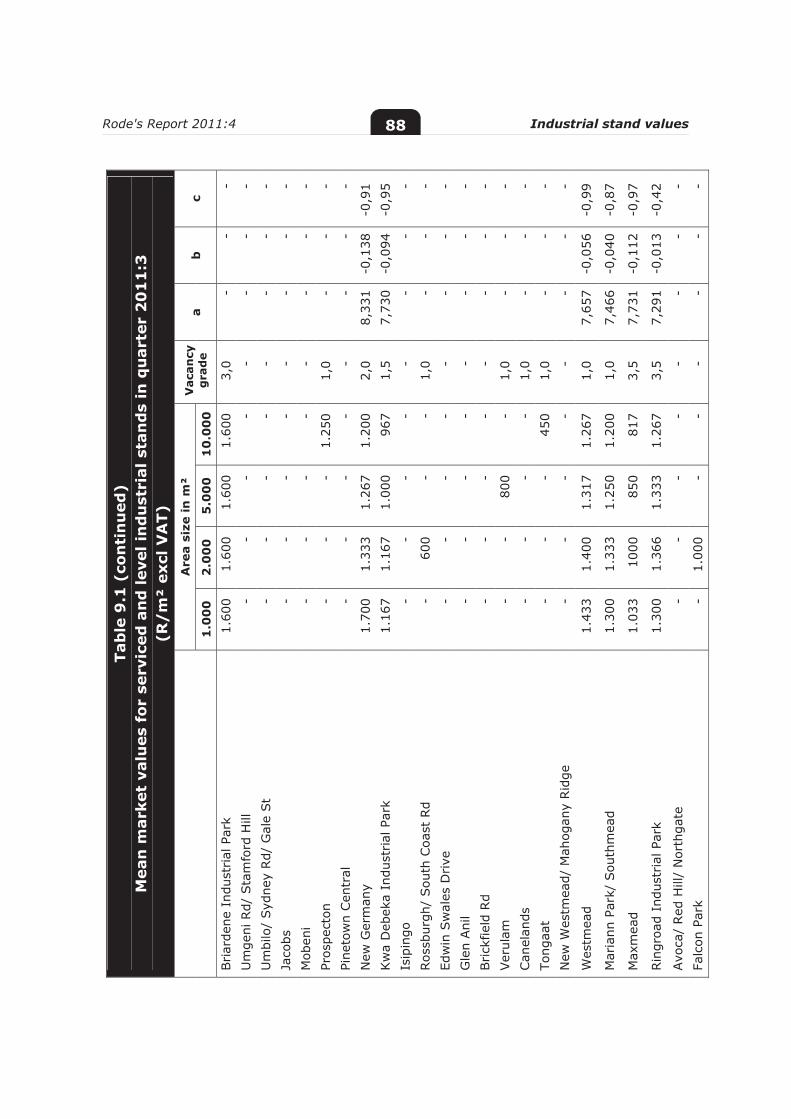
Rode's Report 2011:4 Industrial stand values 88
Tab
le 9
.1 (
con
tin
ued
) M
ean
mar
ket
valu
es f
or s
ervi
ced
an
d le
vel i
nd
ust
rial
sta
nd
s in
qu
arte
r 2
01
1:3
(R
/m
² ex
cl V
AT)
A
rea
size
in m
² V
acan
cy
gra
de
a b
c
1.0
00
2
.00
0
5.0
00
1
0.0
00
Briar
dene
Ind
ustr
ial P
ark
1.60
0 1.
600
1.60
0 1.
600
3,0
- -
- U
mge
ni R
d/ S
tam
ford
Hill
-
- -
- -
- -
- U
mbi
lo/
Syd
ney
Rd/
Gal
e St
- -
- -
- -
- -
Jaco
bs
- -
- -
- -
- -
Mob
eni
- -
- -
- -
- -
Pros
pect
on
- -
- 1.
250
1,0
- -
- Pi
neto
wn
Cen
tral
-
- -
- -
- -
- N
ew G
erm
any
1.70
0 1.
333
1.26
7 1.
200
2,0
8,33
1 -0
,138
-0
,91
Kw
a D
ebek
a In
dust
rial
Par
k 1.
167
1.16
7 1.
000
967
1,5
7,73
0 -0
,094
-0
,95
Isip
ingo
-
- -
- -
- -
- Ros
sbur
gh/
Sou
th C
oast
Rd
- 60
0 -
- 1,
0 -
- -
Edw
in S
wal
es D
rive
-
- -
- -
- -
- G
len
Ani
l -
- -
- -
- -
- Brick
field
Rd
- -
- -
- -
- -
Ver
ulam
-
- 80
0 -
1,0
- -
- Can
elan
ds
- -
- -
1,0
- -
- To
ngaa
t -
- -
450
1,0
- -
- N
ew W
estm
ead/
Mah
ogan
y Rid
ge
- -
- -
- -
- -
Wes
tmea
d 1.
433
1.40
0 1.
317
1.26
7 1,
0 7,
657
-0,0
56
-0,9
9
Mar
iann
Par
k/ S
outh
mea
d 1.
300
1.33
3 1.
250
1.20
0 1,
0 7,
466
-0,0
40
-0,8
7
Max
mea
d 1.
033
1000
85
0 81
7 3,
5 7,
731
-0,1
12
-0,9
7
Rin
groa
d In
dust
rial
Par
k 1.
300
1.36
6 1.
333
1.26
7 3,
5 7,
291
-0,0
13
-0,4
2
Avo
ca/
Red
Hill
/ N
orth
gate
-
- -
- -
- -
- Fa
lcon
Par
k -
1.00
0 -
- -
- -
-
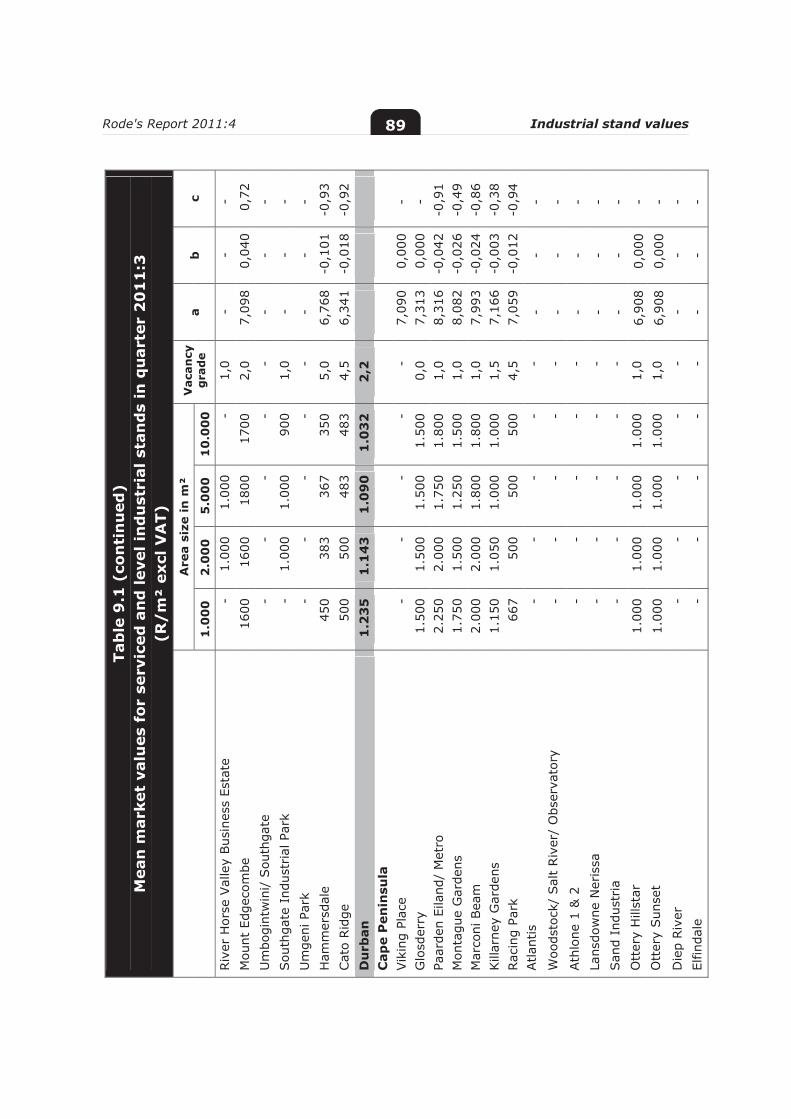
Rode's Report 2011:4 Industrial stand values 89
Tab
le 9
.1 (
con
tin
ued
) M
ean
mar
ket
valu
es f
or s
ervi
ced
an
d le
vel i
nd
ust
rial
sta
nd
s in
qu
arte
r 2
01
1:3
(R
/m
² ex
cl V
AT)
A
rea
size
in m
² V
acan
cy
gra
de
a b
c
1.0
00
2
.00
0
5.0
00
1
0.0
00
Riv
er H
orse
Val
ley
Bus
ines
s Es
tate
-
1.00
0 1.
000
- 1,
0 -
- -
Mou
nt E
dgec
ombe
16
00
1600
18
00
1700
2,
0 7,
098
0,04
0 0,
72
Um
bogi
ntw
ini/
Sou
thga
te
- -
- -
- -
- -
Sou
thga
te I
ndus
tria
l Par
k -
1.00
0 1.
000
900
1,0
- -
- U
mge
ni P
ark
- -
- -
- -
- -
Ham
mer
sdal
e 45
0 38
3 36
7 35
0 5,
0 6,
768
-0,1
01
-0,9
3 Cat
o Rid
ge
500
500
483
483
4,5
6,34
1 -0
,018
-0
,92
Du
rban
1
.23
5
1.1
43
1
.09
0
1.0
32
2
,2
C
ape
Pen
insu
la
Vik
ing
Plac
e -
- -
- -
7,09
0 0,
000
- G
losd
erry
1.
500
1.50
0 1.
500
1.50
0 0,
0 7,
313
0,00
0 -
Paar
den
Eila
nd/
Met
ro
2.25
0 2.
000
1.75
0 1.
800
1,0
8,31
6 -0
,042
-0
,91
Mon
tagu
e G
arde
ns
1.75
0 1.
500
1.25
0 1.
500
1,0
8,08
2 -0
,026
-0
,49
Mar
coni
Bea
m
2.00
0 2.
000
1.80
0 1.
800
1,0
7,99
3 -0
,024
-0
,86
Kill
arne
y G
arde
ns
1.15
0 1.
050
1.00
0 1.
000
1,5
7,16
6 -0
,003
-0
,38
Rac
ing
Park
66
7 50
0 50
0 50
0 4,
5 7,
059
-0,0
12
-0,9
4 Atla
ntis
-
- -
- -
- -
- W
oods
tock
/ Sal
t Riv
er/
Obs
erva
tory
-
- -
- -
- -
- Ath
lone
1 &
2
- -
- -
- -
- -
Lans
dow
ne N
eris
sa
- -
- -
- -
- -
San
d In
dust
ria
- -
- -
- -
- -
Ott
ery
Hill
star
1.
000
1.00
0 1.
000
1.00
0 1,
0 6,
908
0,00
0 -
Ott
ery
Sun
set
1.00
0 1.
000
1.00
0 1.
000
1,0
6,90
8 0,
000
- D
iep
Riv
er
- -
- -
- -
- -
Elfin
dale
-
- -
- -
- -
-
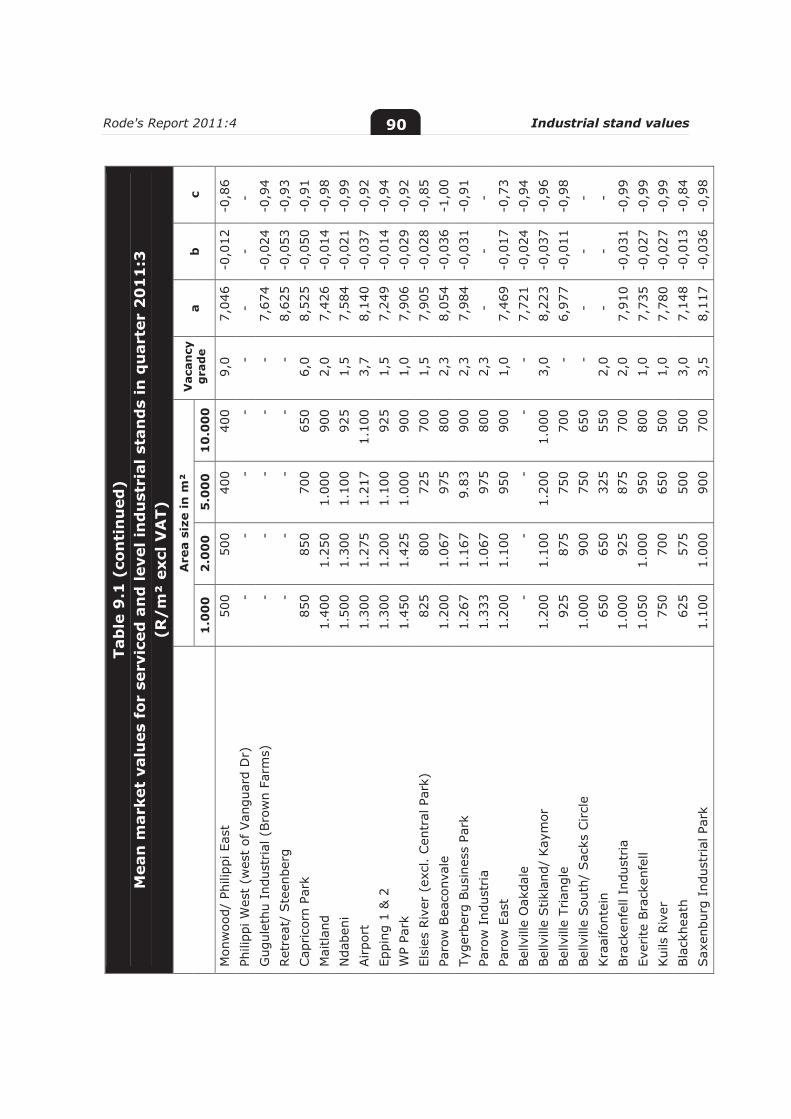
Rode's Report 2011:4 Industrial stand values 90
Tab
le 9
.1 (
con
tin
ued
) M
ean
mar
ket
valu
es f
or s
ervi
ced
an
d le
vel i
nd
ust
rial
sta
nd
s in
qu
arte
r 2
01
1:3
(R
/m
² ex
cl V
AT)
A
rea
size
in m
² V
acan
cy
gra
de
a b
c
1.0
00
2
.00
0
5.0
00
1
0.0
00
Mon
woo
d/ P
hilip
pi E
ast
500
500
400
400
9,0
7,04
6 -0
,012
-0
,86
Phili
ppi W
est
(wes
t of
Van
guar
d D
r)
- -
- -
- -
- -
Gug
ulet
hu I
ndus
tria
l (Bro
wn
Farm
s)
- -
- -
- 7,
674
-0,0
24
-0,9
4 Ret
reat
/ Ste
enbe
rg
- -
- -
- 8,
625
-0,0
53
-0,9
3 Cap
rico
rn P
ark
850
850
700
650
6,0
8,52
5 -0
,050
-0
,91
Mai
tland
1.
400
1.25
0 1.
000
900
2,0
7,42
6 -0
,014
-0
,98
Nda
beni
1.
500
1.30
0 1.
100
925
1,5
7,58
4 -0
,021
-0
,99
Airpo
rt
1.30
0 1.
275
1.21
7 1.
100
3,7
8,14
0 -0
,037
-0
,92
Eppi
ng 1
& 2
1.
300
1.20
0 1.
100
925
1,5
7,24
9 -0
,014
-0
,94
WP
Park
1.
450
1.42
5 1.
000
900
1,0
7,90
6 -0
,029
-0
,92
Elsi
es R
iver
(ex
cl.
Cen
tral
Par
k)
825
800
725
700
1,5
7,90
5 -0
,028
-0
,85
Paro
w B
eaco
nval
e 1.
200
1.06
7 97
5 80
0 2,
3 8,
054
-0,0
36
-1,0
0 Ty
gerb
erg
Bus
ines
s Pa
rk
1.26
7 1.
167
9.83
90
0 2,
3 7,
984
-0,0
31
-0,9
1 Pa
row
Ind
ustr
ia
1.33
3 1.
067
975
800
2,3
- -
- Pa
row
Eas
t 1.
200
1.10
0 95
0 90
0 1,
0 7,
469
-0,0
17
-0,7
3 Bel
lvill
e O
akda
le
- -
- -
- 7,
721
-0,0
24
-0,9
4 Bel
lvill
e Stik
land
/ Kay
mor
1.
200
1.10
0 1.
200
1.00
0 3,
0 8,
223
-0,0
37
-0,9
6 Bel
lvill
e Tr
iang
le
925
875
750
700
- 6,
977
-0,0
11
-0,9
8 Bel
lvill
e Sou
th/
Sac
ks C
ircl
e 1.
000
900
750
650
- -
- -
Kra
aifo
ntei
n 65
0 65
0 32
5 55
0 2,
0 -
- -
Bra
cken
fell
Indu
stria
1.00
0 92
5 87
5 70
0 2,
0 7,
910
-0,0
31
-0,9
9 Ev
erite
Bra
cken
fell
1.05
0 1.
000
950
800
1,0
7,73
5 -0
,027
-0
,99
Kui
ls R
iver
75
0 70
0 65
0 50
0 1,
0 7,
780
-0,0
27
-0,9
9 Bla
ckhe
ath
625
575
500
500
3,0
7,14
8 -0
,013
-0
,84
Sax
enbu
rg I
ndus
tria
l Par
k 1.
100
1.00
0 90
0 70
0 3,
5 8,
117
-0,0
36
-0,9
8
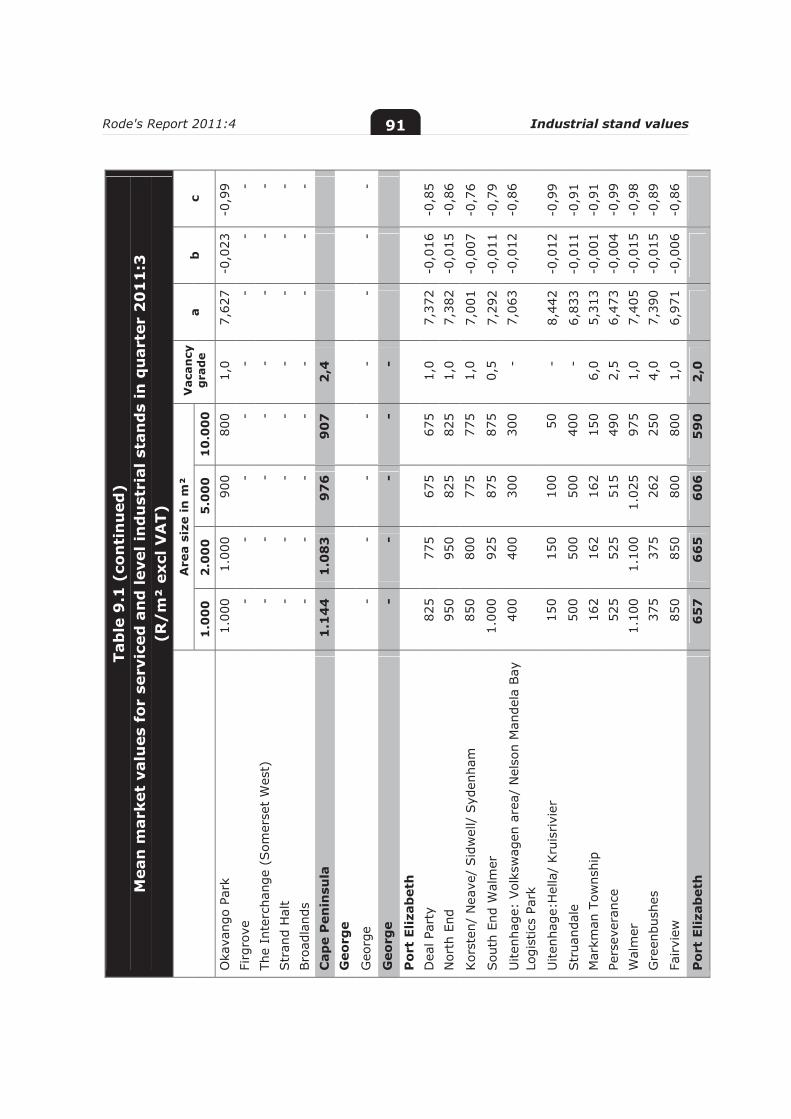
Rode's Report 2011:4 Industrial stand values 91
Tab
le 9
.1 (
con
tin
ued
) M
ean
mar
ket
valu
es f
or s
ervi
ced
an
d le
vel i
nd
ust
rial
sta
nd
s in
qu
arte
r 2
01
1:3
(R
/m
² ex
cl V
AT)
A
rea
size
in m
² V
acan
cy
gra
de
a b
c
1.0
00
2
.00
0
5.0
00
1
0.0
00
Oka
vang
o Pa
rk
1.00
0 1.
000
900
800
1,0
7,62
7 -0
,023
-0
,99
Firg
rove
-
- -
- -
- -
- Th
e In
terc
hang
e (S
omer
set
Wes
t)
- -
- -
- -
- -
Str
and
Hal
t -
- -
- -
- -
- Bro
adla
nds
- -
- -
- -
- -
Cap
e P
enin
sula
1
.14
4
1.0
83
9
76
9
07
2
,4
G
eorg
e
Geo
rge
- -
- -
- -
- -
Geo
rge
- -
- -
-
Po
rt E
lizab
eth
D
eal P
arty
82
5 77
5 67
5 67
5 1,
0 7,
372
-0,0
16
-0,8
5 N
orth
End
95
0 95
0 82
5 82
5 1,
0 7,
382
-0,0
15
-0,8
6
Kor
sten
/ N
eave
/ Sid
wel
l/ S
yden
ham
85
0 80
0 77
5 77
5 1,
0 7,
001
-0,0
07
-0,7
6
Sou
th E
nd W
alm
er
1.00
0 92
5 87
5 87
5 0,
5 7,
292
-0,0
11
-0,7
9
Uite
nhag
e: V
olks
wag
en a
rea/
Nel
son
Man
dela
Bay
Lo
gist
ics
Park
40
0 40
0 30
0 30
0 -
7,06
3 -0
,012
-0
,86
Uite
nhag
e:H
ella
/ Kru
isrivi
er
150
150
100
50
- 8,
442
-0,0
12
-0,9
9
Str
uand
ale
500
500
500
400
- 6,
833
-0,0
11
-0,9
1 M
arkm
an T
owns
hip
162
162
162
150
6,0
5,31
3 -0
,001
-0
,91
Pers
ever
ance
52
5 52
5 51
5 49
0 2,
5 6,
473
-0,0
04
-0,9
9 W
alm
er
1.10
0 1.
100
1.02
5 97
5 1,
0 7,
405
-0,0
15
-0,9
8 G
reen
bush
es
375
375
262
250
4,0
7,39
0 -0
,015
-0
,89
Fairvi
ew
850
850
800
800
1,0
6,97
1 -0
,006
-0
,86
Po
rt E
lizab
eth
6
57
6
65
6
06
5
90
2
,0
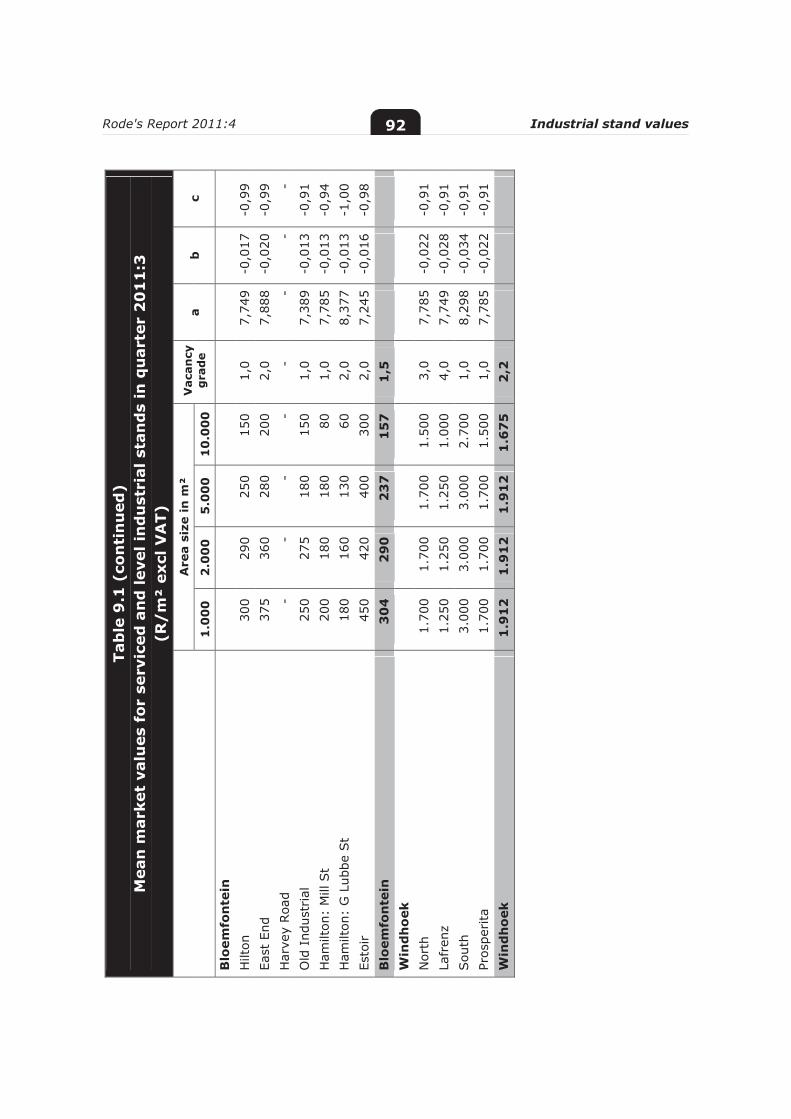
Rode's Report 2011:4 Industrial stand values 92
Tab
le 9
.1 (
con
tin
ued
) M
ean
mar
ket
valu
es f
or s
ervi
ced
an
d le
vel i
nd
ust
rial
sta
nd
s in
qu
arte
r 2
01
1:3
(R
/m
² ex
cl V
AT)
A
rea
size
in
m²
Vac
ancy
g
rad
e a
b
c 1
.00
0
2.0
00
5
.00
0
10
.00
0
Blo
emfo
nte
in
Hilt
on
300
290
250
150
1,0
7,74
9 -0
,017
-0
,99
East
End
37
5 36
0 28
0 20
0 2,
0 7,
888
-0,0
20
-0,9
9 H
arve
y Roa
d
- -
- -
- -
- -
Old
Ind
ustr
ial
250
275
180
150
1,0
7,38
9 -0
,013
-0
,91
Ham
ilton
: M
ill S
t 20
0 18
0 18
0 80
1,
0 7,
785
-0,0
13
-0,9
4 H
amilt
on:
G L
ubbe
St
180
160
130
60
2,0
8,37
7 -0
,013
-1
,00
Esto
ir
450
420
400
300
2,0
7,24
5 -0
,016
-0
,98
Blo
emfo
nte
in
30
4
29
0
23
7
15
7
1,5
Win
dh
oek
N
orth
1.
700
1.70
0 1.
700
1.50
0 3,
0 7,
785
-0,0
22
-0,9
1 La
fren
z 1.
250
1.25
0 1.
250
1.00
0 4,
0 7,
749
-0,0
28
-0,9
1 Sou
th
3.00
0 3.
000
3.00
0 2.
700
1,0
8,29
8 -0
,034
-0
,91
Pros
perita
1.
700
1.70
0 1.
700
1.50
0 1,
0 7,
785
-0,0
22
-0,9
1 W
ind
ho
ek
1.9
12
1
.91
2
1.9
12
1
.67
5
2,2
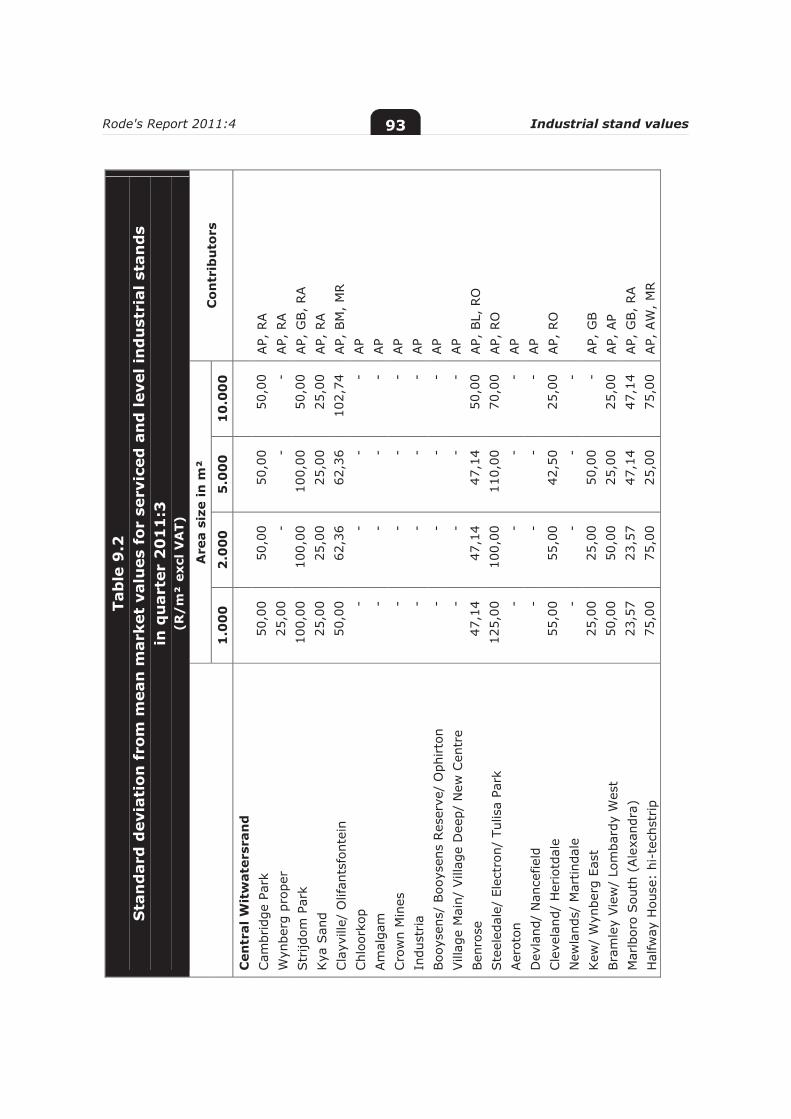
Rode's Report 2011:4 Industrial stand values 93
Tab
le 9
.2
Sta
nd
ard
dev
iati
on f
rom
mea
n m
arke
t va
lues
for
ser
vice
d a
nd
leve
l in
du
stri
al s
tan
ds
in q
uar
ter
20
11
:3
(R/
m²
excl
VA
T)
A
rea
size
in m
² C
on
trib
uto
rs
1.0
00
2
.00
0
5.0
00
1
0.0
00
Cen
tral
Wit
wat
ersr
and
Cam
brid
ge P
ark
50,0
0 50
,00
50,0
0 50
,00
AP,
RA
Wyn
berg
pro
per
25,0
0 -
- -
AP,
RA
Str
ijdom
Par
k 10
0,00
10
0,00
10
0,00
50
,00
AP,
GB,
RA
Kya
San
d 25
,00
25,0
0 25
,00
25,0
0 AP,
RA
Cla
yvill
e/ O
lifan
tsfo
ntei
n 50
,00
62,3
6 62
,36
102,
74
AP,
BM
, M
R
Chl
oork
op
- -
- -
AP
Am
alga
m
- -
- -
AP
Cro
wn
Min
es
- -
- -
AP
Indu
stria
- -
- -
AP
Boo
ysen
s/ B
ooys
ens
Res
erve
/ O
phirto
n -
- -
- AP
Vill
age
Mai
n/ V
illag
e D
eep/
New
Cen
tre
- -
- -
AP
Ben
rose
47
,14
47,1
4 47
,14
50,0
0 AP,
BL,
RO
Ste
eled
ale/
Ele
ctro
n/ T
ulis
a Pa
rk
125,
00
100,
00
110,
00
70,0
0 AP,
RO
Aer
oton
-
- -
- AP
Dev
land
/ N
ance
field
-
- -
- AP
Cle
vela
nd/
Her
iotd
ale
55,0
0 55
,00
42,5
0 25
,00
AP,
RO
New
land
s/ M
artin
dale
-
- -
-
Kew
/ W
ynbe
rg E
ast
25,0
0 25
,00
50,0
0 -
AP,
GB
Bra
mle
y Vie
w/
Lom
bard
y W
est
50,0
0 50
,00
25,0
0 25
,00
AP,
AP
Mar
lbor
o Sou
th (
Ale
xand
ra)
23,5
7 23
,57
47,1
4 47
,14
AP,
GB,
RA
Hal
fway
Hou
se:
hi-t
echs
trip
75
,00
75,0
0 25
,00
75,0
0 AP,
AW
, M
R
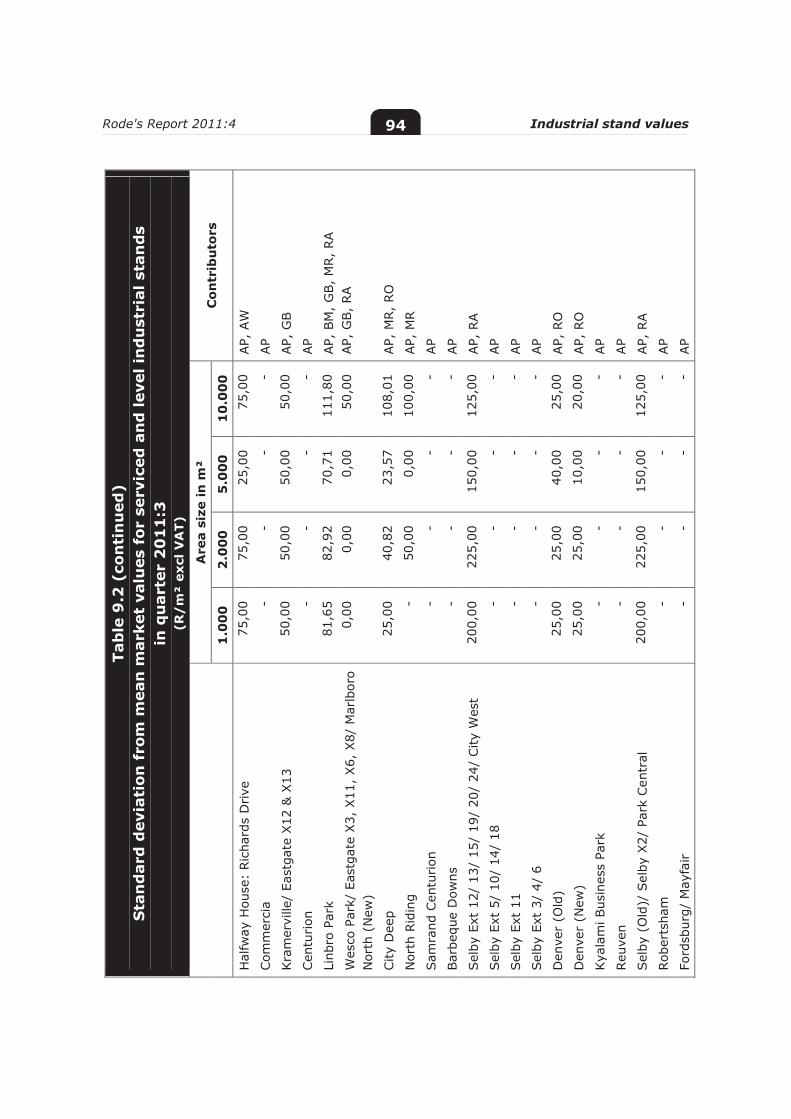
Rode's Report 2011:4 Industrial stand values 94
Tab
le 9
.2 (
con
tin
ued
) S
tan
dar
d d
evia
tion
fro
m m
ean
mar
ket
valu
es f
or s
ervi
ced
an
d le
vel i
nd
ust
rial
sta
nd
s in
qu
arte
r 2
01
1:3
(R
/m
² ex
cl V
AT)
A
rea
size
in m
² C
on
trib
uto
rs
1.0
00
2
.00
0
5.0
00
1
0.0
00
Hal
fway
Hou
se:
Ric
hard
s D
rive
75
,00
75,0
0 25
,00
75,0
0 AP,
AW
Com
mer
cia
- -
- -
AP
Kra
mer
ville
/ Ea
stga
te X
12 &
X13
50
,00
50,0
0 50
,00
50,0
0 AP,
GB
Cen
turion
-
- -
- AP
Linb
ro P
ark
81,6
5 82
,92
70,7
1 11
1,80
AP,
BM
, G
B,
MR,
RA
Wes
co P
ark/
Eas
tgat
e X3,
X11
, X6,
X8/
Mar
lbor
o N
orth
(N
ew)
0,00
0,
00
0,00
50
,00
AP,
GB,
RA
City
Dee
p 25
,00
40,8
2 23
,57
108,
01
AP,
MR,
RO
Nor
th R
idin
g -
50,0
0 0,
00
100,
00
AP,
MR
Sam
rand
Cen
turion
-
- -
- AP
Bar
bequ
e D
owns
-
- -
- AP
Sel
by E
xt 1
2/ 1
3/ 1
5/ 1
9/ 2
0/ 2
4/ C
ity W
est
200,
00
225,
00
150,
00
125,
00
AP,
RA
Sel
by E
xt 5
/ 10
/ 14
/ 18
-
- -
- AP
Sel
by E
xt 1
1 -
- -
- AP
Sel
by E
xt 3
/ 4/
6
- -
- -
AP
Den
ver
(Old
) 25
,00
25,0
0 40
,00
25,0
0 AP,
RO
Den
ver
(New
) 25
,00
25,0
0 10
,00
20,0
0 AP,
RO
Kya
lam
i Bus
ines
s Pa
rk
- -
- -
AP
Reu
ven
- -
- -
AP
Sel
by (
Old
)/ S
elby
X2/
Par
k Cen
tral
20
0,00
22
5,00
15
0,00
12
5,00
AP,
RA
Rob
erts
ham
-
- -
- AP
Ford
sbur
g/ M
ayfa
ir
- -
- -
AP
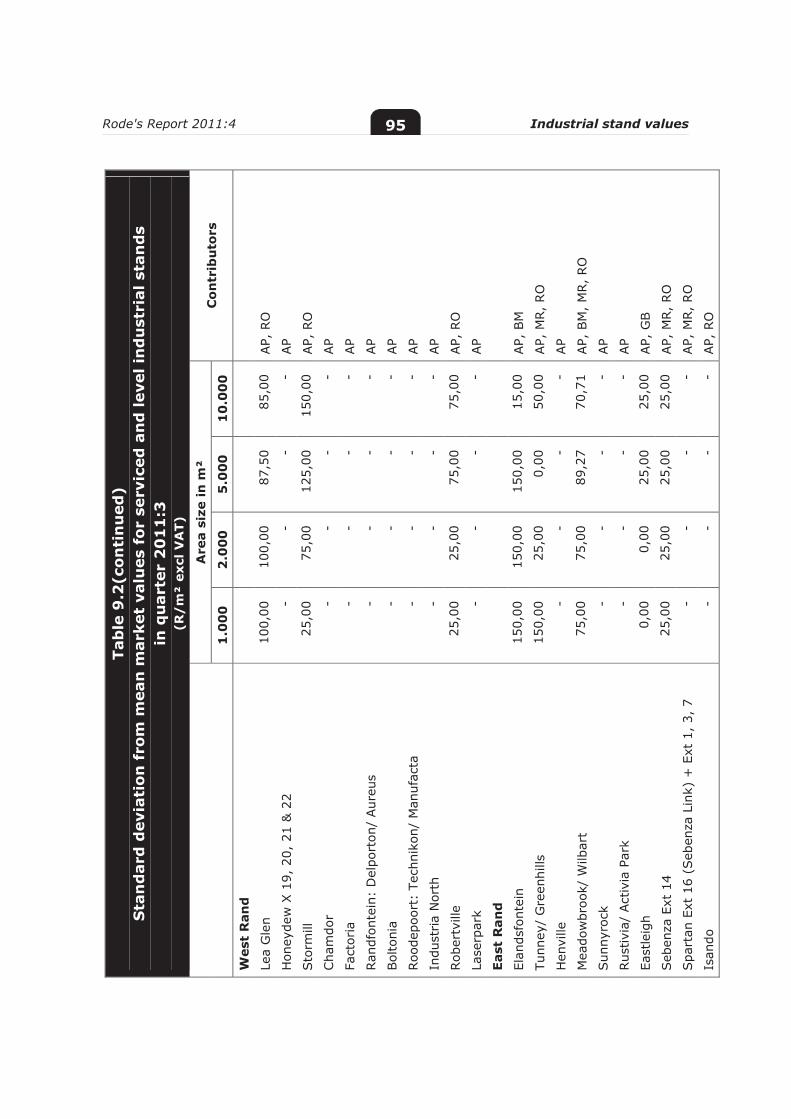
Rode's Report 2011:4 Industrial stand values 95
Tab
le 9
.2(c
onti
nu
ed)
Sta
nd
ard
dev
iati
on f
rom
mea
n m
arke
t va
lues
for
ser
vice
d a
nd
leve
l in
du
stri
al s
tan
ds
in q
uar
ter
20
11
:3
(R/
m²
excl
VA
T)
A
rea
size
in m
² C
on
trib
uto
rs
1.0
00
2
.00
0
5.0
00
1
0.0
00
Wes
t R
and
Lea
Gle
n 10
0,00
10
0,00
87
,50
85,0
0 AP,
RO
Hon
eyde
w X
19,
20,
21
& 2
2 -
- -
- AP
Sto
rmill
25
,00
75,0
0 12
5,00
15
0,00
AP,
RO
Cha
mdo
r -
- -
- AP
Fact
oria
-
- -
- AP
Ran
dfon
tein
: D
elpo
rton
/ Aur
eus
- -
- -
AP
Bol
toni
a -
- -
- AP
Roo
depo
ort:
Tec
hnik
on/
Man
ufac
ta
- -
- -
AP
Indu
stria
Nor
th
- -
- -
AP
Rob
ertv
ille
25,0
0 25
,00
75,0
0 75
,00
AP,
RO
Lase
rpar
k -
- -
- AP
East
Ran
d
Elan
dsfo
ntei
n 15
0,00
15
0,00
15
0,00
15
,00
AP,
BM
Tunn
ey/
Gre
enhi
lls
150,
00
25,0
0 0,
00
50,0
0 AP,
MR,
RO
Hen
ville
-
- -
- AP
Mea
dow
broo
k/ W
ilbar
t 75
,00
75,0
0 89
,27
70,7
1 AP,
BM
, M
R,
RO
Sun
nyro
ck
- -
- -
AP
Rus
tivia
/ Act
ivia
Par
k -
- -
- AP
East
leig
h 0,
00
0,00
25
,00
25,0
0 AP,
GB
Seb
enza
Ext
14
25,0
0 25
,00
25,0
0 25
,00
AP,
MR,
RO
Spa
rtan
Ext
16
(Seb
enza
Lin
k) +
Ext
1,
3, 7
-
- -
- AP,
MR,
RO
Isan
do
- -
- -
AP,
RO
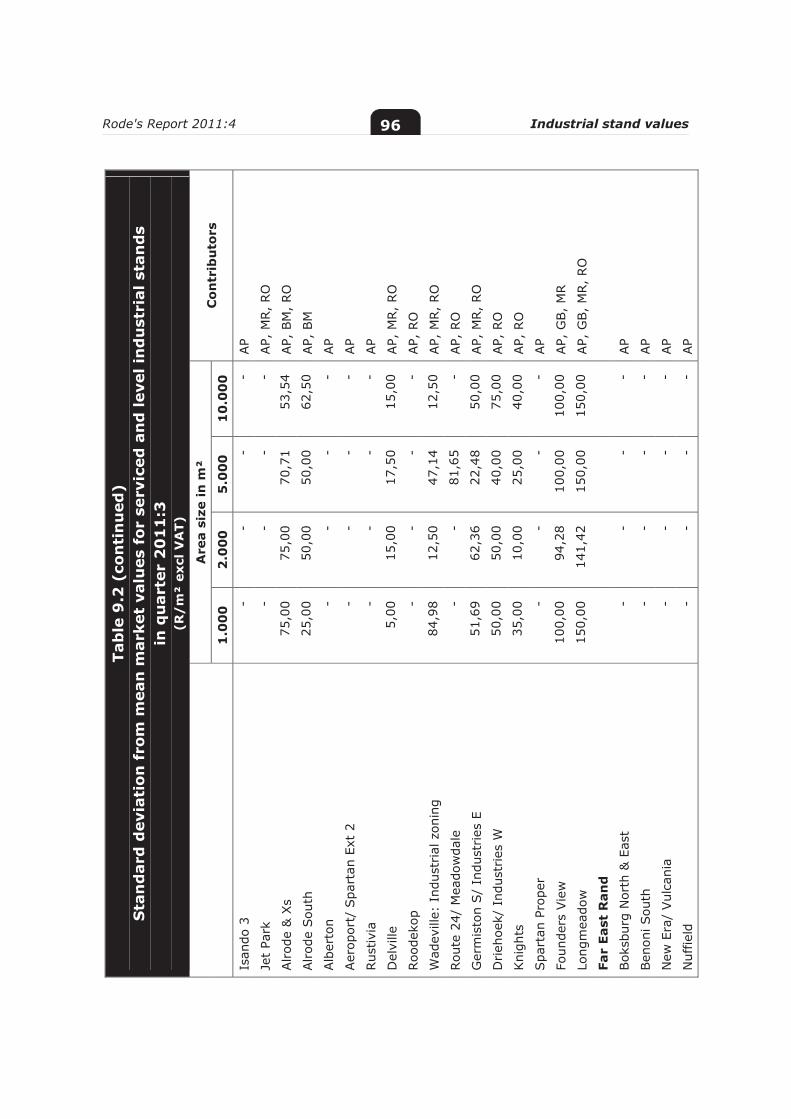
Rode's Report 2011:4 Industrial stand values 96
Tab
le 9
.2 (
con
tin
ued
) S
tan
dar
d d
evia
tion
fro
m m
ean
mar
ket
valu
es f
or s
ervi
ced
an
d le
vel i
nd
ust
rial
sta
nd
s in
qu
arte
r 2
01
1:3
(R
/m
² ex
cl V
AT)
A
rea
size
in m
² C
on
trib
uto
rs
1.0
00
2
.00
0
5.0
00
1
0.0
00
Isan
do 3
-
- -
- AP
Jet
Park
-
- -
- AP,
MR,
RO
Alrod
e &
Xs
75,0
0 75
,00
70,7
1 53
,54
AP,
BM
, RO
Alrod
e Sou
th
25,0
0 50
,00
50,0
0 62
,50
AP,
BM
Alb
erto
n -
- -
- AP
Aer
opor
t/ S
part
an E
xt 2
-
- -
- AP
Rus
tivia
-
- -
- AP
Del
ville
5,
00
15,0
0 17
,50
15,0
0 AP,
MR,
RO
Roo
deko
p -
- -
- AP,
RO
Wad
evill
e: I
ndus
tria
l zon
ing
84,9
8 12
,50
47,1
4 12
,50
AP,
MR,
RO
Rou
te 2
4/ M
eado
wda
le
- -
81,6
5 -
AP,
RO
Ger
mis
ton
S/
Indu
stries
E
51,6
9 62
,36
22,4
8 50
,00
AP,
MR,
RO
Drieh
oek/
Ind
ustr
ies
W
50,0
0 50
,00
40,0
0 75
,00
AP,
RO
Kni
ghts
35
,00
10,0
0 25
,00
40,0
0 AP,
RO
Spa
rtan
Pro
per
- -
- -
AP
Foun
ders
Vie
w
100,
00
94,2
8 10
0,00
10
0,00
AP,
GB,
MR
Long
mea
dow
15
0,00
14
1,42
15
0,00
15
0,00
AP,
GB,
MR,
RO
Far
East
Ran
d
Bok
sbur
g N
orth
& E
ast
- -
- -
AP
Ben
oni S
outh
-
- -
- AP
New
Era
/ Vul
cani
a -
- -
- AP
Nuf
field
-
- -
- AP
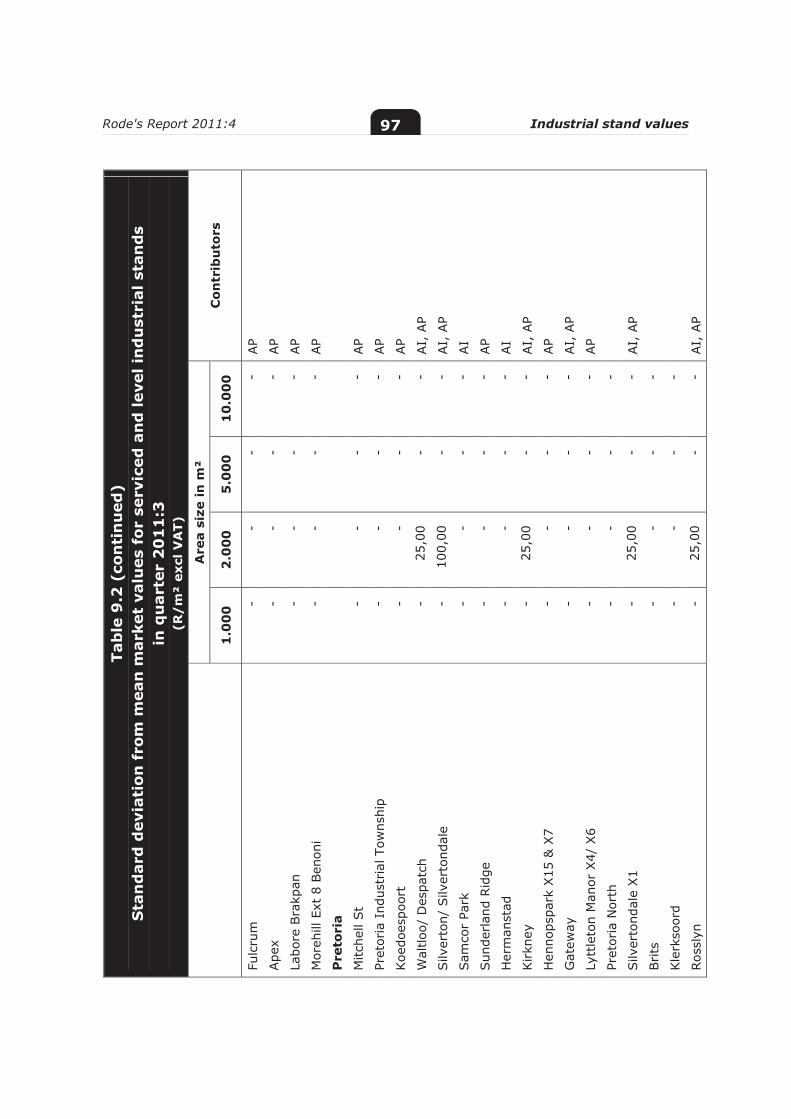
Rode's Report 2011:4 Industrial stand values 97
Tab
le 9
.2 (
con
tin
ued
) S
tan
dar
d d
evia
tion
fro
m m
ean
mar
ket
valu
es f
or s
ervi
ced
an
d le
vel i
nd
ust
rial
sta
nd
s in
qu
arte
r 2
01
1:3
(R
/m
² ex
cl V
AT)
A
rea
size
in m
² C
on
trib
uto
rs
1.0
00
2
.00
0
5.0
00
1
0.0
00
Fulc
rum
-
- -
- AP
Ape
x -
- -
- AP
Labo
re B
rakp
an
- -
- -
AP
Mor
ehill
Ext
8 B
enon
i -
- -
- AP
Pre
tori
a
Mitc
hell
St
- -
- -
AP
Pret
oria
Ind
ustr
ial T
owns
hip
- -
- -
AP
Koe
does
poor
t -
- -
- AP
Wal
tloo/
Des
patc
h -
25,0
0 -
- AI,
AP
Silv
erto
n/ S
ilver
tond
ale
- 10
0,00
-
- AI,
AP
Sam
cor
Park
-
- -
- AI
Sun
derlan
d Rid
ge
- -
- -
AP
Her
man
stad
-
- -
- AI
Kirkn
ey
- 25
,00
- -
AI,
AP
Hen
nops
park
X15
& X
7 -
- -
- AP
Gat
eway
-
- -
- AI,
AP
Lytt
leto
n M
anor
X4/
X6
- -
- -
AP
Pret
oria
Nor
th
- -
- -
Silv
erto
ndal
e X1
- 25
,00
- -
AI,
AP
Brits
-
- -
-
Kle
rkso
ord
- -
- -
Ros
slyn
-
25,0
0 -
- AI,
AP
Rode's Report 2011:4 Industrial stand values 98
Tab
le 9
.2 (
con
tin
ued
) S
tan
dar
d d
evia
tio
n f
rom
mea
n m
arke
t va
lues
for
ser
vice
d a
nd
leve
l in
du
stri
al s
tan
ds
in q
uar
ter
20
11
:3
(R/
m²
excl
VA
T)
A
rea
size
in m
² C
on
trib
uto
rs
1.0
00
2
.00
0
5.0
00
1
0.0
00
Pol
okw
ane
Lebo
wak
gom
o -
- -
- ES
Sup
erbi
a -
- -
- ES
Indu
stria
- -
- -
ES
Ladi
ne
- -
- -
ES
Futu
ra
- -
- -
ES
Labo
ria
- -
- -
ES
Mag
na V
ia
- -
- -
ES
Ses
hego
-
- -
- ES
Nel
spru
it
Nel
spru
it Ea
st
- -
- -
HH
Nel
spru
it W
est
- -
- -
HH
Roc
ky's
Drift
-
- -
- H
H
Riv
ersi
de P
ark
- -
- -
HH
Du
rban
Spr
ingf
ield
Par
k -
- 17
5,00
-
CR,
ML,
PC
May
ville
-
- -
- CR,
PC
Phoe
nix
- -
- -
CR,
MI,
PC
Nor
th C
oast
Rd/
Briar
dene
-
- -
- CR,
PC
Briar
dene
Ind
ustr
ial P
ark
- -
- -
CR,
ML,
PC
Um
geni
Rd/
Sta
mfo
rd H
ill
- -
- -
CR,
PC
Um
bilo
/ Syd
ney
Rd/
Gal
e St
- -
- -
CR,
PC
Rode's Report 2011:4 Industrial stand values 99
Tab
le 9
.2 (
con
tin
ued
) S
tan
dar
d d
evia
tion
fro
m m
ean
mar
ket
valu
es f
or s
ervi
ced
an
d le
vel i
nd
ust
rial
sta
nd
s in
qu
arte
r 2
01
1:3
(R
/m
² ex
cl V
AT)
A
rea
size
in m
²
Con
trib
uto
rs
1.0
00
2
.00
0
5.0
00
1
0.0
00
Jaco
bs
- -
- -
CR,
ML,
PC
Mob
eni
- -
- -
CR,
ML,
PC
Pros
pect
on
- -
- -
CR,
ML,
PC
Pine
tow
n C
entr
al
250,
00
235,
70
205,
48
200,
00
CR,
LS,
ML,
PC
New
Ger
man
y 12
4,72
12
4,72
16
3,30
12
4,72
CR,
LS,
ML,
PC
Isip
ingo
-
- -
- PC
Ros
sbur
gh/
Sou
th C
oast
Rd
- -
- -
CR,
ML
Edw
in S
wal
es D
rive
-
- -
- CR,
MI
Gle
n Ani
l -
- -
- CR,
PC
Brick
field
Rd
- -
- -
CR,
PC
Ver
ulam
-
- -
- CR
Can
elan
ds
- -
- -
PC
Tong
aat
- -
- -
CR,
ML
New
Wes
tmea
d/ M
ahog
any
Rid
ge
169,
97
141,
42
131,
23
94,2
8 CR,
LS,
ML,
PC
Wes
tmea
d 30
0,00
23
5,70
25
0,00
20
0,00
CR,
LS,
ML,
PC
Mar
iann
Par
k/ S
outh
mea
d 94
,28
81,6
5 70
,71
62,3
6 LS
, M
L, P
C
Max
mea
d 30
0,00
26
2,47
24
9,44
20
5,48
CR,
LC,
ML,
PC
Rin
g ro
ad I
ndus
tria
l Par
k -
- -
- PC
Avo
ca/
Red
Hill
/ N
orth
gate
-
- -
- PC
Falc
on P
ark
- -
- -
LS,
PC
Riv
er H
orse
Val
ley
Bus
ines
s Es
tate
-
- 20
0,00
10
0,00
CR,
PC,
MI
Mou
nt E
dgec
ombe
-
- -
- CR,
PC,
MI
Rode's Report 2011:4 Industrial stand values 100
Tab
le 9
.2 (
con
tin
ued
) S
tan
dar
d d
evia
tion
fro
m m
ean
mar
ket
valu
es f
or s
ervi
ced
an
d le
vel i
nd
ust
rial
sta
nd
s in
qu
arte
r 2
01
1:3
(R
/m²
excl
VA
T)
A
rea
size
in m
² C
on
trib
uto
rs
1.0
00
2
.00
0
5.0
00
1
0.0
00
Um
bogi
ntw
ini/
Sou
thga
te
- -
- -
PC
Sou
thga
te I
ndus
tria
l Par
k -
- -
-
Um
geni
Par
k -
- -
- PC
Ham
mer
sdal
e 50
,00
102,
74
84,9
8 70
,71
CR,
LS,
ML,
PC
Cat
o Rid
ge
100,
00
100,
00
62,3
6 62
,36
CR,
LS,
ML,
PC
Cap
e P
enin
sula
Vik
ing
Plac
e -
- -
- BR
Glo
sder
ry
- -
- -
GB
Paar
den
Eila
nd/
Met
ro
250,
00
0,00
25
0,00
-
AN
, BR,
DN
Mon
tagu
e G
arde
ns
250,
00
0,00
25
0,00
-
AN
, BR,
DN
Mar
coni
Bea
m
- -
- -
AN
, BR
Kill
arne
y G
arde
ns
50,0
0 50
,00
- -
AN
, BR,
DN
Rac
ing
Park
11
7,85
-
- -
AN
, BR,
DL,
DN
, LE
Atla
ntis
-
- -
-
Woo
dsto
ck/
Sal
tRiv
er/
Obs
erva
tory
-
- -
-
Ath
lone
1 &
2
- -
- -
Lans
dow
ne N
eris
sa
- -
- -
San
d In
dust
ria
- -
- -
Ott
ery
Hill
star
-
- -
- G
B
Ott
ery
Sun
set
- -
- -
GB
Die
p Riv
er
- -
- -
Elfin
dale
-
- -
-
Mon
woo
d/ P
hilip
pi E
ast
- -
- -
AW
Phili
ppi W
est
(wes
t of
Van
guar
d D
r)
- -
- -
Rode's Report 2011:4 Industrial stand values 101
Tab
le 9
.2 (
con
tin
ued
) S
tan
dar
d d
evia
tion
fro
m m
ean
mar
ket
valu
es f
or s
ervi
ced
an
d le
vel i
nd
ust
rial
sta
nd
s in
qu
arte
r 2
01
1:3
(R
/m²
excl
VA
T)
A
rea
size
in m
² C
on
trib
uto
rs
1.0
00
2
.00
0
5.0
00
1
0.0
00
Gug
ulet
hu I
ndus
tria
l(Bro
wn
Farm
s)
- -
- -
Ret
reat
/ Ste
enbe
rg
- -
- -
Cap
rico
rn P
ark
- -
50,0
0 -
GB,
WA
Mai
tland
-
- -
- G
Y
Nda
beni
-
- -
- G
Y
Airpo
rt
100,
00
75,0
0 23
,57
100,
00
AN
, BR,
DN
, G
Y
Eppi
ng 1
& 2
-
- 10
0,00
75
,00
AW
, BR,
GY
WP
Park
50
,00
75,0
0 -
- AN
, BR,
GY
Elsi
es R
iver
(exc
l. Cen
tral
Par
k)
125,
00
100,
00
125,
00
100,
00
AN
, G
Y
Paro
w B
eaco
nval
e 0,
00
94,2
8 23
,57
0,00
AN
, D
N,
GY
Tyge
rber
g Bus
ines
s Pa
rk
94,2
8 47
,14
0,00
0,
00
AN
, D
N,
GY
Paro
w I
ndus
tria
94
,28
94,2
8 25
,00
100,
00
AN
, D
N,
GY
Paro
w E
ast
- -
- -
GY
Bel
lvill
e O
akda
le
- -
- -
AN
, D
N
Bel
lvill
e Stik
land
/ Kay
mor
0,
00
100,
00
- -
AN
, D
N
Bel
lvill
e Tr
iang
le
75,0
0 25
,00
- -
AN
, D
N
Bel
lvill
e Sou
th/S
acks
Circl
e -
- -
- AN
Kra
aifo
ntei
n 50
,00
50,0
0 25
,00
- AN
, D
N
Bra
cken
fell
Indu
stria
100,
00
75,0
0 12
5,00
-
AN
, D
N
Ever
ite B
rack
enfe
ll 50
,00
0,00
50
,00
- AN
, D
N
Kui
ls R
iver
-
- -
- AN
Bla
ckhe
ath
25,0
0 75
,00
0,00
-
AN
, D
N
Sax
enbu
rg I
ndus
tria
l Par
k 10
0,00
0,
00
- -
AN
, D
N
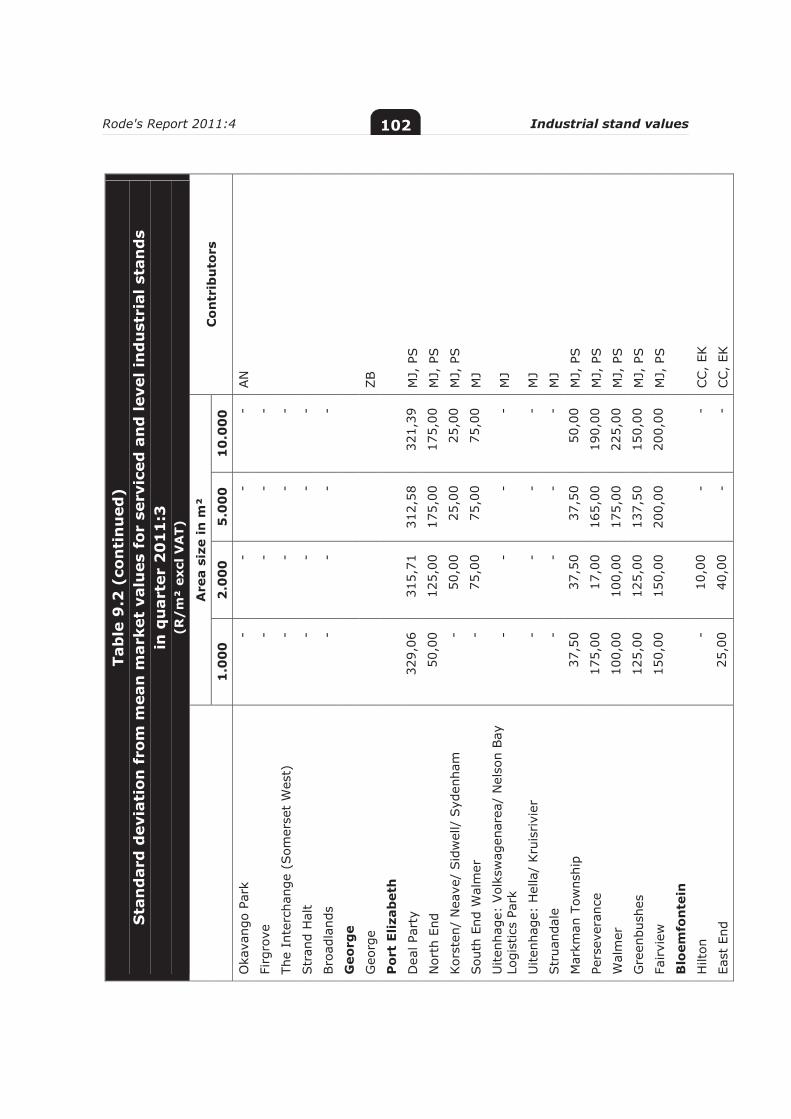
Rode's Report 2011:4 Industrial stand values 102
Tab
le 9
.2 (
con
tin
ued
) S
tan
dar
d d
evia
tion
fro
m m
ean
mar
ket
valu
es f
or s
ervi
ced
an
d le
vel i
nd
ust
rial
sta
nd
s in
qu
arte
r 2
01
1:3
(R
/m²
excl
VA
T)
A
rea
size
in m
² C
on
trib
uto
rs
1.0
00
2
.00
0
5.0
00
1
0.0
00
Oka
vang
o Pa
rk
- -
- -
AN
Firg
rove
-
- -
-
The
Inte
rcha
nge
(Som
erse
t W
est)
-
- -
-
Str
and
Hal
t -
- -
-
Bro
adla
nds
- -
- -
Geo
rge
Geo
rge
ZB
Por
t El
izab
eth
Dea
l Par
ty
329,
06
315,
71
312,
58
321,
39
MJ,
PS
Nor
th E
nd
50,0
0 12
5,00
17
5,00
17
5,00
M
J, P
S
Kor
sten
/ N
eave
/ Sid
wel
l/ S
yden
ham
-
50,0
0 25
,00
25,0
0 M
J, P
S
Sou
th E
nd W
alm
er
- 75
,00
75,0
0 75
,00
MJ
Uite
nhag
e: V
olks
wag
enar
ea/
Nel
son
Bay
Lo
gist
ics
Park
-
- -
- M
J
Uite
nhag
e: H
ella
/ Kru
isrivi
er
- -
- -
MJ
Str
uand
ale
- -
- -
MJ
Mar
kman
Tow
nshi
p 37
,50
37,5
0 37
,50
50,0
0 M
J, P
S
Pers
ever
ance
17
5,00
17
,00
165,
00
190,
00
MJ,
PS
Wal
mer
10
0,00
10
0,00
17
5,00
22
5,00
M
J, P
S
Gre
enbu
shes
12
5,00
12
5,00
13
7,50
15
0,00
M
J, P
S
Fairvi
ew
150,
00
150,
00
200,
00
200,
00
MJ,
PS
Blo
emfo
nte
in
Hilt
on
- 10
,00
- -
CC,
EK
East
End
25
,00
40,0
0 -
- CC,
EK
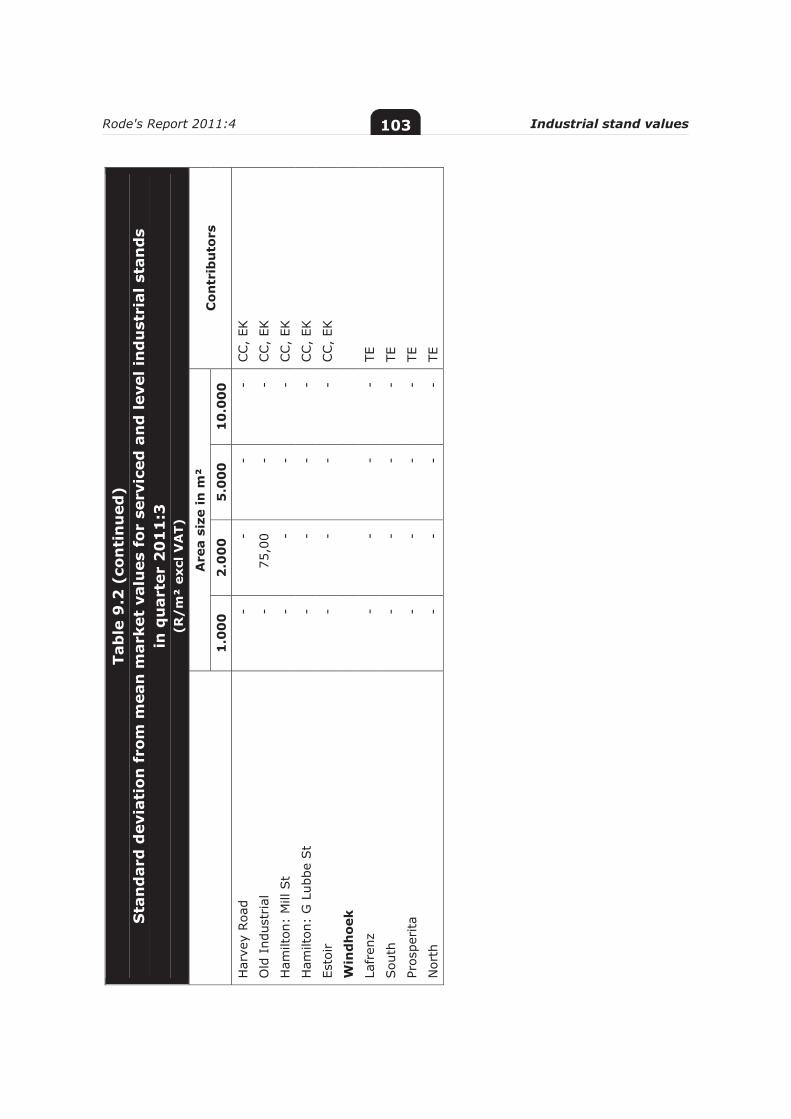
Rode's Report 2011:4 Industrial stand values 103
Tab
le 9
.2 (
con
tin
ued
) S
tan
dar
d d
evia
tion
fro
m m
ean
mar
ket
valu
es f
or s
ervi
ced
an
d le
vel i
nd
ust
rial
sta
nd
s in
qu
arte
r 2
01
1:3
(R
/m
² ex
cl V
AT)
A
rea
size
in m
² C
on
trib
uto
rs
1.0
00
2
.00
0
5.0
00
1
0.0
00
Har
vey
Roa
d -
- -
- CC,
EK
Old
Ind
ustr
ial
- 75
,00
- -
CC,
EK
Ham
ilton
: M
ill S
t -
- -
- CC,
EK
Ham
ilton
: G
Lub
be S
t -
- -
- CC,
EK
Esto
ir
- -
- -
CC,
EK
Win
dh
oek
Lafr
enz
- -
- -
TE
Sou
th
- -
- -
TE
Pros
perita
-
- -
- TE
Nor
th
- -
- -
TE
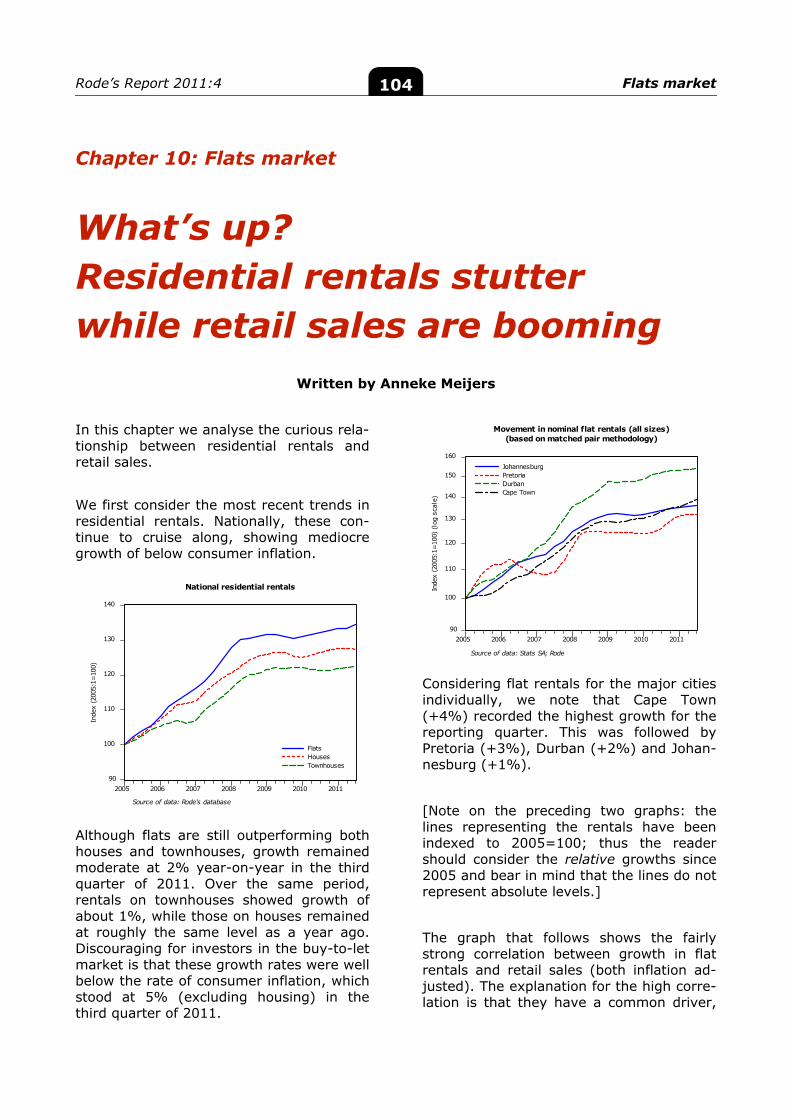
Rode’s Report 2011:4 Flats market 104
90
100
110
120
130
140
2005 2006 2007 2008 2009 2010 2011
FlatsHousesTownhouses
National residential rentals
Inde
x (2
005:
1=10
0)
Source of data: Rode's database
90
100
110
120
130
140
150
160
2005 2006 2007 2008 2009 2010 2011
JohannesburgPretoriaDurbanCape Town
Movement in nominal flat rentals (all sizes)(based on matched pair methodology)
Inde
x (2
005:
1=10
0) (
log
scal
e)
Source of data: Stats SA; Rode
Chapter 10: Flats market
What’s up? Residential rentals stutter while retail sales are booming
Written by Anneke Meijers
In this chapter we analyse the curious rela-tionship between residential rentals and retail sales.
We first consider the most recent trends in residential rentals. Nationally, these con-tinue to cruise along, showing mediocre growth of below consumer inflation. Although flats are still outperforming both houses and townhouses, growth remained moderate at 2% year-on-year in the third quarter of 2011. Over the same period, rentals on townhouses showed growth of about 1%, while those on houses remained at roughly the same level as a year ago. Discouraging for investors in the buy-to-let market is that these growth rates were well below the rate of consumer inflation, which stood at 5% (excluding housing) in the third quarter of 2011.
Considering flat rentals for the major cities individually, we note that Cape Town (+4%) recorded the highest growth for the reporting quarter. This was followed by Pretoria (+3%), Durban (+2%) and Johan-nesburg (+1%).
[Note on the preceding two graphs: the lines representing the rentals have been indexed to 2005=100; thus the reader should consider the relative growths since 2005 and bear in mind that the lines do not represent absolute levels.]
The graph that follows shows the fairly strong correlation between growth in flat rentals and retail sales (both inflation ad-justed). The explanation for the high corre-lation is that they have a common driver,
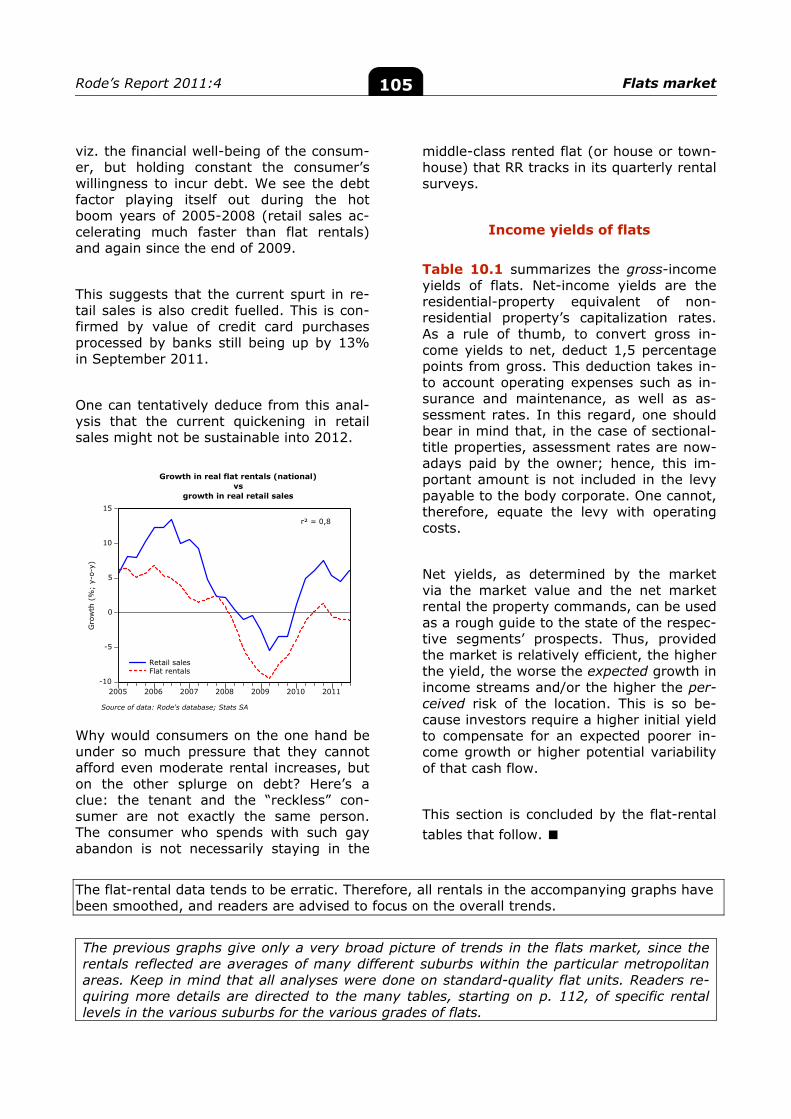
Rode’s Report 2011:4 Flats market 105
-10
-5
0
5
10
15
2005 2006 2007 2008 2009 2010 2011
Retail salesFlat rentals
Growth in real flat rentals (national)vs
growth in real retail sales
Gro
wth
(%
; y-
o-y)
Source of data: Rode's database; Stats SA
r² = 0,8
viz. the financial well-being of the consum-er, but holding constant the consumer’s willingness to incur debt. We see the debt factor playing itself out during the hot boom years of 2005-2008 (retail sales ac-celerating much faster than flat rentals) and again since the end of 2009.
This suggests that the current spurt in re-tail sales is also credit fuelled. This is con-firmed by value of credit card purchases processed by banks still being up by 13% in September 2011.
One can tentatively deduce from this anal-ysis that the current quickening in retail sales might not be sustainable into 2012. Why would consumers on the one hand be under so much pressure that they cannot afford even moderate rental increases, but on the other splurge on debt? Here’s a clue: the tenant and the “reckless” con-sumer are not exactly the same person. The consumer who spends with such gay abandon is not necessarily staying in the
middle-class rented flat (or house or town-house) that RR tracks in its quarterly rental surveys.
Income yields of flats
Table 10.1 summarizes the gross-income yields of flats. Net-income yields are the residential-property equivalent of non-residential property’s capitalization rates. As a rule of thumb, to convert gross in-come yields to net, deduct 1,5 percentage points from gross. This deduction takes in-to account operating expenses such as in-surance and maintenance, as well as as-sessment rates. In this regard, one should bear in mind that, in the case of sectional-title properties, assessment rates are now-adays paid by the owner; hence, this im-portant amount is not included in the levy payable to the body corporate. One cannot, therefore, equate the levy with operating costs.
Net yields, as determined by the market via the market value and the net market rental the property commands, can be used as a rough guide to the state of the respec-tive segments’ prospects. Thus, provided the market is relatively efficient, the higher the yield, the worse the expected growth in income streams and/or the higher the per-ceived risk of the location. This is so be-cause investors require a higher initial yield to compensate for an expected poorer in-come growth or higher potential variability of that cash flow.
This section is concluded by the flat-rental tables that follow. ■
The flat-rental data tends to be erratic. Therefore, all rentals in the accompanying graphs have been smoothed, and readers are advised to focus on the overall trends. The previous graphs give only a very broad picture of trends in the flats market, since the rentals reflected are averages of many different suburbs within the particular metropolitan areas. Keep in mind that all analyses were done on standard-quality flat units. Readers re-quiring more details are directed to the many tables, starting on p. 112, of specific rental levels in the various suburbs for the various grades of flats.
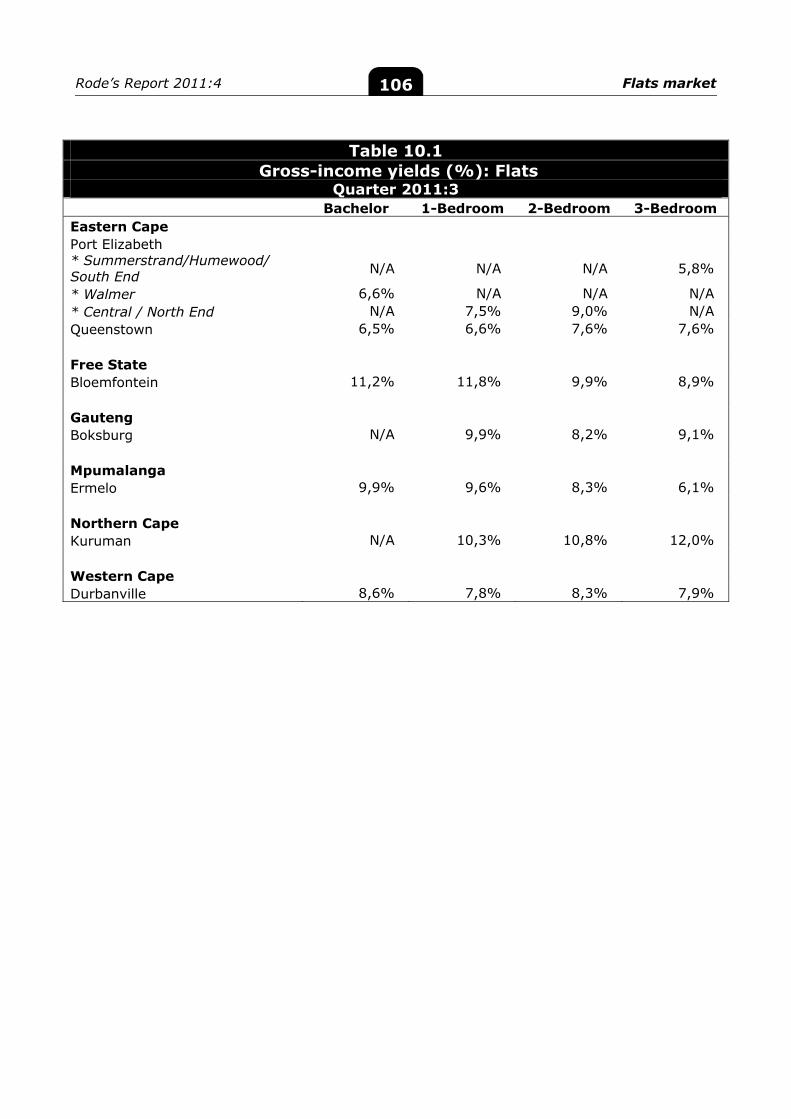
Rode’s Report 2011:4 Flats market 106
Table 10.1 Gross-income yields (%): Flats
Quarter 2011:3 Bachelor 1-Bedroom 2-Bedroom 3-Bedroom Eastern Cape Port Elizabeth * Summerstrand/Humewood/ South End N/A N/A N/A 5,8%
* Walmer 6,6% N/A N/A N/A * Central / North End N/A 7,5% 9,0% N/A Queenstown 6,5% 6,6% 7,6% 7,6% Free State Bloemfontein 11,2% 11,8% 9,9% 8,9% Gauteng Boksburg N/A 9,9% 8,2% 9,1% Mpumalanga Ermelo 9,9% 9,6% 8,3% 6,1%
Northern Cape Kuruman N/A 10,3% 10,8% 12,0%
Western Cape Durbanville 8,6% 7,8% 8,3% 7,9%
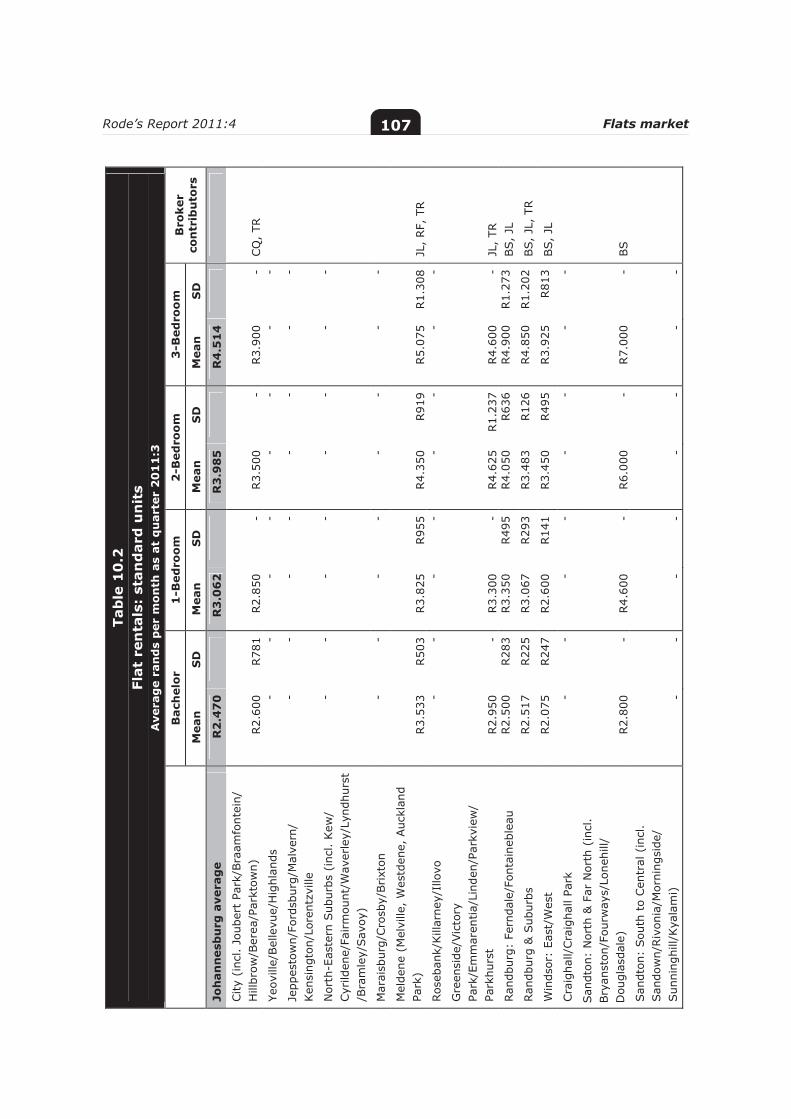
Rode’s Report 2011:4 Flats market 107Ta
ble
10
.2
Flat
ren
tals
: st
and
ard
un
its
Ave
rag
e ra
nd
s p
er m
on
th a
s at
qu
arte
r 2
01
1:3
B
ach
elo
r 1
-Bed
roo
m
2-B
edro
om
3
-Bed
roo
m
Bro
ker
con
trib
uto
rs
M
ean
S
D
Mea
n
SD
M
ean
S
D
Mea
n
SD
Joh
ann
esb
urg
ave
rag
e R
2.4
70
R3
.06
2
R
3.9
85
R4
.51
4
City
(in
cl.
Joub
ert
Park
/Bra
amfo
ntei
n/
Hill
brow
/Ber
ea/P
arkt
own)
R2.
600
R78
1
R2.
850
-
R3.
500
-
R3.
900
-
CQ
, TR
Ye
ovill
e/Bel
levu
e/H
ighl
ands
-
- -
- -
- -
-
Jepp
esto
wn/
Ford
sbur
g/M
alve
rn/
Ken
sing
ton/
Lore
ntzv
ille
- -
- -
- -
- -
N
orth
-Eas
tern
Sub
urbs
(in
cl.
Kew
/
Cyr
ilden
e/Fa
irm
ount
/Wav
erle
y/Ly
ndhu
rst
/Bra
mle
y/Sav
oy)
- -
- -
- -
- -
M
arai
sbur
g/Cro
sby/
Brixt
on
- -
- -
- -
- -
M
elde
ne (
Mel
ville
, W
estd
ene,
Auc
klan
d
Park
) R3.
533
R50
3
R3.
825
R95
5
R4.
350
R91
9
R5.
075
R1.
308
JL
, RF,
TR
Ros
eban
k/Kill
arne
y/Illo
vo
- -
- -
- -
- -
Gre
ensi
de/V
icto
ry
Park
/Em
mar
entia
/Lin
den/
Park
view
/
Park
hurs
t R2.
950
-
R3.
300
-
R4.
625
R1.
237
R4.
600
-
JL,
TR
Ran
dbur
g: F
ernd
ale/
Font
aine
blea
u R2.
500
R28
3
R3.
350
R49
5
R4.
050
R63
6
R4.
900
R1.
273
BS,
JL
Ran
dbur
g &
Sub
urbs
R2.
517
R22
5
R3.
067
R29
3
R3.
483
R12
6
R4.
850
R1.
202
BS,
JL,
TR
Win
dsor
: Ea
st/W
est
R2.
075
R24
7
R2.
600
R14
1
R3.
450
R49
5
R3.
925
R81
3
BS,
JL
Cra
igha
ll/Cra
igha
ll Pa
rk
- -
- -
- -
- -
San
dton
: N
orth
& F
ar N
orth
(in
cl.
Bry
anst
on/F
ourw
ays/
Lone
hill/
D
ougl
asda
le)
R2.
800
-
R4.
600
-
R6.
000
-
R7.
000
-
BS
San
dton
: Sou
th t
o Cen
tral
(in
cl.
San
dow
n/Riv
onia
/Mor
ning
side
/
Sun
ning
hill/
Kya
lam
i)
- -
- -
- -
- -
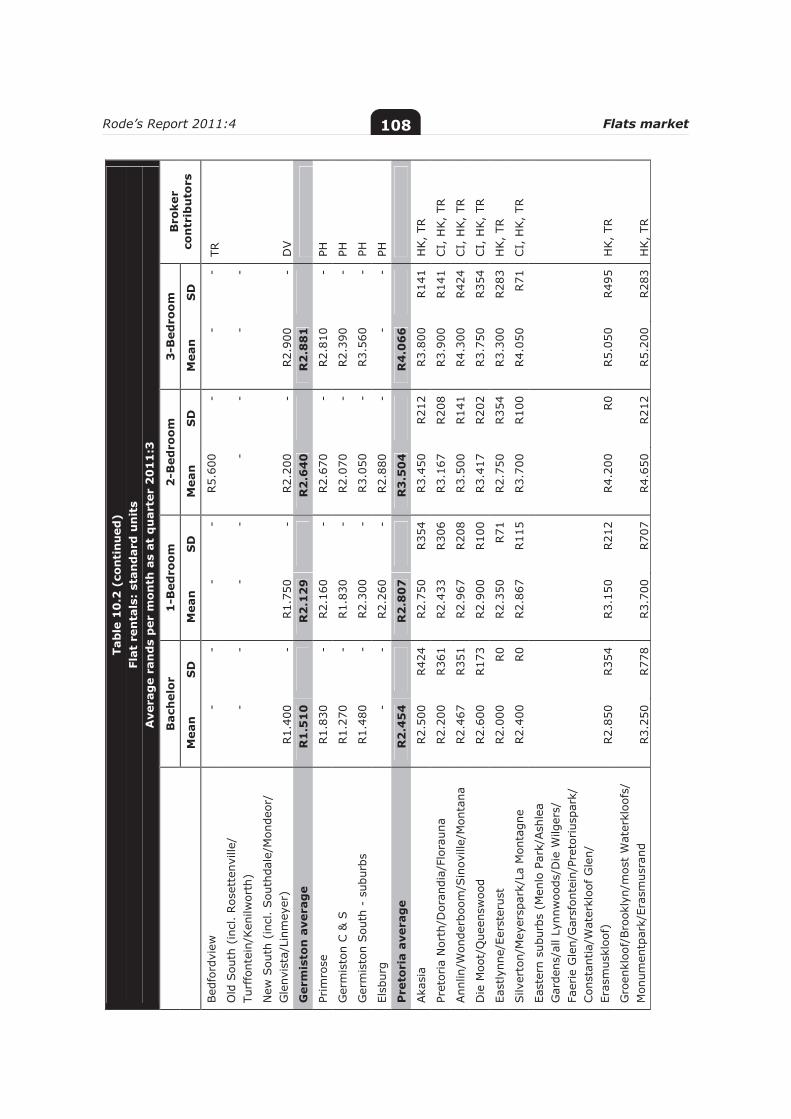
Rode’s Report 2011:4 Flats market 108Ta
ble
10
.2 (
con
tin
ued
) Fl
at r
enta
ls:
stan
dar
d u
nit
s A
vera
ge
ran
ds
per
mon
th a
s at
qu
arte
r 2
01
1:3
B
ach
elor
1
-Bed
roo
m
2-B
edro
om
3
-Bed
roo
m
Bro
ker
con
trib
uto
rs
M
ean
S
D
Mea
n
SD
M
ean
S
D
Mea
n
SD
Bed
ford
view
-
- -
- R5.
600
-
- -
TR
Old
Sou
th (
incl
. Ros
ette
nvill
e/
Turf
font
ein/
Ken
ilwor
th)
- -
- -
- -
- -
N
ew S
outh
(in
cl.
Sou
thda
le/M
onde
or/
G
lenv
ista
/Lin
mey
er)
R1.
400
-
R1.
750
-
R2.
200
-
R2.
900
-
DV
Ger
mis
ton
ave
rag
e R
1.5
10
R2
.12
9
R
2.6
40
R2
.88
1
Prim
rose
R1.
830
-
R2.
160
-
R2.
670
-
R2.
810
-
PH
Ger
mis
ton
C &
S
R1.
270
-
R1.
830
-
R2.
070
-
R2.
390
-
PH
Ger
mis
ton
Sou
th -
sub
urbs
R1.
480
-
R2.
300
-
R3.
050
-
R3.
560
-
PH
Elsb
urg
- -
R2.
260
-
R2.
880
-
- -
PH
Pre
tori
a av
erag
e R
2.4
54
R2
.80
7
R
3.5
04
R4
.06
6
Aka
sia
R2.
500
R42
4
R2.
750
R35
4
R3.
450
R21
2
R3.
800
R14
1
HK,
TR
Pret
oria
Nor
th/D
oran
dia/
Flor
auna
R2.
200
R36
1
R2.
433
R30
6
R3.
167
R20
8
R3.
900
R14
1
CI,
HK,
TR
Ann
lin/W
onde
rboo
m/S
inov
ille/
Mon
tana
R2.
467
R35
1
R2.
967
R20
8
R3.
500
R14
1
R4.
300
R42
4
CI,
HK,
TR
Die
Moo
t/Q
ueen
swoo
d R2.
600
R17
3
R2.
900
R10
0
R3.
417
R20
2
R3.
750
R35
4
CI,
HK,
TR
East
lynn
e/Ee
rste
rust
R2.
000
R0
R2.
350
R71
R2.
750
R35
4
R3.
300
R28
3
HK,
TR
Silv
erto
n/M
eyer
spar
k/La
Mon
tagn
e R2.
400
R0
R2.
867
R11
5
R3.
700
R10
0
R4.
050
R71
CI,
HK,
TR
East
ern
subu
rbs
(Men
lo P
ark/
Ash
lea
G
arde
ns/a
ll Ly
nnw
oods
/Die
Wilg
ers/
Fa
erie
Gle
n/G
arsf
onte
in/P
reto
rius
park
/
Con
stan
tia/W
ater
kloo
f G
len/
Er
asm
uskl
oof)
R2.
850
R35
4
R3.
150
R21
2
R4.
200
R0
R5.
050
R49
5
HK,
TR
Gro
enkl
oof/
Bro
okly
n/m
ost
Wat
erkl
oofs
/
Mon
umen
tpar
k/Er
asm
usra
nd
R3.
250
R77
8
R3.
700
R70
7
R4.
650
R21
2
R5.
200
R28
3
HK,
TR
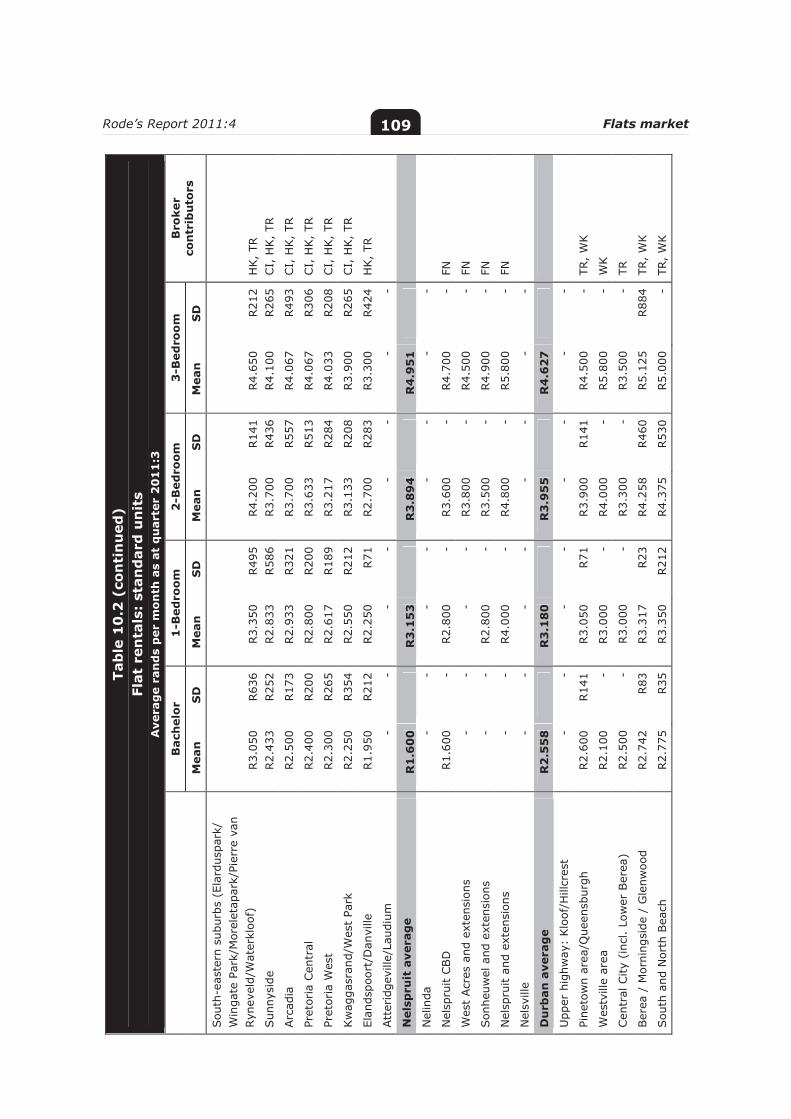
Rode’s Report 2011:4 Flats market 109Ta
ble
10
.2 (
con
tin
ued
) Fl
at r
enta
ls:
stan
dar
d u
nit
s A
vera
ge
ran
ds
per
mo
nth
as
at q
uar
ter
20
11
:3
B
ach
elo
r 1
-Bed
roo
m
2-B
edro
om
3
-Bed
roo
m
Bro
ker
con
trib
uto
rs
M
ean
S
D
Mea
n
SD
M
ean
S
D
Mea
n
SD
Sou
th-e
aste
rn s
ubur
bs (
Elar
dusp
ark/
W
inga
te P
ark/
Mor
elet
apar
k/Pi
erre
van
Ryn
evel
d/W
ater
kloo
f)
R3.
050
R63
6
R3.
350
R49
5
R4.
200
R14
1
R4.
650
R21
2
HK,
TR
Sun
nysi
de
R2.
433
R25
2
R2.
833
R58
6
R3.
700
R43
6
R4.
100
R26
5
CI,
HK,
TR
Arc
adia
R2.
500
R17
3
R2.
933
R32
1
R3.
700
R55
7
R4.
067
R49
3
CI,
HK,
TR
Pret
oria
Cen
tral
R2.
400
R20
0
R2.
800
R20
0
R3.
633
R51
3
R4.
067
R30
6
CI,
HK,
TR
Pret
oria
Wes
t R2.
300
R26
5
R2.
617
R18
9
R3.
217
R28
4
R4.
033
R20
8
CI,
HK,
TR
Kw
agga
sran
d/W
est
Park
R2.
250
R35
4
R2.
550
R21
2
R3.
133
R20
8
R3.
900
R26
5
CI,
HK,
TR
Elan
dspo
ort/
Dan
ville
R1.
950
R21
2
R2.
250
R71
R2.
700
R28
3
R3.
300
R42
4
HK,
TR
Att
erid
gevi
lle/L
audi
um
- -
- -
- -
- -
Nel
spru
it a
vera
ge
R1
.60
0
R
3.1
53
R3
.89
4
R
4.9
51
Nel
inda
-
- -
- -
- -
-
Nel
spru
it CBD
R1.
600
-
R2.
800
-
R3.
600
-
R4.
700
-
FN
Wes
t Acr
es a
nd e
xten
sion
s -
- -
- R3.
800
-
R4.
500
-
FN
Son
heuw
el a
nd e
xten
sion
s -
- R2.
800
-
R3.
500
-
R4.
900
-
FN
Nel
spru
it an
d ex
tens
ions
-
- R4.
000
-
R4.
800
-
R5.
800
-
FN
Nel
svill
e -
- -
- -
- -
-
Du
rban
ave
rag
e R
2.5
58
R3
.18
0
R
3.9
55
R4
.62
7
Upp
er h
ighw
ay:
Klo
of/H
illcr
est
- -
- -
- -
- -
Pine
tow
n ar
ea/Q
ueen
sbur
gh
R2.
600
R14
1
R3.
050
R71
R3.
900
R14
1
R4.
500
-
TR,
WK
Wes
tvill
e ar
ea
R2.
100
-
R3.
000
-
R4.
000
-
R5.
800
-
WK
Cen
tral
City
(in
cl.
Low
er B
erea
) R2.
500
-
R3.
000
-
R3.
300
-
R3.
500
-
TR
Ber
ea /
Mor
ning
side
/ G
lenw
ood
R2.
742
R83
R3.
317
R23
R4.
258
R46
0
R5.
125
R88
4
TR,
WK
Sou
th a
nd N
orth
Bea
ch
R2.
775
R35
R3.
350
R21
2
R4.
375
R53
0
R5.
000
-
TR,
WK
Rode’s Report 2011:4 Flats market 110Ta
ble
10
.2 (
con
tin
ued
) Fl
at r
enta
ls:
stan
dar
d u
nit
s A
vera
ge
ran
ds
per
mo
nth
as
at q
uar
ter
20
11
:3
B
ach
elor
1
-Bed
room
2
-Bed
roo
m
3-B
edro
om
B
roke
r co
ntr
ibu
tors
Mea
n
SD
M
ean
S
D
Mea
n
SD
M
ean
S
D
Dur
ban
Nor
th/L
a Lu
cia/
Um
hlan
ga
- -
- -
- -
- -
Nor
th (
Dol
phin
) Coa
st/B
allit
o -
- -
- -
- -
-
Mon
tcla
ire/
Yello
ww
ood
Park
R2.
700
-
R3.
400
-
R4.
000
-
R4.
500
-
WK
Blu
ff a
rea/
Dur
ban
Sout
h -
- R3.
150
R49
5
R3.
900
R14
1
R4.
200
-
TR,
WK
Dur
ban
Sou
th/A
man
zim
toti/
War
ner
Bea
ch a
rea
- -
R3.
200
-
R4.
000
-
R4.
750
-
WK
Cap
e To
wn
ave
rag
e R
2.5
69
R3
.23
4
R
4.1
33
R5
.24
1
Cam
ps B
ay/C
lifto
n/Ban
try
Bay
R4.
025
R67
2
R5.
450
R71
R7.
400
R84
9
R12
.000
-
SQ
, TR
Sea
Poi
nt
R3.
250
-
R4.
250
-
R5.
500
-
R6.
500
-
TR
Gre
en P
oint
/Thr
ee A
ncho
r Bay
R3.
367
R11
5
R4.
267
R40
4
R5.
633
R47
3
R8.
000
-
PF,
SQ
, TR
City
Bow
l (ex
clud
ing
Hig
gova
le)
R3.
667
R28
9
R4.
583
R38
2
R6.
300
R60
8
R8.
333
R1.
041
JL
, SQ
, TR
City
Cen
tre
R4.
050
R63
6
R4.
750
R35
4
R6.
250
R35
4
R8.
600
R56
6
TR,
SQ
Wat
erfr
ont
- -
- -
- -
- -
Ron
debo
sch/
Ros
eban
k/Cla
rem
ont
R3.
050
R71
R4.
183
R67
1
R4.
933
R75
1
R6.
450
R91
9
PF,
SQ
, TR
Ken
ilwor
th/W
ynbe
rg/P
lum
stea
d R2.
850
R13
2
R3.
633
R76
R4.
367
R30
6
R4.
800
-
PF S
Q,
TR
Mui
zenb
erg/
Kal
k Bay
/ Fi
sh H
oek
R2.
575
R10
6
R3.
250
R42
4
R3.
975
R38
9
R4.
800
-
SQ
, TR
Hou
t Bay
R2.
900
-
R3.
500
-
R4.
600
-
R5.
800
-
EM
Miln
erto
n/San
ddrift
R2.
580
R40
1
R3.
270
R21
7
R3.
960
R49
7
R5.
075
R49
1
LA,
PF,
RS,
TR
Tabl
evie
w/P
arkl
ands
R2.
700
R40
0
R3.
233
R58
R4.
188
R81
5
R4.
575
R10
6
LA,
PF,
RS,
TR
Blo
uber
g/M
elkb
os
R2.
725
R24
7
R3.
225
R24
7
R4.
075
R31
8
R4.
925
R53
0
LA,
TR
Ath
lone
R1.
650
-
R2.
300
-
R3.
200
-
R4.
050
-
TR
Mitc
hell'
s Pl
ain
R1.
950
-
R2.
250
-
R2.
800
-
R3.
500
-
TR
Pine
land
s R2.
850
R21
2
R3.
500
R0
R4.
350
R21
2
R5.
250
R35
4
LA,
TR
Bro
okly
n/Rug
by/M
aitla
nd
R2.
033
R40
4
R2.
567
R45
1
R3.
167
R30
6
R3.
900
R42
4
LA, SQ
, TR
Rode’s Report 2011:4 Flats market 111Ta
ble
10
.2 (
con
tin
ued
) Fl
at r
enta
ls:
stan
dar
d u
nit
s A
vera
ge
ran
ds
per
mo
nth
as
at q
uar
ter
20
11
:3
B
ach
elor
1
-Bed
roo
m
2-B
edro
om
3
-Bed
roo
m
Bro
ker
con
trib
uto
rs
M
ean
S
D
Mea
n
SD
M
ean
S
D
Mea
n
SD
Mon
teVis
ta/G
oodw
ood/
Paro
w/B
ellv
ille
Cen
tral
R2.
450
R31
2
R2.
967
R32
1
R3.
833
R55
1
R4.
350
R21
2
LA,
SQ,
TR
Tyge
r Val
ley
area
/Dur
banv
ille
R2.
300
R20
0
R2.
933
R37
9
R3.
925
R25
0
R4.
700
R17
3
LA,
PF,
RS,
TR
Bra
cken
fell/
Kui
ls R
iver
R1.
900
R30
0
R2.
475
R31
0
R3.
238
R18
9
R4.
125
R10
6
LA,
PF,
RS,
TR
Som
erse
t W
est
R1.
900
R17
3
R2.
200
R17
3
R2.
833
R28
9
R3.
700
R52
0
GE,
LA,
TR
Str
and
R1.
963
R18
9
R2.
465
R22
8
R2.
988
R34
2
R3.
967
R92
9
GE,
LA,
SQ
, TR
G
ordo
n's
Bay
R1.
917
R20
2
R2.
383
R10
4
R2.
950
R87
R4.
233
R68
1
GE,
LA,
TR
Po
rt E
lizab
eth
ave
rag
e R
2.2
18
R2
.60
5
R
3.0
08
R3
.58
7
Sum
mer
stra
nd/H
umew
ood/
Sou
th E
nd
R2.
925
R24
7
R3.
650
R21
2
R4.
600
R10
0
R5.
867
R1.
002
CD
, JP
, ZB
Wal
mer
R2.
475
R62
4
R2.
750
R52
7
R3.
300
R70
0
R4.
500
-
CD
, JP
, ZB
Cen
tral
/Nor
th E
nd
R2.
100
R14
1
R2.
417
R33
3
R2.
625
R31
8
R3.
500
-
CD
, ZB
New
ton
Park
R2.
275
R60
1
R2.
750
R35
4
R2.
725
R17
7
R3.
000
-
CD
, JP
, ZB
Wes
tering
R2.
050
R71
R2.
350
R21
2
R2.
733
R20
2
R3.
150
R21
2
CD
, JP
Kab
ega
R2.
100
R14
1
R2.
500
R42
4
R3.
125
R38
9
R3.
500
-
CD
, JP
, ZB
Alg
oa P
ark
R1.
775
R17
7
R2.
075
R31
8
R2.
400
R56
6
R2.
500
-
CD
, JP
Ea
st L
on
do
n a
vera
ge
R2
.34
7
R
2.4
90
R2
.99
6
R
3.3
58
Sou
ther
nwoo
d/Q
uign
ey B
each
/CBD
R2.
500
-
R2.
375
R53
0
R3.
025
R31
8
R3.
375
R53
0
LP,
TR
Ber
ea
R2.
750
-
R3.
075
R17
7
R3.
525
R35
R3.
800
-
LP,
TR
Am
alin
da
R2.
350
-
R2.
450
R71
R2.
850
R21
2
R3.
050
-
LP,
TR
Gon
ubie
Par
k R2.
000
-
R2.
150
-
R2.
650
-
R3.
250
-
TR
Blo
emfo
nte
in a
vera
ge
R1
.48
3
R
2.2
30
R2
.83
1
R
3.3
63
Blo
emfo
ntei
n
R1.
550
R42
4
R2.
150
R63
6
R2.
650
R49
5
R2.
800
-
ED,
MI
Wes
tden
e R1.
625
R17
7
R2.
250
R35
4
R2.
800
R0
R3.
750
R35
4
ED,
EK,
MI
Will
ows
R1.
683
R34
0
R2.
267
R49
3
R2.
967
R61
1
R3.
275
R67
2
ED,
EK,
MI
Nav
alsi
g R1.
300
-
R2.
233
R46
2
R2.
850
R50
7
R3.
250
R91
9
ED,
EK,
MI
Arb
oret
um
R1.
300
-
R2.
250
R77
8
R2.
900
R84
9
R3.
850
R1.
485
ED
, M
I
Rode’s Report 2011:4 Flats market 112Ta
ble
10
.3
Flat
ren
tals
: u
pm
arke
t u
nit
s A
vera
ge
ran
ds
per
mo
nth
as
at q
uar
ter
20
11
:3
B
ach
elor
1
-Bed
roo
m
2-B
edro
om
3
-Bed
roo
m
Bro
ker
con
trib
uto
rs
M
ean
S
D
Mea
n
SD
M
ean
S
D
Mea
n
SD
Joh
ann
esb
urg
ave
rag
e R
2,7
68
R3
,84
6
R
4,6
89
R5
,07
5
Nor
th-E
aste
rn S
ubur
bs (
incl
. Kew
/
Cyr
ilden
e/Fa
irm
ount
/Wav
erle
y/
Lynd
hurs
t/Bra
mle
y/Sav
oy)
- -
- -
- -
- -
M
arai
sbur
g/C
rosb
y/Bri
xton
-
- -
- -
- -
-
Mel
dene
(M
elvi
lle,
Wes
tden
e,
Auc
klan
d Pa
rk)
R3.
250
-
R3.
450
-
R4.
250
-
R4.
900
-
JL
Ros
eban
k/Kill
arne
y/Illo
vo
R4.
200
-
R5.
500
-
- -
- -
TR
Gre
ensi
de/V
icto
ry
Park
/Em
mar
entia
/Lin
den/
Park
view
/
Park
hurs
t R3.
250
-
R3.
750
-
R4.
300
-
R4.
900
-
JL
Ran
dbur
g: F
ernd
ale/
Font
aine
blea
u R2.
750
R35
4
R3.
625
R53
0
R4.
867
R70
9
R5.
700
R1.
131
BS,
JL,
TR
Ran
dbur
g &
Sub
urbs
R2.
750
R35
4
R3.
400
R14
1
R4.
375
R31
8
R5.
450
R77
8
BS,
JL
Win
dsor
: Ea
st/W
est
R2.
175
R24
7
R2.
825
R24
7
R3.
625
R53
0
R4.
275
R74
2
BS,
JL
Cra
igha
ll/C
raig
hall
Park
-
- -
- -
- -
-
San
dton
: N
orth
& F
ar N
orth
(in
cl.
Bry
anst
on/F
ourw
ays/
Lone
hill/
D
ougl
asda
le)
R3.
000
-
R5.
000
R0
R6.
500
R0
R8.
000
-
BS,
TR
San
dton
: Sou
th t
o Cen
tral
(in
cl.
San
dow
n/R
ivon
ia/M
orni
ngsi
de/
Sun
ning
hill/
Kya
lam
i)
- -
R5.
500
-
R7.
500
-
- -
TR
Bed
ford
view
-
- -
- -
- -
-
Old
Sou
th (
incl
. Ros
ette
nvill
e/
Turf
font
ein/
Ken
ilwor
th)
- -
- -
- -
- -
Rode’s Report 2011:4 Flats market 113Ta
ble
10
.3 (
con
tin
ued
) Fl
at r
enta
ls:
up
mar
ket
un
its
Ave
rag
e ra
nd
s p
er m
on
th a
s at
qu
arte
r 2
01
1:3
B
ach
elor
1
-Bed
roo
m
2-B
edro
om
3
-Bed
roo
m
Bro
ker
con
trib
uto
rs
M
ean
S
D
Mea
n
SD
M
ean
S
D
Mea
n
SD
New
Sou
th (
incl
. Sou
thda
le/M
onde
or/
G
lenv
ista
/Lin
mey
er)
R1.
575
-
R2.
700
R1.
131
R3.
400
R1.
556
R3.
400
-
DV,
TR
Ger
mis
ton
ave
rag
e R
1.8
23
R2
.44
0
R
2.9
62
R3
.31
4
Prim
rose
R2.
020
-
R2.
710
-
R3.
130
-
R3.
460
-
PH
Ger
mis
ton
C &
S
R1.
850
-
R2.
120
-
R2.
450
-
R2.
690
-
PH
Ger
mis
ton
Sou
th -
sub
urbs
R1.
620
-
R2.
530
-
R3.
390
-
R3.
910
-
PH
Elsb
urg
- -
- -
- -
- -
P
reto
ria
aver
age
R2
.50
0
R
2.7
00
R3
.40
0
R
3.8
00
Aka
sia
- -
- -
- -
- -
Pr
etor
ia N
orth
/Dor
andi
a/Fl
orau
na
R2.
500
-
R2.
700
-
R3.
400
-
R3.
800
-
TR
Ann
lin/W
onde
rboo
m/S
inov
ille/
Mon
tana
-
- -
- -
- -
-
Die
Moo
t/Q
ueen
swoo
d -
- -
- -
- -
-
Silv
erto
n/M
eyer
spar
k/La
Mon
tagn
e -
- -
- -
- -
-
East
ern
subu
rbs
(Men
lo P
ark/
Ash
lea
G
arde
ns/a
ll Ly
nnw
oods
/Die
Wilg
ers/
Fa
erie
Gle
n/G
arsf
onte
in/P
reto
rius
park
/
Con
stan
tia/W
ater
kloo
f G
len/
Er
asm
uskl
oof)
-
- -
- -
- -
-
Gro
enkl
oof/
Bro
okly
n/m
ost
Wat
erkl
oofs
/
Mon
umen
tpar
k/Er
asm
usra
nd
- -
- -
- -
- -
Sou
th-e
aste
rn s
ubur
bs (
Elar
dusp
ark/
W
inga
te P
ark/
Mor
elet
apar
k/Pi
erre
van
Ryn
evel
d/W
ater
kloo
f)
- -
- -
- -
- -
Sun
nysi
de
- -
- -
- -
- -
Arc
adia
-
- -
- -
- -
-
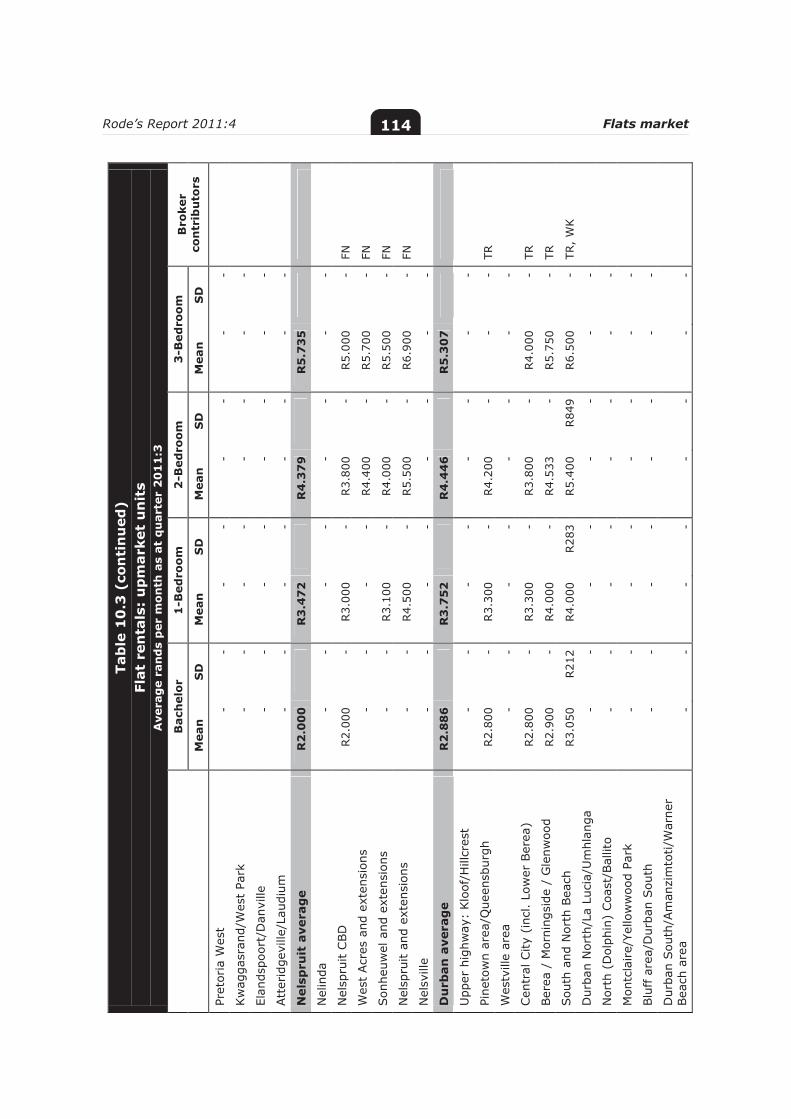
Rode’s Report 2011:4 Flats market 114Ta
ble
10
.3 (
con
tin
ued
) Fl
at r
enta
ls:
up
mar
ket
un
its
Ave
rag
e ra
nd
s p
er m
on
th a
s at
qu
arte
r 2
01
1:3
B
ach
elo
r 1
-Bed
roo
m
2-B
edro
om
3
-Bed
roo
m
Bro
ker
con
trib
uto
rs
M
ean
S
D
Mea
n
SD
M
ean
S
D
Mea
n
SD
Pret
oria
Wes
t -
- -
- -
- -
-
Kw
agga
sran
d/W
est
Park
-
- -
- -
- -
-
Elan
dspo
ort/
Dan
ville
-
- -
- -
- -
-
Att
erid
gevi
lle/L
audi
um
- -
- -
- -
- -
N
elsp
ruit
ave
rag
e R
2.0
00
R3
.47
2
R
4.3
79
R5
.73
5
Nel
inda
-
- -
- -
- -
-
Nel
spru
it C
BD
R2.
000
-
R3.
000
-
R3.
800
-
R5.
000
-
FN
Wes
t Acr
es a
nd e
xten
sion
s -
- -
- R4.
400
-
R5.
700
-
FN
Son
heuw
el a
nd e
xten
sion
s -
- R3.
100
-
R4.
000
-
R5.
500
-
FN
Nel
spru
it a
nd e
xten
sion
s -
- R4.
500
-
R5.
500
-
R6.
900
-
FN
Nel
svill
e -
- -
- -
- -
-
Du
rban
ave
rag
e R
2.8
86
R3
.75
2
R
4.4
46
R5
.30
7
Upp
er h
ighw
ay:
Klo
of/H
illcr
est
- -
- -
- -
- -
Pi
neto
wn
area
/Que
ensb
urgh
R2.
800
-
R3.
300
-
R4.
200
-
- -
TR
Wes
tvill
e ar
ea
- -
- -
- -
- -
Cen
tral
City
(in
cl.
Low
er B
erea
) R2.
800
-
R3.
300
-
R3.
800
-
R4.
000
-
TR
Ber
ea /
Mor
ning
side
/ G
lenw
ood
R2.
900
-
R4.
000
-
R4.
533
-
R5.
750
-
TR
Sou
th a
nd N
orth
Bea
ch
R3.
050
R21
2
R4.
000
R28
3
R5.
400
R84
9
R6.
500
-
TR,
WK
Dur
ban
Nor
th/L
a Lu
cia/
Um
hlan
ga
- -
- -
- -
- -
N
orth
(D
olph
in)
Coa
st/B
allit
o -
- -
- -
- -
-
Mon
tcla
ire/
Yello
ww
ood
Park
-
- -
- -
- -
-
Blu
ff a
rea/
Dur
ban
Sou
th
- -
- -
- -
- -
D
urba
n Sou
th/A
man
zim
toti/
War
ner
Bea
ch a
rea
- -
- -
- -
- -
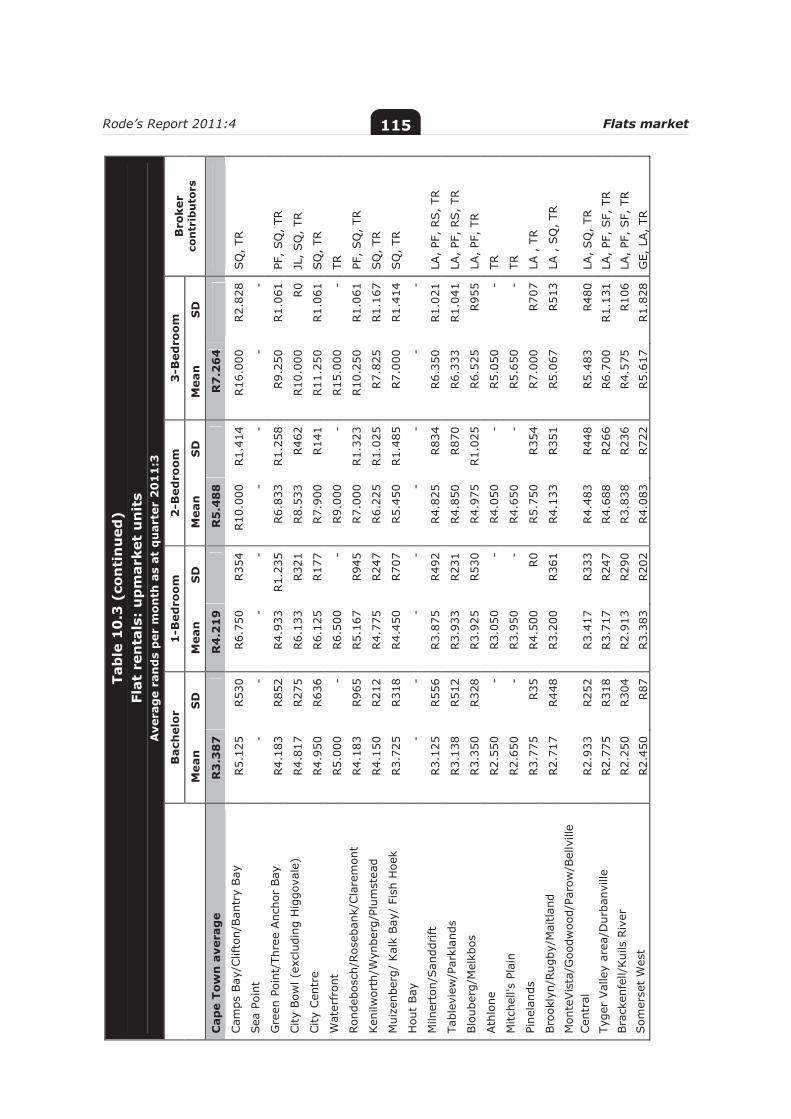
Rode’s Report 2011:4 Flats market 115
Ta
ble
10
.3 (
con
tin
ued
) Fl
at r
enta
ls:
up
mar
ket
un
its
Ave
rag
e ra
nd
s p
er m
on
th a
s at
qu
arte
r 2
01
1:3
B
ach
elo
r 1
-Bed
roo
m
2-B
edro
om
3
-Bed
roo
m
Bro
ker
con
trib
uto
rs
M
ean
S
D
Mea
n
SD
M
ean
S
D
Mea
n
SD
Cap
e To
wn
ave
rag
e R
3.3
87
R4
.21
9
R
5.4
88
R7
.26
4
Cam
ps B
ay/C
lifto
n/Ban
try
Bay
R5.
125
R53
0
R6.
750
R35
4
R10
.000
R1.
414
R16
.000
R2.
828
SQ
, TR
Sea
Poi
nt
- -
- -
- -
- -
G
reen
Poi
nt/T
hree
Anc
hor
Bay
R4.
183
R85
2
R4.
933
R1.
235
R6.
833
R1.
258
R9.
250
R1.
061
PF
, SQ
, TR
City
Bow
l (ex
clud
ing
Hig
gova
le)
R4.
817
R27
5
R6.
133
R32
1
R8.
533
R46
2
R10
.000
R0
JL
, SQ
, TR
City
Cen
tre
R4.
950
R63
6
R6.
125
R17
7
R7.
900
R14
1
R11
.250
R1.
061
SQ
, TR
W
ater
fron
t R5.
000
-
R6.
500
-
R9.
000
-
R15
.000
-
TR
Ron
debo
sch/
Ros
eban
k/Cla
rem
ont
R4.
183
R96
5
R5.
167
R94
5
R7.
000
R1.
323
R10
.250
R1.
061
PF
, SQ
, TR
Ken
ilwor
th/W
ynbe
rg/P
lum
stea
d R4.
150
R21
2
R4.
775
R24
7
R6.
225
R1.
025
R7.
825
R1.
167
SQ
, TR
M
uize
nber
g/ K
alk
Bay
/ Fi
sh H
oek
R3.
725
R31
8
R4.
450
R70
7
R5.
450
R1.
485
R7.
000
R1.
414
SQ
, TR
H
out
Bay
-
- -
- -
- -
-
Miln
erto
n/San
ddrift
R3.
125
R55
6
R3.
875
R49
2
R4.
825
R83
4
R6.
350
R1.
021
LA
, PF
, RS,
TR
Tabl
evie
w/P
arkl
ands
R3.
138
R51
2
R3.
933
R23
1
R4.
850
R87
0
R6.
333
R1.
041
LA
, PF
, RS,
TR
Blo
uber
g/M
elkb
os
R3.
350
R32
8
R3.
925
R53
0
R4.
975
R1.
025
R6.
525
R95
5
LA,
PF,
TR
Ath
lone
R2.
550
-
R3.
050
-
R4.
050
-
R5.
050
-
TR
Mitc
hell'
s Pl
ain
R2.
650
-
R3.
950
-
R4.
650
-
R5.
650
-
TR
Pine
land
s R3.
775
R35
R4.
500
R0
R5.
750
R35
4
R7.
000
R70
7
LA ,
TR
Bro
okly
n/Rug
by/M
aitla
nd
R2.
717
R44
8
R3.
200
R36
1
R4.
133
R35
1
R5.
067
R51
3
LA ,
SQ
, TR
M
onte
Vis
ta/G
oodw
ood/
Paro
w/B
ellv
ille
Cen
tral
R2.
933
R25
2
R3.
417
R33
3
R4.
483
R44
8
R5.
483
R48
0
LA,
SQ
, TR
Ty
ger
Valle
y ar
ea/D
urba
nvill
e R2.
775
R31
8
R3.
717
R24
7
R4.
688
R26
6
R6.
700
R1.
131
LA
, PF
, SF,
TR
Bra
cken
fell/
Kui
ls R
iver
R2.
250
R30
4
R2.
913
R29
0
R3.
838
R23
6
R4.
575
R10
6
LA,
PF,
SF,
TR
Som
erse
t W
est
R2.
450
R87
R3.
383
R20
2
R4.
083
R72
2
R5.
617
R1.
828
G
E, L
A,
TR
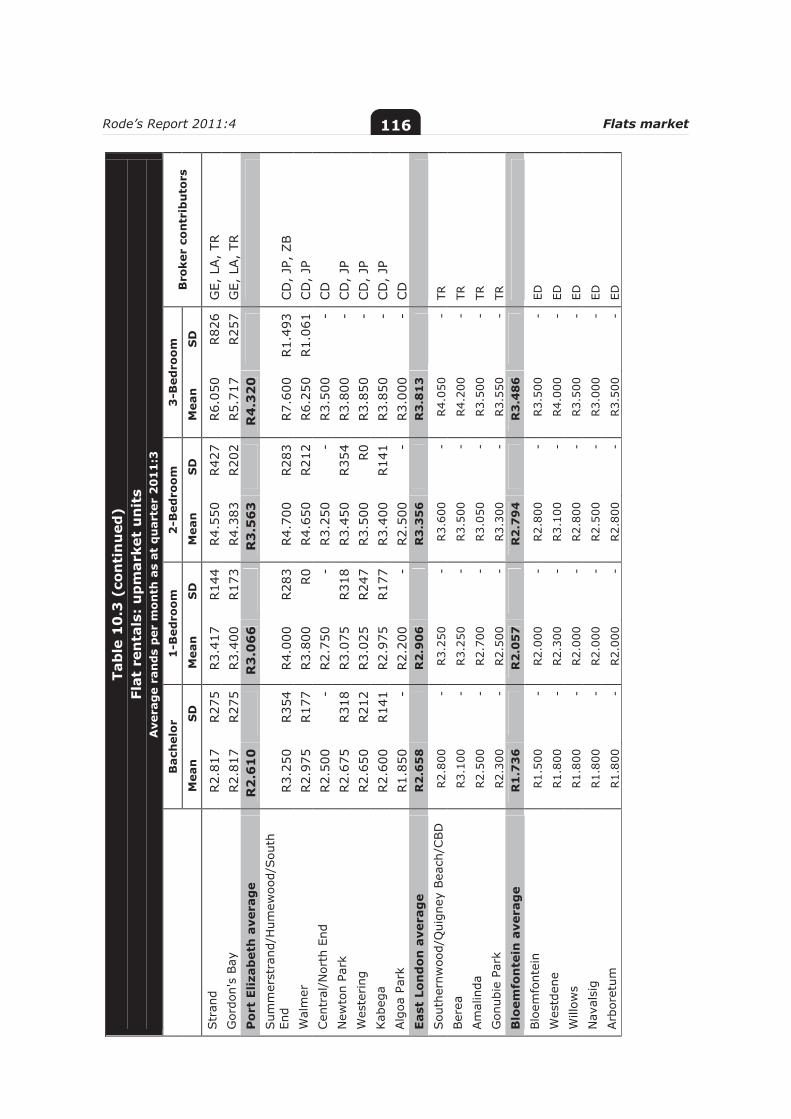
Rode’s Report 2011:4 Flats market 116
Tab
le 1
0.3
(co
nti
nu
ed)
Flat
ren
tals
: u
pm
arke
t u
nit
s A
vera
ge
ran
ds
per
mo
nth
as
at q
uar
ter
20
11
:3
B
ach
elor
1
-Bed
room
2
-Bed
roo
m
3-B
edro
om
B
roke
r co
ntr
ibu
tors
Mea
n
SD
M
ean
S
D
Mea
n
SD
M
ean
S
D
Str
and
R2.
817
R27
5
R3.
417
R14
4
R4.
550
R42
7
R6.
050
R82
6
GE,
LA,
TR
Gor
don'
s Bay
R2.
817
R27
5
R3.
400
R17
3
R4.
383
R20
2
R5.
717
R25
7
GE,
LA,
TR
Po
rt E
lizab
eth
ave
rag
e R
2.6
10
R3
.06
6
R
3.5
63
R4
.32
0
Sum
mer
stra
nd/H
umew
ood/
Sou
th
End
R3.
250
R35
4
R4.
000
R28
3
R4.
700
R28
3
R7.
600
R1.
493
CD
, JP
, ZB
Wal
mer
R2.
975
R17
7
R3.
800
R0
R4.
650
R21
2
R6.
250
R1.
061
CD
, JP
Cen
tral
/Nor
th E
nd
R2.
500
-
R2.
750
-
R3.
250
-
R3.
500
-
CD
N
ewto
n Pa
rk
R2.
675
R31
8
R3.
075
R31
8
R3.
450
R35
4
R3.
800
-
CD
, JP
W
este
ring
R2.
650
R21
2
R3.
025
R24
7
R3.
500
R0
R3.
850
-
CD
, JP
Kab
ega
R2.
600
R14
1
R2.
975
R17
7
R3.
400
R14
1
R3.
850
-
CD
, JP
Alg
oa P
ark
R1.
850
-
R2.
200
-
R2.
500
-
R3.
000
-
CD
Ea
st L
on
do
n a
vera
ge
R2
.65
8
R
2.9
06
R3
.35
6
R
3.8
13
Sou
ther
nwoo
d/Q
uign
ey B
each
/CBD
R2.
800
-
R3.
250
-
R3.
600
-
R4.
050
-
TR
Ber
ea
R3.
100
-
R3.
250
-
R3.
500
-
R4.
200
-
TR
Am
alin
da
R2.
500
-
R2.
700
-
R3.
050
-
R3.
500
-
TR
Gon
ubie
Par
k R2.
300
-
R2.
500
-
R3.
300
-
R3.
550
-
TR
Blo
emfo
nte
in a
vera
ge
R1
.73
6
R
2.0
57
R2
.79
4
R
3.4
86
Blo
emfo
ntei
n
R1.
500
-
R2.
000
-
R2.
800
-
R3.
500
-
ED
Wes
tden
e R1.
800
-
R2.
300
-
R3.
100
-
R4.
000
-
ED
Will
ows
R1.
800
-
R2.
000
-
R2.
800
-
R3.
500
-
ED
Nav
alsi
g R1.
800
-
R2.
000
-
R2.
500
-
R3.
000
-
ED
Arb
oret
um
R1.
800
-
R2.
000
-
R2.
800
-
R3.
500
-
ED
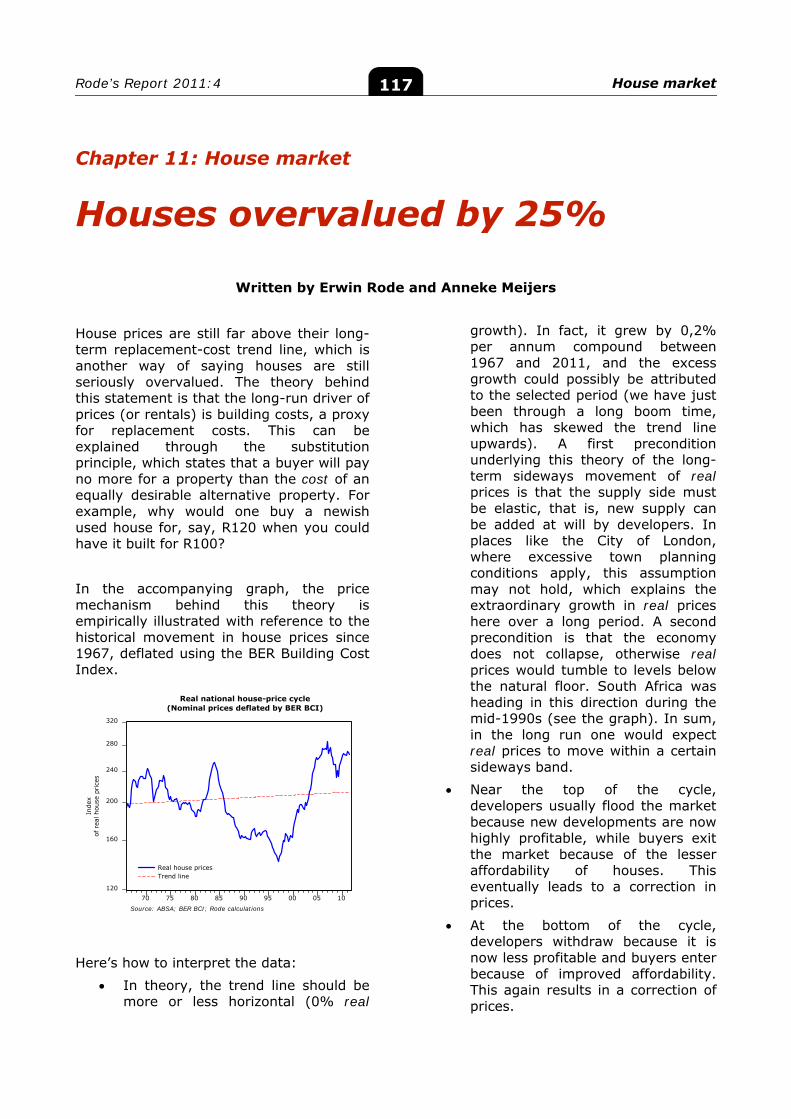
Rode’s Report 2011:4 House market 117
120
160
200
240
280
320
70 75 80 85 90 95 00 05 10
Real house pricesTrend line
Real national house-price cycle(Nominal prices deflated by BER BCI)
Inde
xof
rea
l hou
se p
rice
s
Source: ABSA; BER BCI; Rode calculations
Chapter 11: House market
Houses overvalued by 25%
Written by Erwin Rode and Anneke Meijers
House prices are still far above their long-term replacement-cost trend line, which is another way of saying houses are still seriously overvalued. The theory behind this statement is that the long-run driver of prices (or rentals) is building costs, a proxy for replacement costs. This can be explained through the substitution principle, which states that a buyer will pay no more for a property than the cost of an equally desirable alternative property. For example, why would one buy a newish used house for, say, R120 when you could have it built for R100?
In the accompanying graph, the price mechanism behind this theory is empirically illustrated with reference to the historical movement in house prices since 1967, deflated using the BER Building Cost Index.
Here’s how to interpret the data:
In theory, the trend line should be more or less horizontal (0% real
growth). In fact, it grew by 0,2% per annum compound between 1967 and 2011, and the excess growth could possibly be attributed to the selected period (we have just been through a long boom time, which has skewed the trend line upwards). A first precondition underlying this theory of the long-term sideways movement of real prices is that the supply side must be elastic, that is, new supply can be added at will by developers. In places like the City of London, where excessive town planning conditions apply, this assumption may not hold, which explains the extraordinary growth in real prices here over a long period. A second precondition is that the economy does not collapse, otherwise real prices would tumble to levels below the natural floor. South Africa was heading in this direction during the mid-1990s (see the graph). In sum, in the long run one would expect real prices to move within a certain sideways band.
Near the top of the cycle, developers usually flood the market because new developments are now highly profitable, while buyers exit the market because of the lesser affordability of houses. This eventually leads to a correction in prices.
At the bottom of the cycle, developers withdraw because it is now less profitable and buyers enter because of improved affordability. This again results in a correction of prices.
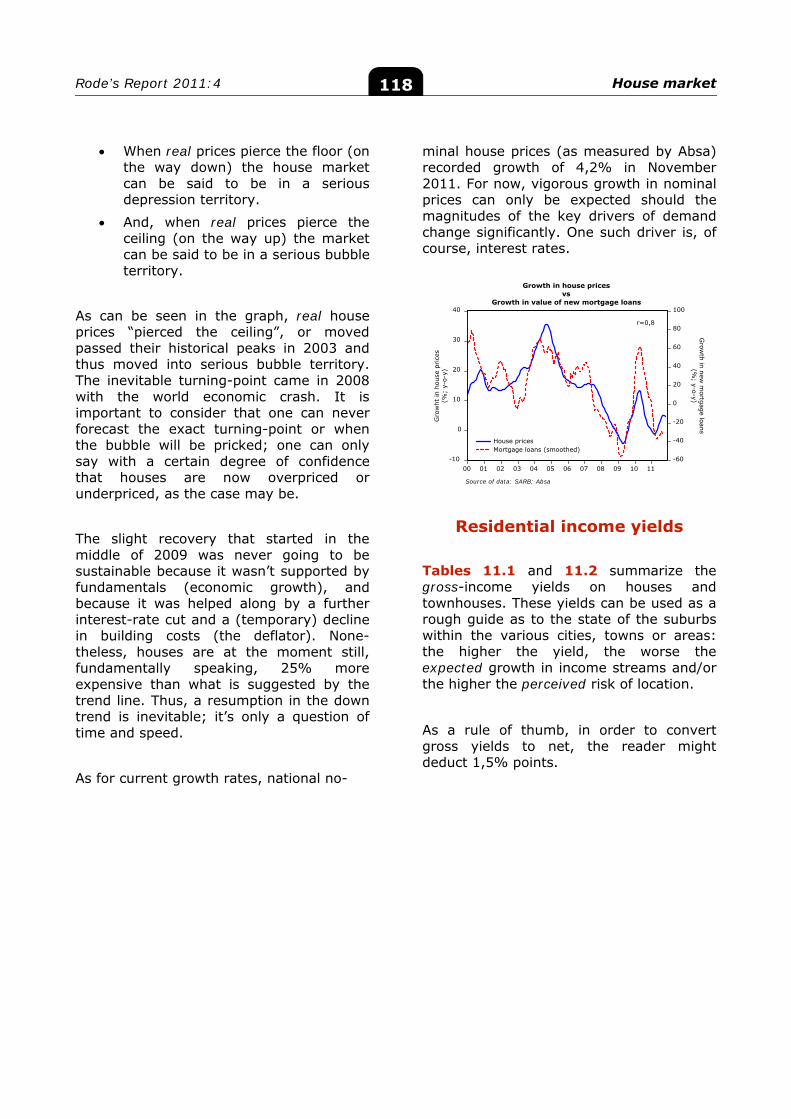
Rode’s Report 2011:4 House market 118
-10
0
10
20
30
40
-60
-40
-20
0
20
40
60
80
100
00 01 02 03 04 05 06 07 08 09 10 11
House pricesMortgage loans (smoothed)
Growth in house pricesvs
Growth in value of new mortgage loans
Gro
wht
in h
ouse
price
s(%
; y-
o-y)
Grow
th in new m
ortgage loans(%
; y-o-y)
Source of data: SARB; Absa
r=0,8
When real prices pierce the floor (on the way down) the house market can be said to be in a serious depression territory.
And, when real prices pierce the ceiling (on the way up) the market can be said to be in a serious bubble territory.
As can be seen in the graph, real house prices “pierced the ceiling”, or moved passed their historical peaks in 2003 and thus moved into serious bubble territory. The inevitable turning-point came in 2008 with the world economic crash. It is important to consider that one can never forecast the exact turning-point or when the bubble will be pricked; one can only say with a certain degree of confidence that houses are now overpriced or underpriced, as the case may be.
The slight recovery that started in the middle of 2009 was never going to be sustainable because it wasn’t supported by fundamentals (economic growth), and because it was helped along by a further interest-rate cut and a (temporary) decline in building costs (the deflator). None-theless, houses are at the moment still, fundamentally speaking, 25% more expensive than what is suggested by the trend line. Thus, a resumption in the down trend is inevitable; it’s only a question of time and speed.
As for current growth rates, national no-
minal house prices (as measured by Absa) recorded growth of 4,2% in November 2011. For now, vigorous growth in nominal prices can only be expected should the magnitudes of the key drivers of demand change significantly. One such driver is, of course, interest rates.
Residential income yields
Tables 11.1 and 11.2 summarize the gross-income yields on houses and townhouses. These yields can be used as a rough guide as to the state of the suburbs within the various cities, towns or areas: the higher the yield, the worse the expected growth in income streams and/or the higher the perceived risk of location.
As a rule of thumb, in order to convert gross yields to net, the reader might deduct 1,5% points.
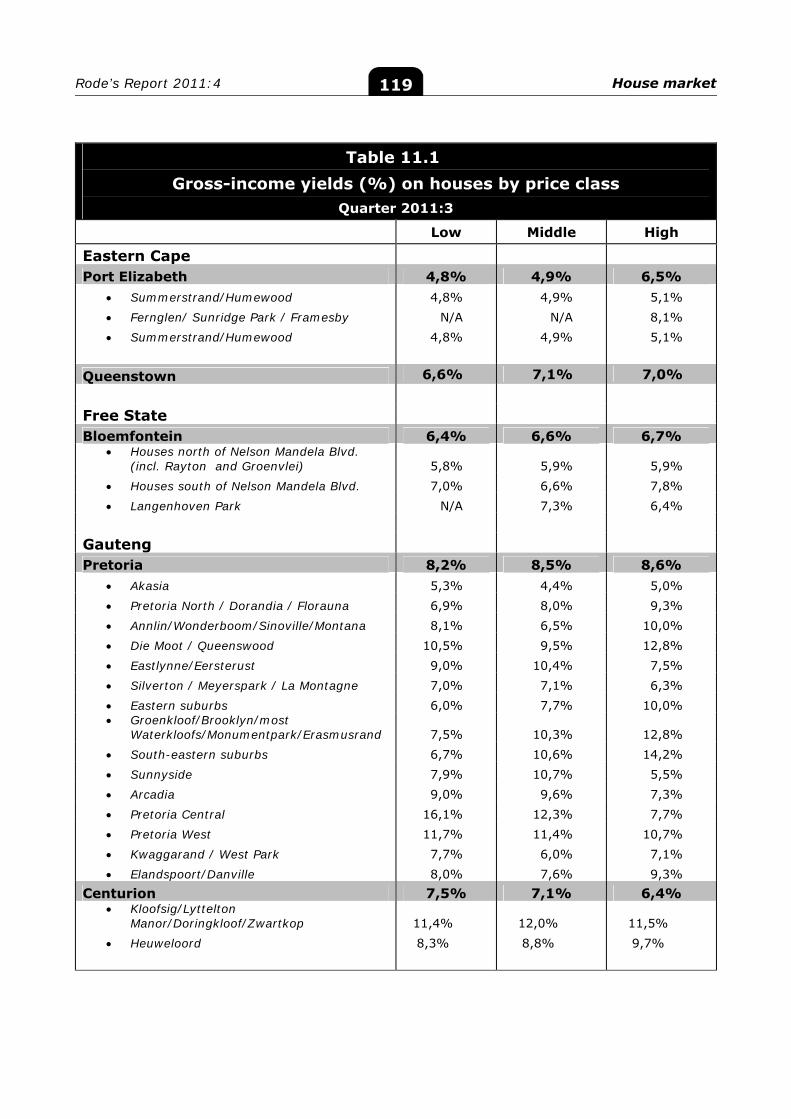
Rode’s Report 2011:4 House market 119
Table 11.1 Gross-income yields (%) on houses by price class
Quarter 2011:3
Low Middle High
Eastern Cape Port Elizabeth 4,8% 4,9% 6,5%
Summerstrand/Humewood 4,8% 4,9% 5,1% Fernglen/ Sunridge Park / Framesby N/A N/A 8,1% Summerstrand/Humewood 4,8% 4,9% 5,1%
Queenstown 6,6% 7,1% 7,0% Free State Bloemfontein 6,4% 6,6% 6,7%
Houses north of Nelson Mandela Blvd. (incl. Rayton and Groenvlei) 5,8% 5,9% 5,9%
Houses south of Nelson Mandela Blvd. 7,0% 6,6% 7,8% Langenhoven Park N/A 7,3% 6,4%
Gauteng Pretoria 8,2% 8,5% 8,6%
Akasia 5,3% 4,4% 5,0% Pretoria North / Dorandia / Florauna 6,9% 8,0% 9,3% Annlin/Wonderboom/Sinoville/Montana 8,1% 6,5% 10,0% Die Moot / Queenswood 10,5% 9,5% 12,8% Eastlynne/Eersterust 9,0% 10,4% 7,5% Silverton / Meyerspark / La Montagne 7,0% 7,1% 6,3% Eastern suburbs 6,0% 7,7% 10,0% Groenkloof/Brooklyn/most
Waterkloofs/Monumentpark/Erasmusrand 7,5% 10,3% 12,8% South-eastern suburbs 6,7% 10,6% 14,2% Sunnyside 7,9% 10,7% 5,5% Arcadia 9,0% 9,6% 7,3% Pretoria Central 16,1% 12,3% 7,7% Pretoria West 11,7% 11,4% 10,7% Kwaggarand / West Park 7,7% 6,0% 7,1% Elandspoort/Danville 8,0% 7,6% 9,3%
Centurion 7,5% 7,1% 6,4% Kloofsig/Lyttelton
Manor/Doringkloof/Zwartkop 11,4% 12,0% 11,5% Heuweloord 8,3% 8,8% 9,7%
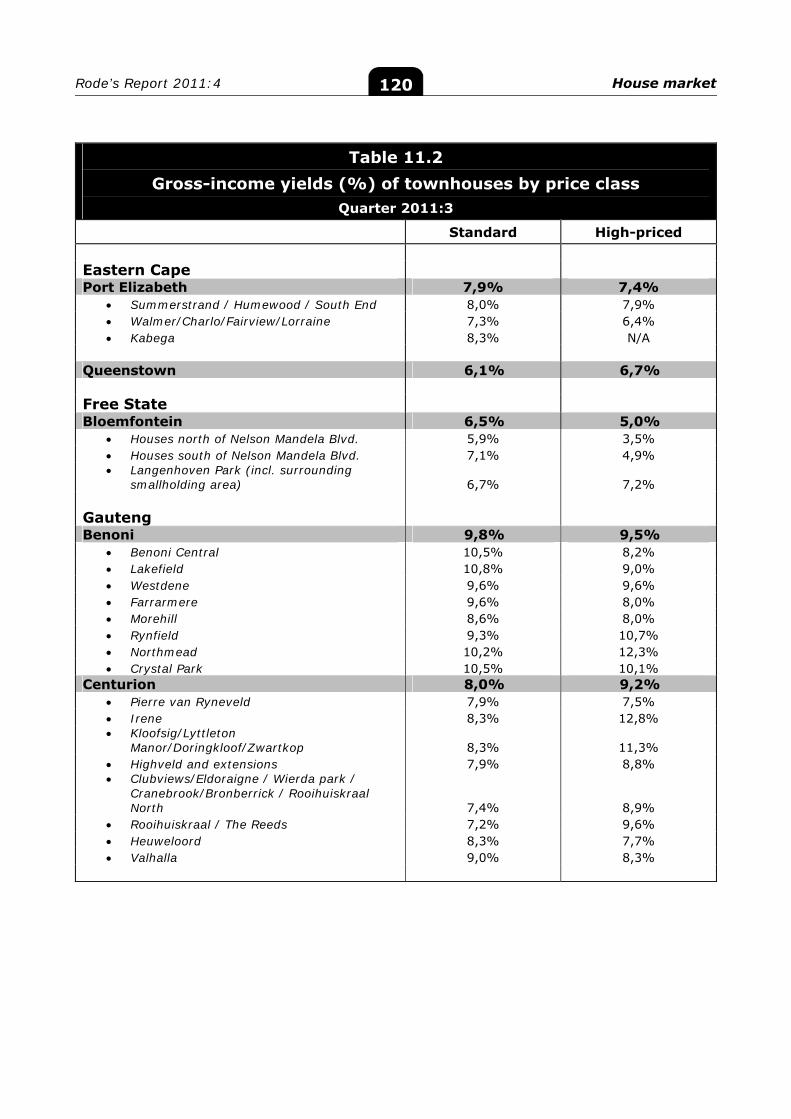
Rode’s Report 2011:4 House market 120
Table 11.2 Gross-income yields (%) of townhouses by price class
Quarter 2011:3
Standard High-priced Eastern Cape Port Elizabeth 7,9% 7,4%
Summerstrand / Humewood / South End 8,0% 7,9% Walmer/Charlo/Fairview/Lorraine 7,3% 6,4% Kabega 8,3% N/A
Queenstown 6,1% 6,7% Free State Bloemfontein 6,5% 5,0%
Houses north of Nelson Mandela Blvd. 5,9% 3,5% Houses south of Nelson Mandela Blvd. 7,1% 4,9% Langenhoven Park (incl. surrounding
smallholding area) 6,7% 7,2% Gauteng Benoni 9,8% 9,5%
Benoni Central 10,5% 8,2% Lakefield 10,8% 9,0% Westdene 9,6% 9,6% Farrarmere 9,6% 8,0% Morehill 8,6% 8,0% Rynfield 9,3% 10,7% Northmead 10,2% 12,3% Crystal Park 10,5% 10,1%
Centurion 8,0% 9,2% Pierre van Ryneveld 7,9% 7,5% Irene 8,3% 12,8% Kloofsig/Lyttleton
Manor/Doringkloof/Zwartkop 8,3% 11,3% Highveld and extensions 7,9% 8,8% Clubviews/Eldoraigne / Wierda park /
Cranebrook/Bronberrick / Rooihuiskraal North 7,4% 8,9%
Rooihuiskraal / The Reeds 7,2% 9,6% Heuweloord 8,3% 7,7% Valhalla 9,0% 8,3%
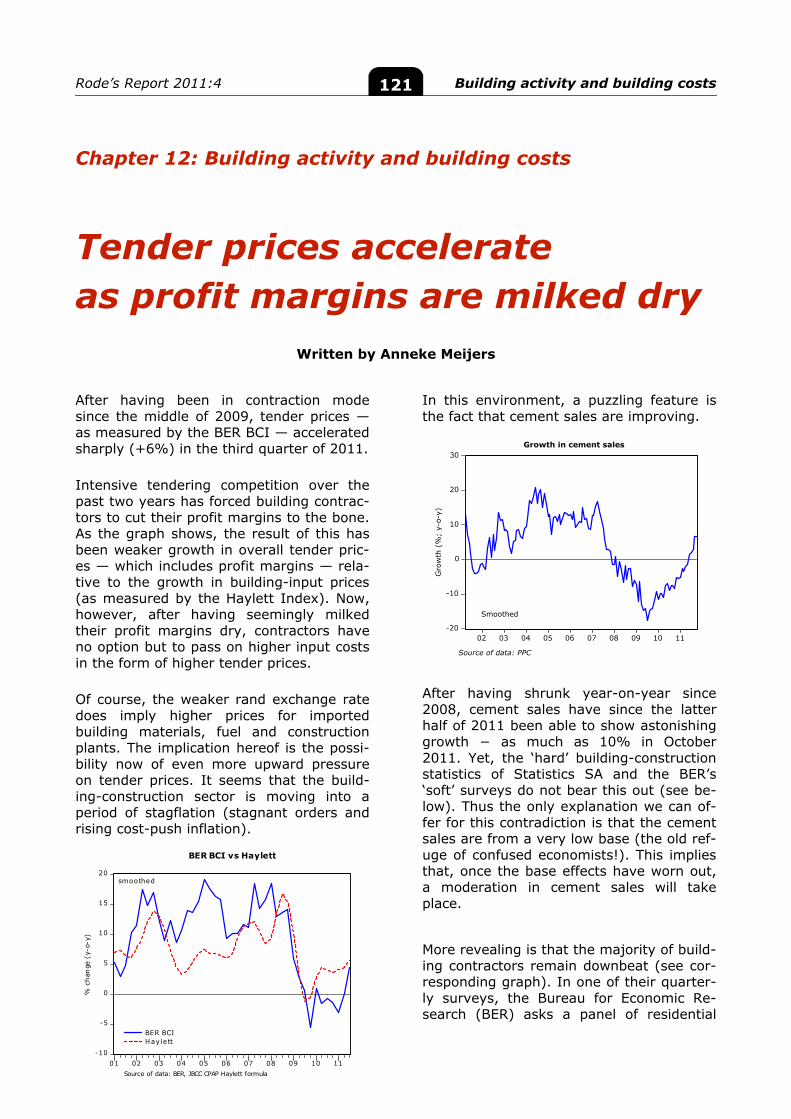
Rode’s Report 2011:4 Building activity and building costs
121
-10
-5
0
5
10
15
20
01 02 03 04 05 06 07 08 09 10 11
BER BCIHay lett
BER BCI vs Haylett
% c
han
ge (
y-o-
y)
smoothed
Source of data: BER, JBCC CPAP Haylett formula
-20
-10
0
10
20
30
02 03 04 05 06 07 08 09 10 11
Growth in cement salesG
row
th (
%;
y-o-
y)
Source of data: PPC
Smoothed
Chapter 12: Building activity and building costs
Tender prices accelerate as profit margins are milked dry
Written by Anneke Meijers
After having been in contraction mode since the middle of 2009, tender prices — as measured by the BER BCI — accelerated sharply (+6%) in the third quarter of 2011.
Intensive tendering competition over the past two years has forced building contrac-tors to cut their profit margins to the bone. As the graph shows, the result of this has been weaker growth in overall tender pric-es — which includes profit margins — rela-tive to the growth in building-input prices (as measured by the Haylett Index). Now, however, after having seemingly milked their profit margins dry, contractors have no option but to pass on higher input costs in the form of higher tender prices.
Of course, the weaker rand exchange rate does imply higher prices for imported building materials, fuel and construction plants. The implication hereof is the possi-bility now of even more upward pressure on tender prices. It seems that the build-ing-construction sector is moving into a period of stagflation (stagnant orders and rising cost-push inflation).
In this environment, a puzzling feature is the fact that cement sales are improving.
After having shrunk year-on-year since 2008, cement sales have since the latter half of 2011 been able to show astonishing growth − as much as 10% in October 2011. Yet, the ‘hard’ building-construction statistics of Statistics SA and the BER’s ‘soft’ surveys do not bear this out (see be-low). Thus the only explanation we can of-fer for this contradiction is that the cement sales are from a very low base (the old ref-uge of confused economists!). This implies that, once the base effects have worn out, a moderation in cement sales will take place.
More revealing is that the majority of build-ing contractors remain downbeat (see cor-responding graph). In one of their quarter-ly surveys, the Bureau for Economic Re-search (BER) asks a panel of residential
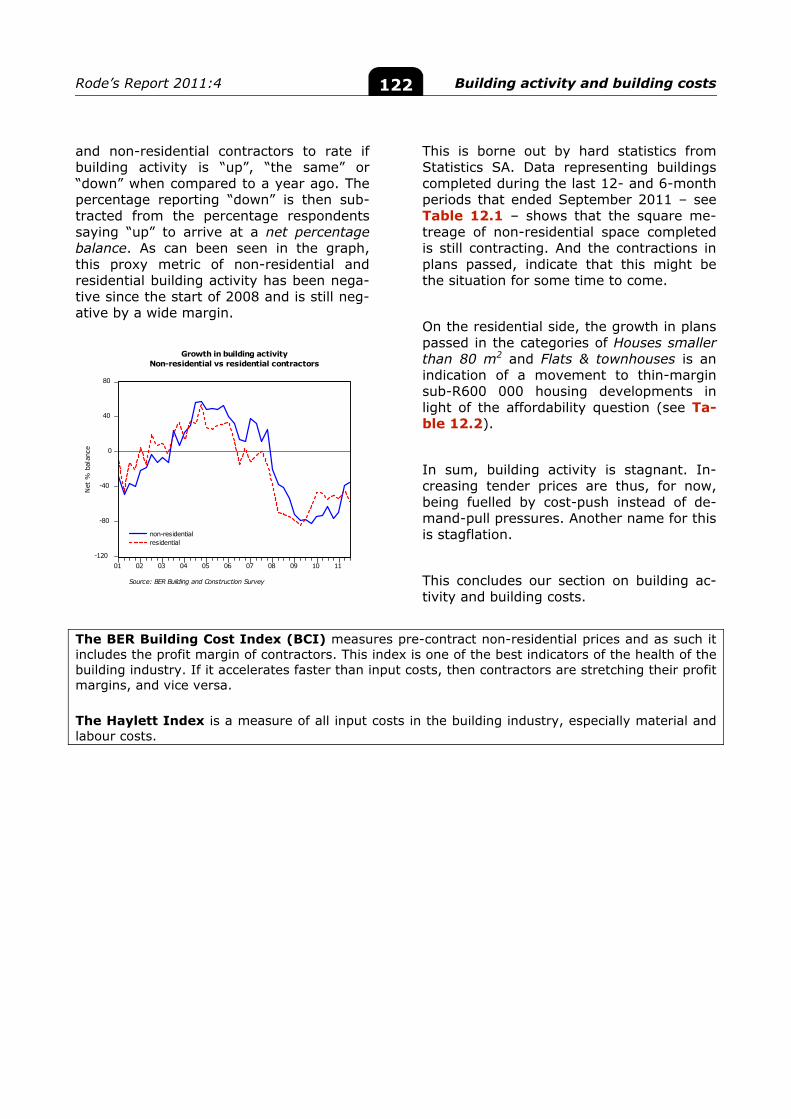
Rode’s Report 2011:4 Building activity and building costs
122
-120
-80
-40
0
40
80
01 02 03 04 05 06 07 08 09 10 11
non-residentialresidential
Growth in building activityNon-residential vs residential contractors
Net
% b
alan
ce
Source: BER Building and Construction Survey
and non-residential contractors to rate if building activity is “up”, “the same” or “down” when compared to a year ago. The percentage reporting “down” is then sub-tracted from the percentage respondents saying “up” to arrive at a net percentage balance. As can been seen in the graph, this proxy metric of non-residential and residential building activity has been nega-tive since the start of 2008 and is still neg-ative by a wide margin.
This is borne out by hard statistics from Statistics SA. Data representing buildings completed during the last 12- and 6-month periods that ended September 2011 – see Table 12.1 – shows that the square me-treage of non-residential space completed is still contracting. And the contractions in plans passed, indicate that this might be the situation for some time to come.
On the residential side, the growth in plans passed in the categories of Houses smaller than 80 m2 and Flats & townhouses is an indication of a movement to thin-margin sub-R600 000 housing developments in light of the affordability question (see Ta-ble 12.2).
In sum, building activity is stagnant. In-creasing tender prices are thus, for now, being fuelled by cost-push instead of de-mand-pull pressures. Another name for this is stagflation.
This concludes our section on building ac-tivity and building costs.
The BER Building Cost Index (BCI) measures pre-contract non-residential prices and as such it includes the profit margin of contractors. This index is one of the best indicators of the health of the building industry. If it accelerates faster than input costs, then contractors are stretching their profit margins, and vice versa. The Haylett Index is a measure of all input costs in the building industry, especially material and labour costs.
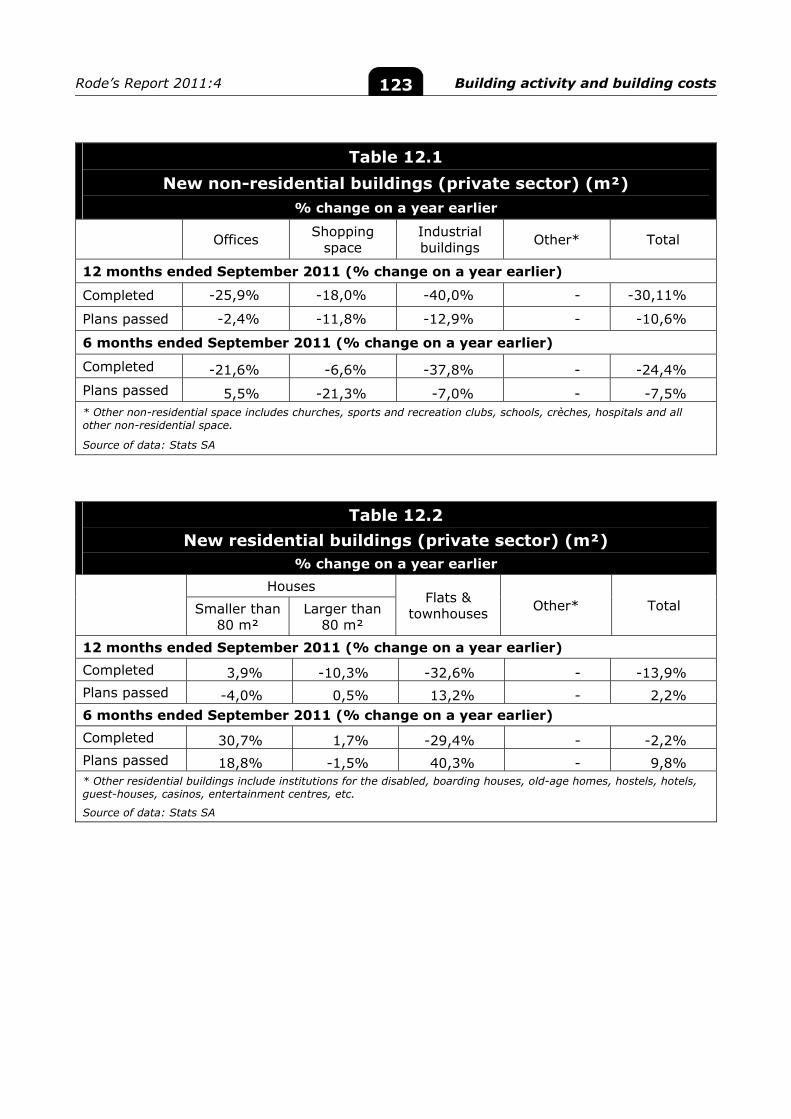
Rode’s Report 2011:4 Building activity and building costs
123
Table 12.1 New non-residential buildings (private sector) (m²)
% change on a year earlier
Offices Shopping space
Industrial buildings Other* Total
12 months ended September 2011 (% change on a year earlier)
Completed -25,9% -18,0% -40,0% - -30,11%
Plans passed -2,4% -11,8% -12,9% - -10,6%
6 months ended September 2011 (% change on a year earlier)
Completed -21,6% -6,6% -37,8% - -24,4% Plans passed 5,5% -21,3% -7,0% - -7,5% * Other non-residential space includes churches, sports and recreation clubs, schools, crèches, hospitals and all other non-residential space.
Source of data: Stats SA
Table 12.2 New residential buildings (private sector) (m²)
% change on a year earlier
Houses
Flats & townhouses Other* Total Smaller than
80 m² Larger than
80 m²
12 months ended September 2011 (% change on a year earlier) Completed 3,9% -10,3% -32,6% - -13,9% Plans passed -4,0% 0,5% 13,2% - 2,2% 6 months ended September 2011 (% change on a year earlier) Completed 30,7% 1,7% -29,4% - -2,2% Plans passed 18,8% -1,5% 40,3% - 9,8% * Other residential buildings include institutions for the disabled, boarding houses, old-age homes, hostels, hotels, guest-houses, casinos, entertainment centres, etc.
Source of data: Stats SA

Annexures
Rode’s Report 2011:4 Annexure 1
I
Glossary of property and related terms and abbreviations
Arithmetic mean: The most often used measure of central tendency, it is the simple average of a number of observations. Mathematically, it is equal to the sum of all values divided by the number of observations. For example, the arithmetic mean of 6 and 7 is (6+7)/2. The arithmetic mean of 6, 7 and 8 is (6+7+8)/3; and so forth. Outlier observations may unduly affect the mean. In the Rode publications all references to the mean refer to the arithmetic mean, unless otherwise specified. See also geometric mean and median.
Besa: Bond Exchange of South Africa.
BER BCI: Bureau for Economic Research Building Cost Index. Measures pre-contract non-residential building-construction prices and as such it includes the profit margin of contractors. This index is one of the best indicators of the health of the building-construction industry. If it accelerates faster than input costs (Haylett Index), then contractors are stretching their profit margins as a result of sufficient work, and vice versa.
Building construction: the construction of buildings like houses, office blocks, factories, shopping centres, schools, hospitals. See also civil construction.
Bulk: The market value of office and shopping-centre land is generally expressed as the value per bulk square metre. Bulk square metres refer to the
gross building area (GBA) of a building. According to The Sapoa Method for Measuring Floor Areas in Commercial and Industrial Buildings, GBA covers: “The entire building area, but it excludes patios, plant boxes, sunscreening, escape stairs, machine rooms, parking (basements or above ground), lift motor rooms, service rooms, caretakers’ flats, etc. GBA is mainly used by planning consultants in order to plan and execute a building in accordance with the permissible Floor Area Ratio (F.A.R) as derived from the zoning of the property.GBA is fixed for the life of the building but it should be noted that different local authorities may interpret the National Building Regulations which regulated the F.A.R definition in a slightly different manner.”
Standard capitalization rate: It is the expected net operating income for year 1, assuming the entire building is let at open-market rentals, divided by the purchase/transaction price, normally expressed as a percentage. This calculation ignores VAT, transfer duty and income tax, and assumes a cash transaction (in contrast to a paper-based sale).
CBD: Central business district or downtown. This is an area of concentrated high economic activity. The user can differentiate between the metropolitan CBD (e.g. the Johannesburg CBD) and a decentralized CBD (like the Sandton CBD).
Civils: colloquial for civil construction.
Rode’s Report 2011:4 Annexure 1
II
Civil construction: the construction of physical infrastructure like roads, bridges, dams, the laying of stormwater pipes, electricity and water reticulation. See also building construction.
Cyclical trend: A short-term growth path of an economic variable. Normally refers to the business cycle, as distinct from a secular trend.
Dec: Decentralized. A Rode abbreviation. Town and regional planners differentiate between local decentralization (from the metropolitan CBD to the suburbs) and regional decentralization (to outlying areas of the country).
Deflation: Deflation occurs when prices are declining over time. This is the opposite of inflation and could be catastrophic. When the inflation rate (by some measure) is negative for a period, the economy is in a deflationary period. See also disinflation.
Deseasonalized: Seasonal fluctuations have been removed. In the case of retail sales, this is essential in order to be able to compare sales pertaining to different months of the year, as opposed to comparing sales of one quarter or month with the same quarter or month a year earlier.
Discount rate: The rate used to express an expected future cash stream in present-value terms. In most instances, the discount rate is equal to the hurdle rate. Mathematically, the hurdle rate of a property is the sum of its market capitalization rate and the expected constant growth rate of its cash flow in perpetuity.
Disinflation: Disinflation occurs when the inflation rate is declining over time. See also deflation.
Escalation rate: The rate by which a rental is hiked once a year in terms of a
lease. The ruling market escalation rate can be seen as an attempt by the market to forecast the growth in market rentals over the duration of the lease, but this attempt is obviously rarely successful. Thus it is important to differentiate between an escalated rental and a market rental.
Forward (income) yield: A bourse term, hence it is typically applied to listed properties. In the non-listed property market, its approximate equivalent is the capitalization rate. It represents the expected net income of year 1 (the following 12 months) divided by the current price/value. It stands to reason that existing leases would largely determine the net income of year 1. See also historic (income) yield.
Fundamental value (FmV): It is a subjective value based on the investor’s own, subjective forecast of rentals and maybe the investor’s unique or different in-house discount rate/capitalization rate. A FmV higher than the objective market value (MV) is a buy signal to an investor.
The calculation of the FmV is especially indicated where the economy, or property market, changes gear, e.g. a secular change in inflation rate or the real-rental cycle bottoming out. These are instances where any market is notoriously poor at forecasting trends.
An alternative term is intrinsic value.
Geometric mean: A measure of central tendency calculated by multiplying the series of numbers and taking the nth root of the product, where n is the number of items in the series. The geometric mean is defined only for sets of positive numbers. For example, the geometric mean of 6 and 7 is the square root of (6*7). The geometric mean of 6, 7 and 8 is the cube root of (6*7*8); and so forth. See also arithmetic mean and median.
Geometric mean return: It is also called the time-weighted rate of return or the average compounded rate of return. It is
Rode’s Report 2011:4 Annexure 1
III
calculated by taking the geometric mean of a portfolio’s subperiod returns. Where there is a great variance in subperiod returns, this is a better return measure than the arithmetic mean return. Unlike the internal rate of return, it is not influenced by the timing and weights of money-flows.
Haylett index: A measure of the movement of all input costs in the building industry, especially material and labour costs. Designed to recompense the building contractor for in-contract rises in input costs. Official designation: JBCC CPAP Haylett Formula (Work Group 180). Does not include profit margins for contractors.
Historic or trailing (income) yield: A bourse term, hence it is typically applied to listed properties. It represents the net income of year 0 divided by the current price/value. See also forward (income) yield. In a market of rising net incomes the historic yield would be expected to be lower than the forward yield.
Hurdle rate: The minimum total return (income yield plus expected capital appreciation) required by potential investors to induce them to invest in a property. Also known as the required rate. As such this is normally the correct rate to use when doing discounted cash flow (DCF) analyses. This is a similar concept to a company’s cost of capital, and it is not to be confused with the cost of money (say, overdraft interest rate). One way of measuring the total return on an investment, ex post or ex ante, is the internal rate of return (IRR) method. See also discount rate.
Index: Describes the method of standardizing the base for comparative data in a time series, usually equating the initial measure to 100 and then expressing all other data in exact relation to that base, e.g. the index for office rentals in any year by comparison with a base-year value of 100 might stand at 90 or 110, indicating a fall or rise of 10% respectively.
Industrial-building grades:
Prime: A property in which space is easily lettable because it satisfies each of the following prerequisites:
a. Generally in a good condition;
b. Satisfactory macro access (i.e. access to freeway);
c. Satisfactory micro access (i.e. from street to building);
d. Proper loading facilities;
e. Eaves >4 m (excluding micro/ mini units);
f. Clear spans;
g. On ground level;
h. Adequate three-phase electrical power.
The eight conditions above are prerequisites for space to be considered prime. However, a building may possess additional enhancements that could improve lettability through increasing the size of the potential tenant pool.
Such enhancements could include sufficient office accommodation, adequate parking, sprinkler systems, masonry up to sill height, adequate floor loadings, roof insulation, sufficient yard space and a good location (as opposed to access).
Secondary: This is industrial space which is not classifiable as prime because it does not satisfy all eight prerequisites for prime space listed above. Such space is typically old buildings or structures, which have been haphazardly renovated. It would have poor access, too little yard space or office accommodation, inadequate goods lifts, no three-phase power and obsolete electrics and ablution facilities. Such space is often (but not exclusively) found in highly urbanised areas.
Rode’s Report 2011:4 Annexure 1
IV
Comparative grading of industrial and office space
Industrial Offices
Prime + A
Prime B
Prime - C
Secondary D
Industrial park: An industrial park is a multi-tenanted complex of industrial buildings, typically surrounded by a security fence with access control and possibly some greenery.
Initial yield: The first year’s expected net operating income (based on existing leases and other income reasonably expected) divided by the purchase price. Therefore the initial yield and the capitalization rate are only the same in those rare cases where a building is let at open-market rentals.
Internal rate of return (IRR): A performance measurement that takes cognisance of the time-value of money. Technically, it is that rate which equates the inflows with the outflows of a cash flow. Also known as the money-weighted rate of return because the timing and weights of the money-flows influence the return. See also geometric mean return.
JSE: JSE Securities Exchange South Africa.
Leaseback: A fully repairing and insuring lease (tenant pays all operating costs) for 10 years or longer (with typically 5-yearly rent reviews or fixed annual escalations) with a tenant with a strong covenant.
Lessee: A person or other entity to whom space is rented under a lease. A tenant. See also lessor.
Lessor: One who rents space to another under a lease. A landlord. See also lessee.
Market rental: The most probable rental
that a voluntary, informed and prudent lessee will pay a voluntary, informed and prudent lessor in a normal open-market (arms-length) transaction, when neither party is under any compulsion to rent or let, other than their normal desire to transact.
Market value: The most probable price that a voluntary, informed and prudent purchaser will pay a voluntary, informed and prudent seller in a normal open-market (arms-length) transaction at the date of valuation – after allowing for proper marketing prior to the valuation date — when neither party is under any compulsion to sell or to purchase, other than their normal desire to transact. See also price and fundamental value.
Mean: See arithmetic mean; median; geometric mean.
Median: Midpoint of a series of observations when arranged in order of magnitude. Thus it is a measure of central tendency that divides the data set into halves. Less affected by outlier observations than the arithmetic mean. For example, the median of 5, 6, 7, 8, 9 is 7. And for 5, 9, 15, 16, 17, 21, 23 the median is 16. See also geometric and arithmetic mean.
Metro: Metropolitan.
MFA: Medium-Term Forecasting Associates, construction economists located in Stellenbosch.
n: Number of respondents.
N/A: Not available — fewer than two respondents.
NNN lease: Also known as a triple-net lease. A fully repairing and insuring
lease (tenant pays all operating costs). The commonest example is a Leaseback.
Rode’s Report 2011:4 Annexure 1
V
Office building grades defined by quality of finishes and facilities:
Grade A: Generally not older than 10 years, unless renovated; prime location; high-quality finishes; adequate on-site parking; air-conditioning. Commands a gross market rental as indicated in the accompanying table.
Grade B: Generally 10 to 20 years old, unless renovated; accommodation to modern standards; prime location; air-conditioning; on-site parking. Commands a gross market rental as indicated in the accompanying table.
Grade C: Generally 20 to 30 years old, unless renovated; in fairly good condition, although finishes are not up to modern standards; good location; may have on-site parking; unlikely to be centrally air-conditioned; commands a gross market rental as indicated in the accompanying table.
Grade D: A building reaching the end of its functional life; old and in poor condition; near the bottom of the rental rate range; typically no air-conditioning and no on-site parking; may have good location.
These grades might be further sub-divided into sub-grades A+, A-, B+, B-, C+ or C-.
Office demand: Office stock less office space vacant (space on the market for renting irrespective of whether there is still a valid lease over the space). In other words, demand is office space occupied.
Office stock: Total rentable office space.
Office take-up: Change in office demand. Where take-up is positive, it can also be called the growth in demand.
Office vacancies: This is the floor area available for leasing at any given time, irrespective of whether there is still a valid lease over the space. Often expressed as a percentage of the stock in rentable m².
Operating costs: See outgoings.
Opportunity cash flow (OCF): A valuation term introduced by Rode. The OCF quantifies the amount gained or foregone by the landlord in that the property is either over rented or under rented. More precisely, for each lease and the space that such a tenant occupies, it is, until expiry of such a lease, the present value (PV) of the contractual rental less the open-market rental (as at the valuation date) escalating at the open-market escalation rate (as at the valuation date). Outgoings (operating costs): In the case of office buildings, the following items are included under total gross outgoings, irrespective of who pays for these:
Cleaning. Repairs & maintenance. Common-area electricity & water (not
tenant’s own). Security. Management (excluding head office
overheads). All leasing expenses: broker’s
commission and in-house payroll, advertising, tenant installations & relocations (unless recovered), buy-outs, etc.
Municipal tax. Insurance (fire & SASRIA). In the case of
self-insurance, the landlord’s provision should be included.
Refuse & sewerage less recoverable amount.
External & common area repairs & maintenance.
Audit fees. The following items are excluded:
VAT. Head office overheads. Tenant’s own electricity and water. Tenant installations/relocations
recovered. Internal maintenance. Recoverable refuse & sewerage.
Rode’s Report 2011:4 Annexure 1
VI
Price: The amount actually paid for an asset. Not the same as market value, because special circumstances may have applied when the transaction was concluded. PLS: Property loan stock, also known as variable loan stock (VLS) (type of listed property fund). PUT: Property unit trust (type of listed property fund). Reit: A reit is an entity that invests primarily in real estate and qualifies for special tax status, so there is single taxation at the investor level. Source: Lehman, Robert W. & Howard, Roth S. Global Real Estate Investment Trust Report 2010: Against all odds. Ernst & Young. Rental: Basic rental (base rental in the
USA): A set amount used as a minimum rent in a lease which also employs a percentage of turnover or other allocation for additional rent.
Gross rental: The total rental payable
by the tenant, excluding VAT, the tenant’s own electricity and water charges, but including other operating costs recovered by the landlord (if any), as well as promotion expenses payable by the tenant in the case of shopping centres. See also rental, net.
Net rental: The amount payable by
the tenant, excluding VAT and excluding operating costs recovered by the landlord (if any). See also rental, gross.
Nominal rental: This has a dual
meaning: o Firstly, it refers to rentals where the
analyst or valuer assumes no incentives like a rent-free period, free relocation, cash upfront, or balance-of-installation allowance. It also excludes amortisation of tenant-installation costs.
o Secondly, it can also mean actual rental values (i.e. not deflated). See
also rental, real. Pioneer rental: The highest rental
actually achieved – and could be a once-off outlier deal; hence “pioneer” is not “market”. The difference between pioneer and the highest market rentals may be used as a blunt tool to gauge the prospects for market rental growth in the short term. If the differential is positive, it is an indication of growth prospects in the node. If the differential is negative, it is an indication that landlords are finding it difficult to find new tenants at the going market rental rate.
Real rental: Deflated rental, typically observations (values) over time (a time series) from which the relevant inflation has been removed. See also rental, nominal.
Rent-free period: No rent is payable by the tenant for an initial portion of the term of a lease. It is offered by a landlord as a rental concession to attract tenants.
Required rate: see hurdle rate.
Retail price: In the context of property syndication, this means the price at which a property-holding company’s shares are sold to the public or the price at which these shares trade. See also wholesale value. RR: Rode's Report on the South African Property Market, a quarterly journal for the professional property practitioner.
Sapoa: South African Property Owners Association.
SARB: South African Reserve Bank (viz. the central bank)
Secular trend: A long-term growth path of an economic variable, around which there might be short-term (business cycle) or other fluctuations. See also cyclical trend.
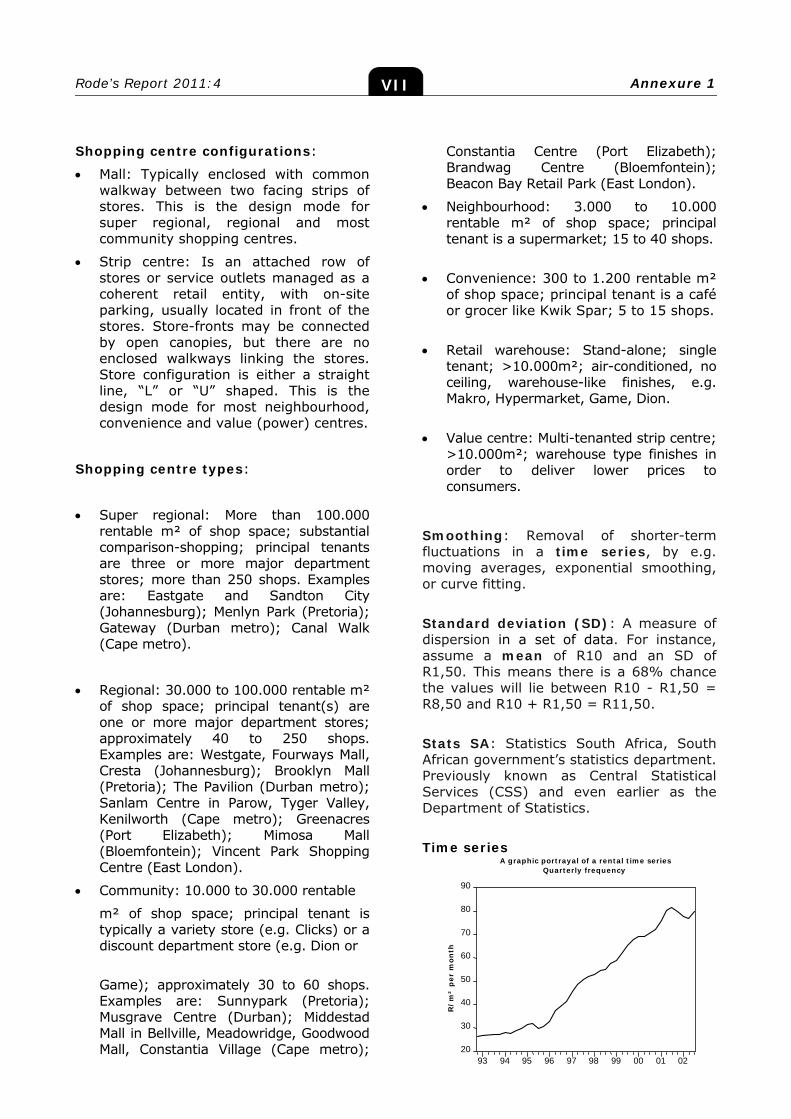
Rode’s Report 2011:4 Annexure 1
VII
20
30
40
50
60
70
80
90
93 94 95 96 97 98 99 00 01 02
A graphic portrayal of a rental time seriesQuarterly frequency
R/m
² p
er m
onth
Shopping centre configurations:
Mall: Typically enclosed with common walkway between two facing strips of stores. This is the design mode for super regional, regional and most community shopping centres.
Strip centre: Is an attached row of stores or service outlets managed as a coherent retail entity, with on-site parking, usually located in front of the stores. Store-fronts may be connected by open canopies, but there are no enclosed walkways linking the stores. Store configuration is either a straight line, “L” or “U” shaped. This is the design mode for most neighbourhood, convenience and value (power) centres.
Shopping centre types:
Super regional: More than 100.000 rentable m² of shop space; substantial comparison-shopping; principal tenants are three or more major department stores; more than 250 shops. Examples are: Eastgate and Sandton City (Johannesburg); Menlyn Park (Pretoria); Gateway (Durban metro); Canal Walk (Cape metro).
Regional: 30.000 to 100.000 rentable m² of shop space; principal tenant(s) are one or more major department stores; approximately 40 to 250 shops. Examples are: Westgate, Fourways Mall, Cresta (Johannesburg); Brooklyn Mall (Pretoria); The Pavilion (Durban metro); Sanlam Centre in Parow, Tyger Valley, Kenilworth (Cape metro); Greenacres (Port Elizabeth); Mimosa Mall (Bloemfontein); Vincent Park Shopping Centre (East London).
Community: 10.000 to 30.000 rentable
m² of shop space; principal tenant is typically a variety store (e.g. Clicks) or a discount department store (e.g. Dion or
Game); approximately 30 to 60 shops. Examples are: Sunnypark (Pretoria); Musgrave Centre (Durban); Middestad Mall in Bellville, Meadowridge, Goodwood Mall, Constantia Village (Cape metro);
Constantia Centre (Port Elizabeth); Brandwag Centre (Bloemfontein); Beacon Bay Retail Park (East London).
Neighbourhood: 3.000 to 10.000 rentable m² of shop space; principal tenant is a supermarket; 15 to 40 shops.
Convenience: 300 to 1.200 rentable m² of shop space; principal tenant is a café or grocer like Kwik Spar; 5 to 15 shops.
Retail warehouse: Stand-alone; single tenant; >10.000m²; air-conditioned, no ceiling, warehouse-like finishes, e.g. Makro, Hypermarket, Game, Dion.
Value centre: Multi-tenanted strip centre; >10.000m²; warehouse type finishes in order to deliver lower prices to consumers.
Smoothing: Removal of shorter-term fluctuations in a time series, by e.g. moving averages, exponential smoothing, or curve fitting.
Standard deviation (SD): A measure of dispersion in a set of data. For instance, assume a mean of R10 and an SD of R1,50. This means there is a 68% chance the values will lie between R10 - R1,50 = R8,50 and R10 + R1,50 = R11,50.
Stats SA: Statistics South Africa, South African government’s statistics department. Previously known as Central Statistical Services (CSS) and even earlier as the Department of Statistics.
Time series
Rode’s Report 2011:4 Annexure 1
VIII
A set of observations for the same variable at different times (see graph). The intervals or frequencies may be of any length, e.g. years or quarters for national-income or property data, monthly for prices, and weekly, daily, or even minute-by-minute for stock exchange prices.
Total return: Normally measured over a year, in which case it is the income yield for the applicable year (net income in year 1 divided by the purchase price or value in year 0) plus the change in capital value over that year. Also known as the combined return because it combines the income yield and capital return in one measure.
Triple-net lease: see NNN lease.
VAT: value-added tax.
Wholesale value: In the context of property syndication, this means the estimated price that a share or shares of a syndicated property-holding company would fetch (excluding winding-up costs)
should the holding company be dissolved and the underlying property sold as a normal, non-syndicated property. See also retail price.
Year-growth: Percentage by which figures have changed compared to the same month, quarter or year of the previous year.
Year 0: Refers to the year ended at the present time.
Year 1: Refers to the period from year 0 to the end of the first year thereafter.
References:
1. International Council of Shopping Centres
2. Sapoa
3. Bureau of Market Research, University of South Africa
Rode’s Report 2011:4 Annexure 2
IX
Technical background to the Rode surveys
Rode has been surveying the crucial variables of the property market in South Africa since the beginning of 1988 using the expert-panel method. Broadly speaking, the researcher has two potential approaches available to him. These are:
o Track actual transactions, like the rental levels of lettings or the capitalization rates at which sales are concluded. Valuers (appraisers) call these ‘comparables’.
o The expert-panel method of surveying, in which the surveyor regularly asks the same individual members of the panel for their expert opinions, which in turn will of course be based on actual deals of which the panellists are aware.
The cons of tracking actual transactions are:
o A paucity of transactions in most nodes, making statistical inferences impossible.
o Hence the danger of relying on outlier data (mainly the result of small samples)
o Dated transactions
o The cost
o The unwillingness of the parties to report the details of individual deals.
In contrast, through the expert-panel method of research, most of the above cons of the actual-transactions approach are addressed through opinion surveys. This results in cheaper, more accurate and timely information. Sample size is still (and will always be) a problem in some of the less active nodes, but to a lesser extent.
Below we give the reader some insight in our survey approach to determine the levels of the various property variables:
Capitalization rate: The Rode capitalization rate panel consists of two categories of panellist — major owners, and leading investment brokers who know their market segments intimately. This means that the latter's knowledge is based on actual sales. The question put to these carefully chosen panellists is:
Owners: “In your opinion, what is presently the capitalization rate at which your organization is equally happy to buy or sell the properties in the cities below? (Assume a typical location and a cash sale, rather than paper.). For leasebacks, assume the escalation rate reported by you in this questionnaire.”
Brokers: “In your opinion, what is presently the most prevalent capitalization rate at which the following properties are sold/bought in the cities indicated below (assume a cash sale rather than paper)? For leasebacks, assume the escalation rate reported by you in this questionnaire.”
Escalation rate (for industrial leasebacks). The question put to the panellists is:
Owners: “In your opinion, what is the current prevalent (i.e. most often achieved) market escalation rate for prime industrial leasebacks (assume the market capitalization rate you provided in this questionnaire)?”
Brokers: “In your opinion, what is the current prevalent (i.e. most often achieved)
Rode’s Report 2011:4 Annexure 2
X
market escalation rate for prime industrial leasebacks (assume the market capitalization rate you provided in this questionnaire)?”
Hurdle rate: The question put to landlord panellists is:
“In your opinion, what is presently the minimum expected internal rate of return or hurdle rate (%) at which your organization will acquire the following property types in the cities indicated on the right. (Assume a time horizon of 5 years)?”
The question is asked in respect of three property types: office buildings, industrial leasebacks and regional shopping centres.
Respondents are asked to supply two hurdle rates, one rate for "buy" and one rate for "develop on spec".
Office rentals: The Rode office rental survey asks respondents to supply average market rentals by grade (grades A+, A, B & C) for a specific office node.
The question put to the panellists is:
“In your opinion, what is presently the nominal gross achievable/market rental (not asking rent, not escalated contractual rents, not exceptional deals) per rentable m² excluding VAT?” The questionnaire also asks for the typical rent-free period in months, the gross current-year operating costs per rentable m² and the predominant escalation rate on net & gross rentals, and operating costs.
‘Nominal’ rental means the panellist has to assume no incentives like a rent-free period.
We ask the panellists to assume office lettings of 250m² in the case of grades A+, A & B and 150m² in the case of grade C (150m² in smaller towns for all office
grades); occupation within 3 months, a lease period of 4 years and an average position within the building.
Land values: The question put to developers or brokers is:
Office bulk: In your opinion, what is the market value (R/bulk m²)* of a vacant stand with an average location in the following nodes?
a. The bulk that is legally permissible and economically viable.
Shopping centre bulk: In your opinion, what is the market value (R/bulk m²)a of vacant stands appropriately zonedb and with the necessary bulk for the following shopping centres?
a. The bulk that is legally permissible and economically viable.
b. Assume that these stands are ready for construction and that the major external infrastructure investments that municipalities normally force the developer to pay for are already in place. That is, external roads, off-ramps, bridges, new electrical substations, and the like, are in place.
Filling-station land: In your opinion, what is the market value of an average-sized, filling station sitea, with a pump-potential of 350.000 litres per month?
a. Site is defined as the unimproved land, with services to its borders, and appropriately zoned.
Industrial rentals: The question put to panellists is:
“In your opinion, what are the current gross achievable/market rentals per m² for prime industrial buildings for the townships and lease sizes indicated below?”
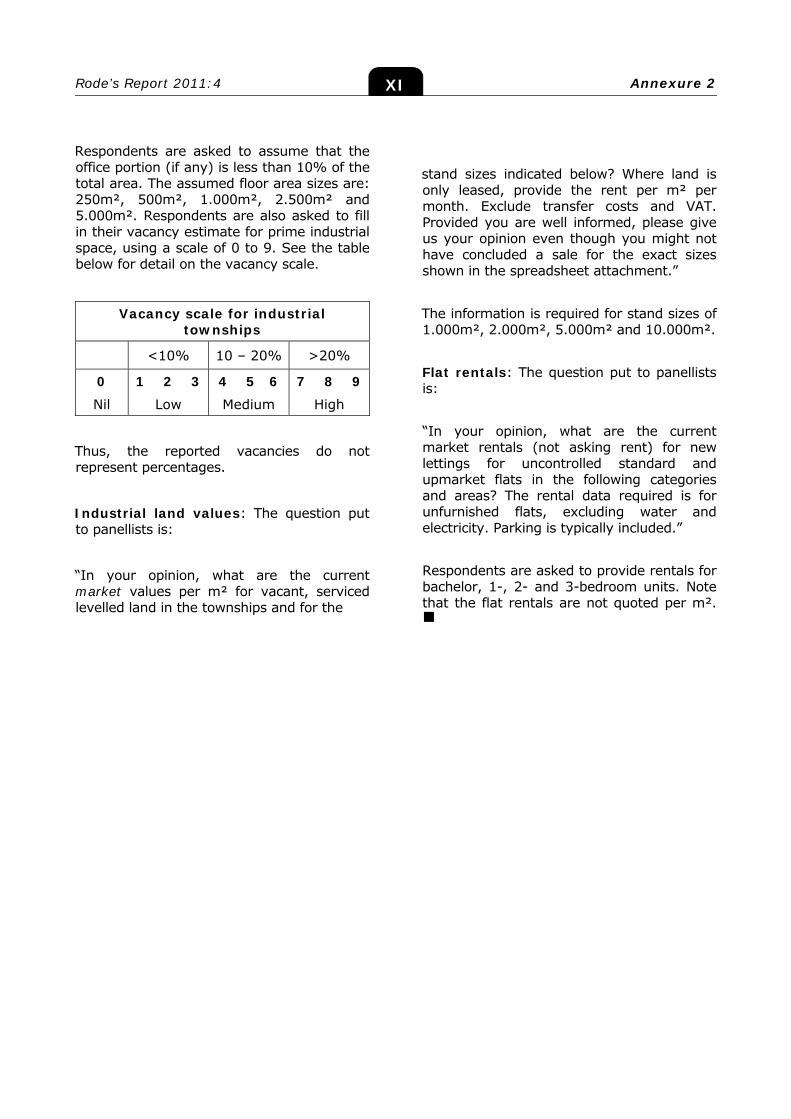
Rode’s Report 2011:4 Annexure 2
XI
Respondents are asked to assume that the office portion (if any) is less than 10% of the total area. The assumed floor area sizes are: 250m², 500m², 1.000m², 2.500m² and 5.000m². Respondents are also asked to fill in their vacancy estimate for prime industrial space, using a scale of 0 to 9. See the table below for detail on the vacancy scale.
Vacancy scale for industrial
townships
<10% 10 – 20% >20%
0
Nil
1 2 3
Low
4 5 6
Medium
7 8 9
High
Thus, the reported vacancies do not represent percentages.
Industrial land values: The question put to panellists is:
“In your opinion, what are the current market values per m² for vacant, serviced levelled land in the townships and for the
stand sizes indicated below? Where land is only leased, provide the rent per m² per month. Exclude transfer costs and VAT. Provided you are well informed, please give us your opinion even though you might not have concluded a sale for the exact sizes shown in the spreadsheet attachment.”
The information is required for stand sizes of 1.000m², 2.000m², 5.000m² and 10.000m².
Flat rentals: The question put to panellists is:
“In your opinion, what are the current market rentals (not asking rent) for new lettings for uncontrolled standard and upmarket flats in the following categories and areas? The rental data required is for unfurnished flats, excluding water and electricity. Parking is typically included.”
Respondents are asked to provide rentals for bachelor, 1-, 2- and 3-bedroom units. Note that the flat rentals are not quoted per m².
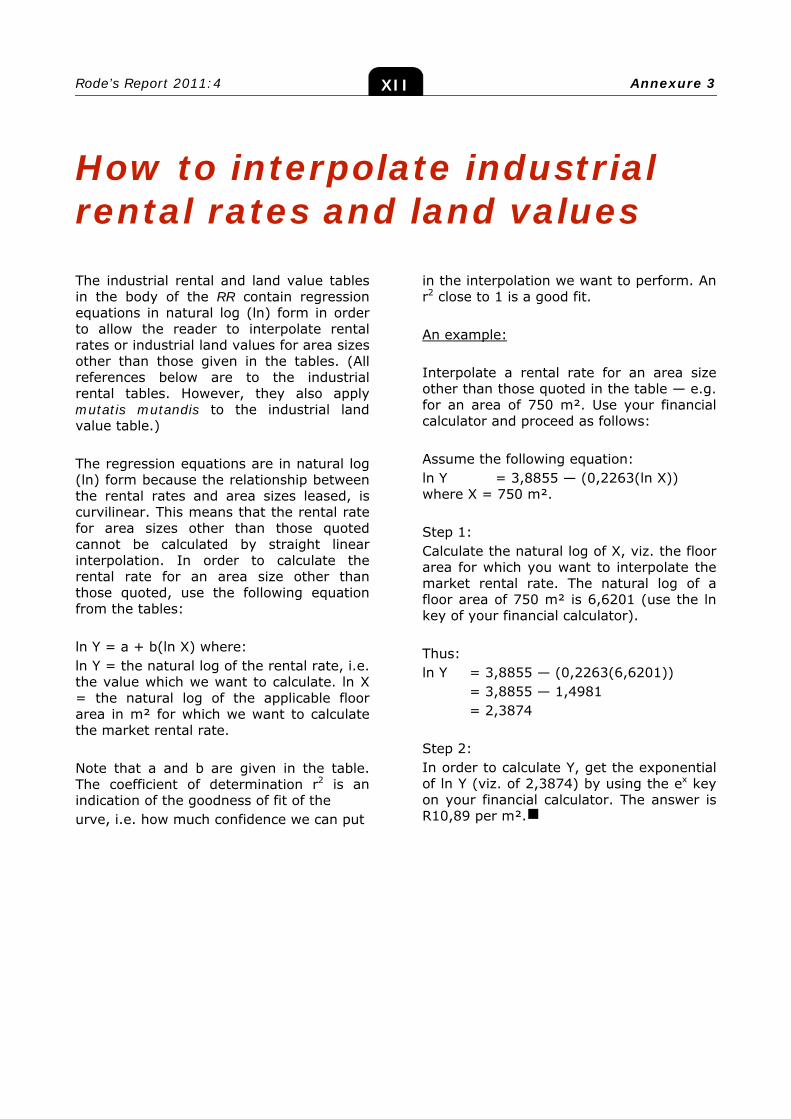
Rode’s Report 2011:4 Annexure 3
XII
How to interpolate industrial rental rates and land values The industrial rental and land value tables in the body of the RR contain regression equations in natural log (ln) form in order to allow the reader to interpolate rental rates or industrial land values for area sizes other than those given in the tables. (All references below are to the industrial rental tables. However, they also apply mutatis mutandis to the industrial land value table.) The regression equations are in natural log (ln) form because the relationship between the rental rates and area sizes leased, is curvilinear. This means that the rental rate for area sizes other than those quoted cannot be calculated by straight linear interpolation. In order to calculate the rental rate for an area size other than those quoted, use the following equation from the tables: ln Y = a + b(ln X) where: ln Y = the natural log of the rental rate, i.e. the value which we want to calculate. ln X = the natural log of the applicable floor area in m² for which we want to calculate the market rental rate. Note that a and b are given in the table. The coefficient of determination r2 is an indication of the goodness of fit of the urve, i.e. how much confidence we can put
in the interpolation we want to perform. An r2 close to 1 is a good fit. An example: Interpolate a rental rate for an area size other than those quoted in the table — e.g. for an area of 750 m². Use your financial calculator and proceed as follows: Assume the following equation: ln Y = 3,8855 — (0,2263(ln X)) where X = 750 m². Step 1: Calculate the natural log of X, viz. the floor area for which you want to interpolate the market rental rate. The natural log of a floor area of 750 m² is 6,6201 (use the ln key of your financial calculator). Thus: ln Y = 3,8855 — (0,2263(6,6201)) = 3,8855 — 1,4981 = 2,3874 Step 2: In order to calculate Y, get the exponential of ln Y (viz. of 2,3874) by using the ex key on your financial calculator. The answer is R10,89 per m².
Rode’s Report 2011:4 Annexure 4
XIII
Approximate building cost rates as at September 2011
Source: Property and construction handbook, Davis Langdon, an AECOM company, March 2010.
The following, unless otherwise stated, is a list of approximate building cost rates per m² of construction area for various building types in the Gauteng region. The rates represent the average expected building cost rates for 2011. It is stressed that these rates are purely of an indicative nature and should be used with circumspection, as they are dependent upon a number of variables.
The area of the building expressed in m² is equivalent to the ‘Construction Area’ where appropriate, as defined in the ‘Method for Measuring Floor Areas in Buildings’ First Edition (effective from 1st August 2005), published by the South African Property Owners Association (SAPOA).
It is recommended that a quantity surveyor be consulted to calculate a more accurate replacement value of a building, which can be updated thereafter using the BER Building Cost Index.
The rates below include P & G but exclude in-contract escalations, professional fees and VAT. For the calculation of replacement costs, for insurance purposes, the following should also be included:
An allowance for demolition costs;
Professional fees;
In-contract building cost escalation (Haylett);
Loss of interest;
An escalation of the contract price to the end of the insurance period; and
Loss of income.
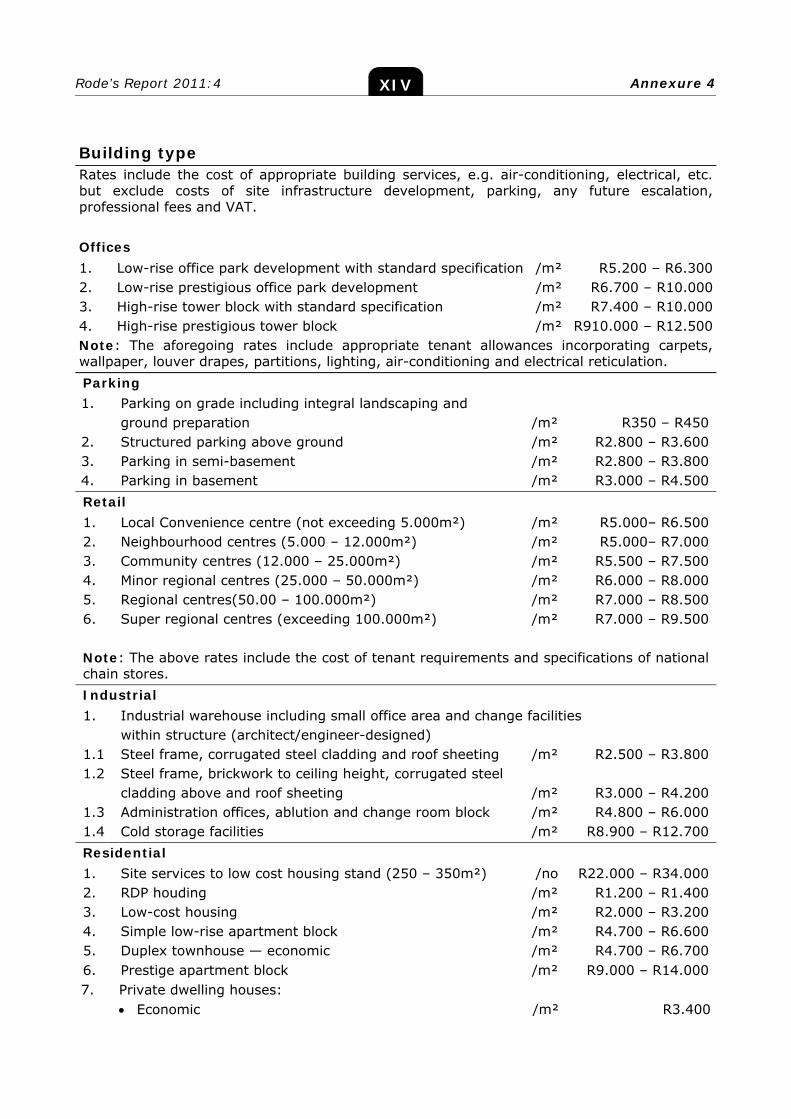
Rode’s Report 2011:4 Annexure 4
XIV
Building type Rates include the cost of appropriate building services, e.g. air-conditioning, electrical, etc. but exclude costs of site infrastructure development, parking, any future escalation, professional fees and VAT. Offices 1. Low-rise office park development with standard specification /m² R5.200 – R6.300 2. Low-rise prestigious office park development /m² R6.700 – R10.000 3. High-rise tower block with standard specification /m² R7.400 – R10.000 4. High-rise prestigious tower block /m² R910.000 – R12.500 Note: The aforegoing rates include appropriate tenant allowances incorporating carpets, wallpaper, louver drapes, partitions, lighting, air-conditioning and electrical reticulation. Parking 1.
Parking on grade including integral landscaping and ground preparation
/m²
R350 – R450
2. Structured parking above ground /m² R2.800 – R3.600 3. Parking in semi-basement /m² R2.800 – R3.800 4. Parking in basement /m² R3.000 – R4.500 Retail 1. Local Convenience centre (not exceeding 5.000m²) /m² R5.000– R6.500 2. 3.
Neighbourhood centres (5.000 – 12.000m²) Community centres (12.000 – 25.000m²)
/m² /m²
R5.000– R7.000 R5.500 – R7.500
4. Minor regional centres (25.000 – 50.000m²) /m² R6.000 – R8.000 5. 6.
Regional centres(50.00 – 100.000m²) Super regional centres (exceeding 100.000m²)
/m² /m²
R7.000 – R8.500 R7.000 – R9.500
Note: The above rates include the cost of tenant requirements and specifications of national chain stores. Industrial 1.
Industrial warehouse including small office area and change facilities within structure (architect/engineer-designed)
1.1 Steel frame, corrugated steel cladding and roof sheeting /m² R2.500 – R3.800 1.2
Steel frame, brickwork to ceiling height, corrugated steel cladding above and roof sheeting
/m²
R3.000 – R4.200
1.3 Administration offices, ablution and change room block /m² R4.800 – R6.000 1.4 Cold storage facilities /m² R8.900 – R12.700 Residential 1. Site services to low cost housing stand (250 – 350m²) /no R22.000 – R34.000 2. RDP houding /m² R1.200 – R1.400 3. Low-cost housing /m² R2.000 – R3.200 4. Simple low-rise apartment block /m² R4.700 – R6.600 5. Duplex townhouse — economic /m² R4.700 – R6.700 6. Prestige apartment block /m² R9.000 – R14.000 7. Private dwelling houses: Economic /m² R3.400
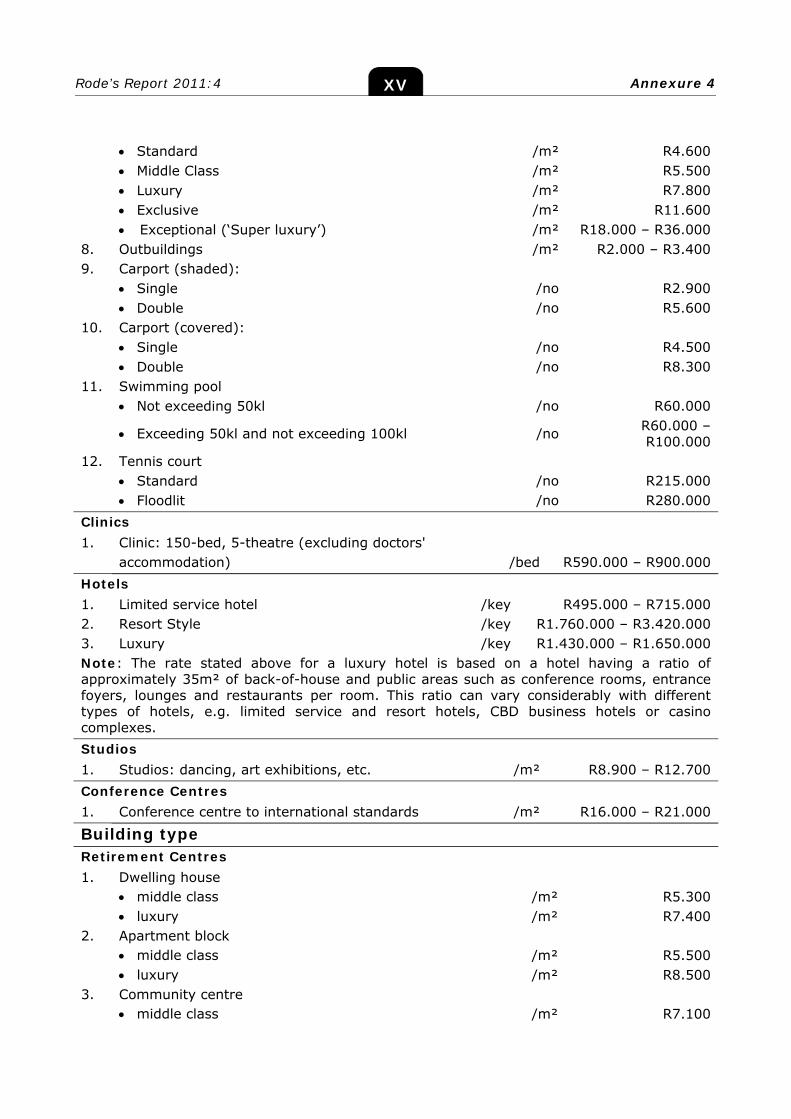
Rode’s Report 2011:4 Annexure 4
XV
Standard /m² R4.600 Middle Class /m² R5.500 Luxury /m² R7.800 Exclusive /m² R11.600 Exceptional (‘Super luxury’) /m² R18.000 – R36.000 8. Outbuildings /m² R2.000 – R3.400 9. Carport (shaded): Single /no R2.900 Double /no R5.600 10. Carport (covered): Single /no R4.500 Double /no R8.300 11. Swimming pool Not exceeding 50kl /no R60.000
Exceeding 50kl and not exceeding 100kl /no R60.000 – R100.000
12. Tennis court Standard /no R215.000 Floodlit /no R280.000 Clinics 1.
Clinic: 150-bed, 5-theatre (excluding doctors' accommodation)
/bed
R590.000 – R900.000
Hotels 1. Limited service hotel /key R495.000 – R715.000 2. Resort Style /key R1.760.000 – R3.420.000 3. Luxury /key R1.430.000 – R1.650.000 Note: The rate stated above for a luxury hotel is based on a hotel having a ratio of approximately 35m² of back-of-house and public areas such as conference rooms, entrance foyers, lounges and restaurants per room. This ratio can vary considerably with different types of hotels, e.g. limited service and resort hotels, CBD business hotels or casino complexes. Studios 1. Studios: dancing, art exhibitions, etc. /m² R8.900 – R12.700 Conference Centres 1. Conference centre to international standards /m² R16.000 – R21.000
Building type Retirement Centres 1. Dwelling house middle class /m² R5.300 luxury /m² R7.400 2. Apartment block middle class /m² R5.500 luxury /m² R8.500 3. Community centre middle class /m² R7.100
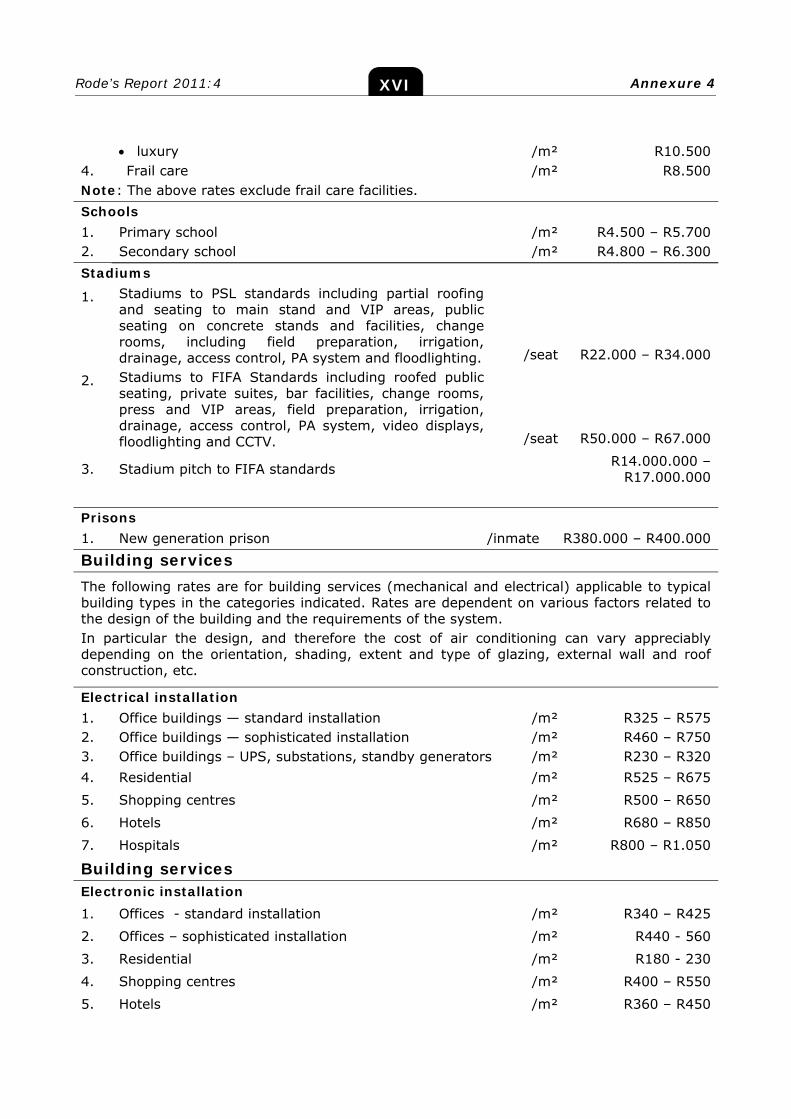
Rode’s Report 2011:4 Annexure 4
XVI
luxury /m² R10.500 4. Frail care /m² R8.500 Note: The above rates exclude frail care facilities. Schools 1. Primary school /m² R4.500 – R5.700 2. Secondary school /m² R4.800 – R6.300 Stadiums
1.
Stadiums to PSL standards including partial roofing and seating to main stand and VIP areas, public seating on concrete stands and facilities, change rooms, including field preparation, irrigation, drainage, access control, PA system and floodlighting.
/seat
R22.000 – R34.000
2.
Stadiums to FIFA Standards including roofed public seating, private suites, bar facilities, change rooms, press and VIP areas, field preparation, irrigation, drainage, access control, PA system, video displays, floodlighting and CCTV.
/seat
R50.000 – R67.000
3. Stadium pitch to FIFA standards R14.000.000 – R17.000.000
Prisons 1. New generation prison /inmate R380.000 – R400.000
Building services The following rates are for building services (mechanical and electrical) applicable to typical building types in the categories indicated. Rates are dependent on various factors related to the design of the building and the requirements of the system. In particular the design, and therefore the cost of air conditioning can vary appreciably depending on the orientation, shading, extent and type of glazing, external wall and roof construction, etc.
Electrical installation 1. Office buildings — standard installation /m² R325 – R575 2. Office buildings — sophisticated installation /m² R460 – R750 3. Office buildings – UPS, substations, standby generators /m² R230 – R320 4. Residential /m² R525 – R675
5. Shopping centres /m² R500 – R650
6. Hotels /m² R680 – R850
7. Hospitals /m² R800 – R1.050
Building services Electronic installation 1. Offices - standard installation /m² R340 – R425
2. Offices – sophisticated installation /m² R440 - 560
3. Residential /m² R180 - 230
4. Shopping centres /m² R400 – R550
5. Hotels /m² R360 – R450
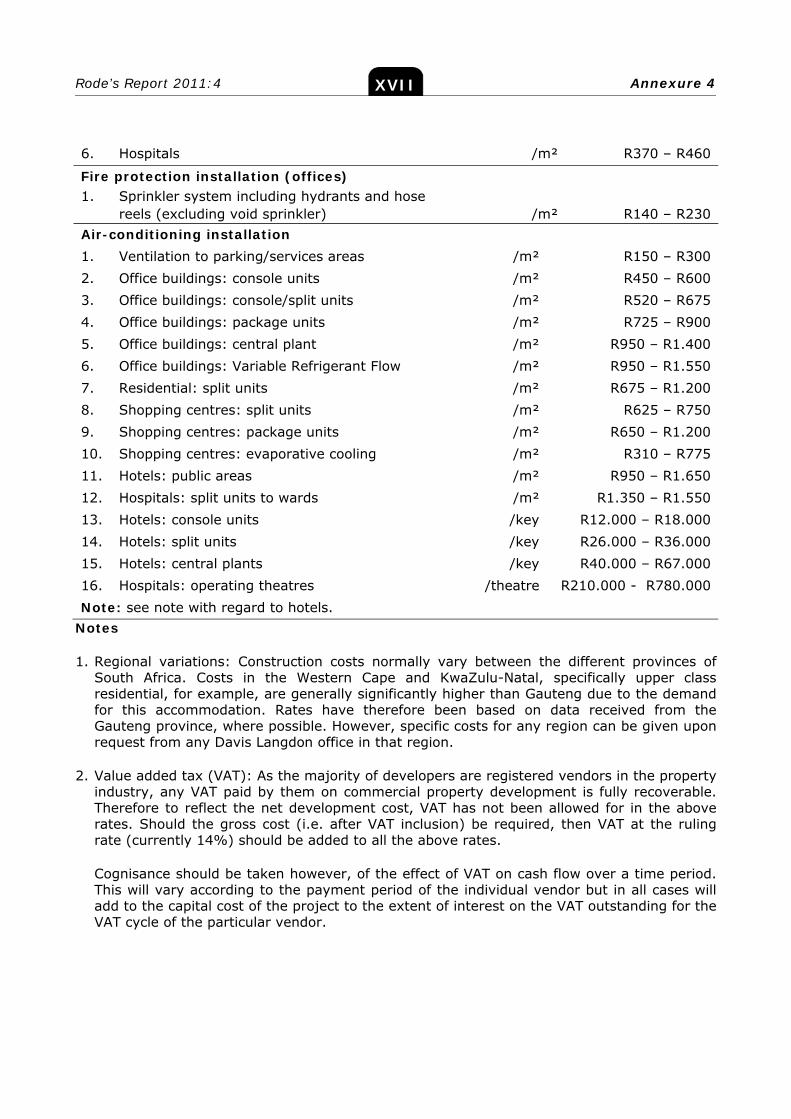
Rode’s Report 2011:4 Annexure 4
XVII
6. Hospitals /m² R370 – R460
Fire protection installation (offices) 1.
Sprinkler system including hydrants and hose reels (excluding void sprinkler)
/m²
R140 – R230
Air-conditioning installation 1. Ventilation to parking/services areas /m² R150 – R300 2. Office buildings: console units /m² R450 – R600 3. Office buildings: console/split units /m² R520 – R675 4. Office buildings: package units /m² R725 – R900 5. Office buildings: central plant /m² R950 – R1.400 6. Office buildings: Variable Refrigerant Flow /m² R950 – R1.550 7. Residential: split units /m² R675 – R1.200 8. Shopping centres: split units /m² R625 – R750 9. Shopping centres: package units /m² R650 – R1.200 10. Shopping centres: evaporative cooling /m² R310 – R775 11. Hotels: public areas /m² R950 – R1.650 12. Hospitals: split units to wards /m² R1.350 – R1.550 13. Hotels: console units /key R12.000 – R18.000 14. Hotels: split units /key R26.000 – R36.000 15. Hotels: central plants /key R40.000 – R67.000 16. Hospitals: operating theatres /theatre R210.000 - R780.000 Note: see note with regard to hotels.
Notes 1. Regional variations: Construction costs normally vary between the different provinces of
South Africa. Costs in the Western Cape and KwaZulu-Natal, specifically upper class residential, for example, are generally significantly higher than Gauteng due to the demand for this accommodation. Rates have therefore been based on data received from the Gauteng province, where possible. However, specific costs for any region can be given upon request from any Davis Langdon office in that region.
2. Value added tax (VAT): As the majority of developers are registered vendors in the property
industry, any VAT paid by them on commercial property development is fully recoverable. Therefore to reflect the net development cost, VAT has not been allowed for in the above rates. Should the gross cost (i.e. after VAT inclusion) be required, then VAT at the ruling rate (currently 14%) should be added to all the above rates.
Cognisance should be taken however, of the effect of VAT on cash flow over a time period. This will vary according to the payment period of the individual vendor but in all cases will add to the capital cost of the project to the extent of interest on the VAT outstanding for the VAT cycle of the particular vendor.
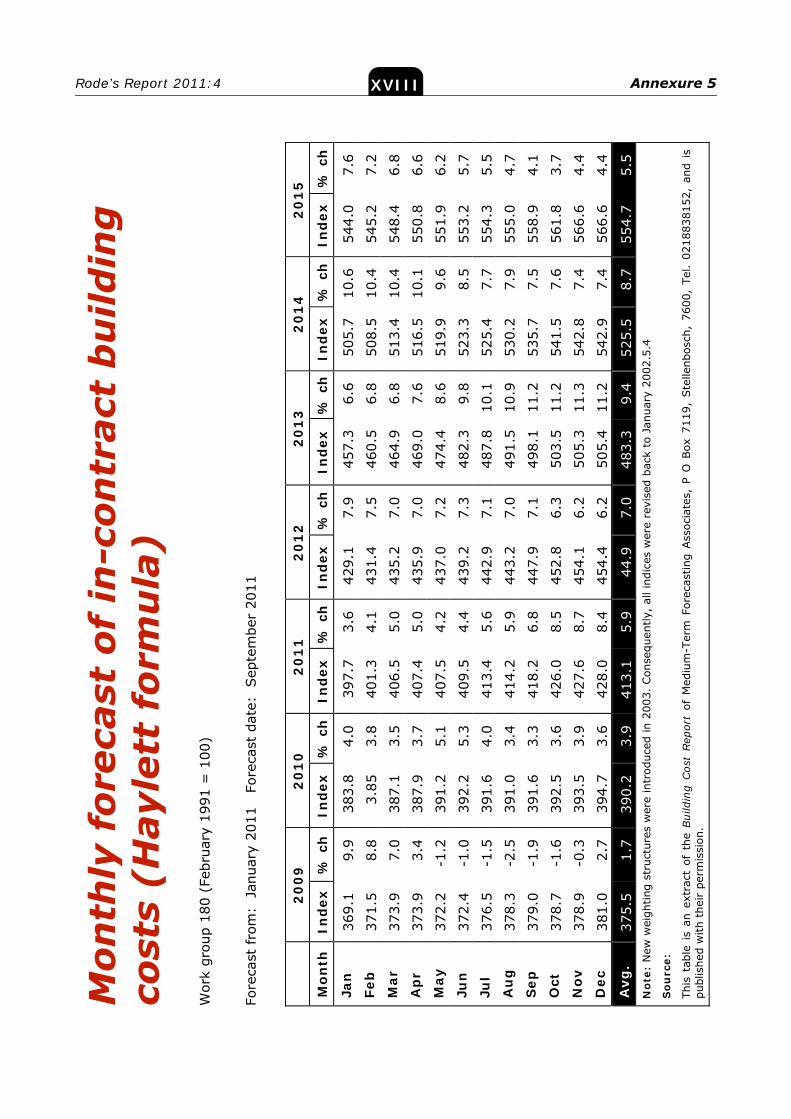
Rode’s Report 2011:4 Annexure 5
XVIII
Mon
thly
for
ecas
t of
in-c
ontr
act
bu
ildin
g
cost
s (H
ayle
tt f
orm
ula
) W
ork
grou
p 18
0 (F
ebru
ary
1991
= 1
00)
Fore
cast
fro
m:
Jan
uary
201
1 Fo
reca
st d
ate:
Sep
tem
ber
2011
2
00
9
20
10
2
01
1
20
12
2
01
3
20
14
2
01
5
Mon
th
Ind
ex
% c
h
Ind
ex
% c
h
Ind
ex
% c
h
Ind
ex
% c
h
Ind
ex
% c
h
Ind
ex
% c
h
Ind
ex
% c
h
Jan
36
9.1
9.9
383.
8 4.
0 39
7.7
3.6
429.
1 7.
9 45
7.3
6.6
505.
7 10
.6
544.
0 7.
6 Fe
b
371.
5 8.
8 3.
85
3.8
401.
3 4.
1 43
1.4
7.5
460.
5 6.
8 50
8.5
10.4
54
5.2
7.2
Mar
37
3.9
7.0
387.
1 3.
5 40
6.5
5.0
435.
2 7.
0 46
4.9
6.8
513.
4 10
.4
548.
4 6.
8 A
pr
373.
9 3.
4 38
7.9
3.7
407.
4 5.
0 43
5.9
7.0
469.
0 7.
6 51
6.5
10.1
55
0.8
6.6
May
37
2.2
-1.2
39
1.2
5.1
407.
5 4.
2 43
7.0
7.2
474.
4 8.
6 51
9.9
9.6
551.
9 6.
2 Ju
n
372.
4 -1
.0
392.
2 5.
3 40
9.5
4.4
439.
2 7.
3 48
2.3
9.8
523.
3 8.
5 55
3.2
5.7
Jul
376.
5 -1
.5
391.
6 4.
0 41
3.4
5.6
442.
9 7.
1 48
7.8
10.1
52
5.4
7.7
554.
3 5.
5 A
ug
37
8.3
-2.5
39
1.0
3.4
414.
2 5.
9 44
3.2
7.0
491.
5 10
.9
530.
2 7.
9 55
5.0
4.7
Sep
37
9.0
-1.9
39
1.6
3.3
418.
2 6.
8 44
7.9
7.1
498.
1 11
.2
535.
7 7.
5 55
8.9
4.1
Oct
37
8.7
-1.6
39
2.5
3.6
426.
0 8.
5 45
2.8
6.3
503.
5 11
.2
541.
5 7.
6 56
1.8
3.7
Nov
37
8.9
-0.3
39
3.5
3.9
427.
6 8.
7 45
4.1
6.2
505.
3 11
.3
542.
8 7.
4 56
6.6
4.4
Dec
38
1.0
2.7
394.
7 3.
6 42
8.0
8.4
454.
4 6.
2 50
5.4
11.2
54
2.9
7.4
566.
6 4.
4 A
vg.
375.
5 1.
7 39
0.2
3.9
413.
1 5.
9 44
.9
7.0
483.
3 9.
4 52
5.5
8.7
554.
7 5.
5 N
ote:
New
wei
ghtin
g st
ruct
ures
wer
e in
trod
uced
in 2
003.
Con
sequ
ently
, al
l ind
ices
wer
e re
vise
d ba
ck t
o Ja
nuar
y 20
02.5
.4
Sou
rce:
This
tab
le i
s an
ext
ract
of
the
Bui
ldin
g Cos
t Rep
ort
of M
ediu
m-T
erm
For
ecas
ting
Ass
ocia
tes,
P O
Box
711
9, S
telle
nbos
ch,
7600
, Te
l. 02
1883
8152
, an
d is
pu
blis
hed
with
the
ir p
erm
issi
on.
Rode’s Report 2011:4 Annexure 6 XIX
Absa home building-cost index
2000 = 100
Quarter Index
% change on
previous year
Quarter Index
% change on
previous year
1996:1 68,3 4,5% 2004:1 163,6 19,1% 1996:2 68,2 3,6% 2004:2 170,2 18,9% 1996:3 68,9 3,0% 2004:3 175,3 17,6% 1996:4 69,4 1,3% 2004:4 180,3 15,4% 1997:1 71,0 4,1% 2005:1 185,9 13,6% 1997:2 74,0 8,4% 2005:2 192,1 12,9% 1997:3 77,1 11,9% 2005:3 198,2 13,0% 1997:4 79,7 14,8% 2005:4 204,3 13,3% 1998:1 82,3 15,8% 2006:1 208,3 12,1% 1998:2 83,5 12,8% 2006:2 211,5 10,1% 1998:3 84,0 9,1% 2006:3 219,6 10,8% 1998:4 84,2 5,7% 2006:4 227,0 11,1% 1999:1 86,6 5,2% 2007:1 230,8 10,8% 1999:2 89,4 7,1% 2007:2 236,7 11,9% 1999:3 92,2 9,7% 2007:3 240,0 9,3% 1999:4 96,1 14,1% 2007:4 245,2 8,0% 2000:1 99,4 14,8% 2008:1 254,0 10,1% 2000:2 101,5 13,5% 2008:2 256,0 8,2% 2000:3 103,0 11,7% 2008:3 258,7 7,8% 2000:4 105,3 9,6% 2008:4 261,9 6,7% 2001:1 107,4 8,1% 2009:1 264,0 3,9% 2001:3 111,4 9,7% 2009:2 272,5 6,5% 2001:4 115,9 12,5% 2009:3 277,4 7,2% 2002:1 118,9 12,9% 2009:4 278,4 6,3% 2002:2 122,1 13,7% 2010:1 285,9 8,3% 2002:3 126,7 13,8% 2010:2 292,3 7,3% 2002:4 131,8 13,8% 2010:3 296,2 6,8% 2003:1 137,4 15,5% 2010:4 304,4 9,3% 2003:2 143,1 17,3% 2011:1 305,4 6,8% 2003:3 149,0 17,6% 2011:2 302,7 3,6% 2003:4 156,2 18,5% 2011:3 310,2 4,7% Source: ABSA. Calculated from Absa home mortgage data, viz. value of houses to be built divided by number of m².
:
Rode’s Report 2011:4 Annexure 7 XX
BER Building Cost Index (non-residential tender prices)
2005=100
First quarter Second quarter Third quarter Fourth
quarter Average
2005 96,5 97,8 101,0 104,7 100,0 % ch 20,2 16,5 16,3 15,6 17,1 2006 103,0 109,2 110,6 117,7 110,1 % ch 6,8 11,7 9,5 12,4 10,1 2007 113,9 132,8 122,9 138,4 127,0 % ch 10,6 21,6 11,2 17,6 15,3 2008 135,4 147,0 141,2 157,5 145,3 % ch 18,9 10,6 14,9 13,8 14,4 2009 138,7 151,0 140,9 145,6 144,0 % ch 2,4 2,7 -0,2 -7,6 -0,9 2010 145,7 144,8 141,3 140,1 143,2 %ch 5,1 -4,1 0,3 -3,8 -0,6 2011 140,8 147,0 150,0 %ch -3,4 1,5 5,6 Source: This table is an extract of the Building Cost Report of Medium-Term Forecasting Associates, P O Box 7119, Stellenbosch, 7600, Tel. 0218838152, and is published with their permission. The last few months are always subject to change.
Rode’s Report 2011:4 Annexure 8
XXI
Pri
me
over
dra
ft r
ate
at m
onth
-en
d (
%)
(pro
xy f
or t
ren
ds
in m
ortg
age
rate
s*)
Y
ear
Jan
Fe
b
Mar
A
pr
May
Ju
n
Jul
Au
g
Sep
O
ct
No
v D
ec
Yea
r 1
98
9
18,0
19
,0
19,0
19
,0
20,0
20
,0
20,0
20
,0
20,0
21
,0
21,0
21
,0
19,8
1
99
0
21,0
21
,0
21,0
21
,0
21,0
21
,0
21,0
21
,0
21,0
21
,0
21,0
21
,0
21,0
1
99
1
21,0
21
,0
21,0
20
,0
20,0
20
,0
20,0
20
,0
20,0
20
,3
20,3
20
,3
20,3
1
99
2
20,3
20
,3
20,3
19
,3
19,3
19
,3
18,3
18
,3
18,3
18
,3
17,3
17
,3
18,8
1
99
3
17,3
16
,3
16,3
16
,3
16,3
16
,3
16,3
16
,3
16,3
16
,3
15,3
15
,3
16,2
1
99
4
15,3
15
,3
15,3
15
,3
15,3
15
,3
15,3
15
,3
16,3
16
,3
16,3
16
,3
15,6
1
99
5
16,3
17
,5
17,5
17
,5
17,5
17
,5
18,5
18
,5
18,5
18
,5
18,5
18
,5
17,9
1
99
6
18,5
18
,5
18,5
19
,5
20,5
20
,5
19,5
19
,5
19,5
19
,3
20,3
20
,3
19,5
1
99
7
20,3
20
,3
20,3
20
,3
20,3
20
,3
20,3
20
,3
20,3
19
,3
19,3
19
,3
20,0
1
99
8
19,3
19
,3
18,3
18
,3
18,3
22
,3
24,0
25
,5
25,5
24
,5
23,5
23
,0
21,8
1
99
9
22,0
21
,0
20,0
19
,0
19,0
18
,0
17,5
16
,5
16,5
15
,5
15,5
15
,5
18,0
2
00
0
14,5
14
,5
14,5
14
,5
14,5
14
,5
14,5
14
,5
14,5
14
,5
14,5
14
,5
14,5
2
00
1
14,5
14
,5
14,5
14
,5
14,5
13
,8
13,5
13
,5
13,0
13
,0
13,0
13
,0
13,8
2
00
2
14,0
14
,0
15,0
15
,0
15,0
16
,0
16,0
16
,0
17,0
17
,0
17,0
17
,0
15,8
2
00
3
17,0
17
,0
17,0
17
,0
17,0
15
,5
15,5
14
,5
13,5
12
,0
12,0
11
,5
15,0
2
00
4
11,5
11
,5
11,5
11
,5
11,5
11
,5
11,5
11
,0
11,0
11
,0
11,0
11
,0
11,3
2
00
5
11,0
11
,0
11,0
10
,5
10,5
10
,5
10,5
10
,5
10,5
10
,5
10,5
10
,5
10,6
2
00
6
10,5
10
,5
10,5
10
,5
10,5
11
,0
11,0
11
,5
11,5
12
,0
12,0
12
,5
11,2
2
00
7
12,5
12
,5
12,5
12
,5
12,5
13
,0
13,0
13
,5
14,0
14
,0
14,0
14
,5
13,2
2
00
8
14,5
14
,5
14,5
15
,0
15,0
15
,5
15,5
15
,5
15,5
15
,5
15,5
15
,0
15,1
2
00
9
15,0
14
,0
13,0
13
,0
11,0
11
,0
11,0
10
,5
10,5
10
,5
10,5
10
,5
10,8
2
01
0
10,5
10
,5
10,0
10
,0
10,0
10
,0
10,0
10
,0
9,5
9,5
9,0
9,0
9,8
20
11
9,
0 9,
0 9,
0 9,
0 9,
0 9,
0 9,
0 9,
0 9,
0 9,
0 9,
0
Sou
rce:
SARB
*Ave
rage
mor
tgag
e ra
tes
for
new
bon
ds a
re,
on a
vera
ge,
belo
w t
he p
rim
e ov
erdr
aft
rate
. In
divi
dual
mor
tgag
e ra
tes
will
dep
end
on t
he c
redi
twor
thin
ess
of t
he m
ortg
agor
.


Our track record speaks for itself
www.delqs.com
www.delqs.com | JHB +27 (11) 642 8751 | PTA +27 (12) 460 3304 Associated offices: GHANA | KENYA | MAURITIUS | NAMIBIA | NIGERIA | TANZANIA | UGANDA
Personal service to satisfy the needs of our clientsWe place great emphasis upon satisfying the needs of our clients. This has resulted in the development of specialised knowledge within the organisation and a constant quest to improve the level of service which we are able to offer our clients. Based in Johannesburg and Pretoria, we have since 2000 built up a remarkable track record of involvement with significant property developments in South Africa, elsewhere in Africa and in the Middle East
Dr Corné de Leeuw
Nico Roos
Gerhard de Leeuw
QUANTITY SURVEYING PROPERTY VALUATIONDISPUTE RESOLUTION


