Embed Size (px)
Citation preview
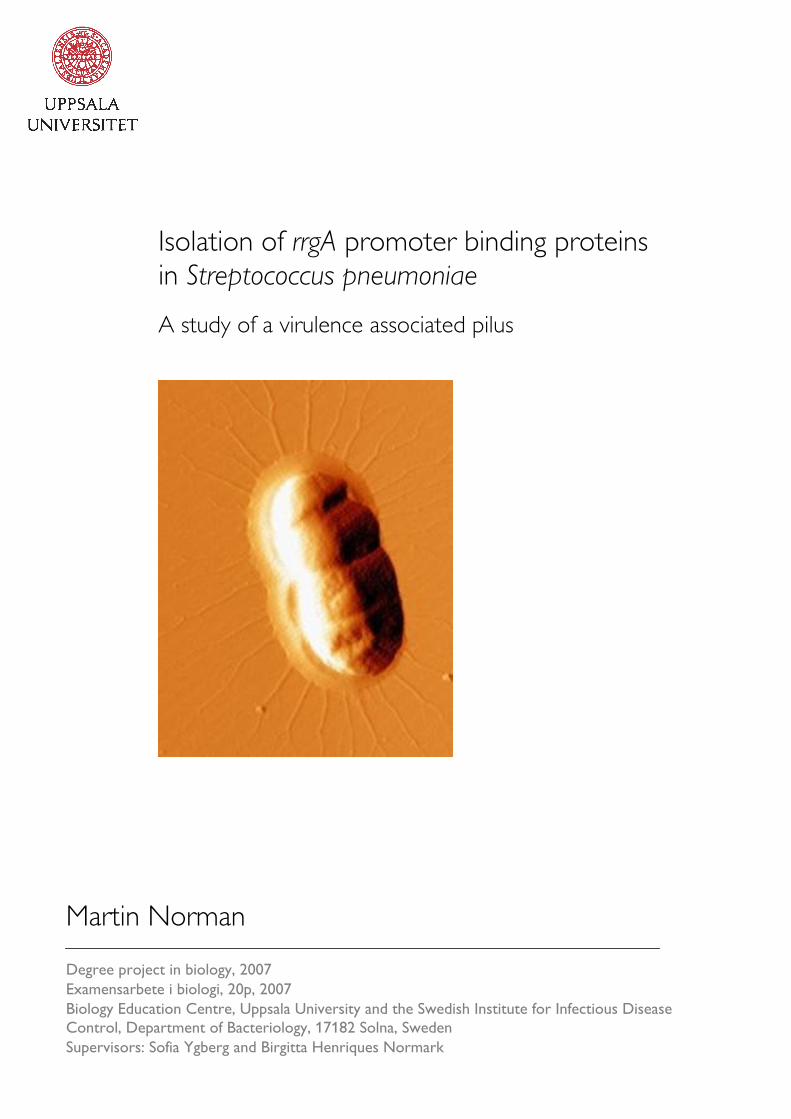
Isolation of rrgA promoter binding proteinsin Streptococcus pneumoniae
A study of a virulence associated pilus
Martin Norman
Degree project in biology, 2007Examensarbete i biologi, 20p, 2007Biology Education Centre, Uppsala University and the Swedish Institute for Infectious DiseaseControl, Department of Bacteriology, 17182 Solna, SwedenSupervisors: Sofia Ygberg and Birgitta Henriques Normark
Table of contents
Abstract ..................................................................................................................................... 3 Introduction .............................................................................................................................. 4
Health effects and implications .............................................................................................. 4 Virulence ................................................................................................................................ 4 Infection control ..................................................................................................................... 5 Pili in Streptococcus pneumoniae .......................................................................................... 5 Scope and context of this project ........................................................................................... 7 Aims ....................................................................................................................................... 7
Results ....................................................................................................................................... 8 Preparing DNA for protein trapping ...................................................................................... 8 Preparation of cytoplasmic protein extract............................................................................. 9 Enriching for proteins binding to target DNA ....................................................................... 9 Preparation of samples for mass spectrometric analysis...................................................... 12
Discussion................................................................................................................................ 14 Immobilisation of rrgA promoter fragments to Dynabeads® ............................................... 14 Cell lysis............................................................................................................................... 14 Binding experiments ............................................................................................................ 15 Future prospects ................................................................................................................... 16
Materials and methods........................................................................................................... 17 Strains and media ................................................................................................................. 17 Culturing of Streptococcus pneumoniae .............................................................................. 17 Primers ................................................................................................................................. 17 DNA extraction .................................................................................................................... 17 PCR protocol and program................................................................................................... 18 Protein extraction tests ......................................................................................................... 18 Protein extraction French press protocol.............................................................................. 20 Protein concentration and quality of extract ........................................................................ 20 Protein-DNA binding reaction ............................................................................................. 20 Precipitation of protein eluate .............................................................................................. 21 PAGE and gel staining ......................................................................................................... 21 Binding reaction for mass spectrometry............................................................................... 21 Sequencing of immobilised fragments ................................................................................. 21
Acknowledgements................................................................................................................. 23 References ............................................................................................................................... 24
2
Abstract
The human pathogen Streptococcus pneumoniae is able to cause diseases ranging from otitis media to pneumonia and bacterial septicaemia. Recently a pathogenicity islet encoding a pilus was described for S. pneumoniae. This pilus is an important virulence factor that mediates adherence to host cells and it is also a potential vaccine candidate. Three structural genes, rrgA, rrgB and rrgC, encode the proteins that form the pilus. These genes are under the influence of the positive regulator RlrA and the repressor MgrA. The aim of this project was to set up a functioning affinity chromatography protocol for Dynabeads® to isolate proteins that bind to the promoter region of rrgA. Several different lysis methods were tested but only mechanical shearing worked sufficiently well. Once a functional protocol was found, the focus shifted to the identification of proteins potentially involved in the regulation of rrgA transcription. The functionality of the protocol largely depended on the addition of divalent ions for successful binding of proteins to the promoter fragment. No differences in the pattern of enriched proteins were noted when the S. pneumoniae TIGR4 strain was compared to strains with either the regulator RlrA or MgrA deleted.
3

Introduction
Health effects and implications Streptococcus pneumoniae, the pneumococcus, is a lancet-shaped Gram-positive bacterium, i.e. it retains Gram stain because of the presence of peptidoglycan in the cell wall. It grows in pairs or short chains and colonises the upper respiratory tract of humans. S. pneumoniae is carried asymptomatically in the nasopharynx in up to 40 % of children and adults, but the frequency of carriage varies greatly between different groups (Hendley et al. 1975). If S. pneumoniae spreads to more distal sites it can cause non-invasive and invasive diseases such as otitis media, pneumonia, bacterial meningitis and septicaemia (Gillespie and Balakrishnan 2000, McCullers and Tuomanen 2001). Respiratory infections are the sixth leading cause of death in the world and the number one cause of infectious deaths. S. pneumoniae is one of the most frequent causes of community acquired pneumonia, bacterial meningitis, otitis media and septicaemia (McCullers and Tuomanen 2001). More than one million children under the age of 5 are estimated to die annually worldwide from infections caused by S. pneumoniae (World Health Organisation 2003). Virulence An important virulence factor for S. pneumoniae is the polysaccharide capsule, which protects colonising and infecting bacteria from phagocytosis. S. pneumoniae can be grouped into about 90 distinct immunogenic types, so called serotypes, based on the composition of the capsule (Henrichsen 1995). Different serotypes have different clinical implications, some being more pathogenic than others. The different serotypes cause disease with different severity and also differ in geographical distribution and host preference, some serotypes have a higher prevalence of causing infection in children than others (Hendley et al 1975, World Health Organisation 2003). The ability of pneumocci to adhere to the respiratory tract is essential for colonisation. Surface proteins that bind to receptors such as N-acetyl-D-galactosamine present on epithelial cells confer adherence of pnemococci to host cells (Gillespie and Balakrishnan 2000). Different surface proteins are thought to be involved in adherence in the upper respiratory tract compared to those involved in the lower respiratory tract. The inability of S. pneumoniae to adhere to the ciliated cells that line the intermediate part of the respiratory tract could, in part, be a possible explanation for the infrequency of pneumonia compared to the frequency of carriage (McCullers and Tuomanen 2001). S. pneumoniae can alter its morphological phenotype, so called phase variation. The two morphological types form either opaque or transparent colonies when grown on an agar plate, and the rate of conversion between the two types varies between 10-3 and 10-6. Transparent variants are able to colonise the nasopharynx more efficiently due to a stronger adherence to the epithelial cells than the opaque variant. The opaque variant, on the other hand, has a higher virulence and higher survival in blood because of differences in the composition of cell wall proteins (Gillespie and Balakrishnan 2000, McCullers and Tuomanen 2001). In addition, choline binding protein A present on the bacterial cell surface is involved in the adherence of S. pneumoniae to the epithelial cells of the host and is essential for nasopharyngeal colonisation (Gillespie and Balakrishnan 2000, McCullers and Tuomanen 2001).
4
Other virulence factors in S. pneumoniae include surface associated autolysins that release intracellular and cell wall components, which in turn stimulate inflammation (Gillespie and Balakrishnan 2000). Pneumolysin is a cytotoxic cytoplasmic monomer that aggregates in the membrane of eukaryotic cells and forms a transmembrane pore resulting in leakage of solutes, thereby damaging the cell. Pneumolysin is also involved in the separation of the tight junctions between the alveolar epithelial cells, thereby facilitating invasion of the bloodstream. The ability of pneumolysin to activate the classical complement pathway by binding to the Fc region of immunoglobulin G induces inflammation as well as allows the bacterium to evade opsonophagocytosis by reducing the limited amount of complement factors present in the alveoli (Gillespie and Balakrishnan 2000). Other virulence associated surface proteins include the pneumococcal surface protein A (PspA) that is a specific receptor for lactoferrin and is important for acquisition of iron by the bacterium (Gillespie and Balakrishnan 2000), but also plays a role in preventing complement factors from binding to the surface of the bacterium (McCullers and Tuomanen 2001). Infection control Antibiotic therapy has been the primary approach to control pneumococcal disease since the introduction of penicillin. During the past decade the emergence of antibiotic tolerant and resistant S. pneumoniae strains have become a significant problem. Penicillin resistance is conferred by a decrease in the binding of the drug to the target enzymes involved in cell wall synthesis (McCullers and Tuomanen 2001). Tolerance by the bacterium to survive in the presence of antibiotics by reducing its metabolism, so called persistence, has been described for pneumococci for the antibiotics penicillin and vancomycin (Henriques Normark et al. 2001). The Alexander project showed that between 1998 and 2000 12 % of 2432 S. pneumoniae clinical isolates in the U.S. had reduced susceptibility to penicillin and 25 % were penicillin resistant (Jacobs et al. 2003). The results from these studies further emphasise the importance of preventing S. pneumoniae infection and the need for new treatments. Capsule-specific antibodies are able to prevent and clear pneumococcal infections (Gianfaldoni et al. 2007). The two vaccines currently used are directed at only 7 or 23 of the more than 90 occurring serotypes. This raises the concern for shifts in the prevalence of serotypes because of the possibility of pneumococci to switch capsule type through transformation (McCullers and Tuomanen 2001). The 23-valent polysaccharide vaccine offers protection against about 90 % of the serotypes involved in invasive infection in the industrialised world. The vaccine elicits no immunological memory, and the poor immunogenicity of polysaccharide vaccines in early childhood precludes the vaccination of children under the age of 2 years (World Health Organisation 2003). The 7-valent polysaccharide-protein conjugate vaccine is only used for vaccinating children, and it covers 65-80 % of the serotypes associated with invasive disease in the U.S. and Western Europe. Regional differences in prevalence of invasive strains lead to differences in efficiency of the two existing vaccines, especially for the 7-valent conjugate vaccine which targets a narrower spectrum of serotypes (World Health Organisation 2003). Pili in Streptococcus pneumoniae Both Gram-positive and Gram-negative bacteria can form pili that protrude from their outer surfaces, however the structure of the pili differs between the two groups of bacteria. In contrast to Gram-negatives, the Gram-positive bacteria form pili that consist of covalently linked subunits. Furthermore Gram-positive bacteria do not require specific chaperones for
5
assembly, and the tip of the pilus is not required for the initiation of pilus formation (Scott and Zähner 2006). In Gram-positive bacteria the structural genes encoding the pilus often occur in clusters that include genes encoding the sortases that are needed for pilus formation. Sortases are enzymes that assemble the pilus subunits and covalently anchor surface proteins with a cell wall sorting signal to the peptidoglycan layer. The tip of the pilus sometimes consists of an adhesin and allows the bacterium to establish initial adherence to the host, since the pilus protrude outside the capsule (Scott and Zähner 2006). The accessibility of the pilus proteins and their importance for virulence make them potential vaccine candidates (Mora et al. 2005). In S. pneumoniae not all strains carry a 12-kb rlrA pathogenicity islet, i.e. a cluster of genes important for virulence, which contains the genes necessary for pilus formation, and not all cells in a population express the pilus. The islet is flanked by IS1167 elements, indicating that the islet indeed is a mobile element. The islet contains the regulatory gene rlrA, three structural genes rrgA, rrgB and rrgC and three sortase genes srtB, srtC and srtD (Hava and Camilli 2002). The structural genes rrgA, rrgB and rrgC encode the proteins that mainly form the basal attachment to the cell wall, the backbone and the tip of the pilus respectively (Barocchi et al. 2006). The localisation of the subunits is not distinct and RrgA is interspersed throughout the pilus (LeMieux et al. 2006). RrgA, RrgB and RrgC all contain the C-terminal (L)PXTG-motif recognised by the sortases (Hava and Camilli 2002). In murine models the rlrA pathogenicity islet has been shown to be important for the bacterium’s ability to adhere to the nasopharynx and lung epithelial cells (Barocchi et al. 2006). Piliated strains were also able to outcompete nonpiliated mutants in murine colonisation, pneumonia and bacteremia models (Barocchi et al. 2006). Transcription of the srtB, srtC and srtD sortases is initiated at a common promoter, as is transcription of rrgB and rrgC. Separate promoters regulate the genes encoding RrgA and RlrA (Hava et al. 2003). The positive regulator RlrA influences the transcription of the other genes in the islet. RlrA has also been found to stimulate the transcription from its own promoter. The same study also suggested RlrA to be autoregulatory in that high level of the protein repress rlrA transcription by blocking the RNA polymerase binding site (Hava et al. 2003). The RlrA consensus binding sequence has been identified as a 13 base pair (bp) long sequence (AYNTTTTTATCAA), and two putative binding sites have been identified in the –36 to –76 region of the rrgA transcriptional start site (Hava et al. 2003). The same report also found RlrA binding sites within 70 bp upstream of transcriptional start sites in 14 promoter regions of other genes, suggesting that RlrA also regulates genes outside the pathogenicity islet. The predicted size of RlrA is 60 kD. There is evidence that another regulator PsaR represses rlrA-transcription in response to high levels of manganese ions (Mn2+). The level of Mn2+ is 1000-fold higher in secretions than in the lung or bloodstream, suggesting that Mn2+ can be an important cue for the bacteria in sensing its environment (Johnston et al. 2006). RlrA is believed to be homologous to the negative regulator Nra from Streptococcus pyogenes (Podbielski et al. 1999). The negative regulator MgrA has a predicted size of 59 kD and is encoded by the sp1880 gene located outside the rlrA-islet and represses transcription of the genes within the islet (Hemsley et al. 2003). MgrA is believed to be an orthologue of Mga, i.e. the genes have evolved from a common ancestral gene by speciation. Mga is a transcriptional activator of several virulence genes involved in the pathogenesis of S. pyogenes, and also activates transcription of its own repressor Nra. Many of the genes under the control of Mga encode surface-associated factors (Podbielski et al. 1996 & 1999, Hemsley et al. 2003). MgrA has been shown to be important for lung infection and nasopharyngeal colonisation in murine model (Hemsley et al. 2003).
6
The three subunits RrgA, RrgB and RrgC, encoded by the rlrA pathogenicity islet, have been shown to confer protection against lethal doses of S. pneumoniae in a murine model. Preliminary data from the same study also suggest that there is a cross-protective ability of pilus subunits between different S. pneumoniae strains (Gianfaldoni et al. 2007), which would make the pilus more effective as a vaccine target. Scope and context of this project A better understanding of the S. pneumoniae pilus, encoded by the rlrA pathogenicity islet, is needed to fully understand the importance of the pilus in the pathogenesis of the bacterium and its potential as vaccine target. Questions that need to be answered include how the pilus subunits are synthesised and localised to the cell wall, how the expression of the pilus associated genes are regulated and what mechanisms influence the regulation of pilus formation. Aims The main aim of this project was to set up an in vitro protocol to isolate and identify DNA-binding proteins in S. pneumoniae by affinity chromatography. Once a functioning protocol had been developed the project would focus on the identification of proteins that binds to the previously defined rrgA promoter region (Hava et al. 2003). The same report also found that RlrA binds within this sequence. The hope for this project was in part to verify this previous finding, as well as to identify other DNA-binding proteins interacting with the sequence. Data of the level of gene transcript, measured by qRT-PCR, (unpublished) had shown that RlrA exerted an influence at the chosen culturing conditions. If possible the project should give hints to the potential role any identified proteins might have in the regulation of rrgA transcription.
7
Results
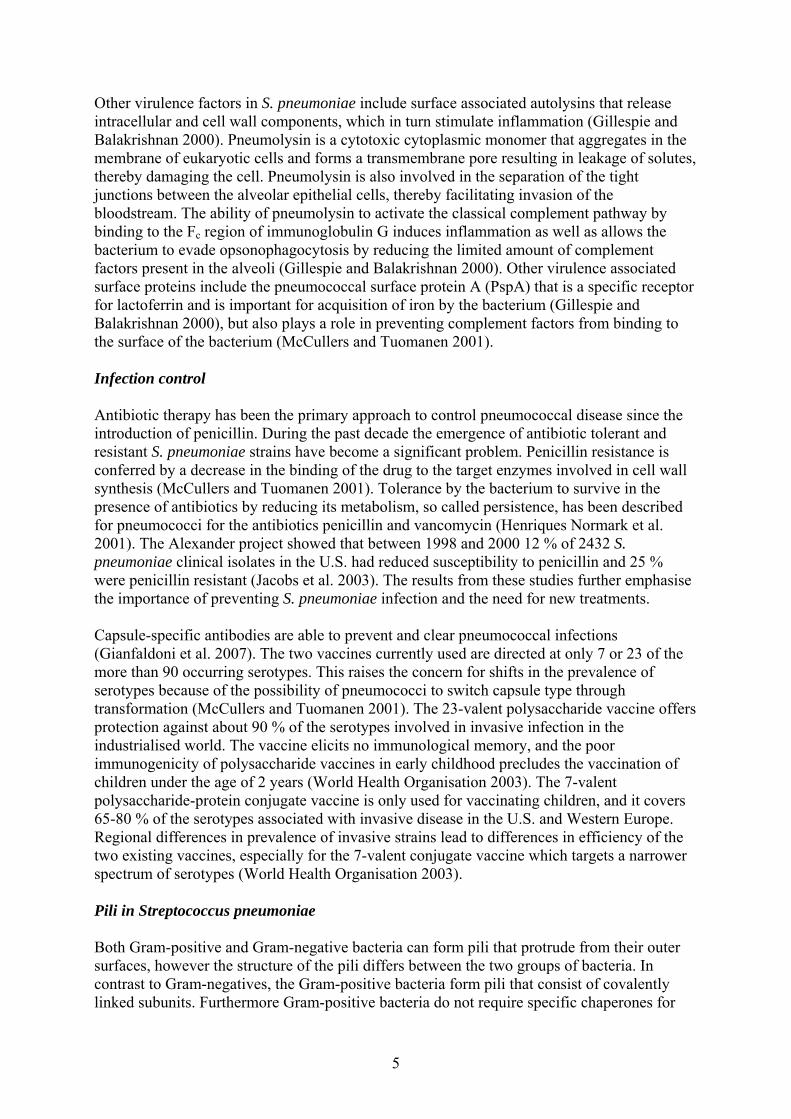
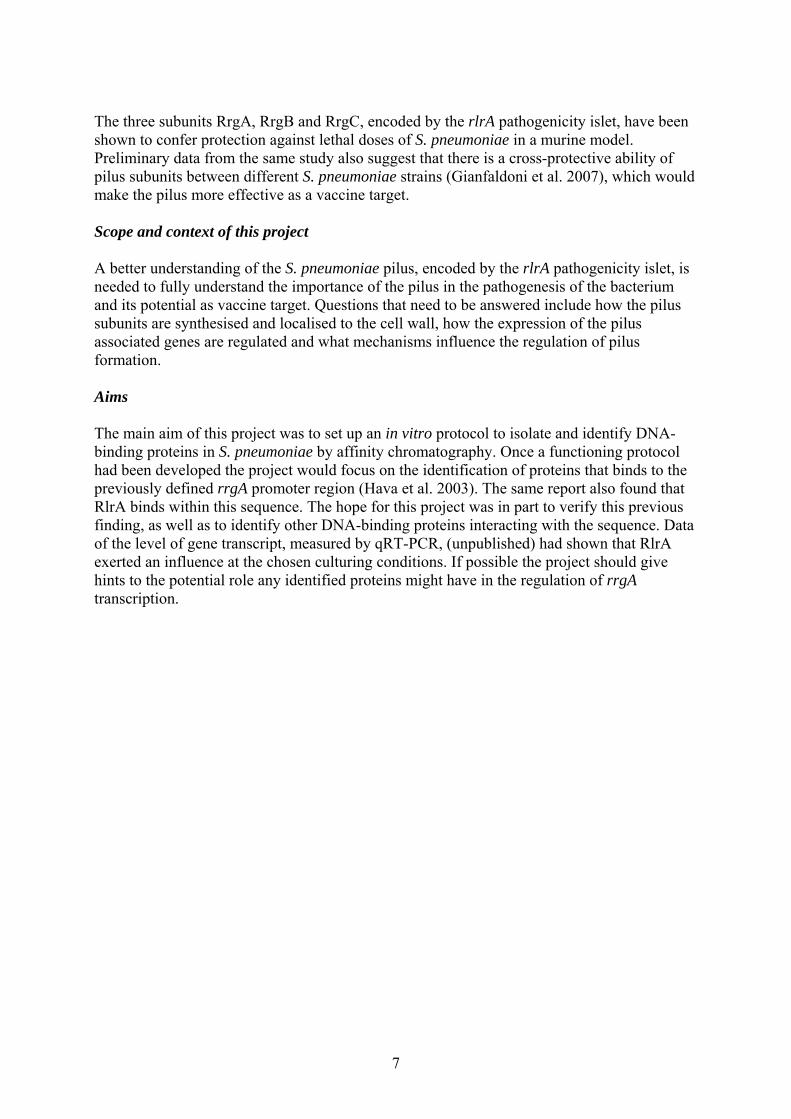
Preparing DNA for protein trapping Amplification The affinity chromatography approach to study the proteins that bind to the rrgA promoter involved the amplification of a ~140 bp sequence from S. pneumoniae serotype 4 strain TIGR4 (T4) with a biotinylated primer. The sequence is located immediately upstream of the rrgA transcriptional start site. The biotinylated fragments could then be bound to magnetic beads (Dynabeads®) coated with streptavidin. The complex would enable proteins binding to the region to be fished out from a S. pneumoniae T4 cell lysate. Initial attempts to amplify the rrgA promoter region by polymerase chain reaction (PCR) resulted in two products, the desired one with a size of ~140 bp and an undesired product with a size of approximately ~250 bp (data not shown). Attempts were made to increase the specificity of the amplification by increasing the annealing temperature and altering the MgCl2 concentration (1.5-5.0 mM), but this did not increase the specificity substantially. A nested PCR approach was employed without success, in which the primary reaction was 2 bp shorter than the secondary, thus creating a 2 bp overhang for the biotinylated primer in the secondary reaction. The reason for using a slightly shorter template to amplify with the biotinylated primer was to see if the specificity problem was caused by steric hindrance by the biotin and its linker region. When a new primer pair was used, AP6-biotin combination with Primer 1 (table 1), the problem with poor specificity in the amplification was greatly reduced. However, the use of this primer combination resulted in a marginally shorter region being amplified than the region used in the study published by Hava et al. (2003). Purification of PCR-products Several different purification kits were tested in order to rid the PCR product of unused primers and free biotin. When PCR samples with poor specificity were purified, most of the unwanted product was retained while the desired product was lost (data not shown). This was most likely because the length of the shorter, desired fragment was too close to the columns’ exclusion limits. The result did not vary markedly between the different purification kits used. Ethanol precipitation gave the same result as the commercial kits. To resolve the problem of unused primers outcompeting the amplification product when binding to the Dynabeads®, the number of cycles used in the PCR program was increased to 50. To reduce the risk of biotin detaching from the primer due to repeated freezing and thawing, the PCR amplified products were not frozen prior to use, but instead stored at 4º C. Fig. 1. Separation on a 1 % agarose
gel of DNA bound to Dynabeads®. M: DNA molecular weight marker IX. Lane 1 contained PCR amplified product with a size of 137 bp of the rrgA promoter region. Lane 2 contained boiled eluate from a binding experiment in which the same PCR product as in lane 1 was immobilised to Dynabeads®.
M 1 2
DNA bound to Dynabeads® To verify that PCR product was indeed bound to the Dynabeads® throughout the binding experiment, the Dynabeads® were boiled in wash buffer after the protein had been detached (eluted) by NaCl, The boiled sample was separated on an agarose gel and formed two
8
distinct bands with the sizes of ~450 and ~230 bp (fig. 1). These two bands were most likely DNA aggregates caused by the binding and extraction procedures. The gel separation showed that a reasonable amount of PCR product was bound to the Dynabeads® throughout the binding experiment. To confirm that the DNA bound to the Dynabeads® was indeed the amplified product, the DNA in the boiled eluate was sequenced. The sequence showed complete (100 %) similarity with the T4 genome sequence over a 66 bp region (438009-438074). Preparation of cytoplasmic protein extract Lysis methods Several different methods were tested to extract cytoplasmic proteins from S. pneumoniae and involved enzymatic and mechanical approaches. The enzymatic procedures (I-XVII, table 2) with the endolysins lysozyme and/or mutanolysin did not achieve detectable lysis regardless of the incubation time, temperature or with the addition of freeze-thaw cycles. The result of the procedures were evaluated by polyacrylamide gel electrophoresis (PAGE) separation and Coomassie® staining. Although this is not the most sensitive method of detecting proteins it should have been more than adequate to detect lysis. The supposed cell lysates from the enzymatic methods were indistinguishable from the respective lysis buffer. A further indication that the cultures were incompletely lysed was that precipitate formed when the lithium dodecyl sulphate (LDS) sample buffer was added to the sample. This precipitate was insoluble by vortexing or heating and did likely consist of intact cells and cell debris, such as insoluble petidoglycan, binding to the LDS. The mechanical shearing used in procedure XVIII (table 2) by vortexing the sample together with glass beads resulted in lysis of the cells. After five minutes of vortexing disintegrated bacteria could be observed in a light microscope. Still, a large portion of the bacteria in the suspension remained intact. Several more minutes of vigorous vortexing would have been required to obtain near complete lysis of the bacteria in the culture. This method was deemed to be too impractical to be scaled up to the volumes needed for hybridisation experiments.
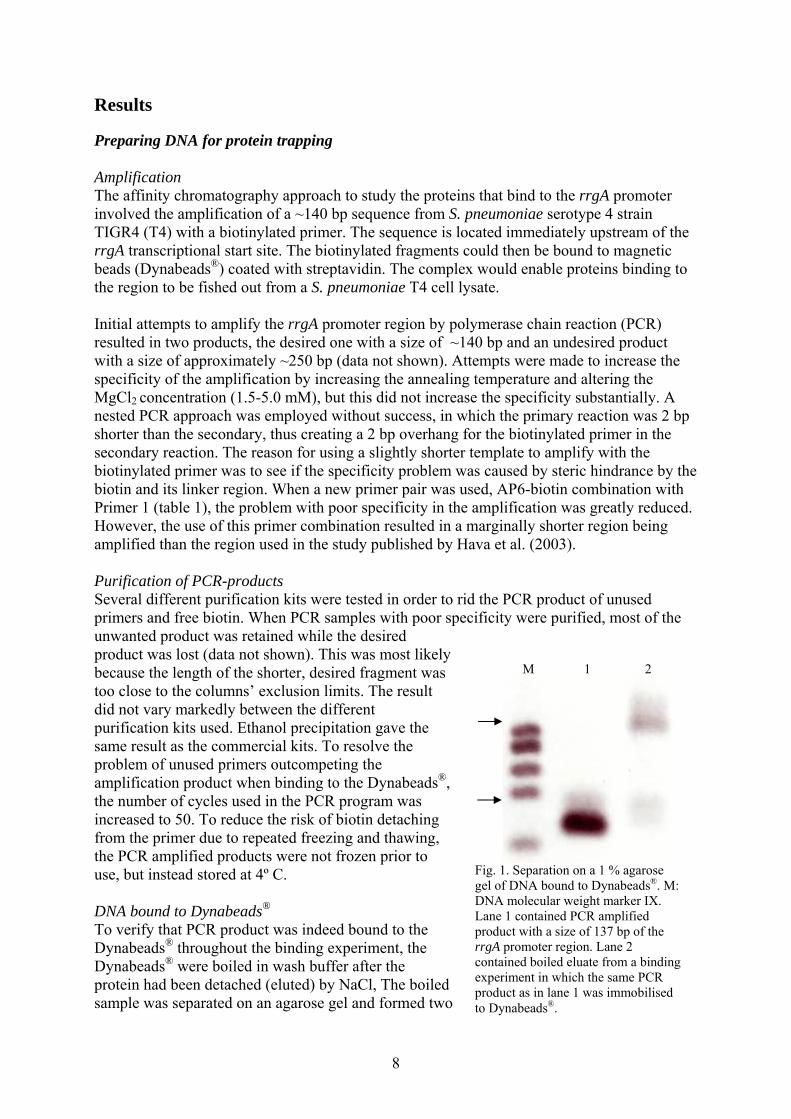
Cell lysates
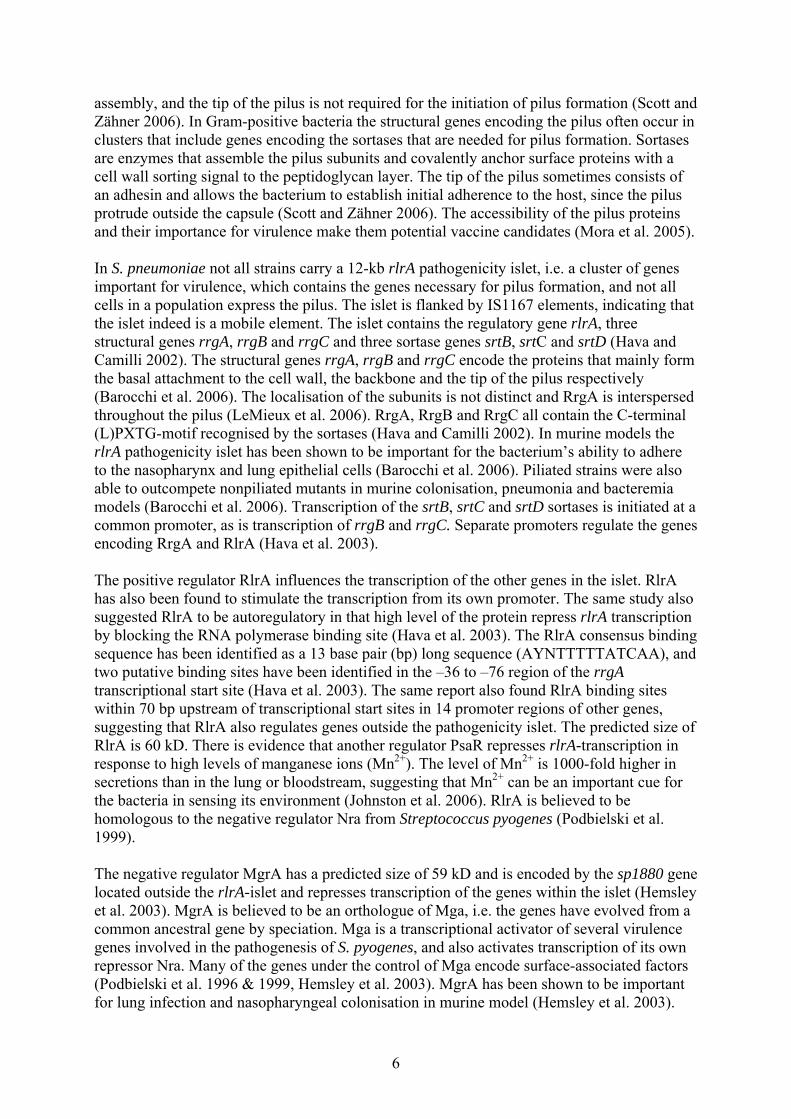
Fig. 2. Cell lysis using French Press. Detection of proteins in lysate by PAGE separation and Coomassie® staining. M: BenchMark™ Protein Standard. Lane 1: T4 wt. Lane 2: T4ΔrlrA. Lane 3: T4ΔmgrA.
M 1 2 3
Lysis by French press Mechanical shearing of the cells by pressure, using a French press, was the method chosen for extraction of cytoplasmic proteins. The method resulted in high quantitative lysis with a minimum of protein degradation (fig. 2) and without the need to add proteins during the extraction procedure. Added proteins could complicate the interpretation of the data in subsequent analysis steps by increasing the level of background. Enriching for proteins binding to target DNA The PCR fragments coupled to Dynabeads® were incubated with cytoplasmic cell extract. The Dynabeads® were separated from the suspension and proteins bound to the DNA were eluted stepwise with increasing concentrations of NaCl and finally boiling of the
9
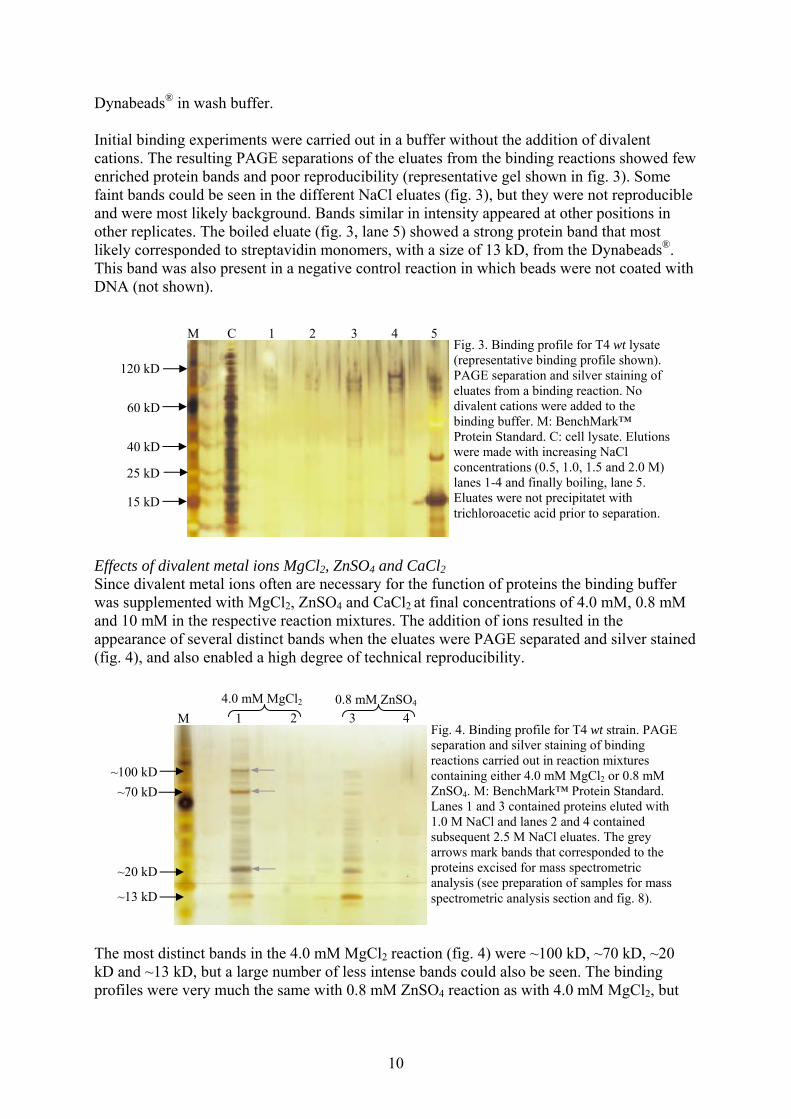
Dynabeads® in wash buffer. Initial binding experiments were carried out in a buffer without the addition of divalent cations. The resulting PAGE separations of the eluates from the binding reactions showed few enriched protein bands and poor reproducibility (representative gel shown in fig. 3). Some faint bands could be seen in the different NaCl eluates (fig. 3), but they were not reproducible and were most likely background. Bands similar in intensity appeared at other positions in other replicates. The boiled eluate (fig. 3, lane 5) showed a strong protein band that most likely corresponded to streptavidin monomers, with a size of 13 kD, from the Dynabeads®. This band was also present in a negative control reaction in which beads were not coated with DNA (not shown).
Effects of divalent metal ions MgCl2, ZnSO4 and CaCl2Since divalent metal ions often are necessary for the function of proteins the binding buffer was supplemented with MgCl2, ZnSO4 and CaCl2
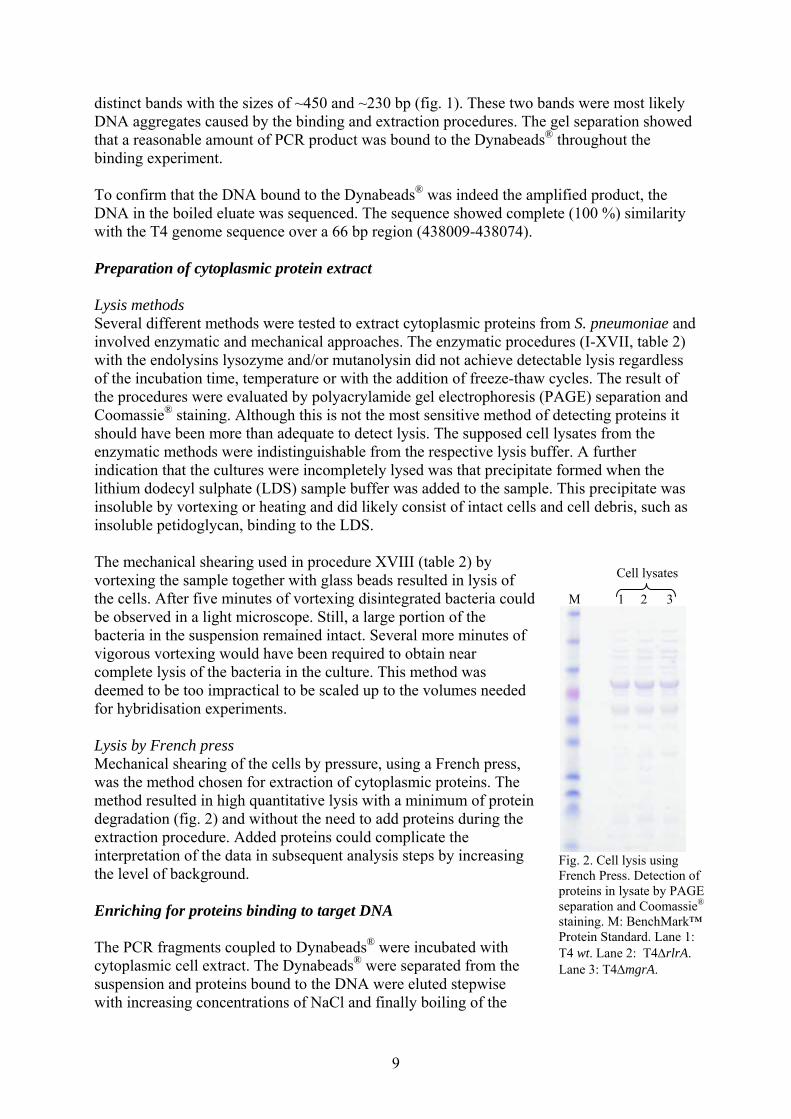
at final concentrations of 4.0 mM, 0.8 mM and 10 mM in the respective reaction mixtures. The addition of ions resulted in the appearance of several distinct bands when the eluates were PAGE separated and silver stained (fig. 4), and also enabled a high degree of technical reproducibility.
The most distinct bands in the 4.0 mM MgCl2 reaction (fig. 4) were ~100 kD, ~70 kD, ~20 kD and ~13 kD, but a large number of less intense bands could also be seen. The binding profiles were very much the same with 0.8 mM ZnSO4 reaction as with 4.0 mM MgCl2, but
~100 kD ~70 kD
~20 kD ~13 kD
40.8 mM ZnSO4
Fig. 4. Binding profile for T4 wt strain. PAGE separation and silver staining of binding reactions carried out in reaction mixtures containing either 4.0 mM MgCl2 or 0.8 mM ZnSO4. M: BenchMark™ Protein Standard. Lanes 1 and 3 contained proteins eluted with 1.0 M NaCl and lanes 2 and 4 contained subsequent 2.5 M NaCl eluates. The grey arrows mark bands that corresponded to the proteins excised for mass spectrometric analysis (see preparation of samples for mass spectrometric analysis section and fig. 8).
31 2 M 4.0 mM MgCl2
Fig. 3. Binding profile for T4 wt lysate (representative binding profile shown). PAGE separation and silver staining of eluates from a binding reaction. No divalent cations were added to the binding buffer. M: BenchMark™ Protein Standard. C: cell lysate. Elutions were made with increasing NaCl concentrations (0.5, 1.0, 1.5 and 2.0 M) lanes 1-4 and finally boiling, lane 5. Eluates were not precipitatet with trichloroacetic acid prior to separation.
M C 1 2 3 4 5
120 kD
60 kD
40 kD
25 kD
15 kD
10
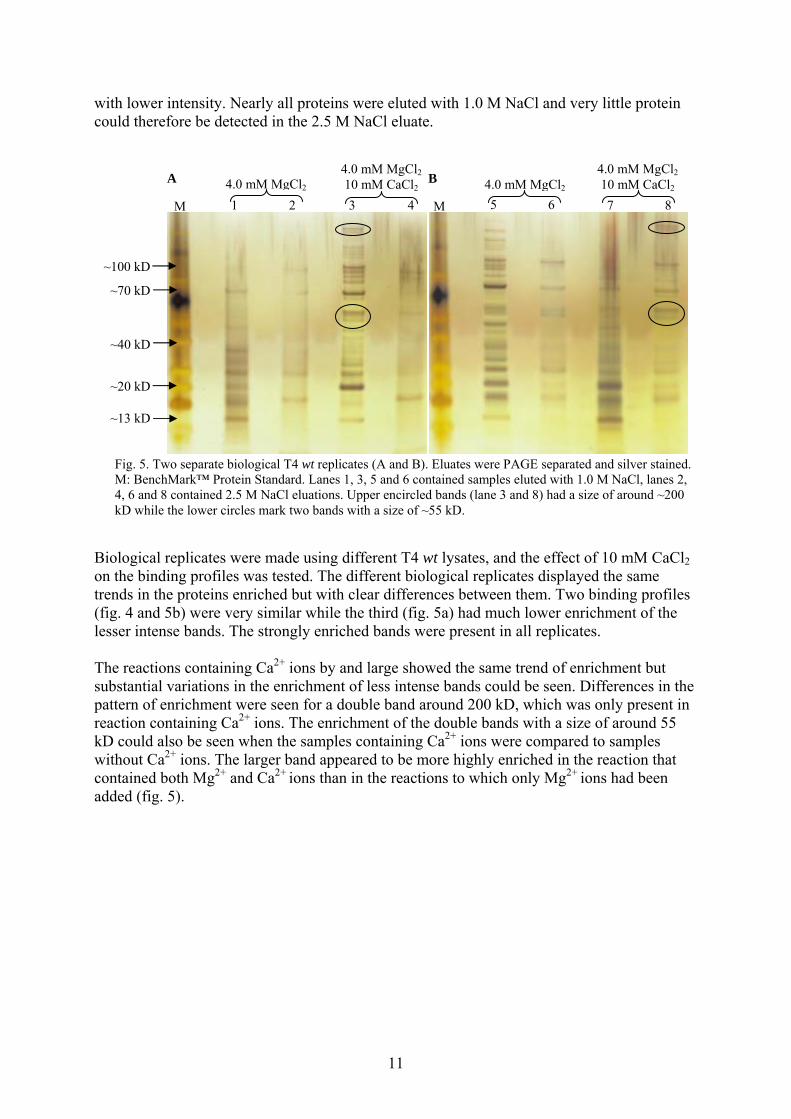
with lower intensity. Nearly all proteins were eluted with 1.0 M NaCl and very little protein could therefore be detected in the 2.5 M NaCl eluate.
A
Biological replicates were made using different T4 wt lysates, and the effect of 10 mM CaCl2 on the binding profiles was tested. The different biological replicates displayed the same trends in the proteins enriched but with clear differences between them. Two binding profiles (fig. 4 and 5b) were very similar while the third (fig. 5a) had much lower enrichment of the lesser intense bands. The strongly enriched bands were present in all replicates. The reactions containing Ca2+ ions by and large showed the same trend of enrichment but substantial variations in the enrichment of less intense bands could be seen. Differences in the pattern of enrichment were seen for a double band around 200 kD, which was only present in reaction containing Ca2+ ions. The enrichment of the double bands with a size of around 55 kD could also be seen when the samples containing Ca2+ ions were compared to samples without Ca2+ ions. The larger band appeared to be more highly enriched in the reaction that contained both Mg2+ and Ca2+ ions than in the reactions to which only Mg2+ ions had been added (fig. 5).
M 1 2 3 4 M
B
5 6 7 84.0 mM MgCl2 4.0 mM MgCl2
Fig. 5. Two separate biological T4 wt replicates (A and B). Eluates were PAGE separated and silver stained. M: BenchMark™ Protein Standard. Lanes 1, 3, 5 and 6 contained samples eluted with 1.0 M NaCl, lanes 2, 4, 6 and 8 contained 2.5 M NaCl eluations. Upper encircled bands (lane 3 and 8) had a size of around ~200 kD while the lower circles mark two bands with a size of ~55 kD.
4.0 mM MgCl2 10 mM CaCl2
4.0 mM MgCl2 10 mM CaCl2
~100 kD
~70 kD
~40 kD
~20 kD
~13 kD
11

Binding profiles of deleted strains T4ΔrlrA and T4ΔmgrA The binding profiles of the mutant strains T4ΔrlrA (fig. 6 and 7) and T4ΔmgrA (fig. 7) were very similar to those of the T4 wt strain. Three biological replicates were made with the T4ΔrlrA strain and one hybridisation reaction was performed with T4ΔmgrA. The two T4ΔrlrA replicates in figure 6 were practically identical. The third T4ΔrlrA replicate (fig. 7) showed the same general pattern for the most highly enriched bands as the other two experiments, but since the overall intensity of the gel was much lower compared to the gel in figure 6 the less enriched bands were not visible. The mutant strains T4ΔrlrA and T4ΔmgrA had practically identical binding profiles (fig. 7) in the binding experiments with Mg2+ ions.
Preparation of samples for mass spectrometric analysis Four replicate reactions with the same lysate as used in the binding reaction in figure 4 were pooled for mass spectrometric analysis. The proteins were eluted with 1.0 M NaCl after which the Dynabeads® were boiled in wash buffer and then in LDS for 10 min. The NaCl eluates were precipitated with trichloroacetic acid (TCA) and pooled. The NaCl and LDS eluted samples were separated by PAGE and Coomassie® stained. Two bands were visible in the
Fig. 6. Binding profiles for T4ΔrlrA lysate, two biological replicates, PAGE separated and silver stained. M: BenchMark™ Protein Standard. Lanes 1 and 3 contained samples eluted with 1.0 M NaCl, lanes 2 and 4 contained samples eluted with 2.5 M NaCl.
M 1 2 3 4
4.0 mM MgCl2 4.0 mM MgCl2
~100 kD
~70 kD
~40 kD
~20 kD
~13 kD
Fig. 7. Silver stained PAGE gel of binding profiles for T4ΔrlrA and T4ΔmgrA strains carried out with 4.0 mM MgCl2. M: BenchMark™ Protein Standard. Lanes 1 and 3 contained samples eluted with 1.0 M NaCl, lanes 2 and 4 contained samples eluted with 2.5 M NaCl.
~100 kD
~70 kD
~40 kD
~20 kD
~13 kD
1 2 3 4
T4ΔrlrA 4.0 mM MgCl2
T4ΔmgrA 4.0 mM MgCl2
M
12
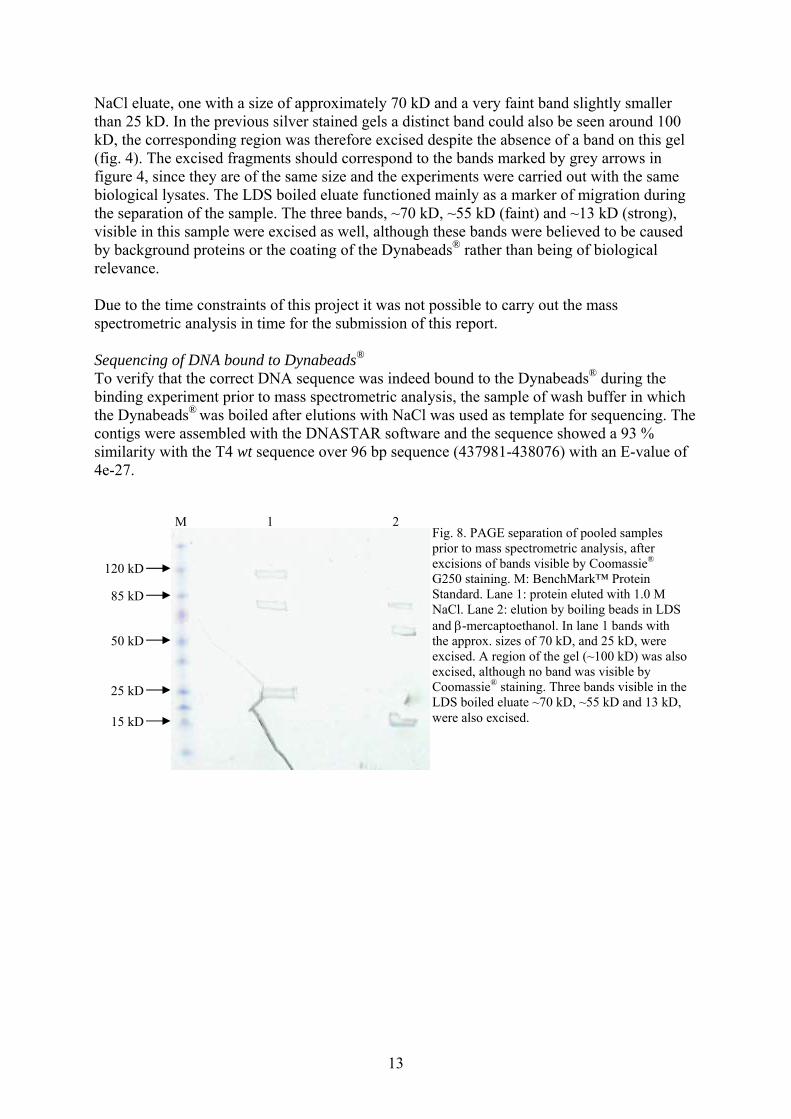
NaCl eluate, one with a size of approximately 70 kD and a very faint band slightly smaller than 25 kD. In the previous silver stained gels a distinct band could also be seen around 100 kD, the corresponding region was therefore excised despite the absence of a band on this gel (fig. 4). The excised fragments should correspond to the bands marked by grey arrows in figure 4, since they are of the same size and the experiments were carried out with the same biological lysates. The LDS boiled eluate functioned mainly as a marker of migration during the separation of the sample. The three bands, ~70 kD, ~55 kD (faint) and ~13 kD (strong), visible in this sample were excised as well, although these bands were believed to be caused by background proteins or the coating of the Dynabeads® rather than being of biological relevance. Due to the time constraints of this project it was not possible to carry out the mass spectrometric analysis in time for the submission of this report. Sequencing of DNA bound to Dynabeads®
To verify that the correct DNA sequence was indeed bound to the Dynabeads® during the binding experiment prior to mass spectrometric analysis, the sample of wash buffer in which the Dynabeads® was boiled after elutions with NaCl was used as template for sequencing. The contigs were assembled with the DNASTAR software and the sequence showed a 93 % similarity with the T4 wt sequence over 96 bp sequence (437981-438076) with an E-value of 4e-27.
Fig. 8. PAGE separation of pooled samples prior to mass spectrometric analysis, after excisions of bands visible by Coomassie® G250 staining. M: BenchMark™ Protein Standard. Lane 1: protein eluted with 1.0 M NaCl. Lane 2: elution by boiling beads in LDS and β-mercaptoethanol. In lane 1 bands with the approx. sizes of 70 kD, and 25 kD, were excised. A region of the gel (~100 kD) was also excised, although no band was visible by Coomassie® staining. Three bands visible in the LDS boiled eluate ~70 kD, ~55 kD and 13 kD, were also excised.
120 kD
85 kD
50 kD
25 kD
15 kD
M 1 2
13
Discussion
Immobilisation of rrgA promoter fragments to Dynabeads®
The initial primers used for the amplification of the rrgA promoter region generated an unspecific product. The specificity of the amplification could not be sufficiently increased by modifying the PCR protocol or program or by employing a nested PCR approach. However, the problems with specificity was abolished when the biotinylation was shifted from the reverse to the forward primer and the unbiotinylated reverse primer used in the nested PCR (Primer 1) was used as reverse primer (for primer sequences see table 1). This strongly suggests that at least one of the initial primers was incorrectly manufactured. The used AP6-biotin & Primer 1 combination resulted in the amplification of a DNA sequence 2 bp shorter than the sequence described by Hava et al. (2003). The inability to purify the PCR products did most likely lead to a reduction in the amount of DNA immobilised to the beads, by outcompetition by free biotin and unused primers present in the reaction mixture, although measures were taken to reduce this problem. If a good method of purifying the PCR product could be found it would likely give a higher enrichment and therefore better detection in the binding experiment. Cell lysis No lysis with enzymatic methods Several different lysis protocols, which used either enzymatic or mechanical approaches, were tested before a functioning protocol could be found. The enzymatic methods involved high concentrations of lysozyme and mutanolysin solely or in combination. Neither lysozyme nor mutanolysin, alone or in combination, caused lysis of the bacteria under the tested conditions. The differences in incubation temperatures, 4º C or 37º C, did not seem to have any effect nor did the subsequent freeze-thaw cycles present in some of the protocols. The absence of lysis was surprising since similar protocols are published for Streptococcus ssp. but with lower concentrations of enzyme. A mutanolysin concentration of 150 U/ml is described to lyse S. pneumoniae (Encheva et al. 2006) and 75 U/ml S. pyogenes (Gryllos et al. 2003), but unlike the protocols used in this study no ethylenediamine-tetraacetic acid (EDTA) was present in the respective lysis buffers. EDTA is used at high concentration (100 mM) together with lysozyme (1 mg/ml) and mutanolysin (5-7 U/ml) in other lysis protocols for Streptococcus ssp. (Stanley et al. 1995, Elliott et al. 1998), although these protocols call for overnight incubation. Since mutanolysin, lysozyme and EDTA can be used in combination the chelating property of EDTA should not interfere with the lysis of the bacteria. The n-Octylglucoside or Triton X-100 (both non-ionic detergents) lysis buffers did not lyse the bacteria. That none of the tested enzymatic methods succeeded in lysing the bacteria is perplexing especially since a lysozyme concentration of 20 mg/ml was sufficient to extract genomic DNA from S. pneumoniae grown on blood agar plates. There is no apparent reason as to why the enzymatic lysis methods failed in this project but succeeded under similar conditions and with closely related organisms. Mechanical methods achieved lysis The two protocols that achieved detectable lysis of the cells were vortexing with glass beads and French pressing. Both these methods use mechanical shearing to disrupt the cells but only the French press was deemed practical on the desired scale. The French press had the advantage over the enzymatic methods of not involving the addition of protein, which could potentially obscure the binding profile by increasing the level of background.
14
Binding experiments The overall consistency in the enrichment of proteins in binding experiments carried out under the same conditions clearly showed that the used protocol offers a high degree of reproducibility. The general pattern of enrichment in comparable binding profiles are strikingly similar and the differences were not larger than expected by the variations inevitably found between biological replicates. Ions greatly influenced enrichment From the binding experiments it was evident that cations were essential in order to hybridise proteins to the DNA. This was not surprising since many proteins depend on the coordination of ions for stability. Some differences in the binding profiles could be seen depending on the ion content of the binding buffer. Experiments with MgCl2 and ZnSO4 looked strikingly similar indicating either that these ions to some extent could substitute for one another or that a certain ion concentration, regardless of the type of ion, was needed for the proteins to bind. Differences in the intensities of the gels in experiments with either Mg2+ or Zn2+ could be explained by a five-fold difference in the concentration of these ions. There were some differences in the proteins enriched between the experiments with either Mg2+ ions or Mg2+ and Ca2+ ions. The differences were most clear for a double band around 200 kD that was visible only in experiments with Ca2+ ions, and a difference in the level of enrichment of a band with a size of around 55 kD (fig. 5). These findings were consistent in biologically separate experiments and seem to be relevant, but since the proteins have not been identified the biological importance of these findings are not clear. The binding profiles with Mg2+ or Mg2+ and Ca2+ ions showed approximately a dozen clearly defined bands, since they were consistently enriched they can hardly be contributed to background. About half of these bands were distinct and fairly intense and would therefore be prime candidates for mass spectrometric identification to elucidate if they have a potential role in the regulation of rrgA. No difference in binding profiles for strains T4 wt, T4ΔrlrA and T4ΔmgrA No differences in the enriched proteins could be observed when the binding profile for T4 wt was compared to the profiles for the deletion strains T4ΔrlrA and T4ΔmgrA. In the case of the T4ΔmgrA strain this was not totally unexpected since it is not known if MgrA binds to the rrgA promoter sequence. The data from the measuring of steady-state mRNA levels by qRT-PCR (unpublished) was inconclusive as to whether MgrA exerts an influence on rrgA transcription under the present culturing conditions. Since RlrA is known to bind to the amplified DNA region (Hava et al. 2003) one would have expected to see a band present in the binding profile for the T4 wt strain that was absent in the profile for the T4ΔrlrA strain. A regulator can exert an influence on transcription, even if it is present only in minute amounts. Therefore proteins co-migrating at the same rate could mask a band consisting of RlrA. It is also possible that the conditions used in the binding experiments were not the right to permit RlrA to bind to the DNA. However, this is not very likely since the binding conditions used were similar to those used in a previously reported RlrA footprinting assay (Hava et al. 2003) Preparations for mass spectrometric analysis The bands excised for mass spectrometric analysis from the gel (fig. 8) most likely correspond to the intense bands marked by grey arrows in figure 4. These bands were present in the other binding profiles as well. As for the excision made around 100 kD that was a chance taken to see whether or not protein corresponding to the strong band in figure 4 could be identified. The relatively few bands visible in figure 8 could be explained by the high detection limit of
15

the Coomassie® stain, additional bands should appear if a higher number of binding reactions were pooled. The sequencing data of the boiled eluate from the reaction is a very strong indication of that the correct DNA sequence was bound to the Dynabeads®. Since the individual enriched proteins have not been identified in this study it was not possible to deduce their function and speculate whether they play a role or not in the regulation of transcription. Future prospects Many questions remain concerning the identities and roles of the proteins consistently enriched with this affinity chromatography approach. To identify these proteins one needs to pool a larger number of reactions and thus increase the amount of protein and enable detection by Coomassie® staining. A two-dimensional gel separation could help to clarify if RlrA is enriched in the T4 wt strain but obscured by a co-migrating protein or not. Since two-dimensional gel separations tend to be more sensitive to high salt concentrations than one-dimensional gels, the NaCl added to elute the proteins could cause problems. To circumvent this problem additional washing steps to remove salt could be introduced or a different method of eluting the proteins (such as lowering pH or using urea) could be used. If RlrA cannot be detected by two-dimensional gel separation one should review the conditions used in the binding experiments and for culturing the bacteria. The rlrA pathogenicity islet generates four transcripts, rlrA, rrgA, rrgBC and srtBCD an organisation that suggests differential regulation of the transcription from the different promoters. Therefore, it would be interesting to correlate the binding profiles of the different promoters with the steady-state mRNA levels of the transcripts as measured by qRT-PCR.
16
Materials and methods
Strains and media Strains Streptococcus pneumoniae strain TIGR4 (T4); also referred to as T4 wt Streptococcus pneumoniae strain T4ΔrlrA; mutant deficient for the RlrA positive regulator Streptococcus pneumoniae strain T4ΔmgrA; mutant deficient for the MgrA negative regulator Blood agar plates were prepared by Karolinska Laboratoriet, Sweden from Colombia Blood agar base svenska labfab CO3-111 4 % (w/v), L-tryptophan 0.1 % and defibrinated horse blood 7.5 %. Todd Hewitt broth supplemented with 0.5 % yeast extract (THY), Karolinska Laboratoriet, Sweden. The medium contained 50 % (w/v) bovine heart infusion, 2 % (w/v) neopeptone, 0.2 % (w/v) dextrose, 0.2 % (w/v) NaCl, 0.04 % (w/v) K2PO4 and 0.25 % (v/w) Na2CO3, pH 7.8 ± 0.2. Culturing of Streptococcus pneumoniae Bacteria were grown for 16 hours on blood agar plates in 37º C, 5 % CO2, 25 % relative humidity, and then resuspended in 50 ml of THY-medium to an optical density at wavelength 620 nm (OD620) of 0.05. The cells were grown to exponential phase OD620 ~0.4-0.5 measured using a Genesys 20 spectrophotometer (ThermoSpectronic). The culture was then centrifuged for 10 min at 2 700g and 4º C. The pellet was stored at –75º C. Primers Table 1: the primers were adopted form Hava et al. (2003)
Primer Sequence 5'-3' Modifications AP6 ATG AGT ATT GGT GGA GTT TAA Primer 1 ACT ATC CTA GTA TAA ATT AAA ACA A AP6-biotin ATG AGT ATT GGT GGA GTT TAA 5' biotinylation AP4 TAA CTA TCC TAG TAT AAA TTA AAA C 5' biotinylation Primers AP6, AP4 and Primer 1 were purchased from TAG Copenhagen A/S while primer AP6-Biotin was purchased from MWG Biotech. Biotin coupled primers were High Performance Liquid Chromatography (HPLC) purified by the respective manufacturer. DNA extraction Chromosomal DNA was extracted from the S. pneumoniae strain T4 grown on blood agar plates at 37º C, 5 % CO2, 25 % relative humidity. For extraction the illustra™ GFX™ Genomic Blood DNA Purification Kit (GE Healthcare) was used according to the manufacturer’s instructions. The quality of the extracted DNA was verified by separation on a 1 % agarose, SeaKem® LE agarose (Cambrex) or NuSieve® 3:1 agarose (Cambrex), gel at 100 V for ~40 min in TBE buffer (1.08 % TRIS-base, 0.55 % H3BO3 and 20 mM EDTA pH 8.0, Karolinska Laboratoriet, Sweden). 1:7 or 2:7 of 6x loading buffer (60 % sucrose, 0.25 %
17

Bromophenol blue (Merck), 0.25 % Xylene cyanol (Sigma)) was added to the samples. The gel was stained using GelRed™ (Biotium Inc.). PCR protocol and program The PCR protocol was optimised with respect to MgCl2 concentration and annealing temperature. The DNA was amplified in a 5 μl reaction with reagents from Qiagen according to the following protocol; 1x PCR Buffer, 3 mM MgCl2, 0.2 mM dNTP mix, 0.2 μM of primer AP6-biotin, 0.2 μM of Primer 1, 1 μl DNA template, 2.5 U Taq-polymerase. Program used; 95º C 5min, 50 cycles of 95º C for 30 sec, 51º C for 30 sec, 72º C for 20 sec and ending with a 5 min post dwell at 72º C. The high number of cycles served to deplete the reaction mixture of free biotinylated primers. PCR products were prepared, separated by gel electrophoresis and stained as described above. As a size standard the DNA molecular weight marker IX (Roche) was used. DNA concentration was measured using a NanoDrop® ND-1000 at λ 230 nm. Purification of PCR products Several attempts were made to purify the biotinylated PCR products using the following kits according to the instructions from the respective manufacturer; Illustra™ DNA & Gel band purification kit (GE) Qiaquick® gel extraction kit (QIAGEN) Chroma spin™+TE-100 columns (Clontech) Purification by precipitation in ethanol was also attempted. 0.1 volumes of 3 M Na-acetate and two volumes of –20º C ethanol were added to the PCR-product. The sample was stored at –75º C for 15 min and then centrifuged at 5 000g for 15 min at 4º C. The supernatant was discarded and the pellet was washed in 750 μl of 70 % ethanol. The sample was centrifuged at 5 000g for 15 min at 4º C, the supernatant was removed and the pellet air-dried before being dissolved in one volume of sH2O. Protein extraction tests Most protocols were modifications of the protocol for the “preparation of cytosolic protein extracts” described by Oscarsson et al. (2005) but modified versions of the protocols described by Gryllos et al. (2003) and Enscheva et al. (2006) were also used. Extraction I using lysozyme (20 mg/ml) Cells were cultured as described above but at 37º C and with the addition that the pellet was frozen at - 20º C for 1 hr. The pellet was then dissolved in 10 ml of binding buffer (20 mM Tris-HCl pH 7.5, 5 mM MgCl2, 0.1 M EDTA, 5 % glycerol), supplemented with 20 mg/ml lysozyme (Sigma). The suspension was incubated at 4º C for 1 hr, frozen at -75º C for 1 hr, thawed at 4º C and stored at -75º C over night. The pellet was thawed at 4º C and 6 ml of binding buffer, supplemented with KCl to a final concentration of 1.3 M in 16 ml volume, was added. The suspension was incubated on ice for 40 min and subsequently treated with RNase A (10 μg/ml) and DNase I (5 U) and incubated for 30 min at RT. Cell debris was removed by centrifugation at 100 000g for 20 min at 9º C. The supernatant was dialysed using a Spectra/Por molecular porous membrane (Spectrum) with molecular weight cut off 3 kD, over night against water at 4º C. The dialysis resulted in large increase in volume of the sample, and was therefore continued for 8 hrs using a Spectra/Por molecular porous
18
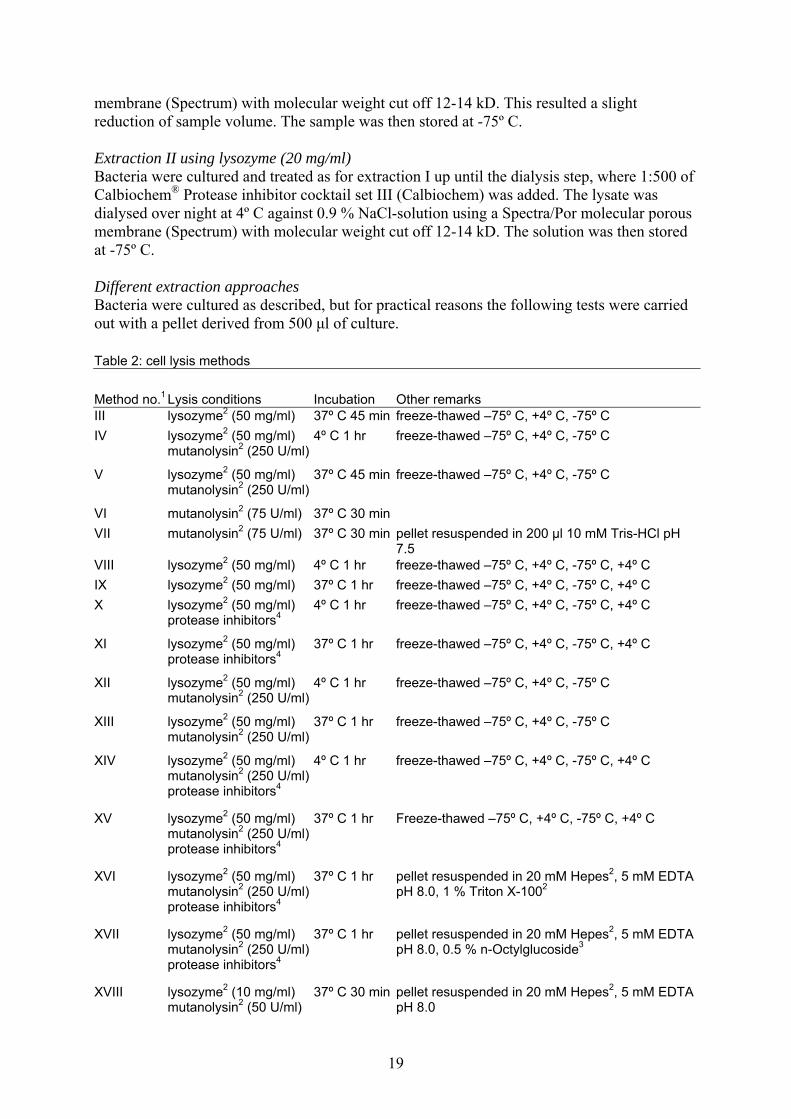
membrane (Spectrum) with molecular weight cut off 12-14 kD. This resulted a slight reduction of sample volume. The sample was then stored at -75º C. Extraction II using lysozyme (20 mg/ml) Bacteria were cultured and treated as for extraction I up until the dialysis step, where 1:500 of Calbiochem® Protease inhibitor cocktail set III (Calbiochem) was added. The lysate was dialysed over night at 4º C against 0.9 % NaCl-solution using a Spectra/Por molecular porous membrane (Spectrum) with molecular weight cut off 12-14 kD. The solution was then stored at -75º C. Different extraction approaches Bacteria were cultured as described, but for practical reasons the following tests were carried out with a pellet derived from 500 μl of culture. Table 2: cell lysis methods Method no.1 Lysis conditions Incubation Other remarks III lysozyme2 (50 mg/ml) 37º C 45 min freeze-thawed –75º C, +4º C, -75º C IV lysozyme2 (50 mg/ml)
mutanolysin2 (250 U/ml) 4º C 1 hr freeze-thawed –75º C, +4º C, -75º C
V lysozyme2 (50 mg/ml) mutanolysin2 (250 U/ml)
37º C 45 min freeze-thawed –75º C, +4º C, -75º C
VI mutanolysin2 (75 U/ml) 37º C 30 min VII mutanolysin2 (75 U/ml) 37º C 30 min pellet resuspended in 200 μl 10 mM Tris-HCl pH
7.5 VIII lysozyme2 (50 mg/ml) 4º C 1 hr freeze-thawed –75º C, +4º C, -75º C, +4º C IX lysozyme2 (50 mg/ml) 37º C 1 hr freeze-thawed –75º C, +4º C, -75º C, +4º C X lysozyme2 (50 mg/ml)
protease inhibitors44º C 1 hr freeze-thawed –75º C, +4º C, -75º C, +4º C
XI lysozyme2 (50 mg/ml) protease inhibitors4
37º C 1 hr freeze-thawed –75º C, +4º C, -75º C, +4º C
XII lysozyme2 (50 mg/ml) mutanolysin2 (250 U/ml)
4º C 1 hr freeze-thawed –75º C, +4º C, -75º C
XIII lysozyme2 (50 mg/ml) mutanolysin2 (250 U/ml)
37º C 1 hr freeze-thawed –75º C, +4º C, -75º C
XIV lysozyme2 (50 mg/ml) mutanolysin2 (250 U/ml) protease inhibitors4
4º C 1 hr freeze-thawed –75º C, +4º C, -75º C, +4º C
XV lysozyme2 (50 mg/ml) mutanolysin2 (250 U/ml) protease inhibitors4
37º C 1 hr Freeze-thawed –75º C, +4º C, -75º C, +4º C
XVI lysozyme2 (50 mg/ml) mutanolysin2 (250 U/ml) protease inhibitors4
37º C 1 hr pellet resuspended in 20 mM Hepes2, 5 mM EDTA pH 8.0, 1 % Triton X-1002
XVII lysozyme2 (50 mg/ml) mutanolysin2 (250 U/ml) protease inhibitors4
37º C 1 hr pellet resuspended in 20 mM Hepes2, 5 mM EDTA pH 8.0, 0.5 % n-Octylglucoside3
XVIII lysozyme2 (10 mg/ml) mutanolysin2 (50 U/ml)
37º C 30 min pellet resuspended in 20 mM Hepes2, 5 mM EDTA pH 8.0
19
1 All trials were conducted with a pellet derived from 500 μl cell culture resuspended in 100 μl buffer A unless otherwise stated. 2 Sigma 3 Roche diagnostics 4 Calbiochem® Protease inhibitor cocktail set III (1:100) (Calbiochem) For method XVIII a volume, equal to the pellet, of sterile glass beads was added and vortexed vigorously. At regular intervals a sample was taken out an evidence of lysis was observed through a Zeiss light microscope with 100 times of magnification 60 μl of binding buffer supplemented with KCl to a final concentration of 1.3 M was added to the samples. The samples were then incubated on ice for 40 min after which suspension was centrifuged for 5 000g and 30 min at 4º C. The samples were then stored at -75º C. Samples XVI and XVII were centrifuged at 16 000g for 3 min and supernatant was stored at -75º C. Protein extraction French press protocol The pellet was thawed on ice and dissolved in 3 ml of Cell lysis buffer (20 mM Tris-HCl, pH 7.5, 5 mM EDTA and 1:500 dilution of Calbiochem® Protease inhibitor cocktail set III (Calbiochem)). The suspension was pressed using a French® pressure mini-cell (SLM Instruments Inc.) 1000 psi 2-3 times to obtain a clear lysate. In order to remove cell debris, the lysate was centrifuged at 100 000g for 30 min at 4º C. The supernatant was divided into aliquots and stored at –75º C. Protein concentration and quality of extract The concentration of the protein extract was estimated using the Bio-Rad protein assay (Bio-Rad) according to the manufacturer’s instructions and using a bovine serum albumin (BSA) standard curve, The absorbance at λ595 nm was measured with an Ultrospec 100 spectrophotometer (Pharmacia Biotech) and varied between 0.7-1.2 mg/ml. The quality of the protein extract was assured by LDS-PAGE (lithium dodecyl sulphate polyacrylamide gel electrophoresis) separation (see below). Protein-DNA binding reaction The protocol was adopted from Oscarsson et al. (2005). 2 mg of Streptavidin coated Dynabeads® M-280 (Dynal) was washed 3 times in 2x B&W buffer (10 mM Tris-HCl pH 7.5, 1 mM EDTA and 2.0 mM NaCl). The beads were coated with ~4 μg of PCR product for 15 min in 800 μl 1x B&W buffer and subsequently washed 3 times in 1x B&W buffer. The beads were incubated with 100 μl of protein extract in 400 μl of binding buffer (10 mM Tris-HCl pH 7.5, 0.1 mM EDTA, 0.1 mM dithiothreitol (DTT), 5 mM NaCl, 5 % glycerol) containing 1 μg of poly-dI-dC (Sigma)) for 30 min. Where stated salts of divalent cations were added to the binding buffer: MgCl2 to 5.0 mM, ZnSO4 to 1.0 mM and CaCl2 to 12.5 mM. The beads were washed four times in wash buffer (10 mM Tris-HCl pH 7.5, 1 mM EDTA, 1 mM DTT, 5 mM NaCl, 5 % glycerol), the first two washes supplemented with 0.5 μg/ml salmon sperm DNA (Sigma). Elutions were made stepwise in wash buffer with increasing NaCl concentrations (0.5, 1.0, 1.5 and 2.0 M or 1.0 and 2.5 M) after which the Dynabeads® were boiled in wash buffer and the eluate was kept while the Dynabeads® were
20
boiled in wash buffer containing LDS and β-mercaptoethanol, as described below under PAGE and gel staining. To confirm that the DNA was bound to the Dynabeads®, boiled eluate from a binding reaction was separated on an agarose gel, as described above. Precipitation of protein eluate The eluted proteins were precipitated with trichloroacetic acid (TCA) to concentrate the sample in preparation of gel separation. Sample volumes were adjusted to contain 0.5 % Triton X-100 (Sigma) and 0.1 % N-Lauroylsarcosine (Sigma). 1/5 of the sample volume of 4º C TCA (Sigma) was added to the sample, which was then incubated on ice for 15 min. Samples were centrifuged at 20 000g and 4° C for 15 min and then immediately put on ice. The upper, clear phase was carefully removed and 100 μl of chilled acetone, -20° C, was added to the cloudy phase and very gently mixed. The sample was incubated on ice for 10 min and then centrifuged for 10 min at 20 000g and 4° C. The sample was immediately put on ice after centrifugation. The supernatant was carefully removed and residual liquid was evaporated at room temperature. Precipitates were dissolved in 10-20 μl of 1x SDS-PAGE sample buffer (50 mM Tris pH 8.0, 2 % SDS (sodium dodecyl sulphate), 100 mM DTT and 10 % glycerol) and boiled for 10 min. PAGE and gel staining The sample was, unless already TCA precipitated, mixed with 4x LDS sample buffer from the NuPAGE® gel system (Invitrogen) and 1:30-1:10 β-mercaptoethanol, boiled for 10 min and spun down. The proteins were separated on a 4-12 % NuPAGE® Bis-Tris gel (Invitrogen) in 1x NuPAGE® MES running buffer (Invitrogen) at 155 V. The separated proteins from binding experiments were visualised by staining with the SilverXpress® silver staining kit (Invitrogen) according to the manufacturer’s instructions. Cell lysates were Coomassie® Brilliant Blue R (Sigma) stained. As size reference the BenchMark™ Prestained Protein Standard (Invitrogen) was used. Binding reaction for mass spectrometry The 1.0 M NaCl elutes of four binding reactions all performed with the same lysate and with binding buffer supplemented with 5.0 mM MgCl2, were TCA precipitated, pooled, dissolved in 1x SDS-PAGE sample buffer and separated on a 4-12 % NuPAGE® Bis-Tris gel (Invitrogen) at 155 V in 1x NuPAGE® MES running buffer (Invitrogen). To visualise the migration of the sample (1x SDS-PAGE sample buffer is colourless) a LDS boiled (coloured) eluate was also loaded. The BenchMark™ Prestained Protein Standard (Invitrogen) was used as a size reference. The gel was incubated for 20 min in fixing solution (50 % methanol and 10 % acetic acid). The gel was washed in water 3 times for 5 min and subsequently stained with Bio-Safe™ Coomassie® G250 (BIO-RAD) over night. The gel was destained 3 times in H2O for 20 min, after which protein bands were excised. The excised pieces were stored at –20º C and the rest of the gel was dried. To prevent contamination of the gel it was not scanned prior to excision of protein bands. Sequencing of immobilised fragments Sequencing PCR reactions with 1 or 2 μl of boiled eluate from a binding reaction as template was set up using the BigDye® terminal sequencing kit v3.1 (Applied Biosystems); 0.5x BigDye® ready reaction kit, 0.5x BigDye® Terminator sequencing buffer, 0.05 μM Primer 1,
21

template and water to final volume of 20 μl. PCR program used; 95º C for 5 min, 30 cycles of 95º C for 30 sec, 51º C for 10 sec, 60º C for 4 min. The sequencing reaction was purified by precipitation. The sample was incubated at room temperature for 15 min in 55 μl ethanol 95 %. The sample was centrifuged at 16 000g for 20 min at room temperature after which the supernatant was removed. 250 μl ethanol 70 % was added to the pellet, and the sample was centrifuged at room temperature 16 000g for 10 min. The supernatant was removed and the pellet air-dried. The pellet was resuspended in 10 or15 μl of HiDi (Applied Biosystems) and sequenced in house using a 3130xl Genetic Anlayzer (Applied Biosystems, Hitachi). The sequence was analysed with the GeneQuest™ 6.1 (DNASTAR) software and compared to the S. pneumoniae TIGR4, complete genome sequence, accession number AE005672.2, obtained from the NCBI homepage.
22

Acknowledgements
I gratefully thank the people in the group of Respiratory Tract Infections at the Department of Bacteriology at the Swedish Institute for Infectious Disease Control. Within this group there are a number of people whom deserves individual recognition, especially my supervisor Sofia Ygberg without whom this project would not have been possible. I would also like to thank the Head of the Department; Birgitta Henriques Normark for giving me the opportunity to conduct this project. I also greatly value the help and input given by Aaron Nelson and Eva Morfeldt during the course of this project. I am also thankful for the technical assistance of Karin Sjöström with sequencing, Thomas Åkerlund with protein analysis and Karin Larsson for Atomic Force Microscope imaging. Special thanks to Mikael Rhen at the Department of Microbiology, Tumor and Cell Biology at the Karolinska Institute for his input, and for the kind cooperation of the people in his group.
23
References
Barrochi M. A., J. Ries, X. Zogaj, C. Hemsley, B. Albiger, A. Kanth, S. Dahlberg, J. Fernebro, M. Moschioni, V. Masignani, K. Hultenby, A. R. Taddei, K. Beiter, F. Wartha, A. von Euler, A. Covacci, D. W. Holden, S. Normark, R. Rappuoli and B. Henriques-Normark. 2006. A pneumococcal pilus influences virulence and host inflammatory responses. Proceedings of the National Academy of Sciences of the United States of America, 103, 2857-2862. Elliott J. A., K. D. Farmer and R. R. Facklam. 1998. Sudden incrase in isolation of Group B Streptococci, serotype V, is not due to emergence of a new Pulsed-Field Gel Electrophoresis type. Journal of Clinical Microbiology, 36, 2115-2116. Encheva V., S. E. Gharbia, R. Wait, S. Begum and H. N. Shah. 2006. Comparison of extraction procedures for proteome analysis of Streptococcus pneumoniae and a basic reference map. Proteomics, 6, 3306-3317. Gianfaldoni C., S. Censini, M. Hilleringmann, M. Moschioni, C. Facciotti, W. Pansegrau, V. Masignani, A. Covacci. R. Rappuoli, M. A. Barrochi and P. Ruggiero. 2007. Streptococcus pneumoniae pilus subunits protect mice against lethal challenge. Infection and immunity, 75, 1059-1062. Gillespie S. H. and I. Balakrishnan. 2000. Pathogenesis of pneumococcal infection. Journal of Medical Microbiology, 49, 1057-1067. Gryllos I., J. C. Levin and M. R. Wessels. 2003. The CsR/CsrS two-component system of group A Streptococcus responds to environmental Mg 2+. PNAS, 100, 4227-4232. Hava D. L. and A. Camilli. 2002. Large-scale identification of serotype 4 Streptococcus pneumoniae virulence factors. Molecular Microbiology, 45, 1389-1405. Hava D. L., C. J. Hemsley and A. Camilli. 2003. Transcriptional regulation in the Streptococcus pneumoniae rlrA pathogenicity islet by RlrA. Journal of Bacteriology, 185, 413-421. Hemsley C., E. Joyce, D. Hava, A. Kawale and A. Camilli. 2003. MgrA, an orthologue of Mga, acts as a transcriptional repressor of the genes within the rlrA pathogenicity islet in Streptococcus pneumoniae. Journal of Bacteriology, 185, 6640-6647. Hendley J. O., M. A. Sande, P. M. Stewart and J. M. Gwaltney, Jr. 1975. Spread of Streptococcus pneumoniae in families. I. Carriage rates and distribution of types. Journal of Infectious Diseases, 132, 55-61. Henrichsen J.. 1995. Six newly recognized types of Streptococcus pneumoniae. Journal of Clinical Microbiology, 33, 2759-2762. Henriques Normark B., R. Novak, Å. Örtqvist, G. Källenius, E. Tuomanen and S. Normark. 2001. Clinical isolates of Streptococcus pneumoniae that exhibit tolerance of vancomycin. Clinical infectious disease, 32, 552-558.
24

Jacobs M. R., D. Felmingham, P. C. Appelbaum, R. N. Grüneberg and the Alexander project group. 2003. The Alexander project 1998-2000: susceptibility of pathogens isolated from community-acquired respiratory tract infection to commonly used antimicrobial agents. Journal of Antimicrobial Chemotherapy, 52, 229-246. Johnston J. W., D. E. Briles, L. E. Myers and S. K Hollingshead. 2006. Mn2+ dependent regulation of multiple genes in Streptococcus pneumoniae through PsaR and the resultant impact on virulence. Infection and Immunity, 74, 1171-1180. LeMieux J., D. L. Hava, A. Basset, A. Camilli. 2006. RrgA and RrgB are components of a multisubunit pilus encoded by the Streptococcus pneumoniae rlrA pathogenicity islet. Infection and Immunity, 74, 2453-2456. McCullers J. A. and E. I. Tuomanen. 2001. Molecular pathogenesis of pneumococcal pneumonia. Frontiers in Bioscience, 6, 877-889. Mora M., G. Bensi, S. Capo, F. Falugi, C. Zingaretti, A. Manetti, T. Maggi, A. Raddei, G. Grandi and J. Telford. 2005. Group A Streptococcus produce pilus-like structures containing protective antigens and Lancefield T antigens. PNAS, 102, 15641-15646. Oscarsson J., C. Harlos and S. Arvidson. 2005. Regulatory role of proteins binding to the spa (protein A) and sarS (staphylococcal accessory regulator) promoter regions in Staphylococcus aureus NTCC 8325-4. International Journal of Medical Microbiology, 295, 253-266. Podbielski A., M. Woischnik, B. A. B. Leonard and K. H. Schmidt. 1999. Characterization of nra, a global negative regulator gene in group A streptococci. Molecular Microbiology, 31, 1051-1064. Podbielski A., M. Woischnik, B. Pohl and K. H. Schmidt. 1996. What is the size of the group A streptococcal vir regulon? The Mga regulator affects expression of secreted and surface virulence factors. Medical Microbiology and Immunology, 185, 171-181. Scott J. R. and D. Zähner. 2006. Pili with strong attachments: Gram-positive bacteria do it differently. Molecular Microbiology, 62, 320-330. Stanley J., D. Linton, M. Desai, A. Efstratiou and R. George. 1995. Molecular subtyping of Streptococcus pyogenes causing invasive disease. Journal of Clinical Microbiology, 33, 2850-2855. World Health Organisation, WHO. 2003. Pneumococcal vaccines. Weekly epidemiological record, 14, 110-119.
25