Embed Size (px)
Citation preview
Prepared by the Imperial College London and the Health and Safety Executive 2012
Health and Safety Executive
The burden of occupational cancer in Great BritainMesothelioma
RR861Research Report
Andy DarntonEpidemiology Unit Health and Safety Executive Redgrave Court Merton Road Bootle Merseyside L20 7HS
Sally Hutchings Department of Epidemiology and BiostatisticsImperial College LondonNorfolk PlaceLondon W2 1PG
The aim of this project was to produce an updated estimate of the current burden of cancer for Great Britain resulting from occupational exposure to carcinogenic agents or exposure circumstances. Estimation was carried out for carcinogenic agents or exposure circumstances classified by the International Agency for Research on Cancer (IARC) as definite (Group 1) or probable (Group 2A) human carcinogens. Here, we present estimates for mesothelioma derived using mortality data for calendar year 2005. The methodological approach used informed judgement about the proportion of mesothelioma cases in Great Britain attributable to occupational and paraoccupational and environmental (indirect industrial exposures) asbestos exposures based on evidence from UK published studies.
The estimated total (male and female) fraction of mesothelioma attributable to occupation and para-occupation is 95.1% (95%Confidence Interval (CI)= 93.0-96.9), which equates to 1937 (95%CI=1898-1976) deaths and 1,937 (95%CI=1898-1976) registrations.
This report and the work it describes were funded by the Health and Safety Executive (HSE). Its contents, including any opinions and/or conclusions expressed, are those of the authors alone and do not necessarily reflect HSE policy.
The burden of occupational cancer in Great BritainMesothelioma
HSE Books
Health and Safety Executive
© Crown copyright 2012
First published 2012
You may reuse this information (not including logos) free of charge in any format or medium, under the terms of the Open Government Licence. To view the licence visit www.nationalarchives.gov.uk/doc/open-government-licence/, write to the Information Policy Team, The National Archives, Kew, London TW9 4DU, or email [email protected].
Some images and illustrations may not be owned by the Crown so cannot be reproduced without permission of the copyright owner. Enquiries should be sent to [email protected].
ACKNOWLEDGEMENTS
Funding was obtained from the Health and Safety Executive (HSE). Andrew Darnton from the HSE was responsible for the work on mesothelioma. The contributions to the project and advice received from many other HSE and Health and Safety Laboratory staff is gratefully acknowledged. Two workshops were held during the project bringing together experts from the UK and around the world. We would like to thank all those who participated and have continued to give advice and comment on the project. We would also like to thank Helen Pedersen and Gareth Evans for their help in editing and formatting the reports.
ii

EXECUTIVE SUMMARY The aim of this project was to produce an updated estimate of the current burden of cancer for Great Britain resulting from occupational exposure to carcinogenic agents or exposure circumstances. Estimation was carried out for carcinogenic agents or exposure circumstances classified by the International Agency for Research on Cancer (IARC) as definite (Group 1) or probable (Group 2A) human carcinogens. Here, we present estimates for mesothelioma derived using mortality data for calendar year 2005. The methodological approach used informed judgement about the proportion of mesothelioma cases in Great Britain attributable to occupational and paraoccupational and environmental (indirect industrial exposures) asbestos exposures based on evidence from UK published studies. Inhalation of asbestos fibres has been recognised as the main cause of mesothelioma for many years. In the past asbestos exposure occurred within industries such as shipbuilding, railway engineering, asbestos product manufacture and in construction, for example during the installation of asbestos building materials for fire protection purposes. Workers with the highest risks today are likely to be those subject to incidental exposures during the course of their work, for example, building maintenance workers.
Due to assumptions made about cancer latency and working age range, only cancers in ages 25+ in 2005/2004 could be attributable to occupation. For Great Britain in 2005, using the well-established UK register of mesothelioma deaths there were 1749 deaths in men aged 25+ and 288 deaths in women from mesothelioma (data collated in 2008); as mesothelioma is rapidly fatal the same figures have been used for cancer registrations. The estimated total (male and female) fraction of mesothelioma attributable to occupation and para-occupation is 95.09% (95%Confidence Interval (CI)=93.03-96.87), which equates to 1937 (95%CI=1898-1976) deaths and 1,937 (95%CI=1898-1976) registrations.
iii

iv
CONTENTS
1. INCIDENCE AND TRENDS.................................................................................... 1
2. OVERVIEW OF AETIOLOGY................................................................................. 2
3. ATTRIBUTABLE FRACTION ESTIMATION.......................................................... 4
3.1 Non-GB based studies ...................................................................................... 4
3.2 GB-based studies.............................................................................................. 5
3.3 Background mesotheliomas.............................................................................. 5
3.4 AF Calculation................................................................................................... 5
3.5 Exposures by industry/job ................................................................................. 6
4.0 APPENDIX 1......................................................................................................... 9
5. BIBLIOGRAPHY................................................................................................... 20
v

vi
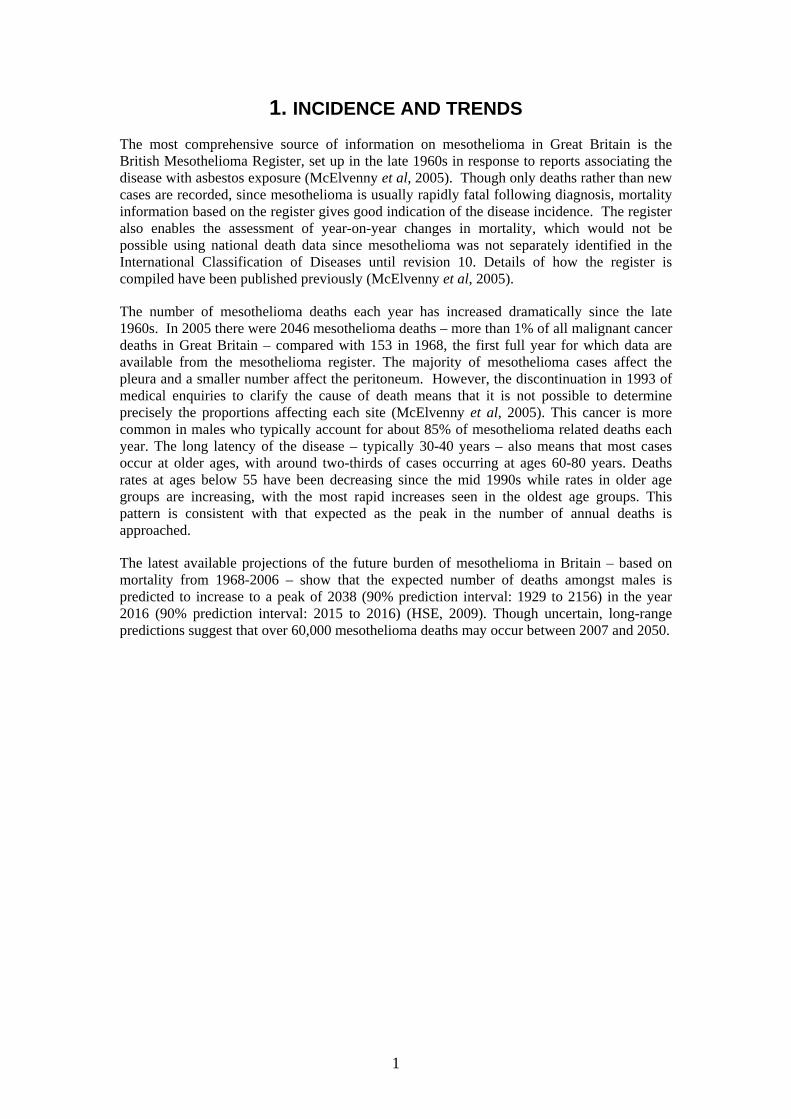
1. INCIDENCE AND TRENDS The most comprehensive source of information on mesothelioma in Great Britain is the British Mesothelioma Register, set up in the late 1960s in response to reports associating the disease with asbestos exposure (McElvenny et al, 2005). Though only deaths rather than new cases are recorded, since mesothelioma is usually rapidly fatal following diagnosis, mortality information based on the register gives good indication of the disease incidence. The register also enables the assessment of year-on-year changes in mortality, which would not be possible using national death data since mesothelioma was not separately identified in the International Classification of Diseases until revision 10. Details of how the register is compiled have been published previously (McElvenny et al, 2005).
The number of mesothelioma deaths each year has increased dramatically since the late 1960s. In 2005 there were 2046 mesothelioma deaths – more than 1% of all malignant cancer deaths in Great Britain – compared with 153 in 1968, the first full year for which data are available from the mesothelioma register. The majority of mesothelioma cases affect the pleura and a smaller number affect the peritoneum. However, the discontinuation in 1993 of medical enquiries to clarify the cause of death means that it is not possible to determine precisely the proportions affecting each site (McElvenny et al, 2005). This cancer is more common in males who typically account for about 85% of mesothelioma related deaths each year. The long latency of the disease – typically 30-40 years – also means that most cases occur at older ages, with around two-thirds of cases occurring at ages 60-80 years. Deaths rates at ages below 55 have been decreasing since the mid 1990s while rates in older age groups are increasing, with the most rapid increases seen in the oldest age groups. This pattern is consistent with that expected as the peak in the number of annual deaths is approached.
The latest available projections of the future burden of mesothelioma in Britain – based on mortality from 1968-2006 – show that the expected number of deaths amongst males is predicted to increase to a peak of 2038 (90% prediction interval: 1929 to 2156) in the year 2016 (90% prediction interval: 2015 to 2016) (HSE, 2009). Though uncertain, long-range predictions suggest that over 60,000 mesothelioma deaths may occur between 2007 and 2050.
1

2. OVERVIEW OF AETIOLOGY
Inhalation of asbestos fibres has been recognised as the main cause of mesothelioma for many years. Analyses of the mesothelioma deaths ‘register’ by occupational group and geographical area support the conclusion that the continuing increase in mesothelioma mortality in Great Britain is largely a consequence of past asbestos exposures in occupational settings (McElvenny et al, 2005). These analyses show that occupations and geographical areas with the highest mesothelioma risks tend to be those clearly associated with heavy past asbestos exposures, for example, within industries such as shipbuilding, railway engineering, asbestos product manufacture, and construction. However, a recent population based case-control study in Britain suggests that nearly half of currently occurring deaths in men are attributable to exposures in construction such as those arising during the installation of asbestos building materials for fire protection purposes (Rake et al, 2009). Workers with the highest risks today are likely to be those subject to incidental exposures during the course of their work, for example, building maintenance workers.
The focus of much of the epidemiological research carried out since the 1960s – when the association between mesothelioma and asbestos was first reported (Wagner et al, 1960) – has been on occupational exposures. However, non-occupational asbestos exposures, cases caused by other agents, and spontaneous cases may contribute to the overall burden to some extent. A recent population based case-control study of mesothelioma in Britain concluded that a substantial proportion of cases that were unattributable to identifiable sources of asbestos exposure (14% of male and 62% of female cases) were nevertheless caused by asbestos, and that the source was likely to be an increase in ambient asbestos exposure that coincided with the widespread occupational exposures of the 1960s and 1970s (Rake et al, 2009). In this study, 16% of female cases overall were attributable to domestic exposures. Several reviews of mesothelioma in relation to non-occupational asbestos also suggest that paraoccupational and environmental (familial) asbestos exposures, neighbourhood asbestos exposures due to residential proximity to industrial sites where asbestos was used, and true environmental asbestos exposures due to naturally occurring deposits can present a risk of mesothelioma (Pan et al, 2005; Orenstein and Schenker, 2000; Gardner and Saracci, 1989; Ilgren and Wagner, 1991).
There is uncertainty in the level of risk associated with various potential non-occupational factors and their relevance to Great Britain where naturally occurring deposits are not widespread. There is also evidence that other mineral fibres such as erionite can cause mesothelioma (Ilgren and Wagner, 1991), but again, widespread exposure within Great Britain is unlikely. A further possible risk factor for mesothelioma is exposure to Simian Virus 40 (SV40), which was found to contaminate many Salk polio vaccines administered widely in the 1950s and early 1960s in developed countries – including Great Britain (Butel, 2000). However, although SV40 is capable of infecting and transforming cells from various species and has been detected in human mesothelioma tissue, one recent study casts some doubt on the validity of earlier studies (López-Ríos et al, 2004), and all human epidemiological studies to date have been inconclusive (Olin et al, 1998; Strickler et al, 1998; Fisher et al, 1999; Strickler et al, 2003; Engels et al, 2003). There is also some evidence that a small number of spontaneous mesothelioma cases occur each year in the absence of any exposure (Rake et al, 2009; McDonald and McDonald, 1994; Ilgren and Wagner 1991). Together with any cases caused by naturally occurring deposits of asbestos or other mineral fibres, these form a background level of mesothelioma which can be thought of as the number of cases that would have occurred in the absence of any industrial uses of asbestos.
The potential causes of mesothelioma relevant to Great Britain have been summarised into three groups in Table 1 below. In order to estimate the contribution of mesothelioma to the overall burden of cancer due to occupation in Great Britain, the number of current cases due
2
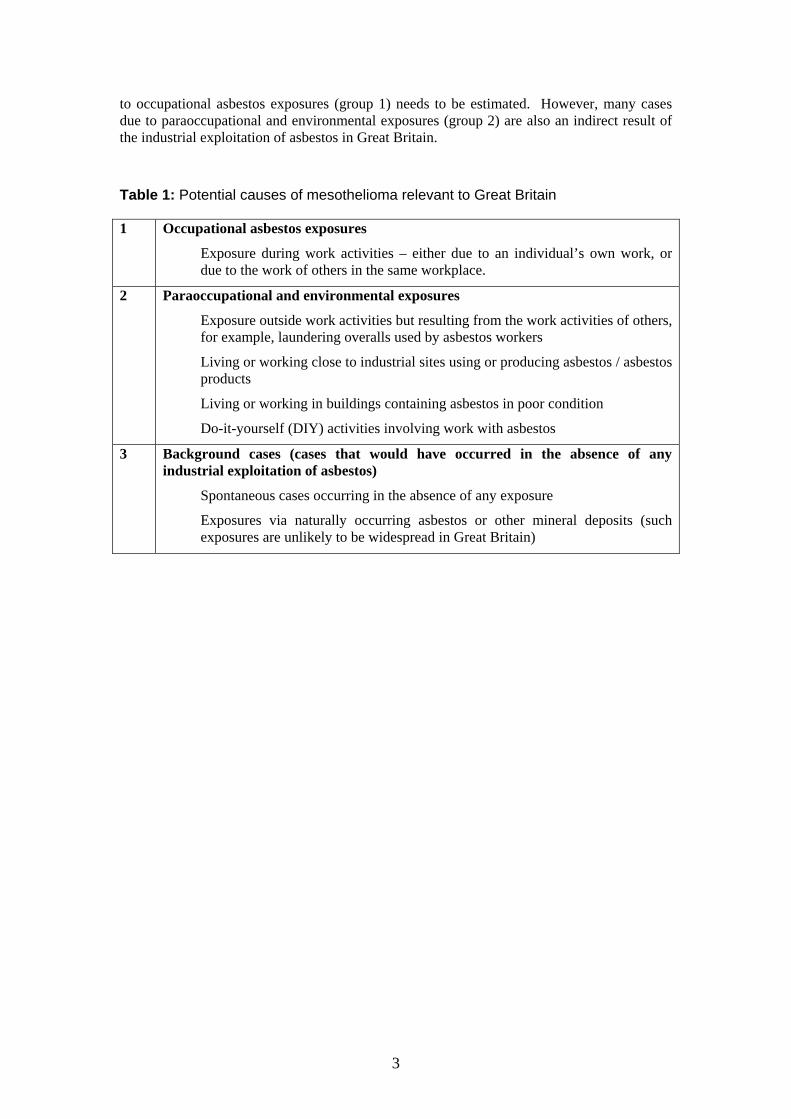
to occupational asbestos exposures (group 1) needs to be estimated. However, many cases due to paraoccupational and environmental exposures (group 2) are also an indirect result of the industrial exploitation of asbestos in Great Britain.
Table 1: Potential causes of mesothelioma relevant to Great Britain
1 Occupational asbestos exposures
Exposure during work activities – either due to an individual’s own work, or due to the work of others in the same workplace.
2 Paraoccupational and environmental exposures
Exposure outside work activities but resulting from the work activities of others, for example, laundering overalls used by asbestos workers
Living or working close to industrial sites using or producing asbestos / asbestos products
Living or working in buildings containing asbestos in poor condition
Do-it-yourself (DIY) activities involving work with asbestos
3 Background cases (cases that would have occurred in the absence of any industrial exploitation of asbestos)
Spontaneous cases occurring in the absence of any exposure
Exposures via naturally occurring asbestos or other mineral deposits (such exposures are unlikely to be widespread in Great Britain)
3
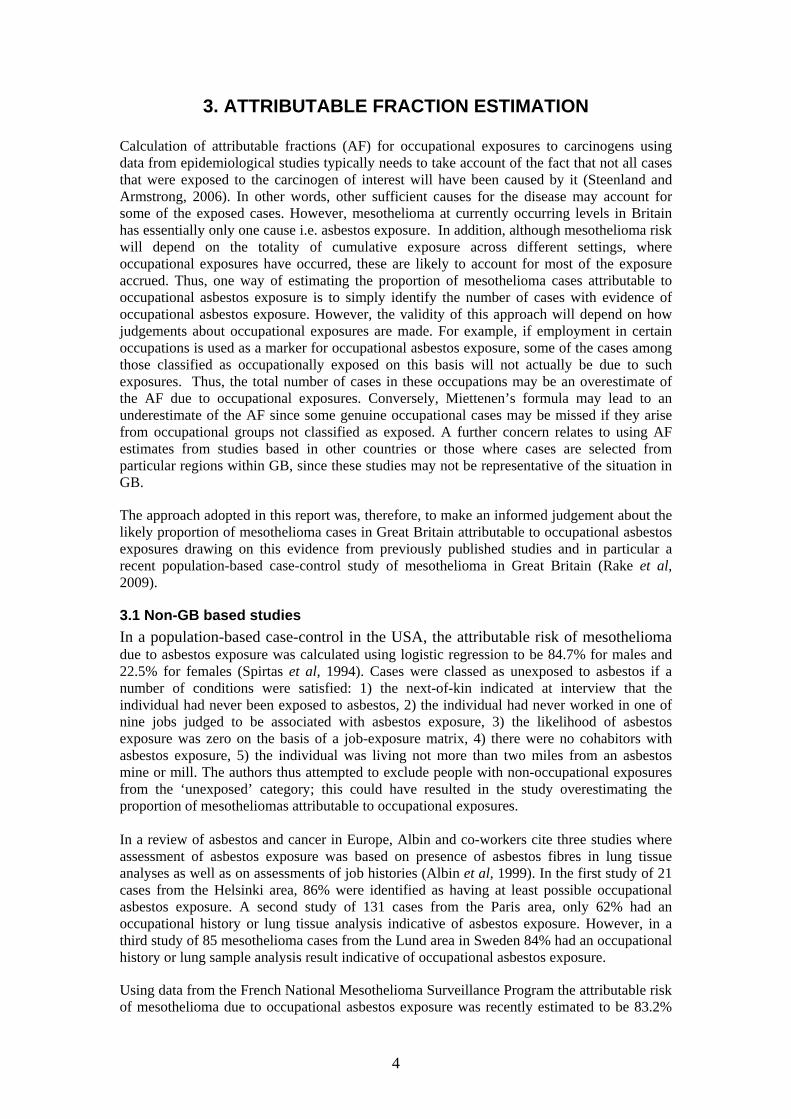
3. ATTRIBUTABLE FRACTION ESTIMATION Calculation of attributable fractions (AF) for occupational exposures to carcinogens using data from epidemiological studies typically needs to take account of the fact that not all cases that were exposed to the carcinogen of interest will have been caused by it (Steenland and Armstrong, 2006). In other words, other sufficient causes for the disease may account for some of the exposed cases. However, mesothelioma at currently occurring levels in Britain has essentially only one cause i.e. asbestos exposure. In addition, although mesothelioma risk will depend on the totality of cumulative exposure across different settings, where occupational exposures have occurred, these are likely to account for most of the exposure accrued. Thus, one way of estimating the proportion of mesothelioma cases attributable to occupational asbestos exposure is to simply identify the number of cases with evidence of occupational asbestos exposure. However, the validity of this approach will depend on how judgements about occupational exposures are made. For example, if employment in certain occupations is used as a marker for occupational asbestos exposure, some of the cases among those classified as occupationally exposed on this basis will not actually be due to such exposures. Thus, the total number of cases in these occupations may be an overestimate of the AF due to occupational exposures. Conversely, Miettenen’s formula may lead to an underestimate of the AF since some genuine occupational cases may be missed if they arise from occupational groups not classified as exposed. A further concern relates to using AF estimates from studies based in other countries or those where cases are selected from particular regions within GB, since these studies may not be representative of the situation in GB.
The approach adopted in this report was, therefore, to make an informed judgement about the likely proportion of mesothelioma cases in Great Britain attributable to occupational asbestos exposures drawing on this evidence from previously published studies and in particular a recent population-based case-control study of mesothelioma in Great Britain (Rake et al, 2009).
3.1 Non-GB based studies In a population-based case-control in the USA, the attributable risk of mesothelioma due to asbestos exposure was calculated using logistic regression to be 84.7% for males and 22.5% for females (Spirtas et al, 1994). Cases were classed as unexposed to asbestos if a number of conditions were satisfied: 1) the next-of-kin indicated at interview that the individual had never been exposed to asbestos, 2) the individual had never worked in one of nine jobs judged to be associated with asbestos exposure, 3) the likelihood of asbestos exposure was zero on the basis of a job-exposure matrix, 4) there were no cohabitors with asbestos exposure, 5) the individual was living not more than two miles from an asbestos mine or mill. The authors thus attempted to exclude people with non-occupational exposures from the ‘unexposed’ category; this could have resulted in the study overestimating the proportion of mesotheliomas attributable to occupational exposures. In a review of asbestos and cancer in Europe, Albin and co-workers cite three studies where assessment of asbestos exposure was based on presence of asbestos fibres in lung tissue analyses as well as on assessments of job histories (Albin et al, 1999). In the first study of 21 cases from the Helsinki area, 86% were identified as having at least possible occupational asbestos exposure. A second study of 131 cases from the Paris area, only 62% had an occupational history or lung tissue analysis indicative of asbestos exposure. However, in a third study of 85 mesothelioma cases from the Lund area in Sweden 84% had an occupational history or lung sample analysis result indicative of occupational asbestos exposure.
Using data from the French National Mesothelioma Surveillance Program the attributable risk of mesothelioma due to occupational asbestos exposure was recently estimated to be 83.2%
4

for males and 38.4% for females (Goldberg et al, 2006). This programme includes 21 districts in France covering approximately one quarter of the total population, chosen to be representative of the France as a whole in terms of demographic, employment and economic activity characteristics.
3.2 GB-based studies From a case series of 272 mesothelioma cases in the south east of England, 236 (86.8%) were judged to have definite or probable occupational asbestos exposure on the basis of an assessment by experienced occupational respiratory physicians of occupational histories constructed from a variety of sources (Yates et al, 1997). The authors concluded that the study may have overestimated the proportion attributable to asbestos exposure because of the way the cases were selected. The high proportion of male cases (93%) may also have led this being an overestimation of the overall attributable fraction.
In a mesothelioma case-control study in the Yorkshire region of England, 82% of the cases were classified as having likely or possible occupational exposure on the basis of occupational histories reported by next-of-kin at interview or from coroner’s reports (Howel et al, 1997). Of the 185 cases in the analysis, 137 (74%) were male.
In a population-based case-control study of mesothelioma cases in Great Britain diagnosed during 2000-2005, 94% of male cases had worked in occupations likely to be associated with asbestos exposure, or had specifically reported substantial asbestos exposures – such as sawing amosite board. AFs for occupational and non-occupational exposure were derived based on any such employment or reported exposures. AFs for occupational exposures were 85% for males and 22% for females. The only significant non-occupational risk factor was paraoccupational and environmental exposure before age 30 with AFs of 1.3% and 16% respectively for males and females (Rake et al, 2009). This study suggests that 14% of male cases and over 62% of female cases therefore remain as “unexplained” cases and these are presumably due to ambient or unreported asbestos exposure or to other or natural causes.
3.3 Background mesotheliomas Several lines of argument have indicated an annual background rate for spontaneous mesothelioma of around 1-2 cases per million (McDonald and McDonald, 1994). Assuming that the background rate is the same in both sexes, and that there is no difference in mesothelioma risk due to asbestos exposure between the sexes, the intercept of a straight line fitted on a plot of annual female deaths against annual national male deaths can be used to estimate the background level and suggests a background rate of the order of 1 per million per year in Great Britain, which is consistent with the rate suggested by McDonald and McDonald (1994). A rate of 1 per million is equivalent to about 30 cases each year in males and the same in females i.e. about 60 background cases per year overall. However, a recent analysis of international male and female mesothelioma rates suggests that the background rate could be closer to 2 per million, which would account for about a quarter of currently occurring female cases, and a similar absolute number in men (Rake et al, 2009)
3.4 AF Calculation In the British studies considered here, between 82% and 94% of male mesothelioma cases were classed as occupationally exposed, and the recent mesothelioma case-control study by Rake et al. (2009) (taken as being most representative of the situation in Great Britain) gave an AF for occupational asbestos exposure of 85% (95% CI: 82-88%). Collectively, these results suggest an estimate of the proportion of mesothelioma cases in males due to past occupational exposures of 85-90%, or about 1480-1570 deaths in 2005, is reasonable. If there
5
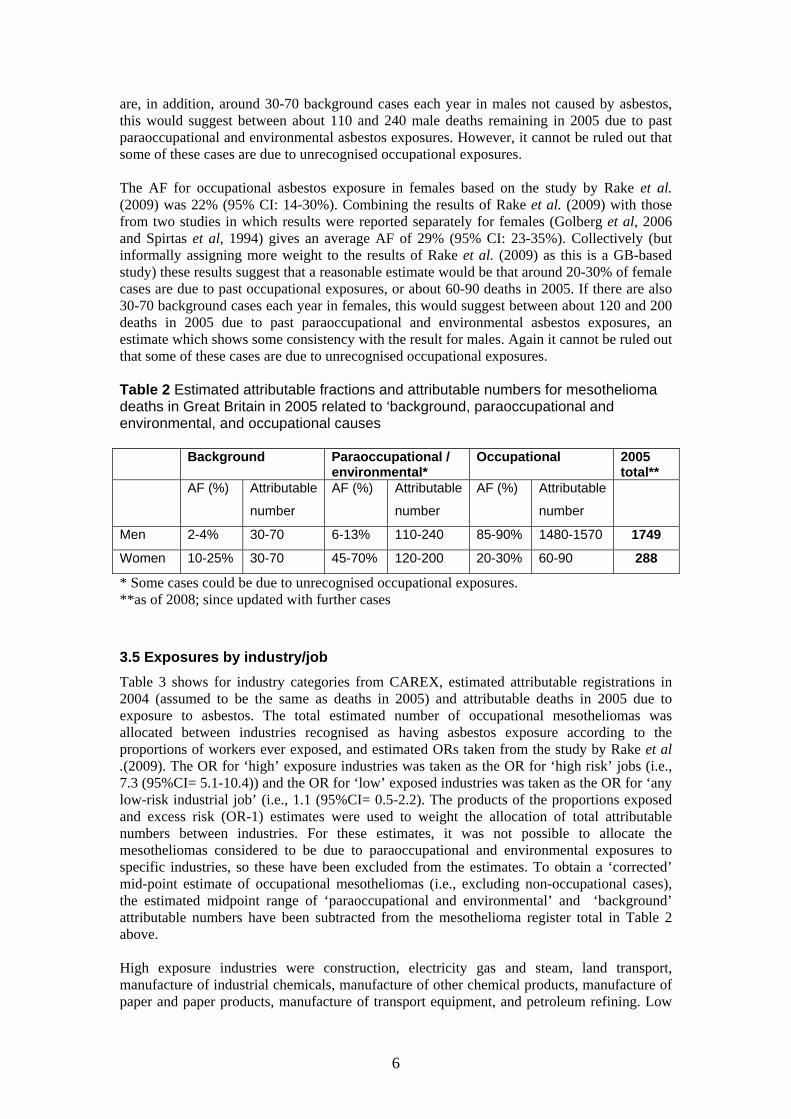
are, in addition, around 30-70 background cases each year in males not caused by asbestos, this would suggest between about 110 and 240 male deaths remaining in 2005 due to past paraoccupational and environmental asbestos exposures. However, it cannot be ruled out that some of these cases are due to unrecognised occupational exposures. The AF for occupational asbestos exposure in females based on the study by Rake et al. (2009) was 22% (95% CI: 14-30%). Combining the results of Rake et al. (2009) with those from two studies in which results were reported separately for females (Golberg et al, 2006 and Spirtas et al, 1994) gives an average AF of 29% (95% CI: 23-35%). Collectively (but informally assigning more weight to the results of Rake et al. (2009) as this is a GB-based study) these results suggest that a reasonable estimate would be that around 20-30% of female cases are due to past occupational exposures, or about 60-90 deaths in 2005. If there are also 30-70 background cases each year in females, this would suggest between about 120 and 200 deaths in 2005 due to past paraoccupational and environmental asbestos exposures, an estimate which shows some consistency with the result for males. Again it cannot be ruled out that some of these cases are due to unrecognised occupational exposures. Table 2 Estimated attributable fractions and attributable numbers for mesothelioma deaths in Great Britain in 2005 related to ‘background, paraoccupational and environmental, and occupational causes Background Paraoccupational /
environmental* Occupational 2005
total** AF (%) Attributable
number
AF (%) Attributable
number
AF (%) Attributable
number
Men 2-4% 30-70 6-13% 110-240 85-90% 1480-1570 1749
Women 10-25% 30-70 45-70% 120-200 20-30% 60-90 288
* Some cases could be due to unrecognised occupational exposures. **as of 2008; since updated with further cases
3.5 Exposures by industry/job Table 3 shows for industry categories from CAREX, estimated attributable registrations in 2004 (assumed to be the same as deaths in 2005) and attributable deaths in 2005 due to exposure to asbestos. The total estimated number of occupational mesotheliomas was allocated between industries recognised as having asbestos exposure according to the proportions of workers ever exposed, and estimated ORs taken from the study by Rake et al .(2009). The OR for ‘high’ exposure industries was taken as the OR for ‘high risk’ jobs (i.e., 7.3 (95%CI= 5.1-10.4)) and the OR for ‘low’ exposed industries was taken as the OR for ‘any low-risk industrial job’ (i.e., 1.1 (95%CI= 0.5-2.2). The products of the proportions exposed and excess risk (OR-1) estimates were used to weight the allocation of total attributable numbers between industries. For these estimates, it was not possible to allocate the mesotheliomas considered to be due to paraoccupational and environmental exposures to specific industries, so these have been excluded from the estimates. To obtain a ‘corrected’ mid-point estimate of occupational mesotheliomas (i.e., excluding non-occupational cases), the estimated midpoint range of ‘paraoccupational and environmental’ and ‘background’ attributable numbers have been subtracted from the mesothelioma register total in Table 2 above. High exposure industries were construction, electricity gas and steam, land transport, manufacture of industrial chemicals, manufacture of other chemical products, manufacture of paper and paper products, manufacture of transport equipment, and petroleum refining. Low
6

exposed occupations were other mining, personal and household services, sanitary and similar services, and wholesale and retail trade, hotels and restaurants. An alternative method of allocation of the total occupational attributable mesotheliomas to industry sectors based on the occupational exposures identified by Rake et al. (2009) is given in Appendix 1. However, for the sake of consistency with other exposures included in the current burden estimates the approach using CAREX described above has been used for the industry breakdown for mesothelioma and also for the other asbestos related cancers (lung, stomach and larynx).
7
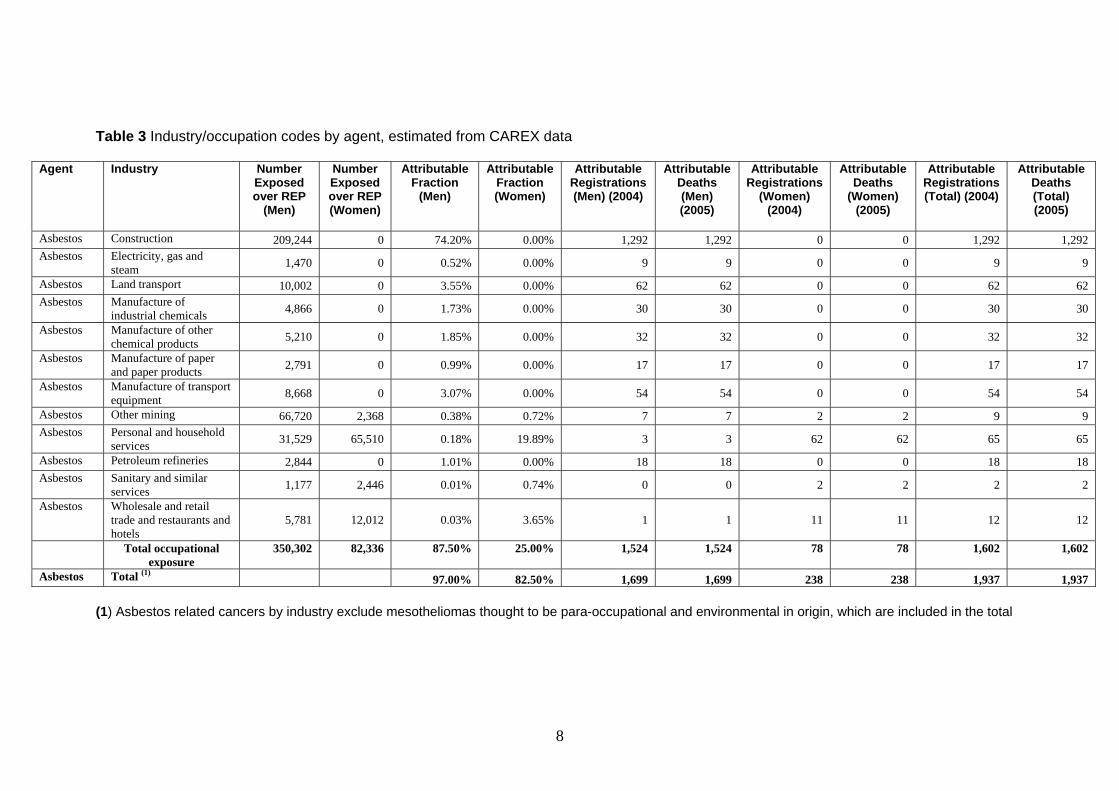
Table 3 Industry/occupation codes by agent, estimated from CAREX data
Agent Industry Number Exposed over REP
(Men)
Number Exposed over REP (Women)
Attributable Fraction
(Men)
Attributable Fraction (Women)
Attributable Registrations (Men) (2004)
Attributable Deaths (Men) (2005)
Attributable Registrations
(Women) (2004)
Attributable Deaths
(Women) (2005)
Attributable Registrations (Total) (2004)
Attributable Deaths (Total) (2005)
Asbestos Construction 209,244 0 74.20% 0.00% 1,292 1,292 0 0 1,292 1,292 Asbestos Electricity, gas and
steam 1,470 0 0.52% 0.00% 9 9 0 0 9 9
Asbestos Land transport 10,002 0 3.55% 0.00% 62 62 0 0 62 62 Asbestos Manufacture of
industrial chemicals 4,866 0 1.73% 0.00% 30 30 0 0 30 30
Asbestos Manufacture of other chemical products 5,210 0 1.85% 0.00% 32 32 0 0 32 32
Asbestos Manufacture of paper and paper products 2,791 0 0.99% 0.00% 17 17 0 0 17 17
Asbestos Manufacture of transport equipment 8,668 0 3.07% 0.00% 54 54 0 0 54 54
Asbestos Other mining 66,720 2,368 0.38% 0.72% 7 7 2 2 9 9 Asbestos Personal and household
services 31,529 65,510 0.18% 19.89% 3 3 62 62 65 65
Asbestos Petroleum refineries 2,844 0 1.01% 0.00% 18 18 0 0 18 18 Asbestos Sanitary and similar
services 1,177 2,446 0.01% 0.74% 0 0 2 2 2 2
Asbestos Wholesale and retail trade and restaurants and hotels
5,781 12,012 0.03% 3.65% 1 1 11 11 12 12
Total occupational exposure
350,302 82,336 87.50% 25.00% 1,524 1,524 78 78 1,602 1,602
Asbestos Total (1) 97.00% 82.50% 1,699 1,699 238 238 1,937 1,937
(1) Asbestos related cancers by industry exclude mesotheliomas thought to be para-occupational and environmental in origin, which are included in the total
8
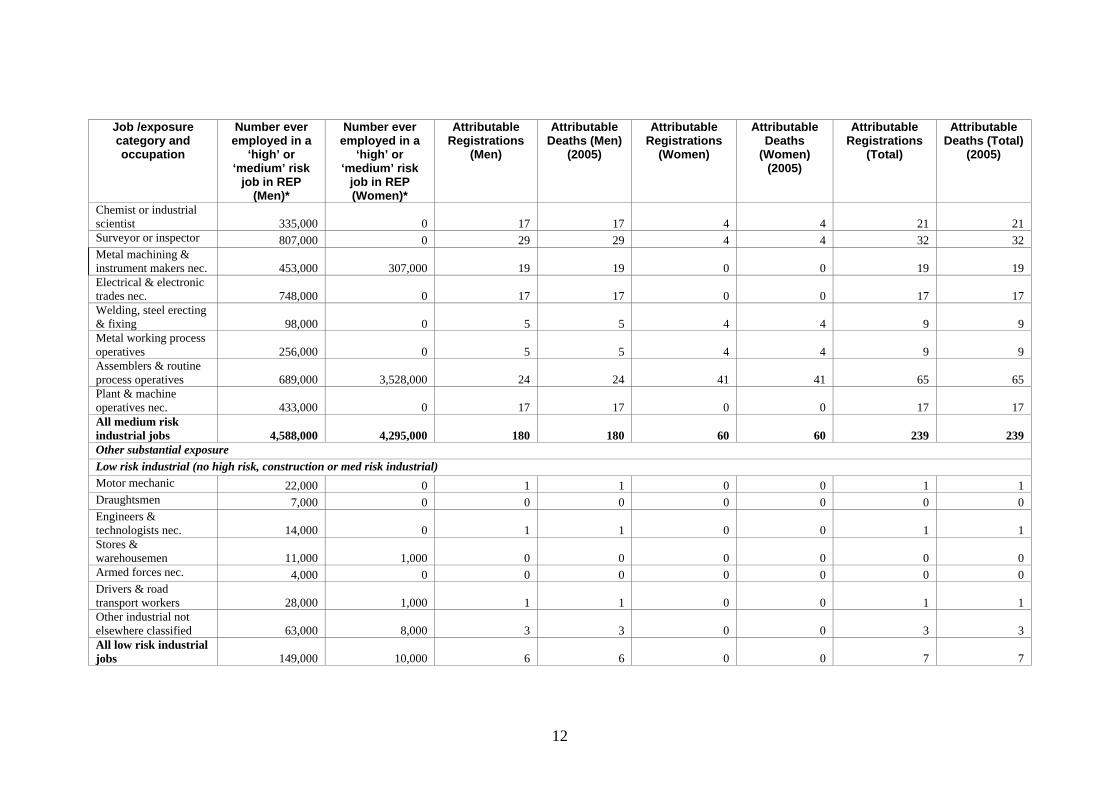
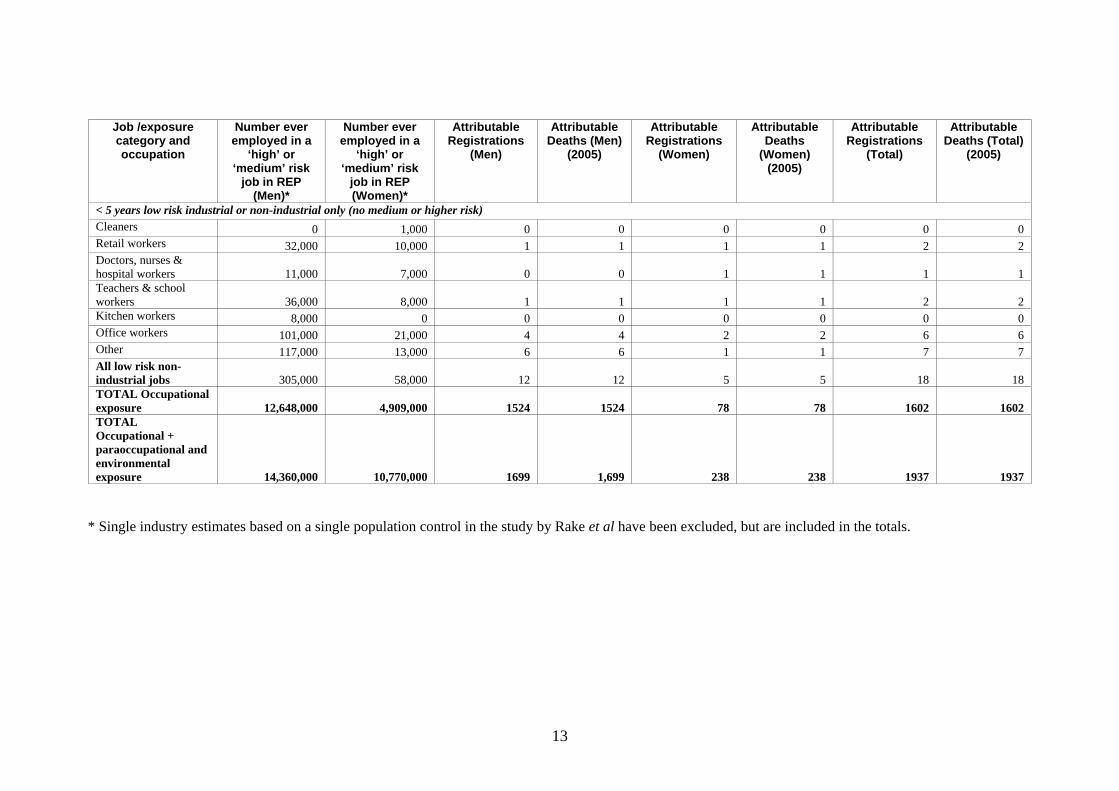
4.0 APPENDIX 1 Alternative method of allocation of total numbers to industry sectors Table A1 gives results of an alternative method of allocation of the total occupation attributable mesotheliomas estimated from the mesothelioma register (excluding environmental and para-occupational cases as described above) to job categories, based on the occupational exposures identified by Rake et al. (2009). The allocation was carried out as follows. 1. Asbestos attributable cases by exposure category (listed in Table A2) (excluding those
due to domestic exposure <age 30) were considered to be occupational, (from Table 3.4.2 in the HSE technical report describing the UK mesothelioma case-control study (Peto et al, 2009). Proportions based on these numbers were used to divide the 1524 occupational mesotheliomas in men and 78 in women between exposure categories. Peto et al's ‘non-attributable’ cases (M 69.6, W 68.0) in Table A2 plus the cases attributed to domestic exposure <age 30 (M 6.8, W 17.5) are taken as equivalent to exposure described as background plus environmental and para-occupational above (M 225, W 210), and are excluded from the allocation.
2. In order to allocate to jobs within the Table A2 exposure categories, proportions by
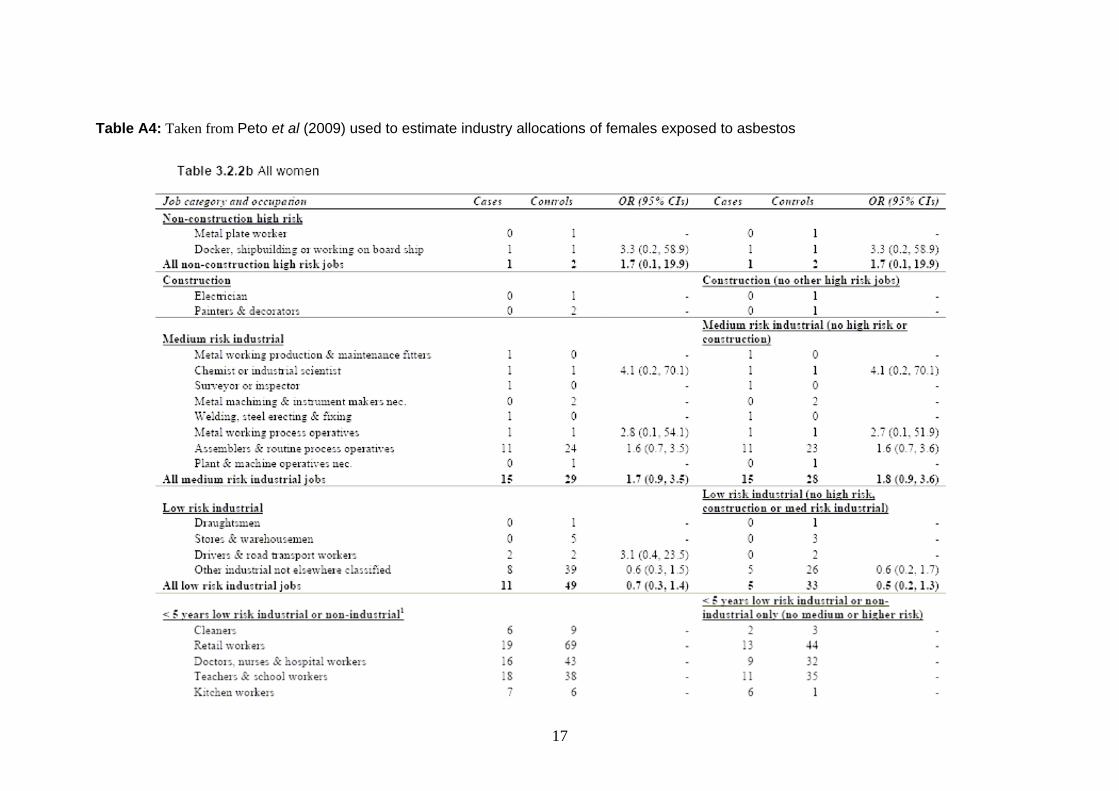
occupation within these categories from Tables A3 and A4 (Tables 3.2.2a and b respectively in Peto et al, (2009)) were used as an approximation (in most categories these are for a minimum 5 years duration, which is not the case in Table A2). As the job exposures in Tables A3 and A4 are not mutually exclusive, allocations were made within exposure categories in proportion to the industry-cases represented, not individual cases.
3. 'Other substantial exposure' in Table A2 was taken to include the 'low risk industrial' plus
'<5 years low risk industrial or non-industrial only' categories from Tables A3 and A4. An example is given of the calculation of the estimates for construction for men in Table A4.
Comparison of alternative method with method based on CAREX Use of population controls from the study of Rake et al (2009) to estimate proportions of the population exposed (proportion who did at least some work in job groups classified as medium risk or higher), indicate much greater past exposure to asbestos than is indicated by the CAREX data. The proportion of the population estimated as ever exposed to asbestos using the standard GB cancer burden methodology and based on the CAREX exposed numbers (Table 3) are 1.8% for men and 0.4% for women, whereas the proportions of controls from the Rake et al (2009) study who worked in jobs classified as medium risk or above were 65% and 23% respectively. These proportions however represent workers ever employed in an occupation with potential for asbestos exposure, whereas the CAREX data estimate numbers actually exposed within industry sectors subject to asbestos exposure in 1990-93. Therefore the proportions from the Rake study controls represent an upper limit of numbers ever actually exposed to asbestos, while the CAREX data, for 1990-93, are likely to underestimate numbers exposed in the risk exposure period as workplace exposure was known to be much greater in the early part of the REP (1956-1995), certainly in the industries where the risk from asbestos was recognised. CAREX numbers have been adjusted for greater numbers employed in the industries included in the CAREX list for asbestos, but not for the higher proportions of these workers that will have been exposed. Table A1 gives estimates of numbers ever exposed to asbestos by occupation; these were obtained by applying the Rake et al (2009) study control proportions to numbers of men and women who were ever of working age during the risk exposure period (i.e. long latency) and still alive in 2005 (19.4 million men and 21 million women).
9
The representation by industry also differs substantially, with construction accounting for 74% of mesotheliomas in men from the CAREX data, versus 47% in the Rake study (2009). The CAREX data estimate of 20% of mesotheliomas in women being due to work in personal and household services also contrasts with the Rake et al study (2009) estimate of 1.7% for all low risk non-industrial jobs. In the Rake et al study (2009) 13% of women’s mesotheliomas are attributed to work as ‘assemblers and routine process operatives’ in manufacturing industry, whereas it has been assumed that there were no women amongst the workers with ‘high’ level asbestos exposure in manufacturing industry estimated in CAREX. Given that the industry allocation from the Rake et al (2009) study is derived directly from a GB population based study, it is likely that this is more reliable. However, younger cases were over-represented in the study and this could result in some over-allocation of the total burden of GB cases to industries where exposures were important towards the more recent part of the risk exposure period. The approach using CAREX has therefore been used for the industry breakdown for mesothelioma and also for the other asbestos related cancers (lung, stomach and larynx), for the sake of consistency with other exposures included in the current burden estimates. However the results based on population controls from the Rake study noted above do merit further consideration, although they have been set aside for this analysis as they are likely to be an overestimate of numbers exposed. The results obtained using the standard turnover approach based on CAREX point estimate data are on the other hand likely to be an underestimate.
10
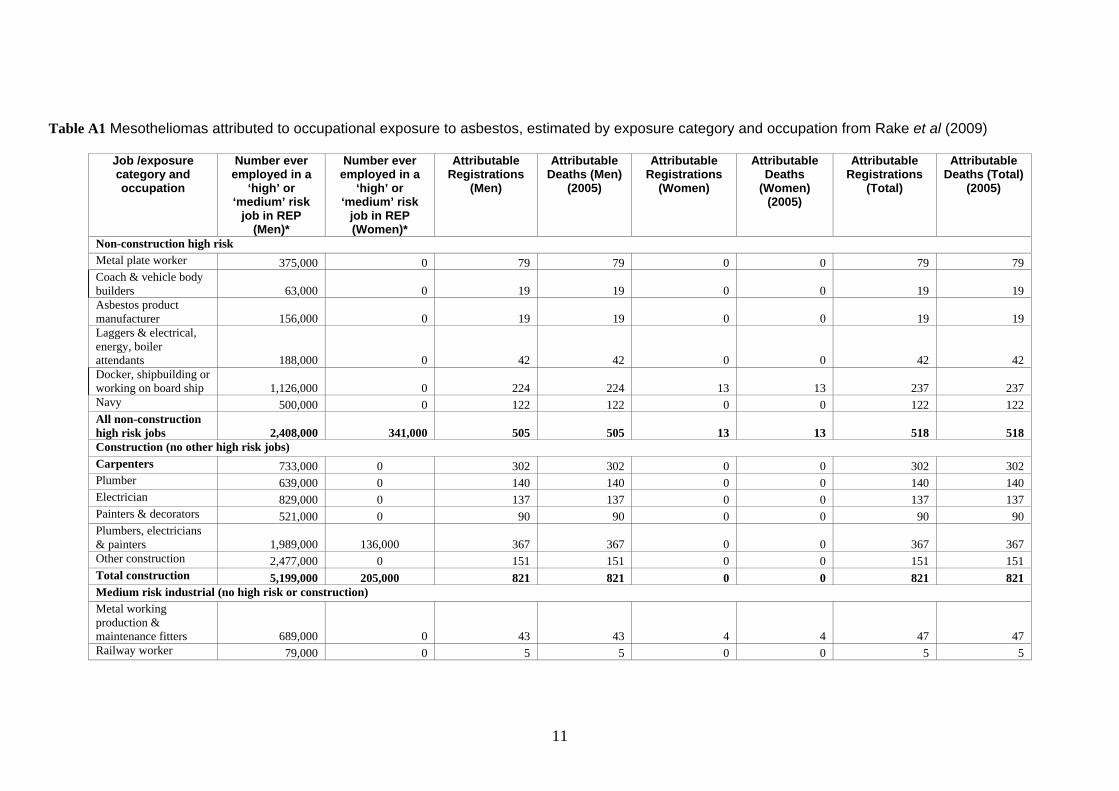
Table A1 Mesotheliomas attributed to occupational exposure to asbestos, estimated by exposure category and occupation from Rake et al (2009)
Job /exposure category and occupation
Number ever employed in a
‘high’ or ‘medium’ risk
job in REP (Men)*
Number ever employed in a
‘high’ or ‘medium’ risk
job in REP (Women)*
Attributable Registrations
(Men)
Attributable Deaths (Men)
(2005)
Attributable Registrations
(Women)
Attributable Deaths
(Women) (2005)
Attributable Registrations
(Total)
Attributable Deaths (Total)
(2005)
Non-construction high risk Metal plate worker 375,000 0 79 79 0 0 79 79 Coach & vehicle body builders 63,000 0 19 19 0 0 19 19 Asbestos product manufacturer 156,000 0 19 19 0 0 19 19 Laggers & electrical, energy, boiler attendants 188,000 0 42 42 0 0 42 42 Docker, shipbuilding or working on board ship 1,126,000 0 224 224 13 13 237 237 Navy 500,000 0 122 122 0 0 122 122 All non-construction high risk jobs 2,408,000 341,000 505 505 13 13 518 518 Construction (no other high risk jobs) Carpenters 733,000 0 302 302 0 0 302 302 Plumber 639,000 0 140 140 0 0 140 140 Electrician 829,000 0 137 137 0 0 137 137 Painters & decorators 521,000 0 90 90 0 0 90 90 Plumbers, electricians & painters 1,989,000 136,000 367 367 0 0 367 367 Other construction 2,477,000 0 151 151 0 0 151 151 Total construction 5,199,000 205,000 821 821 0 0 821 821 Medium risk industrial (no high risk or construction) Metal working production & maintenance fitters 689,000 0 43 43 4 4 47 47 Railway worker 79,000 0 5 5 0 0 5 5
11
Job /exposure category and occupation
Number ever employed in a
‘high’ or ‘medium’ risk
job in REP (Men)*
Number ever employed in a
‘high’ or ‘medium’ risk
job in REP (Women)*
Attributable Registrations
(Men)
Attributable Deaths (Men)
(2005)
Attributable Registrations
(Women)
Attributable Deaths
(Women) (2005)
Attributable Registrations
(Total)
Attributable Deaths (Total)
(2005)
Chemist or industrial scientist 335,000 0 17 17 4 4 21 21 Surveyor or inspector 807,000 0 29 29 4 4 32 32 Metal machining & instrument makers nec. 453,000 307,000 19 19 0 0 19 19 Electrical & electronic trades nec. 748,000 0 17 17 0 0 17 17 Welding, steel erecting & fixing 98,000 0 5 5 4 4 9 9 Metal working process operatives 256,000 0 5 5 4 4 9 9 Assemblers & routine process operatives 689,000 3,528,000 24 24 41 41 65 65 Plant & machine operatives nec. 433,000 0 17 17 0 0 17 17 All medium risk industrial jobs 4,588,000 4,295,000 180 180 60 60 239 239 Other substantial exposure Low risk industrial (no high risk, construction or med risk industrial) Motor mechanic 22,000 0 1 1 0 0 1 1 Draughtsmen 7,000 0 0 0 0 0 0 0 Engineers & technologists nec. 14,000 0 1 1 0 0 1 1 Stores & warehousemen 11,000 1,000 0 0 0 0 0 0 Armed forces nec. 4,000 0 0 0 0 0 0 0 Drivers & road transport workers 28,000 1,000 1 1 0 0 1 1 Other industrial not elsewhere classified 63,000 8,000 3 3 0 0 3 3 All low risk industrial jobs 149,000 10,000 6 6 0 0 7 7
12
Job /exposure category and occupation
Number ever employed in a
‘high’ or ‘medium’ risk
job in REP (Men)*
Number ever employed in a
‘high’ or ‘medium’ risk
job in REP (Women)*
Attributable Registrations
(Men)
Attributable Deaths (Men)
(2005)
Attributable Registrations
(Women)
Attributable Deaths
(Women) (2005)
Attributable Registrations
(Total)
Attributable Deaths (Total)
(2005)
< 5 years low risk industrial or non-industrial only (no medium or higher risk) Cleaners 0 1,000 0 0 0 0 0 0 Retail workers 32,000 10,000 1 1 1 1 2 2 Doctors, nurses & hospital workers 11,000 7,000 0 0 1 1 1 1 Teachers & school workers 36,000 8,000 1 1 1 1 2 2 Kitchen workers 8,000 0 0 0 0 0 0 0 Office workers 101,000 21,000 4 4 2 2 6 6 Other 117,000 13,000 6 6 1 1 7 7 All low risk non-industrial jobs 305,000 58,000 12 12 5 5 18 18 TOTAL Occupational exposure 12,648,000 4,909,000 1524 1524 78 78 1602 1602 TOTAL Occupational + paraoccupational and environmental exposure 14,360,000 10,770,000 1699 1,699 238 238 1937 1937
* Single industry estimates based on a single population control in the study by Rake et al have been excluded, but are included in the totals.
13

Table A2: Taken from Peto et al (2009) summarising mesothelioma cases in men and women attributed to asbestos exposure in each exposure category (subjects in each row are excluded in subsequent rows).
14

Table A3: Taken from Peto et al, 2009 used to estimate industry allocations of males exposed to asbestos
15

16
Table A3 (contd..) taken from Peto et al, 2009 used to estimate industry allocations of males exposed to asbestos
17
Table A4: Taken from Peto et al (2009) used to estimate industry allocations of females exposed to asbestos

Table A4: (contd.) taken from Peto et al (2009) used to estimate industry allocations of females exposed to asbestos
18
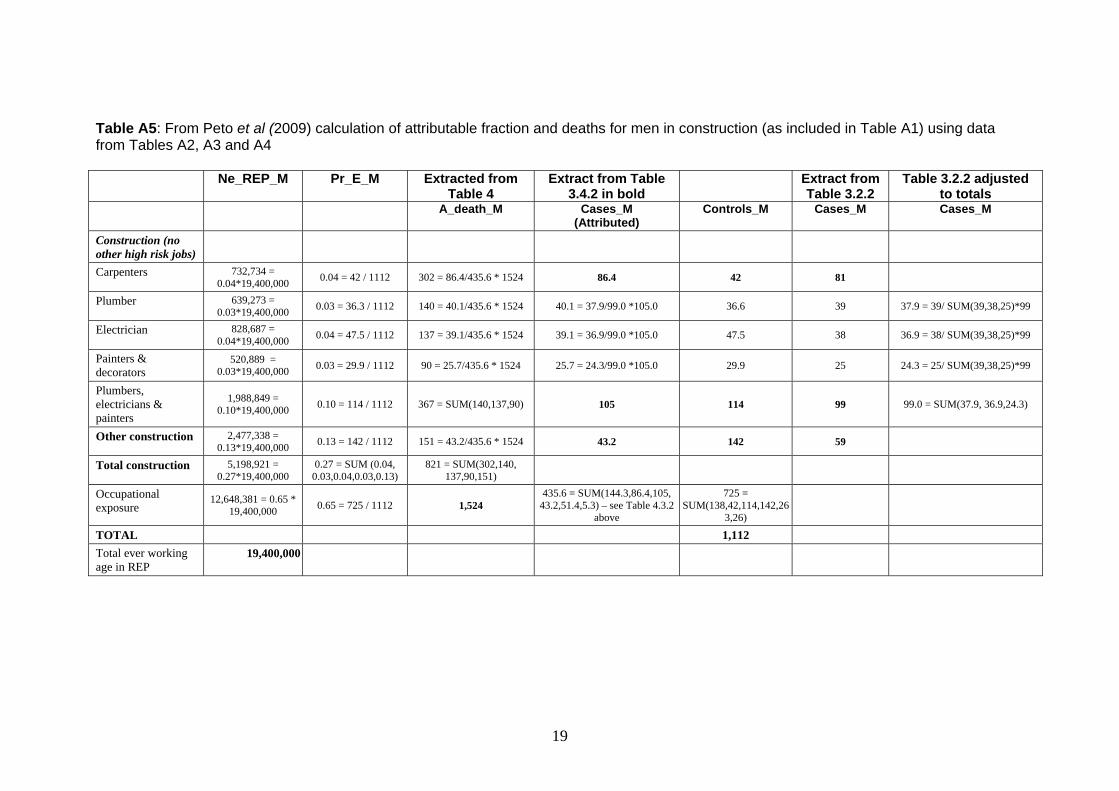
Table A5: From Peto et al (2009) calculation of attributable fraction and deaths for men in construction (as included infrom Tables A2, A3 and A4
Table A1) using data
Ne_REP_M Pr_E_M Extracted from
Table 4 Extract from Table
3.4.2 in bold Extract from
Table 3.2.2 Table 3.2.2 adjusted
to totals A_death_M Cases_M
(Attributed) Controls_M Cases_M Cases_M
Construction (no other high risk jobs)
Carpenters 732,734 = 0.04*19,400,000 0.04 = 42 / 1112 302 = 86.4/435.6 * 1524 86.4 42 81
Plumber 639,273 = 0.03*19,400,000 0.03 = 36.3 / 1112 140 = 40.1/435.6 * 1524 40.1 = 37.9/99.0 *105.0 36.6 39 37.9 = 39/ SUM(39,38,25)*99
Electrician 828,687 = 0.04*19,400,000 0.04 = 47.5 / 1112 137 = 39.1/435.6 * 1524 39.1 = 36.9/99.0 *105.0 47.5 38 36.9 = 38/ SUM(39,38,25)*99
Painters & decorators
520,889 = 0.03*19,400,000 0.03 = 29.9 / 1112 90 = 25.7/435.6 * 1524 25.7 = 24.3/99.0 *105.0 29.9 25 24.3 = 25/ SUM(39,38,25)*99
Plumbers, electricians & painters
1,988,849 = 0.10*19,400,000 0.10 = 114 / 1112 367 = SUM(140,137,90) 105 114 99 99.0 = SUM(37.9, 36.9,24.3)
Other construction 2,477,338 = 0.13*19,400,000 0.13 = 142 / 1112 151 = 43.2/435.6 * 1524 43.2 142 59
Total construction 5,198,921 = 0.27*19,400,000
0.27 = SUM (0.04, 0.03,0.04,0.03,0.13)
821 = SUM(302,140, 137,90,151)
Occupational exposure
12,648,381 = 0.65 * 19,400,000 0.65 = 725 / 1112 1,524
435.6 = SUM(144.3,86.4,105, 43.2,51.4,5.3) – see Table 4.3.2
above
725 = SUM(138,42,114,142,26
3,26)
TOTAL 1,112 Total ever working age in REP
19,400,000
19

OGRAPHY in M i C, Krstev a i E I (1 urre in Europe. Environmental Health Perspectives 107: 289-298
el J 0) Simian virus 40, poliovirus vaccines, and human cancer: research progress us m and public intere B et f th orld Health Organization, 78.
els atki H, Nielsen N, Winther J, Hjalgrim H, Gjerris F, Rosenberg P, Frisch M 3) C cidence in Denmark following exposure to poliovirus vaccine contaminated sim 40. Jour i 95: 532-539
er S L, Carbone M (1999) Cancer risk associated with Simian Virus 40 tami olio vaccine. Anticancer Research 19: 2173-2180
dner M, Saracci R (1989). Effects on health of non-occupational exposure to airborne eral fibre Non-occupational exposure to mineral fibres. In: IARC Sci Publ No 90, non J, Peto J, Saracci R (eds) pp. 375-397. n n.
dberg M, Gilg Soit Ilg A, Saves A, Frenay C, mmings S, Arveux P, Boutin C, Launoy G, Pairon J, Astoul P, Galateau-Salle F, Brochard 2006) The French National Mesothelioma Surveillance Program. Occupational and iron tal Medicine 63: 0-395 Burden of Occupational Cancer in Great Britain. mar Workshop ld 22 and 23 November 2
lth a Execu e 0 r tio f m theli rtality in Great Britain. Re rt RR , E o
el D la L, Swinb e S eiger M, Renvoize E, Hatton P (1997) Routes of stos osure and the dev p nt Occupational
Environmenta dicine 54: 403-409
en E agner J (19 k u inc nce sothelioma: animal and human enc tory tox nd pha aco y 1 9
ez-R ei P, Ru V a yi M (20 ) E uma eliomas d h sk false-positive PCR results owing to presence of 0 se n comm plasmid Lancet ; 1157-1166
onald J, McD ld A (1994) Mesothelioma: is there a background : The mesothelial and mesothelioma. Bignon (eds p 45 er: New York, el, H Kong.
lve P e H gso (2 5 s elioma mortality in Great ain f 1968 to 200 c a a edicine 55
P, Giese e J (1998) Po nti ex sureng 1957: no impact on cancer incidence rates 1960 to 199 ents in Biological dardisation 94: 227-2
e , Schenke n nd mesothelioma. t ion in pulmonary medicine
, R e Gilham C and Hatch J ( ccupational, domestic and environmental elioma risks in Britain, a case-control study. HSE Research reports RR696: ww.hse.go search/rrpdf/rr696.pdf
L, Day HW, Wang W, Beckett LA, Schenker MB (2005) Residential proximity to ly occurring asbestos and mesot a r m Crit Care Med : 1019-25
5. BIBLIS, R
sts.
Albof c
Butvers
Eng(200with
Fishcon
GarminBigLyo
GolChaP (EnvSum
HeaHSE
Howasbeand
Ilgrevid
Lópin hSV4
McDcellBas
McEBrit
OlinduriStan
OrenstCurren
Peto Jmesothhttp://w
Pan Xnatural172(8)
, Magnt tren
(200edia
nands
pit
ull
, Shef
in o
er
e W
999) Asbestos and cancer: An overview
E, Kanceian v
, Wnated p
r inirus
eber
nal of the Nat onal Cancer Institute
s. In
Imbernon E, Rolland P,
Inter ational Agency for Research on Cancer:
M, de Quillacq
meny Repo
nd Ssearch
, Arb exp
39 he
(20 HS
urnelo
rt of
ty epo
ster
on
9) P Bo
L, me
004
oma moafe R
tiv728
ojecks.
chw of mesothelioma in an English region.
n o eso
l Me
, We. Reg
íos Fn mequen
91)icology a
sch anon laboratory
Bac
, L hig
gro
dan ri
nd rm
of
idelog
04
s.
of3: 1
vidence against a role for SV40 infection
me33-14
364
ula
, Illsothces i
ona ? In J, Jaurand M.-C.
riccup
te
) p
00: 7
. 37-
) Me9-87
. Marcel Dekk
oth
ong
nny D, Darnton rom
A, 1. O
M,tion
al
odl M
po
n J
to SV40 in polio vaccines used in Sweden ck3. Developm
expo
33
r M in M opin
ak
(2000) Enviro 6: 37
2009). O
menta1-377
l asbestos sure a
C,
v.uk/re
helioma risk in C lifo nia. A J Respir
20
Rake C, Gilham C, Hatch J, Darnton A, Hodgson H, Peto J (2009) Occupational, domestic and environmental mesothelioma n: a case–control study. British Journal of Cancer 100(7): 1175-
upational and
burden of
r rates. Journal of
erg P (2003) Trends in US
orth Western Cape Province. British Journal of Industrial Medicine 17: 260-271
risks in the British populatio83.
Spirtas R, Heineman E, Bernstein L, Beebe G, Keehn R, Stark A, Harlow B, Benichou J (1994) Malignant mesothelioma: attributable risk of asbestos exposure. OccEnvironmental Medicine 51: 804-811
Steenland K, Armstrong B (2006) An overview of methods for calculating thedisease due to specific risk factors. Epidemiology 17: 512-519
Strickler H, Rosenberg P, Devesa S, Hertel J, Fraumeni J, Goedert J (1998) Contamination of poliovirus vaccines with simian virus 40 (1955-1963) and subsequent cancethe American Medical Association 279: 292-295
Strickler H, Goedert J, Devesa S, Lahey J, Fraumeni J, Rosenbpleural mesothelioma incidence rates following Simian Virus 40 contamination of early poliovirus vaccines. Journal of the National Cancer Institute 95: 38-45
Wagner J, Sleggs C, Marchand P (1960) Diffuse pleural mesothelioma and asbestos exposure in the N
Yates D, Corrin B, Stidolph P, Browne K (1997) Malignant mesothelioma in south east England: clinicopathological experience of 272 cases. Thorax 52: 507-512
21

Published by the Health and Safety Executive 06/12
The burden of occupational cancer in Great BritainMesothelioma
Health and Safety Executive
RR861
www.hse.gov.uk
The aim of this project was to produce an updated estimate of the current burden of cancer for Great Britain resulting from occupational exposure to carcinogenic agents or exposure circumstances. Estimation was carried out for carcinogenic agents or exposure circumstances classified by the International Agency for Research on Cancer (IARC) as definite (Group 1) or probable (Group 2A) human carcinogens. Here, we present estimates for mesothelioma derived using mortality data for calendar year 2005. The methodological approach used informed judgement about the proportion of mesothelioma cases in Great Britain attributable to occupational and paraoccupational and environmental (indirect industrial exposures) asbestos exposures based on evidence from UK published studies.
The estimated total (male and female) fraction of mesothelioma attributable to occupation and para-occupation is 95.1% (95%Confidence Interval (CI)= 93.0-96.9), which equates to 1937 (95%CI=1898-1976) deaths and 1,937 (95%CI=1898-1976) registrations.
This report and the work it describes were funded by the Health and Safety Executive (HSE). Its contents, including any opinions and/or conclusions expressed, are those of the authors alone and do not necessarily reflect HSE policy.