Embed Size (px)
Citation preview
Health and Safety Executive
A study of the slip characteristics of metal flooring materials
Prepared by the Health and Safety Laboratory for the Health and Safety Executive 2007
RR534 Research Report

© Crown copyright 2007
First published 2007
All rights reserved. No part of this publication may bereproduced, stored in a retrieval system, or transmitted inany form or by any means (electronic, mechanical,photocopying, recording or otherwise) without the priorwritten permission of the copyright owner.
Applications for reproduction should be made in writing to:Licensing Division, Her Majesty’s Stationery Office,St Clements House, 2-16 Colegate, Norwich NR3 1BQor by e-mail to [email protected]
Health and Safety Executive
A study of the slip characteristics of metal flooring materials
Dr Marianne Loo-Morrey & Dr Paul Lemon Health and Safety Laboratory Harpur Hill Buxton Derbyshire SK17 9JN
The work detailed in this report was carried out at the request of Mr Stephen Taylor (Construction Division Technology Unit, HSE) in line with the HSE strategy to reduce the incidence of slip and trip accidents.
The aim of the current study was to assess the slip resistance of a wide range of industrial flooring materials, both profiled and open-grid. This type of industrial flooring has traditionally been widely used in manufacturing environments where the likelihood of gross contamination is high. In recent years there has been a dramatic increase in the amount of certain types of industrial floors that have been installed in commercial premises in the retail and hospitality sectors, as designers currently consider these types of industrial finishes to be fashionable.
Unfortunately, little is understood about the slip characteristics of these floors, although appreciable anecdotal evidence exists which suggests that this type of flooring can present a high slip potetnial in contaminated conditions. Furthermore, the slipperiness of profiled and open-grid walkway surfaces is difficult (although not impracticable) to assess with the test methods currently recognised by HSL/HSE. The current study aims to quantify the slip resistance of industrial profiled metal flooring, with a view to the incorporation of the information generated into planned British Standards.
The floor surfaces studied were assessed using the following test methods:
n Surface microroughness assessment.
n The standard UKSRG Ramp Test (based on the HSL Ramp Test Methodology).
This report and the work it describes were funded by the Health and Safety Executive (HSE). Its contents, including any opinions and/or conclusions expressed, are those of the authors alone and do not necessarily reflect HSE policy.
HSE Books
CONTENTS
1 Introduction ........................................................................................................................... 5 2 Experimental ......................................................................................................................... 6
2.1 Surface MicroRoughness .............................................................................................. 7 2.2 Ramp Test ..................................................................................................................... 7 2.3 Hardness Measurements.............................................................................................. 10
3 Results and Discussion........................................................................................................ 11 3.1 Surface Roughness Results ......................................................................................... 11 3.2 Ramp Results............................................................................................................... 14 3.3 Effect of Profiles ......................................................................................................... 19
4 Conclusions ......................................................................................................................... 23 4.1 Surface Roughness ...................................................................................................... 23 4.2 Ramp Results............................................................................................................... 24
5 Further Work....................................................................................................................... 27 6 References ........................................................................................................................... 28 Appendix 1 .................................................................................................................................. 29
2
EXECUTIVE SUMMARY
Objectives The objectives of the research presented were:
1. To determine the surface roughness characteristics of a range of industrial flooring materials.
2. To assess the anti-slip performance (coefficient of friction) of these flooring materials using the HSL ramp test method.
Main Findings Surface Roughness Results Surface microroughness data was generated on fifteen of the twenty flooring samples assessed during this study. Roughness data could not be generated on the remaining flooring samples as a result of either their macro-rough texture or their physical geometry. Measurement of the Rz surface microroughness of the floorings tested resulted in their classification under water-wet contamination as follows:
• High slip potential: five floors. • Moderate slip potential: seven floors. • Low slip potential: five floors.
The flooring materials assessed in this study therefore exhibited a range of slip potential characteristics, several being classified as being unsuitable for use in foreseeably wet areas. Their performance when subjected to the more viscous contaminants generally found in industrial areas is likely to be further compromised. Ramp Results The use of ramp-based coefficient of friction tests, specifically the HSL Ramp Test has been shown to be an effective means of determining the anti-slip performance of flooring materials. The Ramp Test also allows the assessment of a number of generic floor surface types, which may be difficult to assess using traditional techniques, such as the pendulum. Data generated with the Ramp Test using test footwear soled with standardised ‘Slider 96’ rubber (formerly known as ‘Four-S’ rubber) under water-wet contamination classified the floors under study as follows:
• High slip potential: one floor. • Moderate slip potential: two floors. • Low slip potential: seventeen floors.
Comparison between slip potential classifications obtained from ramp data and surface roughness data show higher levels of disagreement than would normally be expected for non-profiled, solid surfaces. The anti-slip performance of the industrial floors is clearly strongly influenced by other key factors. This supports previous HSL/HSE findings, which show that Rz surface microroughness information should not be used in isolation for the specification or classification of flooring materials, but rather should be used in conjunction with other salient data.
3
Effect of Footwear The initial footwear results generated also suggests that factors other than the surface roughness of the flooring are important:
• The slip resistance of heavily profiled industrial flooring materials may be heavily influenced by the degree of ‘interlock’ between the floor profiling (or grid characteristics) and the cleating pattern of the footwear used.
• The degree of interlock is likely to change with wear, of both the flooring surface and the footwear soling material during their service life.
This supports the current HSE/HSL stance that the specification of footwear issued as ‘personal protective equipment’ (PPE) should, whenever possible, be preceded by user trials of candidate footwear to determine performance and user acceptability in real workplace situations. Effect of Profiles Test data generated from ‘ex-factory’ industrial flooring using the HSL Ramp Test indicates that:
• The presence of aggressive surface profiles may improve the anti-slip performance of industrial metal flooring.
• The change in slip resistance associated with the introduction of aggressive surface profiles appears greater than can be explained simply in terms of surface micro-roughness change.
• The improved slip resistance performance is believed to be a result of the physical interlock between the flooring and footwear.
There is considerable anecdotal evidence that some in-service profiled surfaces pose a significant slip risk. This may be explained by:
• The contribution to slip resistance provided by the interlock with the profiles is likely to be high for new surfaces and may change significantly with wear.
• When the physical interlock does not occur, surface roughness measurements may give the best indication of slip potential of the flooring.
Given the strong influence of the interlock between the footwear cleating pattern and the surface profile, any potential benefit from the introduction of a profile to the flooring surface depends on the ability of the footwear to “exploit” the profile. The findings suggest that it should not be assumed that the introduction of a profiled surface would automatically improve the slip resistance experienced by a pedestrian. Heavily profiled industrial floors may exhibit a range of behaviour, and cannot be properly characterised by a single measurement technique.
4
1 INTRODUCTION
The work detailed in this report was carried out at the request of Mr. Stephen Taylor (Construction Division Technology Unit, HSE) in line with the HSE strategy to reduce the incidence of slip and trip accidents. The aim of the current study was to assess the slip resistance of a wide range of industrial flooring materials, both profiled and open-grid. This type of industrial flooring has traditionally been widely used in manufacturing environments where the likelihood of gross contamination is high. In recent years there has been a dramatic increase in the amount of certain types of industrial floors that have been installed in commercial premises in the retail and hospitality sectors, as designers currently consider these types of industrial finishes to be fashionable. Unfortunately, little is understood about the slip characteristics of these floors, although appreciable anecdotal evidence exists which suggests that this type of flooring can present a high slip potetnial in contaminated conditions. Furthermore, the slipperiness of profiled and open-grid walkway surfaces is difficult (although not impracticable) to assess with the test methods currently recognised by HSL/HSE. The current study aims to quantify the slip resistance of industrial profiled metal flooring, with a view to the incorporation of the information generated into planned British Standards. The floor surfaces studied were assessed using the following test methods:
• Surface microroughness assessment • The standard UKSRG Ramp Test (based on the HSL Ramp Test Methodology)
5
2 EXPERIMENTAL
Twenty floors were selected for study, as shown in Table 1. The floors chosen were selected to represent the extensive rage of commercially available metal and glass reinforced plastic (GRP) industrial floors. Flooring Type Metal Floors Sheet aluminum Solid sheet metal Aluminum checkerplate Solid metal profile Mild steel plate Solid sheet metal Mild steel durbar plate Solid metal profile Mild steel cold formed planks type ‘BP’ Metal planks with punched holes Mild steel cold formed planks type ‘BZ’ Metal planks with serrated slots Mild steel forge welded plain top Open grid floor Mild steel forge welded single machine serrated Open grid floor Mild steel forge welded mill serrated Open grid floor Mild steel pressure locked plain top (33 x 33mm) Open grid floor Mild steel pressure locked plain top (45 x 22mm) Open grid floor Mild steel pressure locked single serrated Open grid floor Mild steel pressure locked double serrated Open grid floor Mild steel expanded metal Open mesh floor Glass Reinforce Plastic (GRP) Floors White checkerplate Solid glass fiber composite profile Gritted GRP plate Solid glass fiber composite plate floor with grit Pultruded GRP Glass fiber open bar floor Pultruded GRP with grit Glass fiber open bar floor with grit GRP grating Glass fiber open grid floor GRP grating with grit Glass fiber open grid floor with grit
Table 2.1 Floors used in the current investigation. The slip resistance of each of the test surfaces used in the current work was assessed using standard test methods as outlined in the United Kingdom Slip Resistance Group (UKSRG) Guidelines1 using a Mitutoyo SJ-201P microroughness transducer, see Figure 2.1. This test method is often used by HSL as part of on-site slipperiness assessments and during contract research for HSE. The slip resistance of each floor was further characterized using the test methodology developed by HSL and documented in protocol HSL-PS-SOP-12.
1 Issue 2 of the Slip Resistance Group Guidelines, which were current at the time of testing.
6
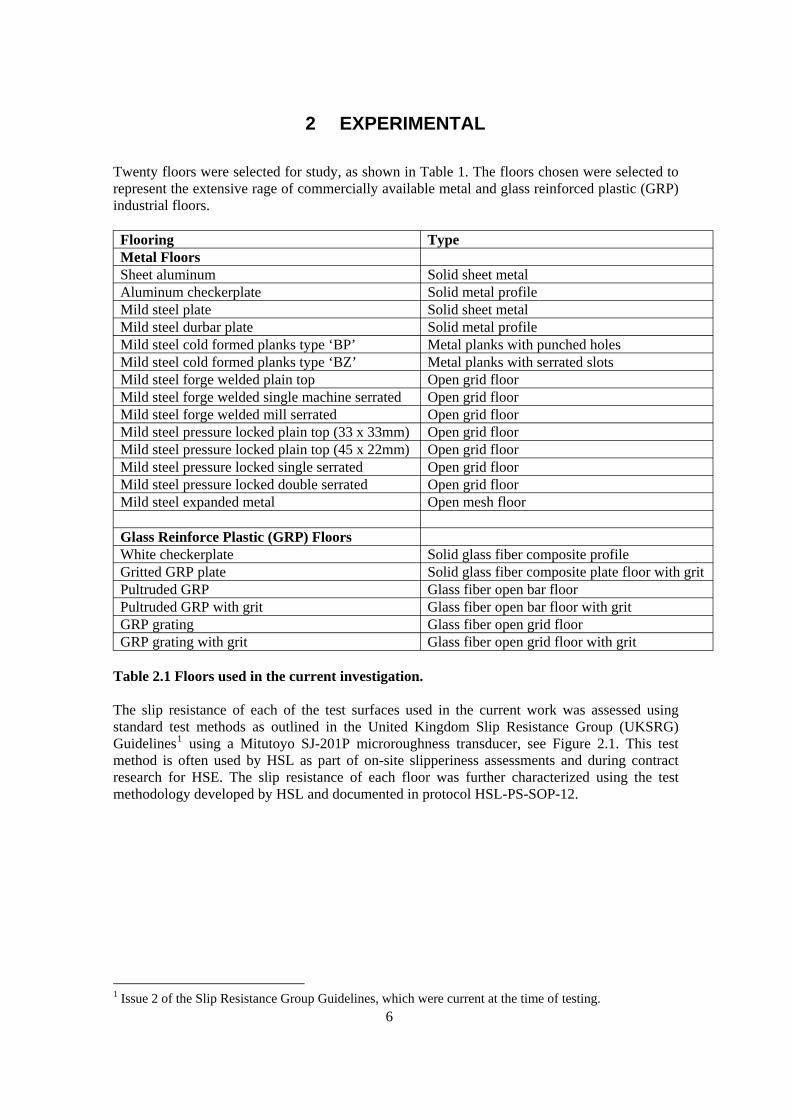
2.1 SURFACE MICROROUGHNESS During the routine slipperiness assessment of flooring materials, 10 Rz measurements are taken using a standard test methodology. The aim of the current work was to characterise the industrial flooring as completely as possible. The opportunity was therefore taken to collect a much wider range of surface roughness parameters than that routinely advised by the UKSRG (including Ra, Rz, Rq, Rt, Rp, Rmr, and Rs. See Appendix 1 for definitions).
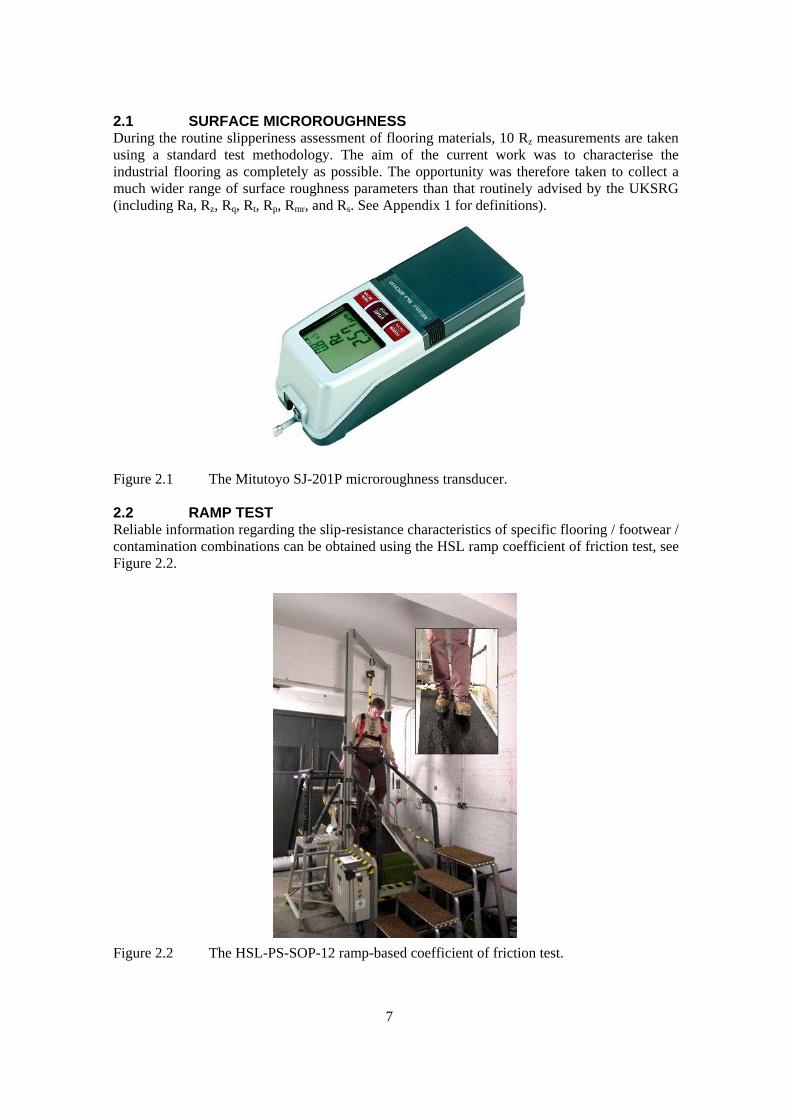
Figure 2.1 The Mitutoyo SJ-201P microroughness transducer. 2.2 RAMP TEST Reliable information regarding the slip-resistance characteristics of specific flooring / footwear / contamination combinations can be obtained using the HSL ramp coefficient of friction test, see Figure 2.2.
Figure 2.2 The HSL-PS-SOP-12 ramp-based coefficient of friction test.
7
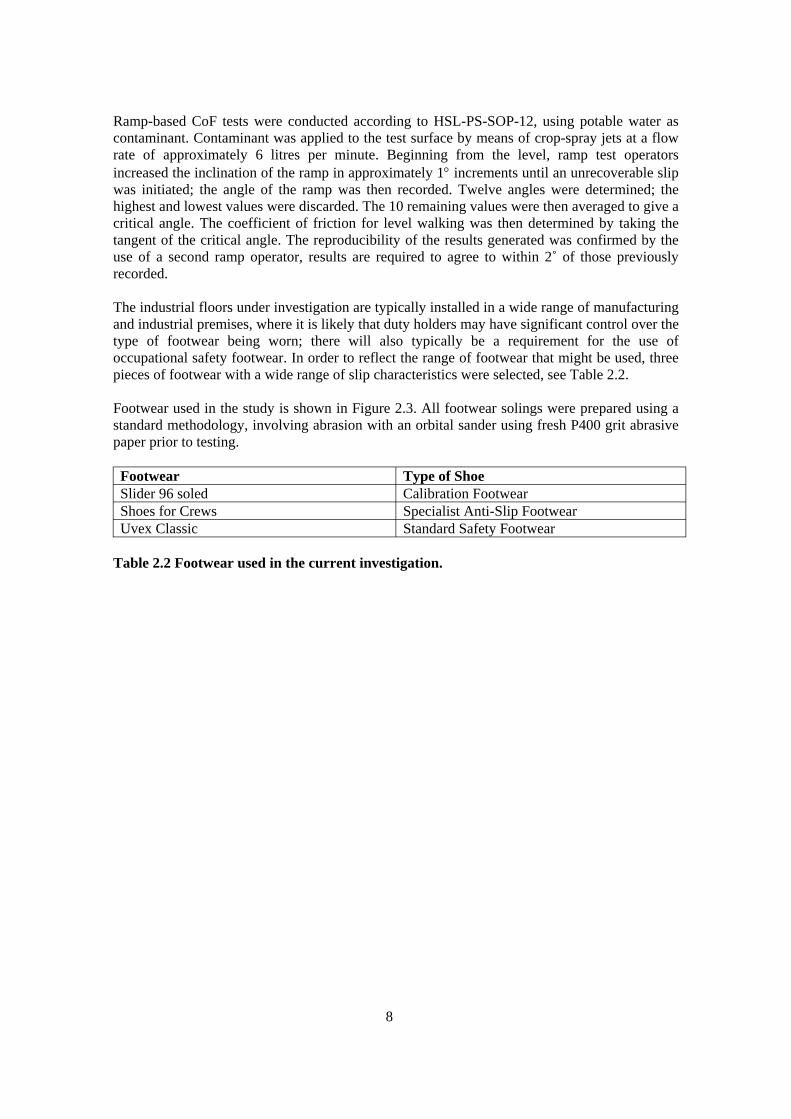
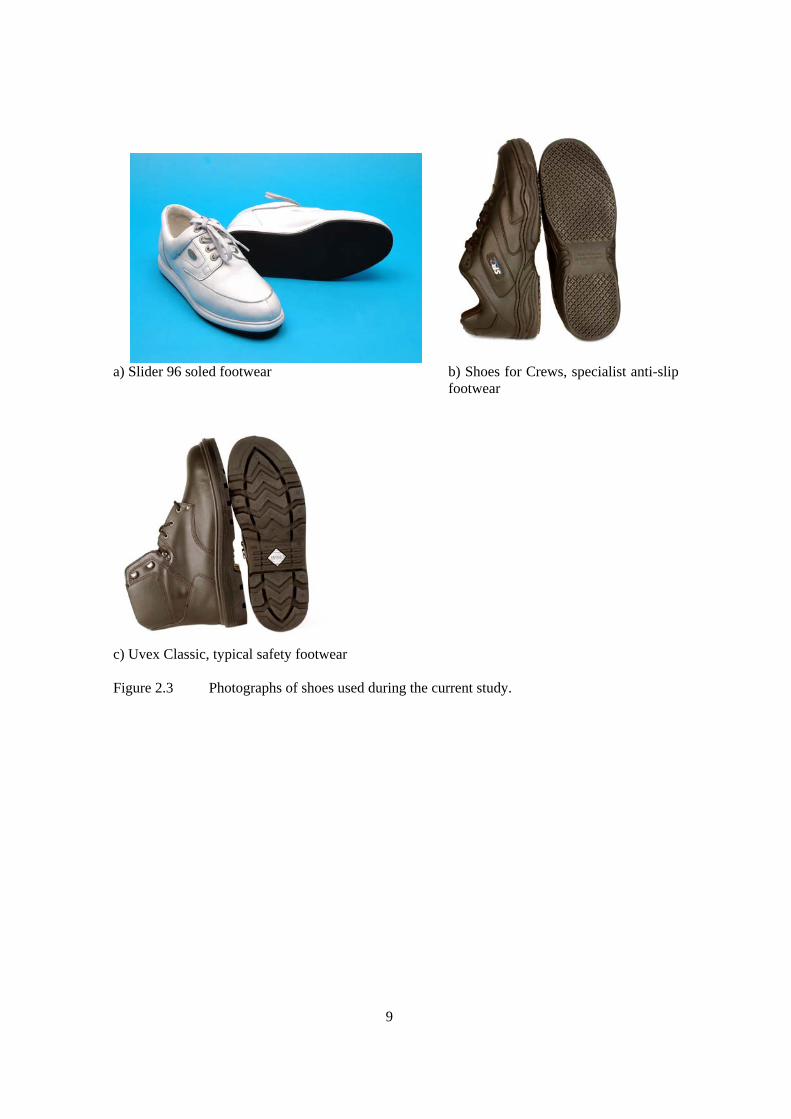
Ramp-based CoF tests were conducted according to HSL-PS-SOP-12, using potable water as contaminant. Contaminant was applied to the test surface by means of crop-spray jets at a flow rate of approximately 6 litres per minute. Beginning from the level, ramp test operators increased the inclination of the ramp in approximately 1° increments until an unrecoverable slip was initiated; the angle of the ramp was then recorded. Twelve angles were determined; the highest and lowest values were discarded. The 10 remaining values were then averaged to give a critical angle. The coefficient of friction for level walking was then determined by taking the tangent of the critical angle. The reproducibility of the results generated was confirmed by the use of a second ramp operator, results are required to agree to within 2˚ of those previously recorded. The industrial floors under investigation are typically installed in a wide range of manufacturing and industrial premises, where it is likely that duty holders may have significant control over the type of footwear being worn; there will also typically be a requirement for the use of occupational safety footwear. In order to reflect the range of footwear that might be used, three pieces of footwear with a wide range of slip characteristics were selected, see Table 2.2. Footwear used in the study is shown in Figure 2.3. All footwear solings were prepared using a standard methodology, involving abrasion with an orbital sander using fresh P400 grit abrasive paper prior to testing. Footwear Type of Shoe Slider 96 soled Calibration Footwear Shoes for Crews Specialist Anti-Slip Footwear Uvex Classic Standard Safety Footwear
Table 2.2 Footwear used in the current investigation.
8
a) Slider 96 soled footwear b) Shoes for Crews, specialist anti-slip
footwear
c) Uvex Classic, typical safety footwear Figure 2.3 Photographs of shoes used during the current study.
9
2.3 HARDNESS MEASUREMENTS Hardness measurements were taken from the soles of the footwear used. Six measurements were taken from the forepart and heel of each shoe tested. The Durotech Shore hardness meter is shown in Figure 2.4.
Figure 2.4 The Durotech M202 Shore hardness meter.
10
3 RESULTS AND DISCUSSION
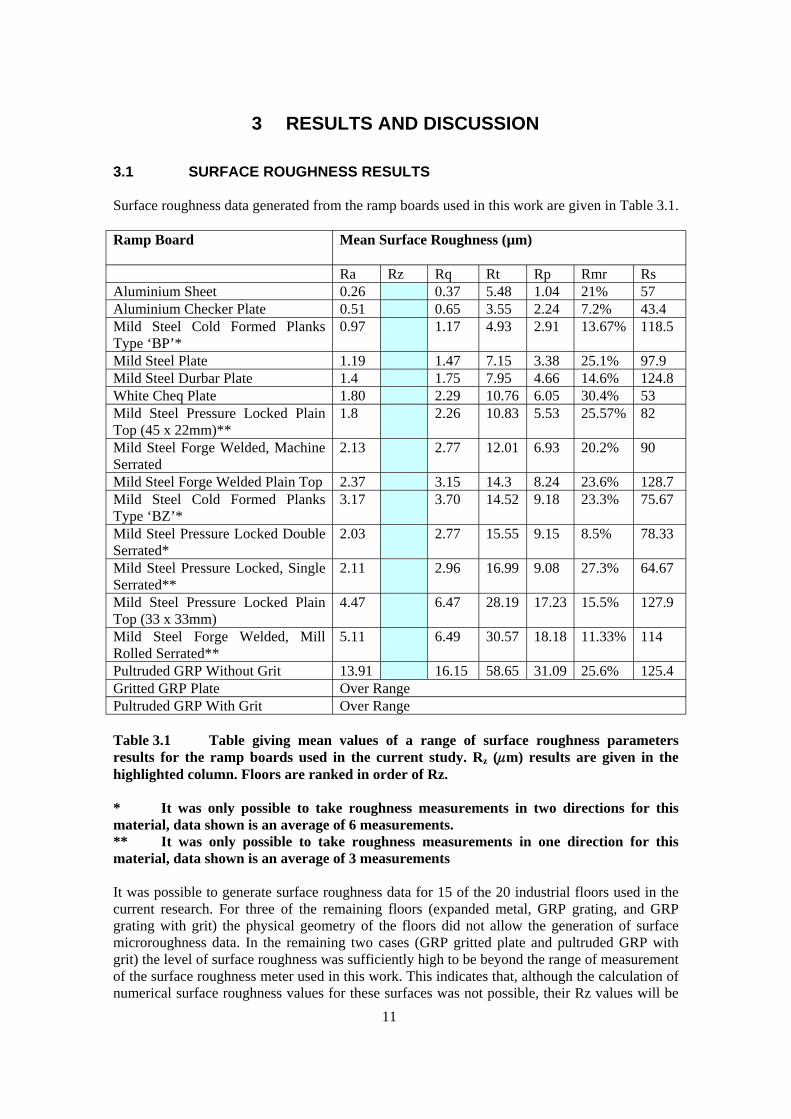
3.1 SURFACE ROUGHNESS RESULTS Surface roughness data generated from the ramp boards used in this work are given in Table 3.1. Ramp Board Mean Surface Roughness (µm)
Ra Rz Rq Rt Rp Rmr Rs Aluminium Sheet 0.26 2.26 0.37 5.48 1.04 21% 57 Aluminium Checker Plate 0.51 3.55 0.65 3.55 2.24 7.2% 43.4 Mild Steel Cold Formed Planks Type ‘BP’*
0.97 4.93 1.17 4.93 2.91 13.67% 118.5
Mild Steel Plate 1.19 7.15 1.47 7.15 3.38 25.1% 97.9 Mild Steel Durbar Plate 1.4 7.95 1.75 7.95 4.66 14.6% 124.8 White Cheq Plate 1.80 10.76 2.29 10.76 6.05 30.4% 53 Mild Steel Pressure Locked Plain Top (45 x 22mm)**
1.8 10.83 2.26 10.83 5.53 25.57% 82
Mild Steel Forge Welded, Machine Serrated
2.13 12.01 2.77 12.01 6.93 20.2% 90
Mild Steel Forge Welded Plain Top 2.37 14.3 3.15 14.3 8.24 23.6% 128.7 Mild Steel Cold Formed Planks Type ‘BZ’*
3.17 14.52 3.70 14.52 9.18 23.3% 75.67
Mild Steel Pressure Locked Double Serrated*
2.03 15.55 2.77 15.55 9.15 8.5% 78.33
Mild Steel Pressure Locked, Single Serrated**
2.11 16.99 2.96 16.99 9.08 27.3% 64.67
Mild Steel Pressure Locked Plain Top (33 x 33mm)
4.47 28.19 6.47 28.19 17.23 15.5% 127.9
Mild Steel Forge Welded, Mill Rolled Serrated**
5.11 30.57 6.49 30.57 18.18 11.33% 114
Pultruded GRP Without Grit 13.91 58.65 16.15 58.65 31.09 25.6% 125.4 Gritted GRP Plate Over Range Pultruded GRP With Grit Over Range Table 3.1 Table giving mean values of a range of surface roughness parameters results for the ramp boards used in the current study. Rz ( m) results are given in the highlighted column. Floors are ranked in order of Rz. * It was only possible to take roughness measurements in two directions for this material, data shown is an average of 6 measurements. ** It was only possible to take roughness measurements in one direction for this material, data shown is an average of 3 measurements It was possible to generate surface roughness data for 15 of the 20 industrial floors used in the current research. For three of the remaining floors (expanded metal, GRP grating, and GRP grating with grit) the physical geometry of the floors did not allow the generation of surface microroughness data. In the remaining two cases (GRP gritted plate and pultruded GRP with grit) the level of surface roughness was sufficiently high to be beyond the range of measurement of the surface roughness meter used in this work. This indicates that, although the calculation of numerical surface roughness values for these surfaces was not possible, their Rz values will be 11
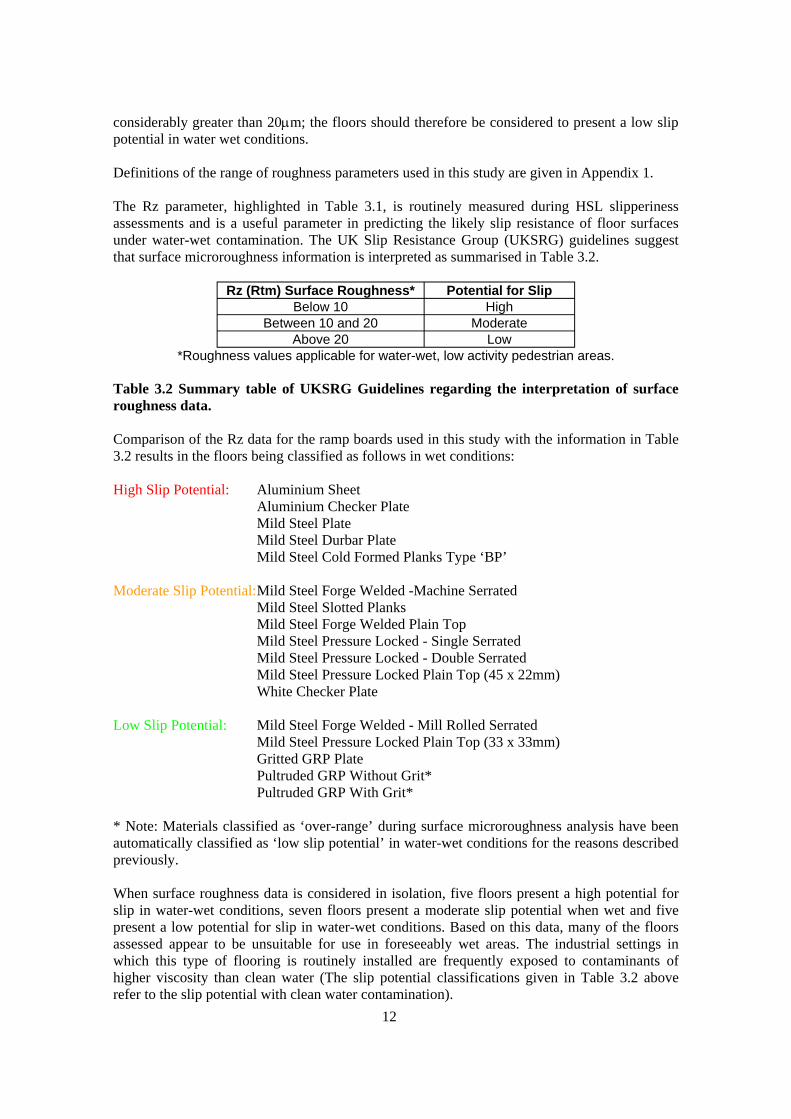
considerably greater than 20μm; the floors should therefore be considered to present a low slip potential in water wet conditions. Definitions of the range of roughness parameters used in this study are given in Appendix 1. The Rz parameter, highlighted in Table 3.1, is routinely measured during HSL slipperiness assessments and is a useful parameter in predicting the likely slip resistance of floor surfaces under water-wet contamination. The UK Slip Resistance Group (UKSRG) guidelines suggest that surface microroughness information is interpreted as summarised in Table 3.2.
Rz (Rtm) Surface Roughness* Potential for Slip Below 10 High
Between 10 and 20 Moderate Above 20 Low
*Roughness values applicable for water-wet, low activity pedestrian areas. Table 3.2 Summary table of UKSRG Guidelines regarding the interpretation of surface roughness data. Comparison of the Rz data for the ramp boards used in this study with the information in Table 3.2 results in the floors being classified as follows in wet conditions: High Slip Potential: Aluminium Sheet
Aluminium Checker Plate Mild Steel Plate Mild Steel Durbar Plate Mild Steel Cold Formed Planks Type ‘BP’
Moderate Slip Potential: Mild Steel Forge Welded -Machine Serrated
Mild Steel Slotted Planks Mild Steel Forge Welded Plain Top Mild Steel Pressure Locked - Single Serrated Mild Steel Pressure Locked - Double Serrated Mild Steel Pressure Locked Plain Top (45 x 22mm) White Checker Plate
Low Slip Potential: Mild Steel Forge Welded - Mill Rolled Serrated
Mild Steel Pressure Locked Plain Top (33 x 33mm) Gritted GRP Plate Pultruded GRP Without Grit*
Pultruded GRP With Grit* * Note: Materials classified as ‘over-range’ during surface microroughness analysis have been automatically classified as ‘low slip potential’ in water-wet conditions for the reasons described previously. When surface roughness data is considered in isolation, five floors present a high potential for slip in water-wet conditions, seven floors present a moderate slip potential when wet and five present a low potential for slip in water-wet conditions. Based on this data, many of the floors assessed appear to be unsuitable for use in foreseeably wet areas. The industrial settings in which this type of flooring is routinely installed are frequently exposed to contaminants of higher viscosity than clean water (The slip potential classifications given in Table 3.2 above refer to the slip potential with clean water contamination). 12
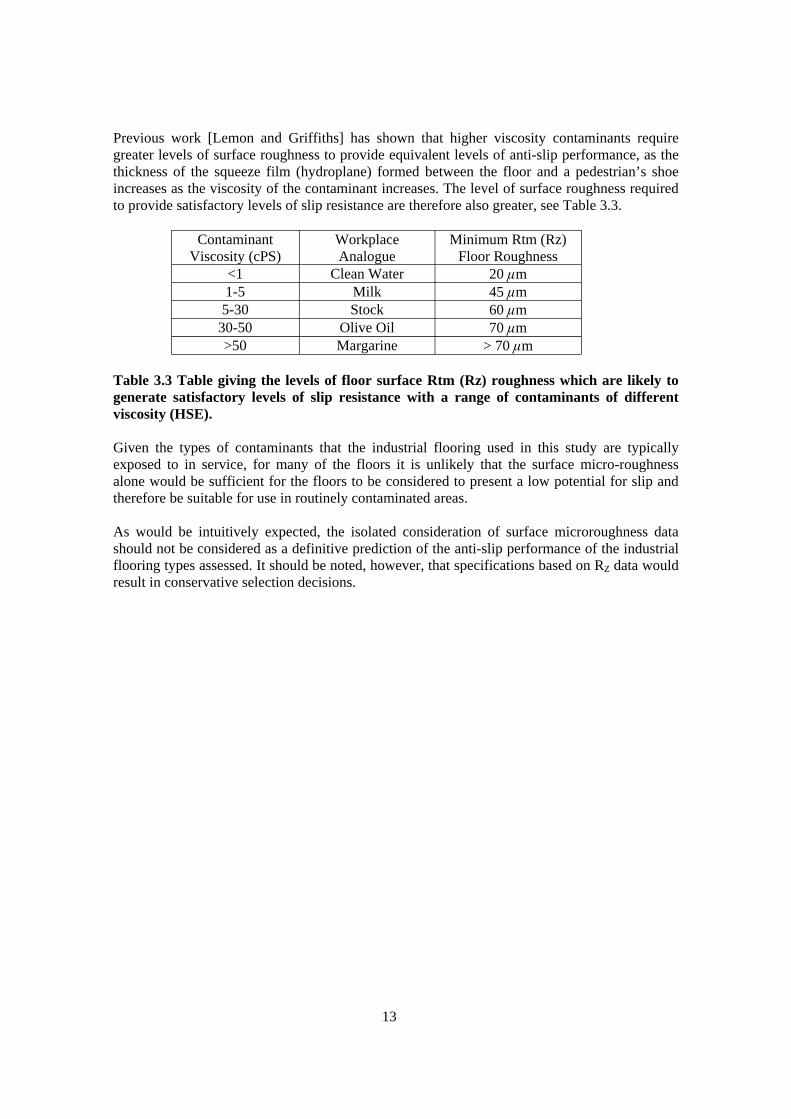
Previous work [Lemon and Griffiths] has shown that higher viscosity contaminants require greater levels of surface roughness to provide equivalent levels of anti-slip performance, as the thickness of the squeeze film (hydroplane) formed between the floor and a pedestrian’s shoe increases as the viscosity of the contaminant increases. The level of surface roughness required to provide satisfactory levels of slip resistance are therefore also greater, see Table 3.3.
Contaminant Viscosity (cPS)
Workplace Analogue
Minimum Rtm (Rz) Floor Roughness
<1 Clean Water 20 m 1-5 Milk 45 m
5-30 Stock 60 m 30-50 Olive Oil 70 m >50 Margarine > 70 m
Table 3.3 Table giving the levels of floor surface Rtm (Rz) roughness which are likely to generate satisfactory levels of slip resistance with a range of contaminants of different viscosity (HSE). Given the types of contaminants that the industrial flooring used in this study are typically exposed to in service, for many of the floors it is unlikely that the surface micro-roughness alone would be sufficient for the floors to be considered to present a low potential for slip and therefore be suitable for use in routinely contaminated areas. As would be intuitively expected, the isolated consideration of surface microroughness data should not be considered as a definitive prediction of the anti-slip performance of the industrial flooring types assessed. It should be noted, however, that specifications based on RZ data would result in conservative selection decisions.
13
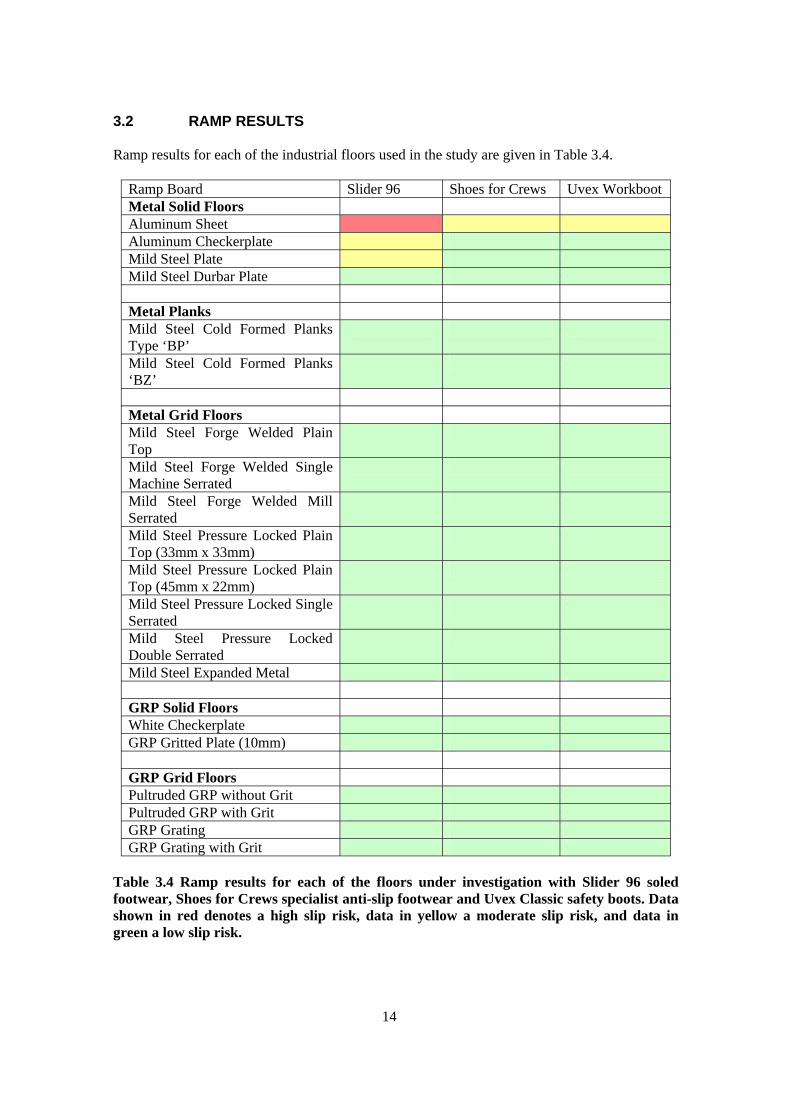
3.2 RAMP RESULTS Ramp results for each of the industrial floors used in the study are given in Table 3.4.
Ramp Board Slider 96 Shoes for Crews Uvex Workboot Metal Solid Floors Aluminum Sheet 0.13 0.3 0.28 Aluminum Checkerplate 0.28 0.54 0.54 Mild Steel Plate 0.23 0.84+ 0.84+ Mild Steel Durbar Plate 0.69 0.84+ 0.84+ Metal Planks Mild Steel Cold Formed Planks Type ‘BP’
0.67 0.71 0.71
Mild Steel Cold Formed Planks ‘BZ’
0.84+ 0.84+ 0.84+
Metal Grid Floors Mild Steel Forge Welded Plain Top
0.44 0.78 0.74
Mild Steel Forge Welded Single Machine Serrated
0.66 0.84+ 0.84+
Mild Steel Forge Welded Mill Serrated
0.66 0.84+ 0.83+
Mild Steel Pressure Locked Plain Top (33mm x 33mm)
0.65 0.84+ 0.84+
Mild Steel Pressure Locked Plain Top (45mm x 22mm)
0.41 0.84+ 0.84+
Mild Steel Pressure Locked Single Serrated
0.84+ 0.84+ 0.84+
Mild Steel Pressure Locked Double Serrated
0.69 0.84+ 0.84+
Mild Steel Expanded Metal 0.67 0.84+ 0.84+ GRP Solid Floors White Checkerplate 0.57 0.74 0.73 GRP Gritted Plate (10mm) 0.84+ 0.84+ 0.84+ GRP Grid Floors Pultruded GRP without Grit 0.59 0.75 0.84+ Pultruded GRP with Grit 0.84+ 0.84+ 0.84+ GRP Grating 0.56 0.77 0.78 GRP Grating with Grit 0.84+ 0.84+ 0.84+
Table 3.4 Ramp results for each of the floors under investigation with Slider 96 soled footwear, Shoes for Crews specialist anti-slip footwear and Uvex Classic safety boots. Data shown in red denotes a high slip risk, data in yellow a moderate slip risk, and data in green a low slip risk.
14
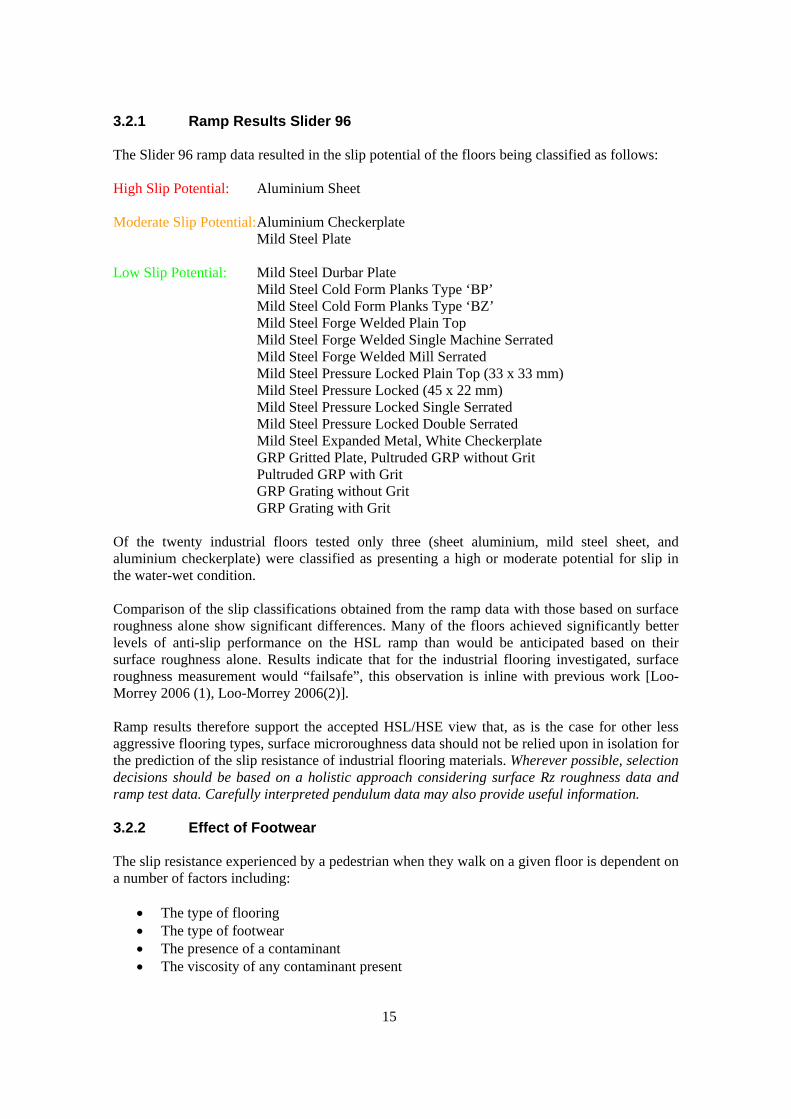
3.2.1 Ramp Results Slider 96 The Slider 96 ramp data resulted in the slip potential of the floors being classified as follows: High Slip Potential: Aluminium Sheet Moderate Slip Potential: Aluminium Checkerplate
Mild Steel Plate Low Slip Potential: Mild Steel Durbar Plate
Mild Steel Cold Form Planks Type ‘BP’ Mild Steel Cold Form Planks Type ‘BZ’ Mild Steel Forge Welded Plain Top Mild Steel Forge Welded Single Machine Serrated Mild Steel Forge Welded Mill Serrated Mild Steel Pressure Locked Plain Top (33 x 33 mm) Mild Steel Pressure Locked (45 x 22 mm) Mild Steel Pressure Locked Single Serrated Mild Steel Pressure Locked Double Serrated Mild Steel Expanded Metal, White Checkerplate GRP Gritted Plate, Pultruded GRP without Grit Pultruded GRP with Grit GRP Grating without Grit GRP Grating with Grit
Of the twenty industrial floors tested only three (sheet aluminium, mild steel sheet, and aluminium checkerplate) were classified as presenting a high or moderate potential for slip in the water-wet condition. Comparison of the slip classifications obtained from the ramp data with those based on surface roughness alone show significant differences. Many of the floors achieved significantly better levels of anti-slip performance on the HSL ramp than would be anticipated based on their surface roughness alone. Results indicate that for the industrial flooring investigated, surface roughness measurement would “failsafe”, this observation is inline with previous work [Loo-Morrey 2006 (1), Loo-Morrey 2006(2)]. Ramp results therefore support the accepted HSL/HSE view that, as is the case for other less aggressive flooring types, surface microroughness data should not be relied upon in isolation for the prediction of the slip resistance of industrial flooring materials. Wherever possible, selection decisions should be based on a holistic approach considering surface Rz roughness data and ramp test data. Carefully interpreted pendulum data may also provide useful information. 3.2.2 Effect of Footwear The slip resistance experienced by a pedestrian when they walk on a given floor is dependent on a number of factors including:
• The type of flooring • The type of footwear • The presence of a contaminant • The viscosity of any contaminant present
15
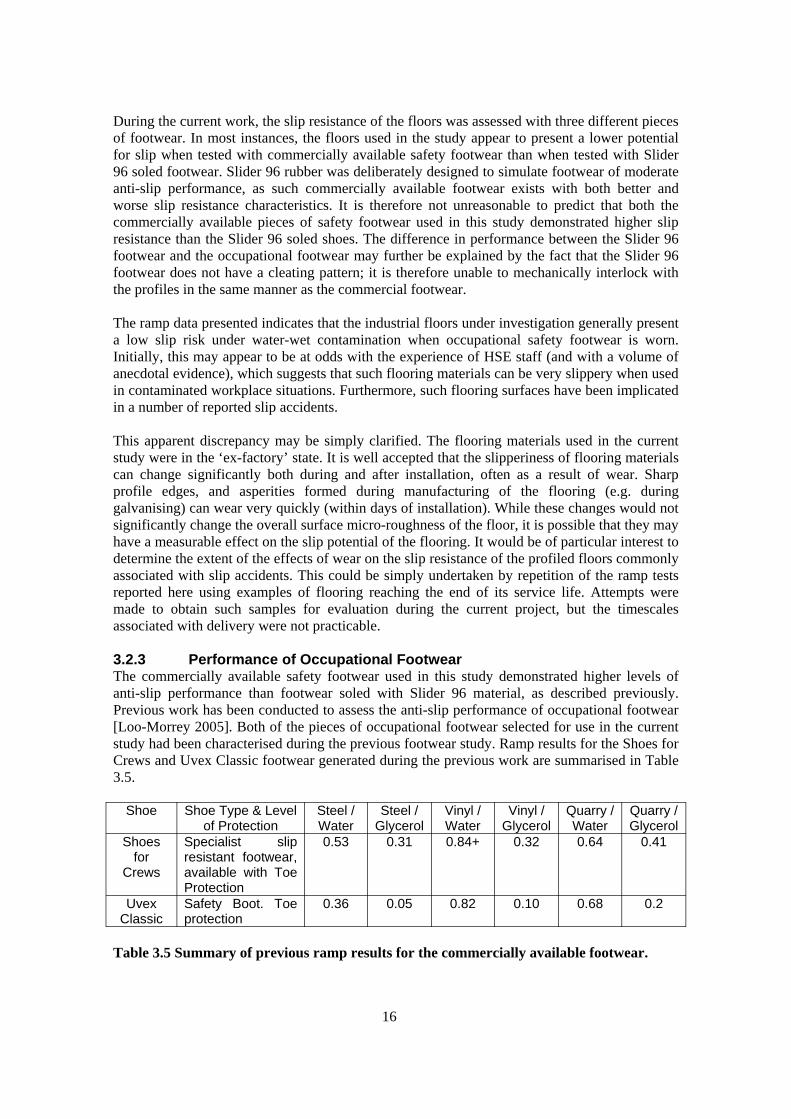
During the current work, the slip resistance of the floors was assessed with three different pieces of footwear. In most instances, the floors used in the study appear to present a lower potential for slip when tested with commercially available safety footwear than when tested with Slider 96 soled footwear. Slider 96 rubber was deliberately designed to simulate footwear of moderate anti-slip performance, as such commercially available footwear exists with both better and worse slip resistance characteristics. It is therefore not unreasonable to predict that both the commercially available pieces of safety footwear used in this study demonstrated higher slip resistance than the Slider 96 soled shoes. The difference in performance between the Slider 96 footwear and the occupational footwear may further be explained by the fact that the Slider 96 footwear does not have a cleating pattern; it is therefore unable to mechanically interlock with the profiles in the same manner as the commercial footwear. The ramp data presented indicates that the industrial floors under investigation generally present a low slip risk under water-wet contamination when occupational safety footwear is worn. Initially, this may appear to be at odds with the experience of HSE staff (and with a volume of anecdotal evidence), which suggests that such flooring materials can be very slippery when used in contaminated workplace situations. Furthermore, such flooring surfaces have been implicated in a number of reported slip accidents. This apparent discrepancy may be simply clarified. The flooring materials used in the current study were in the ‘ex-factory’ state. It is well accepted that the slipperiness of flooring materials can change significantly both during and after installation, often as a result of wear. Sharp profile edges, and asperities formed during manufacturing of the flooring (e.g. during galvanising) can wear very quickly (within days of installation). While these changes would not significantly change the overall surface micro-roughness of the floor, it is possible that they may have a measurable effect on the slip potential of the flooring. It would be of particular interest to determine the extent of the effects of wear on the slip resistance of the profiled floors commonly associated with slip accidents. This could be simply undertaken by repetition of the ramp tests reported here using examples of flooring reaching the end of its service life. Attempts were made to obtain such samples for evaluation during the current project, but the timescales associated with delivery were not practicable. 3.2.3 Performance of Occupational Footwear The commercially available safety footwear used in this study demonstrated higher levels of anti-slip performance than footwear soled with Slider 96 material, as described previously. Previous work has been conducted to assess the anti-slip performance of occupational footwear [Loo-Morrey 2005]. Both of the pieces of occupational footwear selected for use in the current study had been characterised during the previous footwear study. Ramp results for the Shoes for Crews and Uvex Classic footwear generated during the previous work are summarised in Table 3.5.
Shoe Shoe Type & Level of Protection
Steel / Water
Steel / Glycerol
Vinyl / Water
Vinyl / Glycerol
Quarry / Water
Quarry / Glycerol
Shoes for
Crews
Specialist slip resistant footwear, available with Toe Protection
0.53 0.31 0.84+ 0.32 0.64 0.41
Uvex Classic
Safety Boot. Toe protection
0.36 0.05 0.82 0.10 0.68 0.2
Table 3.5 Summary of previous ramp results for the commercially available footwear.
16
As can be seen from Table 3.5, the Shoes for Crews (specialist anti-slip footwear) generally out-performed the Uvex Classic boot in the previous study. It should be noted that the performance difference between the two footwear types was greatest in the most demanding test conditions. In less demanding situations (water on vinyl, water on quarry), the anti slip performance of the shoes were very similar. To summarise,
• Shoes for Crews (SFC) footwear continues to represent one of the best performing pieces of anti-slip footwear identified to date.
• The Uvex Classic boot was selected, as it is typical of the type of footwear worn in environments where industrial flooring materials are likely to be installed. The sole cleating pattern is a variant of one of the most common patterns used on occupational footwear intended for use in the manufacturing sector.
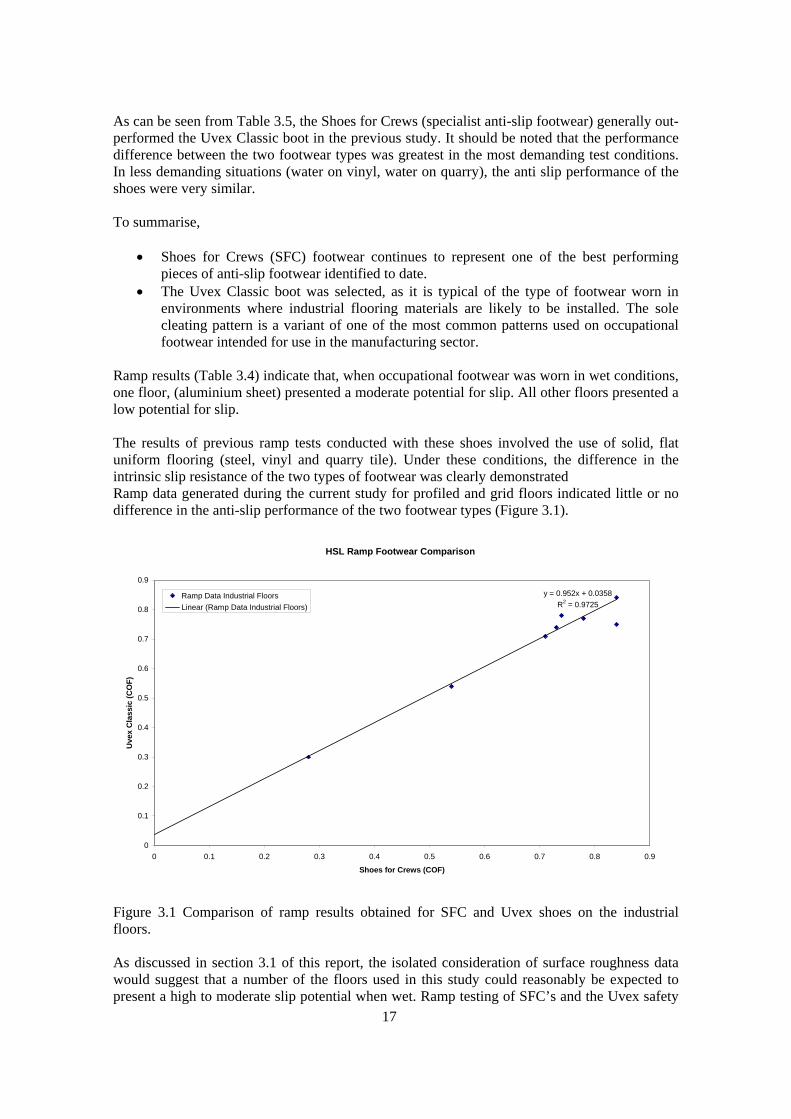
Ramp results (Table 3.4) indicate that, when occupational footwear was worn in wet conditions, one floor, (aluminium sheet) presented a moderate potential for slip. All other floors presented a low potential for slip. The results of previous ramp tests conducted with these shoes involved the use of solid, flat uniform flooring (steel, vinyl and quarry tile). Under these conditions, the difference in the intrinsic slip resistance of the two types of footwear was clearly demonstrated Ramp data generated during the current study for profiled and grid floors indicated little or no difference in the anti-slip performance of the two footwear types (Figure 3.1).
Figure 3.1 Comparison of ramp results obtained for SFC and Uvex shoes on the industrial floors. As discussed in section 3.1 of this report, the isolated consideration of surface roughness data would suggest that a number of the floors used in this study could reasonably be expected to present a high to moderate slip potential when wet. Ramp testing of SFC’s and the Uvex safety
HSL Ramp Footwear Comparison
y = 0.952x + 0.0358R2 = 0.9725
0
0.1
0.2
0.3
0.4
0.5
0.6
0.7
0.8
0.9
0 0.1 0.2 0.3 0.4 0.5 0.6 0.7 0.8 0.9
Shoes for Crews (COF)
Uve
x C
lass
ic (C
OF)
Ramp Data Industrial FloorsLinear (Ramp Data Industrial Floors)
17
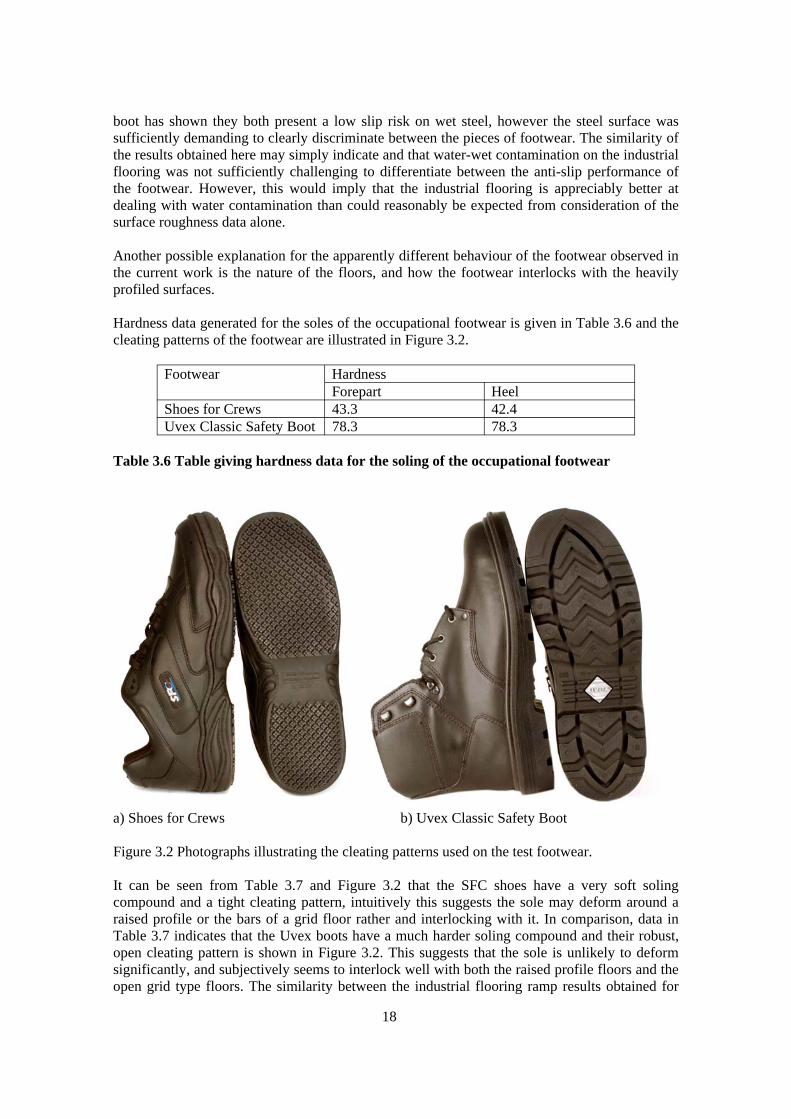
boot has shown they both present a low slip risk on wet steel, however the steel surface was sufficiently demanding to clearly discriminate between the pieces of footwear. The similarity of the results obtained here may simply indicate and that water-wet contamination on the industrial flooring was not sufficiently challenging to differentiate between the anti-slip performance of the footwear. However, this would imply that the industrial flooring is appreciably better at dealing with water contamination than could reasonably be expected from consideration of the surface roughness data alone. Another possible explanation for the apparently different behaviour of the footwear observed in the current work is the nature of the floors, and how the footwear interlocks with the heavily profiled surfaces. Hardness data generated for the soles of the occupational footwear is given in Table 3.6 and the cleating patterns of the footwear are illustrated in Figure 3.2.
Footwear Hardness Forepart Heel
Shoes for Crews 43.3 42.4 Uvex Classic Safety Boot 78.3 78.3
Table 3.6 Table giving hardness data for the soling of the occupational footwear
a) Shoes for Crews b) Uvex Classic Safety Boot Figure 3.2 Photographs illustrating the cleating patterns used on the test footwear. It can be seen from Table 3.7 and Figure 3.2 that the SFC shoes have a very soft soling compound and a tight cleating pattern, intuitively this suggests the sole may deform around a raised profile or the bars of a grid floor rather and interlocking with it. In comparison, data in Table 3.7 indicates that the Uvex boots have a much harder soling compound and their robust, open cleating pattern is shown in Figure 3.2. This suggests that the sole is unlikely to deform significantly, and subjectively seems to interlock well with both the raised profile floors and the open grid type floors. The similarity between the industrial flooring ramp results obtained for
18
the SFC and Uvex footwear may therefore be a result of the superior ability of the Uvex cleating pattern to interlock with the floors compensating for the superior intrinsic slip resistance of the SFC footwear. Essentially the similarity in the ramp results for these two pieced of footwear was unexpected. Previous experience with the footwear, indicated that on flooring surfaces with low levels of surface roughness the SFC’s would have been expected to routinely out perform the Uvex boots. Clearly this did not happen during the current work, and results suggests the interaction between footwear and heavily profiled flooring may be more complex then previously appreciated. Although the findings of this work are based a very sample of occupational footwear, they indicate that caution should be used when using ramp data generated on non-profiled floors as a guide to the likely performance for a given piece of footwear on a given profile. Although there are a number of limitations in the results discussed here:
• The results were generated using ex-factory flooring material. • They do not take into account the effects of wear that would be seen in service. • The sample of occupational footwear used is very small.
Even with the above limitations, the work in the current study suggests the following points:
• It is difficult to predict how a given piece of footwear will perform on a profiled floor. • The slip resistance experienced by a pedestrian walking on these types of industrial
flooring may be determined by the degree to which the cleating pattern of their footwear is able to interlock with the flooring and not necessarily the intrinsic anti-slip performance of the footwear itself. Or it may be a combination of both.
• The use of specialist anti-slip footwear in areas where industrial type flooring has been installed may not always result in pedestrians experiencing improved levels of slip resistance.
3.3 EFFECT OF PROFILES Previous work on profiled surfaces has concentrated on the slip resistance of lightly profiled ceramic tiles [Lemon, Thorpe and Griffiths (a)]. This work showed that the surface micro-roughness present on the profile, and not the presence of the profile, was the overriding influence on the slip resistance of the lightly profiled ceramic tiles studied. In the current study there were two cases where it was possible to compare the slip resistance of the sheet form of the material with the profiled form:
1. Aluminium sheet / Aluminium checker plate 2. Mild steel sheet / Mild steel durbar plate
The surface roughness data and ramp results for these floors are compared in Table 3.7 and 3.8.
19
Ramp Board Average Surface Roughness (µm) Ra Rz Rq Rt Rp Rmr Rs Aluminium Sheet 0.26 2.26 0.37 5.48 1.04 21% 57 Aluminium Checker Plate
0.51 3.55 0.65 3.55 2.24 7.2% 43.4
Mild Steel Plate 1.19 7.15 1.47 7.15 3.38 25.1% 97.9 Mild Steel Durbar Plate
1.4 7.95 1.75 7.95 4.66 14.6% 124.8
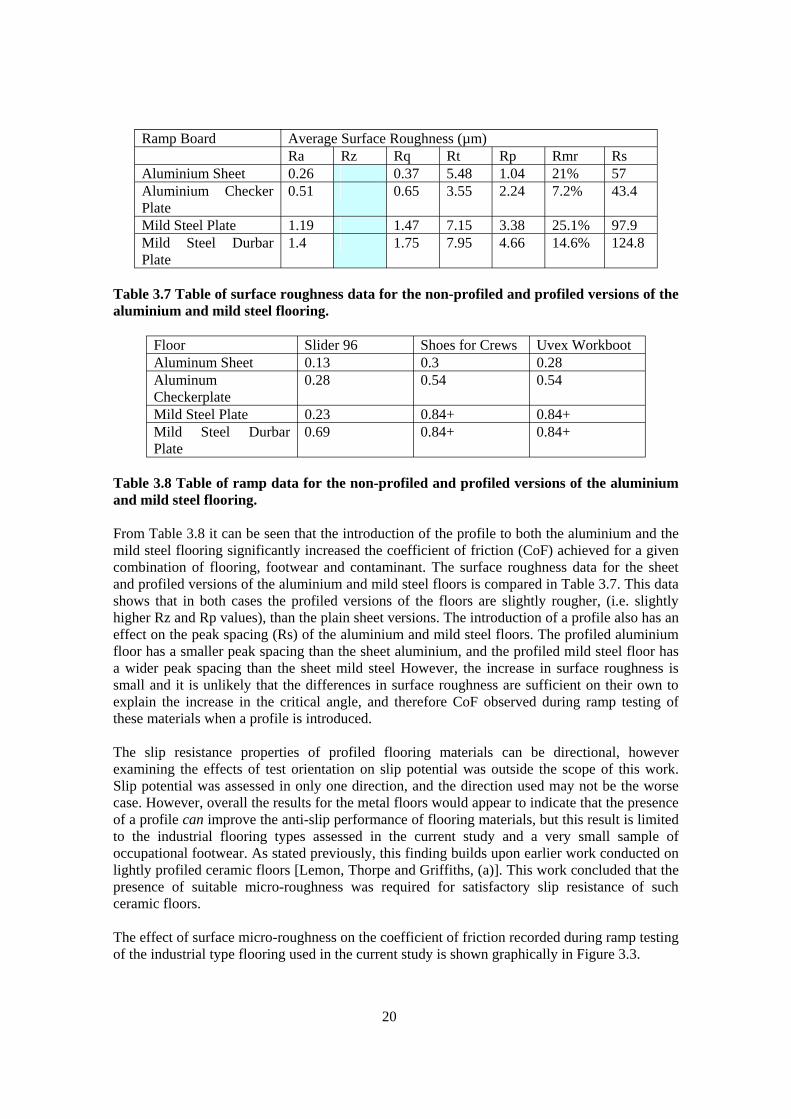
Table 3.7 Table of surface roughness data for the non-profiled and profiled versions of the aluminium and mild steel flooring.
Floor Slider 96 Shoes for Crews Uvex Workboot Aluminum Sheet 0.13 0.3 0.28 Aluminum Checkerplate
0.28 0.54 0.54
Mild Steel Plate 0.23 0.84+ 0.84+ Mild Steel Durbar Plate
0.69 0.84+ 0.84+
Table 3.8 Table of ramp data for the non-profiled and profiled versions of the aluminium and mild steel flooring. From Table 3.8 it can be seen that the introduction of the profile to both the aluminium and the mild steel flooring significantly increased the coefficient of friction (CoF) achieved for a given combination of flooring, footwear and contaminant. The surface roughness data for the sheet and profiled versions of the aluminium and mild steel floors is compared in Table 3.7. This data shows that in both cases the profiled versions of the floors are slightly rougher, (i.e. slightly higher Rz and Rp values), than the plain sheet versions. The introduction of a profile also has an effect on the peak spacing (Rs) of the aluminium and mild steel floors. The profiled aluminium floor has a smaller peak spacing than the sheet aluminium, and the profiled mild steel floor has a wider peak spacing than the sheet mild steel However, the increase in surface roughness is small and it is unlikely that the differences in surface roughness are sufficient on their own to explain the increase in the critical angle, and therefore CoF observed during ramp testing of these materials when a profile is introduced. The slip resistance properties of profiled flooring materials can be directional, however examining the effects of test orientation on slip potential was outside the scope of this work. Slip potential was assessed in only one direction, and the direction used may not be the worse case. However, overall the results for the metal floors would appear to indicate that the presence of a profile can improve the anti-slip performance of flooring materials, but this result is limited to the industrial flooring types assessed in the current study and a very small sample of occupational footwear. As stated previously, this finding builds upon earlier work conducted on lightly profiled ceramic floors [Lemon, Thorpe and Griffiths, (a)]. This work concluded that the presence of suitable micro-roughness was required for satisfactory slip resistance of such ceramic floors. The effect of surface micro-roughness on the coefficient of friction recorded during ramp testing of the industrial type flooring used in the current study is shown graphically in Figure 3.3.
20
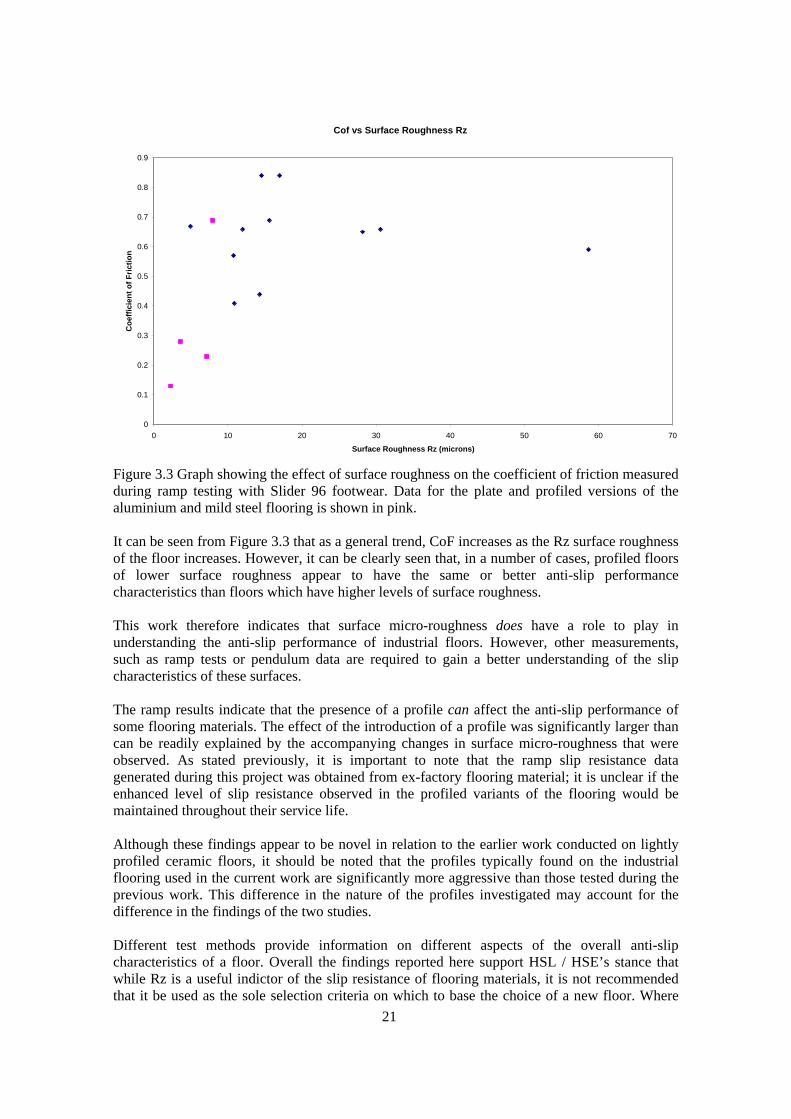
Figure 3.3 Graph showing the effect of surface roughness on the coefficient of friction measured during ramp testing with Slider 96 footwear. Data for the plate and profiled versions of the aluminium and mild steel flooring is shown in pink. It can be seen from Figure 3.3 that as a general trend, CoF increases as the Rz surface roughness of the floor increases. However, it can be clearly seen that, in a number of cases, profiled floors of lower surface roughness appear to have the same or better anti-slip performance characteristics than floors which have higher levels of surface roughness. This work therefore indicates that surface micro-roughness does have a role to play in understanding the anti-slip performance of industrial floors. However, other measurements, such as ramp tests or pendulum data are required to gain a better understanding of the slip characteristics of these surfaces. The ramp results indicate that the presence of a profile can affect the anti-slip performance of some flooring materials. The effect of the introduction of a profile was significantly larger than can be readily explained by the accompanying changes in surface micro-roughness that were observed. As stated previously, it is important to note that the ramp slip resistance data generated during this project was obtained from ex-factory flooring material; it is unclear if the enhanced level of slip resistance observed in the profiled variants of the flooring would be maintained throughout their service life. Although these findings appear to be novel in relation to the earlier work conducted on lightly profiled ceramic floors, it should be noted that the profiles typically found on the industrial flooring used in the current work are significantly more aggressive than those tested during the previous work. This difference in the nature of the profiles investigated may account for the difference in the findings of the two studies. Different test methods provide information on different aspects of the overall anti-slip characteristics of a floor. Overall the findings reported here support HSL / HSE’s stance that while Rz is a useful indictor of the slip resistance of flooring materials, it is not recommended that it be used as the sole selection criteria on which to base the choice of a new floor. Where
Cof vs Surface Roughness Rz
0
0.1
0.2
0.3
0.4
0.5
0.6
0.7
0.8
0.9
0 10 20 30 40 50 60 7
Surface Roughness Rz (microns)
Coe
ffici
ent o
f Fric
tion
0
21

possible flooring selection should be based on a holistic approached which considers all available test data.
22
4 CONCLUSIONS
4.1 SURFACE ROUGHNESS Due to the macro-rough nature of some of the Glass Reinforced Plastic (GRP) floors used in the study and the physical geometry of some of the metal floors it was not possible to obtain roughness data for all of the floors. In fifteen of the twenty cases, it was possible to obtain surface roughness data, and in two cases the microroughness of the floors was classed as being over range. The Rz measurements resulted in the slip potential of the floors being classified as follows: High Slip Potential: Aluminium Sheet
Aluminium Checker Plate Mild Steel Plate Mild Steel Durbar Plate Mild Steel Cold Formed Planks Type ‘BP’
Moderate Slip Potential: Mild Steel Forge Welded -Machine Serrated
Mild Steel Slotted Planks Mild Steel Forge Welded Plain Top Mild Steel Pressure Locked - Single Serrated Mild Steel Pressure Locked - Double Serrated Mild Steel Pressure Locked Plain Top (45 x 22mm) White Checker Plate
Low Slip Potential: Mild Steel Forge Welded - Mill Rolled Serrated
Mild Steel Pressure Locked Plain Top (33 x 33mm) Gritted GRP Plate Pultruded GRP Without Grit†Pultruded GRP With Grit†
Note †: Those flooring materials for which the surface roughness meters classified the surfaces as over-range have been classified as presenting a low slip potential in water-wet conditions. When surface roughness alone is considered, five floors appear to present a high potential for slip in water-wet conditions, seven floors appear to present a moderate slip potential when wet and five are indicated as posing a low potential for slip in water-wet conditions. Based on surface roughness alone the majority of the floors used in the study would be considered to pose a high or moderate slip risk in water-wet conditions and therefore unsuitable for use in foreseeably wet areas. Given the types of contaminants that industrial flooring is typically exposed to in service, for many of the floors it is unlikely that the surface micro-roughness alone would be sufficient for the floors to be considered to present a low potential for slip and therefore be suitable for use in routinely contaminated areas.
23
4.2 RAMP RESULTS Ramp Results – Slider 96 The anti-slip performance of twenty different industrial type floors was assessed in this study using the HSL ramp test. The Slider 96 ramp data resulted in the slip potential of the floors being classified as follows: High Slip Potential: Aluminium Sheet Moderate Slip Potential: Aluminium Checkerplate
Mild Steel Plate. Low Slip Potential: Mild Steel Durbar Plate
Mild Steel Cold Form Planks Type ‘BP’ Mild Steel Cold Form Planks Type ‘BZ’ Mild Steel Forge Welded Plain Top Mild Steel Forge Welded Single Machine Serrated Mild Steel Forge Welded Mill Serrated Mild Steel Pressure Locked Plain Top (33 x 33 mm) Mild Steel Pressure Locked (45 x 22 mm) Mild Steel Pressure Locked Single Serrated Mild Steel Pressure Locked Double Serrated Mild Steel Expanded Metal White Checkerplate GRP Gritted Plate Pultruded GRP without Grit Pultruded GRP with Grit GRP Grating without Grit GRP Grating with Grit.
Comparison of the slip classifications obtained from the ramp data with those based on surface roughness alone show significant differences, as would be intuitively expected. Many of the floors achieved significantly better levels of anti-slip performance on the HSL ramp than would be anticipated based on their surface roughness alone. The level and frequency of disagreement between the slip potential classifications obtained for the industrial flooring materials from surface roughness and ramp test results is higher than typically observed. Ramp result suggests that for these types of industrial floors the presence of a profile can contribute something to the slip resistance performance of some types of industrial flooring and that surface roughness alone may not always be the single key factor controlling their slip resistance. Surface roughness alone should not be used as the sole selection criteria for industrial flooring. The findings reported here, indicate that whenever possible specification decisions should be based on surface roughness data considered in conjunction with other slip resistance data such as pendulum results or ramp data. It should be noted however that the results of the current work suggest that specification decisions based on RZ surface roughness, would generally “fail safe”. Overall the findings reported here support HSL / HSE’s stance that while Rz is a useful indictor of the slip resistance of flooring materials, it is not recommended that it be used as the sole selection criteria on which to base the choice of a new floor. Different test methods provide information on different aspects of the overall anti-slip character of a given floor. 24
Footwear Generally the flooring was shown to have better anti-slip performance when the operators wore commercially available occupational footwear. During previous testing with these shoes the SFC footwear generally out performed the Uvex boots, delivering appreciably better levels of anti-slip performance for demanding combinations of flooring and contamination. However, comparison of the ramp data generated for profiled and grid floors with SFC and the Uvex boots shows that this clear difference in anti-slip performance between the shoes has disappeared for industrial flooring with water contamination. The ramp results suggest that one of the key factors controlling the level of slip resistance experienced by a pedestrian walking on this type of industrial flooring is the degree to which the cleating pattern of their footwear is able to interlock with the flooring and not necessarily the intrinsic anti-slip performance of the footwear itself. Footwear selection for work environments where industrial flooring is installed may be more complex than for areas where more conventional flooring is installed, factors that should be considered include:
• Information about the anti-slip performance of the footwear. • Type and level of contamination likely. • Ability of the cleating pattern to interlock with the profiled / grid flooring. • Other requirements of the footwear e.g. toe protection.
Overall the findings of this study support HSE/HSL’s stance that decisions about changes to current issue footwear should whenever possible, be preceded where possible by user trials of new candidate footwear to determine actual performance in the real workplace situation and user acceptability. Effect of Profiles Ramp results appear to indicate that surface micro-roughness does have a role to play in the anti-slip performance of industrial floors. Ramp data for the industrial floors appeared to indicate that the presence of a profile can appreciably improve the anti-slip performance of a some industrial flooring. The effect of the introduction of a profile was significantly larger than could be readily explained by the accompanying changes in surface micro-roughness that were observed. It should be noted at all of the ramp slip resistance data generated during this projected was obtained from brand new ex-factory material, and it is unclear if the enhanced level of slip resistance observed in the profiled variants of the flooring would be maintained throughout their service life. Overall the results of the current study suggest that while surface micro-roughness does play a role in the anti-slip performance of industrial floors, the level of micro-roughness may not always be the sole factor in determining the level of slip resistance offered by this type of flooring. However, it should be noted that the potential benefit in anti-slip performance of introducing a profile to the surface is dependent on the ability of the footwear to exploit the profile. Although these findings appear novel in relation to the earlier work conducted on lightly profiled ceramic floors it should be noted that the profiles typically found on the industrial flooring used in the current work are significantly more aggressive than those tested during the
25

previous work. This difference in the nature of the profiles investigated may account for the difference in the findings of the two studies.
26
5 FURTHER WORK
It is advised that further work be undertaken to build upon the results of the work presented. This work could include:
• The assessment of the anti-slip performance of industrial flooring in the presence of more viscous contaminants.
• The assessment of similar industrial floorings to those studied, but after periods of real
or artificial wear. Repeated assessments could be undertaken at a number of stages throughout the wear process. Representatives of London Underground have expressed an interest in participating in this type of study. They may be willing install samples of profiled flooring at various locations around their network. These samples could then be retrieved and assessed in the lab by ramp test methods after suitable wear intervals.
• A study of the directionality of the slip resistance characteristics of profiled and open-
grid industrial flooring materials. This could be simply undertaken by the ramp-based coefficient of friction assessment using flooring materials similar to those tested during the work presented here, but in a number of orientations. The orientations used should include longitudinal, lateral, and a range of diagonal orientations as a function of the characteristics of the profile repeating pattern.
• The generation of data regarding the slip resistant performance of the footwear
materials used (i.e. so negating the effects of the presence of a tread pattern and therefore negating the effects of interlock) by the systematic removal of the cleating patterns used on test footwear. The techniques previously employed during former HSL research [Lemon, Thorpe and Griffiths (b)] shall be used.
• The generation of an accurate and reproducible pendulum test protocol allowing the
assessment of profiled flooring surfaces, including guidance for the interpretation of pendulum test data.
27
6 REFERENCES
HSE, “HSE information sheet, Preventing slips in the food and drink industries – technical update on floor specifications.” Food Sheet No. 22, HSE. P. Lemon and S. Griffiths, “Further Application of Squeeze Film Theory to Pedestrian Slipping.”, HSL report, IR/L/PE/97/9, 1997. P. Lemon, S. C. Thorpe and R. S. Griffiths, “Pedestrian Slipping Phase 4: Macro-Rough and Profiled Floors.”, HSL report, IR/L/PE/99/01, 1999 [a]. P. Lemon, S. C. Thorpe and R. S. Griffiths, “The Effects of Cleaning and Surface Treatment on Pedestrian Slipping.”, HSL Internal Research Report, IR/L/PE/99/05, 1999 [b]. M. Loo-Morrey, “Slip Testing of Occupational Footwear.”, HSL report Ped/05/04, March 2005. M. Loo-Morrey, “Natural and Man Made Stone Floors – Final Report.”, HSL Research Report Ped/06/06, April 2006. M. Loo-Morrey, “A Study of the Slip Characteristics of Applied Epoxy Resin Flooring and Thin Coat Epoxy Based Materials. Ramp Testing of Epoxy Floors – Final Report.”, HSL Research Report Ped/06/07, June 2006. M. T. Richardson and R. S. Griffiths, “The Application of Squeeze Film Theory to Pedestrian Slipping Research.” HSL report, IR/L/PE/96/4, 1996. S. C. Thorpe, J. Karnon, and P. Lemon, “Industrial Slip and Fall Accidents. Can Footwear Make a Difference?”, The Proceedings of the XVI Annual International Occupational Ergonomics and Safety Conference 2002. UKSRG, United Kingdom Slip Resistance Group, “The Measurement of Floor Slip Resistance - Guidelines Recommended by the UK Slip Resistance Group”, Issue 3, June 2005.
28

APPENDIX 1
Definitions of Surface Roughness Parameters.
29
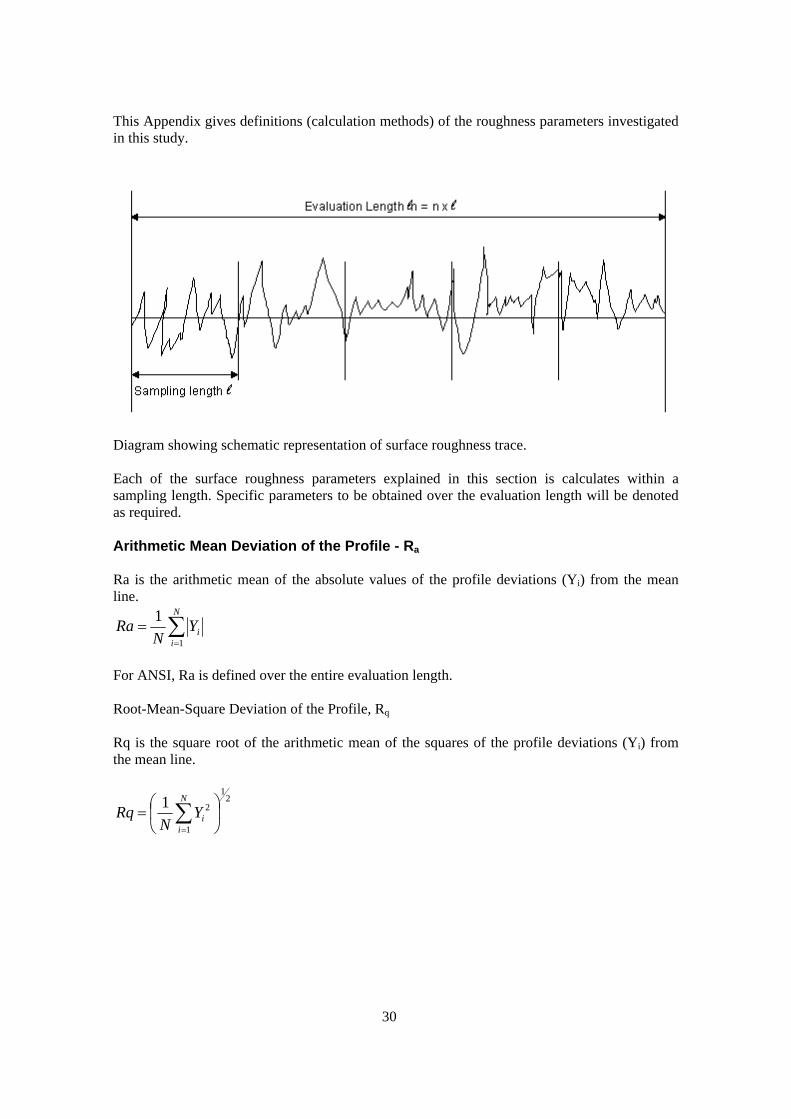
This Appendix gives definitions (calculation methods) of the roughness parameters investigated in this study.
D Esampling length. Specific parameters to be obtained over the evaluation length will be denoted as required. A Rline.
=Ra ∑=
F R Rthe mean line.
21
1
21⎟⎠
⎞⎜⎝
⎛= ∑
=
N
iiY
NRq
iagram showing schematic representation of surface roughness trace.
ach of the surface roughness parameters explained in this section is calculates within a
rithmetic Mean Deviation of the Profile - Ra
a is the arithmetic mean of the absolute values of the profile deviations (Yi) from the mean
N
iiY
N 1
1
or ANSI, Ra is defined over the entire evaluation length.
oot-Mean-Square Deviation of the Profile, Rq
q is the square root of the arithmetic mean of the squares of the profile deviations (Yi) from
30
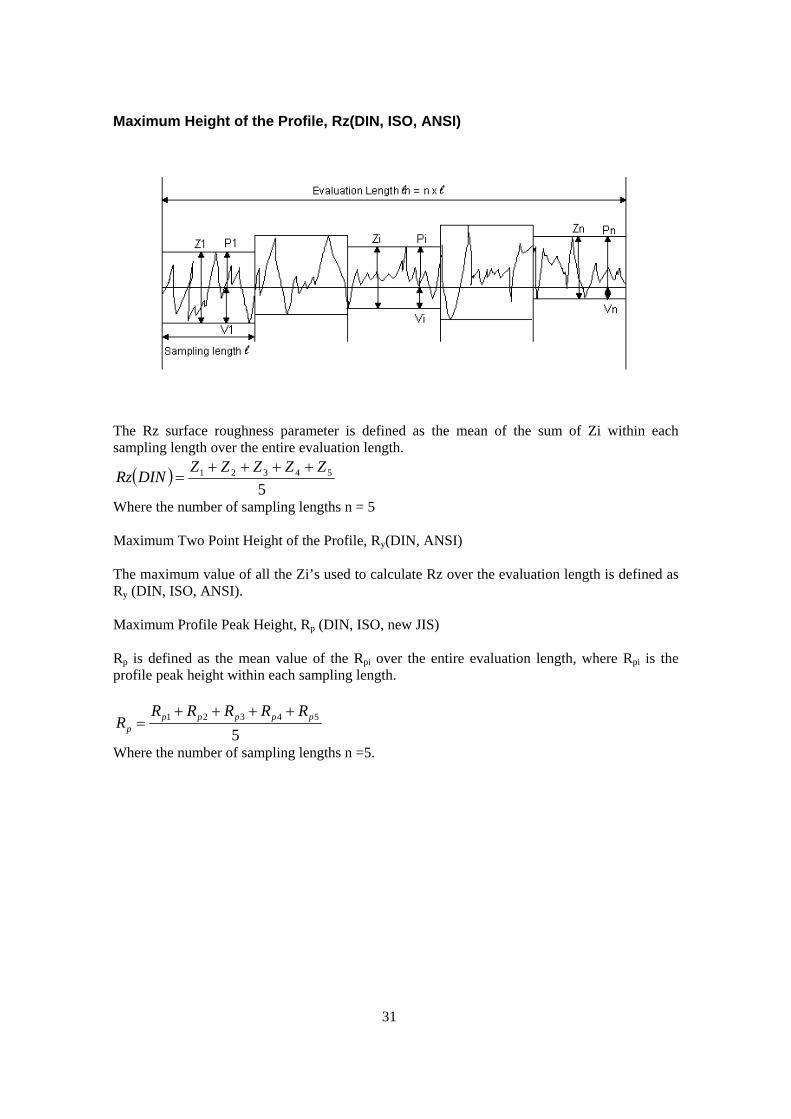
Maximum Height of the Profile, Rz(DIN, ISO, ANSI)
The Rz surface roughness parameter is defined as the mean of the sum of Zi within each sampling length over the entire evaluation length.
( )5
54321 ZZZZZDINRz ++++=
Where the number of sampling lengths n = 5 Maximum Two Point Height of the Profile, Ry(DIN, ANSI) The maximum value of all the Zi’s used to calculate Rz over the evaluation length is defined as Ry (DIN, ISO, ANSI). Maximum Profile Peak Height, Rp (DIN, ISO, new JIS) Rp is defined as the mean value of the Rpi over the entire evaluation length, where Rpi is the profile peak height within each sampling length.
554321 ppppp
p
RRRRRR
++++=
Where the number of sampling lengths n =5.
31
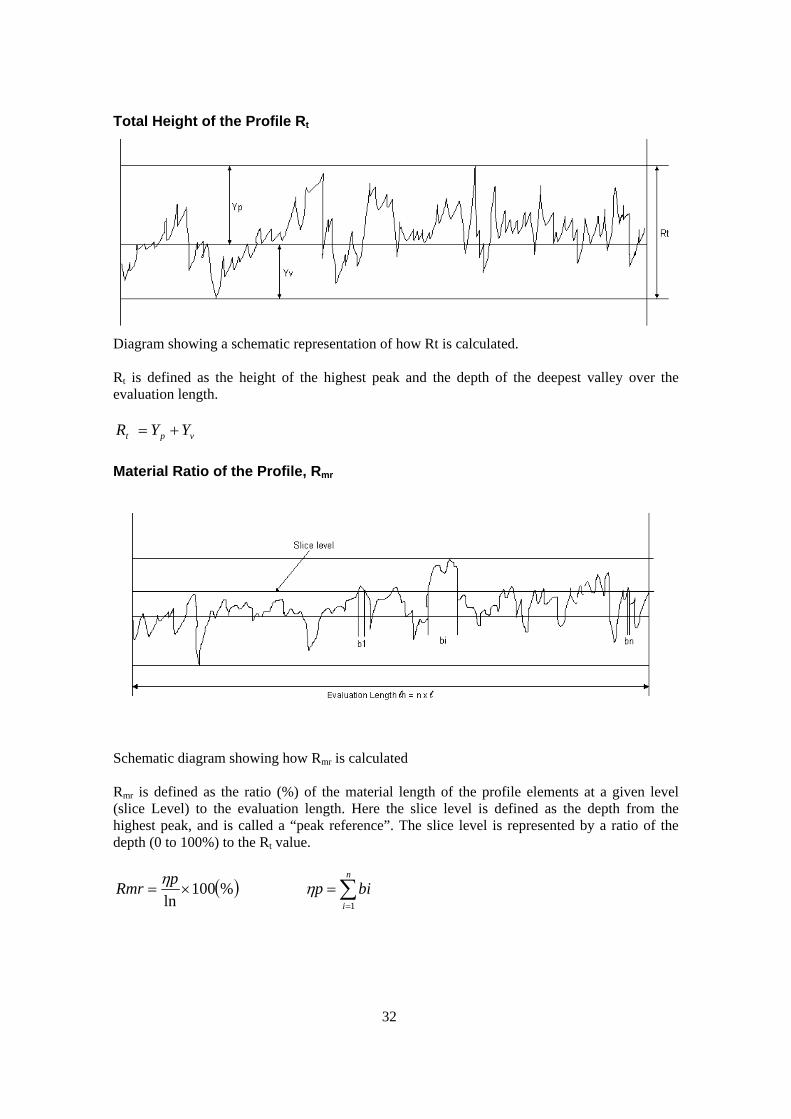
Total Height of the Profile Rt
Diagram showing a schematic representation of how Rt is calculated. Rt is defined as the height of the highest peak and the depth of the deepest valley over the evaluation length.
vpt YYR +=
Material Ratio of the Profile, Rmr
Schematic diagram showing how Rmr is calculated Rmr is defined as the ratio (%) of the material length of the profile elements at a given level (slice Level) to the evaluation length. Here the slice level is defined as the depth from the highest peak, and is called a “peak reference”. The slice level is represented by a ratio of the depth (0 to 100%) to the Rt value.
( )%100ln
×=pRmr η
∑=
=n
ibip
1η
32

Mean Spacing of Local Peaks of the Profile, Rs Rs is the mean spacing of adjacent local. For ANSI, this parameter is defined over the evaluation length.
∑=
=n
iis S
nR
1
1
Where n = number of peaks.
33

Published by the Health and Safety Executive 04/07
A study of the slip characteristicsof metal flooring materials
Health and Safety Executive
RR534
www.hse.gov.uk
The work detailed in this report was carried out at therequest of Mr Stephen Taylor (Construction DivisionTechnology Unit, HSE) in line with the HSE strategy toreduce the incidence of slip and trip accidents.
The aim of the current study was to assess the slipresistance of a wide range of industrial flooring materials,both profiled and open-grid. This type of industrial flooringhas traditionally been widely used in manufacturingenvironments where the likelihood of gross contaminationis high. In recent years there has been a dramatic increasein the amount of certain types of industrial floors that havebeen installed in commercial premises in the retail andhospitality sectors, as designers currently consider thesetypes of industrial finishes to be fashionable.
Unfortunately, little is understood about the slipcharacteristics of these floors, although appreciableanecdotal evidence exists which suggests that this type offlooring can present a high slip potetnial in contaminatedconditions. Furthermore, the slipperiness of profiled andopen-grid walkway surfaces is difficult (although notimpracticable) to assess with the test methods currentlyrecognised by HSL/HSE. The current study aims toquantify the slip resistance of industrial profiled metalflooring, with a view to the incorporation of the informationgenerated into planned British Standards.
The floor surfaces studied were assessed using thefollowing test methods:
n Surface microroughness assessment.
n The standard UKSRG Ramp Test (based on theHSL Ramp Test Methodology).
This report and the work it describes were funded bythe Health and Safety Executive (HSE). Its contents,including any opinions and/or conclusions expressed, arethose of the authors alone and do not necessarily reflectHSE policy.