Embed Size (px)
Citation preview
Health and Safety Executive
Isocyanate exposure, emission and control in small motor vehicle repair premises using spray rooms: Phase 1
Prepared by the Health and Safety Laboratory for the Health and Safety Executive 2006
RR496 Research Report
Health and Safety Executive
Isocyanate exposure, emission and control in small motor vehicle repair premises using spray rooms: Phase 1
John White, Matthew Coldwell, Tim Davies, Julie Helps, Mark Piney, Duncan Rimmer, John Saunders & Derrick Wake Harpur Hill Buxton Derbyshire SK17 9JN
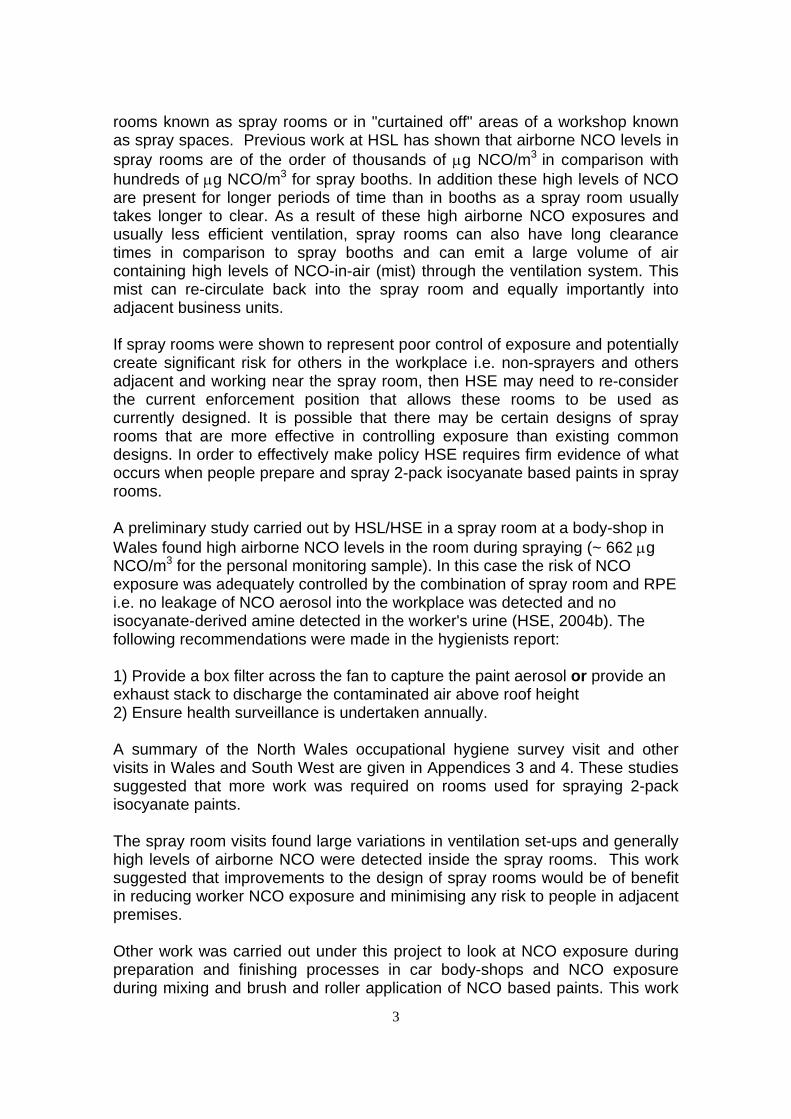
A mock up spray room was constructed within the HSL spray booth with dimensions, ventilation conditions, extraction rates etc set to represent typical MVR spray room conditions. A robotic sprayer was used to simulate paint spraying of car parts under a range of conditions; including spray orientation relative to the extraction duct, spray gun type, ventilation (air in) set up and extraction rates. Real and near time monitors were used in conjunction with the HSL standard method for airborne isocyanate monitoring (MDHS 25/3).
The main findings were:
• High isocyanate (NCO) levels (~ thousands of µg NCO/m3 during the spraying period) arise in spray rooms during spraying.
• Airborne NCO levels were homogeneous throughout the spray room. Tracer gas studies confirmed this finding. • Factors affecting the amount of airborne NCO are; gun type (eg HVLP give ~ 2 to 5x lower levels than
conventional types), gun condition and setup, spray pattern and isocyanate formulation. Spraying in the direction of the extract fan did not decrease airborne NCO.
• Airborne NCO took a significant time (~20+ minutes) to clear the spray room. • The majority of air in the spray room was close to perfect mixing (tracer gas experiments) but shortcircuiting
(ie inlet air that is extracted without mixing with the main body of air in the room) occurred. This agrees with HSL/HSE field observations.
• Tracer gas studies found that the clearance time was proportional to the airflow rate. If this is the case for spray rooms in general, then the clearance rate may be estimated by calculation from the perfect mixing equation.
• The addition of false walls and filters to the spray room did not decrease airborne NCO levels in the room but the filters did remove most (94–98%) of the NCO from the vented air and so reduced the risk of recirculation of the NCO mist back into the spray room, adjacent workplaces and the environment.
• The near time monitor (paper tape reader) underestimated significantly (~10x) the amount of airborne NCO but both the real time (photoionization detector) and near time monitors (paper tape reader) gave clearance times that were comparable with the HSL standard method.
• Spraying solvent through the guns to clean them produces high levels of airborne isocyanate (~ thousands of µg NCO/m3) and should not be undertaken unless full control procedures are in place.
This report and the work it describes were funded by the Health and Safety Executive (HSE). Its contents, including any opinions and/or conclusions expressed, are those of the authors alone and do not necessarily reflect HSE policy.
HSE Books
© Crown copyright 2006
First published 2006
All rights reserved. No part of this publication may bereproduced, stored in a retrieval system, or transmitted inany form or by any means (electronic, mechanical,photocopying, recording or otherwise) without the priorwritten permission of the copyright owner.
Applications for reproduction should be made in writing to:Licensing Division, Her Majesty’s Stationery Office,St Clements House, 216 Colegate, Norwich NR3 1BQor by email to hmsolicensing@cabinetoffice.x.gsi.gov.uk
ii
ACKNOWLEDGEMENTS
This work was funded by the Health and Safety Executive.
Thanks to Mr. Terry Gee (HSL, Workshop) and other HSL workshop staff for the loan of the compressor used in this work and for modifications to the spray room as required. Thanks to Mr. Chris Parker (HSL, Personal Protective Equipment Section) for assistance with the provision of PPE for "Brushing, Rollering and Mixing" work (HSL, 2005a). Thanks to the staff of HSL, Visual Presentation Services for the photography and videoing of the work.
Thanks to Mr. Philip Merrifield (DeVilbiss) and to SATA for the donation of the spray guns used in this work.
iii

iv
CONTENTS
1 INTRODUCTION ......................................................................................... 12 EXPERIMENTAL ......................................................................................... 5
2.1 Design and Set-up of Sprayer Traversing System......................................................... 52.2 Spray Room Characterisation...................................................................................... 102.3 Initial Set-Up of Spraying Experiments and General Experimental Details ............... 212.4 Spraying Experiments – Establishment of Standard Conditions (room congfiguration1); Effect of Sprayer Orientation............................................................................................. 252.5 Spray Decay work – Clearance Times ........................................................................ 252.6 Autostep Profile decay work – Clearance Times ........................................................ 262.7 Spraying Experiments – Effect of Modifications to Spray room Conditions; AlteredSpray Gun/Spray Pattern/Spray Room Configuration/Paint type/Room Air-Flow................. 262.8 Gun Cleaning experiments .......................................................................................... 282.9 Other Work.................................................................................................................. 282.10 Safety and Health Considerations ............................................................................... 29
3 RESULTS AND DISCUSSION .................................................................. 303.1 Measurement of Volume Flow-Rate and Air-Change Rate in an Industrial SprayRoom 303.2 Tracer Gas tests on a Real Spray Room ...................................................................... 313.3 Tracer Gas Tests Using the HSL Spray Room – Configuration 1 .............................. 323.4 Tracer Gas Tests made in the HSL Spray Room – Configuration 2 ........................... 333.5 Spraying Experiments – Spray Room Configuration 1 Establishment of StandardConditions; Effect of Sprayer Orientation............................................................................... 363.6 Spray Profile Decay work – Clearance Times ............................................................ 433.7 Autostep Profile decay work – Clearance Times ........................................................ 453.8 Spraying Experiments – Effect of Modifications to Spray Room Conditions; AlteredSpray Gun/Spray Pattern/Spray Room Configuration/Paint type/Room Air-Flow................. 483.9 Gun Cleaning Experiments ......................................................................................... 53
4 CONCLUSIONS ........................................................................................ 545 REFERENCES .......................................................................................... 566 APPENDICES............................................................................................ 60
6.1 Appendix 1. Sampler Positions for the Spray Room Experiments ............................. 606.2 Appendix 2. Full Data from Spray Room Evaluations - Tables and Bubble plots...... 616.3 Appendix 3. HSE Report on A Visit to A small MVR Premises in Wales ................ 996.4 Appendix 4. Summary of Spray Space Visits and Sampling Results (Wales and WestRegion) in the 1990's and 2004 ............................................................................................. 110
v

vi
EXECUTIVE SUMMARY
Aim
To investigate exposure, spread and escape of isocyanate-in-air during simulated 2-pack isocyanate paint spraying in spray rooms commonly used in small motor vehicle repair (MVR) operations.
Objectives
1. To identify spray room arrangements (including size, layout and ventilation) commonly found in small MVR establishments;
2. To simulate, realistically, 2-pack isocyanate spraying of vehicles and parts of vehicles and measure exposure, spread and escape of isocyanate-in-air under different conditions and arrangements;
3. To conduct a limited (2 site) field monitoring exercise to measure exposure rise and fall in isocyanate-in-air during spraying operations and to test observations made during simulated testing work.
Summary and Main Findings
A mock up spray room was constructed within a stand-alone spray booth located at HSL. Dimensions, ventilation conditions and extraction rates were set to represent typical MVR spray room conditions. A robotic sprayer was used to simulate paint spraying of car parts under a range of conditions. Real and near time monitors were used in conjunction with standard sampling media that were later analysed to determine isocyanate concentrations and clearance rates at various locations around the spray room. Tests were carried out to examine the effects of spraying under a range of conditions, including spray orientation relative to the extraction duct, spray gun type, ventilation (air in) set up and extraction rates. Because of day-to-day inconsistencies in the operation of the spray guns on the robotic system, isocyanate concentration results were expressed relative to the weight of paint sprayed as well as airborne isocyanate concentration based on sampling time. The main findings were as follows:
• High levels of airborne isocyanate are produced during spraying (~ thousands of µg NCO/m3 during the spraying period).
• Under “standard” spray room (ventilation/extraction/standard gun settingsetc.) conditions isocyanate was detected at similar concentrations at all sampling points apart from those in the immediate vicinity to the spraygun. This implies that the aerosol disperses uniformly inside the spray room. This finding was in agreement with the results of air-flowcalculations for the HSL spray room for both configurations used. Tracergas tests on the HSL test room also showed that both spray rooms had near perfect mixing of the air i.e. highly turbulent air flow leading to homogeneous levels of the tracer gas throughout the room.
vii
• Tracer gas studies on an industrial spray room showed that whilst the majority of the air in the room was close to perfect mixing, there was a high degree of "short-circuiting" that occurred close to the fan (shortcircuiting is defined as inlet air that is extracted from the room before mixing with the main body of room air). This is in agreement with field observations made by HSL/HSE staff.
• Orientation of spraying relative to the extraction fan had little effect on the uniformity of the isocyanate dispersion. There is no significant benefit from spraying in the direction of the extraction fan.
• Overlapping the car bonnet when spraying gave decreased (by ~ 2x) airborne concentrations of isocyanate in comparison to spraying with no overlap of the bonnet when using the standard spray gun i.e. spray pattern has a slight effect on airborne isocyanate levels. This is presumably because of increased "bounce back" of aerosol form the bonnet in the "no-overlap" experiments.
• Gun type, gun condition and gun set-up are important factors in the levels of airborne isocyanate detected.
• The isocyanate formulation used is an important factor in the levels of airborne isocyanate detected.
• Use of the HVLP spray guns reduced airborne isocyanate concentrations in comparison to spraying using a standard gun (conventional high-pressure gun) and there was no difference between the overlapping and non-overlapping spray pattern for the HVLP gun. The HVLP gun gave decreased (by ~ 2 to 5x - depending on spray pattern) airborne concentrations of isocyanate in comparison to spraying with the conventional gun.
• Increased room extraction rates (airflow) reduced airborne isocyanate concentrations (by ~ 2x for a 2x increase in air-flow) and so shortened clearance times for the HSL spray room.
• Addition of filters and false internal walls to the spray room had no effect on airborne isocyanate levels and clearance times inside the spray room.
• For the "false wall and filters" experiments (spray room configuration 2), the measured airborne isocyanate levels on the extract fan grill were lower (~30x) than those for the spray room without the false walls/filters added. The addition of the filters and false walls may therefore be beneficial for environmental reasons i.e. to reduce the risk of recirculation of vented isocyanate aerosol (mist) back into the spray room or into adjacent business units and the environment.
• Measurements taken either side of the filter panels showed that the filter material used removed 98 to 94% of the airborne NCO aerosol from the air.
• The paper tape reader evaluated underestimated the amount of airborne isocyanates present (~ 10x) when compared to MDHS 25/3. This is as expected as HSL has found that the paper tape readers are not suitable for quantification of NCO aerosol without extensive recalibration.
• The paper tape reader evaluated gave reasonable indications of air clearance rates (clearance times for the HSL spray room ~20 minutes by
viii
paper tape reader compared to ~30 minutes by MDHS 25/3). The clearance time is defined as the time, after finishing spraying, when no airborne isocyanate can be detected. This value is important for the safety of staff leaving, or re-entering the spray room, after spraying.
• The photo-ionization detector (PID), which was measures total particulate, gave a clearance time of ~ 10 minutes which is shorter than those for the paper tape reader or measured by MDHS 25/3 but in agreement with a theoretical value of ~ 12 minutes for 99% clearance calculated from the tracer gas test decay curve for the HSL room. It should be noted that the theoretical value is calculated from an exponential decay and so the time to "no detectable airborne isocyanate" using this method will be longer than 12 minutes (time to 99% clearance).
• Spraying solvent through the guns to clean them produces high levels of airborne isocyanate (~ thousands of µg NCO/m3 during the spraying period) and should not be undertaken unless full control procedures are in place.
• Other work was undertaken during this project on brush and roller application of paints and sanding and NCO emissions during baking of NCO painted car parts. This work has already been reported (HSL, 2005a; HSL, 2005b).
• Video and still photography was carried out during the project and this and other material was used to support the HSE Safety and Health Awareness Days (SHADs) on NCO spraying.
• The results of the work presented in this report will be used by HSE to update the NCO guidance sheets on NCO use (e.g. MR01 - isocyanate from mixing 2-pack paint etc., MR02 – spraying 2-pack products in a spray/bake booth, MR03 – isocyanate from cleaning 2-pack paint spray guns, MR04 – isocyanate from brush and roller application of 2-pack products, HSE (2005a)).
• Because other survey work has provided information on typical spray room conditions and potential exposures, the field monitoring exercise (objective 3) was not undertaken. The results of previous field-work are summarised in this report (appendices 3 and 4).
Recommendations
• This work has shown that high isocyanate levels (~ thousands of µg NCO/m3 during the spraying period) arise in spray rooms during spraying and that the airborne isocyanates take a significant time to clear (20+ minutes) to clear these spray rooms. A variety of factors affecting the amount of airborne NCO aerosol have been identified (see - Main Findings above). These findings are important and should be brought to the attention of the MVR industry.
• This work has shown that the clearance time is proportional to the airflow rate and that the air-flow in the spray room, investigated in this report, is close to perfect mixing. If this is the case for spray rooms in
ix
general, then it is suggested that the clearance rate may be estimated by calculation from the perfect mixing equation.
• Further work is required to define and test minimum control and running standards, in particular ventilation configurations that would prevent short-circuiting occurring. HSE would be in a stronger position to enforce improved standards of exposure control if it could, for example, point to a well evaluated example of a commercial spray room retro-fitted with improved ventilation, filtration, exhaust discharge, pressure monitoring etc.
• It is therefore recommended that further work be carried out to retro-fit an existing commercial MVR spray room with improved ventilation and other controls, and measure and characterize the improvement in performance and to examine cost implications.
• Gun cleaning has been identified as having a major potential for worker isocyanate exposure and HSL should undertake work on automated gun cleaning devices to see if they emit significant airborne isocyanate aerosol.
x
1 INTRODUCTION
Isocyanates (NCO) are highly reactive species widely used in the motor vehicle repair and other industries. They are known respiratory tract and skin sensitizers and are the most common cause of occupational asthma in the UK (HSE, 2004a). The Health and Safety Executive (HSE) has set workplace exposure limits (WELs) for total isocyanate exposure (i.e. all NCO species), of 70 µg/m-3 (short term, 15 minute) and 20 µg/m3 (8 hour TWA) (HSE, 2005a). Isocyanates may be produced by thermal degradation of NCO containing material, during mixing of NCO containing materials, during finishing or preparation of surfaces to be painted and other processes involved in motor vehicle repair (MVR) (HSL, 2002; HSL, 2003a; HSL, 2003b; HSL, 2005a; HSL, 2005b; HSL, 2005c) but the most important exposure to NCO, from an ill-health concern, is spraying of 2-pack NCO paints in the MVR (HSE, 2005a).
The hazards associated with spraying of isocyanate paints are well known (e.g. HSE, 2004) but data on likely levels of exposure and possible measures to reduce the hazard for small and medium sized premises is limited. In large MVR premises spraying is usually carried out in commercially available spray booths that have relatively sophisticated ventilation systems designed to minimise worker exposure to NCO e.g. down-draft spray booths. Previous surveys of NCO exposure from spray painting have concentrated largely on these larger operators (NIOSH, 1993; Heitbrink et al, 1995; Sparer et al, 2004, Woskie et al; 2004) or on the comparison of sampling and analytical methods (Ekman et al, 2002; England et al; 2000). However, spraying is also carried out in enclosures with less sophisticated ventilation (spray room) or in an open workshop or curtained off area of a workshop (spray space). A rough estimate of the number of spray rooms in the UK puts the range at 500 to 1500. These spray room and spray spaces are used to spray whole cars and/or car components.
HSE recently funded a major survey of NCO use and control in the UK that looked at a variety of industries and uses e.g. MVR, foam manufacturers, military, vehicle manufacturers, coatings and adhesives, industrial painters, printers and laminators and insulation contractors, totalling ~ 2000 companies contacted in total (HSE, 2005b). Uses of isocyanate were identified as; chemical processing, coating/spreading, glueing/sealing, mixing, moulding/injecting, painting (brush or roller, painting (spraying) and polyurethane spraying. It was estimated that ~ 6200 MVR sector companies and ~ 1650 non-MVR sector companies use NCO giving a ~ 22,000 employees potentially directly exposed to NCO. This survey used a questionnaire (phase 1) backed by limited sampling and analysis (phase 2) of selected sites for each industry (13 sites in total). For the majority of industries and tasks investigated the amount of airborne NCO found was small (~ 75% of samples (120 out of 160) gave "not detected" or "below the limit of quantification", ~ 1 µg NCO/m3).
Wide variations in health and safety practice were noted from industry to industry and within industries. The largest single group of isocyanate users was
1
stated to be car body repairers in firms with less than 5 employees (estimated ~ 2700 companies in the UK in this category out of an estimated total of ~ 6200). This survey found that "… the highest measurements (of NCO) were collected during spray painting in (the) truck and car manufacturing industry …" (HSE, 2005b). This survey identified a general lack of awareness of the health effects of polymeric isocyanates. This finding is particularly relevant to the MVR industry as most of the paints used in it are oligomeric HDI based. Patterns of work and health surveillance were varied and poor chemical handling procedures were identified at some companies. Further work was suggested on procedures/equipment to reduce spray exposure to isocyanates during spraying in the MVR industry as this would be advantageous in reducing occupational asthma in this industry. This survey also recommended the development of improved sampling and analysis methods for the determination of airborne NCO.
Phase 1 of the HSE survey found that for the MVR companies contacted ~78% of respondants (233 out of 295 companies) used an enclosed down-draft spray booth during spraying, ~ 11% used an open ended spray booth during spraying and 3% reported no localised ventilation was used during spraying. The most popular gun type was found to be the High Volume Low Pressure (HVLP) sprayer (77%, 227 out of 295) with the conventional high-pressure gun less popular (36%, 105 out of 295).
A second HSE/HSL survey of workplace practice in small and medium MVR shops (~100 shops visited between 2002 and 2003) was carried out by HSL in the Home Counties and Greater London area. This survey found large variations in awareness of risk and the adequacy of control measures in use amongst the users of NCO based paints (HSL, 2003c). The survey visited MVR premises covering a range of sizes and control measures from main dealers that had up to 5 commercial spray booths per site to "back-street" repair shops with variable standards of "home-made" ventilation. A variety of paint product and spray equipment were in use. Most of the sites visited used full air-fed visors as respiratory protective equipment (RPE) and spray booths for spray painting. As mentioned above, a spray booth is here defined as a specified enclosure with a relatively sophisticated ventilation and extraction system usually of a down-draft type. Maintenance standards for the spray equipment, spray enclosures (booths and rooms) and RPE were found to vary considerably as did the amount of information on the NCO products in use at a particular shop. It is worth noting that the higher standards expected of larger garages were not always realised and that some of the smaller shops had high standards of control and surveillance. The biological monitoring results obtained in this survey showed that ~ 41% (75 out of 181) urine samples taken gave detectable levels of NCO exposure. These biological monitoring results showed that all sizes of premises and control measures (spray booth, spray room, RPE etc) were at risk of NCO exposure.
In comparison to the larger premises, in the smaller premises spraying is more likely carried out with limited ventilation e.g. one or two axial fans, in discrete
2
rooms known as spray rooms or in "curtained off" areas of a workshop known as spray spaces. Previous work at HSL has shown that airborne NCO levels in spray rooms are of the order of thousands of µg NCO/m3 in comparison with hundreds of µg NCO/m3 for spray booths. In addition these high levels of NCO are present for longer periods of time than in booths as a spray room usually takes longer to clear. As a result of these high airborne NCO exposures and usually less efficient ventilation, spray rooms can also have long clearance times in comparison to spray booths and can emit a large volume of air containing high levels of NCO-in-air (mist) through the ventilation system. This mist can re-circulate back into the spray room and equally importantly into adjacent business units.
If spray rooms were shown to represent poor control of exposure and potentially create significant risk for others in the workplace i.e. non-sprayers and others adjacent and working near the spray room, then HSE may need to re-consider the current enforcement position that allows these rooms to be used as currently designed. It is possible that there may be certain designs of spray rooms that are more effective in controlling exposure than existing common designs. In order to effectively make policy HSE requires firm evidence of what occurs when people prepare and spray 2-pack isocyanate based paints in spray rooms.
A preliminary study carried out by HSL/HSE in a spray room at a body-shop in Wales found high airborne NCO levels in the room during spraying (~ 662 µg NCO/m3 for the personal monitoring sample). In this case the risk of NCO exposure was adequately controlled by the combination of spray room and RPE i.e. no leakage of NCO aerosol into the workplace was detected and no isocyanate-derived amine detected in the worker's urine (HSE, 2004b). The following recommendations were made in the hygienists report:
1) Provide a box filter across the fan to capture the paint aerosol or provide an exhaust stack to discharge the contaminated air above roof height 2) Ensure health surveillance is undertaken annually.
A summary of the North Wales occupational hygiene survey visit and other visits in Wales and South West are given in Appendices 3 and 4. These studies suggested that more work was required on rooms used for spraying 2-pack isocyanate paints.
The spray room visits found large variations in ventilation set-ups and generally high levels of airborne NCO were detected inside the spray rooms. This work suggested that improvements to the design of spray rooms would be of benefit in reducing worker NCO exposure and minimising any risk to people in adjacent premises.
Other work was carried out under this project to look at NCO exposure during preparation and finishing processes in car body-shops and NCO exposure during mixing and brush and roller application of NCO based paints. This work
3
has been reported elsewhere (HSL, 2005a; HSL, 2005b) and is not reported here.
In conclusion, the aim of this present study was to investigate exposure, spread and escape of airborne isocyanates during simulated operations involving 2pack isocyanates paints in small premises using spray rooms in the motor Vehicle Repair Industry (MVR). This was achieved by realistic simulations of 2pack isocyanate paint use in HSL's spray room facility.
4
2 EXPERIMENTAL
2.1 DESIGN AND SET-UP OF SPRAYER TRAVERSING SYSTEM
The design of the robotic sprayer followed on from discussions held with a skilled vehicle sprayer who related the typical procedures and actions that would be followed when spraying a car body panel. He advised that when spraying a large panel the usual procedure is to spray horizontally in one direction over the width of the panel, starting at the top of the panel. The spray gun is then lowered through a distance approximating to half the width of the spray pattern produced by the gun at the optimum spraying distance from the panel (from data supplied by a particular spray-gun manufacturer) and spray is then applied in the opposite horizontal direction. These actions would be repeated until the entire area of the panel had been covered. It is usual practice to keep the spray gun on continually throughout the entire operation, to slightly overlap each band of spray and to spray past the extremities of the panel through a short distance. However, some operatives might switch the gun off at the end of each pass to conserve paint. The robotic spraying apparatus was thus constructed to mimic all of these actions as closely as possible. Each component of the robotic sprayer, discussed below, can be seen in the Figures 1 to 4.
2.1.1 Traversing apparatus
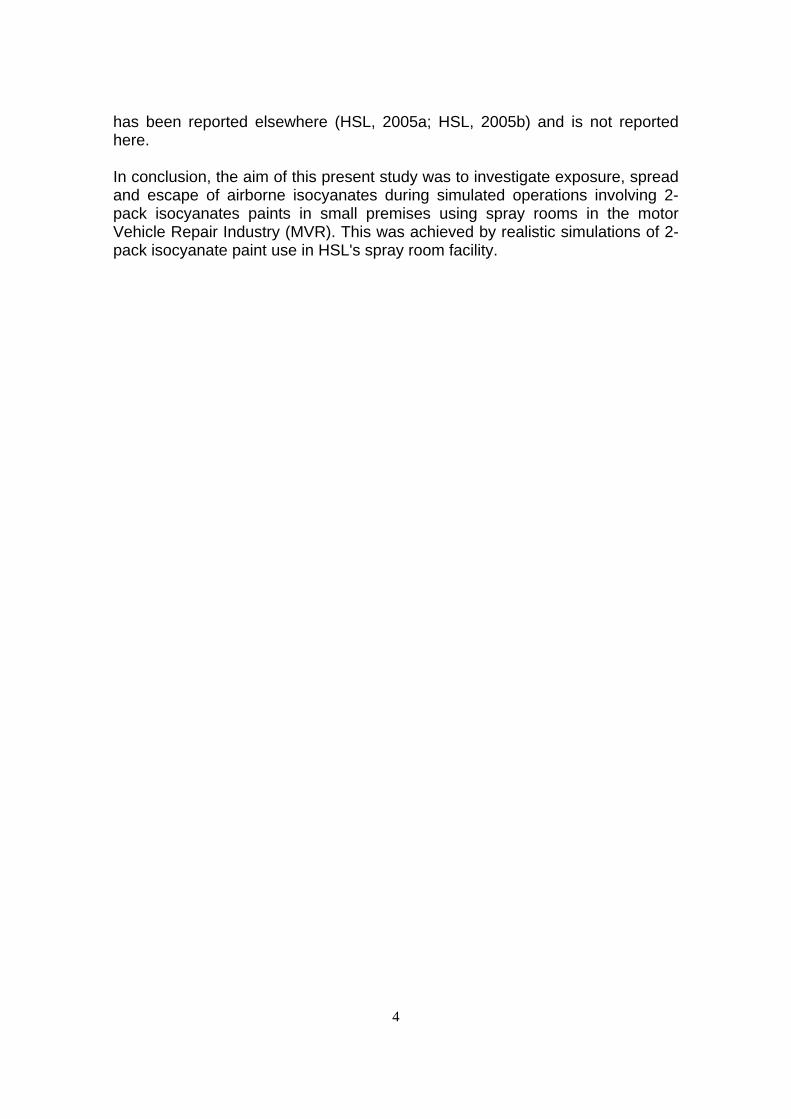
The traversing apparatus for moving the spray gun laterally to the work piece (a car bonnet), comprised of a fixed modular, twin rail, linear platform, 2.5 m in length, with a movable carriage mounted between the rails. The upper torso of a manikin and the spray gun were attached to a column, which could be varied in height, electro-magnetically. The column was fastened to the top of the movable carriage by a flange. The manikin and spray gun could be simultaneously raised or lowered through an overall distance of 0.75 metres in increments by the electro-magnetic column.
5
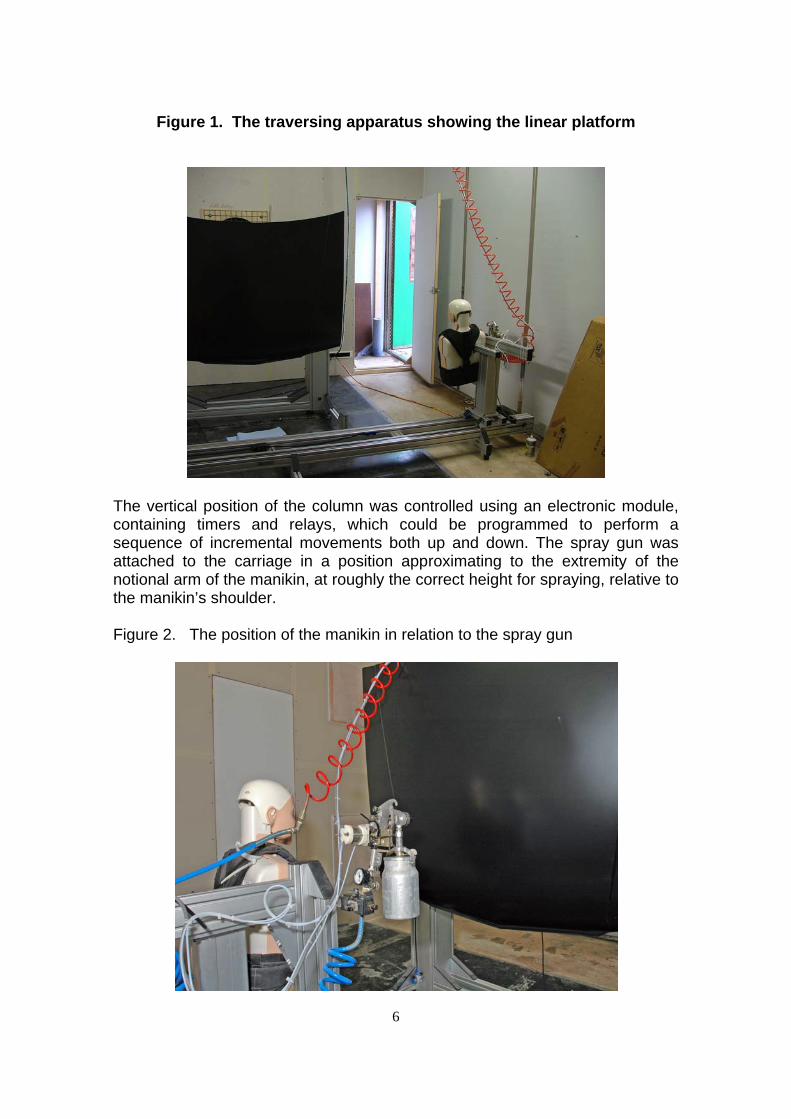
Figure 1. The traversing apparatus showing the linear platform
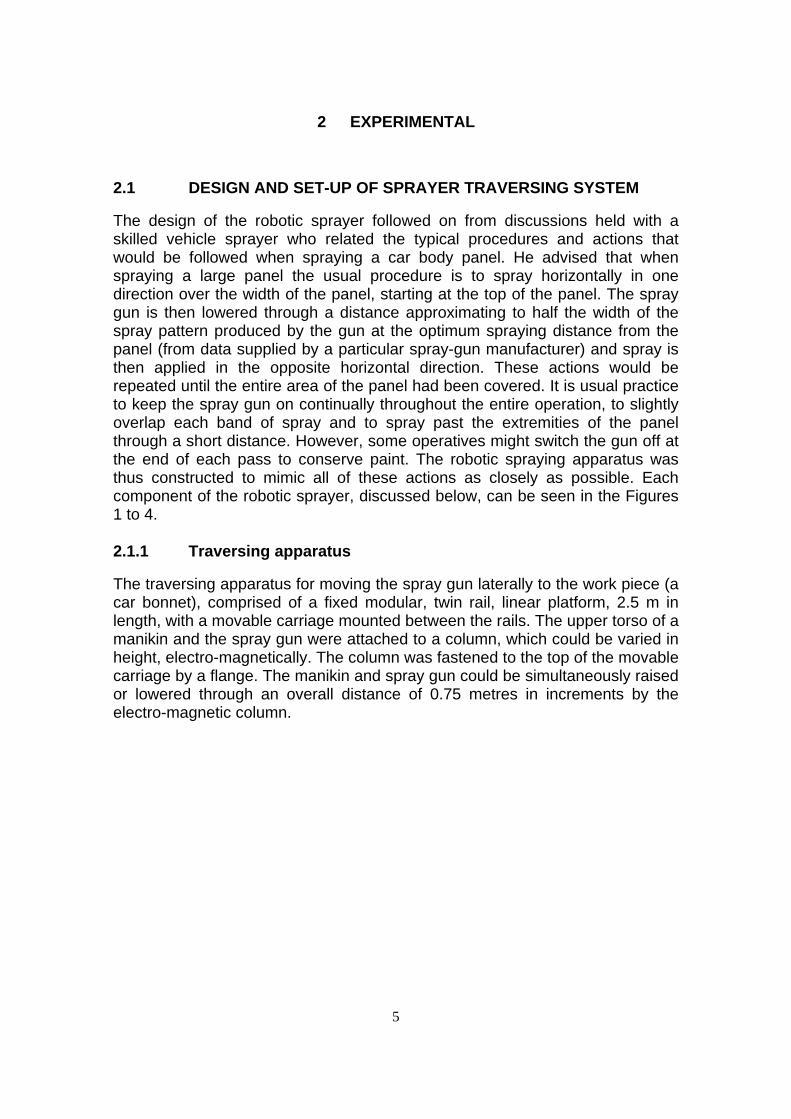
The vertical position of the column was controlled using an electronic module, containing timers and relays, which could be programmed to perform a sequence of incremental movements both up and down. The spray gun was attached to the carriage in a position approximating to the extremity of the notional arm of the manikin, at roughly the correct height for spraying, relative to the manikin’s shoulder.
Figure 2. The position of the manikin in relation to the spray gun
6
The speed and direction of travel of the carriage was governed by a high power stepper motor driving the carriage via a toothed rubber belt and roller bearings located in one of the rails. The stepper motor was operated from a consul located in the room adjacent to the spray space where all other controls for the spraying apparatus were also located. The console could be programmed to operate the stepper motor in a sequence of movements at speeds of between 0.2 ms-1 and 1.6 ms-1. For the purpose of these experiments, however, the speed of the carriage was set at the lower limit because this was closest to the speed of the arm movements demonstrated by the skilled sprayer. For these experiments the distance of travel of the carriage in each direction, starting and ending from two positions, referenced to the width of a car bonnet, was 1.6 m. This distance was chosen to include the actual width of the car bonnet plus a further 5 cm, to allow for over spraying. Magnetic reed switches were attached to the rails of the linear platform in positions close to the extremities of travel of the carriage. These switches provided reference signals to synchronise the raising and lowering of the magnetic lifting column to which the manikin and spray gun was attached and signals to synchronise the other parts of the system. The reed switches were also available to enable the spray gun to be turned on or off electronically at the beginning and end of each traverse, should that function be required. The reed switches were activated by small magnets, which were attached to the carriage at appropriate positions. The signals from the reed switches were fed into a system of latching and time-based relays acting in conjunction with the main programmable console. The signals from reed switches used on the other parts of the apparatus described later were also routed into the main operating consul to enable synchronisation with the sequence of programmed moves.
2.1.2 Work-piece holding apparatus
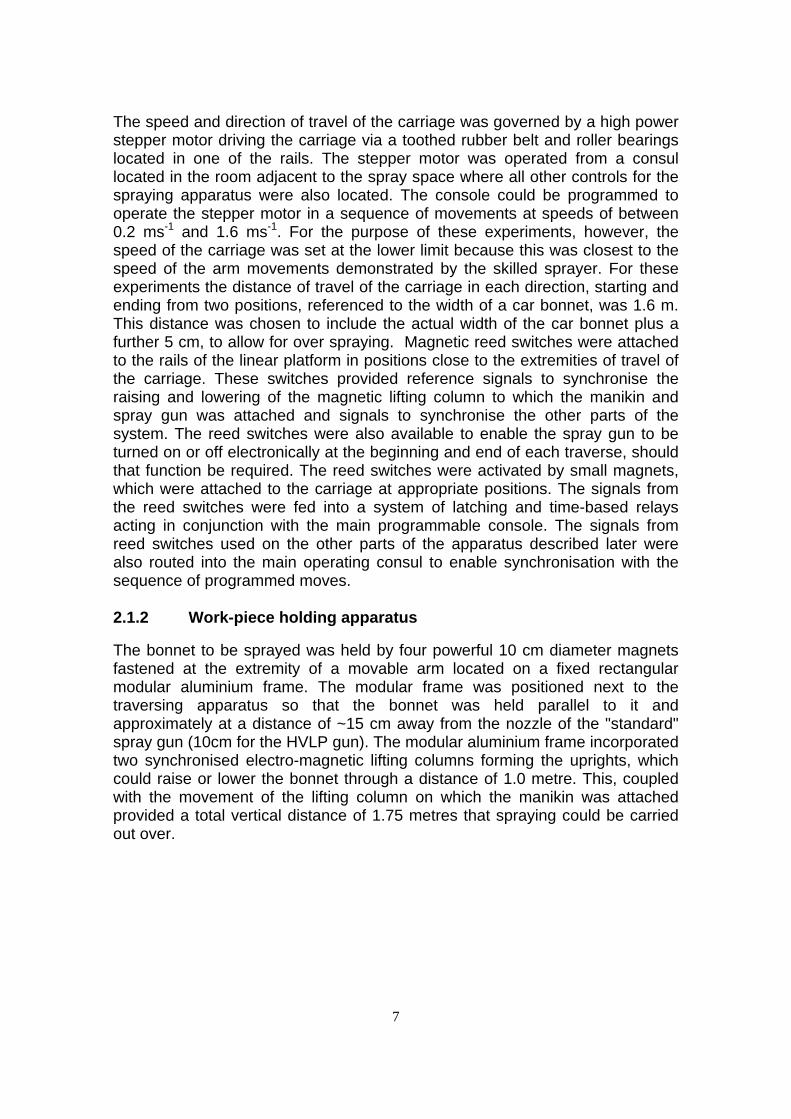
The bonnet to be sprayed was held by four powerful 10 cm diameter magnets fastened at the extremity of a movable arm located on a fixed rectangular modular aluminium frame. The modular frame was positioned next to the traversing apparatus so that the bonnet was held parallel to it and approximately at a distance of ~15 cm away from the nozzle of the "standard" spray gun (10cm for the HVLP gun). The modular aluminium frame incorporated two synchronised electro-magnetic lifting columns forming the uprights, which could raise or lower the bonnet through a distance of 1.0 metre. This, coupled with the movement of the lifting column on which the manikin was attached provided a total vertical distance of 1.75 metres that spraying could be carried out over.
7
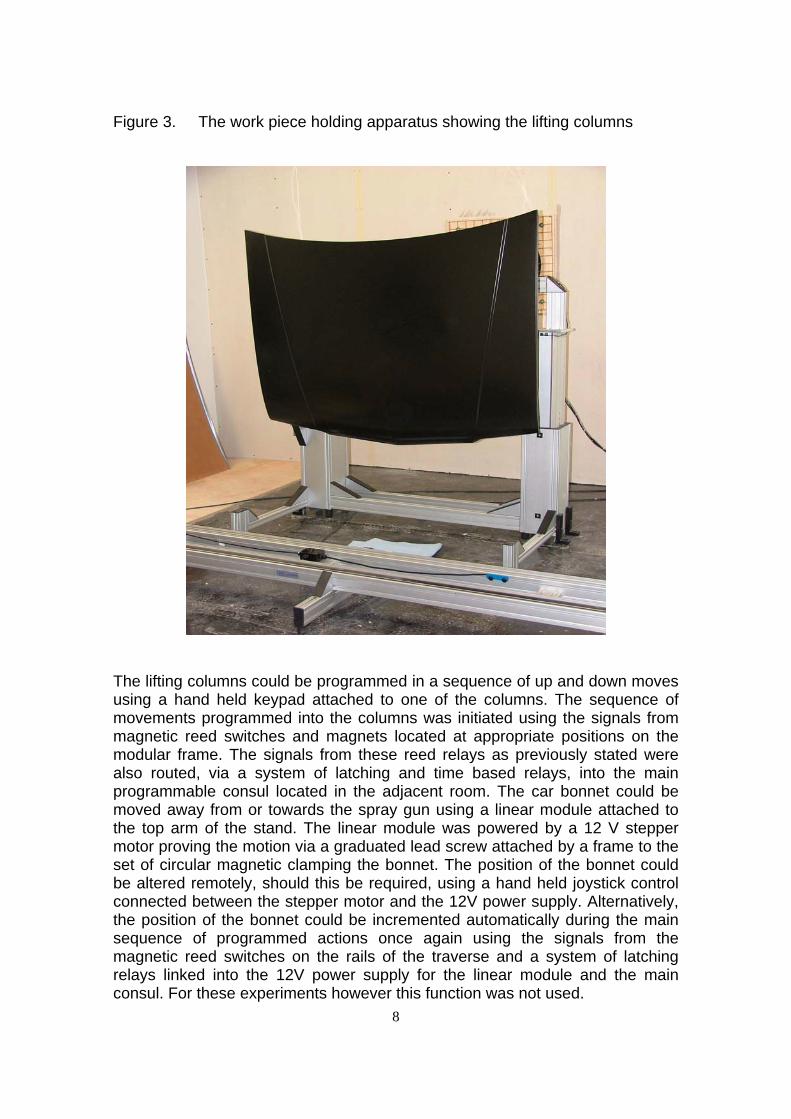
Figure 3. The work piece holding apparatus showing the lifting columns
The lifting columns could be programmed in a sequence of up and down moves using a hand held keypad attached to one of the columns. The sequence of movements programmed into the columns was initiated using the signals from magnetic reed switches and magnets located at appropriate positions on the modular frame. The signals from these reed relays as previously stated were also routed, via a system of latching and time based relays, into the main programmable consul located in the adjacent room. The car bonnet could be moved away from or towards the spray gun using a linear module attached to the top arm of the stand. The linear module was powered by a 12 V stepper motor proving the motion via a graduated lead screw attached by a frame to the set of circular magnetic clamping the bonnet. The position of the bonnet could be altered remotely, should this be required, using a hand held joystick control connected between the stepper motor and the 12V power supply. Alternatively, the position of the bonnet could be incremented automatically during the main sequence of programmed actions once again using the signals from the magnetic reed switches on the rails of the traverse and a system of latching relays linked into the 12V power supply for the linear module and the main consul. For these experiments however this function was not used.
8
2.1.3 Spray gun operation
For safety reasons during this work, the operation of the spray gun was controlled independently of the main operating system, using a pneumatic device to actuate the trigger rather than an electronic actuator.
Figure 4. The spray gun and pneumatic actuator
Air was supplied to the pneumatic actuator, which essentially was a reciprocating piston linked to the trigger of the spray gun, via two independent solenoid valves, from a small air compressor located in the adjacent room. The gun could be turned on or off from outside the spray booth by an operator using a switching module connected by a long length of cable, to the solenoid valves and their associated power supply. The operation of the spray gun and all the other functions of the automated spraying system could be observed remotely, using two small TV cameras mounted in convenient positions inside the spray booth. The cameras were radio-linked to portable battery powered TV monitors that could be observed outside the spray booth a short distance from it.
9
2.2 SPRAY ROOM CHARACTERISATION
This section describes the work carried out to characterise the HSL spray room and at an industrial ("real") spray room.
2.2.1 Summary of ventilation measurements made at a real spray room
A range of ventilation measurements were carried out at an industrial ("real") spray room. These results were then used to help realistically configure the HSL spray room for the spray painting experiments.
2.2.1.1 Description of Industrial Spray Room
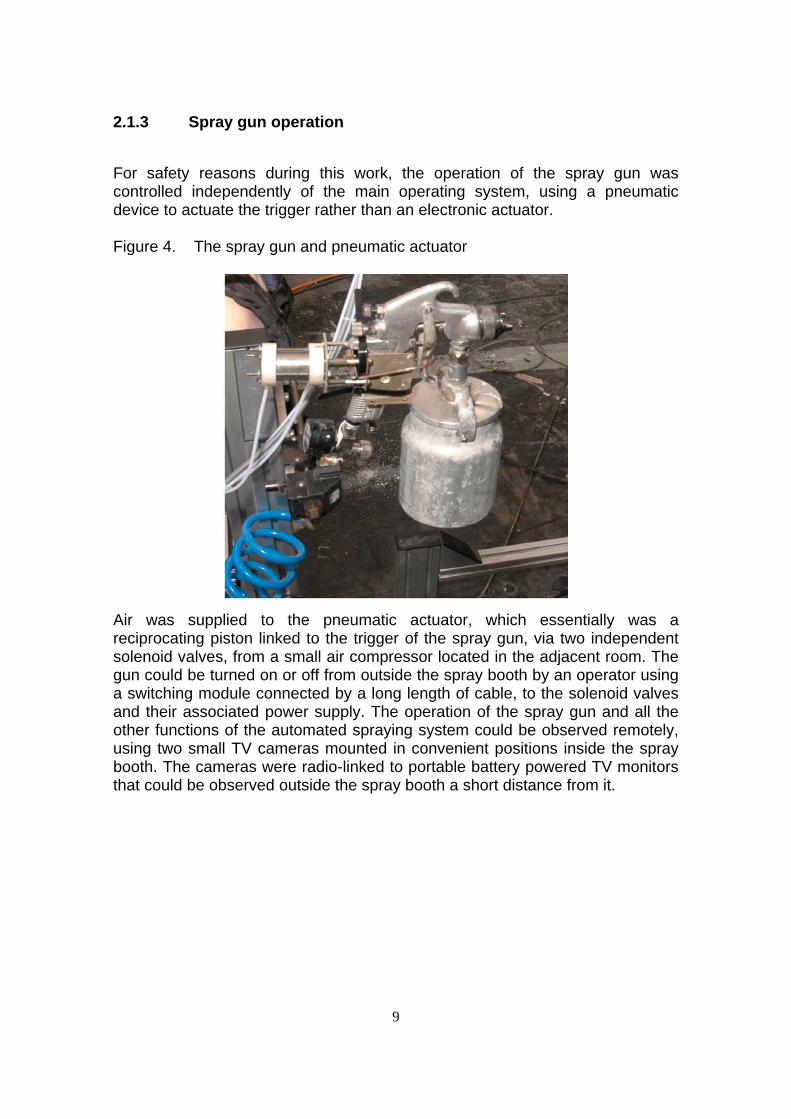
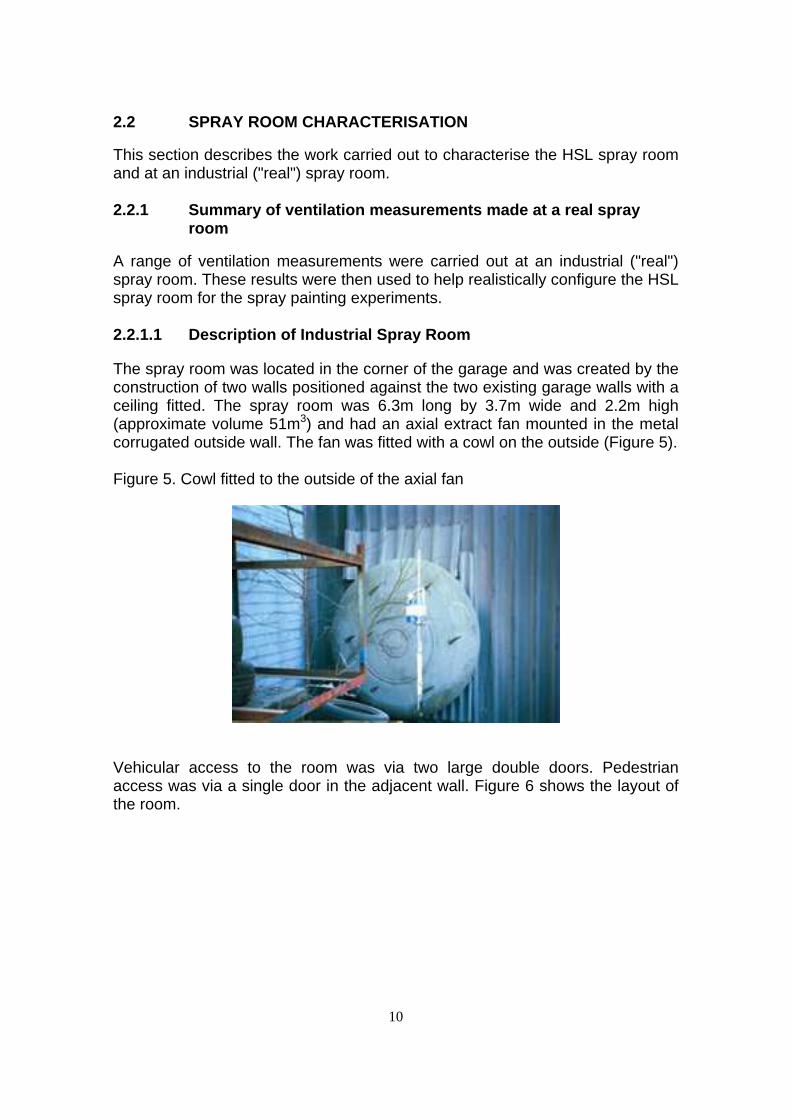
The spray room was located in the corner of the garage and was created by the construction of two walls positioned against the two existing garage walls with a ceiling fitted. The spray room was 6.3m long by 3.7m wide and 2.2m high (approximate volume 51m3) and had an axial extract fan mounted in the metal corrugated outside wall. The fan was fitted with a cowl on the outside (Figure 5).
Figure 5. Cowl fitted to the outside of the axial fan
Vehicular access to the room was via two large double doors. Pedestrian access was via a single door in the adjacent wall. Figure 6 shows the layout of the room.
10
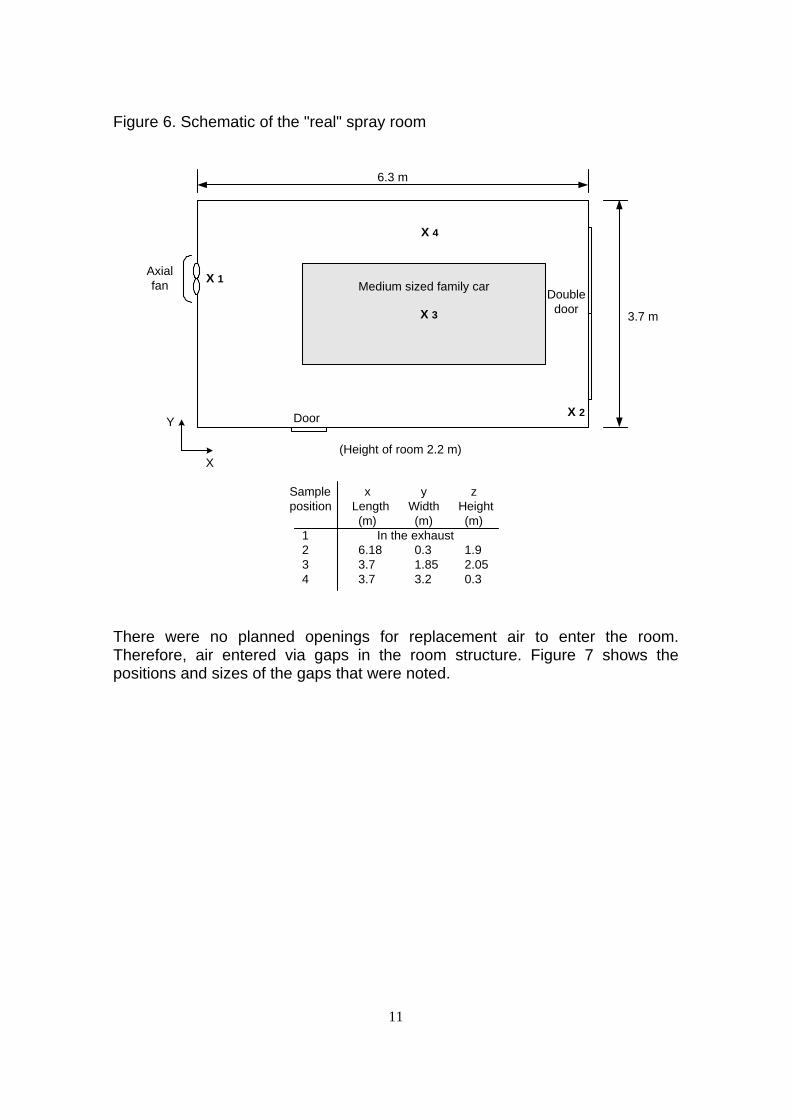
Figure 6. Schematic of the "real" spray room
6.3 m
Axial fan
X 3
X 2
X 4
X 1
Door
Medium sized family car
(Height of room 2.2 m)
Double door 3.7 m
Y
X
Sample x y z position Length Width Height
(m) (m) (m) 1 In the exhaust 2 6.18 0.3 1.9 3 3.7 1.85 2.05 4 3.7 3.2 0.3
There were no planned openings for replacement air to enter the room. Therefore, air entered via gaps in the room structure. Figure 7 shows the positions and sizes of the gaps that were noted.
11
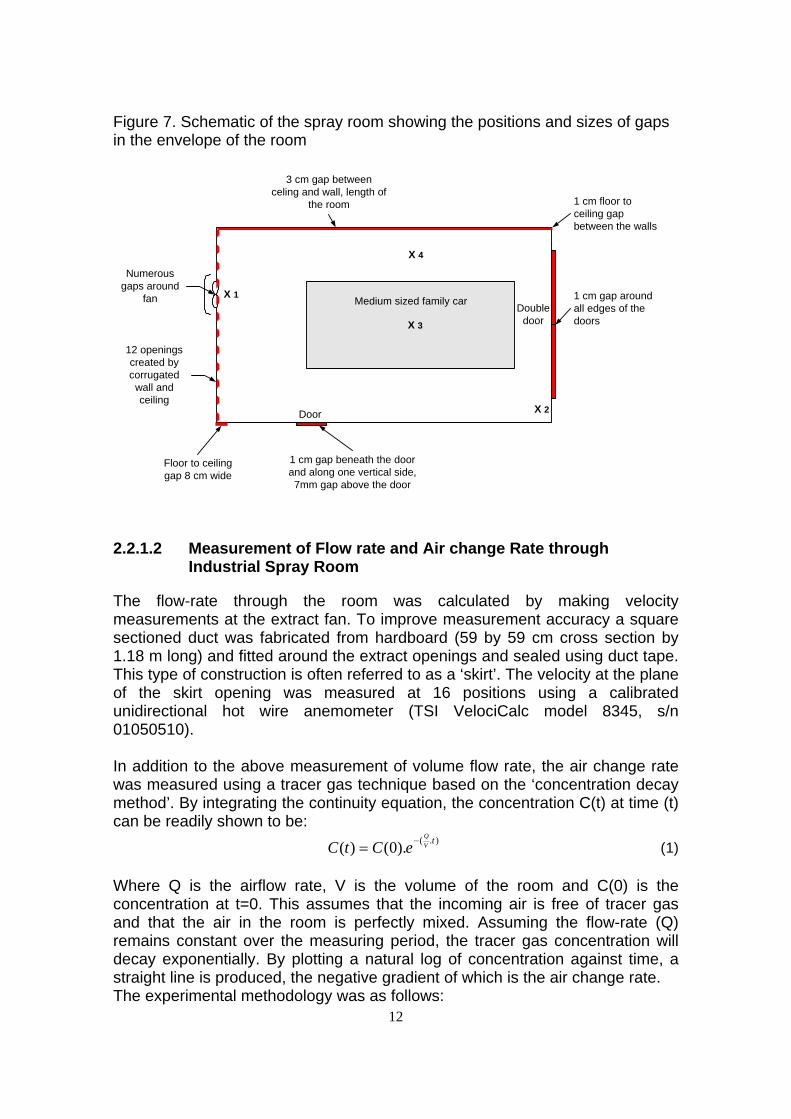
Figure 7. Schematic of the spray room showing the positions and sizes of gaps in the envelope of the room
3 cm gap between celing and wall, length of
the room 1 cm floor to ceiling gap between the walls
Numerousgaps around
fan
X 3
X 2
X 4
X 1
door
Medium sized family car
Door
Double 1 cm gap around all edges of the doors
12 openingscreated bycorrugated
wall andceiling
Floor to ceiling 1 cm gap beneath the doorgap 8 cm wide and along one vertical side,
7mm gap above the door
2.2.1.2 Measurement of Flow rate and Air change Rate through Industrial Spray Room
The flow-rate through the room was calculated by making velocity measurements at the extract fan. To improve measurement accuracy a square sectioned duct was fabricated from hardboard (59 by 59 cm cross section by 1.18 m long) and fitted around the extract openings and sealed using duct tape. This type of construction is often referred to as a ‘skirt’. The velocity at the plane of the skirt opening was measured at 16 positions using a calibrated unidirectional hot wire anemometer (TSI VelociCalc model 8345, s/n 01050510).
In addition to the above measurement of volume flow rate, the air change rate was measured using a tracer gas technique based on the ‘concentration decay method’. By integrating the continuity equation, the concentration C(t) at time (t) can be readily shown to be:
VC(t) = C( ).0 e −( Q .t ) (1)
Where Q is the airflow rate, V is the volume of the room and C(0) is the concentration at t=0. This assumes that the incoming air is free of tracer gas and that the air in the room is perfectly mixed. Assuming the flow-rate (Q) remains constant over the measuring period, the tracer gas concentration will decay exponentially. By plotting a natural log of concentration against time, a straight line is produced, the negative gradient of which is the air change rate. The experimental methodology was as follows:
12
1. The extract fan was switched off and a neutrally buoyant tracer gas (17% sulphur hexafluoride (SF6) in Helium) was introduced into a mixing fan within the room. The release continued until the concentration, measured using an infrared gas analyser, was approximately between 50 and 100 ppm.
2. The tracer gas release was then stopped and the mixing fan was allowed to run for 1 to 2 minutes to ensure a homogeneous concentration within the room.
3. The extract fan was switched on and the decay in SF6 concentration logged onto a laptop computer every 10s. The mixing fan was left on throughout the test to ensure good mixing.
The results and discussion for this work are given in Section 3.1. To further characterise the ventilation and air movement within the spray room further tracer gas tests and airflow visualisation were carried out and these are described below.
2.2.1.3 Tracer gas tests at a Real Spray Room
Tracer gas decay measurements were carried out at a number of positions in the spray room with a medium sized family car present in the room (Rover 200). Figure 6 (above) shows the location of the car and the sampling positions. The test methodology was the same as that described above, except that the mixing fan was turned off at the same time as the extract fan was turned on and the test started.
Ideally when making these types of measurements, the air would be sampled sequentially at each position during the measurement period. However, due to the relatively high volume flow rate through the room it was recognised that the tracer gas concentration would fall to zero before enough data was collected. For this reason, only one position was sampled during a test and the test repeated at each position. It has been assumed, therefore, that the ventilation rate did not change between tests. To check this the extract sampling position was repeated and the results compared. The results for this work are given in Figure 18, section 3.2.
2.2.2 HSL test spray room
Simulation spray painting experiments were carried out in the HSL spray room (see sections 2.3 to 2.8). Prior to these experiments the air-change rate and volume flow rates for the room were determined.
2.2.2.1 Description of HSL Spray Room - Configuration 1
The room configuration and the ventilation parameters were selected from the work described above (section 2.2.1) and data gathered by Julie Helps and Tim Davies (section 6.3). This study included details of 11 spray rooms and included room dimensions and an estimate of the extract volume flow-rate (appendix 4).
13
It should be noted that the volume flow-rates were calculated from air velocity measurements made at the fan inlet and due to the non-uniformity of the air speed close to the fan the calculated volume flow-rates are only estimates.
From this data it is clear that not only the dimensions of spray rooms vary, but so do the volume flow-rates. This is not surprising, as spray rooms will be made to fit a particular area of a garage and fan selection will be based on availability and price rather than flow-rate and pressure requirements. For these reasons it is likely that all spray rooms are unique in one way or another.
Using the data from appendices 3 and 4 the HSL down draft spray booth was modified to function as an average spray room. This was achieved by:
(i) The addition of two false walls. (ii) Panelling over the ceiling air inlet and isolating the air inlet fan. (iii) Panelling over the extract pit. (iv) Connecting the extract fan, via the pit, to a 50 cm diameter duct,
which in turn was connected to a 50 cm diameter hole in the centre of one of the false walls to form the extract opening.
The modifications resulted in a room with dimensions 5.3 m long by 4.2 m wide by 3m high (approximate volume of 66 m3). To allow full control of the ventilation rate the extract fan was fitted with an inverter.
To allow air to enter the room a number of linear gaps were cut in the opposite false wall. This was intended to reproduce unplanned replacement air via gaps around double doors. Figure 8 shows a plan view of the room, whilst Figure 9 shows the position and dimensions of the air inlet gaps.
14
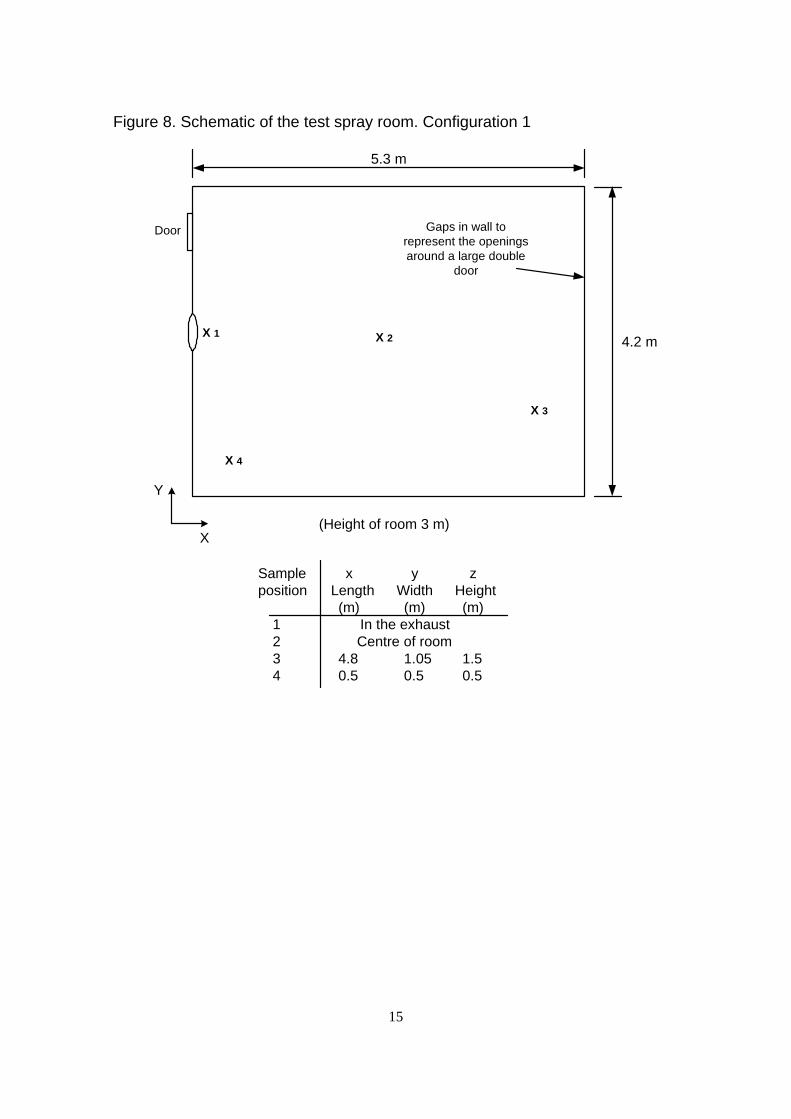
Figure 8. Schematic of the test spray room. Configuration 1
5.3 m
le
X 1 4.2 mX 2
X 4
X 3
Door Gaps in wall to represent the openings around a large doub
door
(Height of room 3 m)
Y
X
Sample position
1234
x y z Length Width Height (m) (m) (m)
In the exhaust Centre of room
4.8 1.05 1.5 0.5 0.5 0.5
15
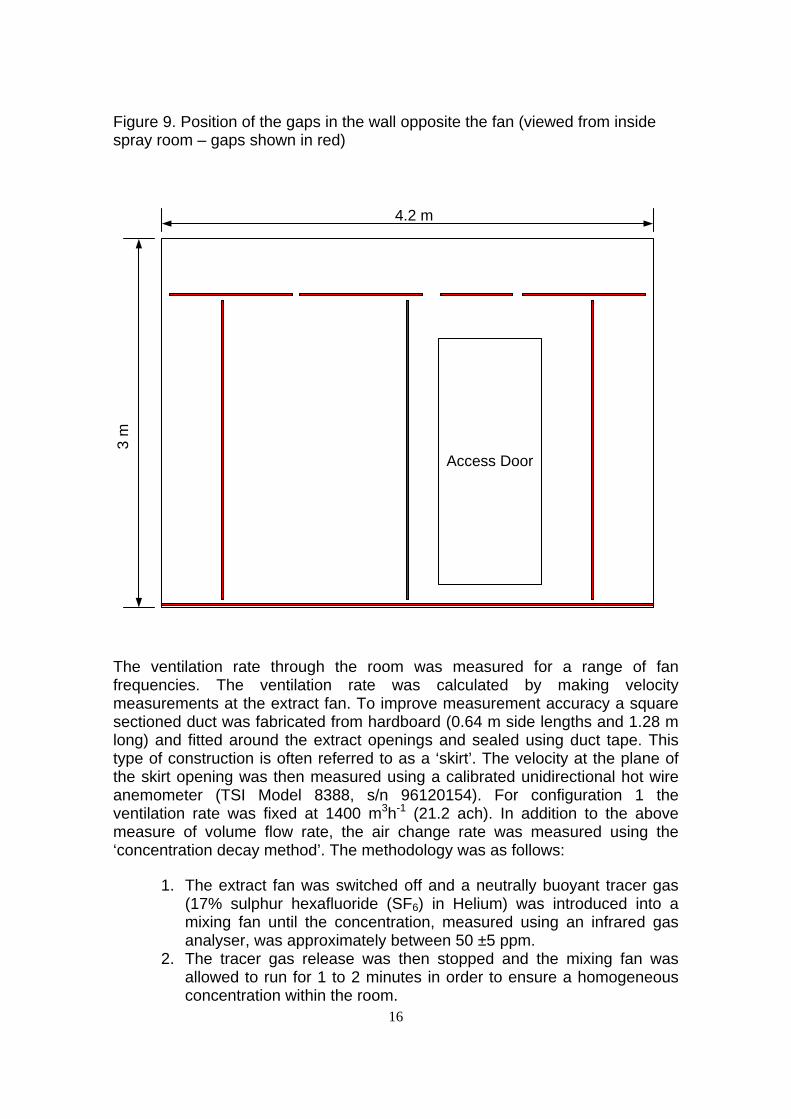
Figure 9. Position of the gaps in the wall opposite the fan (viewed from inside spray room – gaps shown in red)
3 m
Access Door
4.2 m
The ventilation rate through the room was measured for a range of fan frequencies. The ventilation rate was calculated by making velocity measurements at the extract fan. To improve measurement accuracy a square sectioned duct was fabricated from hardboard (0.64 m side lengths and 1.28 m long) and fitted around the extract openings and sealed using duct tape. This type of construction is often referred to as a ‘skirt’. The velocity at the plane of the skirt opening was then measured using a calibrated unidirectional hot wire anemometer (TSI Model 8388, s/n 96120154). For configuration 1 the ventilation rate was fixed at 1400 m3h-1 (21.2 ach). In addition to the above measure of volume flow rate, the air change rate was measured using the ‘concentration decay method’. The methodology was as follows:
1. The extract fan was switched off and a neutrally buoyant tracer gas (17% sulphur hexafluoride (SF6) in Helium) was introduced into a mixing fan until the concentration, measured using an infrared gas analyser, was approximately between 50 ±5 ppm.
2. The tracer gas release was then stopped and the mixing fan was allowed to run for 1 to 2 minutes in order to ensure a homogeneous concentration within the room.
16
3. The extract fan was switched on and the SF6 concentration logged onto a laptop computer every 10s. The mixing fan was left on throughout the test to ensure the air in the room was well mixed.
For all tracer gas tests the spray room was empty, with the exception of the test spray panel. Figure 8 (above) shows the location of the sample positions. The test methodology was the same as that described above, except that the mixing fan was turned off at the same time as the extract fan was turned on and the test started.
Ideally when making these types of measurements, the air would be sampled sequentially at each position during the measurement period. However, due to the relatively high volume flow rate through the room it was recognised that the tracer gas concentration would fall before enough data was gathered. For this reason, only one position was sampled during a test and the test repeated at each position. Therefore, it has been assumed that the ventilation rate did not change between tests.
The tracer gas concentration plots for this work are shown in Figure 19, section 3.3. The figure also includes a decay curve based on perfect mixing, calculated from equation 1 and the data from the velocity measurements.
2.2.2.2 Description of HSL Spray Room - Configuration 2
The test spray room was modified to create a room where the ventilation was planned. The linear gaps in the false wall were replaced with 4 square inlets placed in the centre of each quadrant of the wall. At each opening a standard sized filter frame (580mm by 580mm) was fitted and F5 (EU 5) efficiency filter material fitted. At the opposite side of the room an additional false wall was constructed 0.5m from the extract. Again, 4 square openings were created in the centre of each quadrant of the wall and at each opening a standard sized filter frame (580mm by 580mm) was fitted. "Green paint stop" was fitted as the pre-filter and followed by the F5 (EU 5) as the main filter. Figure 10 shows the main features of the modified test spray room.
17
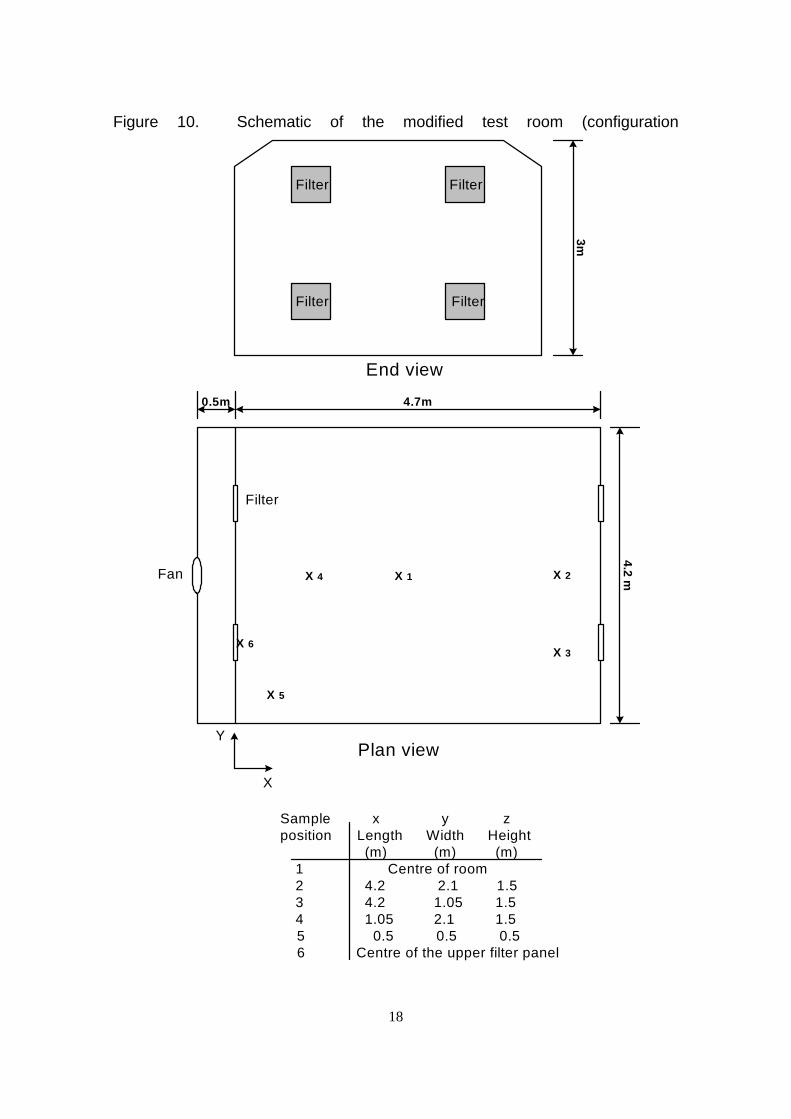
Figure 10. Schematic of the modified test room (configuration
3m
Fi
Filter Filter
Filter lter
End view
4.2 mX 1 X 2
X 3
X 4
X 5
X 6
Fil
4.7m 0.5m
ter
Fan
Y Plan view
X
Sample position
12345 6
x y z Length Width Height (m) (m) (m)
Centre of room4.2 2.1 1.5 4.2 1.05 1.5 1.05 2.1 1.5
0.5 0.5 0.5 Centre of the upper filter panel
18
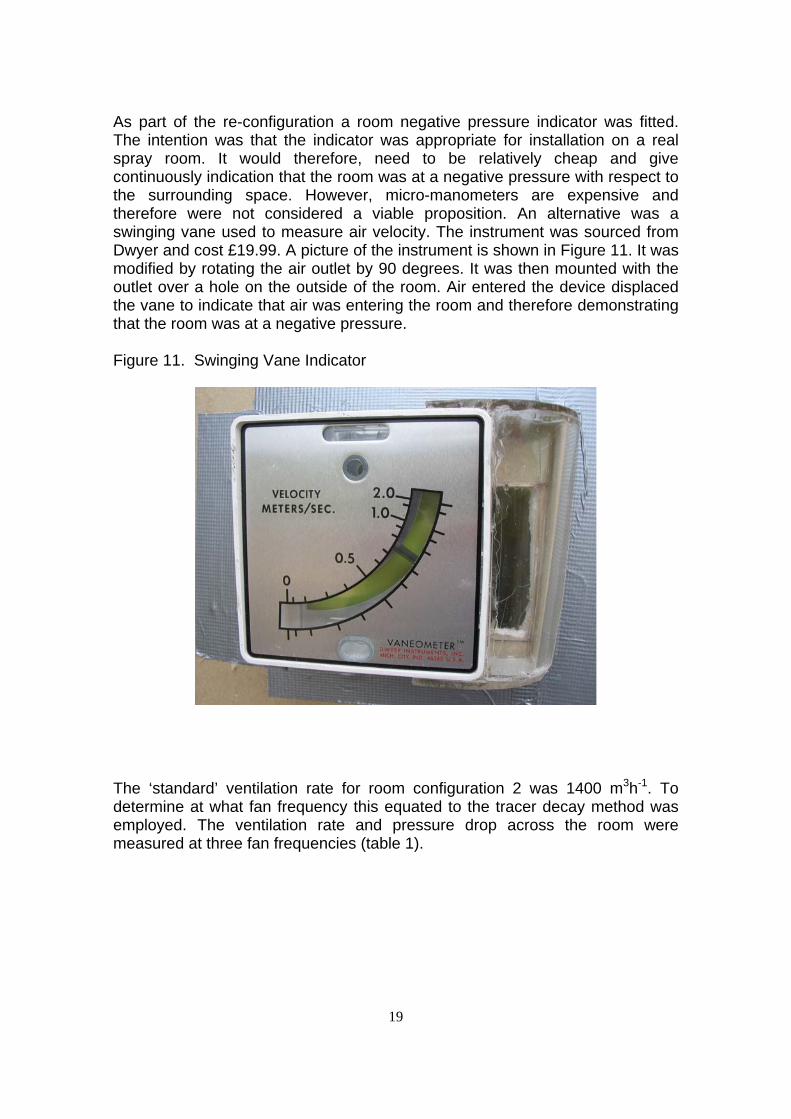
As part of the re-configuration a room negative pressure indicator was fitted. The intention was that the indicator was appropriate for installation on a real spray room. It would therefore, need to be relatively cheap and give continuously indication that the room was at a negative pressure with respect to the surrounding space. However, micro-manometers are expensive and therefore were not considered a viable proposition. An alternative was a swinging vane used to measure air velocity. The instrument was sourced from Dwyer and cost £19.99. A picture of the instrument is shown in Figure 11. It was modified by rotating the air outlet by 90 degrees. It was then mounted with the outlet over a hole on the outside of the room. Air entered the device displaced the vane to indicate that air was entering the room and therefore demonstrating that the room was at a negative pressure.
Figure 11. Swinging Vane Indicator
The ‘standard’ ventilation rate for room configuration 2 was 1400 m3h-1. To determine at what fan frequency this equated to the tracer decay method was employed. The ventilation rate and pressure drop across the room were measured at three fan frequencies (table 1).
19
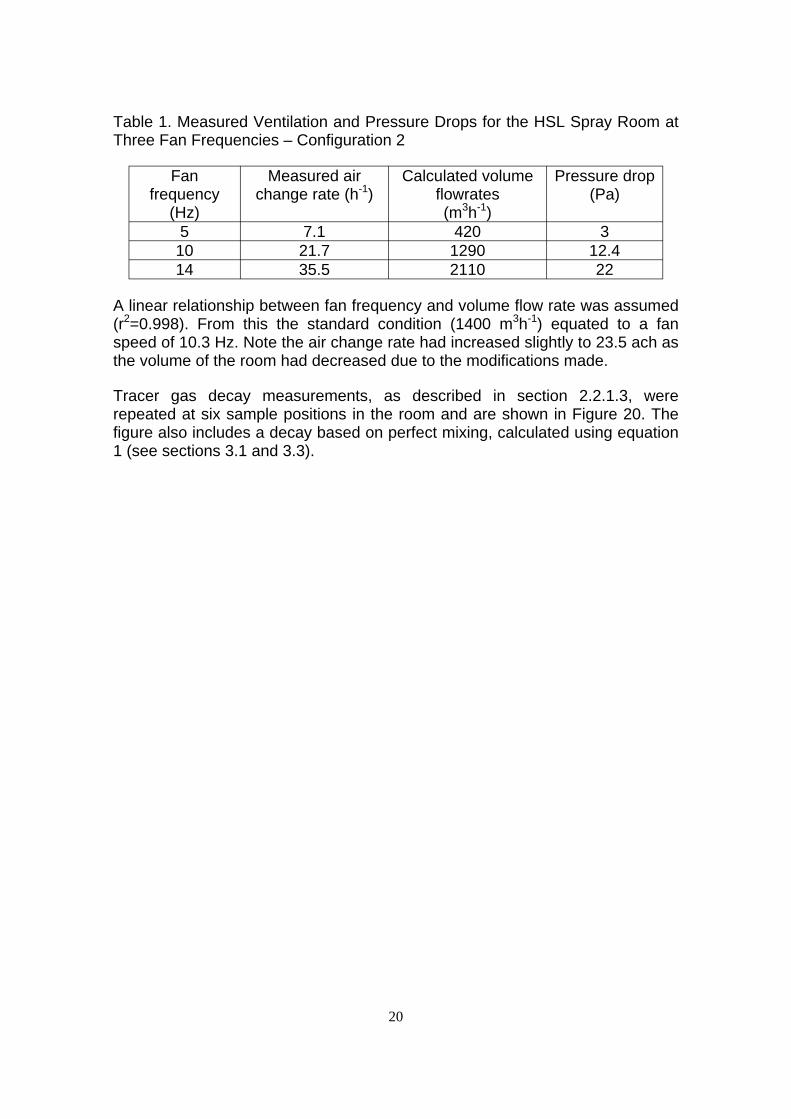
Table 1. Measured Ventilation and Pressure Drops for the HSL Spray Room at Three Fan Frequencies – Configuration 2
Fan frequency
(Hz)
Measured air change rate (h-1)
Calculated volume flowrates (m3h-1)
Pressure drop (Pa)
5 7.1 420 3 10 21.7 1290 12.4 14 35.5 2110 22
A linear relationship between fan frequency and volume flow rate was assumed (r2=0.998). From this the standard condition (1400 m3h-1) equated to a fan speed of 10.3 Hz. Note the air change rate had increased slightly to 23.5 ach as the volume of the room had decreased due to the modifications made.
Tracer gas decay measurements, as described in section 2.2.1.3, were repeated at six sample positions in the room and are shown in Figure 20. The figure also includes a decay based on perfect mixing, calculated using equation 1 (see sections 3.1 and 3.3).
20
2.3 INITIAL SET-UP OF SPRAYING EXPERIMENTS AND GENERAL EXPERIMENTAL DETAILS
The paints used in the HSL spray room work were;
• Topcoat/Lacquer - a 2-pack 1,6-diisocyanatohexane (HDI) based topcoat (hardener and lacquer).
• The hardener is predominantly a mixture of oligo-isocyanates (mainly biuret, dimer, isocyanurate) in hydrocarbon solvent (xylenes, n-butyl acetate and trimethylbenzene). Characterisation of the NCO content of the hardener by titration, liquid chromatography with electro-chemical and ultra-violet/visible detection (LC/EC/UV) and liquid chromatography/tandem mass spectrometry (LC/MS/MS) (HSL, 2003d; HSL, 2003e) found the %NCO content to be ~ 6.4 ± 0.11 and the composition to be approximately ~50% biuret, ~30% uretidinedione (dimer), ~7% isocyanurate, ~2% isocyanurate-triuretidinedione and < 1% diisocyanurate and other oligomers of HDI. The monomer content was found to be ~1%.
• The lacquer was a mix of resins in a hydrocarbon solvent and the thinners were primarily n-butyl acetate (30-50% w/w) and xylene (4030%). The topcoat was mixed 100/50/30 (lacquer/hardener/thinners) as stated in the supplier's instructions (Hallam Factors, Sheffield, UK).
The topcoat was used in the majority of experiments.
• Primer – a 2-pack 1,6-diisocyanatohexane (HDI) based primer comprising of a grey paint and the isocyanate containing hardener. Characterisation of the NCO content of the hardener as described above found it to have a %NCO content of ~8.1 ± 0.21 and a composition of ~ 95% isocyanurate, ~3% di-isocyanurate with < 1% of monomer, biuret, tri-isocyanurate and tetra-isocyanurate. The primer was mixed 2/1 (paint/hardener) as stated in the supplier's instructions (Hallam Factors, Sheffield, UK)
The automatic spraying system and ventilation systems have been described above (sections 2.1 and 2.2). Configuration 1 was the spray booth set up as a spray room i.e. with the floor vents etc blocked as described previously. Configuration 2 (experiments 22 and 23) used the spray booth with a false wall added in front of the extract fan and at the back of the booth. These false walls contained four panels of F5 EU5 filter material each.
Spray experiments were carried out in the HSL spray room using a variety of spray guns;
• "standard" gun – DeVilbiss JGA suction feed, aircap 186, nozzle size 14 (= 1.4 mm) diameter. Part # JGA-614FWL-186B
• gravity-fed gun – DeVilbiss GTi with #110 Compliant/Trans-Tech air cap, nozzle size 14). Part # GTI-G110B-14
21
• high volume low pressure (HVLP) - DeVilbiss GTi (as above) with #115 HVLP air cap, nozzle size 14. Part # GTI-G115B-14
• high volume low pressure (HVLP) – SATA (experiment 25)
Inlet pressures were set as stated in the user manuals for the guns e.g. gravity fed gun was ~ 30 p.s.i., the HVLP gun was ~ 30 p.s.i. and the suction fed "standard" gun ~ 50 p.s.i. The compressor pressure varied but was usually ~ 120 p.s.i. Gun settings (e.g. spray fan) were set to "fully open" and the position of the control knob marked to enable spraying under reproducible conditions to be carried out. The gun was positioned ~ 15 cm from the car bonnet for the "standard" and gravity fed gun with the compliant nozzle. For the HVLP guns the gun was positioned ~ 10 cm from the bonnet.
After discussions with professional car sprayers, two spray patterns were used in these experiments,
• Overlapping - The automatic traversing system was programmed for a 3 minute cycle which was 14 passes of the sprayed car bonnet, the traverse of the sprayer was ~ 1.6 m. At the end of the traverse the sprayer overlapped the bonnet by ~ 10 cm.
• No overlap - The automatic traversing system was programmed for a 3 minute cycle which was 30 passes of the sprayed car bonnet, the traverse of the sprayer was ~0.9 m. At the end of the traverse the sprayed did not overlap the bonnet.
Spraying was controlled by the auto-trigger and spraying was carried out for 2 minutes i.e. 30 seconds into the traversing cycle spraying was started (see Section 2.1 for full details on the sprayer system).
Sampling and analysis for airborne isocyanates was carried out as described in MDHS 25/3 (HSL, 1999). This method uses an impinger containing a solution of 1-(2-methoxyphenyl)piperazine (MP) derivatizing agent in toluene backed by a MP coated filter. The sampling rate used is 1l/min. Sampling was carried out at a number of points around the spray room (see figure 31, appendix 1) to try to model the cloud of NCO aerosol produced during spraying. If sufficient sampling equipment was available then duplicate samples were taken in some of the sampling positions. Analysis used liquid chromatography with electrochemical and ultra-violet/visible detection (LC/EC/UV) for quantification. Typical limits of detection (LOD) for this method (EC detection) are ~ 0.01 µg NCO/ml which corresponds to 4 µg NCO/m3 for a 5 l sample. Liquid chromatography/tandem mass spectrometry (LC/MS/MS) was used for confirmation of identification.
After spraying the spray room was left for 45 to 60 minutes before the airborne NCO samplers were switched off, filter samples field desorbed in MP solution and the samples returned to the laboratory for analysis. The amount of paint used was obtained by weighing the spray gun paint container before and after spraying. Sprayer experiments where the gun had failed to spray efficiently, the
22
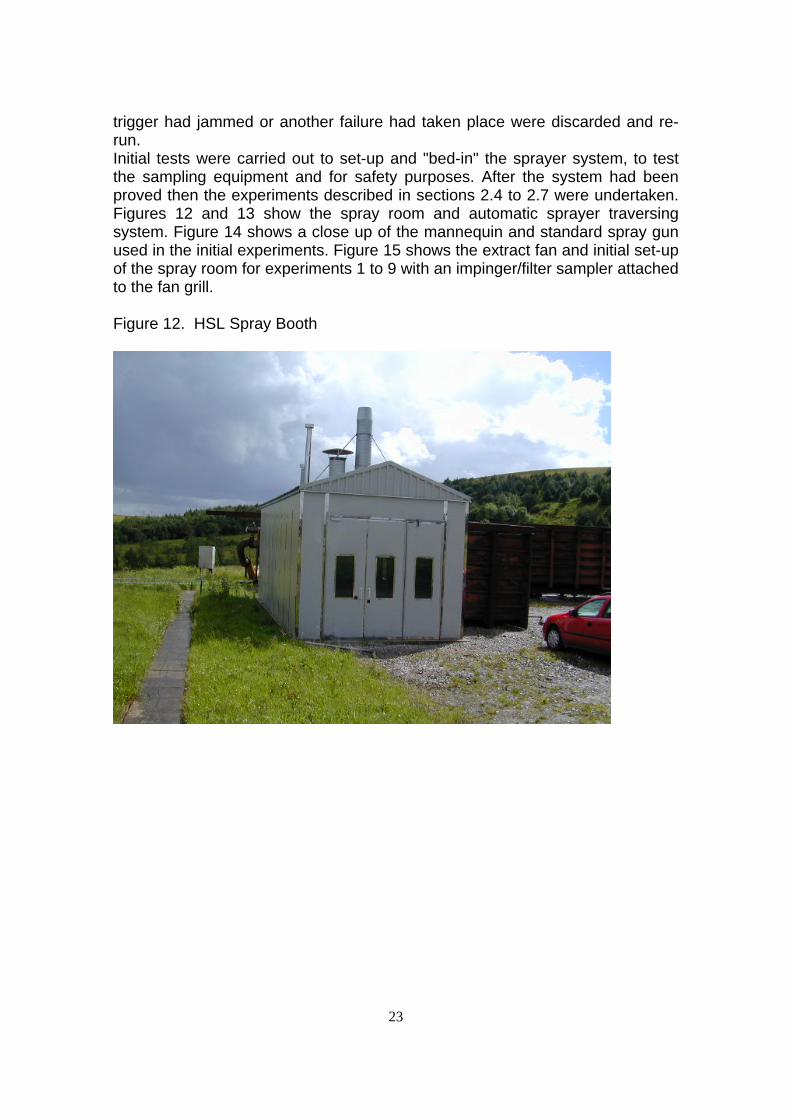
trigger had jammed or another failure had taken place were discarded and rerun. Initial tests were carried out to set-up and "bed-in" the sprayer system, to test the sampling equipment and for safety purposes. After the system had been proved then the experiments described in sections 2.4 to 2.7 were undertaken. Figures 12 and 13 show the spray room and automatic sprayer traversing system. Figure 14 shows a close up of the mannequin and standard spray gun used in the initial experiments. Figure 15 shows the extract fan and initial set-up of the spray room for experiments 1 to 9 with an impinger/filter sampler attached to the fan grill.
Figure 12. HSL Spray Booth
23
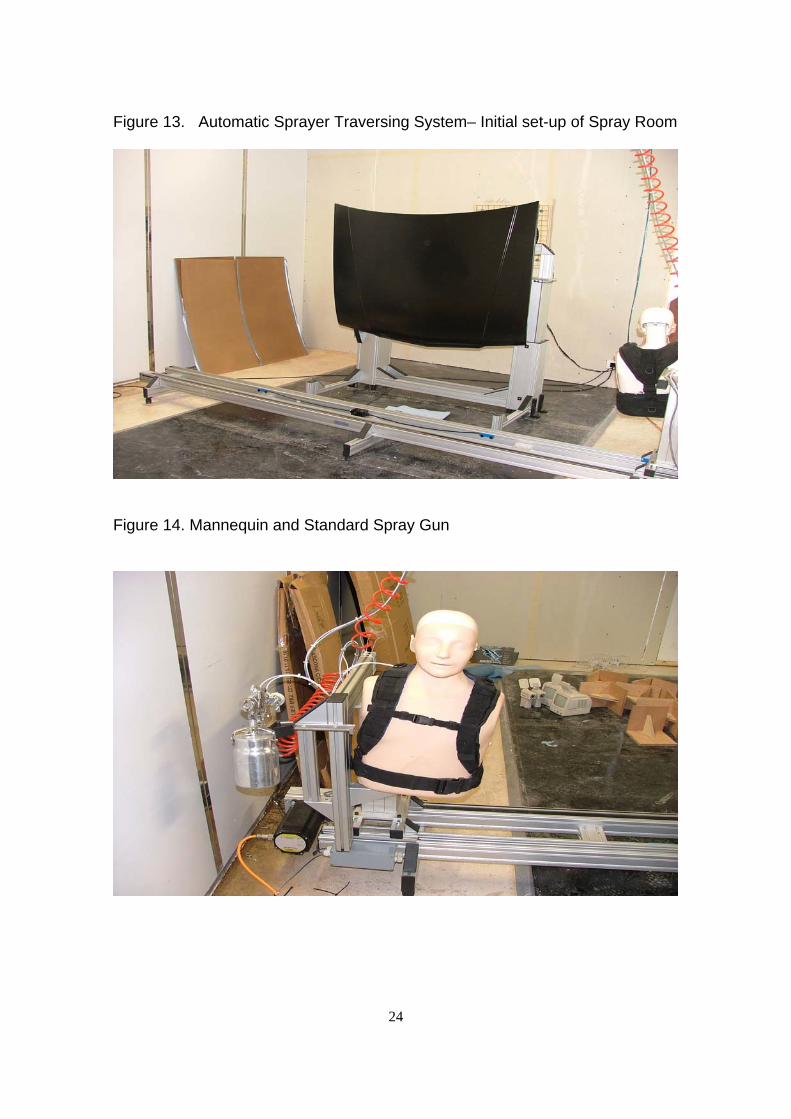
Figure 13. Automatic Sprayer Traversing System– Initial set-up of Spray Room
Figure 14. Mannequin and Standard Spray Gun
24
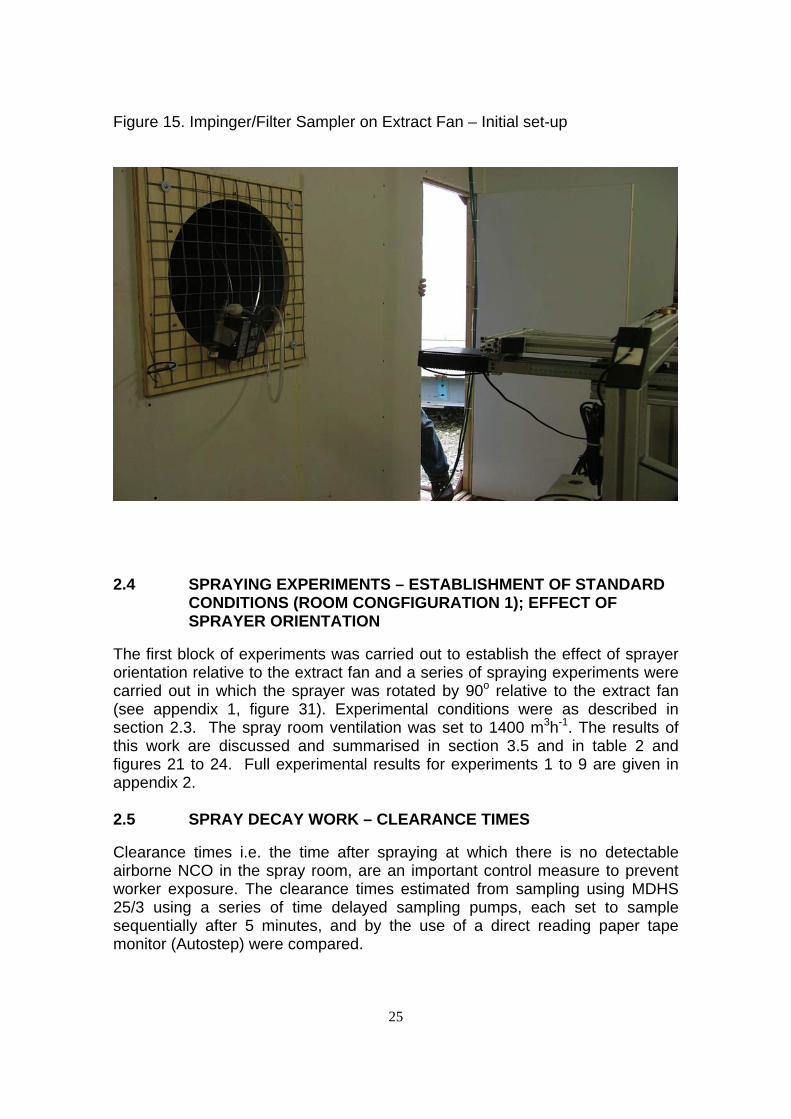
Figure 15. Impinger/Filter Sampler on Extract Fan – Initial set-up
2.4 SPRAYING EXPERIMENTS – ESTABLISHMENT OF STANDARD CONDITIONS (ROOM CONGFIGURATION 1); EFFECT OF SPRAYER ORIENTATION
The first block of experiments was carried out to establish the effect of sprayer orientation relative to the extract fan and a series of spraying experiments were carried out in which the sprayer was rotated by 90o relative to the extract fan (see appendix 1, figure 31). Experimental conditions were as described in section 2.3. The spray room ventilation was set to 1400 m3h-1. The results of this work are discussed and summarised in section 3.5 and in table 2 and figures 21 to 24. Full experimental results for experiments 1 to 9 are given in appendix 2.
2.5 SPRAY DECAY WORK – CLEARANCE TIMES
Clearance times i.e. the time after spraying at which there is no detectable airborne NCO in the spray room, are an important control measure to prevent worker exposure. The clearance times estimated from sampling using MDHS 25/3 using a series of time delayed sampling pumps, each set to sample sequentially after 5 minutes, and by the use of a direct reading paper tape monitor (Autostep) were compared.
25
The principal advantages of the paper tape monitor are ease-of-use and real-time measurements. HSL has previously carried out a large amount of work on various direct reading instruments for airborne NCO monitoring (HSL, 1991a; HSL 1991b; HSL, 1991c; HSL, 1991d; HSL, 2003f). This previous work may be summarised as finding that these devices work well for monomeric vapour but are not quantitative for polymeric NCO or aerosols. However, direct reading instruments may be of use as indicators.
2.6 AUTOSTEP PROFILE DECAY WORK – CLEARANCE TIMES
Experiments were carried with the Autostep paper tape reader to assess it's utility in measuring clearance times for the spray room. These results were compared with those from a portable photo-ionisation detector (PID - Microdust Pro and Microdust 880) and the total airborne NCO results as measured by MDHS 25/3 (experiments 6 and 7, appendix 2). The results of this work are given in figures 25 to 28 and table 3 – sections 3.6 and 3.7.
2.7 SPRAYING EXPERIMENTS – EFFECT OF MODIFICATIONS TO SPRAY ROOM CONDITIONS; ALTERED SPRAY GUN/SPRAY PATTERN/SPRAY ROOM CONFIGURATION/PAINT TYPE/ROOM AIR-FLOW
The second block of experiments was carried out to establish the effect of minor spray room modifications on airborne NCO levels. Experimental conditions were as described in section 2.3. The results of this work are discussed and summarised in section 3.8 and in table 4 and figures 29 and 30. Full experimental results for experiments 14 to 25 are given in appendix 2.
Experiments 14 and 15 were the control experiments, the "standard gun" was used with an overlapping spray pattern and the topcoat formulation was sprayed. In experiments 17 and 18 the non-overlapping spray pattern was used. In experiment 16 the primer was sprayed. All these experiments used the room set up in configuration 1 i.e. no false wall or filters. In experiments 19 and 20 the air-flow through the room was doubled from 1400 m3h-1 to 2800 m3h-1
(both using room configuration 1) and then reduced to 700 m3h-1. In experiments 21 and 22 a false wall was constructed 0.5 m in front of the fan and the four extract openings fitted to the wall as described in section 2.2 (configuration 2). The aim of these experiments was to see if a different arrangement of the number and position of inlet and outlet opening, including filtration, would lead to improved airflow through the spray room and so leading to more rapid clearing of the airborne NCO. Figures 16 and 17 show the filter panels fitted to the front and back of the room.
26
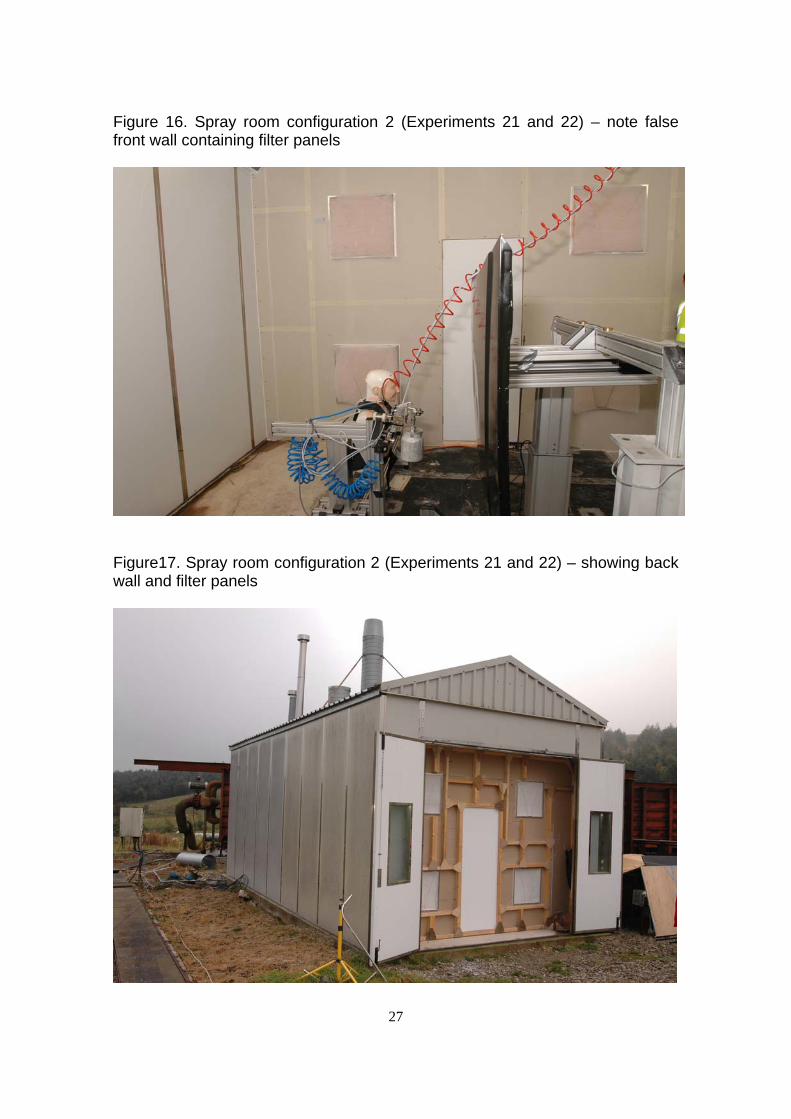
Figure 16. Spray room configuration 2 (Experiments 21 and 22) – note false front wall containing filter panels
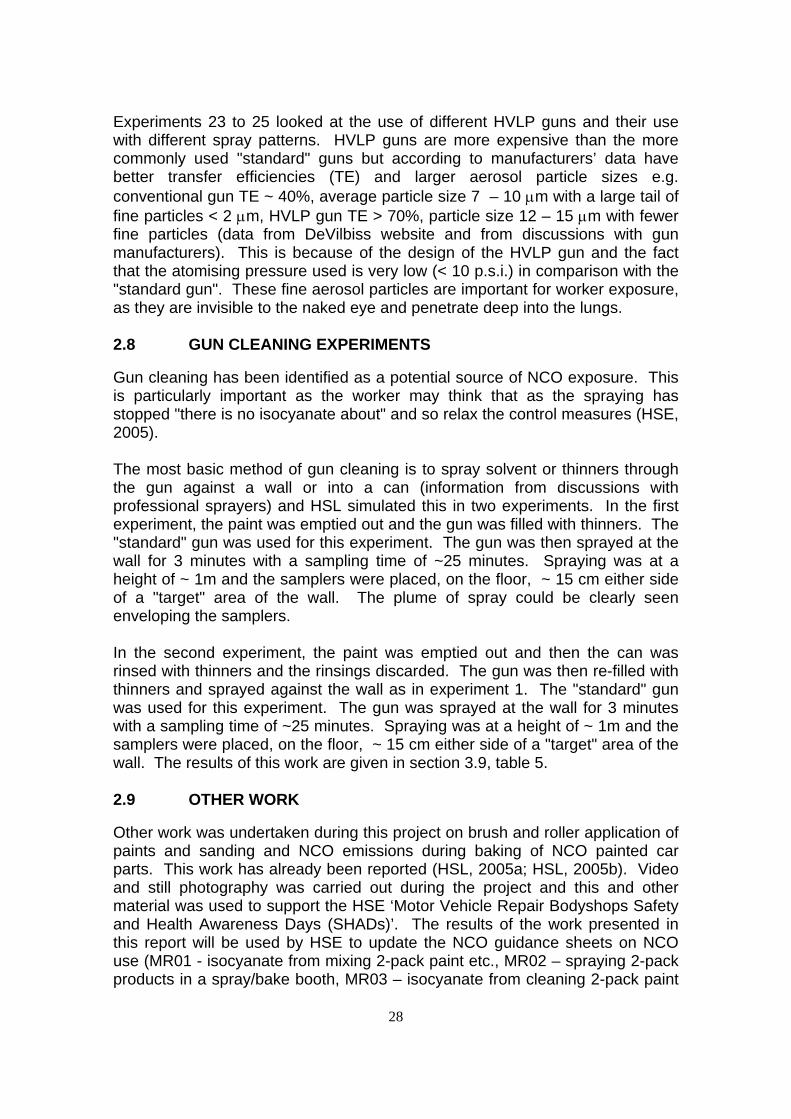
Figure17. Spray room configuration 2 (Experiments 21 and 22) – showing back wall and filter panels
27
Experiments 23 to 25 looked at the use of different HVLP guns and their use with different spray patterns. HVLP guns are more expensive than the more commonly used "standard" guns but according to manufacturers’ data have better transfer efficiencies (TE) and larger aerosol particle sizes e.g. conventional gun TE ~ 40%, average particle size 7 – 10 µm with a large tail of fine particles < 2 µm, HVLP gun TE > 70%, particle size 12 – 15 µm with fewer fine particles (data from DeVilbiss website and from discussions with gun manufacturers). This is because of the design of the HVLP gun and the fact that the atomising pressure used is very low (< 10 p.s.i.) in comparison with the "standard gun". These fine aerosol particles are important for worker exposure, as they are invisible to the naked eye and penetrate deep into the lungs.
2.8 GUN CLEANING EXPERIMENTS
Gun cleaning has been identified as a potential source of NCO exposure. This is particularly important as the worker may think that as the spraying has stopped "there is no isocyanate about" and so relax the control measures (HSE, 2005).
The most basic method of gun cleaning is to spray solvent or thinners through the gun against a wall or into a can (information from discussions with professional sprayers) and HSL simulated this in two experiments. In the first experiment, the paint was emptied out and the gun was filled with thinners. The "standard" gun was used for this experiment. The gun was then sprayed at the wall for 3 minutes with a sampling time of ~25 minutes. Spraying was at a height of ~ 1m and the samplers were placed, on the floor, ~ 15 cm either side of a "target" area of the wall. The plume of spray could be clearly seen enveloping the samplers.
In the second experiment, the paint was emptied out and then the can was rinsed with thinners and the rinsings discarded. The gun was then re-filled with thinners and sprayed against the wall as in experiment 1. The "standard" gun was used for this experiment. The gun was sprayed at the wall for 3 minutes with a sampling time of ~25 minutes. Spraying was at a height of ~ 1m and the samplers were placed, on the floor, ~ 15 cm either side of a "target" area of the wall. The results of this work are given in section 3.9, table 5.
2.9 OTHER WORK
Other work was undertaken during this project on brush and roller application of paints and sanding and NCO emissions during baking of NCO painted car parts. This work has already been reported (HSL, 2005a; HSL, 2005b). Video and still photography was carried out during the project and this and other material was used to support the HSE ‘Motor Vehicle Repair Bodyshops Safety and Health Awareness Days (SHADs)’. The results of the work presented in this report will be used by HSE to update the NCO guidance sheets on NCO use (MR01 - isocyanate from mixing 2-pack paint etc., MR02 – spraying 2-pack products in a spray/bake booth, MR03 – isocyanate from cleaning 2-pack paint
28
spray guns, MR04 – isocyanate from brush and roller application of 2-pack products, see - HSE (2005b).
2.10 SAFETY AND HEALTH CONSIDERATIONS
This project was subject to stringent scrutiny before approval. Spraying tests on the spray room (flammability tests) were carried out to verify that the airborne solvent levels were below the required lower explosion limit (LEL). Measurements showed that the only explosion hazard came from the material as it was sprayed from the gun and that airborne solvent levels throughout the rest of the booth were below the required LEL. Material used in construction and the premises used for the tests was compliant with HSL's fire safety policies. The automated spraying system was used to provide reproducible tests and to minimise worker exposure to NCO. The project proposal was vetted by HSE's ethics committee and COSHH and environmental evaluations were carried out during the planning stage. Biological monitoring of workers using NCO was carried out as appropriate.
29
3.1
3 RESULTS AND DISCUSSION
The results of the experimental work described above are given below.
MEASUREMENT OF VOLUME FLOW-RATE AND AIR-CHANGE RATE IN AN INDUSTRIAL SPRAY ROOM
The velocity measurements made at the plane of the skirt where averaged (2.9 ms-1) and multiplied by the area of the square opening (0.348 m) to give a volume flow-rate of approximately 3600 m3h-1, equivalent to 70 air changes per hour (ach). The pressure drop across the room with the extract fan on was measured to be 1.5 Pa using a micro-manometer (s/n 0851696).
From the log-linear plot of the tracer decay (with the mixing fan on) the air change rate was calculated to be 46 ach. This was significantly different from the measured value based on air velocity measurement and therefore the reason for this discrepancy was investigated. From airflow visualisation tests using a smoke machine, it was found that a significant amount of extracted air was re-entering the room almost immediately via gaps around the fan. This occurred because the outside cowl effectively directed the discharge air back against the wall of the building. The gaps were sealed and the tracer gas test repeated. The air change rate was then measured to be 53 ach (2720m3h-1), an increase in the air change rate of approximately 15%, but still only 75% of the measurement based on air velocities. Possible explanations for the discrepancy include:
1. Re-entering of air back into the building and thus back into the spray room giving a reduced air change rate.
2. Incomplete mixing of the air in the spray room resulting in some short-circuiting occurring. Where short-circuiting is defined as inlet air that is extracted from the room before mixing with the main body of room air.
Both these scenarios are possible as smoke tests showed that the discharged air moved up the side of the building where it was possible to re-enter at roof height. However, incomplete mixing was the most likely scenario as there was a large 0.08 m by 2.2 m gap in the adjacent wall where air entered the room and blew across the face of the fan, effectively short circuiting the main body of air in the room. In addition there were a number of openings above the fan that blew down the wall across the face of the fan. These drafts were sufficiently strong enough to overcome the air movement created by the office style fan used to mix the air in the room.
Therefore, whilst the extract fan removed 3600m3h-1 of air from the room, the effective ventilation rate was 2720 m3h-1.
30
3.2 TRACER GAS TESTS ON A REAL SPRAY ROOM
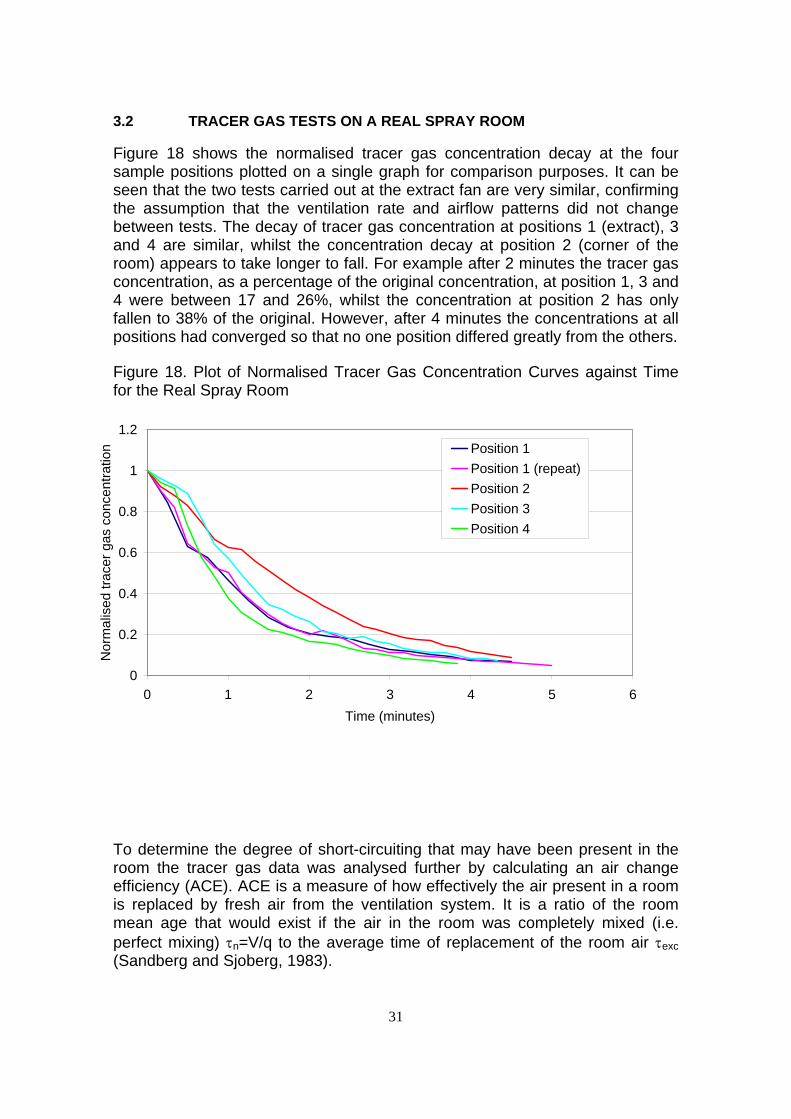
Figure 18 shows the normalised tracer gas concentration decay at the four sample positions plotted on a single graph for comparison purposes. It can be seen that the two tests carried out at the extract fan are very similar, confirming the assumption that the ventilation rate and airflow patterns did not change between tests. The decay of tracer gas concentration at positions 1 (extract), 3 and 4 are similar, whilst the concentration decay at position 2 (corner of the room) appears to take longer to fall. For example after 2 minutes the tracer gas concentration, as a percentage of the original concentration, at position 1, 3 and 4 were between 17 and 26%, whilst the concentration at position 2 has only fallen to 38% of the original. However, after 4 minutes the concentrations at all positions had converged so that no one position differed greatly from the others.
Figure 18. Plot of Normalised Tracer Gas Concentration Curves against Time for the Real Spray Room
0
1
Nor
mal
ised
trac
er g
as c
once
ntra
tion
0.2
0.4
0.6
0.8
1.2 Position 1 Position 1 (repeat) Position 2 Position 3 Position 4
0 1 2 3 4 5 6 Time (minutes)
To determine the degree of short-circuiting that may have been present in the room the tracer gas data was analysed further by calculating an air change efficiency (ACE). ACE is a measure of how effectively the air present in a room is replaced by fresh air from the ventilation system. It is a ratio of the room mean age that would exist if the air in the room was completely mixed (i.e. perfect mixing) τn=V/q to the average time of replacement of the room air τexc (Sandberg and Sjoberg, 1983).
31
τ nACE = x100 (2)2 τ exc
Where:
∞
. ( ).dt t C t ∫ e
τ = 0 (3)exc ∞
( ).dt t C ∫ e 0
and Ce(t) is the concentration in the exhaust. An ACE value of 100% indicates piston flow (or plug flow), whilst a value of 50% indicates fully mixed conditions. The room mean age is calculated from the recorded tracer gas concentrations measured in the exhaust with the mixing fan off during the test. A value less that 50% indicates short-circuiting.
From the data, τn is equal to (51.3/3600) x 60 = 0.85 minutes. From the tracer gas taken in the exhaust τexc can be calculated. This was carried out by applying Simpsons rule to approximate the integrals. It is normal practice to stop the test before the concentration falls to zero to minimise calibration errors. As the decay will be exponential the missing data or the ‘tail’ area is calculated from the gradient of a log-linear plot. The calculations gave a value of τexc of 1.81 minutes for the first measurement in the exhaust and 1.85 minutes for the repeat test. Assuming an average of 1.83 minutes, the ACE equals 23%. This is significantly below 50% and implies there is short-circuiting of the airflow.
3.3 TRACER GAS TESTS USING THE HSL SPRAY ROOM – CONFIGURATION 1
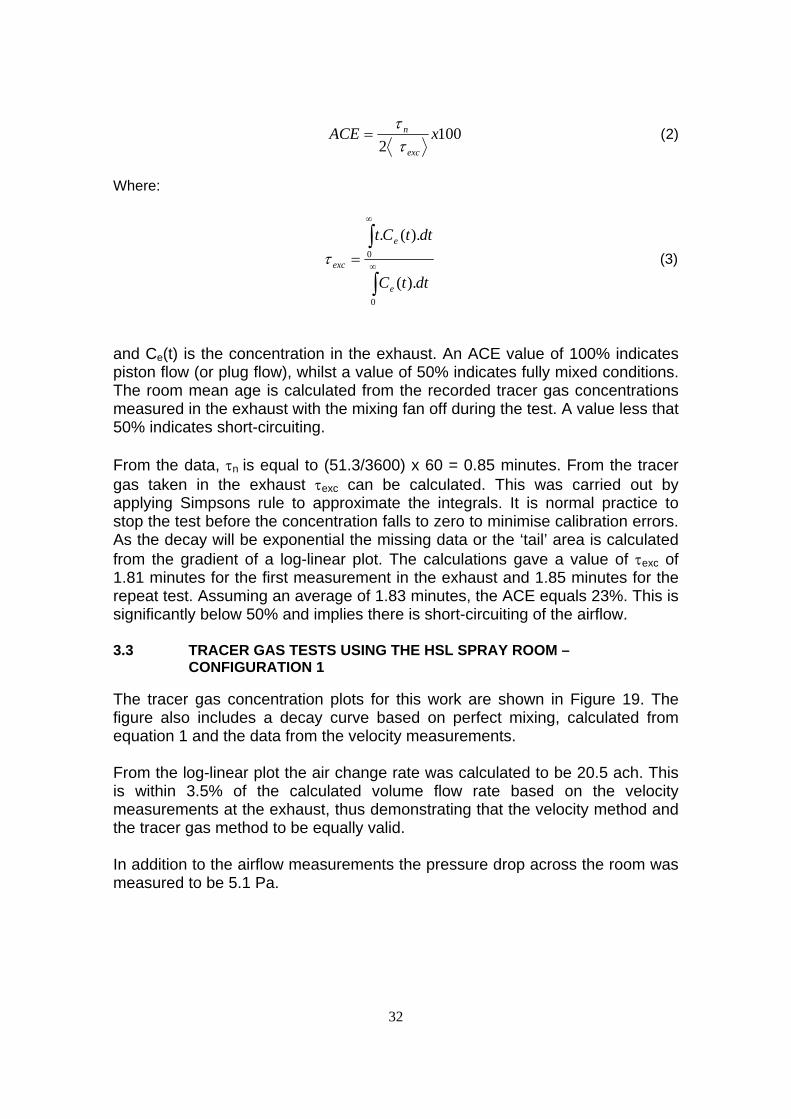
The tracer gas concentration plots for this work are shown in Figure 19. The figure also includes a decay curve based on perfect mixing, calculated from equation 1 and the data from the velocity measurements.
From the log-linear plot the air change rate was calculated to be 20.5 ach. This is within 3.5% of the calculated volume flow rate based on the velocity measurements at the exhaust, thus demonstrating that the velocity method and the tracer gas method to be equally valid.
In addition to the airflow measurements the pressure drop across the room was measured to be 5.1 Pa.
32
3.4
Figure 19. Plot of Normalised Tracer Gas Concentration Curves against Time for the HSL Spray Room – Configuration 1
0
0.2
0.4
0.6
0.8
1
1.2
ing
Nor
mal
ised
trac
er g
as c
once
ntra
tion Position 1
Position 2 Position 3 Position 4 Perfect mix
0 1 2 3 4 5 6 7 8 Time (minutes)
It can be seen that the tracer gas concentration curves fall exponentially at approximately the same rate as the perfect mixing curve, regardless of sample position. To quantify how good the mixing was the data was analysed further by calculating the air change efficiency (ACE).
From the data, τn is equal to (66/1400) x 60 = 2.83 minutes. From the tracer gas taken in the exhaust τexc can be calculated. This was again carried out by applying Simpsons rule to approximate the integrals and by the addition of the ‘tail’ area. This gave a value of τexc of 3.08 minutes. Therefore, ACE= 45%. This is close to 50% and therefore indicates near perfect mixing
TRACER GAS TESTS MADE IN THE HSL SPRAY ROOM – CONFIGURATION 2
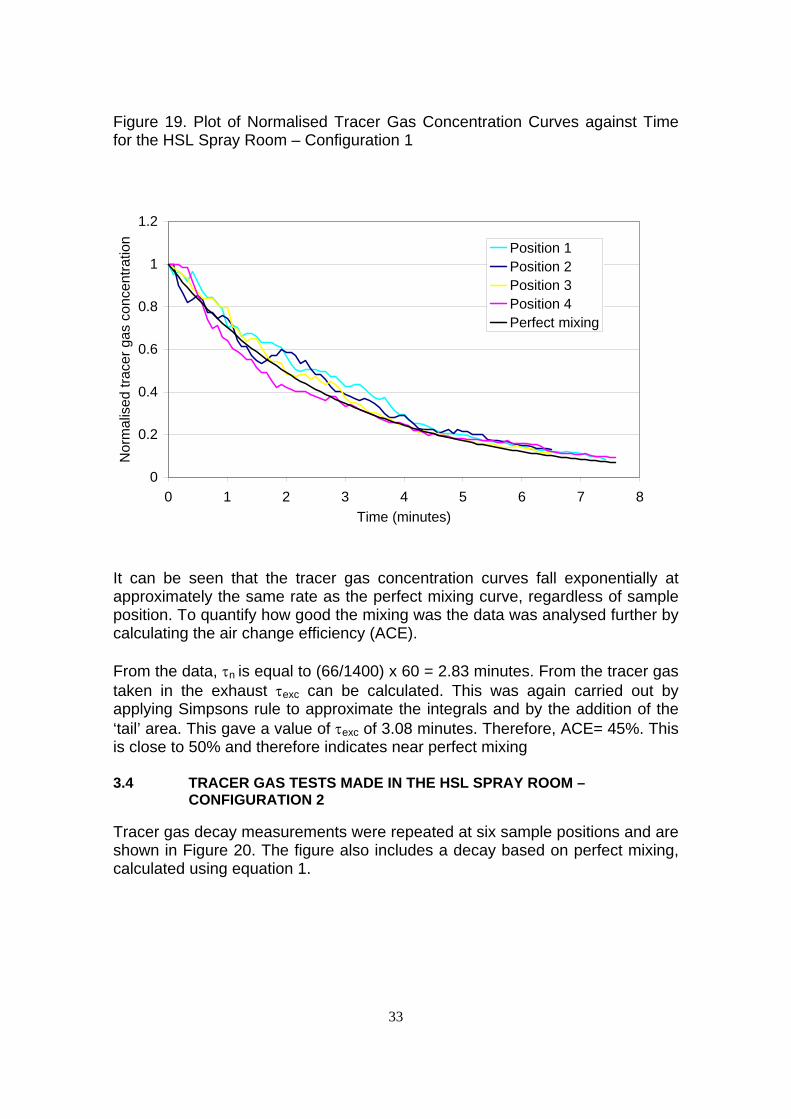
Tracer gas decay measurements were repeated at six sample positions and are shown in Figure 20. The figure also includes a decay based on perfect mixing, calculated using equation 1.
33
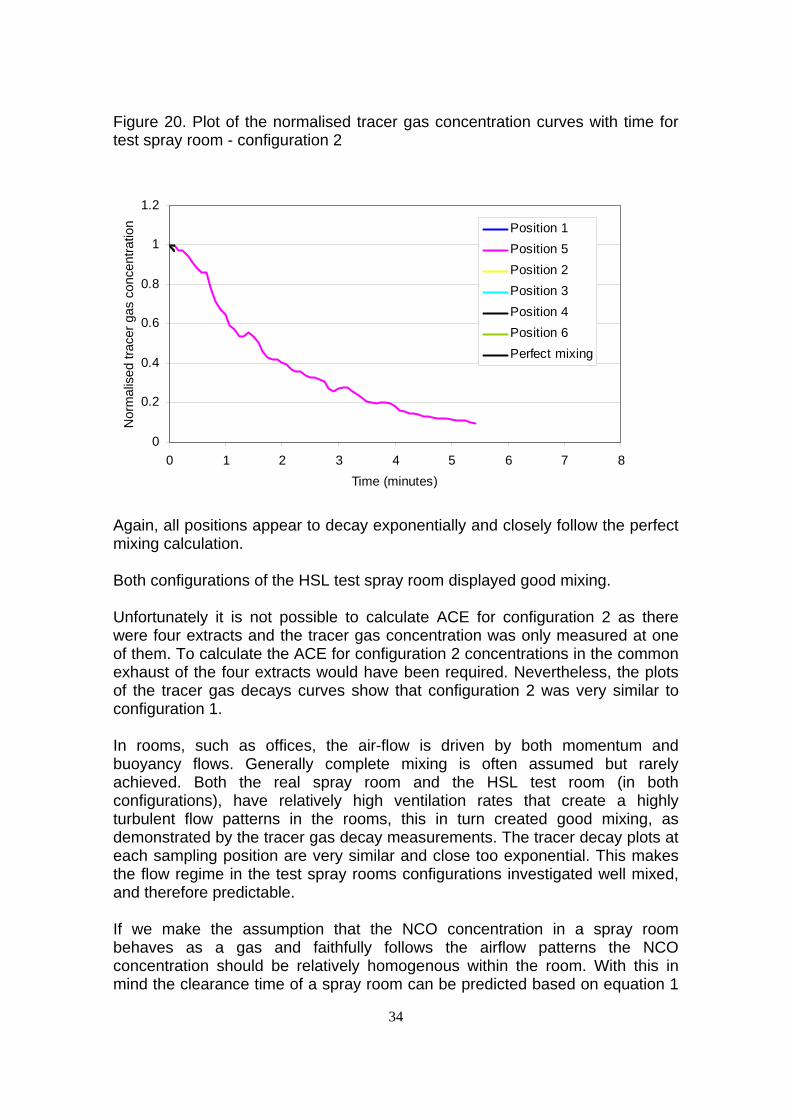
Figure 20. Plot of the normalised tracer gas concentration curves with time for test spray room - configuration 2
Nor
mal
ised
trac
er g
as c
once
ntra
tion
1.2
1
0.8
0.6
0.4
0.2
0
Position 1 Position 5 Position 2 Position 3 Position 4 Position 6 Perfect mixing
0 1 2 3 4 5 6 7 8 Time (minutes)
Again, all positions appear to decay exponentially and closely follow the perfect mixing calculation.
Both configurations of the HSL test spray room displayed good mixing.
Unfortunately it is not possible to calculate ACE for configuration 2 as there were four extracts and the tracer gas concentration was only measured at one of them. To calculate the ACE for configuration 2 concentrations in the common exhaust of the four extracts would have been required. Nevertheless, the plots of the tracer gas decays curves show that configuration 2 was very similar to configuration 1.
In rooms, such as offices, the air-flow is driven by both momentum and buoyancy flows. Generally complete mixing is often assumed but rarely achieved. Both the real spray room and the HSL test room (in both configurations), have relatively high ventilation rates that create a highly turbulent flow patterns in the rooms, this in turn created good mixing, as demonstrated by the tracer gas decay measurements. The tracer decay plots at each sampling position are very similar and close too exponential. This makes the flow regime in the test spray rooms configurations investigated well mixed, and therefore predictable.
If we make the assumption that the NCO concentration in a spray room behaves as a gas and faithfully follows the airflow patterns the NCO concentration should be relatively homogenous within the room. With this in mind the clearance time of a spray room can be predicted based on equation 1
34
and the air change rate. For example, for configuration 2 (23.5 ach) the original concentration in the room (after spraying ceases) will have fallen to:
10% after approximately 6 minutes 5% after approximately 7.5 minutes 2% after approximately 10 minutes 1% after approximately 12 minutes
It should be noted that this theoretical calculation follows an exponential decay and so will never reach zero. The clearance times (defined as the time to no detectable airborne isocyanate) given in section 3.6 and 3.7 are based on experimental measurements of airborne isocyanates using the method MDHS 25/3, a paper tape reader and a photo-ionization detector (PID) and so give slightly different results (MDHS 25/3 ~ 30 minutes, paper tape ~ 15 minutes, PID ~ 10 minutes). For the typical airborne NCO concentrations found in the spray room during spraying (e.g. ~ 100 µg NCO/m3 over a 60 minute sampling time which corresponds to 6 µg NCO/sample) 1% remaining would give a sample concentration about ~0.06 µg NCO/ml which is above the estimated limit of detection for MDHS 25/3 (~ 0.01 mg NCO/ml).
This situation is not the same for spray booths, where the air change rate is not directly related to the clearance time of the booth and therefore the use of air-change rates in booths is misleading.
Analysis of the ventilation measurements made at the real spray room indicated that the tracer decay at the measuring points fell at similar rates and that after a few minutes the concentration at all of the sample points was very similar. However, smoke tests showed that exhausted air was re-entering the room via gaps around the fan.
Further analysis of the tracer gas data revealed that there was short-circuiting of the inlet air. This is where inlet air enters the room but is extracted before it mixes with the main body of room air. This situation was likely created by a number of gaps in the wall and ceiling close to the fan. The openings were positioned such that the inlet air would blow directly down and across the wall towards the fan.
This situation highlights the necessity for best practice guidance on how to design and maintain spray rooms.
35
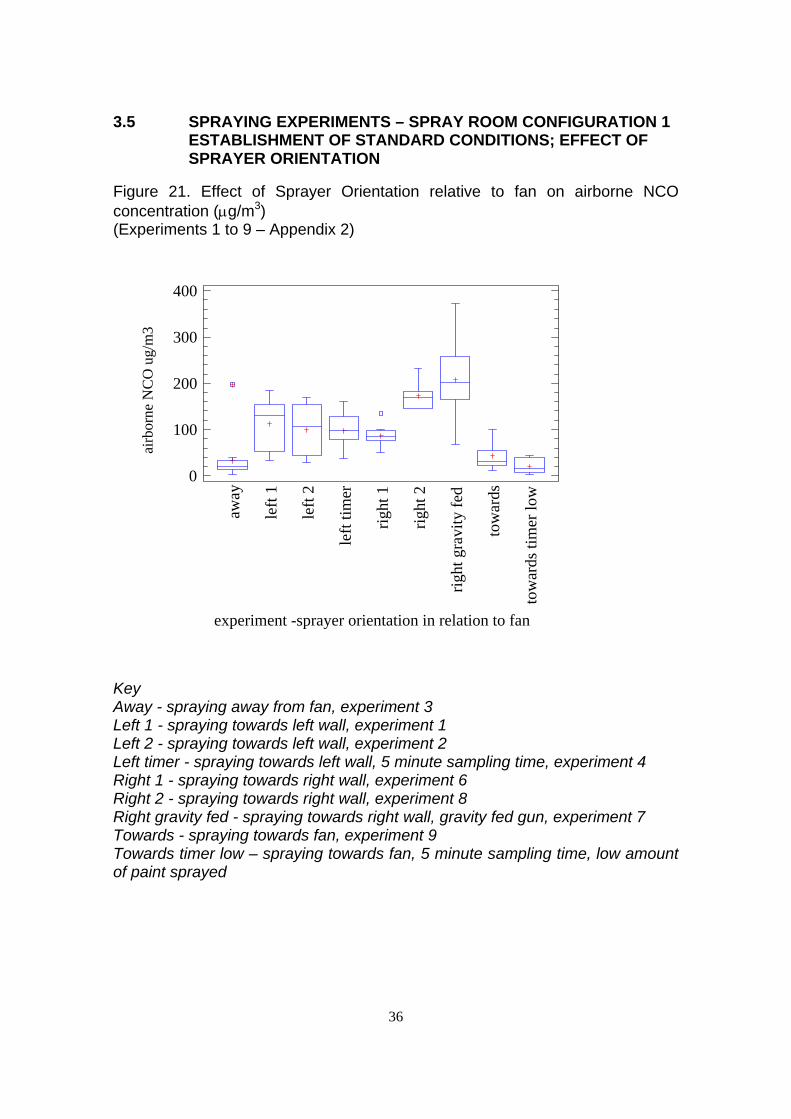
3.5 SPRAYING EXPERIMENTS – SPRAY ROOM CONFIGURATION 1 ESTABLISHMENT OF STANDARD CONDITIONS; EFFECT OF SPRAYER ORIENTATION
Figure 21. Effect of Sprayer Orientation relative to fan on airborne NCO concentration (µg/m3) (Experiments 1 to 9 – Appendix 2)
airb
orne
NC
O u
g/m
3
0
100
200
300
400
away
left
1
left
2
left
timer
right
1
right
2
right
gra
vity
fed
tow
ards
tow
ards
tim
er lo
w
experiment -sprayer orientation in relation to fan
Key Away - spraying away from fan, experiment 3 Left 1 - spraying towards left wall, experiment 1 Left 2 - spraying towards left wall, experiment 2 Left timer - spraying towards left wall, 5 minute sampling time, experiment 4 Right 1 - spraying towards right wall, experiment 6 Right 2 - spraying towards right wall, experiment 8 Right gravity fed - spraying towards right wall, gravity fed gun, experiment 7 Towards - spraying towards fan, experiment 9 Towards timer low – spraying towards fan, 5 minute sampling time, low amount of paint sprayed
36
Notes
Ends of the whiskers are the highest and lowest results for a data set exceptany outliers. The box covers the upper and lower quartiles i.e. 50% of the data is inside the box. The line crossing the box is the median of the data. The cross inside the box is the arithmetic mean of the data. Airborne NCO concentration is µg NCO/m3. STEL 70 µg NCO/m3
Boxes outside the whiskers are samples that have been designated as outliers. Outliers (square) are >1.5x the interquartile mean. Far outliers (crossed square) are >3x the interquartile mean.
37
spra
yer o
rient
atio
n re
lativ
e to
fan
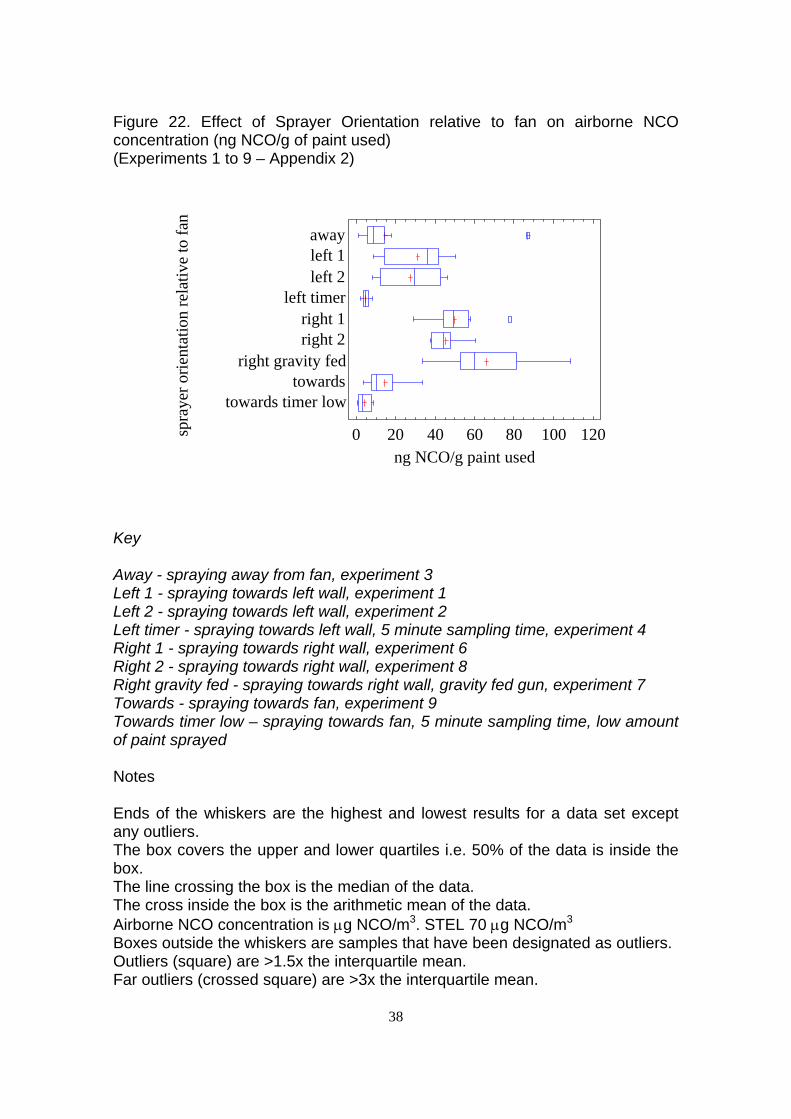
Figure 22. Effect of Sprayer Orientation relative to fan on airborne NCO concentration (ng NCO/g of paint used) (Experiments 1 to 9 – Appendix 2)
awayleft 1left 2
left timerright 1right 2
right gravity fedtowards
towards timer low
0 20 40 60 80 100 120 ng NCO/g paint used
Key
Away - spraying away from fan, experiment 3 Left 1 - spraying towards left wall, experiment 1 Left 2 - spraying towards left wall, experiment 2 Left timer - spraying towards left wall, 5 minute sampling time, experiment 4 Right 1 - spraying towards right wall, experiment 6 Right 2 - spraying towards right wall, experiment 8 Right gravity fed - spraying towards right wall, gravity fed gun, experiment 7 Towards - spraying towards fan, experiment 9 Towards timer low – spraying towards fan, 5 minute sampling time, low amount of paint sprayed
Notes
Ends of the whiskers are the highest and lowest results for a data set exceptany outliers. The box covers the upper and lower quartiles i.e. 50% of the data is inside the box. The line crossing the box is the median of the data. The cross inside the box is the arithmetic mean of the data. Airborne NCO concentration is µg NCO/m3. STEL 70 µg NCO/m3
Boxes outside the whiskers are samples that have been designated as outliers. Outliers (square) are >1.5x the interquartile mean. Far outliers (crossed square) are >3x the interquartile mean.
38
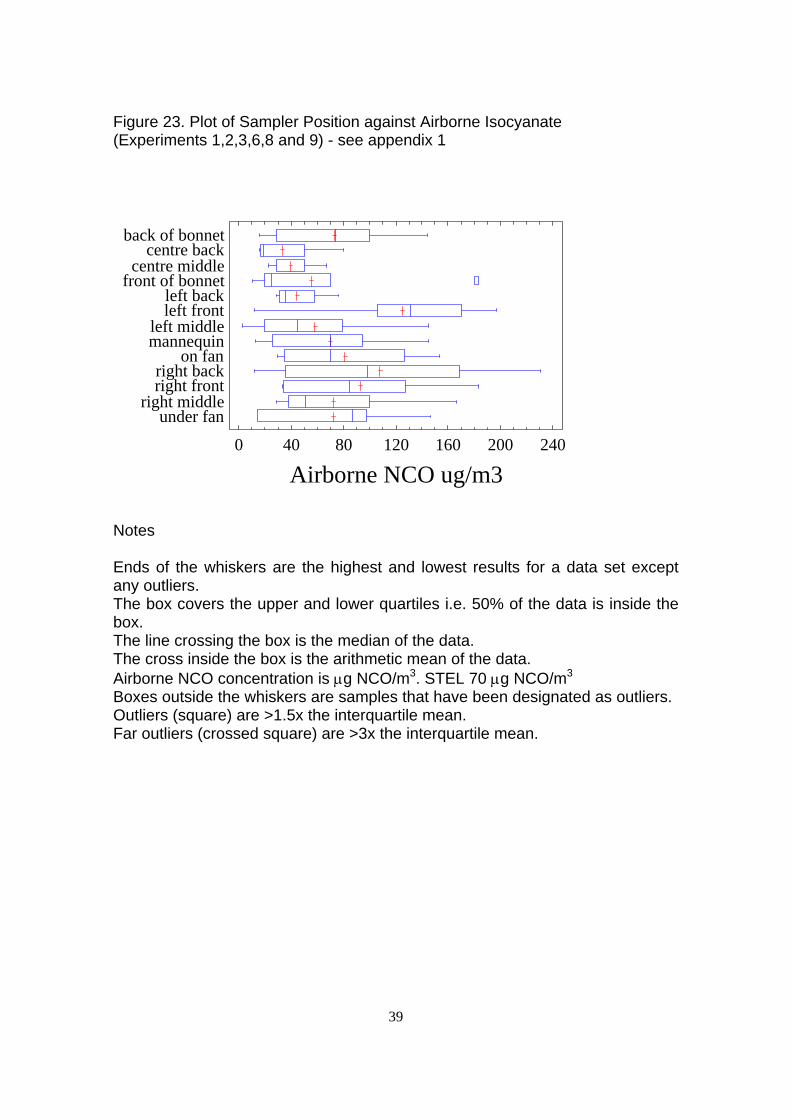
Figure 23. Plot of Sampler Position against Airborne Isocyanate
Airborne NCO ug/m3
back of bonnet centre back
centre middle front of bonnet
left back left front
left middle mannequin
on fan right backright front
right middleunder fan
0 40 80 120 160 200 240
(Experiments 1,2,3,6,8 and 9) - see appendix 1
Notes
Ends of the whiskers are the highest and lowest results for a data set exceptany outliers. The box covers the upper and lower quartiles i.e. 50% of the data is inside the box. The line crossing the box is the median of the data. The cross inside the box is the arithmetic mean of the data. Airborne NCO concentration is µg NCO/m3. STEL 70 µg NCO/m3
Boxes outside the whiskers are samples that have been designated as outliers. Outliers (square) are >1.5x the interquartile mean. Far outliers (crossed square) are >3x the interquartile mean.
39
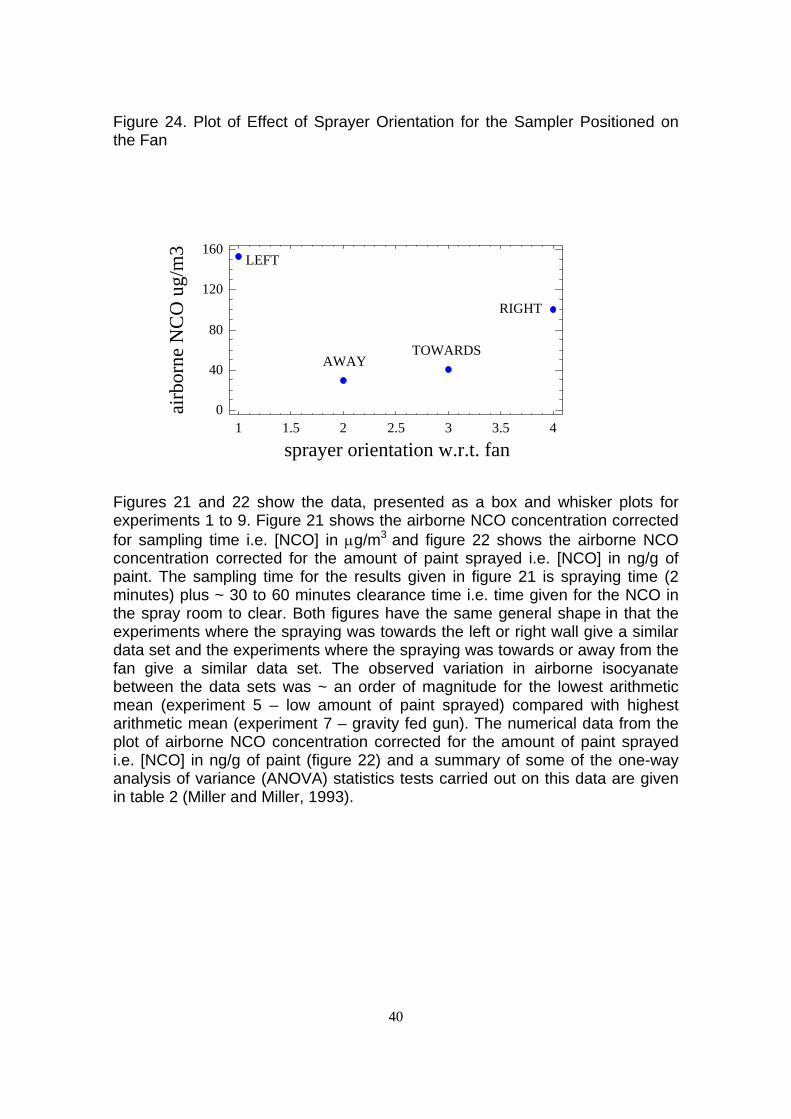
Figure 24. Plot of Effect of Sprayer Orientation for the Sampler Positioned on the Fan
airb
orne
NC
O u
g/m
3 160
120
80
40
0
LEFT
AWAY TOWARDS
RIGHT
1 1.5 2 2.5 3 3.5 4
sprayer orientation w.r.t. fan
Figures 21 and 22 show the data, presented as a box and whisker plots for experiments 1 to 9. Figure 21 shows the airborne NCO concentration corrected for sampling time i.e. [NCO] in µg/m3 and figure 22 shows the airborne NCO concentration corrected for the amount of paint sprayed i.e. [NCO] in ng/g of paint. The sampling time for the results given in figure 21 is spraying time (2 minutes) plus ~ 30 to 60 minutes clearance time i.e. time given for the NCO in the spray room to clear. Both figures have the same general shape in that the experiments where the spraying was towards the left or right wall give a similar data set and the experiments where the spraying was towards or away from the fan give a similar data set. The observed variation in airborne isocyanate between the data sets was ~ an order of magnitude for the lowest arithmetic mean (experiment 5 – low amount of paint sprayed) compared with highest arithmetic mean (experiment 7 – gravity fed gun). The numerical data from the plot of airborne NCO concentration corrected for the amount of paint sprayed i.e. [NCO] in ng/g of paint (figure 22) and a summary of some of the one-way analysis of variance (ANOVA) statistics tests carried out on this data are given in table 2 (Miller and Miller, 1993).
40
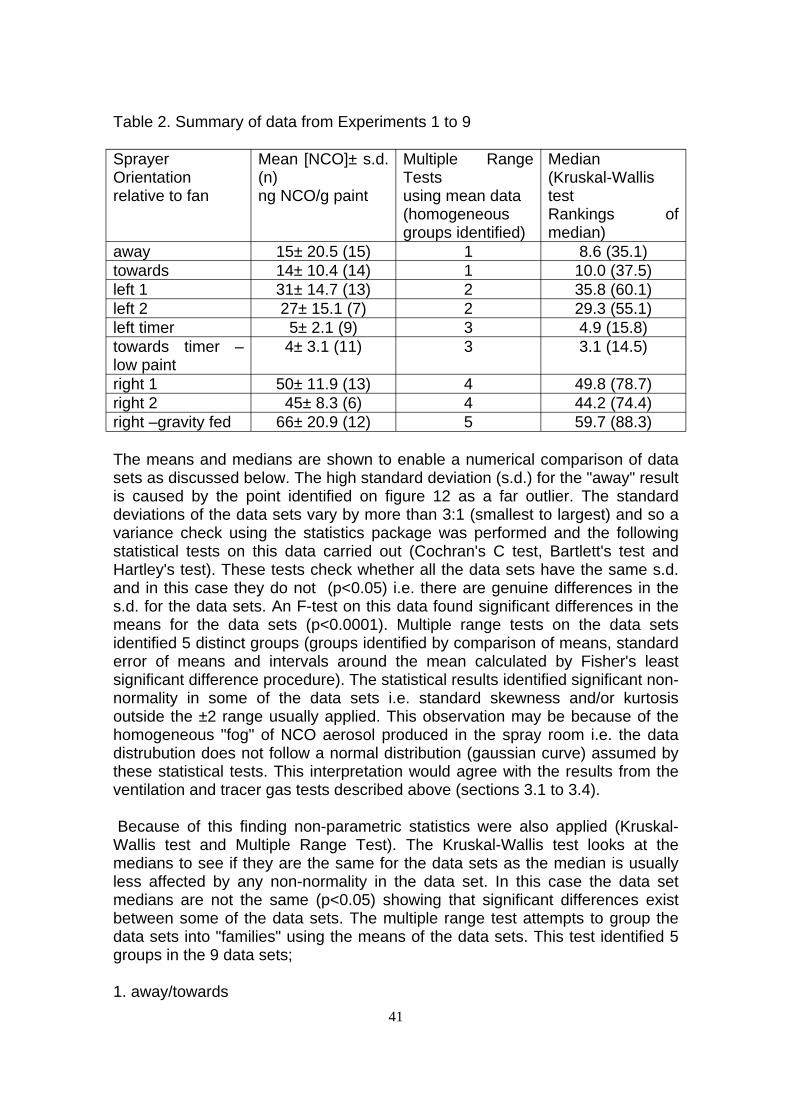
Table 2. Summary of data from Experiments 1 to 9
Sprayer Mean [NCO]± s.d. Multiple Range Median Orientation (n) Tests (Kruskal-Wallis relative to fan ng NCO/g paint using mean data test
(homogeneous Rankings of groups identified) median)
away 15± 20.5 (15) 1 8.6 (35.1) towards 14± 10.4 (14) 1 10.0 (37.5) left 1 31± 14.7 (13) 2 35.8 (60.1) left 2 27± 15.1 (7) 2 29.3 (55.1) left timer 5± 2.1 (9) 3 4.9 (15.8) towards timer – 4± 3.1 (11) 3 3.1 (14.5) low paint right 1 50± 11.9 (13) 4 49.8 (78.7) right 2 45± 8.3 (6) 4 44.2 (74.4) right –gravity fed 66± 20.9 (12) 5 59.7 (88.3)
The means and medians are shown to enable a numerical comparison of data sets as discussed below. The high standard deviation (s.d.) for the "away" result is caused by the point identified on figure 12 as a far outlier. The standard deviations of the data sets vary by more than 3:1 (smallest to largest) and so a variance check using the statistics package was performed and the following statistical tests on this data carried out (Cochran's C test, Bartlett's test and Hartley's test). These tests check whether all the data sets have the same s.d. and in this case they do not (p<0.05) i.e. there are genuine differences in the s.d. for the data sets. An F-test on this data found significant differences in the means for the data sets (p<0.0001). Multiple range tests on the data sets identified 5 distinct groups (groups identified by comparison of means, standard error of means and intervals around the mean calculated by Fisher's least significant difference procedure). The statistical results identified significant non-normality in some of the data sets i.e. standard skewness and/or kurtosis outside the ±2 range usually applied. This observation may be because of the homogeneous "fog" of NCO aerosol produced in the spray room i.e. the data distrubution does not follow a normal distribution (gaussian curve) assumed by these statistical tests. This interpretation would agree with the results from the ventilation and tracer gas tests described above (sections 3.1 to 3.4).
Because of this finding non-parametric statistics were also applied (Kruskal-Wallis test and Multiple Range Test). The Kruskal-Wallis test looks at the medians to see if they are the same for the data sets as the median is usually less affected by any non-normality in the data set. In this case the data set medians are not the same (p<0.05) showing that significant differences exist between some of the data sets. The multiple range test attempts to group the data sets into "families" using the means of the data sets. This test identified 5 groups in the 9 data sets;
1. away/towards 41
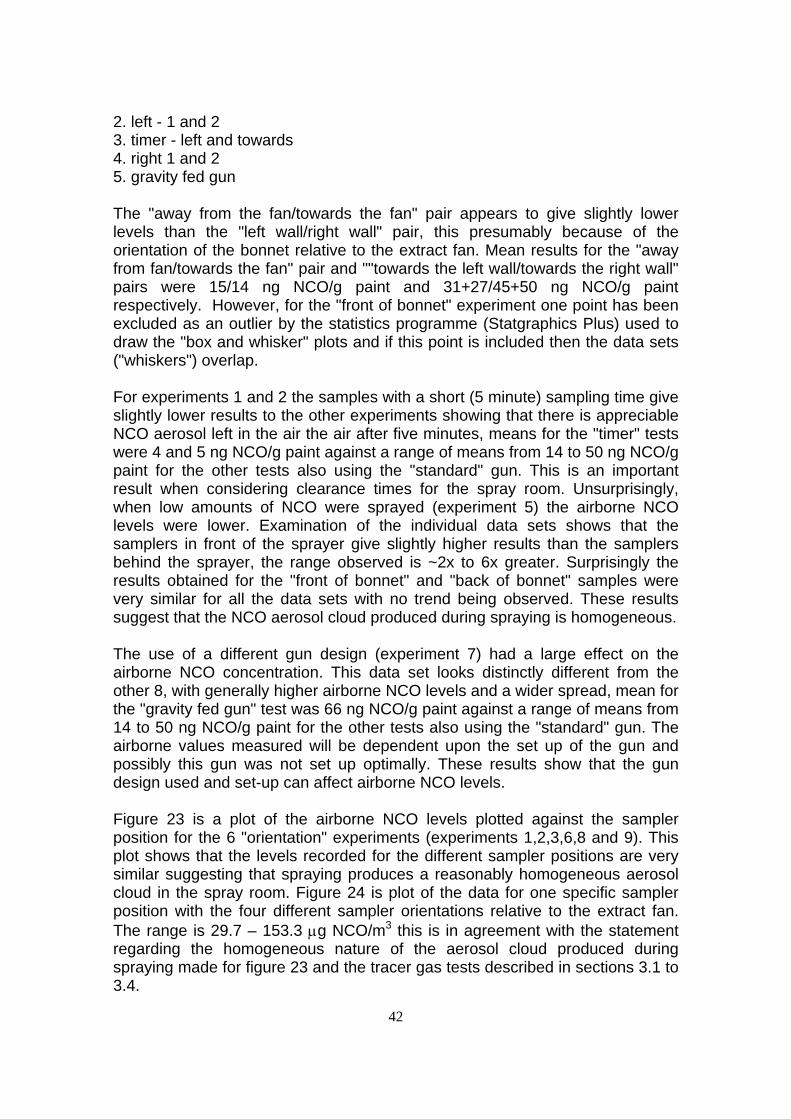
2. left - 1 and 2 3. timer - left and towards 4. right 1 and 2 5. gravity fed gun
The "away from the fan/towards the fan" pair appears to give slightly lower levels than the "left wall/right wall" pair, this presumably because of the orientation of the bonnet relative to the extract fan. Mean results for the "away from fan/towards the fan" pair and ""towards the left wall/towards the right wall" pairs were 15/14 ng NCO/g paint and 31+27/45+50 ng NCO/g paint respectively. However, for the "front of bonnet" experiment one point has been excluded as an outlier by the statistics programme (Statgraphics Plus) used to draw the "box and whisker" plots and if this point is included then the data sets ("whiskers") overlap.
For experiments 1 and 2 the samples with a short (5 minute) sampling time give slightly lower results to the other experiments showing that there is appreciable NCO aerosol left in the air the air after five minutes, means for the "timer" tests were 4 and 5 ng NCO/g paint against a range of means from 14 to 50 ng NCO/g paint for the other tests also using the "standard" gun. This is an important result when considering clearance times for the spray room. Unsurprisingly, when low amounts of NCO were sprayed (experiment 5) the airborne NCO levels were lower. Examination of the individual data sets shows that the samplers in front of the sprayer give slightly higher results than the samplers behind the sprayer, the range observed is ~2x to 6x greater. Surprisingly the results obtained for the "front of bonnet" and "back of bonnet" samples were very similar for all the data sets with no trend being observed. These results suggest that the NCO aerosol cloud produced during spraying is homogeneous.
The use of a different gun design (experiment 7) had a large effect on the airborne NCO concentration. This data set looks distinctly different from the other 8, with generally higher airborne NCO levels and a wider spread, mean for the "gravity fed gun" test was 66 ng NCO/g paint against a range of means from 14 to 50 ng NCO/g paint for the other tests also using the "standard" gun. The airborne values measured will be dependent upon the set up of the gun and possibly this gun was not set up optimally. These results show that the gun design used and set-up can affect airborne NCO levels.
Figure 23 is a plot of the airborne NCO levels plotted against the sampler position for the 6 "orientation" experiments (experiments 1,2,3,6,8 and 9). This plot shows that the levels recorded for the different sampler positions are very similar suggesting that spraying produces a reasonably homogeneous aerosol cloud in the spray room. Figure 24 is plot of the data for one specific sampler position with the four different sampler orientations relative to the extract fan. The range is 29.7 – 153.3 µg NCO/m3 this is in agreement with the statement regarding the homogeneous nature of the aerosol cloud produced during spraying made for figure 23 and the tracer gas tests described in sections 3.1 to 3.4.
42
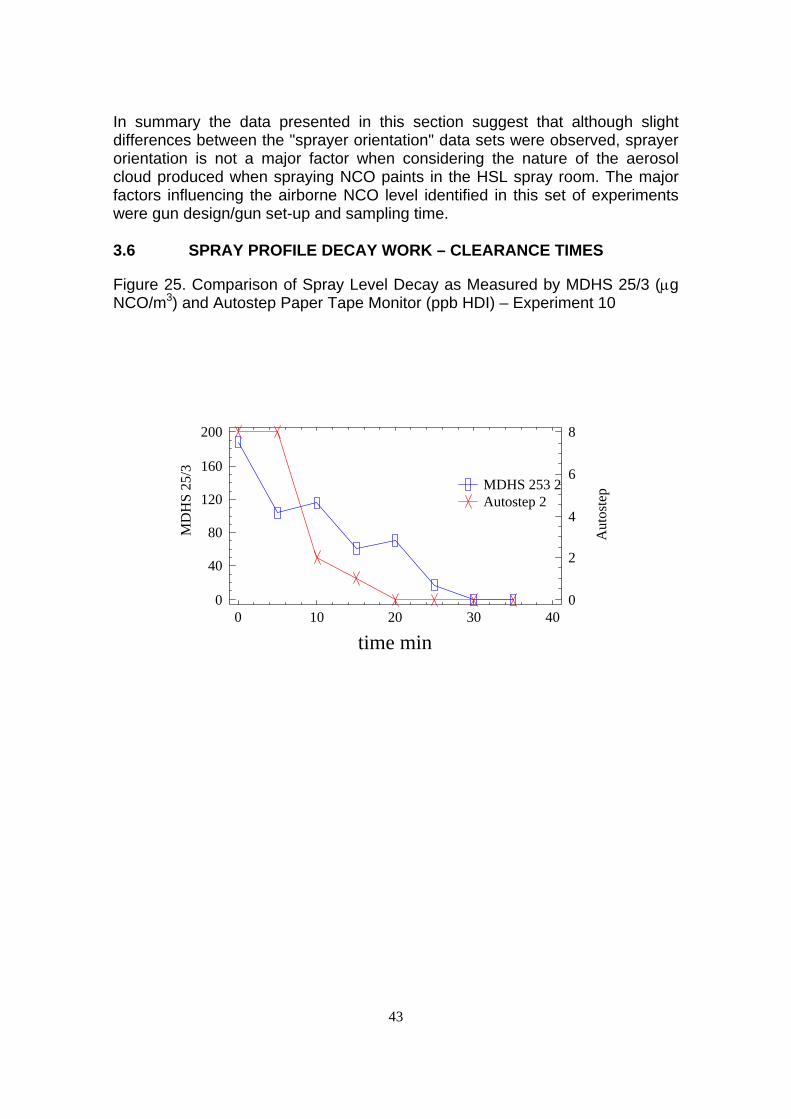
3.6
In summary the data presented in this section suggest that although slight differences between the "sprayer orientation" data sets were observed, sprayer orientation is not a major factor when considering the nature of the aerosol cloud produced when spraying NCO paints in the HSL spray room. The major factors influencing the airborne NCO level identified in this set of experiments were gun design/gun set-up and sampling time.
SPRAY PROFILE DECAY WORK – CLEARANCE TIMES
Figure 25. Comparison of Spray Level Decay as Measured by MDHS 25/3 (µg NCO/m3) and Autostep Paper Tape Monitor (ppb HDI) – Experiment 10
MDHS 253 2 Autostep 2
MD
HS
25/3
Aut
oste
p 0
0
40
80
120
160
200
0
2
4
6
8
10 20 30 40
time min
43
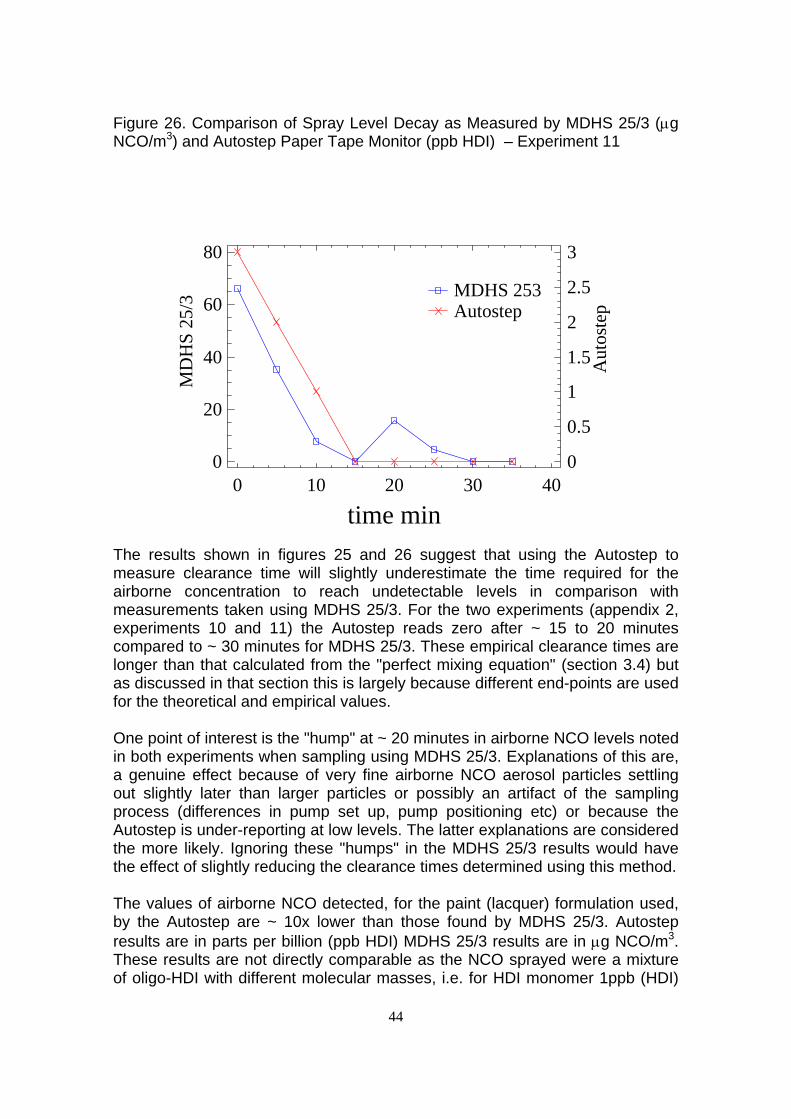
Figure 26. Comparison of Spray Level Decay as Measured by MDHS 25/3 (µg NCO/m3) and Autostep Paper Tape Monitor (ppb HDI) – Experiment 11
MDHS 253 Autostep
MD
HS
25/3
Aut
oste
p
0
20
40
60
80
0
0.5
1
1.5
2
2.5
3
0 10 20 30 40
time min The results shown in figures 25 and 26 suggest that using the Autostep to measure clearance time will slightly underestimate the time required for the airborne concentration to reach undetectable levels in comparison with measurements taken using MDHS 25/3. For the two experiments (appendix 2, experiments 10 and 11) the Autostep reads zero after ~ 15 to 20 minutes compared to ~ 30 minutes for MDHS 25/3. These empirical clearance times are longer than that calculated from the "perfect mixing equation" (section 3.4) but as discussed in that section this is largely because different end-points are used for the theoretical and empirical values.
One point of interest is the "hump" at ~ 20 minutes in airborne NCO levels noted in both experiments when sampling using MDHS 25/3. Explanations of this are, a genuine effect because of very fine airborne NCO aerosol particles settling out slightly later than larger particles or possibly an artifact of the sampling process (differences in pump set up, pump positioning etc) or because the Autostep is under-reporting at low levels. The latter explanations are considered the more likely. Ignoring these "humps" in the MDHS 25/3 results would have the effect of slightly reducing the clearance times determined using this method.
The values of airborne NCO detected, for the paint (lacquer) formulation used, by the Autostep are ~ 10x lower than those found by MDHS 25/3. Autostep results are in parts per billion (ppb HDI) MDHS 25/3 results are in µg NCO/m3. These results are not directly comparable as the NCO sprayed were a mixture of oligo-HDI with different molecular masses, i.e. for HDI monomer 1ppb (HDI)
44
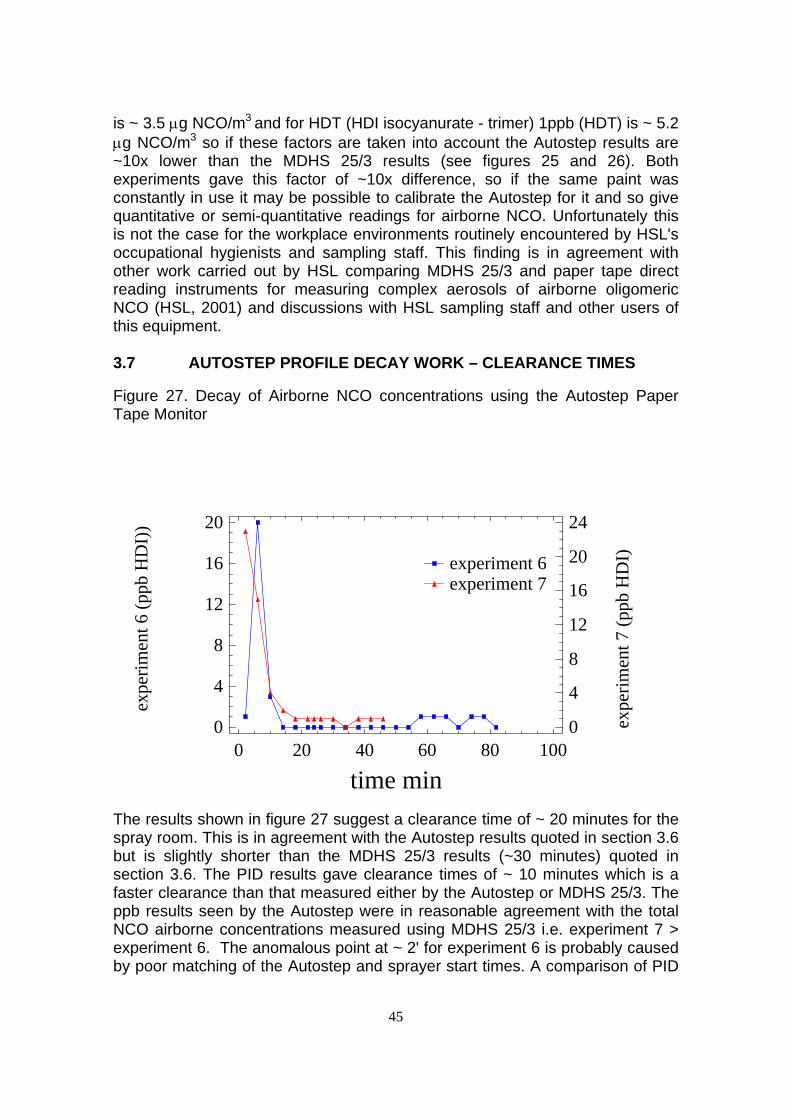
3.7
is ~ 3.5 µg NCO/m3 and for HDT (HDI isocyanurate - trimer) 1ppb (HDT) is ~ 5.2 µg NCO/m3 so if these factors are taken into account the Autostep results are ~10x lower than the MDHS 25/3 results (see figures 25 and 26). Both experiments gave this factor of ~10x difference, so if the same paint was constantly in use it may be possible to calibrate the Autostep for it and so give quantitative or semi-quantitative readings for airborne NCO. Unfortunately this is not the case for the workplace environments routinely encountered by HSL's occupational hygienists and sampling staff. This finding is in agreement with other work carried out by HSL comparing MDHS 25/3 and paper tape direct reading instruments for measuring complex aerosols of airborne oligomeric NCO (HSL, 2001) and discussions with HSL sampling staff and other users of this equipment.
AUTOSTEP PROFILE DECAY WORK – CLEARANCE TIMES
Figure 27. Decay of Airborne NCO concentrations using the Autostep Paper Tape Monitor
experiment 6 experiment 7
expe
rimen
t 6 (p
pb H
DI)
)
0
4
8
12
16
20
0
4
8
12
16
20
24
expe
rimen
t 7 (p
pb H
DI)
0 20 40 60 80 100
time min The results shown in figure 27 suggest a clearance time of ~ 20 minutes for the spray room. This is in agreement with the Autostep results quoted in section 3.6 but is slightly shorter than the MDHS 25/3 results (~30 minutes) quoted in section 3.6. The PID results gave clearance times of ~ 10 minutes which is a faster clearance than that measured either by the Autostep or MDHS 25/3. The ppb results seen by the Autostep were in reasonable agreement with the total NCO airborne concentrations measured using MDHS 25/3 i.e. experiment 7 > experiment 6. The anomalous point at ~ 2' for experiment 6 is probably caused by poor matching of the Autostep and sprayer start times. A comparison of PID
45
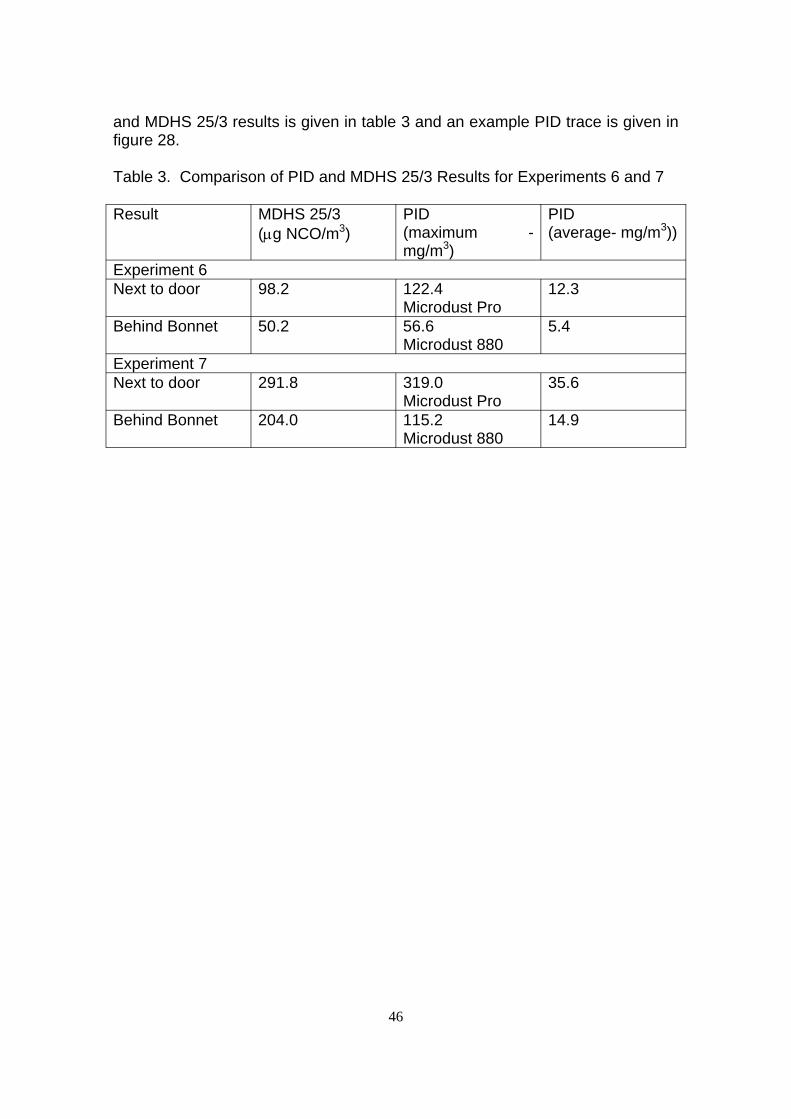
and MDHS 25/3 results is given in table 3 and an example PID trace is given in figure 28.
Table 3. Comparison of PID and MDHS 25/3 Results for Experiments 6 and 7
Result MDHS 25/3 (µg NCO/m3)
PID (maximum mg/m3)
-PID (average- mg/m3))
Experiment 6 Next to door 98.2 122.4 12.3
Microdust Pro Behind Bonnet 50.2 56.6
Microdust 880 5.4
Experiment 7 Next to door 291.8 319.0 35.6
Microdust Pro Behind Bonnet 204.0 115.2
Microdust 880 14.9
46
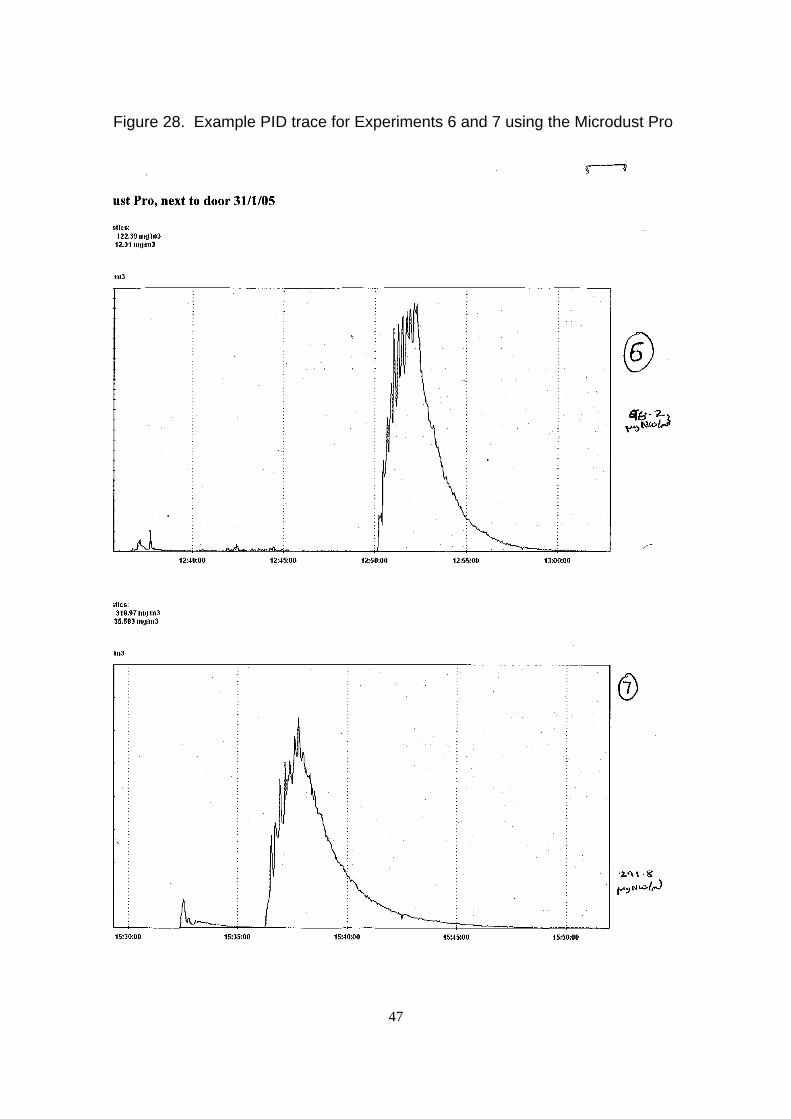
Figure 28. Example PID trace for Experiments 6 and 7 using the Microdust Pro
47
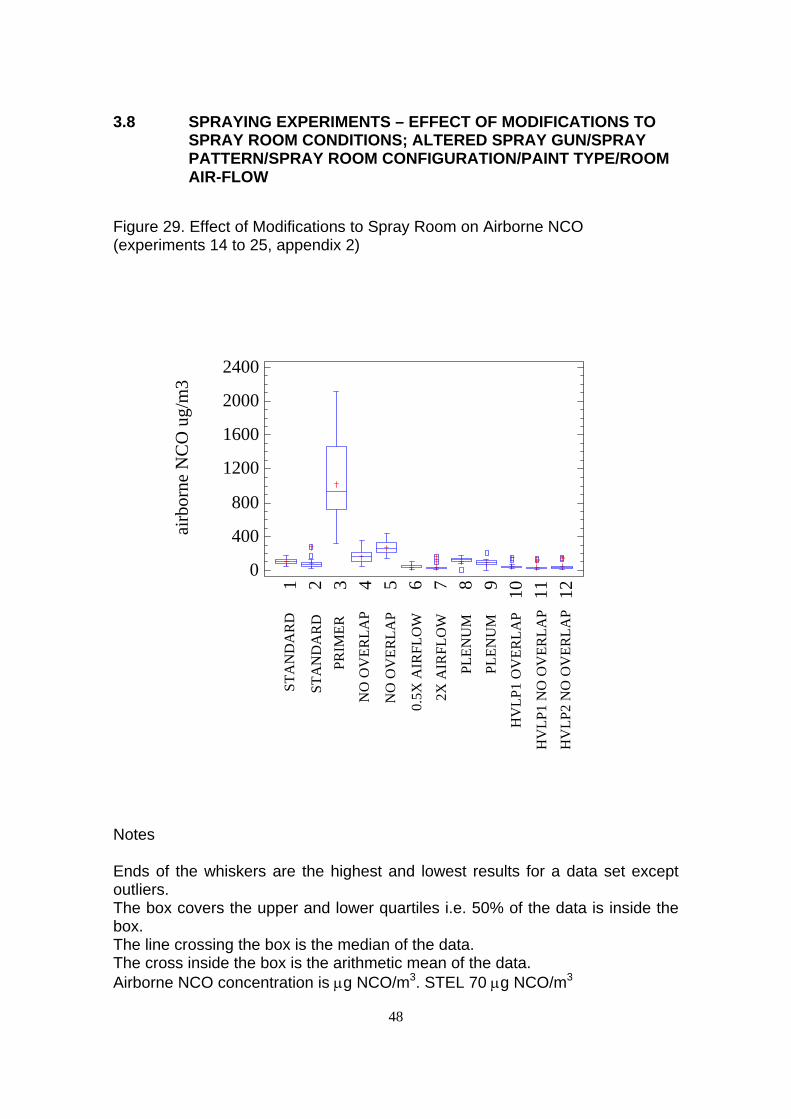
3.8 SPRAYING EXPERIMENTS – EFFECT OF MODIFICATIONS TO SPRAY ROOM CONDITIONS; ALTERED SPRAY GUN/SPRAY PATTERN/SPRAY ROOM CONFIGURATION/PAINT TYPE/ROOM AIR-FLOW
Figure 29. Effect of Modifications to Spray Room on Airborne NCO (experiments 14 to 25, appendix 2)
2400
airb
orne
NC
O u
g/m
3
2000
1600
1200
800
400
0
STA
ND
AR
D1
STA
ND
AR
D2
PRIM
ER3
NO
OV
ERLA
P 4
NO
OV
ERLA
P5
0.5X
AIR
FLO
W6
2X A
IRFL
OW
7PL
ENU
M8
PLEN
UM
9H
VLP
1 O
VER
LAP
10H
VLP
1 N
O O
VER
LAP
11H
VLP
2 N
O O
VER
LAP
12
Notes
Ends of the whiskers are the highest and lowest results for a data set exceptoutliers. The box covers the upper and lower quartiles i.e. 50% of the data is inside the box. The line crossing the box is the median of the data. The cross inside the box is the arithmetic mean of the data. Airborne NCO concentration is µg NCO/m3. STEL 70 µg NCO/m3
48
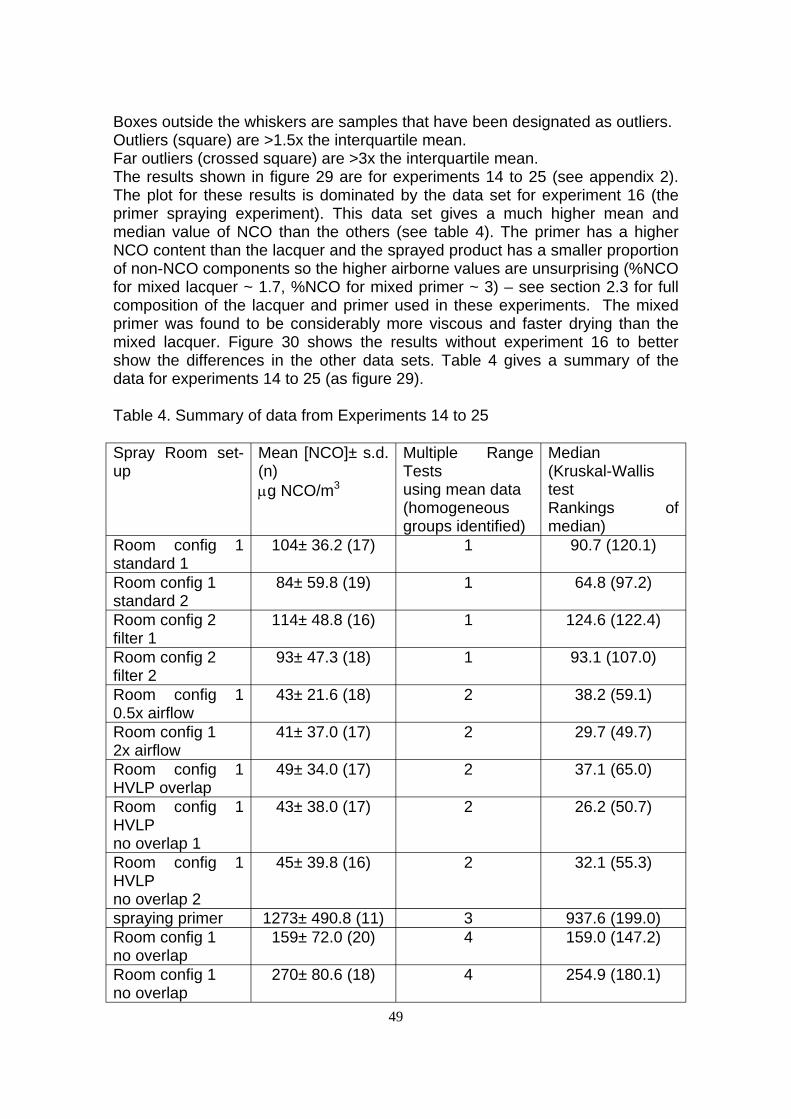
Boxes outside the whiskers are samples that have been designated as outliers. Outliers (square) are >1.5x the interquartile mean. Far outliers (crossed square) are >3x the interquartile mean. The results shown in figure 29 are for experiments 14 to 25 (see appendix 2). The plot for these results is dominated by the data set for experiment 16 (the primer spraying experiment). This data set gives a much higher mean and median value of NCO than the others (see table 4). The primer has a higher NCO content than the lacquer and the sprayed product has a smaller proportion of non-NCO components so the higher airborne values are unsurprising (%NCO for mixed lacquer ~ 1.7, %NCO for mixed primer ~ 3) – see section 2.3 for full composition of the lacquer and primer used in these experiments. The mixed primer was found to be considerably more viscous and faster drying than the mixed lacquer. Figure 30 shows the results without experiment 16 to better show the differences in the other data sets. Table 4 gives a summary of the data for experiments 14 to 25 (as figure 29).
Table 4. Summary of data from Experiments 14 to 25
Spray Room set- Mean [NCO]± s.d. Multiple Range Median up (n)
µg NCO/m3 Tests using mean data (homogeneous
(Kruskal-Wallis test Rankings of
groups identified) median) Room config 1 104± 36.2 (17) 1 90.7 (120.1) standard 1 Room config 1 standard 2
84± 59.8 (19) 1 64.8 (97.2)
Room config 2 filter 1
114± 48.8 (16) 1 124.6 (122.4)
Room config 2 filter 2
93± 47.3 (18) 1 93.1 (107.0)
Room config 1 0.5x airflow
43± 21.6 (18) 2 38.2 (59.1)
Room config 1 2x airflow
41± 37.0 (17) 2 29.7 (49.7)
Room config 1 HVLP overlap
49± 34.0 (17) 2 37.1 (65.0)
Room config 1 43± 38.0 (17) 2 26.2 (50.7) HVLP no overlap 1 Room config 1 45± 39.8 (16) 2 32.1 (55.3) HVLP no overlap 2 spraying primer 1273± 490.8 (11) 3 937.6 (199.0) Room config 1 159± 72.0 (20) 4 159.0 (147.2) no overlap Room config 1 270± 80.6 (18) 4 254.9 (180.1) no overlap
49
Table 4 shows the means and medians to enable a numerical comparison of data sets as discussed below. The standard deviations of the data sets vary by more than 3:1 (smallest to largest) and so a variance check using the statistics package was performed and the following statistical tests on this data carried out (Cochran's C test, Bartlett's test and Hartley's test). These tests check whether all the data sets have the same s.d. and in this case they do not (p<0.05) i.e. there are genuine differences in the s.d. for the data sets. An F-test on this data found significant differences in the means for the data sets (p<0.0001). Multiple range tests on the data sets identified 4 distinct groups (groups identified by comparison of means, standard error of means and intervals around the mean calculated by Fisher's least significant difference procedure). The statistical results identified significant non-normality in some of the data sets i.e. standard skewness and/or kurtosis outside the ±2 range usually applied. This observation may be because of the homogeneous "fog" of NCO aerosol produced in the spray room i.e. the data distribution does not follow a normal distribution (gaussian curve). This finding is in agreement with the ventilation and tracer gas tests described in section 3.1 and 3.4 that showed near perfect mixing for the HSL spray room.
Because of this finding non-parametric statistics were also applied (Kruskal-Wallis test and Multiple Range Test). The Kruskal-Walls test looks at the medians to see if they are the same for the data sets as the median is usually less affected by any non-normality in the data set. In this case the data set medians are not the same (p<0.05). All of these statistical tests show that there are significant differences between some of the data sets. The multiple range test attempts to group the data sets into "families" using the means of the data sets. This test identified 4 groups in the 9 data sets;
1. standard - room configuration 1/room configuration 2 2. HVLP experiments/air-flow experiments (configuration 1) 3. primer spraying experiment (configuration 1) 4. no-overlap (configuration 1)
From the results shown in figure 30 it can be seen that highest airborne NCO levels and largest variation within data sets were seen with "standard" gun when the sprayer did not overlap the bonnet (means 159 and 270 µg NCO/m3). This is presumably because the car bonnet is helping to push the NCO aerosol up into the roof of the spray room ("bounce back").
In experiments 19 and 20 the airflow through the room (configuration 1) was doubled from 1400 m3h-1 to 2800 m3h-1 and reducing the flow rate to 700 m3h
1as described in section 2.2. Examining the "box and whisker" plot suggests that the higher flow rate is reducing airborne NCO levels i.e. "2x airflow, mean 41 µg NCO/m3, standard experiments, means 104, 84 µg NCO/m3). The means of the two "airflow" experiments are very similar (0.5x air-flow, mean 43 µg NCO/m3 and 2x air-flow, mean 41µg NCO/m3) however the mean for the "2x airflow" experiment has been raised by the two far outliers identified on the "box
50
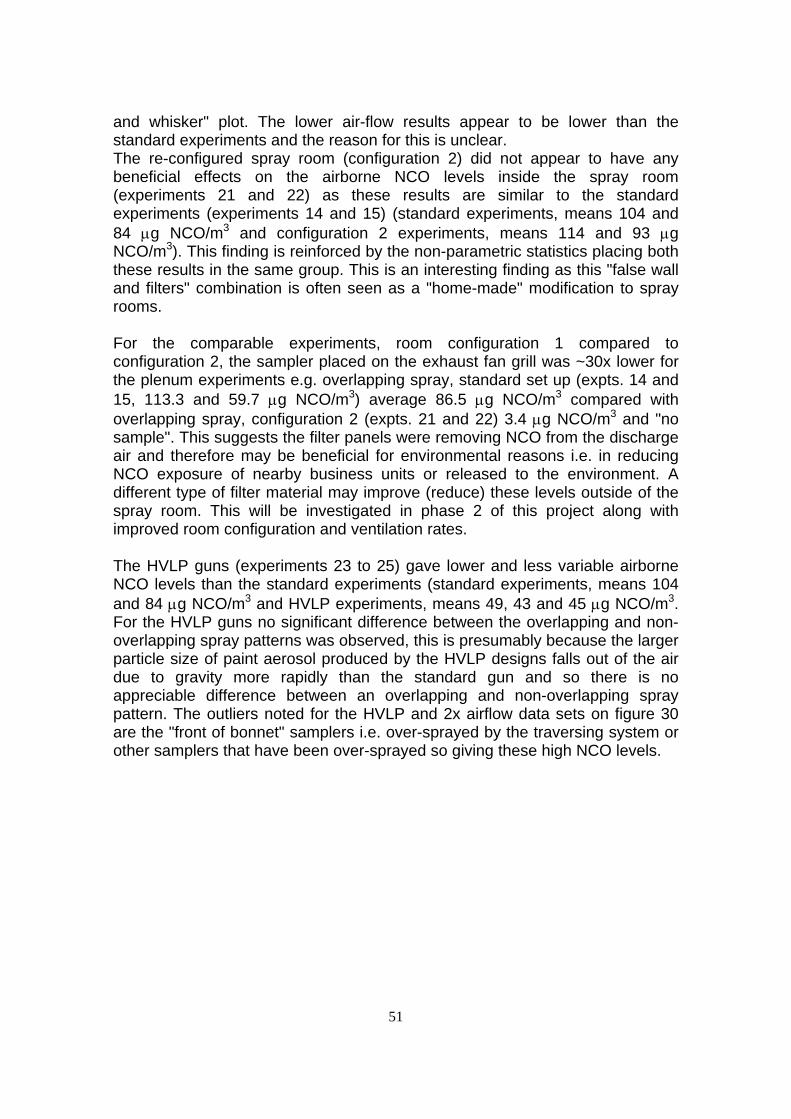
and whisker" plot. The lower air-flow results appear to be lower than the standard experiments and the reason for this is unclear. The re-configured spray room (configuration 2) did not appear to have any beneficial effects on the airborne NCO levels inside the spray room (experiments 21 and 22) as these results are similar to the standard experiments (experiments 14 and 15) (standard experiments, means 104 and 84 µg NCO/m3 and configuration 2 experiments, means 114 and 93 µg NCO/m3). This finding is reinforced by the non-parametric statistics placing both these results in the same group. This is an interesting finding as this "false wall and filters" combination is often seen as a "home-made" modification to spray rooms.
For the comparable experiments, room configuration 1 compared to configuration 2, the sampler placed on the exhaust fan grill was ~30x lower for the plenum experiments e.g. overlapping spray, standard set up (expts. 14 and 15, 113.3 and 59.7 µg NCO/m3) average 86.5 µg NCO/m3 compared with overlapping spray, configuration 2 (expts. 21 and 22) 3.4 µg NCO/m3 and "no sample". This suggests the filter panels were removing NCO from the discharge air and therefore may be beneficial for environmental reasons i.e. in reducing NCO exposure of nearby business units or released to the environment. A different type of filter material may improve (reduce) these levels outside of the spray room. This will be investigated in phase 2 of this project along with improved room configuration and ventilation rates.
The HVLP guns (experiments 23 to 25) gave lower and less variable airborne NCO levels than the standard experiments (standard experiments, means 104 and 84 µg NCO/m3 and HVLP experiments, means 49, 43 and 45 µg NCO/m3. For the HVLP guns no significant difference between the overlapping and non-overlapping spray patterns was observed, this is presumably because the larger particle size of paint aerosol produced by the HVLP designs falls out of the air due to gravity more rapidly than the standard gun and so there is no appreciable difference between an overlapping and non-overlapping spray pattern. The outliers noted for the HVLP and 2x airflow data sets on figure 30 are the "front of bonnet" samplers i.e. over-sprayed by the traversing system or other samplers that have been over-sprayed so giving these high NCO levels.
51
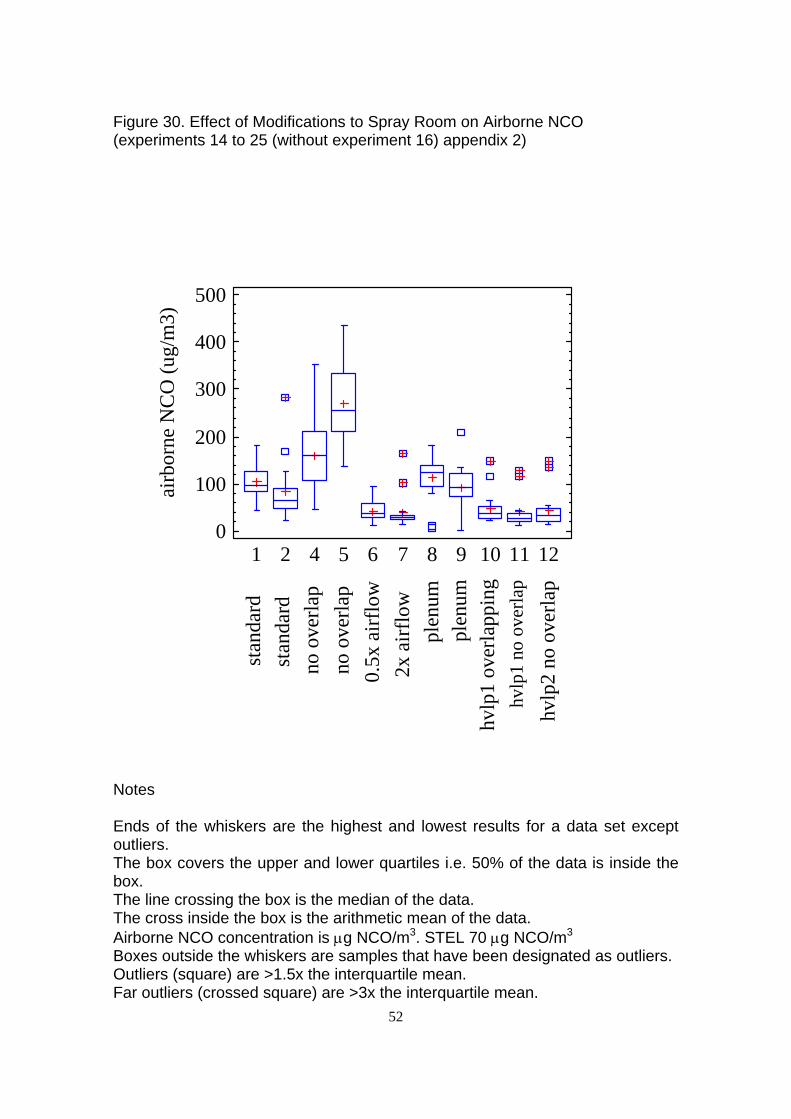
Figure 30. Effect of Modifications to Spray Room on Airborne NCO (experiments 14 to 25 (without experiment 16) appendix 2)
airb
orne
NC
O (u
g/m
3)
0
100
200
300
400
500
1 2 4 5 6 7 8 9 10 11 12
stan
dard
stan
dard
no o
verla
pno
ove
rlap
0.5x
airf
low
2x a
irflo
wpl
enum
plen
umhv
lp1
over
lapp
ing
hvlp
1 no
ove
rlap
hvlp
2 no
ove
rlap
Notes
Ends of the whiskers are the highest and lowest results for a data set exceptoutliers. The box covers the upper and lower quartiles i.e. 50% of the data is inside the box. The line crossing the box is the median of the data. The cross inside the box is the arithmetic mean of the data. Airborne NCO concentration is µg NCO/m3. STEL 70 µg NCO/m3
Boxes outside the whiskers are samples that have been designated as outliers. Outliers (square) are >1.5x the interquartile mean. Far outliers (crossed square) are >3x the interquartile mean.
52
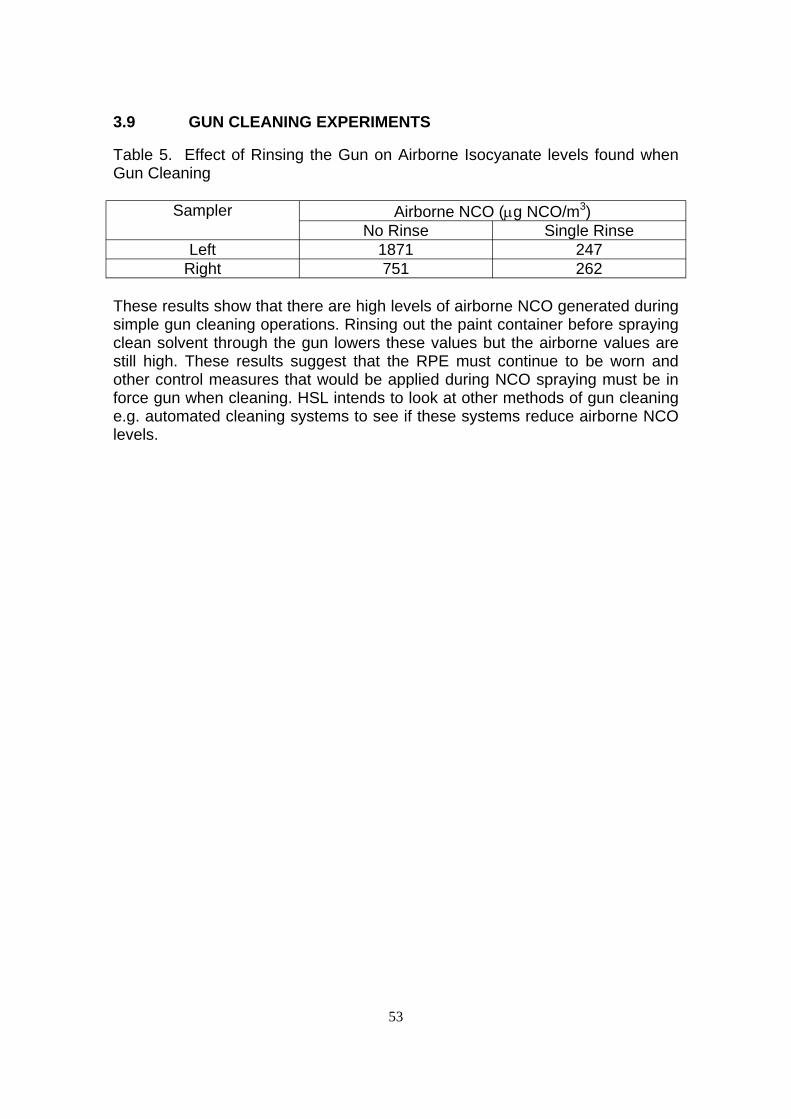
3.9 GUN CLEANING EXPERIMENTS
Table 5. Effect of Rinsing the Gun on Airborne Isocyanate levels found when Gun Cleaning
Sampler Airborne NCO (µg NCO/m3) No Rinse Single Rinse
Left 1871 247 Right 751 262
These results show that there are high levels of airborne NCO generated during simple gun cleaning operations. Rinsing out the paint container before spraying clean solvent through the gun lowers these values but the airborne values are still high. These results suggest that the RPE must continue to be worn and other control measures that would be applied during NCO spraying must be in force gun when cleaning. HSL intends to look at other methods of gun cleaning e.g. automated cleaning systems to see if these systems reduce airborne NCO levels.
53
4 CONCLUSIONS
The main conclusion is that high levels of airborne isocyanate (~ thousands of µg NCO/m3) are produced during spraying and so RPE is necessary for the sprayer and good ventilation systems are required to reduce NCO exposure for other workers/bystanders.
Under “standard” spray room (ventilation/extraction/standard gun settings etc.) conditions isocyanate was detected at similar concentrations at all sampling points apart from those in the immediate vicinity to the spray gun. This implies that the aerosol disperses uniformly. The ventilation test results (sections 3.1 to 3.4) support this finding. Orientation of spraying relative to the extraction fan had little effect on the uniformity of the isocyanate dispersion i.e. there is no significant benefit from spraying in the direction of the extraction fan. From discussions with professional sprayers it has been learnt that spraying into the fan is often carried out because of a belief that this will lessen exposure.
Overlapping the car bonnet when spraying gave slightly decreased air concentrations of isocyanate (~2x) in comparison to spraying with no overlap of the bonnet when using the standard spray gun i.e. spray pattern has a slight effect on airborne isocyanate levels. The isocyanate formulation used is an important factor in the levels of airborne isocyanate detected, however, there is probably not much control that the sprayer has over the products used. Gun type and gun set-up are important factors in the levels of airborne isocyanate detected. Incorrect set-up and maintenance of the gun may lead to increased NCO exposure.
The use of the HVLP spray guns reduced airborne isocyanate concentrations in comparison to spraying using a standard gun (conventional high-pressure gun) by a factor of 2 to 5 depending on sprayer orientation. In contrast to the findings for the standard gun, there was no difference between the overlapping and non-overlapping spray pattern for the HVLP gun, possibly because of the larger aerosol produced by the HVLP gun.
Increased extraction rates reduced airborne isocyanate concentrations inside the room by a factor of ~2x compared to the standard experiments. This finding brings up the question of positioning of the exhaust vent from the spray room as the NCO aerosol will be vented to the outside atmosphere. Filters and traps to capture the NCO aerosol need to be of the correct type and properly maintained to prevent re-circulation of the NCO mist.
The increase in the number of outlet positions and planned make-up air had no effect on airborne isocyanate levels and clearance times when compared to the standard experiments. Further work is required to see if improved room designs will give any benefit. It may be that the best ventilation
54
condition for spray rooms is to create as close to perfect mixing conditions as possible. HSE guidance in this area would be beneficial.
Measurements taken either side of the filter material used in the plenum experiments i.e. inside and outside the booth, showed that it filtered out 94 to 98% of the airborne NCO.
For the room configuration 2 experiments, the measured airborne isocyanate levels on the extract fan grill were lower (~30x) to those for the spray room without the plenum added. The addition of the plenum may therefore be beneficial for environmental reasons to prevent re-circulation of NCO into the spray room and exposure of neighbouring business units.
The real time monitors (paper tape reader and photo-ionisation detector) underestimated the amount of airborne isocyanates but gave reasonable indications of air clearance rates (clearance times for the spray room). It may be possible to calibrate these instruments so they give more accurate results for NCO aerosols. Clearance times of ~20+ minutes were measured for the test HSL spray booth using MDHS 25/3.
Spraying solvent through the guns to clean them produces high levels of airborne isocyanate (~ thousands of µg NCO/m3 during the spraying period) and should not be undertaken unless full control procedures are in place. Further work on other gun cleaning measures is required.
Other work was undertaken during this project on brush and roller application of paints and sanding and NCO emissions during baking of NCO painted car parts. This work has already been reported (HSL, 2005a; HSL, 2005b). Video and still photography was carried out during the project and this and other material was used to support the HSE Safety and Health Awareness Days (SHADs) on NCO spraying. The results of the work presented in this report will be used by HSE to update the NCO guidance sheets on NCO use (MR01 - isocyanate from mixing 2-pack paint etc., MR02 – spraying 2-pack products in a spray/bake booth, MR03 – isocyanate from cleaning 2-pack paint spray guns, MR04 – isocyanate from brush and roller application of 2-pack products, see - HSE (2005a).
Because other survey work has provided information on typical spray room conditions and potential exposures (see appendices 3 and 4), the field monitoring exercise (objective 3) was not undertaken. Extra spray room tests were performed instead. The results of previous field-work are summarised in this report (appendices 3 and 4).
55
5 REFERENCES
England E, Key-Schwartz R, Lesage J, Carlton G, Streicher R and Song R (2000) Comparison of sampling methods for monomer and polyisocyanates of 1,6-hexamethylene diisocyanate during spray finishing operations Applied Occupational and Environmental Hygiene, 15(6), p472-478.
Ekman J, Levin J-O, Lindahl R, Sundgren M and Östin A (2002) Comparison of sampling methods for 1,6-hexamethylene diisocyanate in a commercial spray box Analyst, 127, p169-173.
Health and Safety Executive (2004a) hse.gov.uk/asthma/substacesinfo HSE website.
Health and Safety Executive (2004b) Project on isocyanate exposure in small MVR premises Helps J HSE Field Operations Directorate, Wales and South West Divisional Specialist Group, Occupational Hygiene Section, FOCUS job # 002512
Health and Safety Executive (1999) Organic isocyanates in air Methods for the determination of hazardous substances Method 25/3
Health and Safety Executive (2005a) HSE website - www.hse.gov.uk - especially the MVR and asthma pages
Health and Safety Executive (2005b) An occupational hygiene assessment of the use and control of isocyanates in the UK Cowie HA, Hughson GW, Creely KS, Graham MK, Hutchison PA and Aitken RJ – Institute of Occupational Medicine HSE Research Report 311
Health and Safety Laboratory (1991a) Laboratory evaluation of a pumped sampling device for the on-site measurement of TDI – the GMD dosimeter "Surespot" Milsom E and Groves J HSL report IR/L/SP/91/02
Health and Safety Laboratory (1991b) Laboratory evaluation of the Graseby airborne vapour monitor Milsom E HSL report IR/L/SP/91/03
56
Health and Safety Laboratory (1991c) Laboratory evaluation of a colorimetric diffusive sampler device for the on-site measurement of TDI – the GMD 7000 series dosimeter Milsom E and Groves J HSL report IR/L/SP/91/04
Health and Safety Laboratory (1991d) Preliminary investigation into the Chemsense isocyanates dosimeter Milsom E HSL report IR/L/SP/91/07
Health and Safety Laboratory (2001) Field Evaluation of MDA Isologger Keen C HSL Report OMS/2001/17
Health and Safety Laboratory (2002) Pyrolysis screening methods Pengelly I HSL report OMS/2002/02
Health and Safety Laboratory (2003a) Sanding of isocyanate based paints – part 1 Coldwell M and White J HSL report OMS/2003/06
Health and Safety Laboratory (2003b) The determination of isocyanates in the presence of amines White J HSL report OMS/2003/10
Health and Safety Laboratory (2003c) The effectiveness of control measures for isocyanates in motor vehicle repair Bagon DA HSL report FSSU/2003/04
Health and Safety Laboratory (2003d) Isocyanate call-off contract White J HSL report OMS/2003/12
Health and Safety Laboratory (2003e) LC/MS/MS call-off contract White J HSL report OMS/2003/13
Health and Safety Laboratory (2003f) Enhanced Isologger for fast response measurements of TDI
57
Booth A and Simpson A HSL report FMS/02/10
Health and Safety Laboratory (2005a) Measured airborne isocyanate from mixing and brush and roller application of isocyanate based 2- pack paints Coldwell M and White J HSL report OMS/2005/02
Health and Safety Laboratory (2005b) Measurement of airborne isocyanate during sanding and bake cycle Coldwell M and White J HSL report OMS/2005/10
Health and Safety Laboratory (2005c) Airborne isocyanate from SMART repair Coldwell M and White J HSL report OMS/2005/12
Heitbrink WA, Wallace ME, Charles JB, Walter ER (1995) Control of paint overspray in autobody repair shops AIHA journal, 56, p 1023-1032.
Maitre A, Leplay A, Perdrix A, Ohl G, Boinay P, Romazini S and Aubrun JC (1996) Comparison between solid sampler and impinger for evaluation of occupational exposure to 1,6 hexamethylene diisocyanate polyisocyanates during spray painting AIHA journal, 57, p153–160.
Miller JC and Miller JN (1993) Statistics for Analytical Chemistry, 3rd ed. Ellis-Horwood Ltd, England
National Institute of Occupational Safety and Hygiene (1993) Cooper TC, Heitbrink WA, Edmonds MA, Bryant CJ and Ruch WE Control technologies for Auto Repair and Painting Shops NIOSH report ECTB 179-15-1993
Sandberg, M. and M. Sjoberg (1983) The use of moments for assessing air quality in ventilated rooms. Building and Environment, p181-197.
Sparer J, Stowe MH, Bello D, Liu Y, Gore RJ, Youngs F, Cullen MR, Redlich CA and Woskie S (2004) Isocyanate exposures in autobody shop work: the SPRAY (Study of Painters and Repairers of Autobodies by Yale) study Journal of Occupational and Environmental Hygiene, 1, p570-580.
58
Woskie SR, Sparer J, Gore RJ, Stowe M, Bello D, Liu Y, Youngs SR, Redlich C, Eisen E and Cullen M (2004) Determinants of isocyanates exposures in auto body repair and refinishing shops Ann. Occup. Hyg., 48, No. 5, p 393-403.
59
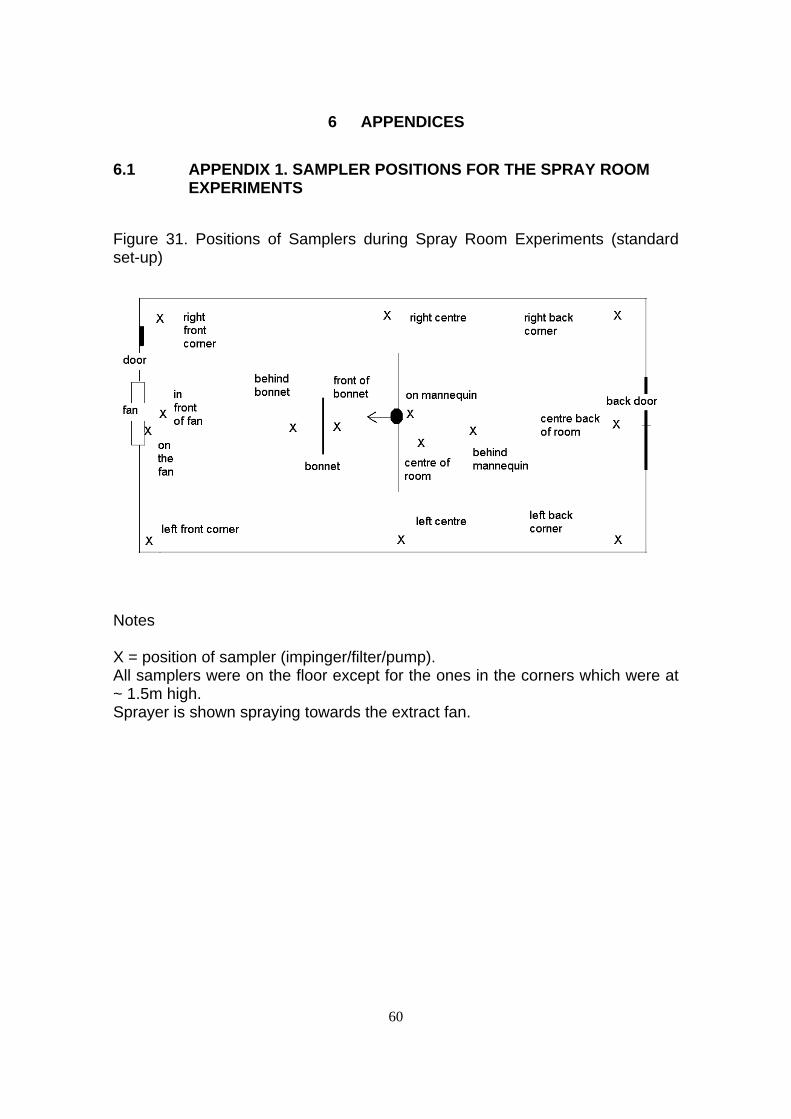
6.1
6 APPENDICES
APPENDIX 1. SAMPLER POSITIONS FOR THE SPRAY ROOM EXPERIMENTS
Figure 31. Positions of Samplers during Spray Room Experiments (standard set-up)
Notes
X = position of sampler (impinger/filter/pump). All samplers were on the floor except for the ones in the corners which were at ~ 1.5m high. Sprayer is shown spraying towards the extract fan.
60
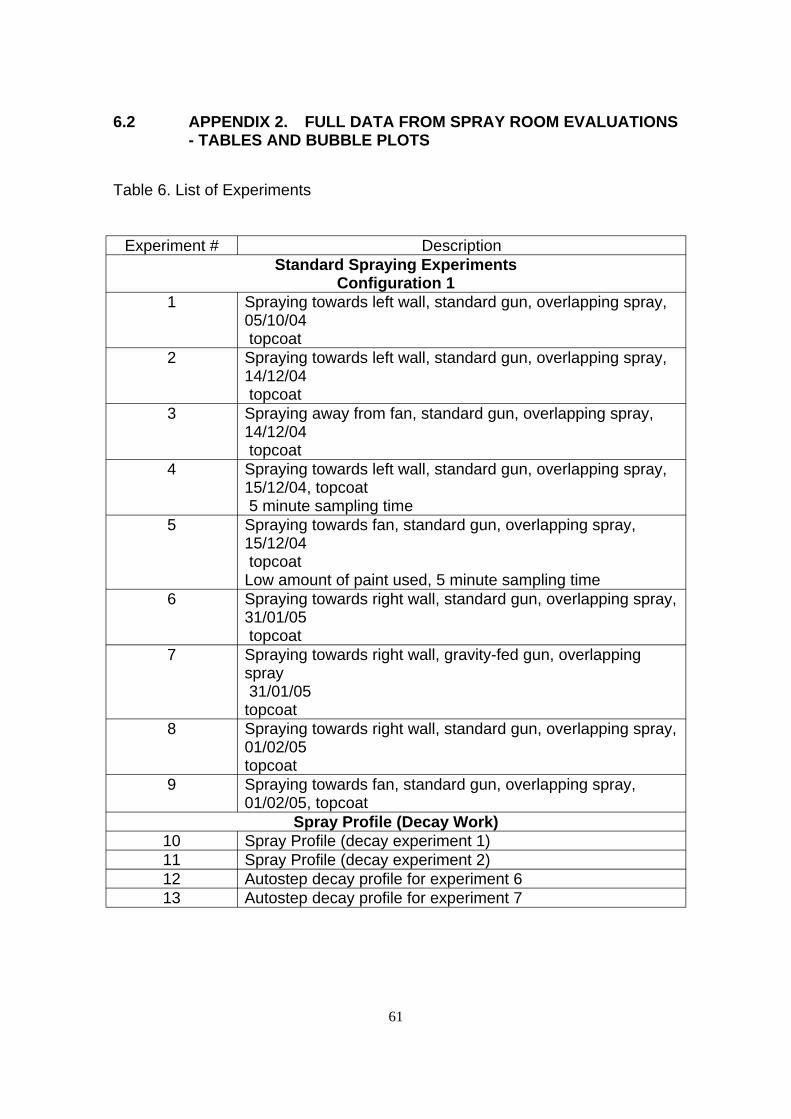
6.2 APPENDIX 2. FULL DATA FROM SPRAY ROOM EVALUATIONS - TABLES AND BUBBLE PLOTS
Table 6. List of Experiments
Experiment # Description Standard Spraying Experiments
Configuration 1 1 Spraying towards left wall, standard gun, overlapping spray,
05/10/04 topcoat
2 Spraying towards left wall, standard gun, overlapping spray, 14/12/04 topcoat
3 Spraying away from fan, standard gun, overlapping spray, 14/12/04 topcoat
4 Spraying towards left wall, standard gun, overlapping spray, 15/12/04, topcoat 5 minute sampling time
5 Spraying towards fan, standard gun, overlapping spray, 15/12/04 topcoat
Low amount of paint used, 5 minute sampling time 6 Spraying towards right wall, standard gun, overlapping spray,
31/01/05 topcoat
7 Spraying towards right wall, gravity-fed gun, overlapping spray 31/01/05
topcoat 8 Spraying towards right wall, standard gun, overlapping spray,
01/02/05 topcoat
9 Spraying towards fan, standard gun, overlapping spray, 01/02/05, topcoat
Spray Profile (Decay Work) 10 Spray Profile (decay experiment 1) 11 Spray Profile (decay experiment 2) 12 Autostep decay profile for experiment 6 13 Autostep decay profile for experiment 7
61
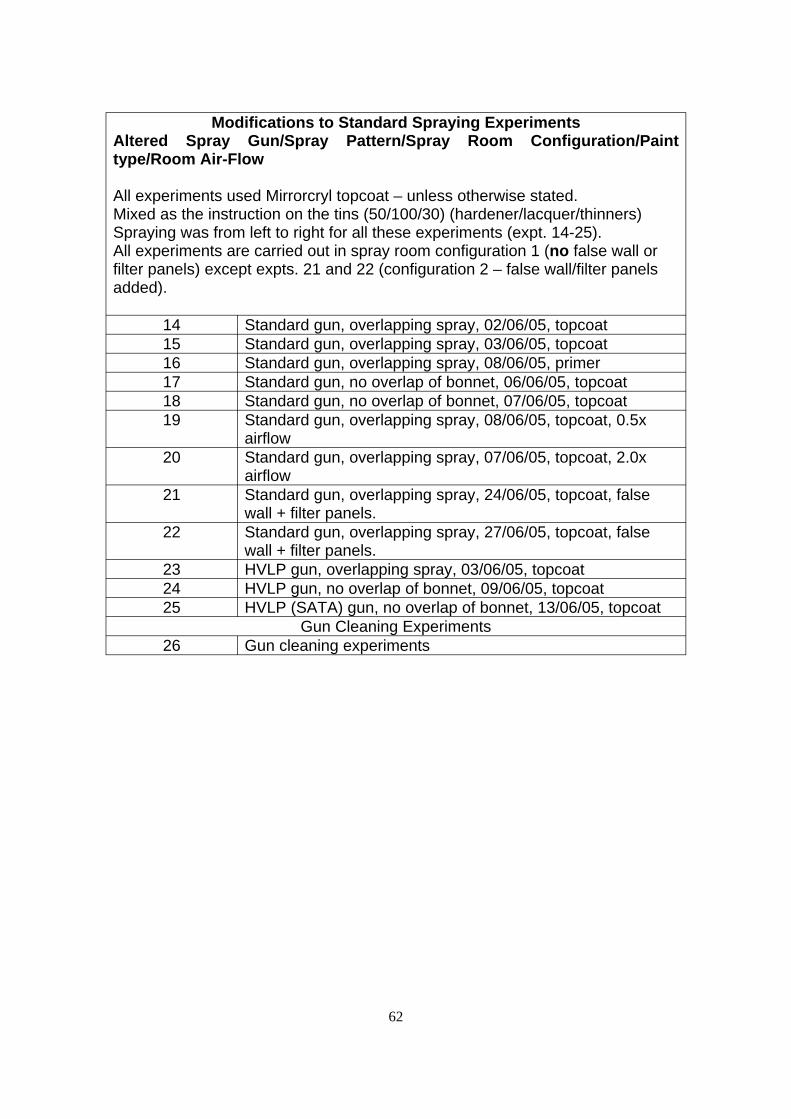
Modifications to Standard Spraying Experiments Altered Spray Gun/Spray Pattern/Spray Room Configuration/Paint type/Room Air-Flow
All experiments used Mirrorcryl topcoat – unless otherwise stated. Mixed as the instruction on the tins (50/100/30) (hardener/lacquer/thinners) Spraying was from left to right for all these experiments (expt. 14-25). All experiments are carried out in spray room configuration 1 (no false wall or filter panels) except expts. 21 and 22 (configuration 2 – false wall/filter panels added).
14 Standard gun, overlapping spray, 02/06/05, topcoat 15 Standard gun, overlapping spray, 03/06/05, topcoat 16 Standard gun, overlapping spray, 08/06/05, primer 17 Standard gun, no overlap of bonnet, 06/06/05, topcoat 18 Standard gun, no overlap of bonnet, 07/06/05, topcoat 19 Standard gun, overlapping spray, 08/06/05, topcoat, 0.5x
airflow 20 Standard gun, overlapping spray, 07/06/05, topcoat, 2.0x
airflow 21 Standard gun, overlapping spray, 24/06/05, topcoat, false
wall + filter panels. 22 Standard gun, overlapping spray, 27/06/05, topcoat, false
wall + filter panels. 23 HVLP gun, overlapping spray, 03/06/05, topcoat 24 HVLP gun, no overlap of bonnet, 09/06/05, topcoat 25 HVLP (SATA) gun, no overlap of bonnet, 13/06/05, topcoat
Gun Cleaning Experiments 26 Gun cleaning experiments
62
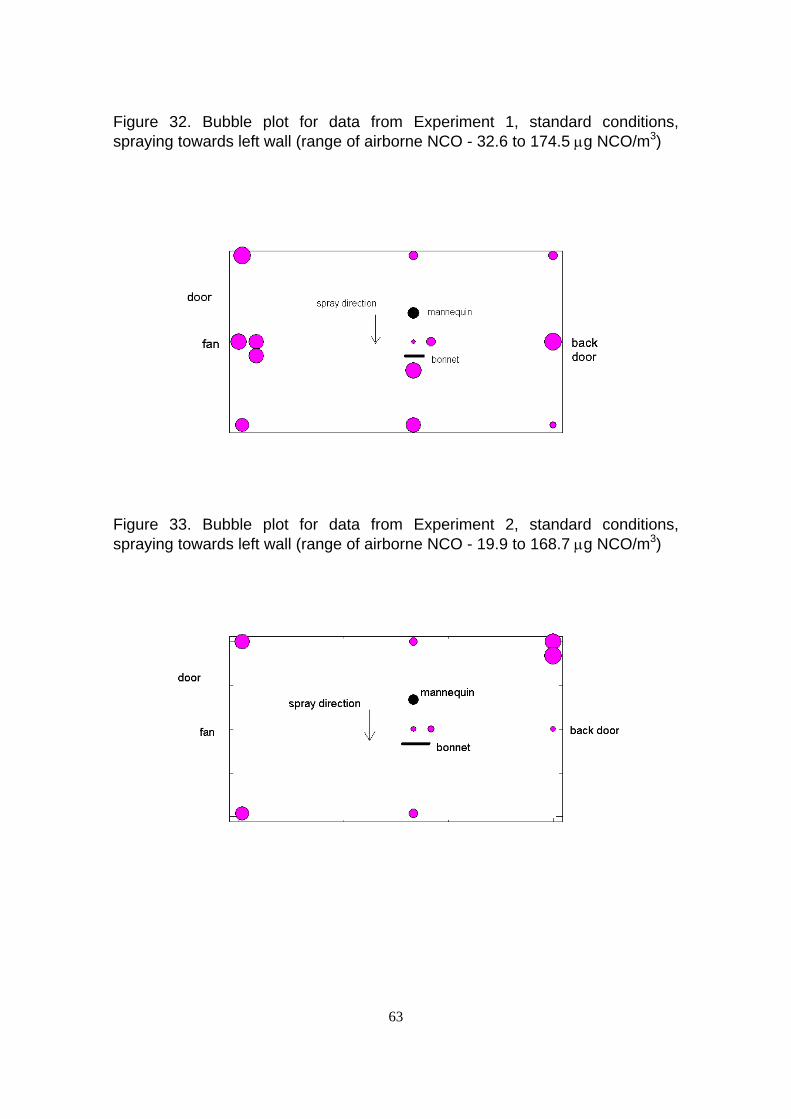
Figure 32. Bubble plot for data from Experiment 1, standard conditions, spraying towards left wall (range of airborne NCO - 32.6 to 174.5 µg NCO/m3)
Figure 33. Bubble plot for data from Experiment 2, standard conditions, spraying towards left wall (range of airborne NCO - 19.9 to 168.7 µg NCO/m3)
63
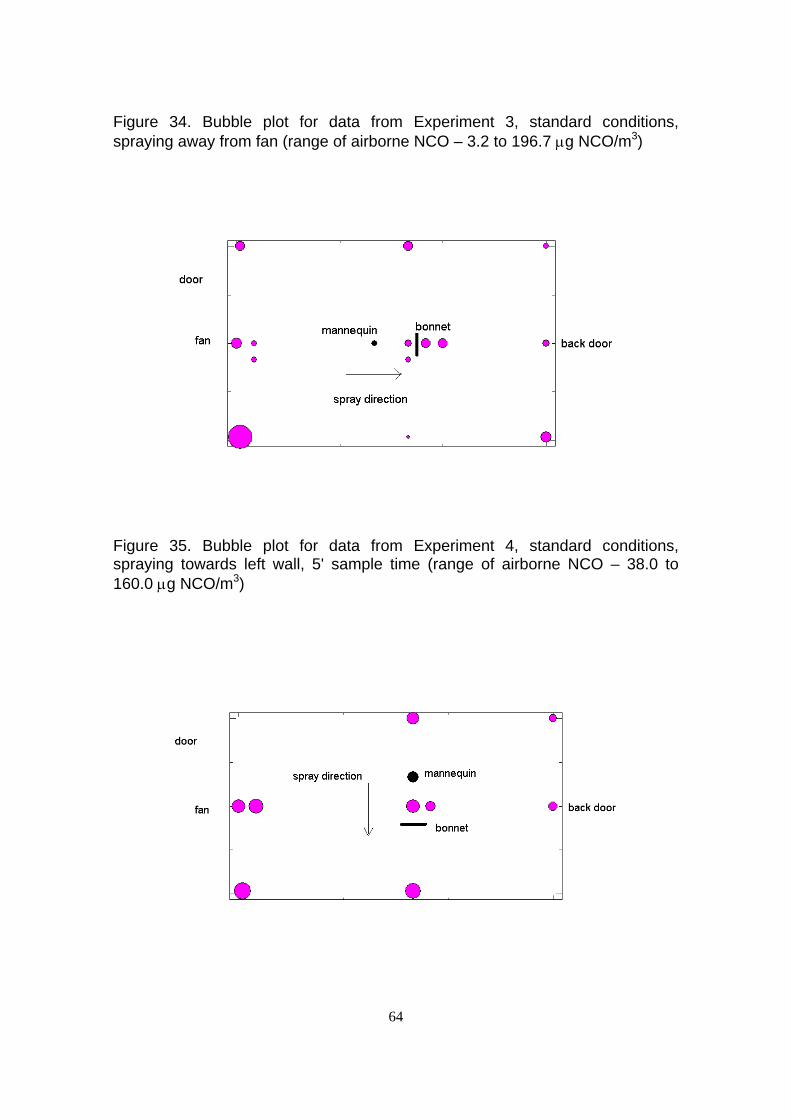
Figure 34. Bubble plot for data from Experiment 3, standard conditions, spraying away from fan (range of airborne NCO – 3.2 to 196.7 µg NCO/m3)
Figure 35. Bubble plot for data from Experiment 4, standard conditions, spraying towards left wall, 5' sample time (range of airborne NCO – 38.0 to 160.0 µg NCO/m3)
64
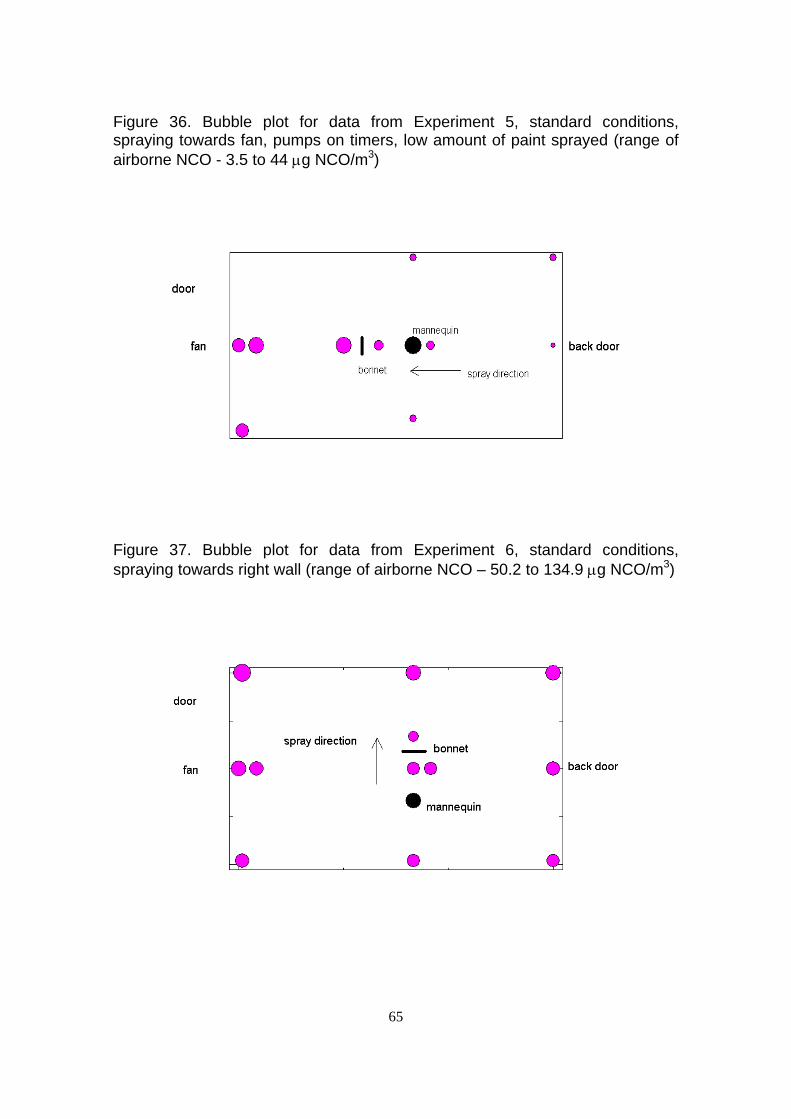
Figure 36. Bubble plot for data from Experiment 5, standard conditions, spraying towards fan, pumps on timers, low amount of paint sprayed (range of airborne NCO - 3.5 to 44 µg NCO/m3)
Figure 37. Bubble plot for data from Experiment 6, standard conditions, spraying towards right wall (range of airborne NCO – 50.2 to 134.9 µg NCO/m3)
65
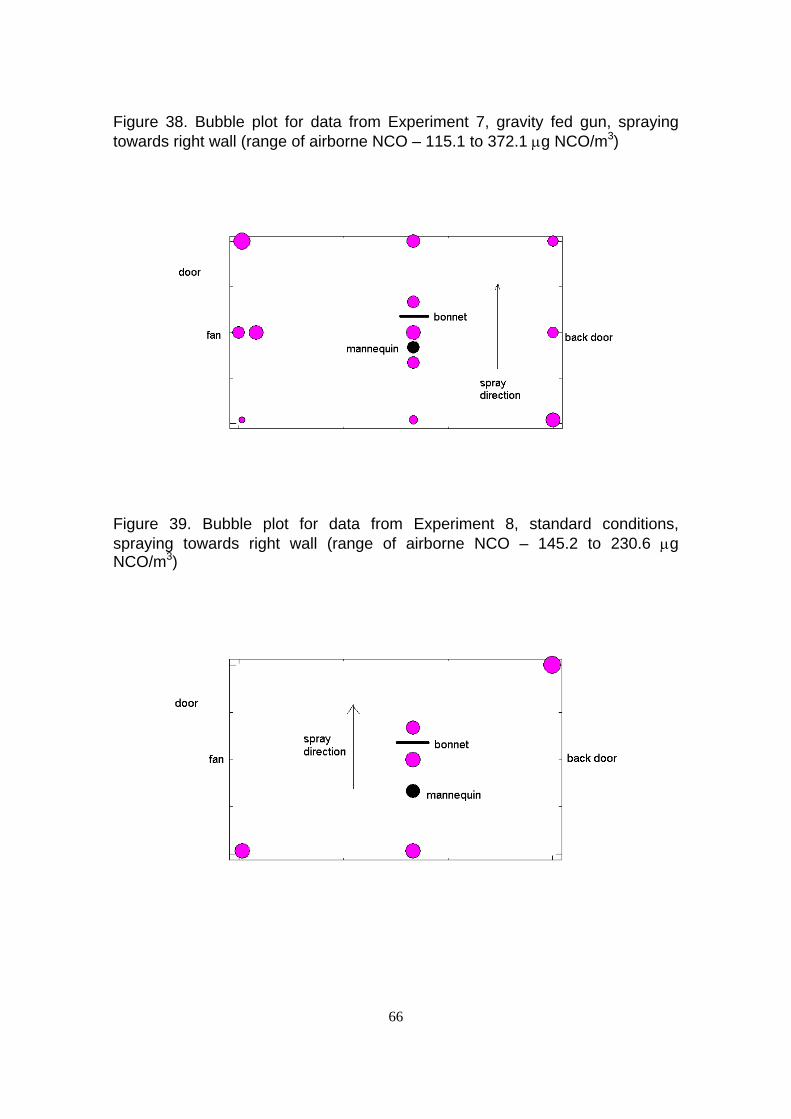
Figure 38. Bubble plot for data from Experiment 7, gravity fed gun, spraying towards right wall (range of airborne NCO – 115.1 to 372.1 µg NCO/m3)
Figure 39. Bubble plot for data from Experiment 8, standard conditions, spraying towards right wall (range of airborne NCO – 145.2 to 230.6 µg NCO/m3)
66
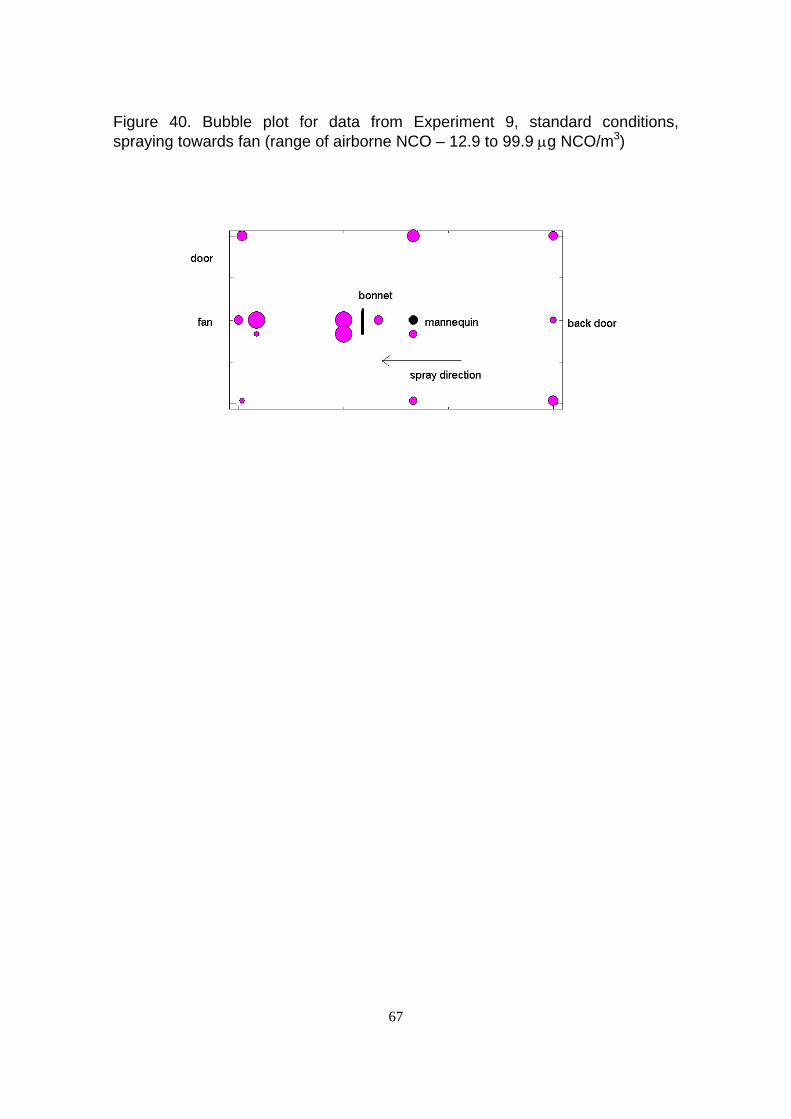
Figure 40. Bubble plot for data from Experiment 9, standard conditions, spraying towards fan (range of airborne NCO – 12.9 to 99.9 µg NCO/m3)
67
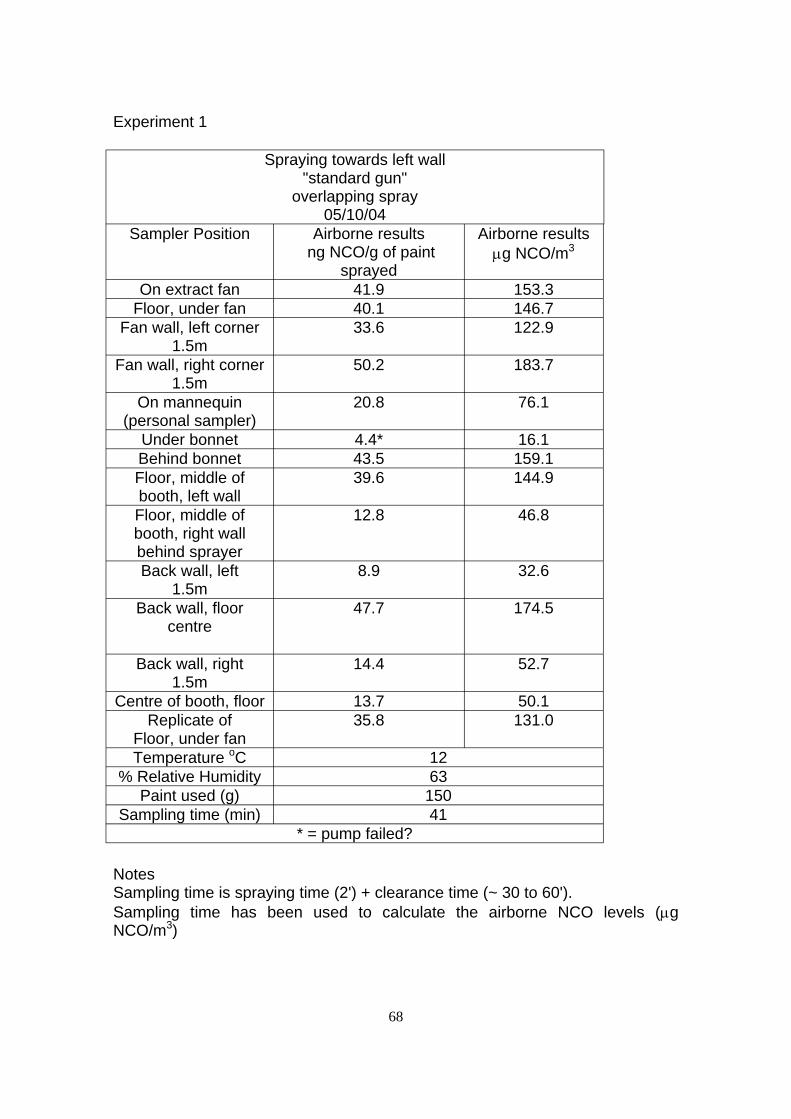
Experiment 1
Spraying towards left wall "standard gun"
overlapping spray 05/10/04
Sampler Position Airborne results ng NCO/g of paint
sprayed
Airborne results µg NCO/m3
On extract fan 41.9 153.3 Floor, under fan 40.1 146.7
Fan wall, left corner 33.6 122.9 1.5m
Fan wall, right corner 50.2 183.7 1.5m
On mannequin 20.8 76.1 (personal sampler)
Under bonnet 4.4* 16.1 Behind bonnet 43.5 159.1 Floor, middle of 39.6 144.9 booth, left wall Floor, middle of 12.8 46.8 booth, right wall behind sprayer Back wall, left 8.9 32.6
1.5m Back wall, floor 47.7 174.5
centre
Back wall, right 14.4 52.7 1.5m
Centre of booth, floor 13.7 50.1 Replicate of 35.8 131.0
Floor, under fan Temperature oC 12
% Relative Humidity 63 Paint used (g) 150
Sampling time (min) 41 * = pump failed?
Notes Sampling time is spraying time (2') + clearance time (~ 30 to 60'). Sampling time has been used to calculate the airborne NCO levels (µg NCO/m3)
68
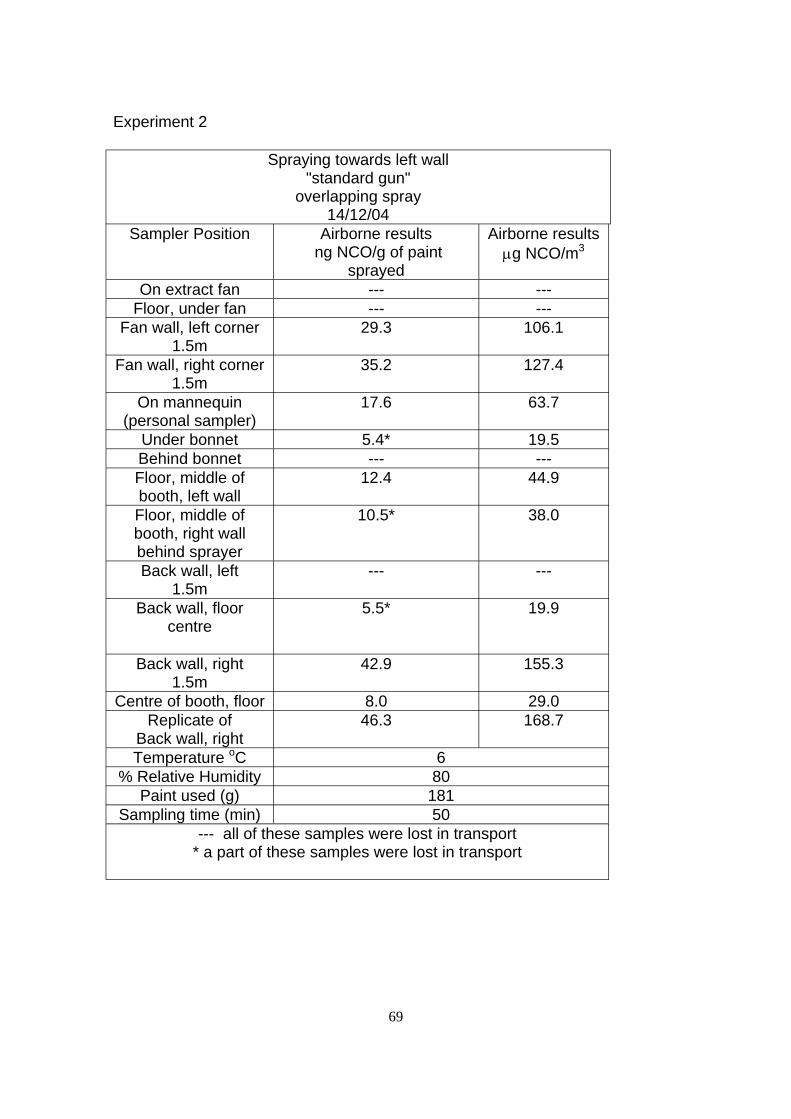
--- --- --- ---
--- ---
--- ---
---
Experiment 2
Spraying towards left wall "standard gun"
overlapping spray 14/12/04
Sampler Position Airborne results ng NCO/g of paint
sprayed
Airborne results µg NCO/m3
On extract fan Floor, under fan
Fan wall, left corner 1.5m
29.3 106.1
Fan wall, right corner 1.5m
35.2 127.4
On mannequin (personal sampler)
17.6 63.7
Under bonnet 5.4* 19.5 Behind bonnet Floor, middle of booth, left wall
12.4 44.9
Floor, middle of booth, right wall behind sprayer
10.5* 38.0
Back wall, left 1.5m
Back wall, floor centre
5.5* 19.9
Back wall, right 1.5m
42.9 155.3
Centre of booth, floor 8.0 29.0 Replicate of
Back wall, right 46.3 168.7
Temperature oC 6 % Relative Humidity 80
Paint used (g) 181 Sampling time (min) 50
all of these samples were lost in transport * a part of these samples were lost in transport
69
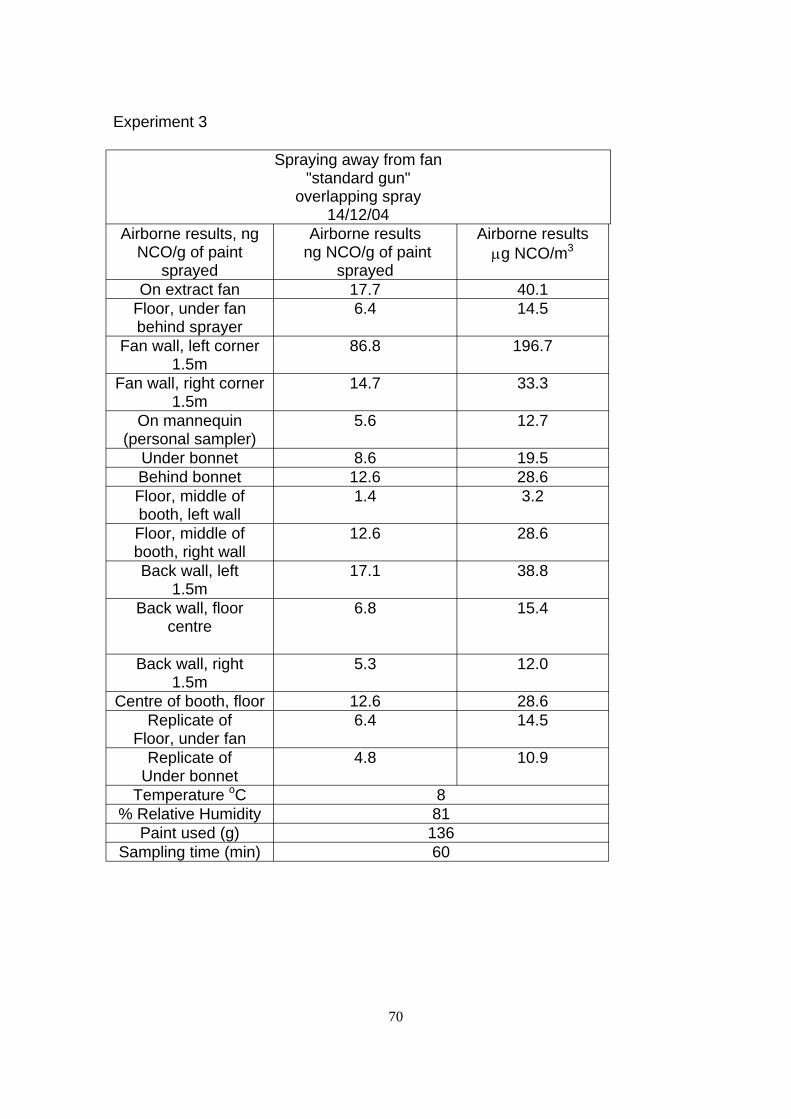
Experiment 3
Spraying away from fan "standard gun"
overlapping spray 14/12/04
Airborne results, ng NCO/g of paint
sprayed
Airborne results ng NCO/g of paint
sprayed
Airborne results µg NCO/m3
On extract fan 17.7 40.1 Floor, under fan 6.4 14.5 behind sprayer
Fan wall, left corner 86.8 196.7 1.5m
Fan wall, right corner 14.7 33.3 1.5m
On mannequin 5.6 12.7 (personal sampler)
Under bonnet 8.6 19.5 Behind bonnet 12.6 28.6 Floor, middle of 1.4 3.2 booth, left wall Floor, middle of 12.6 28.6 booth, right wall Back wall, left 17.1 38.8
1.5m Back wall, floor 6.8 15.4
centre
Back wall, right 5.3 12.0 1.5m
Centre of booth, floor 12.6 28.6 Replicate of 6.4 14.5
Floor, under fan Replicate of 4.8 10.9
Under bonnet Temperature oC 8
% Relative Humidity 81 Paint used (g) 136
Sampling time (min) 60
70
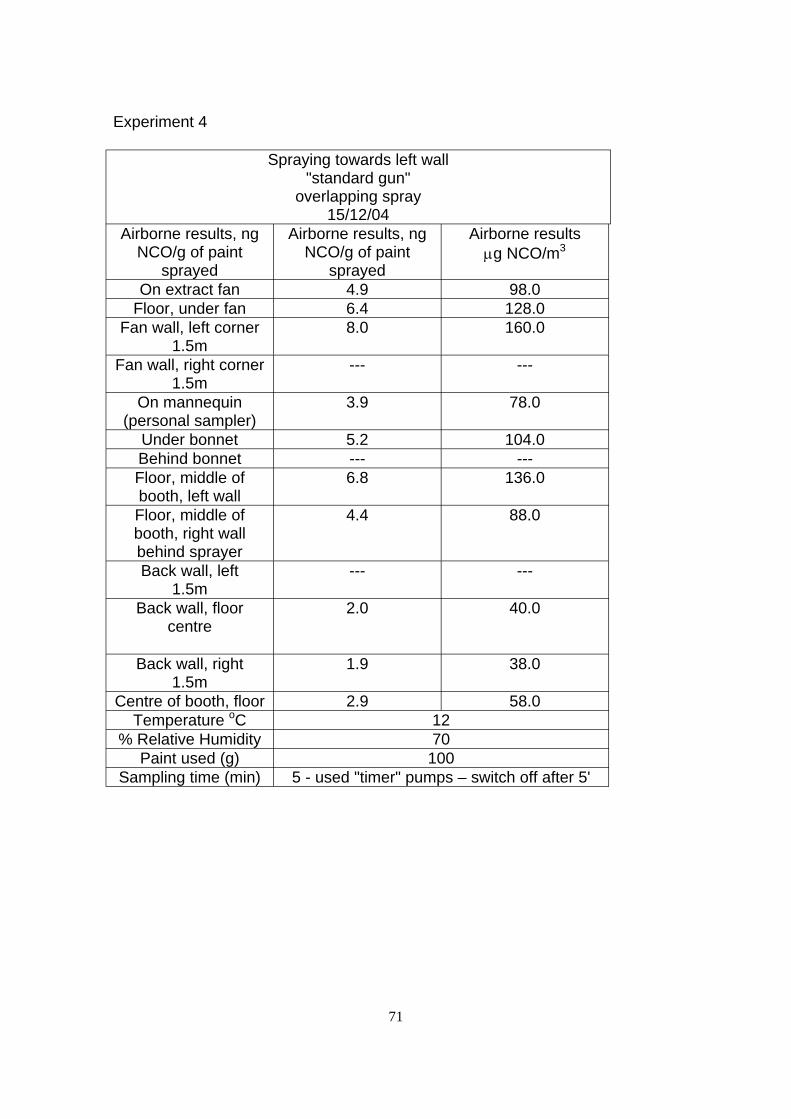
--- ---
--- ---
--- ---
Experiment 4
Spraying towards left wall "standard gun"
overlapping spray 15/12/04
Airborne results, ng NCO/g of paint
sprayed
Airborne results, ng NCO/g of paint
sprayed
Airborne results µg NCO/m3
On extract fan 4.9 98.0 Floor, under fan 6.4 128.0
Fan wall, left corner 8.0 160.0 1.5m
Fan wall, right corner 1.5m
On mannequin 3.9 78.0 (personal sampler)
Under bonnet 5.2 104.0 Behind bonnet Floor, middle of 6.8 136.0 booth, left wall Floor, middle of 4.4 88.0 booth, right wall behind sprayer Back wall, left
1.5m Back wall, floor 2.0 40.0
centre
Back wall, right 1.9 38.0 1.5m
Centre of booth, floor 2.9 58.0 Temperature oC 12
% Relative Humidity 70 Paint used (g) 100
Sampling time (min) 5 - used "timer" pumps – switch off after 5'
71
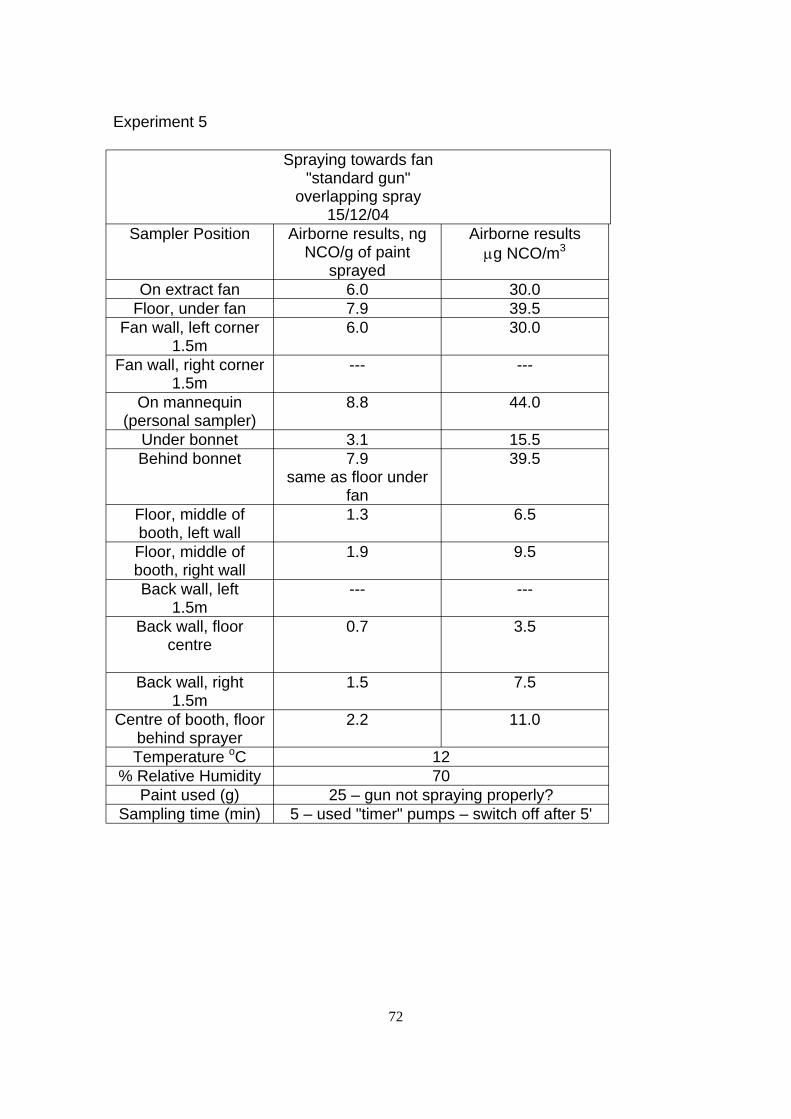
--- ---
--- ---
Experiment 5
Spraying towards fan "standard gun"
overlapping spray 15/12/04
Sampler Position Airborne results, ng NCO/g of paint
sprayed
Airborne results µg NCO/m3
On extract fan 6.0 30.0 Floor, under fan 7.9 39.5
Fan wall, left corner 6.0 30.0 1.5m
Fan wall, right corner 1.5m
On mannequin 8.8 44.0 (personal sampler)
Under bonnet 3.1 15.5 Behind bonnet 7.9 39.5
same as floor under fan
Floor, middle of 1.3 6.5 booth, left wall Floor, middle of 1.9 9.5 booth, right wall Back wall, left
1.5m Back wall, floor 0.7 3.5
centre
Back wall, right 1.5 7.5 1.5m
Centre of booth, floor 2.2 11.0 behind sprayer Temperature oC 12
% Relative Humidity 70 Paint used (g) 25 – gun not spraying properly?
Sampling time (min) 5 – used "timer" pumps – switch off after 5'
72
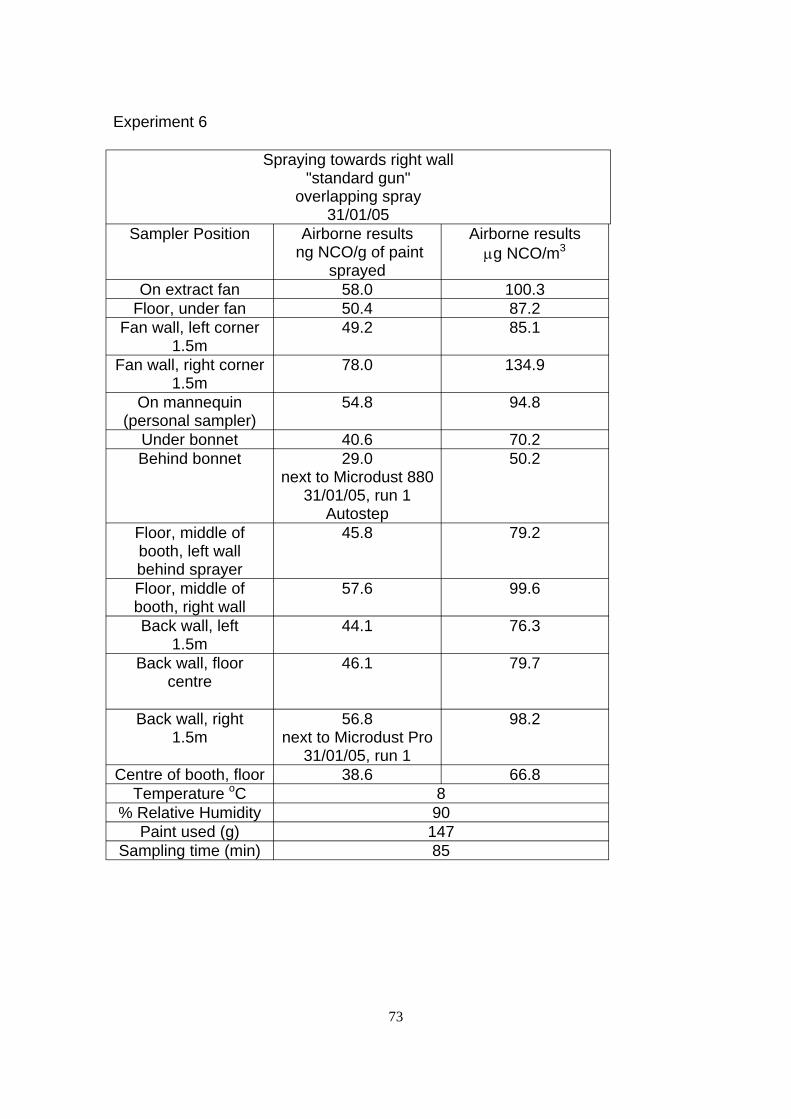
Experiment 6
Spraying towards right wall "standard gun"
overlapping spray 31/01/05
Sampler Position Airborne results ng NCO/g of paint
sprayed
Airborne results µg NCO/m3
On extract fan 58.0 100.3 Floor, under fan 50.4 87.2
Fan wall, left corner 49.2 85.1 1.5m
Fan wall, right corner 78.0 134.9 1.5m
On mannequin 54.8 94.8 (personal sampler)
Under bonnet 40.6 70.2 Behind bonnet 29.0 50.2
next to Microdust 880 31/01/05, run 1
Autostep Floor, middle of 45.8 79.2 booth, left wall behind sprayer Floor, middle of 57.6 99.6 booth, right wall Back wall, left 44.1 76.3
1.5m Back wall, floor 46.1 79.7
centre
Back wall, right 56.8 98.2 1.5m next to Microdust Pro
31/01/05, run 1 Centre of booth, floor 38.6 66.8
Temperature oC 8 % Relative Humidity 90
Paint used (g) 147 Sampling time (min) 85
73

Experiment 7
Spraying towards right wall "gravity fed gun"
overlapping spray 31/01/05
Sampler Position Airborne results ng NCO/g of paint
sprayed
Airborne results µg NCO/m3
On extract fan 53.6 183.1 Floor, under fan 85.6 292.5
Fan wall, left corner 20.1 68.7 1.5m * pump failure?
Fan wall, right corner 108.9 372.1 1.5m
On mannequin 58.0 198.2 (personal sampler)
Under bonnet 76.7 262.1 Behind bonnet 59.7 204.0
next to Microdust 880 31/01/05, run 2
Autostep Floor, middle of 33.7 115.1 booth, left wall behind sprayer Floor, middle of 74.6 254.9 booth, right wall Back wall, left 85.4 291.8
1.5m next to Microdust Pro 31/01/05, run 2
Back wall, floor 51.6 176.3 centre
Back wall, right 44.4 151.7 1.5m
Centre of booth, floor 59.7 204.0 Temperature oC 8
% Relative Humidity 90 Paint used (g) 205
Sampling time (min) 60
74
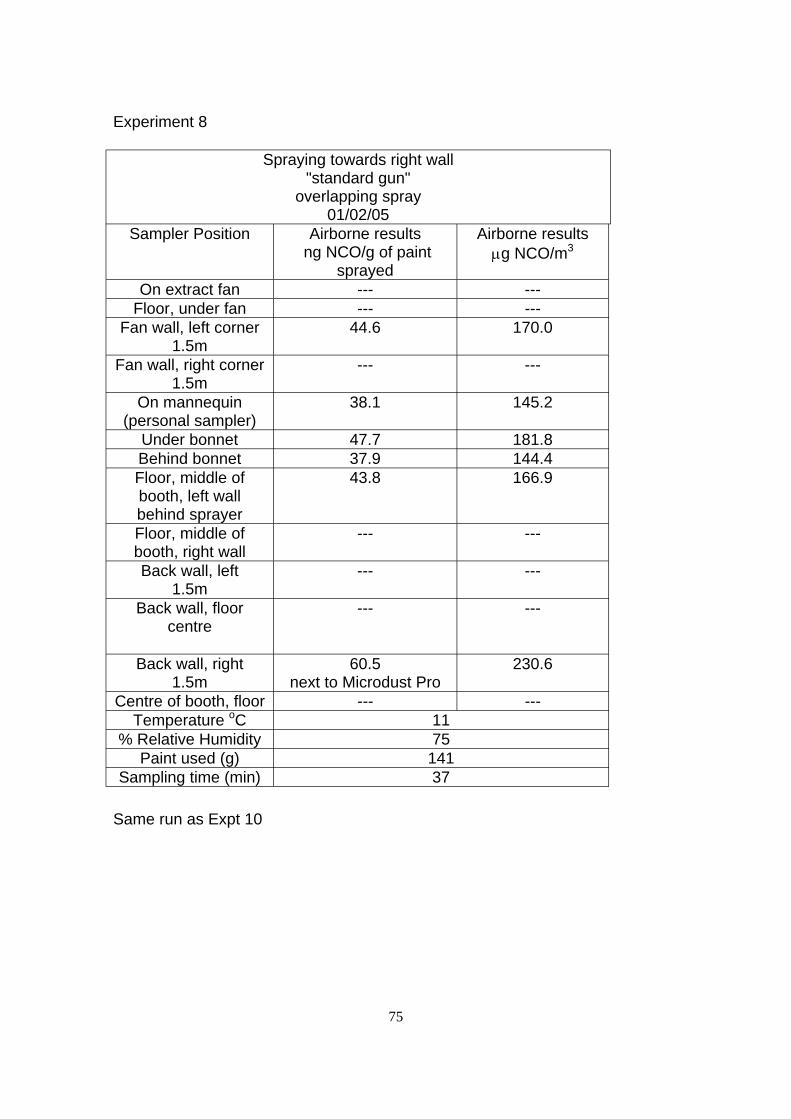
--- --- --- ---
--- ---
--- ---
--- ---
--- ---
--- ---
Experiment 8
Spraying towards right wall "standard gun"
overlapping spray 01/02/05
Sampler Position Airborne results ng NCO/g of paint
sprayed
Airborne results µg NCO/m3
On extract fan Floor, under fan
Fan wall, left corner 44.6 170.0 1.5m
Fan wall, right corner 1.5m
On mannequin 38.1 145.2 (personal sampler)
Under bonnet 47.7 181.8 Behind bonnet 37.9 144.4 Floor, middle of 43.8 166.9 booth, left wall behind sprayer Floor, middle of booth, right wall Back wall, left
1.5m Back wall, floor
centre
Back wall, right 60.5 230.6 1.5m next to Microdust Pro
Centre of booth, floor Temperature oC 11
% Relative Humidity 75 Paint used (g) 141
Sampling time (min) 37
Same run as Expt 10
75
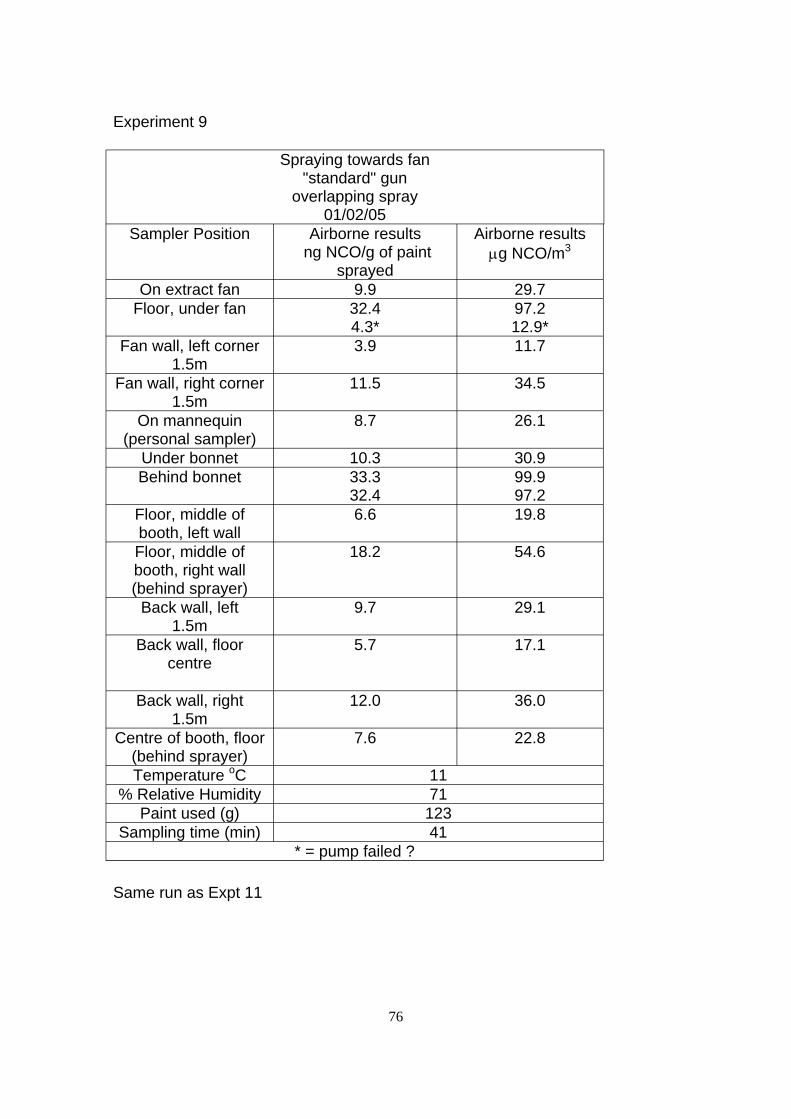
Experiment 9
Spraying towards fan "standard" gun
overlapping spray 01/02/05
Sampler Position Airborne results ng NCO/g of paint
sprayed
Airborne results µg NCO/m3
On extract fan 9.9 29.7 Floor, under fan 32.4 97.2
4.3* 12.9* Fan wall, left corner 3.9 11.7
1.5m Fan wall, right corner 11.5 34.5
1.5m On mannequin 8.7 26.1
(personal sampler) Under bonnet 10.3 30.9 Behind bonnet 33.3 99.9
32.4 97.2 Floor, middle of 6.6 19.8 booth, left wall Floor, middle of 18.2 54.6 booth, right wall (behind sprayer)
Back wall, left 9.7 29.1 1.5m
Back wall, floor 5.7 17.1 centre
Back wall, right 12.0 36.0 1.5m
Centre of booth, floor 7.6 22.8 (behind sprayer) Temperature oC 11
% Relative Humidity 71 Paint used (g) 123
Sampling time (min) 41 * = pump failed ?
Same run as Expt 11
76
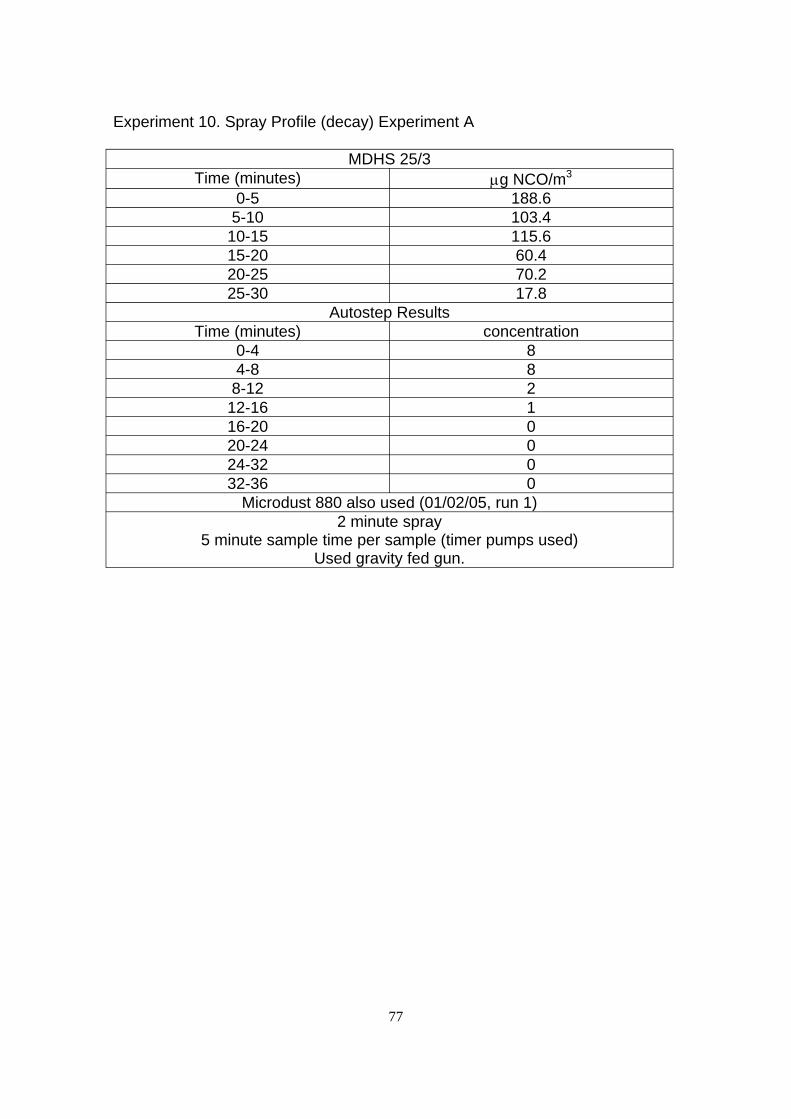
Experiment 10. Spray Profile (decay) Experiment A
MDHS 25/3 Time (minutes) µg NCO/m3
0-5 188.6 5-10 103.4 10-15 115.6 15-20 60.4 20-25 70.2 25-30 17.8
Autostep Results Time (minutes) concentration
0-4 8 4-8 8
8-12 2 12-16 1 16-20 0 20-24 0 24-32 0 32-36 0
Microdust 880 also used (01/02/05, run 1) 2 minute spray
5 minute sample time per sample (timer pumps used) Used gravity fed gun.
77
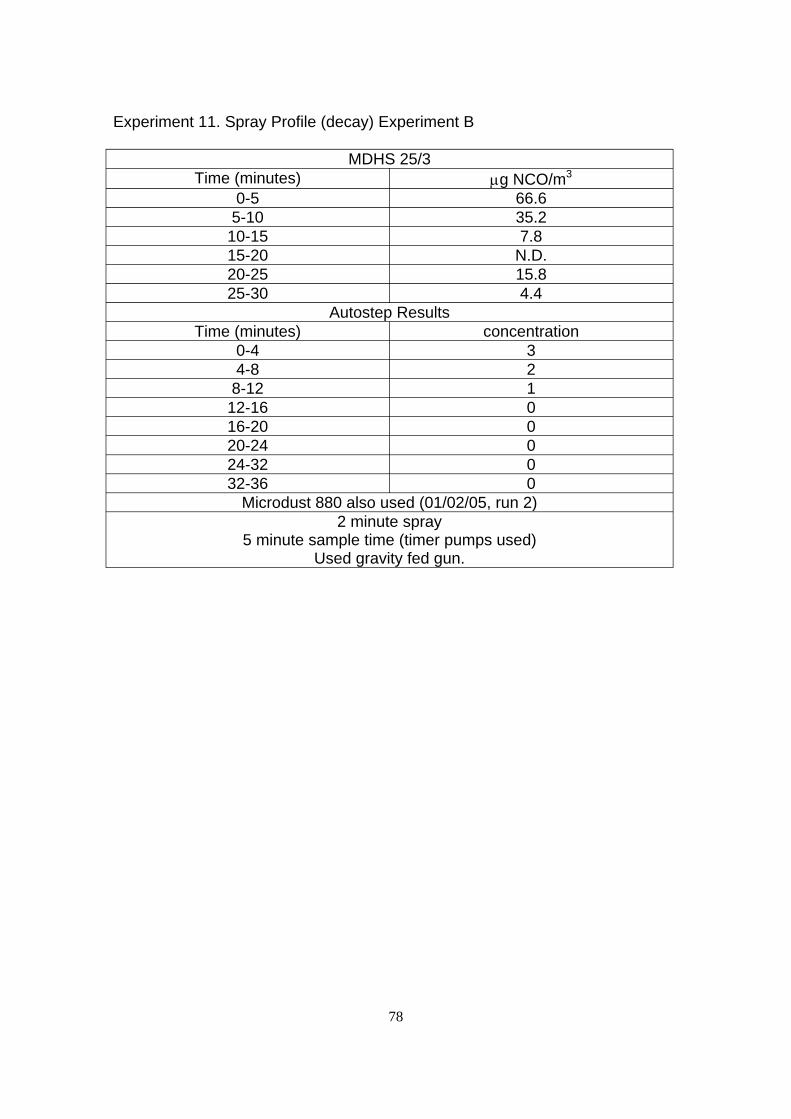
Experiment 11. Spray Profile (decay) Experiment B
MDHS 25/3 Time (minutes) µg NCO/m3
0-5 66.6 5-10 35.2 10-15 7.8 15-20 N.D. 20-25 15.8 25-30 4.4
Autostep Results Time (minutes) concentration
0-4 3 4-8 2
8-12 1 12-16 0 16-20 0 20-24 0 24-32 0 32-36 0
Microdust 880 also used (01/02/05, run 2) 2 minute spray
5 minute sample time (timer pumps used) Used gravity fed gun.
78
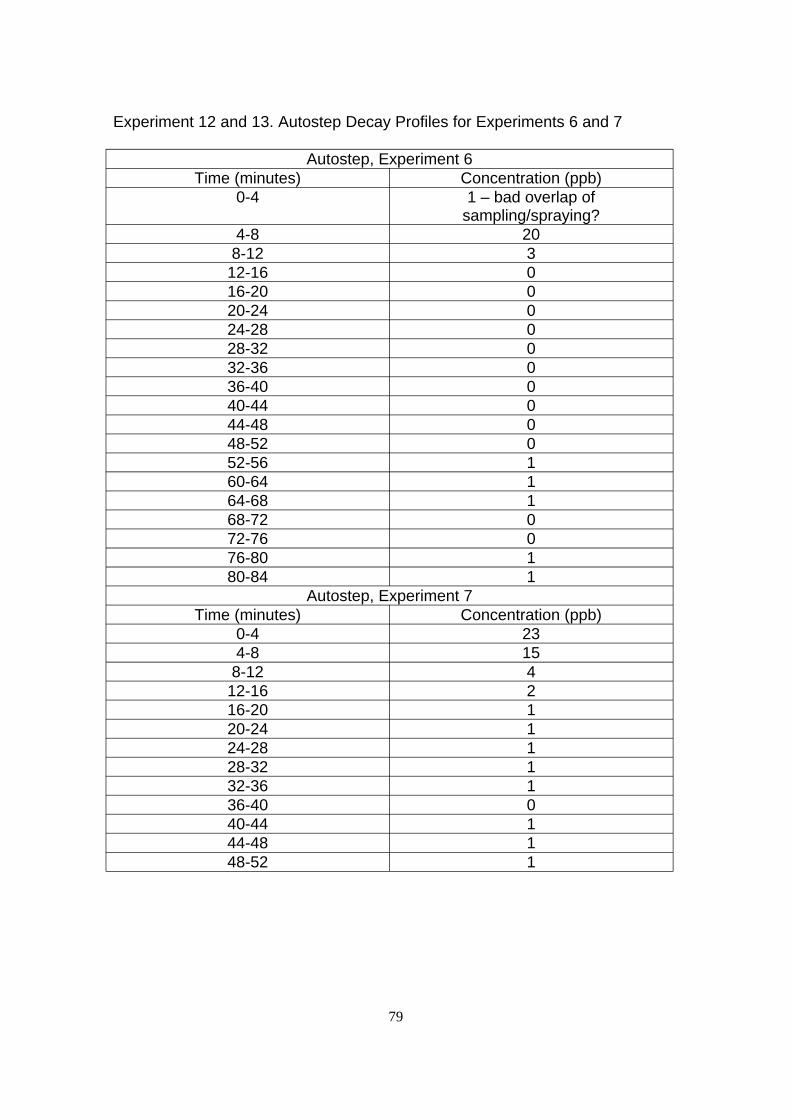
Experiment 12 and 13. Autostep Decay Profiles for Experiments 6 and 7
Autostep, Experiment 6 Time (minutes) Concentration (ppb)
0-4 1 – bad overlap of sampling/spraying?
4-8 20 8-12 3 12-16 0 16-20 0 20-24 0 24-28 0 28-32 0 32-36 0 36-40 0 40-44 0 44-48 0 48-52 0 52-56 1 60-64 1 64-68 1 68-72 0 72-76 0 76-80 1 80-84 1
Autostep, Experiment 7 Time (minutes) Concentration (ppb)
0-4 23 4-8 15
8-12 4 12-16 2 16-20 1 20-24 1 24-28 1 28-32 1 32-36 1 36-40 0 40-44 1 44-48 1 48-52 1
79
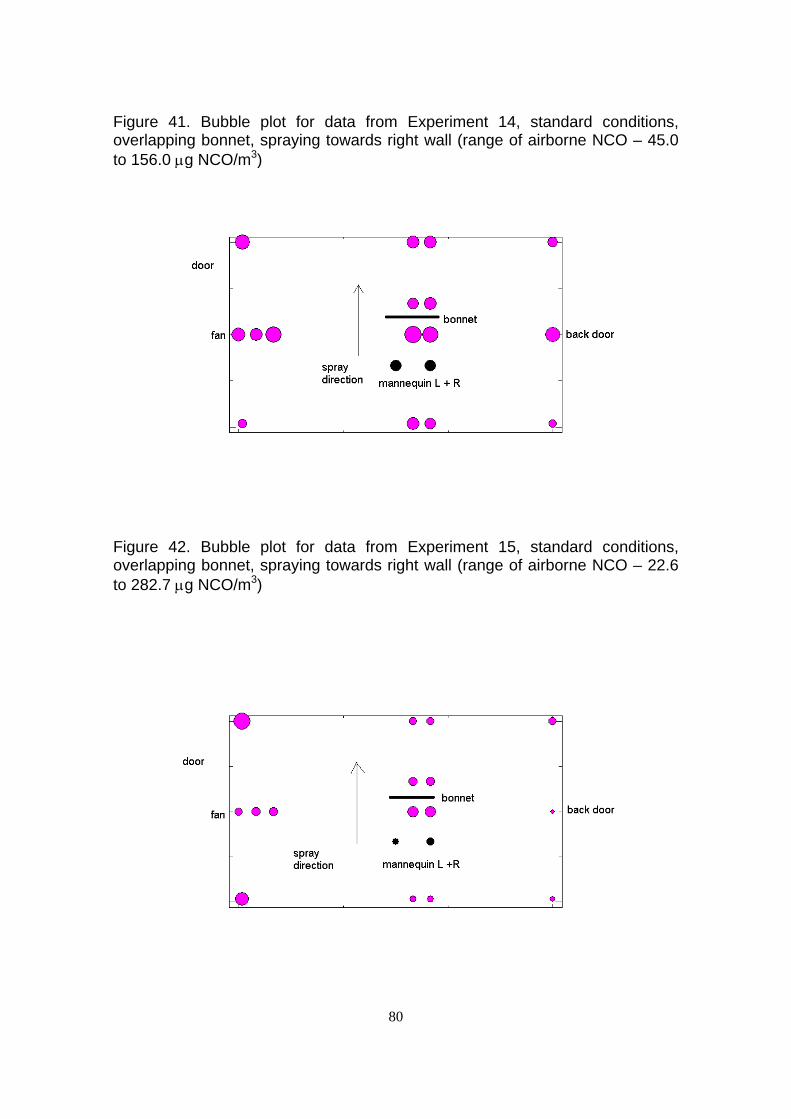
Figure 41. Bubble plot for data from Experiment 14, standard conditions, overlapping bonnet, spraying towards right wall (range of airborne NCO – 45.0 to 156.0 µg NCO/m3)
Figure 42. Bubble plot for data from Experiment 15, standard conditions, overlapping bonnet, spraying towards right wall (range of airborne NCO – 22.6 to 282.7 µg NCO/m3)
80
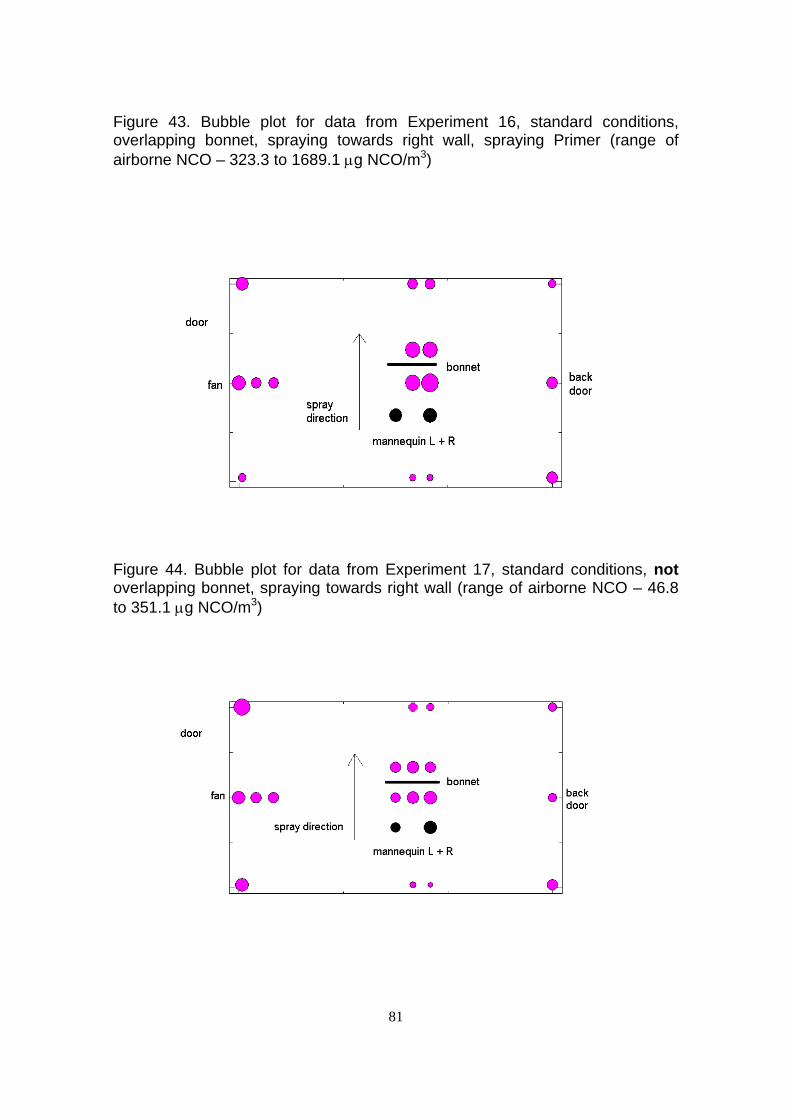
Figure 43. Bubble plot for data from Experiment 16, standard conditions, overlapping bonnet, spraying towards right wall, spraying Primer (range of airborne NCO – 323.3 to 1689.1 µg NCO/m3)
Figure 44. Bubble plot for data from Experiment 17, standard conditions, not overlapping bonnet, spraying towards right wall (range of airborne NCO – 46.8 to 351.1 µg NCO/m3)
81
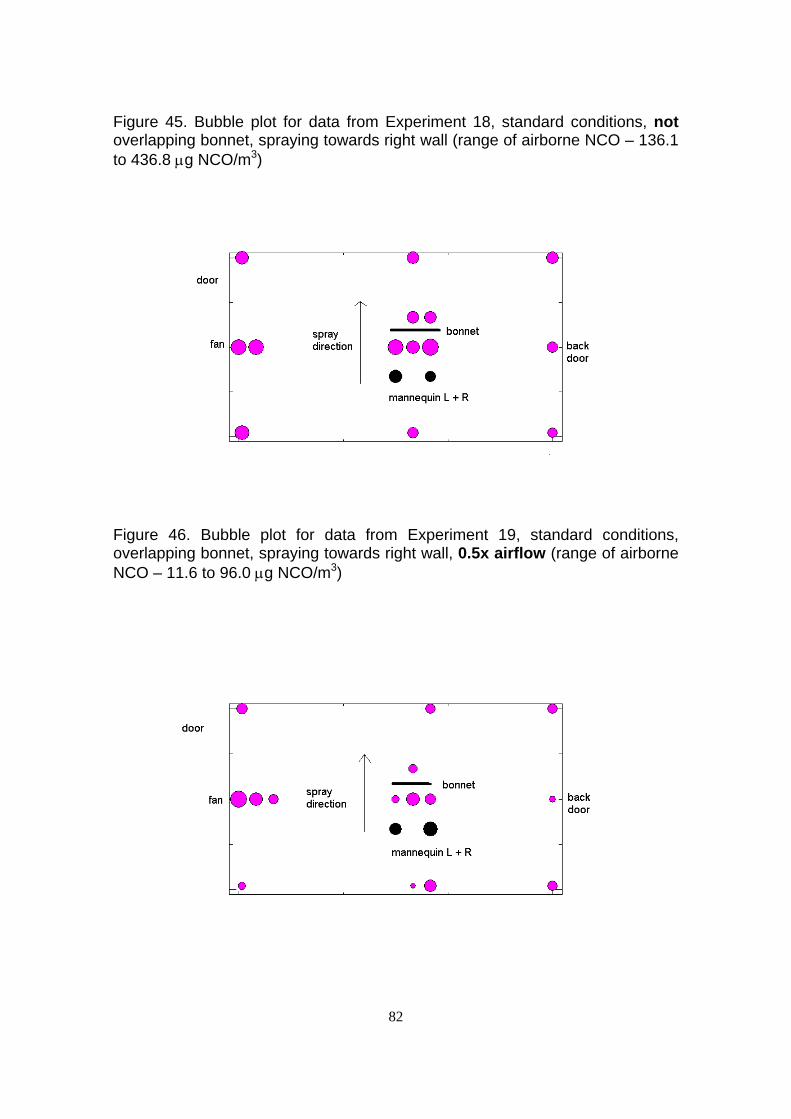
Figure 45. Bubble plot for data from Experiment 18, standard conditions, not overlapping bonnet, spraying towards right wall (range of airborne NCO – 136.1 to 436.8 µg NCO/m3)
Figure 46. Bubble plot for data from Experiment 19, standard conditions, overlapping bonnet, spraying towards right wall, 0.5x airflow (range of airborne NCO – 11.6 to 96.0 µg NCO/m3)
82
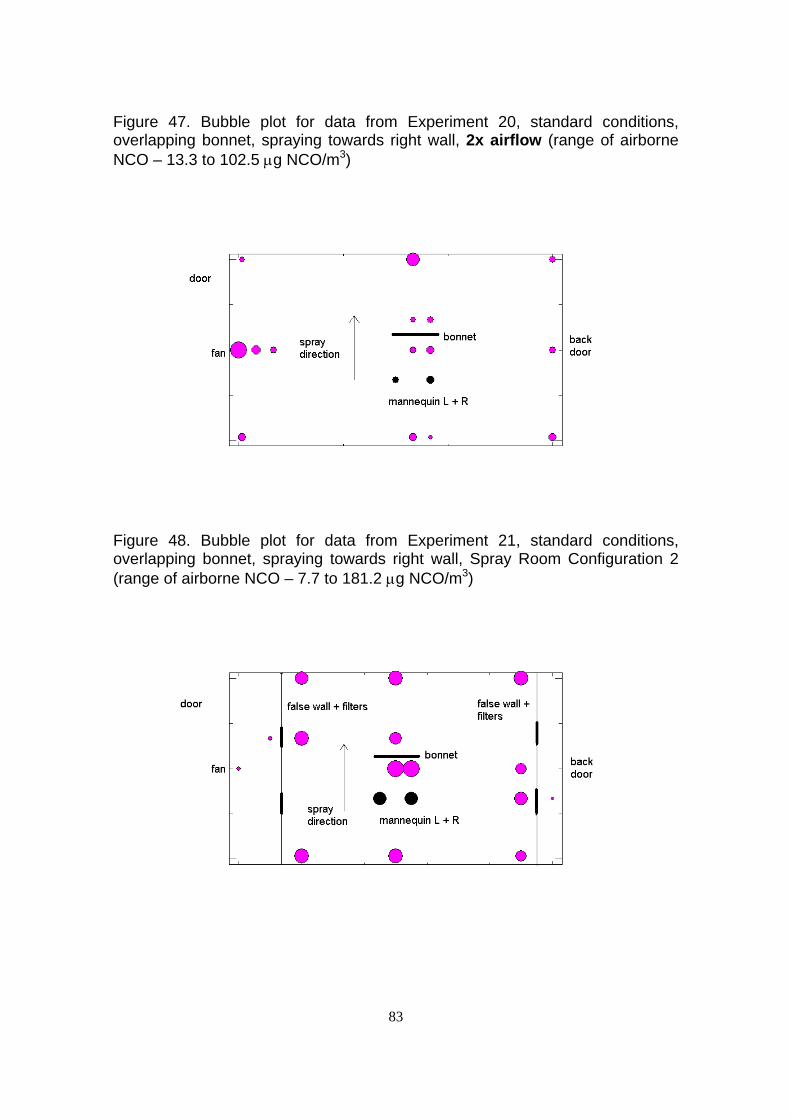
Figure 47. Bubble plot for data from Experiment 20, standard conditions, overlapping bonnet, spraying towards right wall, 2x airflow (range of airborne NCO – 13.3 to 102.5 µg NCO/m3)
Figure 48. Bubble plot for data from Experiment 21, standard conditions, overlapping bonnet, spraying towards right wall, Spray Room Configuration 2 (range of airborne NCO – 7.7 to 181.2 µg NCO/m3)
83
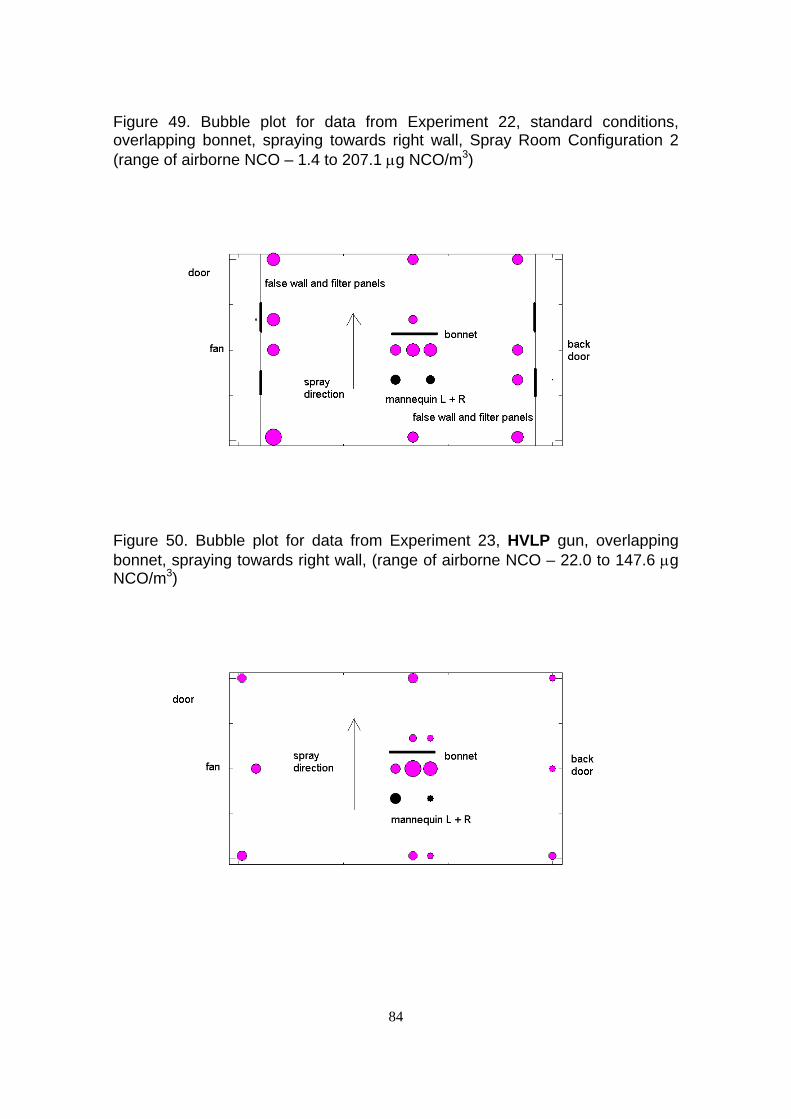
Figure 49. Bubble plot for data from Experiment 22, standard conditions, overlapping bonnet, spraying towards right wall, Spray Room Configuration 2 (range of airborne NCO – 1.4 to 207.1 µg NCO/m3)
Figure 50. Bubble plot for data from Experiment 23, HVLP gun, overlapping bonnet, spraying towards right wall, (range of airborne NCO – 22.0 to 147.6 µg NCO/m3)
84
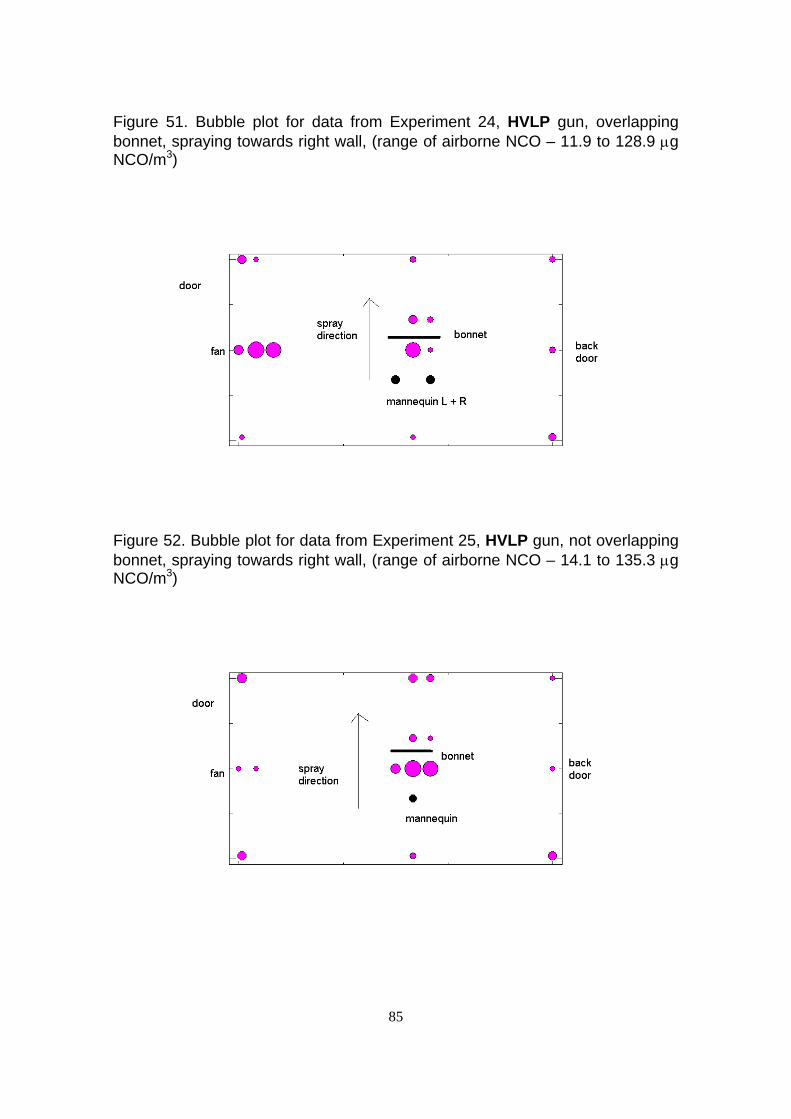
Figure 51. Bubble plot for data from Experiment 24, HVLP gun, overlapping bonnet, spraying towards right wall, (range of airborne NCO – 11.9 to 128.9 µg NCO/m3)
Figure 52. Bubble plot for data from Experiment 25, HVLP gun, not overlapping bonnet, spraying towards right wall, (range of airborne NCO – 14.1 to 135.3 µg NCO/m3)
85
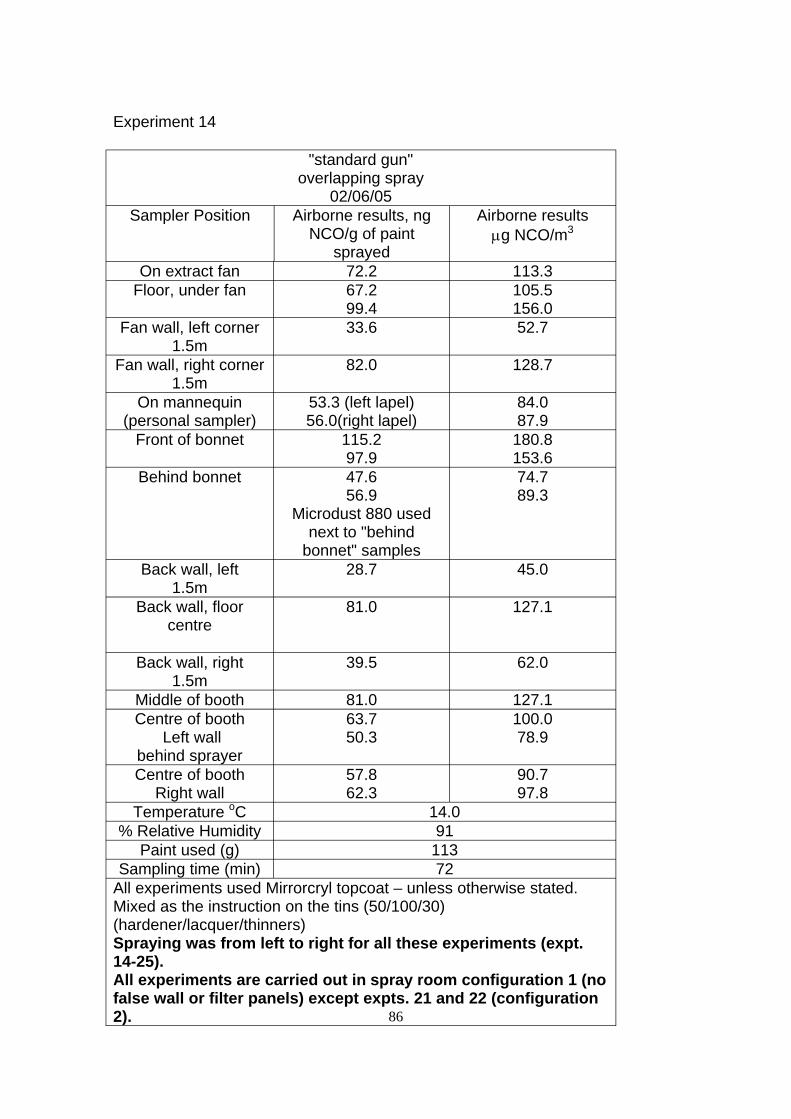
Experiment 14
"standard gun" overlapping spray
02/06/05 Sampler Position Airborne results, ng
NCO/g of paint sprayed
Airborne results µg NCO/m3
On extract fan 72.2 113.3 Floor, under fan 67.2
99.4 105.5 156.0
Fan wall, left corner 1.5m
33.6 52.7
Fan wall, right corner 1.5m
82.0 128.7
On mannequin (personal sampler)
53.3 (left lapel) 56.0(right lapel)
84.0 87.9
Front of bonnet 115.2 97.9
180.8 153.6
Behind bonnet 47.6 56.9
Microdust 880 used next to "behind
bonnet" samples
74.7 89.3
Back wall, left 1.5m
28.7 45.0
Back wall, floor centre
81.0 127.1
Back wall, right 1.5m
39.5 62.0
Middle of booth 81.0 127.1 Centre of booth
Left wall behind sprayer
63.7 50.3
100.0 78.9
Centre of booth Right wall
57.8 62.3
90.7 97.8
Temperature oC 14.0 % Relative Humidity 91
Paint used (g) 113 Sampling time (min) 72
86
All experiments used Mirrorcryl topcoat – unless otherwise stated. Mixed as the instruction on the tins (50/100/30) (hardener/lacquer/thinners) Spraying was from left to right for all these experiments (expt. 14-25). All experiments are carried out in spray room configuration 1 (no false wall or filter panels) except expts. 21 and 22 (configuration 2).
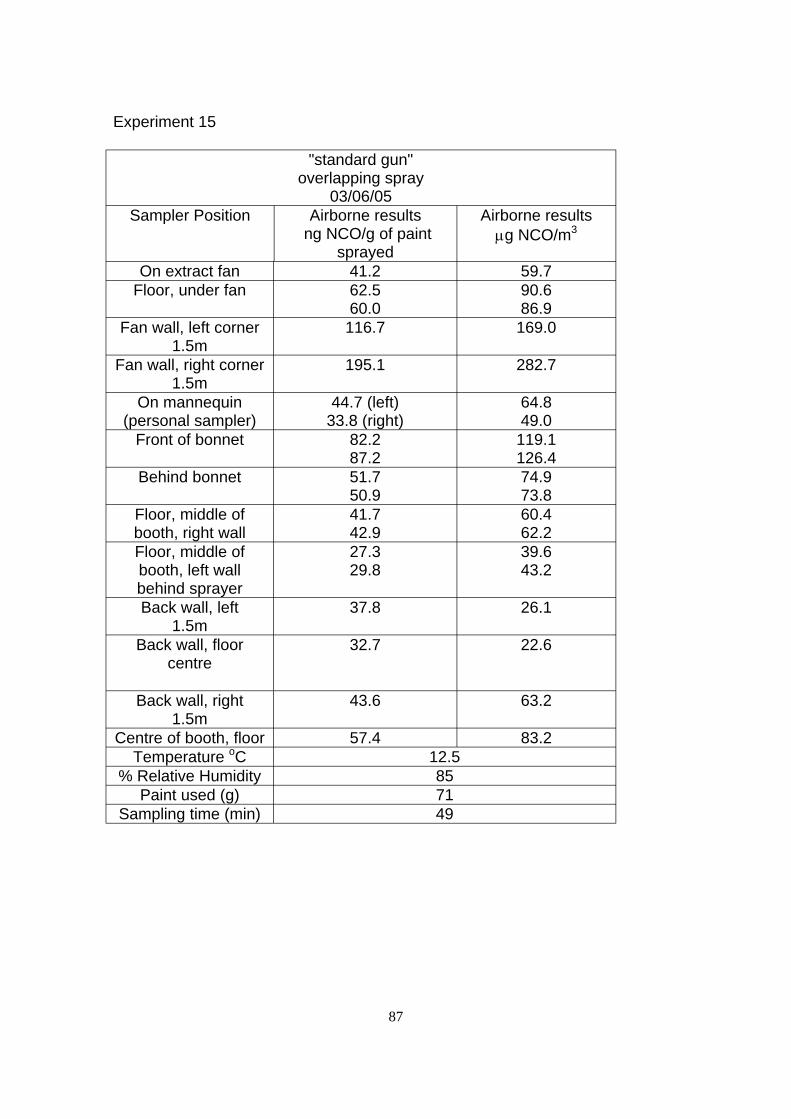
Experiment 15
"standard gun" overlapping spray
03/06/05 Sampler Position Airborne results
ng NCO/g of paint sprayed
Airborne results µg NCO/m3
On extract fan 41.2 59.7 Floor, under fan 62.5 90.6
60.0 86.9 Fan wall, left corner 116.7 169.0
1.5m Fan wall, right corner 195.1 282.7
1.5m On mannequin 44.7 (left) 64.8
(personal sampler) 33.8 (right) 49.0 Front of bonnet 82.2 119.1
87.2 126.4 Behind bonnet 51.7 74.9
50.9 73.8 Floor, middle of 41.7 60.4 booth, right wall 42.9 62.2 Floor, middle of 27.3 39.6 booth, left wall 29.8 43.2 behind sprayer Back wall, left 37.8 26.1
1.5m Back wall, floor 32.7 22.6
centre
Back wall, right 43.6 63.2 1.5m
Centre of booth, floor 57.4 83.2 Temperature oC 12.5
% Relative Humidity 85 Paint used (g) 71
Sampling time (min) 49
87
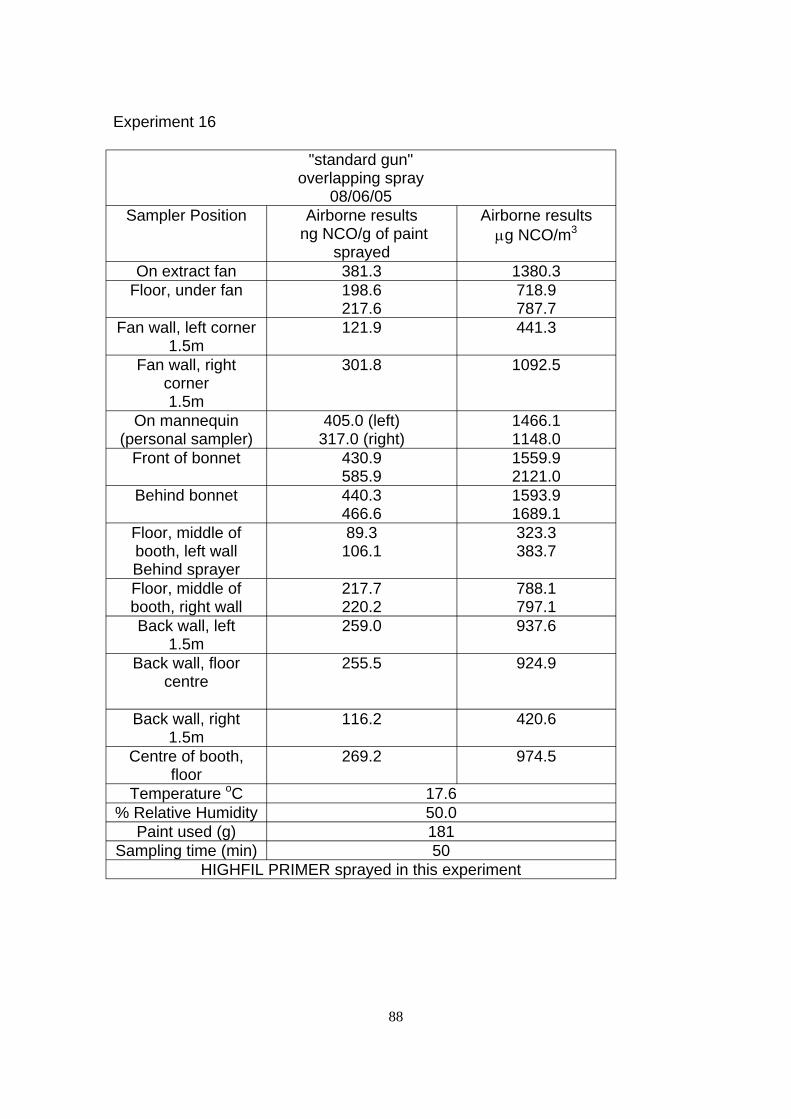
Experiment 16
"standard gun" overlapping spray
08/06/05 Sampler Position Airborne results
ng NCO/g of paint sprayed
Airborne results µg NCO/m3
On extract fan 381.3 1380.3 Floor, under fan 198.6
217.6 718.9 787.7
Fan wall, left corner 1.5m
121.9 441.3
Fan wall, right corner 1.5m
301.8 1092.5
On mannequin (personal sampler)
405.0 (left) 317.0 (right)
1466.1 1148.0
Front of bonnet 430.9 585.9
1559.9 2121.0
Behind bonnet 440.3 466.6
1593.9 1689.1
Floor, middle of booth, left wall Behind sprayer
89.3 106.1
323.3 383.7
Floor, middle of booth, right wall
217.7 220.2
788.1 797.1
Back wall, left 1.5m
259.0 937.6
Back wall, floor centre
255.5 924.9
Back wall, right 1.5m
116.2 420.6
Centre of booth, floor
269.2 974.5
Temperature oC 17.6 % Relative Humidity 50.0
Paint used (g) 181 Sampling time (min) 50
HIGHFIL PRIMER sprayed in this experiment
88
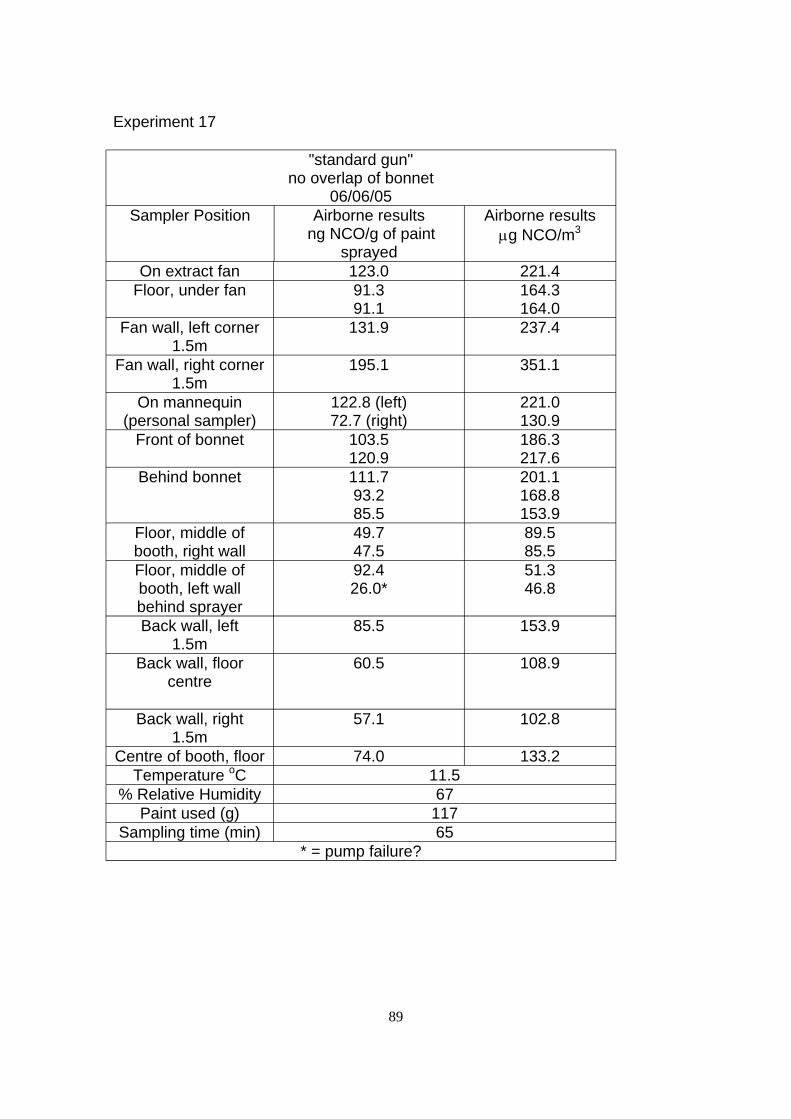
Experiment 17
"standard gun" no overlap of bonnet
06/06/05 Sampler Position Airborne results
ng NCO/g of paint sprayed
Airborne results µg NCO/m3
On extract fan 123.0 221.4 Floor, under fan 91.3 164.3
91.1 164.0 Fan wall, left corner 131.9 237.4
1.5m Fan wall, right corner 195.1 351.1
1.5m On mannequin 122.8 (left) 221.0
(personal sampler) 72.7 (right) 130.9 Front of bonnet 103.5 186.3
120.9 217.6 Behind bonnet 111.7 201.1
93.2 168.8 85.5 153.9
Floor, middle of 49.7 89.5 booth, right wall 47.5 85.5 Floor, middle of 92.4 51.3 booth, left wall 26.0* 46.8 behind sprayer Back wall, left 85.5 153.9
1.5m Back wall, floor 60.5 108.9
centre
Back wall, right 57.1 102.8 1.5m
Centre of booth, floor 74.0 133.2 Temperature oC 11.5
% Relative Humidity 67 Paint used (g) 117
Sampling time (min) 65 * = pump failure?
89
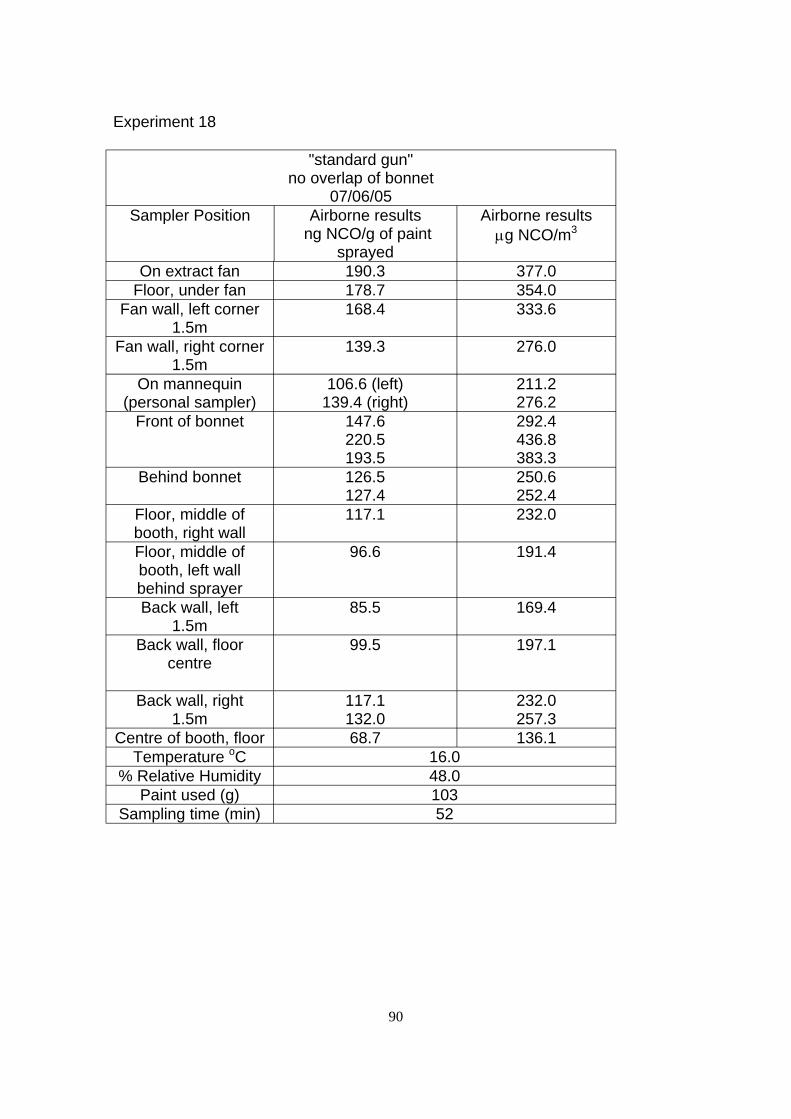
Experiment 18
"standard gun" no overlap of bonnet
07/06/05 Sampler Position Airborne results
ng NCO/g of paint sprayed
Airborne results µg NCO/m3
On extract fan 190.3 377.0 Floor, under fan 178.7 354.0
Fan wall, left corner 168.4 333.6 1.5m
Fan wall, right corner 139.3 276.0 1.5m
On mannequin 106.6 (left) 211.2 (personal sampler) 139.4 (right) 276.2
Front of bonnet 147.6 292.4 220.5 436.8 193.5 383.3
Behind bonnet 126.5 250.6 127.4 252.4
Floor, middle of 117.1 232.0 booth, right wall Floor, middle of 96.6 191.4 booth, left wall behind sprayer Back wall, left 85.5 169.4
1.5m Back wall, floor 99.5 197.1
centre
Back wall, right 117.1 232.0 1.5m 132.0 257.3
Centre of booth, floor 68.7 136.1 Temperature oC 16.0
% Relative Humidity 48.0 Paint used (g) 103
Sampling time (min) 52
90
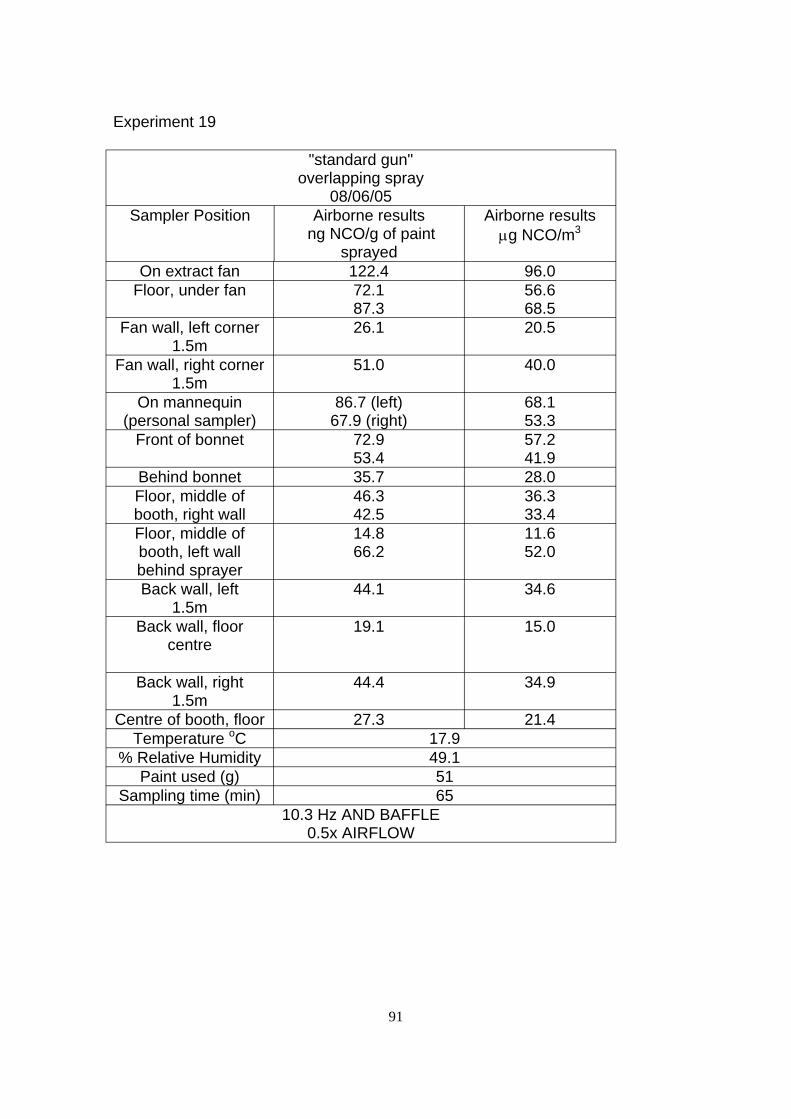
Experiment 19
"standard gun" overlapping spray
08/06/05 Sampler Position Airborne results
ng NCO/g of paint sprayed
Airborne results µg NCO/m3
On extract fan 122.4 96.0 Floor, under fan 72.1 56.6
87.3 68.5 Fan wall, left corner 26.1 20.5
1.5m Fan wall, right corner 51.0 40.0
1.5m On mannequin 86.7 (left) 68.1
(personal sampler) 67.9 (right) 53.3 Front of bonnet 72.9 57.2
53.4 41.9 Behind bonnet 35.7 28.0 Floor, middle of 46.3 36.3 booth, right wall 42.5 33.4 Floor, middle of 14.8 11.6 booth, left wall 66.2 52.0 behind sprayer Back wall, left 44.1 34.6
1.5m Back wall, floor 19.1 15.0
centre
Back wall, right 44.4 34.9 1.5m
Centre of booth, floor 27.3 21.4 Temperature oC 17.9
% Relative Humidity 49.1 Paint used (g) 51
Sampling time (min) 65 10.3 Hz AND BAFFLE
0.5x AIRFLOW
91
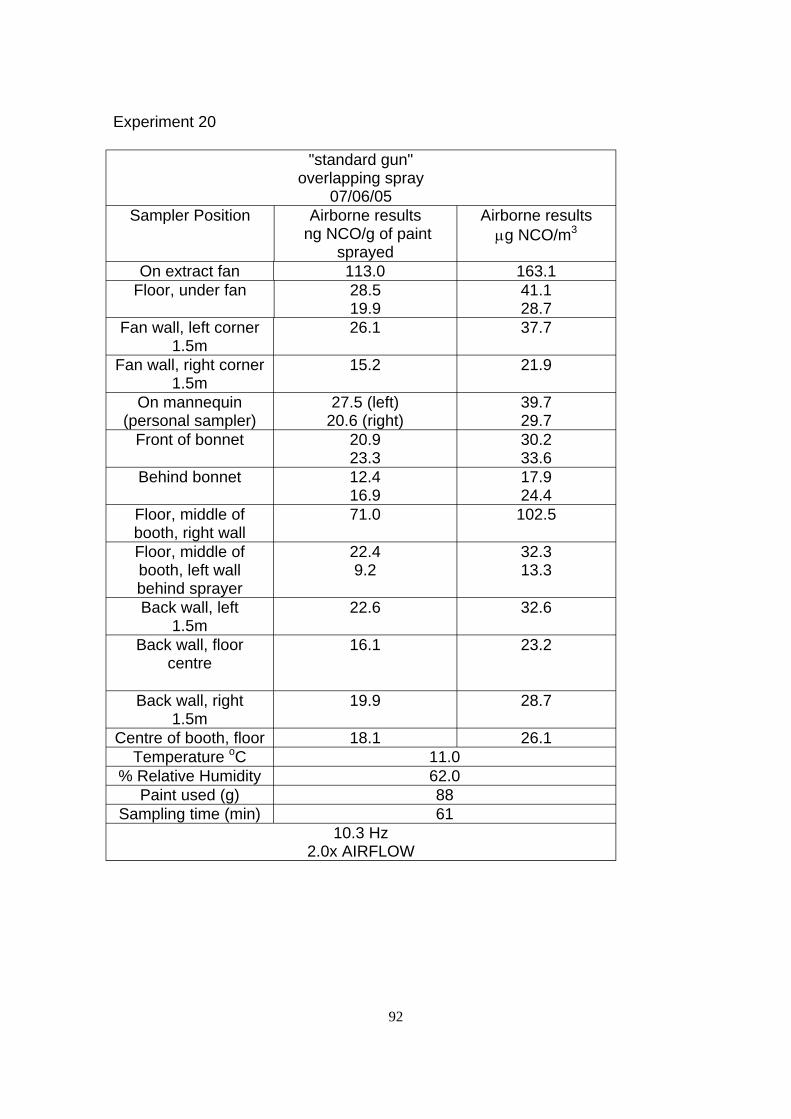
Experiment 20
"standard gun" overlapping spray
07/06/05 Sampler Position Airborne results
ng NCO/g of paint sprayed
Airborne results µg NCO/m3
On extract fan 113.0 163.1 Floor, under fan 28.5 41.1
19.9 28.7 Fan wall, left corner 26.1 37.7
1.5m Fan wall, right corner 15.2 21.9
1.5m On mannequin 27.5 (left) 39.7
(personal sampler) 20.6 (right) 29.7 Front of bonnet 20.9 30.2
23.3 33.6 Behind bonnet 12.4 17.9
16.9 24.4 Floor, middle of 71.0 102.5 booth, right wall Floor, middle of 22.4 32.3 booth, left wall 9.2 13.3 behind sprayer Back wall, left 22.6 32.6
1.5m Back wall, floor 16.1 23.2
centre
Back wall, right 19.9 28.7 1.5m
Centre of booth, floor 18.1 26.1 Temperature oC 11.0
% Relative Humidity 62.0 Paint used (g) 88
Sampling time (min) 61 10.3 Hz
2.0x AIRFLOW
92
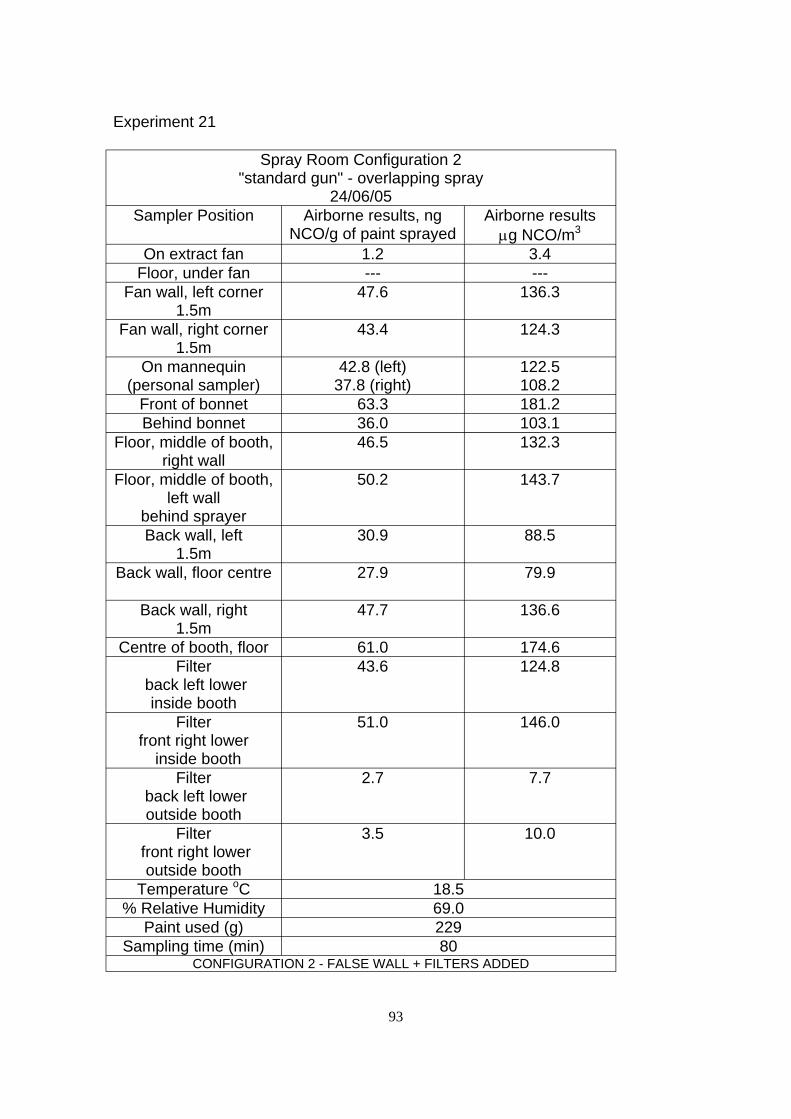
--- ---
Experiment 21
Spray Room Configuration 2 "standard gun" - overlapping spray
24/06/05 Sampler Position Airborne results, ng
NCO/g of paint sprayed Airborne results
µg NCO/m3
On extract fan 1.2 3.4 Floor, under fan
Fan wall, left corner 1.5m
47.6 136.3
Fan wall, right corner 1.5m
43.4 124.3
On mannequin (personal sampler)
42.8 (left) 37.8 (right)
122.5 108.2
Front of bonnet 63.3 181.2 Behind bonnet 36.0 103.1
Floor, middle of booth, right wall
46.5 132.3
Floor, middle of booth, left wall
behind sprayer
50.2 143.7
Back wall, left 1.5m
30.9 88.5
Back wall, floor centre 27.9 79.9
Back wall, right 1.5m
47.7 136.6
Centre of booth, floor 61.0 174.6 Filter
back left lower inside booth
43.6 124.8
Filter front right lower
inside booth
51.0 146.0
Filter back left lower outside booth
2.7 7.7
Filter front right lower
outside booth
3.5 10.0
Temperature oC 18.5 % Relative Humidity 69.0
Paint used (g) 229 Sampling time (min) 80
CONFIGURATION 2 - FALSE WALL + FILTERS ADDED
93
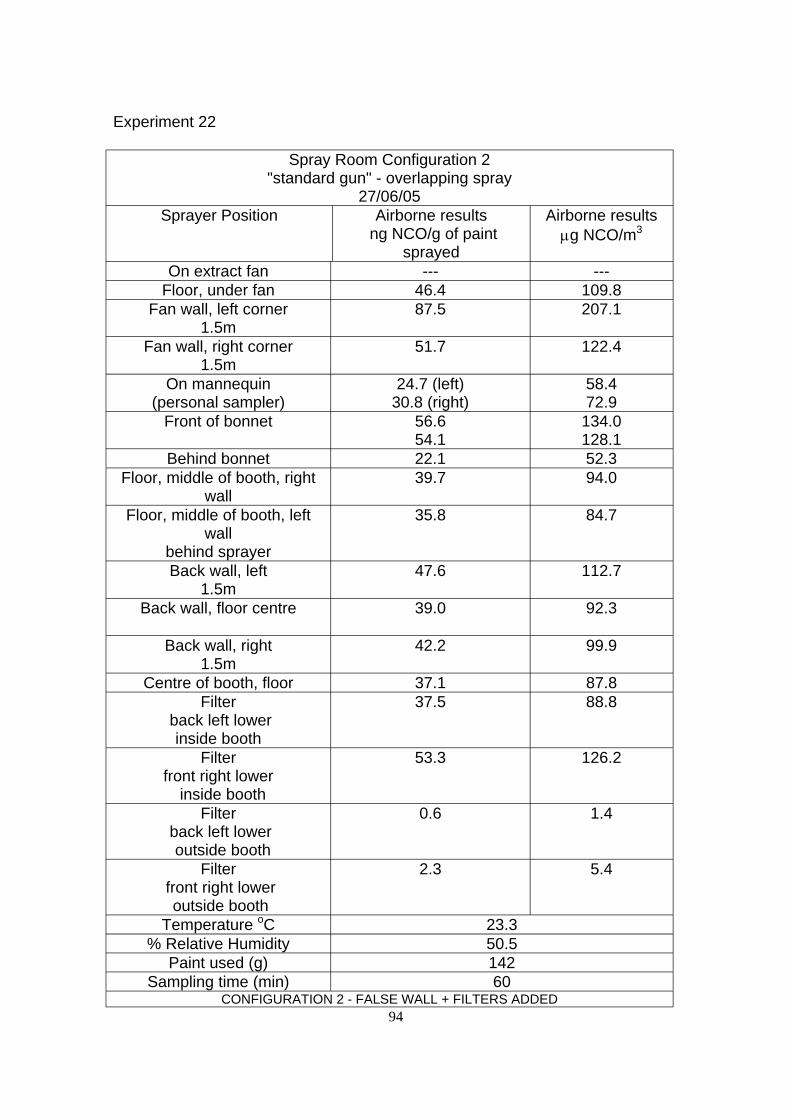
--- ---
Experiment 22
Spray Room Configuration 2 "standard gun" - overlapping spray
27/06/05 Sprayer Position Airborne results
ng NCO/g of paint sprayed
Airborne results µg NCO/m3
On extract fan Floor, under fan 46.4 109.8
Fan wall, left corner 1.5m
87.5 207.1
Fan wall, right corner 1.5m
51.7 122.4
On mannequin (personal sampler)
24.7 (left) 30.8 (right)
58.4 72.9
Front of bonnet 56.6 54.1
134.0 128.1
Behind bonnet 22.1 52.3 Floor, middle of booth, right
wall 39.7 94.0
Floor, middle of booth, left wall
behind sprayer
35.8 84.7
Back wall, left 1.5m
47.6 112.7
Back wall, floor centre 39.0 92.3
Back wall, right 1.5m
42.2 99.9
Centre of booth, floor 37.1 87.8 Filter
back left lower inside booth
37.5 88.8
Filter front right lower
inside booth
53.3 126.2
Filter back left lower outside booth
0.6 1.4
Filter front right lower
outside booth
2.3 5.4
Temperature oC 23.3 % Relative Humidity 50.5
Paint used (g) 142 Sampling time (min) 60
CONFIGURATION 2 - FALSE WALL + FILTERS ADDED 94
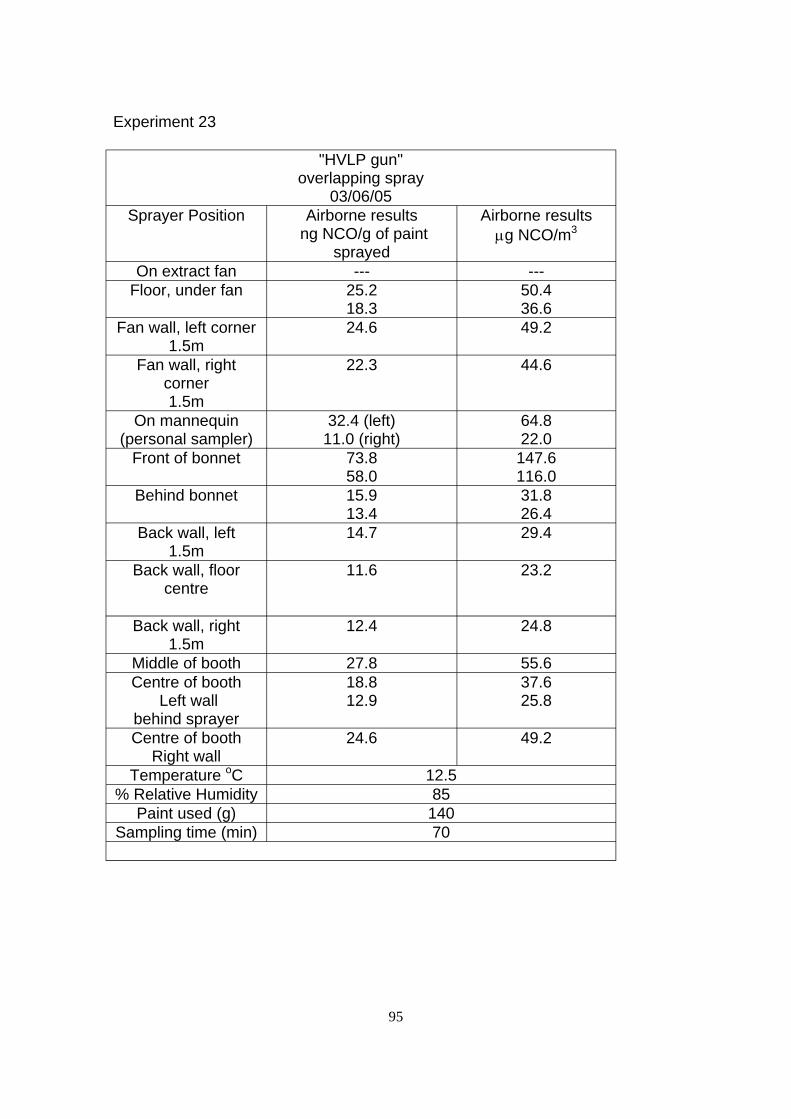
--- ---
Experiment 23
"HVLP gun" overlapping spray
03/06/05 Sprayer Position Airborne results
ng NCO/g of paint sprayed
Airborne results µg NCO/m3
On extract fan Floor, under fan 25.2 50.4
18.3 36.6 Fan wall, left corner 24.6 49.2
1.5m Fan wall, right 22.3 44.6
corner 1.5m
On mannequin 32.4 (left) 64.8 (personal sampler) 11.0 (right) 22.0
Front of bonnet 73.8 147.6 58.0 116.0
Behind bonnet 15.9 31.8 13.4 26.4
Back wall, left 14.7 29.4 1.5m
Back wall, floor 11.6 23.2 centre
Back wall, right 12.4 24.8 1.5m
Middle of booth 27.8 55.6 Centre of booth 18.8 37.6
Left wall 12.9 25.8 behind sprayer Centre of booth 24.6 49.2
Right wall Temperature oC 12.5
% Relative Humidity 85 Paint used (g) 140
Sampling time (min) 70
95

Experiment 24
Sprayer Position "HVLP gun"
no overlap of bonnet 09/06/05
Sprayer Position Airborne results ng NCO/g of paint
sprayed
Airborne results µg NCO/m3
On extract fan 19.4 44.3 Floor, under fan 56.5 128.9
50.4 115.0 Fan wall, left corner 7.4 16.9
1.5m Fan wall, right corner 16.8 38.3
1.5m On mannequin 16.0 (left) 36.5
(personal sampler) 16.6 (right) 37.9 Front of bonnet 50.6 115.4 Behind bonnet 15.1 34.4
10.1 23.0 Back wall, left 11.5 26.2
1.5m Back wall, floor 9.1 20.8
centre
Back wall, right 9.8 22.4 1.5m
Middle of booth 7.2 16.4 Centre of booth 5.2 11.9
Left wall behind sprayer Centre of booth 9.4 21.4
Right wall 6.7 15.3 Temperature oC 21.6
% Relative Humidity 52.4 Paint used (g) 130
Sampling time (min) 57
96
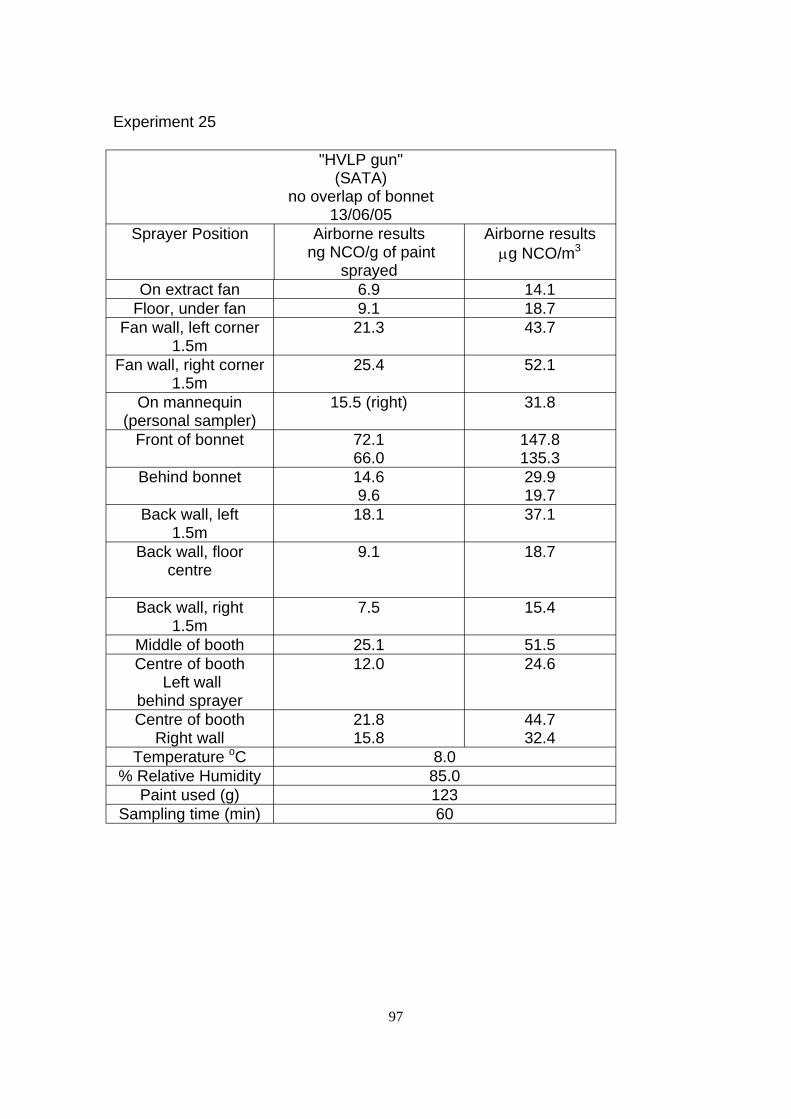
Experiment 25
"HVLP gun" (SATA)
no overlap of bonnet 13/06/05
Sprayer Position Airborne results ng NCO/g of paint
sprayed
Airborne results µg NCO/m3
On extract fan 6.9 14.1 Floor, under fan 9.1 18.7
Fan wall, left corner 1.5m
21.3 43.7
Fan wall, right corner 1.5m
25.4 52.1
On mannequin (personal sampler)
15.5 (right) 31.8
Front of bonnet 72.1 66.0
147.8 135.3
Behind bonnet 14.6 9.6
29.9 19.7
Back wall, left 1.5m
18.1 37.1
Back wall, floor centre
9.1 18.7
Back wall, right 1.5m
7.5 15.4
Middle of booth 25.1 51.5 Centre of booth
Left wall behind sprayer
12.0 24.6
Centre of booth Right wall
21.8 15.8
44.7 32.4
Temperature oC 8.0 % Relative Humidity 85.0
Paint used (g) 123 Sampling time (min) 60
97
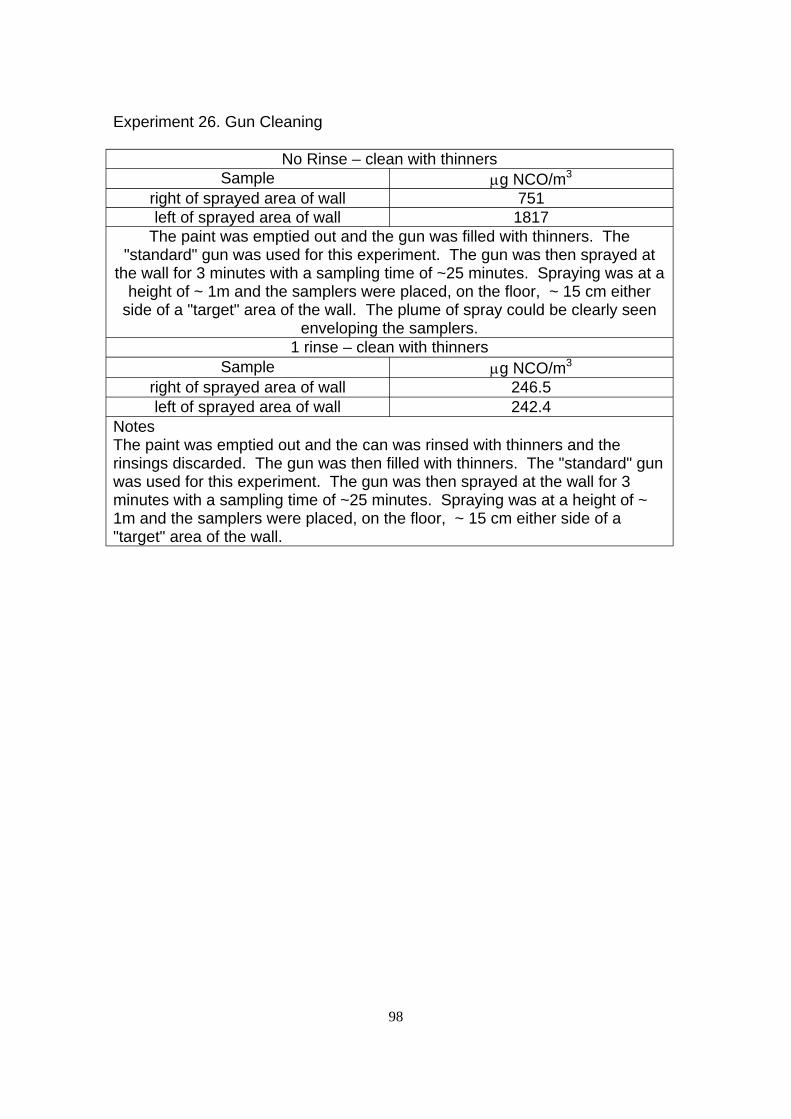
Experiment 26. Gun Cleaning
No Rinse – clean with thinners Sample µg NCO/m3
right of sprayed area of wall 751 left of sprayed area of wall 1817
The paint was emptied out and the gun was filled with thinners. The "standard" gun was used for this experiment. The gun was then sprayed at
the wall for 3 minutes with a sampling time of ~25 minutes. Spraying was at a height of ~ 1m and the samplers were placed, on the floor, ~ 15 cm either
side of a "target" area of the wall. The plume of spray could be clearly seen enveloping the samplers.
1 rinse – clean with thinners Sample µg NCO/m3
right of sprayed area of wall 246.5 left of sprayed area of wall 242.4
Notes The paint was emptied out and the can was rinsed with thinners and the rinsings discarded. The gun was then filled with thinners. The "standard" gun was used for this experiment. The gun was then sprayed at the wall for 3 minutes with a sampling time of ~25 minutes. Spraying was at a height of ~ 1m and the samplers were placed, on the floor, ~ 15 cm either side of a "target" area of the wall.
98
6.3 APPENDIX 3. HSE REPORT ON A VISIT TO A SMALL MVR PREMISES IN WALES
FIELD OPERATIONS DIVISIONAL
SPECIALIST GROUP1 REPORT
DIRECTORATE WALES AND SOUTH WEST
OCCUPATIONAL HYGIENE SECTION
Project on isocyanate exposure in small Motor Vehicle Repair (MVR) premises.
Site Name: XXXXXX
Author: Julie Helps2
HM Specialist Inspector (Occupational Hygiene)
Date: 14th June 2004
1 1Head of Wales and West SG - Mr S Maidment. HSE Government Buildings, Ty Glas, Llanishen, Cardiff,
CF14 5SH Phone 02920 26300 Fax 02920 263120
2 HSE Government Buildings, Ty Glas, Llanishen, Cardiff, CF14 5SH
99
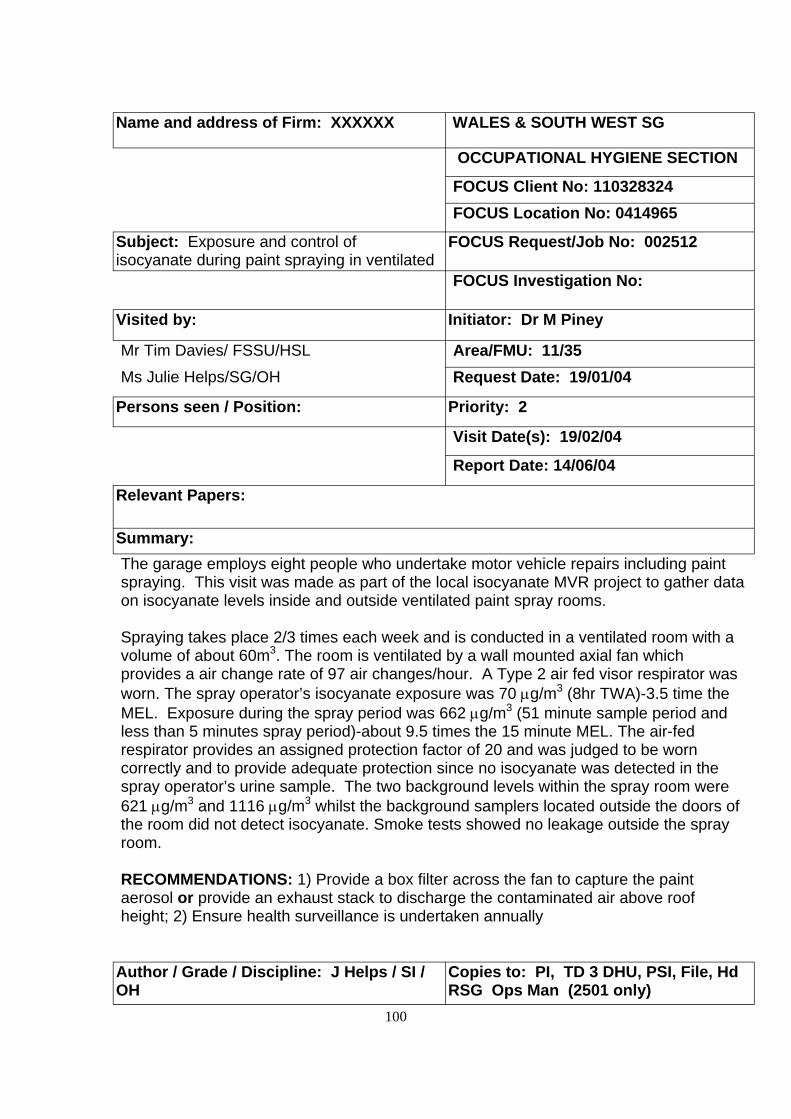
Name and address of Firm: XXXXXX WALES & SOUTH WEST SG � �
OCCUPATIONAL HYGIENE SECTION
FOCUS Client No: 110328324 FOCUS Location No: 0414965
Subject: Exposure and control of isocyanate during paint spraying in ventilated
FOCUS Request/Job No: 002512
FOCUS Investigation No:
Visited by: Initiator: Dr M Piney
Mr Tim Davies/ FSSU/HSL Area/FMU: 11/35 Ms Julie Helps/SG/OH Request Date: 19/01/04
Persons seen / Position: Priority: 2
Visit Date(s): 19/02/04
Report Date: 14/06/04
Relevant Papers:
Summary: The garage employs eight people who undertake motor vehicle repairs including paint spraying. This visit was made as part of the local isocyanate MVR project to gather data on isocyanate levels inside and outside ventilated paint spray rooms.
Spraying takes place 2/3 times each week and is conducted in a ventilated room with a volume of about 60m3. The room is ventilated by a wall mounted axial fan which provides a air change rate of 97 air changes/hour. A Type 2 air fed visor respirator was worn. The spray operator’s isocyanate exposure was 70 µg/m3 (8hr TWA)-3.5 time the MEL. Exposure during the spray period was 662 µg/m3 (51 minute sample period and less than 5 minutes spray period)-about 9.5 times the 15 minute MEL. The air-fed respirator provides an assigned protection factor of 20 and was judged to be worn correctly and to provide adequate protection since no isocyanate was detected in the spray operator’s urine sample. The two background levels within the spray room were 621 µg/m3 and 1116 µg/m3 whilst the background samplers located outside the doors of the room did not detect isocyanate. Smoke tests showed no leakage outside the spray room.
RECOMMENDATIONS: 1) Provide a box filter across the fan to capture the paint aerosol or provide an exhaust stack to discharge the contaminated air above roof height; 2) Ensure health surveillance is undertaken annually
Author / Grade / Discipline: J Helps / SI / Copies to: PI, TD 3 DHU, PSI, File, Hd OH RSG Ops Man (2501 only)
100
1. OBJECTIVES
1. Assess personal and background exposure to isocyanate paints both
within and outside the spray space;
2. Assess effectiveness of spray space ventilation;
3. Assess adequacy, suitability and use of RPE;
4. To consider whether exposure is adequately controlled.
2. PROJECT BACKGROUND
Isocyanate exposure is the biggest single recorded cause of occupational
asthma (OA) in the UK. The occupational group most at risk of contracting
isocyanate-induced OA are paint sprayers particularly those working in Motor
Vehicle Repair (MVR) premises.
In the larger companies that have bespoke spray-booths, exposure may occur
because sprayers do not adopt the correct working practices (often because
they are not told), the respiratory protective equipment (RPE) is inadequate,
some spraying takes place outside the booth on busy days or the spray booth is
faulty. In general, in such companies, the appropriate control hardwear (booths
and air-fed RPE) is in place and although it may not be maintained properly, the
problem is often that it may not be used correctly.
Various studies have been made of isocyanate control measures in MVR and
their effectiveness in large-medium sized companies, but very few in the small-
medium sized companies. The main reasons probably being practicability and
access to small companies. This project is unique in that it is attempting to get a
general view of isocyanate exposure and control measures, and standards of
occupational health surveillance in an important but under-investigated but high
risk group within the MVR industry. In industrial estates where individual units
are side-by-side, it is possible that people in adjacent units are put at risk. Part
of the project will be to assess the exposure of others apart from the sprayers.
The Project has the support of the Engineering Sector and reduction of OA is
one of the HSE’s priority targets.
101
3. HEALTH EFFECTS AND EXPOSURE STANDARDS FOR ISOCYANATE
The levels at which isocyanate can trigger sensitisation are unknown although
there are reports suggesting that peak exposures may be important. The
development of sensitisation may occur within months of exposure or after
years of symptom free exposure. Since a no adverse health effect cannot be
established, isocyanates have been given Maximum Exposure Limits, which are
20 µg/m3 (8 hour TWA) and 70 µg/m3 (15-minute reference period). There is a
lower prevalence of rhinitis, conjunctivitis and bronchitis.
If employees are, or are liable to be, exposed to airborne isocyanate, the
COSHH Regulations require those employees to have suitable health checks
(health surveillance).
4. COMPANY BACKGROUND
The garage employs eight employees excluding the proprietors. Seven men
repair and prepare vehicles for spraying and one employee sprays the vehicles.
The sprayer's basic hours of work are 0800-1700 Monday to Friday with a total
break of about one hour.
5. PROCESSES
The area of interest in this survey was the paint spraying of vehicles, which is
undertaken in a dedicated spray room located in the corner of the garage.
Figures 1 and 2 show the layout and dimensions of the spray room, the
adjacent areas and the position of the wall-mounted fan.
The company frequently remove the body parts that require spraying and mount
the component/s on trestles within the spray room. The area to be sprayed is
wet and dried sanded and wiped down with a solvent to remove any residual
dust. Typically, non- isocyanate based primer and base coat are applied prior
to the application of three coats of two-pack isocyanate based clear lacquer.
The lacquer mix consists of Activator/Hardener (containing HDI isocyanate),
thinner and lacquer all manufactured by Bodyline. The mix is prepared on a 102
table outside the spray room. The throughput of vehicles varies from week to
week but the proprietor estimated that they average four spray jobs per week.
Prior to the start of the spray period, the sprayer prepared the lacquer mix on
the bench outside the side door of the spray room. He then donned his RPE,
entered the spray room and immediately connected his RPE and spray gun to
the compressed airline (located near the door) via the T-piece on his belt. After
applying each coat of paint the operator reversed the process. At the end of the
spray period the operator washed the spray gun with thinner and transferred
the washings to a waste drum.
During the survey a car bonnet and bumper were sprayed. Spraying of each
lacquer coat took about a minute and the operator vacated the spray room for
about 15 minutes between the spraying of each coat.
6.0 CONTROLS
6.1 SPRAY ROOM
Paint spraying is undertaken in the spray room which can be accessed via a
side door or through the double doors at the front (see Figure 1). The
dimensions of the spray room are approximately 6m (length) x 4m (width) x 2.5
m (high) giving a total volume of approximately 60m3. Air enters the room via
gaps around the double doors and is extracted via a wall mounted, axial fan of
area 0.27m2 (located towards the rear right hand corner of the spray room).
The average face velocity at the fan grill (measured using a hot wire
anemometer and a vane anemometer) was about 6m/s. Assuming no naturally
induced general ventilation this gives an air change rate of about 97 air changes
per hour.
The room was leak tested using a smoke generator and no smoke was
detected outside the spray room. This suggests the negative pressure
generated by the fan is sufficient to prevent air escaping from the spray room.
There was no filter fitted across the fan to remove the paint particulate and the
103
discharged air was emitted direct to atmosphere through the wall into the
storage yard (i.e. no stack provided to discharge the contaminated air above
roof height).
6.2 RESPIRATORY PROTECTIVE EQUIPMENT
The sprayer operator wore a Type 2 air fed visor when spraying which provides
an assigned protection factor (APF) of 20. The respirator appeared to be in a
good condition and was stored in a box on a shelf.
7.0 HEALTH SURVEILLANCE AND TRAINING
The sprayer has had health surveillance but I am uncertain whether this is an
annual occurrence. The paint sprayer is experienced and is aware of the
hazards associated with isocyanates and the importance of wearing the air-fed
respirator.
8.0 SAMPLING AND ANALYSIS
Personal air samples were collected from the paint sprayer and the surveyor
and static samples were collected at five locations: two within the spray room;
two in the garage; and one outside the garage, next to the axial fan (see Figure
2). Samples were collected onto an impinger and an impregnated filter in series
at a flow rate of 1 litre/min, in accordance with MDHS 25/3 “Organic
isocyanates in air”. The samples were subsequently analysed by high
performance liquid chromatography, at the HSL in Sheffield.
Urine samples were collected from the sprayer and surveyor to assess the total
body burden of isocyanate. In the case of the sprayer, the purpose was to
demonstrate the effectiveness of the RPE (i.e. if it was being used correctly and
providing an adequate level protection). The samples were analysed for
isocyanate by gas chromatography - mass spectrophotometry at the HSL in
Sheffield.
104
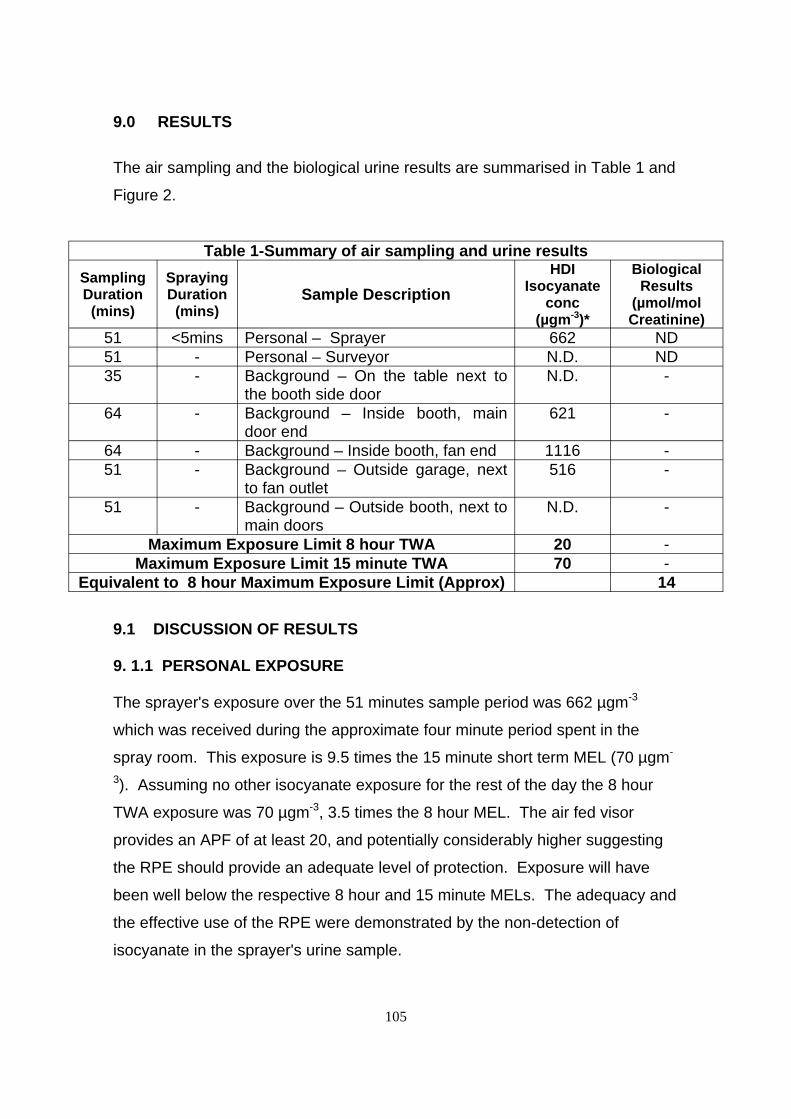
9.0 RESULTS
The air sampling and the biological urine results are summarised in Table 1 and
Figure 2.
Table 1-Summary of air sampling and urine results Sampling Duration
(mins)
Spraying Duration
(mins) Sample Description
HDI Isocyanate
conc (µgm-3)*
Biological Results
(µmol/mol Creatinine)
51 <5mins Personal – Sprayer 662 ND 51 - Personal – Surveyor N.D. ND 35 - Background – On the table next to N.D. -
the booth side door 64 - Background – Inside booth, main 621 -
door end 64 - Background – Inside booth, fan end 1116 -51 - Background – Outside garage, next 516 -
to fan outlet 51 - Background – Outside booth, next to N.D. -
main doors Maximum Exposure Limit 8 hour TWA 20 -
Maximum Exposure Limit 15 minute TWA 70 -Equivalent to 8 hour Maximum Exposure Limit (Approx) 14
9.1 DISCUSSION OF RESULTS
9. 1.1 PERSONAL EXPOSURE
The sprayer's exposure over the 51 minutes sample period was 662 µgm-3
which was received during the approximate four minute period spent in the
spray room. This exposure is 9.5 times the 15 minute short term MEL (70 µgm
3). Assuming no other isocyanate exposure for the rest of the day the 8 hour
TWA exposure was 70 µgm-3, 3.5 times the 8 hour MEL. The air fed visor
provides an APF of at least 20, and potentially considerably higher suggesting
the RPE should provide an adequate level of protection. Exposure will have
been well below the respective 8 hour and 15 minute MELs. The adequacy and
the effective use of the RPE were demonstrated by the non-detection of
isocyanate in the sprayer's urine sample.
105
9.2.2 STATIC RESULTS
The static samplers within the spray room gave results of 621 µgm-3 (corner
near double doors) and 1116 µgm-3 (corner adjacent to fan) whilst the two
samplers located outside the doors of the garage did not detect isocyanate.
The former results indicate that high isocyanate levels were generated within
the spray room whilst the latter results show that there was no leakage outside
the spray room. The surveyor’s personal sampler did not detect isocyanate
which reinforces that there was no leakage outside the spray space. The
sampler located outside the garage, at the outlet from the fan, gave a result of
516µgm-3 demonstrating the fan was effectively removing the aerosol.
10.0 CONCLUSIONS
• The ventilated spray room contained the paint aerosol and vapour within the sprayroom – no isocyanate was detected by the samplers
located outside the spray room and the smoke tests demonstrated no
visible leakage;
• The air fed visor prevented the operator being exposed to isocyanate - no isocyanate was detected in the sprayer's urine sample
indicating that the RPE was worn correctly and offered an adequate level
of protection;
• The isocyanate concentrations within the booth were high –
exposures during the sample period were 662 µgm-3 (personal-9.5 times
the STEL and 3.5 times the LTEL) and 621 µgm-3 and 1116 µgm-3
(background).
11.0 RECOMMENDATIONS
• Provide a box filter across the fan to capture the paint aerosol - to
prevent it from contaminating the external atmosphere and the likelihood
of isocyanate being recirculated into the garage or entering neighbouring
106
workplaces. The filter will also prevent paint being deposited on the fan
blades so avoid imbalance and wear on the fan bearings;
or if the filter significantly reduces the fan’s extract efficiency
• Provide an exhaust stack to discharge the contaminated air above roof height- to dissipate the contaminated air more effectively
minimising exposure and the likelihood of the contaminated air being
recirculated into the garage or entering neighboring workplaces;
• Ensure health surveillance is undertaken annually
Julie Helps H M Specialist Inspector-Occupational Hygiene
107
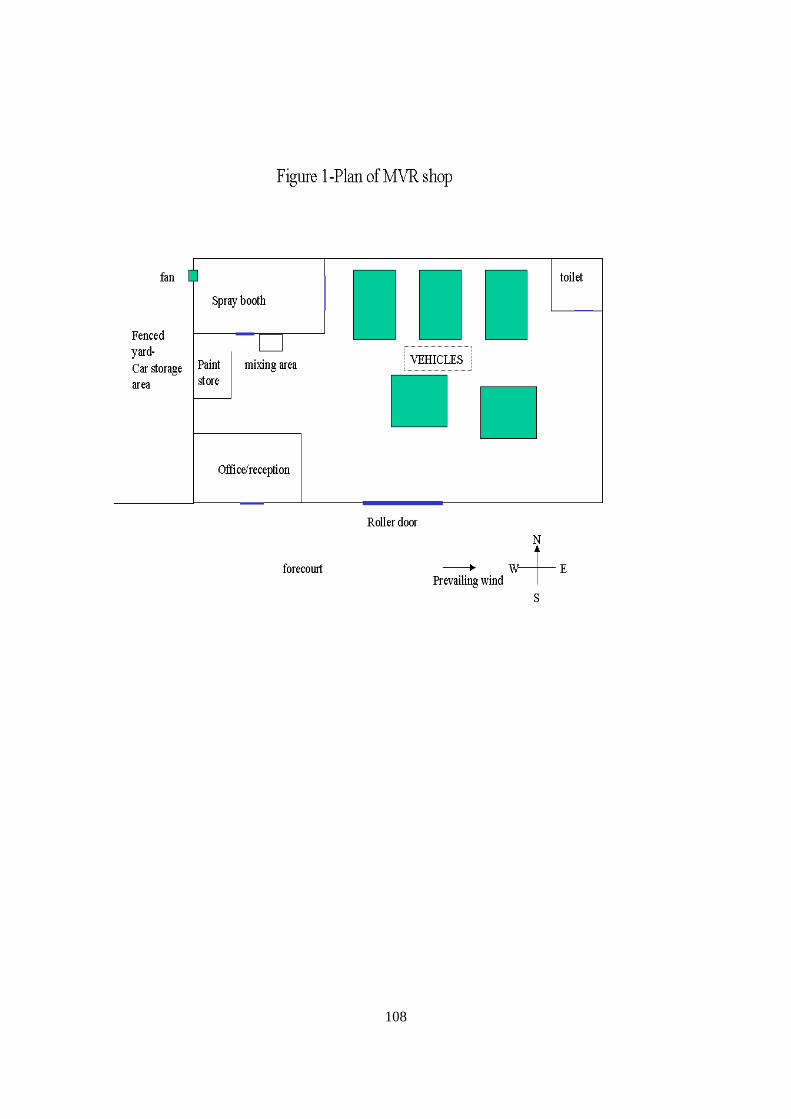
108
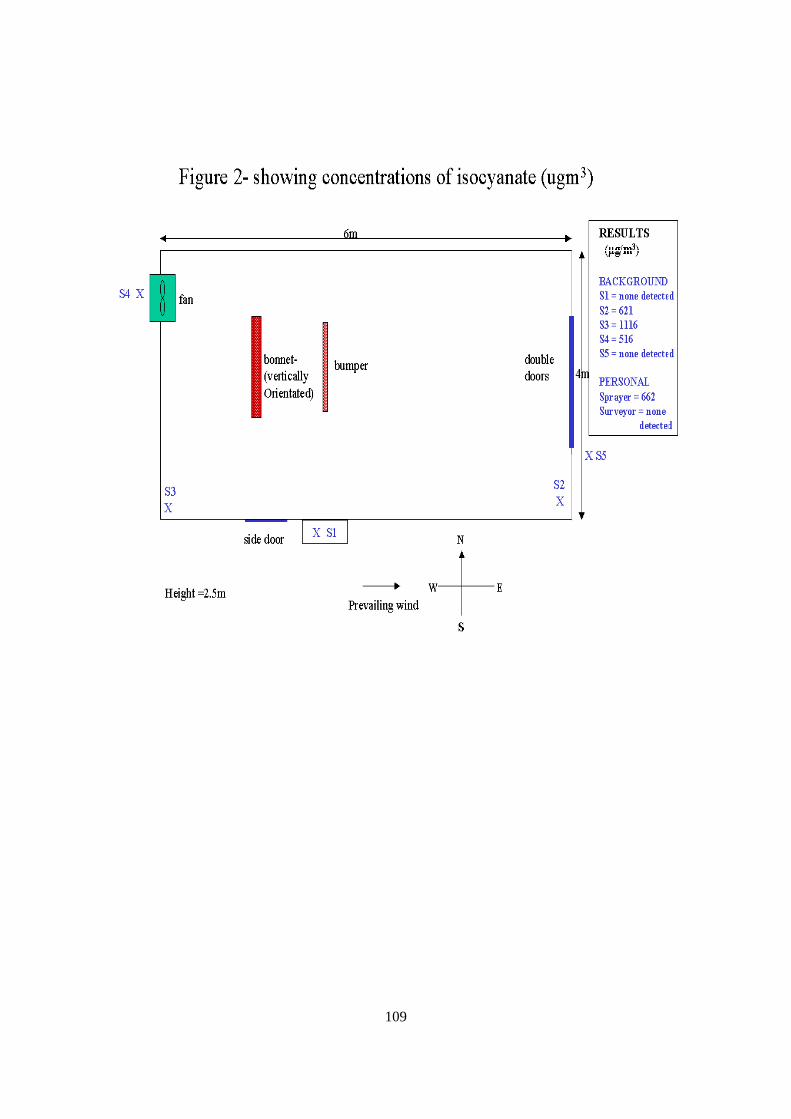
109
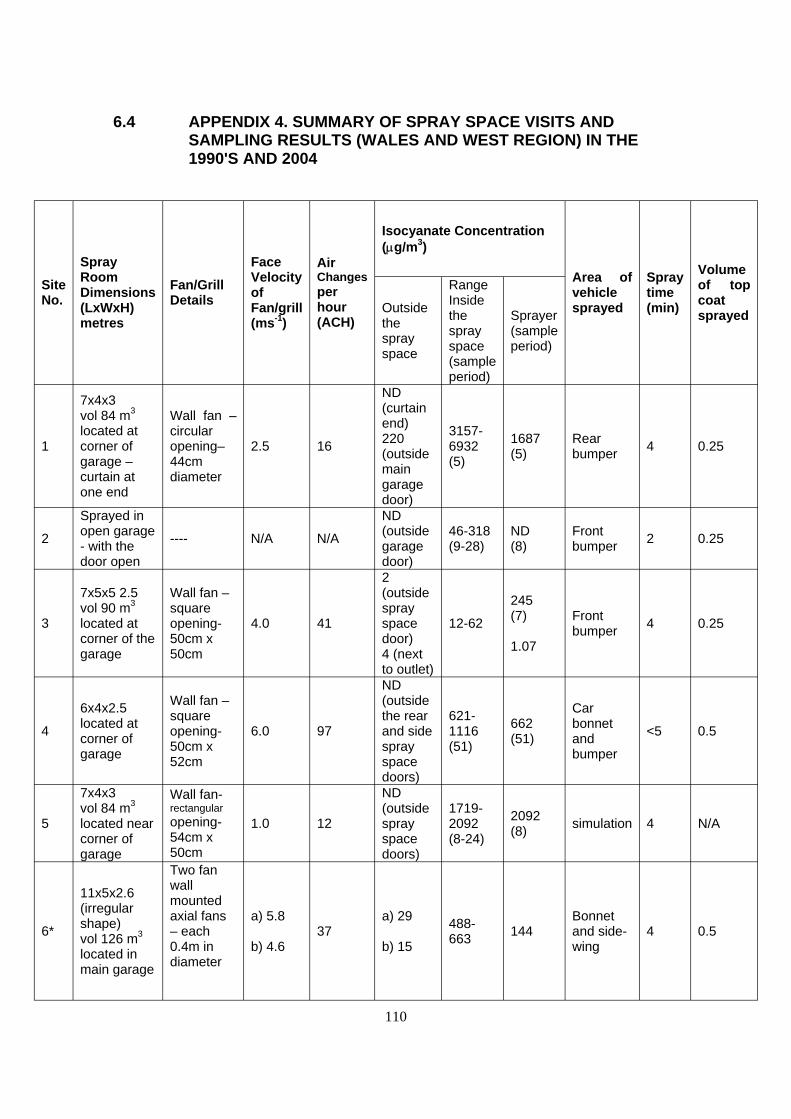
----
6.4 APPENDIX 4. SUMMARY OF SPRAY SPACE VISITS AND SAMPLING RESULTS (WALES AND WEST REGION) IN THE 1990'S AND 2004
Site No.
Spray Room Dimensions (LxWxH) metres
Fan/Grill Details
Face Velocity of Fan/grill (ms-1)
Air Changes per hour (ACH)
Isocyanate Concentration (µg/m3)
Area of vehicle sprayed
Spray time (min)
Volume of top coat sprayed Outside
the spray space
Range Inside the spray space (sample period)
Sprayer (sample period)
1
7x4x3 vol 84 m3
located at corner of garage – curtain at one end
Wall fan – circular opening– 44cm diameter
2.5 16
ND (curtain end) 220 (outside main garage door)
3157- 6932 (5)
1687 (5)
Rear bumper 4 0.25
2
Sprayed in open garage - with the door open
N/A N/A
ND (outside garage door)
46-318 (9-28)
ND (8)
Front bumper 2 0.25
2
3
7x5x5 2.5 vol 90 m3
located at corner of the garage
Wall fan – square opening- 50cm x 50cm
4.0 41
(outside spray space door) 4 (next to outlet)
12-62
245 (7)
1.07
Front bumper 4 0.25
ND
4
6x4x2.5 located at corner of garage
Wall fan – square opening- 50cm x 52cm
6.0 97
(outside the rear and side spray space doors)
6211116 (51)
662 (51)
Car bonnet and bumper
<5 0.5
5
7x4x3 vol 84 m3
located near corner of garage
Wall fan-rectangular opening- 54cm x 50cm
1.0 12
ND (outside spray space doors)
17192092 (8-24)
2092 (8) simulation 4 N/A
6*
11x5x2.6 (irregular shape) vol 126 m3
located in main garage
Two fan wall mounted axial fans – each 0.4m in diameter
a) 5.8
b) 4.6 37
a) 29
b) 15
488663 144
Bonnet and side-wing
4 0.5
110
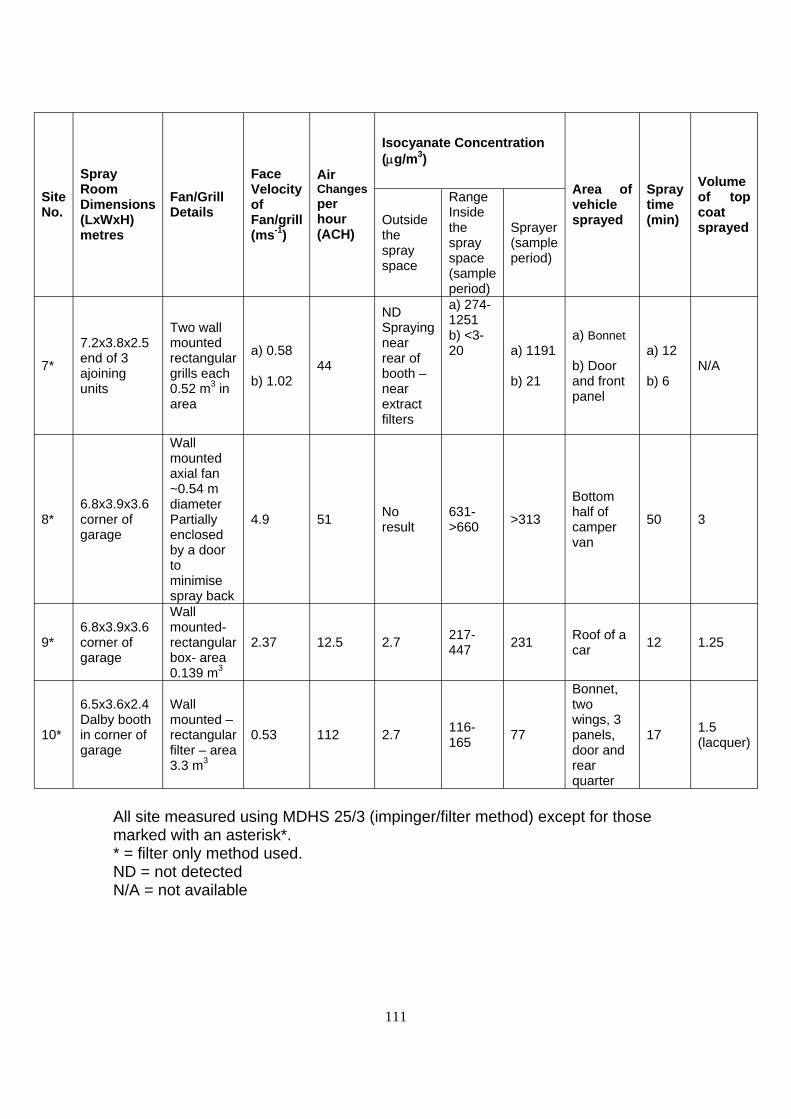
Site No.
Spray Room Dimensions (LxWxH) metres
Fan/Grill Details
Face Velocity of Fan/grill (ms-1)
Air Changes per hour (ACH)
Isocyanate Concentration (µg/m3)
Area of vehicle sprayed
Spray time (min)
Volume of top coat sprayed Outside
the spray space
Range Inside the spray space (sample period)
Sprayer (sample period)
7*
7.2x3.8x2.5 end of 3 ajoining units
Two wall mounted rectangular grills each 0.52 m3 in area
a) 0.58
b) 1.02 44
ND Spraying near rear of booth – near extract filters
a) 2741251 b) <320 a) 1191
b) 21
a) Bonnet
b) Door and front panel
a) 12
b) 6 N/A
Wall mounted axial fan
8* 6.8x3.9x3.6 corner of garage
~0.54 m diameter Partially enclosed by a door to
4.9 51 No result
631->660 >313
Bottom half of camper van
50 3
minimise spray back
9* 6.8x3.9x3.6 corner of garage
Wall mounted- rectangular box- area 0.139 m3
2.37 12.5 2.7 217447 231 Roof of a
car 12 1.25
6.5x3.6x2.4 Wall Bonnet, two
10* Dalby booth in corner of garage
mounted – rectangular filter – area 3.3 m3
0.53 112 2.7 116165 77
wings, 3 panels, door and rear
17 1.5 (lacquer)
quarter
All site measured using MDHS 25/3 (impinger/filter method) except for those marked with an asterisk*. * = filter only method used. ND = not detected N/A = not available
111

Published by the Health and Safety Executive 11/06
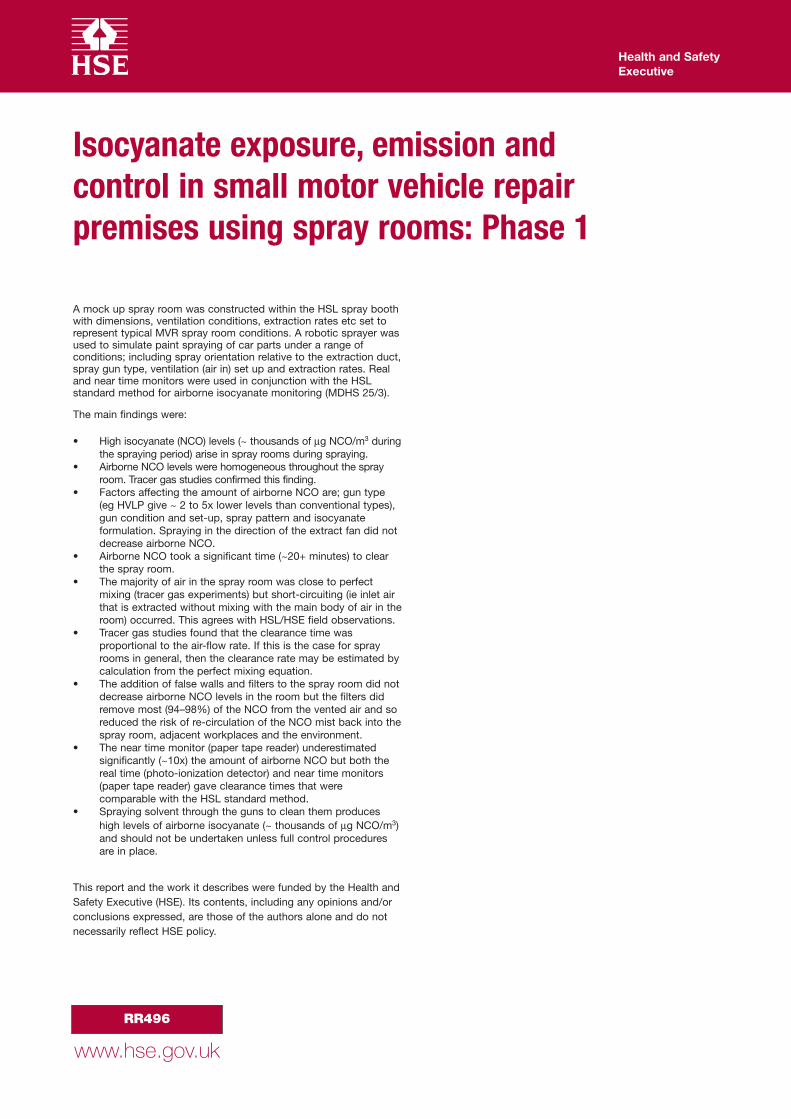
Health and Safety Executive
Isocyanate exposure, emission and control in small motor vehicle repair premises using spray rooms: Phase 1
A mock up spray room was constructed within the HSL spray booth with dimensions, ventilation conditions, extraction rates etc set to represent typical MVR spray room conditions. A robotic sprayer was used to simulate paint spraying of car parts under a range of conditions; including spray orientation relative to the extraction duct, spray gun type, ventilation (air in) set up and extraction rates. Real and near time monitors were used in conjunction with the HSL standard method for airborne isocyanate monitoring (MDHS 25/3).
The main findings were:
• High isocyanate (NCO) levels (~ thousands of µg NCO/m3 during the spraying period) arise in spray rooms during spraying.
• Airborne NCO levels were homogeneous throughout the spray room. Tracer gas studies confirmed this finding.
• Factors affecting the amount of airborne NCO are; gun type (eg HVLP give ~ 2 to 5x lower levels than conventional types), gun condition and setup, spray pattern and isocyanate formulation. Spraying in the direction of the extract fan did not decrease airborne NCO.
• Airborne NCO took a significant time (~20+ minutes) to clear the spray room.
• The majority of air in the spray room was close to perfect mixing (tracer gas experiments) but shortcircuiting (ie inlet air that is extracted without mixing with the main body of air in the room) occurred. This agrees with HSL/HSE field observations.
• Tracer gas studies found that the clearance time was proportional to the airflow rate. If this is the case for spray rooms in general, then the clearance rate may be estimated by calculation from the perfect mixing equation.
• The addition of false walls and filters to the spray room did not decrease airborne NCO levels in the room but the filters did remove most (94–98%) of the NCO from the vented air and so reduced the risk of recirculation of the NCO mist back into the spray room, adjacent workplaces and the environment.
• The near time monitor (paper tape reader) underestimated significantly (~10x) the amount of airborne NCO but both the real time (photoionization detector) and near time monitors (paper tape reader) gave clearance times that were comparable with the HSL standard method.
• Spraying solvent through the guns to clean them produces high levels of airborne isocyanate (~ thousands of µg NCO/m3) and should not be undertaken unless full control procedures are in place.
This report and the work it describes were funded by the Health and Safety Executive (HSE). Its contents, including any opinions and/or conclusions expressed, are those of the authors alone and do not necessarily reflect HSE policy.
RR496
www.hse.gov.uk


![[INFOGRAPHIC] Standard Deviation Measurements of Methyal Isocyanate](https://img.pdfslide.us/doc/110x75/58ed63961a28aba1408b46eb/infographic-standard-deviation-measurements-of-methyal-isocyanate.jpg)