Embed Size (px)
Citation preview

RPC – THE ESSENTIAL INGREDIENT
© 2017 RPC Group Plc. All Rights Reserved.
29 November 2017
RPC GROUP PLC 2017 / 18 INTERIM RESULTS

2
First half highlights 2017 / 18
Revenue +53% to £1,876mFCF +45% to £171.7m with strong cash conversion
Continued organic growth at c.2% Healthy innovation pipeline
Operating profit (adj.) +58% to £214.7mAdjusted EPS +27% to 36.4pInterim dividend +28% to 7.8p
ROS up 30bps to 11.4%RONOA up 320bps to 28%ROCE at 15.1% well above WACC
Letica integration well advancedAcquisition of Astrapak completed
European synergy programme on track and nearing completion with total implementation costs lower than expected

3
AgendaVision 2020 Strategy Pim Vervaat
Financial Overview Simon Kesterton
Market Overview Pim Vervaat
Summary and Outlook Pim Vervaat

4
Progress of Vision 2020 strategy in the first half year
FOC
USE
D G
RO
WTH
Focus on organic growth
Selective consolidation in Europe
Creating a meaningful presence outside Europe
• Continued organic growth at c.2% with healthy innovation pipeline• Global roll-out of patented sports caps continuing
• European synergy programme nearing completion • Opportunities to further consolidate the European plastic packaging market estimated
at >€26bn combined sales
• Acquisition of ‘mini RPC’ Astrapak completed• Greenfield plant in China on stream with Brazilian plant starting up • Further opportunities emerging from leveraging global platform
Pursuing added value opportunities in non packaging markets
• Expansion of Zhuhai operations generating profitable growth in the automotive market• Good contribution of ESE in first year of RPC ownership
Capital allocation
• Capital expenditure to support future growth in attractive market segments• Utilised £12.4m under £100m share buyback • Interim dividend up 28% representing 25th consecutive year of growth

5
Returns since Vision 2020 strategy launch
Strategy generates returns consistently above WACC
£475m
£2,371m
£2,846m
19.4%
14.3% 15.1%
2017 / 18
Capital employed
Return on capital employed
RPC GroupSeptember 2017
Acquisitions &c.£165m organic investments > depreciation
5 years
ROCE
Capitalemployed
2012 / 13RPC Group
pre Vision 2020

6
Selective acquisition opportunities in Europe Size of the opportunity in Europe
Good quality acquisition opportunities in Europe with sales >€26bn
c.€63bn
Numerous opportunities driven by:
• Short term hold periods of private equity • Owner-managed businesses with succession challenges
Note: Not representative of total market, only those targets actively monitored
Size(by revenue)
Number Combinedrevenues
>€500m 12 >€13bn
€50m-€500m 60 >€11bn<€50m >100 >€2bnTotal >€26bn
Rigid and flexible plastic packaging
c.€3bnRPC
*Smithers Pira, 2017; converted to EUR using an exchange rate of 0.88
Europe*
Actively monitored targets
(European packaging only)

7
Financial Overview

8
Income statement
H1 2017 / 18 H1 2016 / 17 FY 2016 / 17 £m % £m % Δ £m %
Revenue 1,875.7 1,226.1 53.0% 2,747.2
Raw materials* (945.2) 50.4 (575.5) 46.9 64.2% (1,359.8) 49.5
Wages and salaries* (391.7) 20.9 (283.2) 23.1 38.3% (624.9) 22.7
Other expenses* (324.1) 17.3 (231.1) 18.8 40.2% (454.3) 16.5
Adjusted operating profit 214.7 11.4 136.3 11.1 57.5% 308.2 11.2
Adjusted interest charge (16.0) (11.1) 44.1% (22.8)
Adjusted profit before tax 199.2 10.6 125.5 10.2 58.7% 286.1 10.4
Non underlying costs (33.0) (53.0) (131.4)
Taxation (44.1) (21.5) (22.7)
Profit after tax 122.1 51.0 139.4% 132.0
Adjusted basic earnings per share 36.4p 28.6p 27.3% 62.2p
Statutory earnings per share 29.5p 15.2p 94.2% 37.1p
Return on capital employed % 15.1% 14.8% 30bps 15.1%
* See appendix page 38

9
Revenue bridge (£m)
1,308
1,876
65
17
540
28
1,226
RevenueH1 2016 / 17
Impact FXtranslation
Polymer price Underlyingrevenue
H1 2016 / 17
Net acquisitions(prior yearrevenue)
Organic growth RevenueH1 2017 / 18
c.2%
30 9
501
Revenue H12016 / 17
FXtranslation
Polymer
Organic growth

10
Adjusted operating profit bridge (£m)
145
215(1)
(21)
10
49
42
136
Adjustedoperating
profitH1 2016 / 17
FXtranslation
Polymerpass through
variance
Underlyingoperating
profitH1 2016 / 17
Netacquisitions(prior year
profit)
Businessimprovement
Cost inflation Adjustedoperating
profitH1 2017 / 18
(1)3
47
Adjustedoperating profitH1 2016 / 17
FXtranslation
Polymer
Includes synergies* of £13m
* From Promens / GCS / BPI / Letica

11
Polymer pass through
€ PER TONNE: average of Platts / ICIS indices
HDPE BMPP HOMO
1,050
1,150
1,250
1,350
1,450
1,550
1,650
1,750
Mar 14 Sep 14 Mar 15 Sep 15 Mar 16 Sep 16 Mar 17 Sep 17
• Polymer pass through mechanisms in place (based on c. 65 indices) albeit with a time lag
• Proactive raw material stock and purchase contract management mitigating the pass through time lag effect
• Flexibility in purchasing various polymer grades for similar applications enhanced
800
900
1,000
1,100
1,200
1,300
1,400
Mar 14 Sep 14 Mar 15 Sep 15 Mar 16 Sep 16 Mar 17 Sep 17
£ PER TONNE: average of Platts / ICIS indices
Mainland Europe UK impacted by weakened sterling
Polymer price changes passed through to the customer base
$ PER TONNE: per IHS
1,200
1,400
1,600
1,800
2,000
2,200
2,400
Mar 14 Sep 14 Mar 15 Sep 15 Mar 16 Sep 16 Mar 17 Sep 17
US impacted by hurricanes

12
Promens, GCS and BPI synergy programme nearing completion
Overview• RPC acquired Promens (€582m sales) in February
2015, GCS (€590m sales) in March 2016 and BPI (€553m sales) in August 2016
• Combined sales of €1,725m with a total of 82 manufacturing sites
Synergy realisation• Steady state cost synergies estimated to be at least
€105m or c.6% of acquired sales
• Over the programme 22 locations will close (including 4 head offices and 2 operations in progress for closure when acquired) in total while relocating >300 production lines
• Currently finalising closures including relocation of UK and Danish facilities
• Synergy programme anticipated to be substantiallycompleted by March 2018
European site rationalisation
* Excludes the closure of a Chinese location

13
0
€35
€68€95 €105
14/15 15/16 16/17 17/18 18/19
€2
€30 €28€50
0
14/15 15/16 16/17 17/18 18/19
€(110)m
€30m
€45m
€(185)m
P&L charge Assetwrite downs
Proceeds,working capital & asset sales
Cash costs
Lower implementation costs than previously anticipated
• Total P&L charge is €185m, down from €190m previously announced
• The associated cash out is €110m, down from €120m previously announced – with steady state benefits remaining at least €105m per annum
Cash costs €m
By year
€6
€77 €77
€250
14/15 15/16 16/17 17/18 18/19
P&L costs €m
Synergy realisation
€m (cumulative)
Promens, GCS and BPI related synergy realisation costs

14
Non-underlying costs (see Appendix page 45 for definitions)
Interims Finals
£ million 2017 / 18 2016 / 17 2016 / 17 2015 / 16
Fitter for the Future - - - 3.8
Acquisition related expenditure 2.1 6.8 18.9 11.9
Deferred consideration on earn-outs 1.1 3.8 (11.2) (11.5)
Promens / GCS / BPI integration costs 10.3 19.1 66.8 58.6
Other integration and exceptional items (7.0) 3.0 9.7 5.4
Total exceptional items 6.5 32.7 84.2 68.2
Amortisation – acquired intangibles 25.3 11.0 31.0 10.3
Other (pension admin fees) 0.6 0.4 1.0 0.6
Total non-underlying operating items 32.4 44.1 116.2 79.1
Non-underlying finance costs 0.6 8.9 15.2 5.9
Total non-underlying costs 33.0 53.0 131.4 85.0

15
Underlying cash generation
Interims Finals
£ million 2017 / 18 2016 / 17 2016 / 17 2015 / 16
Adjusted EBITDA 296 199 441 251
Working capital 25 29 29 -
Net capex (108) (82) (176) (101)
Other* (1) - - 2
Operating cash flow 212 146 294 152
Net interest & tax (40) (28) (55) (29)
Free cash flow 172 118 239 123
Adj. conversion** 99% 107% 95% 87%
Statutory conversion# 97% 105% 82% 85%
80%
90%
100%
110%
0
80
160
240
H1 15/16 H1 16/17 H1 17/18
Adjusted operating profit Free cash flow Conversion (%)
£m
* Share based payments, disposal of fixed assets and pension deficit payments**Ratio of operating cash flow shown above to adjusted operating profit# see Appendix page 43
• Continued investment in growth; total capex to sales ratio of 5.8% (Capex / depreciation of 1.4x)
• Working capital synergies realised as acquisitions adopt RPC’s approach; working capital as a % of sales improved to 5.5% (2016: 6.1%)
• Both statutory cash flow conversion and underlying conversion remain strong

16
Net debt bridge
(1,070)
(108)(40) (1)
(77)(12) (9)
(74) (21)
296
25 (1,049)
Net DebtMar 2017
AdjustedEBITDA
WorkingCapital
InvestingActivities
Interest& Tax
Other freecashflowitems#
Acquisitions(inc. debt)
Sharebuyback
ExceptionalItems
Dividends Other* Net DebtSep 2017
Free cash flow £172m
# Share based payments, disposal of fixed assets and pension deficit payments* Includes exchange rate movements: (£18m), non-underlying cash provision movements: £17m, movement in provisions and financial instruments: £22m

17
Financial position
KPIs Sep 2017
Net debt (£m) 1,070
Headroom (£m) 1,077
Net debt to EBITDA ratio (pro forma)** 1.8x
Net debt to EBITDA covenant 3.5x
0
250
500
750
1,000
1,250
1,500
2017 2018 2019 2020 2021
Renewal date main facilities
USP
P
USP
P
£m
RC
F
RC
F
TER
M
Calendar year
*The 18 month term facility is extendable up to 2020 if required**Adjusted to include acquisitions on a pro forma basis
*

18
Capital allocation priorities
Profitable organic growth
Investing in organic growth and returns ahead of WACCTargeting through the cycle organic growth ahead of GDP
Acquisitions that meet strict investment criteria
17 acquisitions since launch of Vision 2020; demonstrating excellent returns well above WACC
Progressive dividend policy with dividend cover at 2.5x through the cycle
H1 17/18 DPS of 7.8p, up 28% and representing the 25th
consecutive year of growth
Leverage to remain at a suitable and responsible level
H1 17/18 net debt to EBITDA ratio of 1.8x (pro forma)Covenant 3.5x EBITDA
Announced inaugural share buyback programme of up to £100m* over a 12 month period to July 2018
Programme launched as share price undervalued the Group’s performance and future prospects
Capital priorities and structure
*£20.5m shares bought back to date at an average price of 906p

19
Technical guidance
For financial year 2017 / 18
Capex c. £230m
Depreciation c. £175m
Non-underlying cash provision utilisation c. £30m
Underlying tax rate c. 24.5%
Interest c. £34m
FX sensitivity: €1c move changes EBIT by c. £1.8m $1c move changes EBIT by c. £0.4m
Progressive dividend policy with cover targeted to be 2.5x across the cycle
Category GuidanceAcquisition related expenditure External cost on acquisition
activityDeferred consideration on earn-outs
• Ace: 40% c. £3m • Letica 40% c. £20m
Promens / GCS / BPI integration costs
P&L c. £21.5m (€25m) with c. £43m (€50m) cash
Other integration and exceptional items
Minor
Amortisation – acquired intangibles c. £50m
Other non-underlying items Minor
Non-underlying finance costs • Pension scheme interest c. £8m
• Interest on earn-outs:immaterial
• FX on earn-outs depends on FX rates
Non-underlying costs

20
21.7% 22.3% 22.7% 25.7%
28.0%
13/14 14/15 15/16 16/17 H1 17/18
30.6 26.3 57.0 118.2
171.7 29.0 34.3
65.6
120.8
13/14 14/15 15/16 16/17 H1 17/18
+45%
+230bps
525 589 800 1,226 1,876 522 633
842
1,521
13/14 14/15 15/16 16/17 H1 17/18
+53%
47.1 60.9 82.8136.3
214.753.9 70.7
91.5
171.9
13/14 14/15 15/16 16/17 H1 17/18
+58%
Sales (£m) Adjusted Operating Profit (£m)
14.7p 17.5p 19.8p 28.6p 36.4p 16.9p 17.9p 20.6p
33.6p
13/14 14/15 15/16 16/17 H1 17/18
Adjusted basic EPS*
Adjusted = before restructuring costs, impairment charges, amortisation of acquired intangibles and other non-underlying items, net of tax where relevant* Restated following rights issues in 2015, 2016 and 2017 # Includes acquisitions completed in 2016 and comparatives restated on a pro forma basis
Key figures
+27%
Free cash flow (£m) Return on net operating assets#
3.5p 3.8p 4.5p 6.1p 7.8p 8.4p 9.5p 11.5p
17.9p
13/14 14/15 15/16 16/17 H1 17/18
Dividend per share*
+28%
H1H2FY

21
Market Overview

22
Organic growth in the first six months of 2017 / 18
Global plastic packaging markets over the next five years anticipated to grow c.4% with European growth rates at >2%* helped by ongoing material substitution
Good growth in Europe (representing 79% of total sales) with growth outside Europe tempered by hurricane impact in the US
Overall organic growth of c.2% reflecting improved activity levels in both packaging and non-packaging markets partially offset certain adverse natural events and by fewer trading days
Group targeting through the cycle growth ahead of GDP
Continued investment in innovation capabilities driving a healthy pipeline going forward
* Growth rates to 2022 (Source: Smithers Pira)

23
Sports Caps
Market leading beverage closure, developed in France Now produced in 6 countries across 3 continents; sold worldwide Efficient roll-out facilitated by internally developed standardised
approach Patented innovation incorporating functionality for on-the-go
consumption
Current sales
Growth through innovation and best practice sharing

2420 production lines installed with 17 still to come
Sports Caps (continued)
Current sales
Agreed additional sales

25
£353m H1 17 / 18+1% Organic growth
Key developments
RPC: growth in H1 driven by higher added value automotive components
Market: strong demand growth in complex automotive products, particularly in China
Outlook: portfolio of strong platforms for higher added value future growth
Technical Components
£378m H1 17 / 18+1% Organic growth
Key developments
RPC: good overall demand particularly for nicotine delivery systems offsetting decline in UK surface coatings
Market: growth driven by innovation in product design in various market segments
Outlook: continued growth in tobacco while staying focused on margin enhancement in mature market segments
Non-food
£565m H1 17 / 18+3% Organic growth
Key developments
RPC: good growth in agricultural films and confectionary products in H1
Market: growth driven by shelf-life enhancing solutions, portion control and minimising food waste. Agricultural market continues to grow
Outlook: ongoing growth with spreads market recovering as price of substitute (butter) increases
Food
Segmental development

26
£82m H1 17 / 18Static sales
Key developments
RPC: close to zero growth with new product launches later than envisaged
Market: dry powder inhalant devices set for longer term growth particularly in Western markets
Outlook: medium to longer term growth following formation of larger healthcare platform post Plastiape acquisition
Healthcare
£268m H1 17 / 18Static sales
Key developments
RPC: close to zero growth as demand in sport caps and CSD lite closures is offset by continued softness with European coffee capsule customers
Market: growing demand for higher added value single serve beverage capsules and closures
Outlook: continuing growth in closures combined with Brazilian coffee capsules plant starting up
Beverage
£230m H1 17 / 18+2% Organic growth
Key developments
RPC: increased sales in China driving growth in H1
Market: globalisation and higher quality products are key growth drivers
Outlook: further growth opportunities leveraging global platform and development of the air free DEFI system
Personal Care
Segmental development (continued)

27
Summary and Outlook

28
Second half of the year has started well
Encouraging trading in the first half with record profitability levels (both statutory and adjusted) and strong cash generation (both statutory and adjusted)
Will continue to target innovation based growth, leveraging global footprint, and expect to participate in the ongoing consolidation of the plastic packaging markets*
Unprecedented rationalisation of the European manufacturing footprint nearing completion, with the benefits being realised as anticipated
Letica integration progressing well with the expected cost savings on track
Summary and Outlook
* No significant acquisitions anticipated in the remainder of this financial year

29
Forward looking statementsThis presentation contains forward-looking statements, which:have been made by the directors in good faith based on the information available to them up to the time of the approval of this presentation and such information should be treated with caution due to the inherent uncertainties, including both economic and business risk factors, underlying such forward-looking information. The Group undertakes no obligation to update these forward-looking statements and nothing in this presentation should be construed as a profit forecast. Past performance is no guide to future performance and persons needing advice should consult an independent financial advisor.
Nothing in this presentation shall constitute, in any jurisdiction, an offer or solicitation to sell or purchase any securities or other financial instruments, nor shall it constitute a recommendation or advice in respect of any securities or other financial instruments or any other matter.

30
Supplementary Material

31
Appendices Disciplined and selective approach to acquisitions
Decentralised organisation enhances integration capability
Commitment to our people
Commitment to sustainability
Polymer capacity expected to increase
Income statement extract at FY 2014/15 polymer prices
Segmental and geographical analysis
Consolidated balance sheet
Employee benefits
Statutory cash flow
Adjusted earning reconciliation
Definitions

32
Core acquisition criteria Strategic fit Strength of incumbent management Financial track record Financial criteria:
• ROCE > WACC of RPC • Quantifiable cost and cash synergies• Impact on Group KPIs (ROS & RONOA)• Earnings accretion
Acquisitions generally concluded at below market average EBITDA multiples
Source:Mergermarket,company information
Overview (EV / EBITDA LTM)
2011-2013 Average 7.8x 2014-2017 Average 9.3x
Sector trading multiples
RPC major transactions =
Transaction multiples
Adding value Improving RPC’s overall commercial position Improving RPC’s strategic buying position Realising cost synergies (including procurement) Enhancing performance and innovation focus of acquired
businesses
Disciplined and selective approach to acquisitions

33
Disciplined and selective approach to acquisitions (continued)
>360
94
175%60% 25%
>215
Acquisition process
Acquired Hand over to divisional management team and corporate purchasing Of those reviewed in-depth, 17 were acquired equating to 18% More than one in three acquisitions have been off-market, one-to-one
processes initiated through existing industry relationships
Targets reviewed in-depth In-depth due diligence performed by RPC teams and external advisers Rejected when target does not meet RPC’s acquisition criteria
Desktop review Desktop review of businesses and market segment More attractive opportunities progressed to review involving business management teams Rejected where no strategic fit or value
Opportunities presented to RPC (since launch of Vision 2020) Industry is consolidating – numerous opportunities presented Database maintained with attractive assets to be actively approached40% Rejected without
extensive review
34
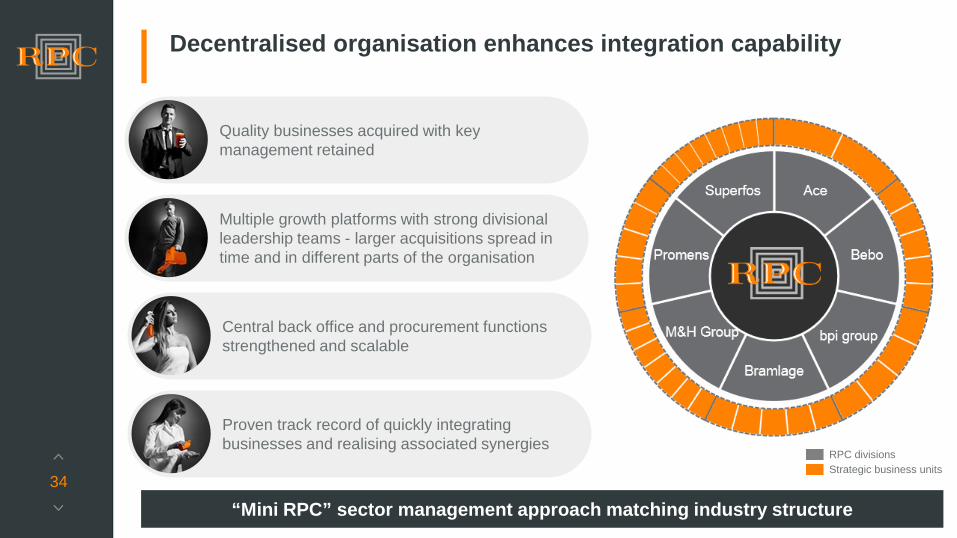
RPC divisions Strategic business units
Decentralised organisation enhances integration capability
“Mini RPC” sector management approach matching industry structure
Quality businesses acquired with key management retained
Central back office and procurement functions strengthened and scalable
Multiple growth platforms with strong divisional leadership teams - larger acquisitions spread in time and in different parts of the organisation
Proven track record of quickly integrating businesses and realising associated synergies

35
Commitment to our people
450
550
650
750
850
H1 15/16 H1 16/17 H1 17/18 2016/17
Reportable accident frequency rate (RAFR)*
Health & Safety
* number of accidents resulting in more than three days off work, excluding accidents where an employee is travelling to or from work, divided by average number of employees x 100k
• Health & Safety culture: • Number 1 priority for RPC; further reduction in RAFR• Annual Health & Safety week “Safety. It’s in our Hands”
• Sharesave:• New annual schemes launched across 23 countries• Take up of 4,468 employees (23%)
• Training & Development:• Apprentice training schemes established across many sites • International Graduate Development Programme• Succession plans in place across the organisation• Identification of key talent and potential• Range of talent development training programmes
RPC commitment to its employees
Full year results

36
Commitment to sustainability
• Raw Materials: Research and development of new materials such as biodegradable polymers
• Design & development:• Lightweighting• Use of recycled material in products• Product protection / waste reduction• Substitution of heavier materials
• Manufacturing:• Efficient use of water and electricity• Reduction of waste
• Recycling & the responsible disposal of plastic:• Closed loop recycling process – bpi recycled products & ESE
World• Involvement in external activities to increase recycling of plastic
e.g. New Plastics Economy Initiative
RPC commitment to sustainabilityThe plastic product lifecycle
We work with organisations including:

37
Polymer capacity expected to increase
• Capacity continues to grow and outpace demand
• Ability to source from outside Europe will become a key competitive advantage
• RPC’s scale, extensive network and flexibility provide a leading position from which to access global markets
• Key capacity additions are North America and Middle East, both targeting exports as markets globalise. China will look to become self-sufficient in PP, freeing capacity for other geographies
RPC’s European operations are well placed to take advantage of global markets
Global PP & PE:
70%
75%
80%
85%
90%
95%
100%
120135150165180195210225240255
2012 2013 2014 2015 2016 2017 2018 2019 2020
Capacity utilisation polymer industryTONNES (M) OPERATING RATE %
Operating rate Actual demand Free capacity Forecast demand
Source: IHS Markit

38
Income statement extract at FY 2014 / 15 polymer prices
H1 2017 / 18 2016 / 17 2015 / 16 2014 / 15£m % £m % £m % £m %
Revenue 1,876 2,747 1,642 1,222
Restated revenue 1,295 2,397 1,677 1,222
Raw materials (583) 45 (1,085) 45 (787) 47 (584) 48
Wages and salaries (288) 22 (558) 23 (384) 23 (280) 23
Other expenses (221) 17 (417) 17 (297) 18 (226) 18
• % of restated revenue• All costs exclude restructuring costs• Revenue and adjusted operating costs have been restated at FY 2014 / 15 polymer pricing
and before 2016 / 17 acquisitions

39
Segmental and geographical analysis
Interims % Finals
£ million 2017 / 18 2016 / 17 VarianceAt constant
exchange 2016 / 17
RevenuePackaging 1,592 1,055 50.8 43.4 2,365Non-packaging 284 171 66.6 56.2 382Total 1,876 1,226 53.0 45.2 2,747Operating profitPackaging 177.5 109.0 62.8 52.2 246.2Non-packaging 37.2 27.3 36.3 28.6 62.0Total 214.7 136.3 57.5 47.5 308.2Return on salesPackaging 11.2% 10.3% 90bps 70bps 10.4%Non-packaging 13.1% 16.0% (290)bps (280)bps 16.2%Total 11.4% 11.1% 30bps 20bps 11.2%
• Both packaging and non-packaging continue to grow with sales mix and acquisitions affecting non-packaging return on sales

40
Segmental and geographical analysis (continued)
Interims % Finals
£ million 2017 / 18 2016 / 17 VarianceAt constant
exchange 2016 / 17
RevenueEurope 1,477 1,052 40.4 33.6 2,363Rest of the world 399 174 128.7 115.4 384Total 1,876 1,226 53.0 45.2 2,747Operating profitEurope 161.5 106.9 51.1 41.8 245.1Rest of the world 53.2 29.4 81.0 68.0 63.1Total 214.7 136.3 57.5 47.5 308.2Return on salesEurope 10.9% 10.2% 80bps 60bps 10.4%Rest of the world 13.3% 16.9% (350)bps (370)bps 16.4%Total 11.4% 11.1% 30bps 20bps 11.2%
• Strong revenue growth by region; Rest of World return on sales affected by sales mix and acquisitions

41
Consolidated balance sheet
£ million SEP 2017 SEP 2016 MAR 2017
Property, plant and equipment 1,328.3 1,098.7 1,265.5
Goodwill 1,600.4 1,099.4 1,577.1
Other non-current assets 492.8 350.3 536.4
Working capital 207.7 169.1 220.3
Employee benefit liabilities (LT) (240.7) (300.9) (256.0)
Provisions, including deferred consideration (135.5) (171.3) (165.1)
Other assets & liabilities (317.6) (216.9) (312.0)
Assets held for sale - 1.8 5.6
Net debt (1,070.4) (833.0) (1,049.1)
Equity shareholder funds 1,865.0 1,197.2 1,822.7

42
H1 2017/18
H1 2016/17
FY 2016/17
Discount rate 2.7% 2.4% 2.6%
Inflation rate 2.1% 2.0% 2.1%
Employee benefits
£ million SEP 2017 SEP 2016 MAR 2017
Retirement benefit liability UK DBs 141.1 185.7 157.3
Other retirement benefit obligations 95.3 110.3 94.3
Termination benefits 0.7 0.8 0.9
Other employee benefit liabilities 3.6 4.1 3.5
Total employee benefit liability 240.7 300.9 256.0
• Improving discount rates plus deficit reduction payments have reduced the pension liability since the year end
• Key assumptions:

43
Statutory cash flow
Interims Finals
£ million 2017 / 18 2016 / 17 2016 / 17 2015 / 16
Adjusted EBITDA 296 199 441 251
Movement in working capital 25 29 29 -
Payment in respect of non-underlying items
(8) (28) (81) (50)
Movement in provisions and financial liabilities
(27) (21) (56) (19)
Cash generated by operations 286 179 333 182
Net capex (108) (82) (176) (101)
Cash flow 178 97 157 81
Statutory operating profit 182 92 192 95
Statutory conversion* 97% 105% 82% 85%
* Ratio of cash flow to statutory operating profit
• Capex ahead of depreciation (1.4x)
• Disciplined working capital management
• Costs and benefits of the Promens / GCS / BPI programme nearing completion with 87% investment in one time costs and 86% of the related benefits have been received

44
Adjusted earnings reconciliation
Earnings(£m)
Adjusted earnings & EPS 150.4
Acquisition and integration costs (12.4)
Deferred consideration on earn-outs (1.1)
Amortisation – acquired intangibles (25.3)
Other non-underlying items 5.8
Total non-underlying tax 4.7
Total adjustments (28.3)
Basic earnings & EPS 122.1 29.5p
(3.0)p
(0.3)p
(6.1)p
1.4p
1.1p
36.4p
(6.9)p

45
Definitions
Expense Description
Fitter for the Future All expenditure related to a business improvement programme announced before the Vision 2020 Focused Growth Strategy, which was centred on rationalising RPC’s European manufacturing footprint, optimising its business portfolio and realised value for the Group by disposing of its non-core businesses and redundant properties. This scheme was largely completed by the end of the 2014/15 financial year.
Acquisition related expenditure The advisors fees and other expenses directly relating to the Group’s completed acquisitions.
Deferred consideration on earn-outs
The remuneration earned by the shareholders of Ace and other acquisitions who must remain as employees of the Group for the duration of the earn-out period to qualify for the remuneration. It also includes adjustments related to the current expectation of the final payment.
Integration costs Costs relate to the integration of the Promens, GCS and BPI businesses into the RPC organisation, including related restructuring, redundancy, closure costs and impairment charges.
Other integration & exceptional items
Includes other items such as start up costs. It also includes restructuring, redundancy and closure costs of other business optimisation programmes not directly affected by the Promens, GCS and BPI integration and advisors fees directly relating to the group’s aborted acquisition processes.
Amortisation – acquired intangibles
Relates to amortisation of intangible assets such as brands and customer relationships related to acquired business (amortised to the income statement on a straight-line basis over their estimated useful life).
Other non-underlying items Other immaterial non underlying costs including the pension admin costs on closed DB schemes.
Non-underlying finance costs Includes finance charges related to the defined benefit pension schemes and the Ace contingent consideration finance cost and the associated foreign exchange impact on the US dollar liability.

46
Definitions (continued)
Category Description
Organic growth Period-on-period revenue change adjusted for constant exchange rates and polymer prices, pro forma for acquisitions completed in the current period and adjusted for disposals.
ROCE ROCE is measured over the relevant period (annualised for half year results) and normalised for the effect of acquisitions, is adjusted operating profit for continuing operations, divided by the average of opening and closing shareholders equity, after adjusting for net retirement benefit obligations, assets held for sale, acquisition intangibles and net borrowings for the year concerned.
RONOA RONOA is measured over the relevant period (annualised for half year results) and normalised for the effect of acquisitions, is adjusted operating profit for continuing operations divided by the average of opening and closing property plant and equipment and working capital for the year concerned. Comparatives are restated to include acquisitions on a pro forma basis.