Embed Size (px)
Citation preview

DET NORSKE VERITAS
RECOMMENDED PRACTICEDNV-RP-E303
GEOTECHNICAL DESIGN ANDINSTALLATION
OF SUCTION ANCHORS IN CLAYOCTOBER 2005
FOREWORD
DET NORSKE VERITAS (DNV) is an autonomous and independent foundation with the objectives of safeguardinglife, property and the environment, at sea and onshore. DNV undertakes classification, certification, and otherverification and consultancy services relating to quality of ships, offshore units and installations, and onshoreindustries worldwide, and carries out research in relation to these functions.
DNV Offshore Codes consist of a three level hierarchy of documents:
– Offshore Service Specifications. Provide principles and procedures of DNV classification, certification, verificationand consultancy services.
– Offshore Standards. Provide technical provisions and acceptance criteria for general use by the offshore industryas well as the technical basis for DNV offshore services.
– Recommended Practices. Provide proven technology and sound engineering practice as well as guidance for thehigher level Offshore Service Specifications and Offshore Standards.
DNV Offshore Codes are offered within the following areas:A) Qualification, Quality and Safety MethodologyB) Materials TechnologyC) StructuresD) SystemsE) Special FacilitiesF) Pipelines and RisersG) Asset OperationH) Marine OperationsJ) Wind Turbines
Amendments and CorrectionsThis document is valid until superseded by a new revision. Minor amendments and corrections will be publishedin a separate document on the DNV web-site; normally updated twice per year (April and October). To access theweb-site, select short-cut options “Technology Services” and “Offshore Rules and Standards” at http://www.dnv.com/
The electronic web-versions of the DNV Offshore Codes will be regularly updated to include these amendmentsand corrections
AcknowledgementsThis Recommended Practice is based upon a design procedure developed within the Joint Industry Project"Reliability-Based Calibration of Design Code for Suction Anchors” /1/, which consisted of two phases, the Pilot Phase and the Final Phase. The following companies sponsored both phases:BP America; Conoco Phillips Norge; Det Norske Veritas; Statoil ASA; The following companies sponsored the Pilot Phase only:Health & Safety Executive; Minerals Management Service; Norwegian Petroleum Directorate; Petrobras.The execution of the JIP was carried out in co-operation with the Norwegian Geotechnical Institute (NGI). DNV is grateful for the valuable co-operation and discussions with NGI and with the sponsoring companies. Theirindividuals are hereby acknowledged for their contributions, NGI also for its contributions and comments duringthe writing of this RP.As part of the publication of this Recommended Practice, a draft copy was written in co-operation with NGI, whichwas sent for hearing to several companies. Significant, valuable and concrete comments were provided within theresulting feedback. The following organizations, which actively participated, are especially acknowledged:Bluewater Energy services BV; BP America Production Company; Statoil ASA; and Total.
Comments may be sent by e-mail to [email protected] subscription orders or information about subscription terms, please use [email protected] information about DNV services, research and publications can be found at http://www.dnv.com, or can be obtained from DNV, NO-1322 Høvik, Norway; Tel +47 67 57 99 00, Fax +47 67 57 99 11.
© Det Norske Veritas. All rights reserved. No part of this publication may be reproduced or transmitted in any form or by any means,including photocopying and recording, without the prior written consent of Det Norske Veritas.
Computer Typesetting by Det Norske Veritas.Printed in Norway by GAN Grafisk.
If any person suffers loss or damage which is proved to have been caused by any negligent act or omission of Det Norske Veritas, then Det Norske Veritas shall pay compensation to such person forhis proved direct loss or damage. However, the compensation shall not exceed an amount equal to ten times the fee charged for the service in question, provided that the maximum compensationshall never exceed USD 2 million.In this provision “Det Norske Veritas” shall mean the Foundation Det Norske Veritas as well as all its subsidiaries, directors, officers, employees, agents and any other acting on behalf of Det NorskeVeritas.
Recommended Practice No. RP-E303
2005
DET NORSKE VERITAS
CONTENTS
1. General .....................................................................1
1.1 Introduction ...............................................................1
1.2 Objective....................................................................1
1.3 Scope of application ..................................................1
1.4 Structure of the document..........................................2
1.5 Abbreviations.............................................................2
1.6 Symbols and explanation of terms.............................2
2. Design Principles......................................................5
2.1 Limit state method of design .....................................5
2.2 Limit states ................................................................6
2.3 Consequence classes ..................................................6
3. Available Methods for Design of Suction Anchors7
3.1 Advanced models.......................................................7
3.2 Less advanced methods .............................................7
4. Design Code for Suction Anchors...........................7
4.1 General.......................................................................7
4.2 Failure mechanism.....................................................8
4.3 Calculation of line-soil interaction effects .................8
4.4 Geometrical idealisation and 3D effects ....................8
4.5 Description of the limiting equilibrium model ..........9
4.6 Optimal load attachment point.................................11
4.7 Shear strength and “set-up” along outside skirt wall11
4.8 Shear strength and set-up along inside skirt wall.....13
4.9 Effect of crack along outside skirt on the active side13
4.10 Calculation of the cyclic shear strength ...................14
4.11 Tilt and non-optimal load attachment point.............16
4.12 Misorientation..........................................................16
5. Finite Element Models...........................................16
6. Probability-based design .......................................17
7. Verification of Anchor Installation ......................17
8. References...............................................................17
Appendix A: Installation, retrieval and removal analyses
Appendix B: General requirements to soil investigations

Recommended Practice No. RP-E303 1 2005
1. General
1.1 Introduction This Recommended Practice is based on the results from the Joint Industry Project “Reliability-Based Calibration of Design Code for Suction Anchors” /1/.
This Recommended Practice includes a design code for suction anchors. The design code is recommended by DNV for use in designing suction anchors in clay.
The design code is a more formal part of the Recommended Practice in that it specifies requirements, rather than guidance, with respect to which design rules shall be satisfied and which partial safety factors shall be used in the design.
1.2 Objective The objective is that this Recommended Practice shall
- lead to good designs
- be convenient in use
- impose a known reliability level, and
- allow comparison of different designs for consistent reliability
1.3 Scope of application The design code applies to the geotechnical design and installation of suction anchors in normally consolidated clay for taut, semi-taut and catenary mooring systems. The design code is applicable to anchors for both temporary and permanent mooring.
The design code provides procedures for determination of the anchor resistance and (by reference) the characteristic load required by the code.
The code makes use of a relatively detailed resistance analysis. If a less detailed resistance analysis is applied, the designer should be aware of the limitations of the method and make sure that the effects of any simplifications are conservative in comparison with the results from the more advanced methods.
With reference to /17/ a number of existing 3D finite element methods meet the analysis requirements of this code. It was also reported in /17/ that the plane limit equilibrium method used in the calibration of this code, as well as a quasi 3D finite element model, where the 3D effects are accounted for by side shear on a 2D model, generally show good agreement with the 3D finite element analyses. Also a plastic limit analysis using a function fitted to approximate upper bound results gave good results.
This should thus open for different choices with respect to analytical methods, which will meet the analysis requirements in this code.
The partial safety factors for use in combination with this design code are calibrated on the basis of structural reliability analyses. The scope of the calibration /10/ covers conventional cylindrical suction anchors, with closed vents on the top cover, in normally consolidated clay, subject to extreme line tensions representative of a semisubmersible operating in 1,000m water depth in the Gulf of Mexico and at Haltenbanken, offshore of Norway, and a moored ship in 2,000m water depth at Haltenbanken. Two normally consolidated (NC) clay profiles have been included, one of them with a top layer with a constant undrained shear strength, whose thickness is determined by a requirement of strength continuity at the intersection with the underlying NC clay. The coefficient of variation (CoV) of the soil strength is set to 12 and 15% in the NC clay and to 20% in the top clay.
It is generally recognised that the robustness of the code will increase as the scope of the calibration becomes broader, and in the future it may be necessary to broaden the scope to include other design situations than those covered by the present code calibration. For example, the current edition of this design code assumes that the governing loads lead to undrained conditions in the clay. If drained conditions need to be considered, this has to be evaluated on a case-by-case basis. A general description of the calibration procedure adopted is given in /11/.
The specified partial safety factor γm on anchor resistance for use in combination with the design code presented herein is based on the results of the reliability analysis and code calibration reported in /10/. An epistemic uncertainty in the soil strength with a coefficient of variation of about 15% is accounted for and comes in addition to a coefficient of variation (CoV) for the natural variability of the soil strength of up to 15% (20% in the top clay). It is noted that the quantification of the epistemic uncertainty is difficult. Therefore, efforts to improve the techniques for soil investigation and the methods of interpretation of the results from field and laboratory investigations are necessary to keep the epistemic uncertainty as low as possible.
The requirement to the material factor γm is given with the assumptions
− that the anchor resistance is calculated using the mean cyclic shear strength of the clay as the characteristic value;
− that the submerged weight W’ of the anchor is included in the characteristic anchor resistance RC upon which the material factor is applied; and
− that the partial material factor is used together with the partial load factors specified in this code.
DET NORSKE VERITAS
2 Recommended Practice No. RP-E303 2005
DET NORSKE VERITAS
The installation accuracy in terms of out-of-verticality (tilt) and misorientation has been accounted for in the reliability analyses by assuming expectations of no tilt and no misorientation in conjunction with standard deviations of σ = 3º for tilt and σ = 3º for misorientation. The installation has thus been assumed to be carried out with this accuracy. However, in practice one must design the anchor for the installation tolerance specified in the design basis, and after installation of the anchor one must verify that this tolerance has been met.
For an explanation of symbols and terms used in this Recommended Practice, see Section 1.6. Additional symbols and terms may also be defined in the text.
1.4 Structure of the document The design principles are presented in Chapter 2, design methods in Chapter 3, and the recommended deterministic design code for suction anchors in clay is described in Chapter 4. General requirements for a full probabilistic design, which is an alternative to the deterministic design method, are given in Chapter 6.
Installation, retrieval and removal analyses of suction anchors are addressed in Appendix A.
General requirements for soil investigations are given in Appendix B.
A number of Guidance Notes have been included and provide further guidance to the designer, e.g. in the choice of design soil parameters, explanation of failure mechanisms and symbols related to the analytical model used in the calibration and description of this design code. The Guidance Notes are not intended to be mandatory.
1.5 Abbreviations ALS Accidental damage Limit State
CC Failure Consequence Class
CC1 Failure consequences not serious
CC2 Failure consequences may well be serious
DSS Direct Simple Shear
ULS Ultimate Limit State
UU Unconsolidated Undrained
1.6 Symbols and explanation of terms Symbol
Symbol
Term
Term
Explanation of term
Explanation of term
α Shear strength factor
Set-up factor
αout Maximum set-up factor after installation
A measure of the regained outer unit skin friction (after installation) divided by the DSS cyclic
shear strength Dcyf ,τ
αp Line angle at padeye
αD Line angle at dip-down point
αss Side shear factor For calculation of τside
Ain Plan view of inside area
Where underpressure is applied
Ainside Inside skirt wall area
Awall Skirt wall area Sum of inside and outside area
Atip Skirt tip area CC Ratio between
and Ccyf ,τ D
cyf ,τ
CE Ratio between and E
cyf ,τ Dcyf ,τ
Ct Thixotropy factor D Anchor diameter fpadeye Reduction factor on
RC
For non-optimal padeye level
ftilt Reduction factor on RC
For tilt
γmean Partial safety factor (or load factor) on TC-mean
Accounts for the uncertainty in the mean line tension
γdyn Partial safety factor (or load factor) on TC-dyn
Accounts for the uncertainty in the dynamic line tension
γm Partial safety factor (or material factor) on characteristic anchor resistance RC
γ’ Submerged unit weight of clay
HT Height of upper retrieved part of anchor
H1 Depth to top of deep part with a failure mechanism around anchor
H Anchor penetration depth (installation depth)
Penetrated length of physical anchor height (= zi)
HS Significant wave height
Used when calculating the cyclic shear strength τf,cy
Hpassive Horizontal reaction force due to passive earth pressure
Acting in the upper part, at the front side, of the anchor
Recommended Practice No. RP-E303 3 2005
Symbol Symbol Term Term Explanation of term Explanation of term
Tpassive Vertical reaction force due to shear stress
Acting at the passive side, in the upper part, of the anchor
Hactive Horizontal reaction force due to active earth pressure
Acting at the rear side, in the upper part, of the anchor
Tactive Vertical reaction force due to shear stress
Acting at the active side, in the upper part, of the anchor
Hanchor,side Horizontal reaction force due to horizontal shear stress
Acting at the side, in the upper part, of the anchor
Tanchor, side Vertical reaction force due to vertical shear
Acting at the side of the upper part of the anchor
Hpassive,side Horizontal reaction force due to shear stress
Acting at the side of the passive failure zone (3D effect), in the upper part, of the anchor
Hactive,side Horizontal reaction force due to shear stress
Acting at the side of the active failure zone (3D effect), in the upper part, of the anchor
Hanchor,deep Horizontal reaction force due to active earth pressure
Acting in the deep part of the anchor, where the soil flows around the anchor
Tanchor,deep Vertical reaction force due to vertical shear stress
Acting along the deep part of the anchor, where the soil flows around the anchor
Hanchor,tip Horizontal reaction force due to horizontal shear stress
Acting at the bottom of the anchor
Vanchor,tip Vertical reaction force due to changes in the vertical normal stress
Acting at the bottom of the anchor, corresponding to an inverse bearing capacity mechanism
Ip Plasticity index of clay
k Undrained shear strength gradient
Average gradient between seabed intercept su,0 and shear strength su at depth z
κ Factor Used in fpadeye
Msoil Resulting overturning moment obtained from soil reaction forces on anchor
∆M Change in moment due to change in padeye level
Nc Bearing capacity factor for clay
Corrected as relevant for the effects of shape, orientation and depth of embedment
Neqv Equivalent number of cycles to failure (N may also be used)
The number of cycles at the maximum cyclic shear stress that will give the same effect as the actual cyclic load history
OCR Over-consolidation ratio
Ratio between maximum past and present effective vertical stress on a soil element
p0’ Effective overburden pressure
Rp Anchor resistance at the optimal padeye depth zp
Acting in direction αp at padeye
∆Rline Anchor resistance between the dip-down point and the padeye
Resistance against embedded part of mooring line
RC Characteristic anchor resistance
Resistance in the line direction at the optimal padeye depth zp, determined for the anchor penetration depth zi = H
Rd Design anchor resistance at the optimal padeye depth zp
= RC/γm
Rh, Rv Horizontal and vertical components of total soil reaction forces on anchor
Limited upwards by Rh,max and Rv,max, respectively
r Roughness factor Mobilized shear stress divided by the undrained shear strength
St Soil sensitivity The ratio between su and su,r, e.g. determined by fall-cone tests or UU triaxial tests
su Static undrained shear strength
DET NORSKE VERITAS
4 Recommended Practice No. RP-E303 2005
Symbol Symbol Term Term Explanation of term Explanation of term
avDus , Average DSS shear
strength over penetration depth
avtipus , Average undrained
shear strength at skirt tip level
Used in connection with prediction of penetration resistance
LBtipus , 2/3 of the average
of su,C, su,E and su,D
Used when specifying the allowable underpressure (under certain conditions)
su,0 Seabed intercept of su
su,D Static DSS undrained shear strength
(su,D)v DSS shear strength on a vertical plane
su,C Static triaxial compression undrained shear strength
su,E Static triaxial extension undrained shear strength
su,wall Undrained shear strength along inside skirt wall
= α·su,D
su,rr Undrained shear strength on the vertical wall along the inside skirt wall
Reconsolidated remoulded shear strength = α· D
cyf ,τ
τside Shear stress at the side of the plastic zone
τside = αss·(su,D)v
τa Average shear stress
τa/su,D Average shear stress level
τcy Cyclic shear stress τcy/su,D Cyclic shear stress
level
↑ Used in connection with cyclic DSS tests ↓
τf,cy Cyclic shear strength
Accounts for both loading rate and cyclic degradation effects on su.
Dcyf ,τ Cyclic DSS shear
strength
Ccyf ,τ Cyclic triaxial
compression shear strength
Ecyf ,τ Cyclic triaxial
extension shear strength
TC Characteristic line tension
Split into a mean and dynamic component, TC-mean and TC-dyn
TC-mean Characteristic mean line tension
Due to pretension and the effect of mean environmental loads in the environmental state
TC-dyn Characteristic dynamic line tension
The increase in tension due to oscillatory low-frequency and wave-frequency effects
Td Design line tension With specified partial safety factors included
Td-mean Design mean line tension
= TC-mean ⋅ γmean
Td-dyn Design dynamic line tension
= TC-dyn ⋅ γdyn
Tpre Pretension in line Tp Line tension at the
optimal padeye depth zp
Acting in direction αp at padeye
TP Peak period for waves
Ucy Cyclic loading factor
Ucy0 Cyclic loading factor in purely two-way cyclic loading
∆ua Allowable underpressure
uinitial Pore water pressure W’ Submerged anchor
weight during installation
xp Radial distance from anchor centre line to padeye
zD Dip-down point Located at seabed, i.e. at depth z=0
zp Padeye depth Depth to padeye measured from seabed
∆z Absolute depth deviation from optimal padeye depth
Used when calculating fpadeye
∆ztilt Change in padeye level due to tilt
DET NORSKE VERITAS
Recommended Practice No. RP-E303 5 2005
2. Design Principles
2.1 Limit state method of design In the design code for suction anchors outlined in Chapter 3, the safety requirements are based on the limit state method of design.
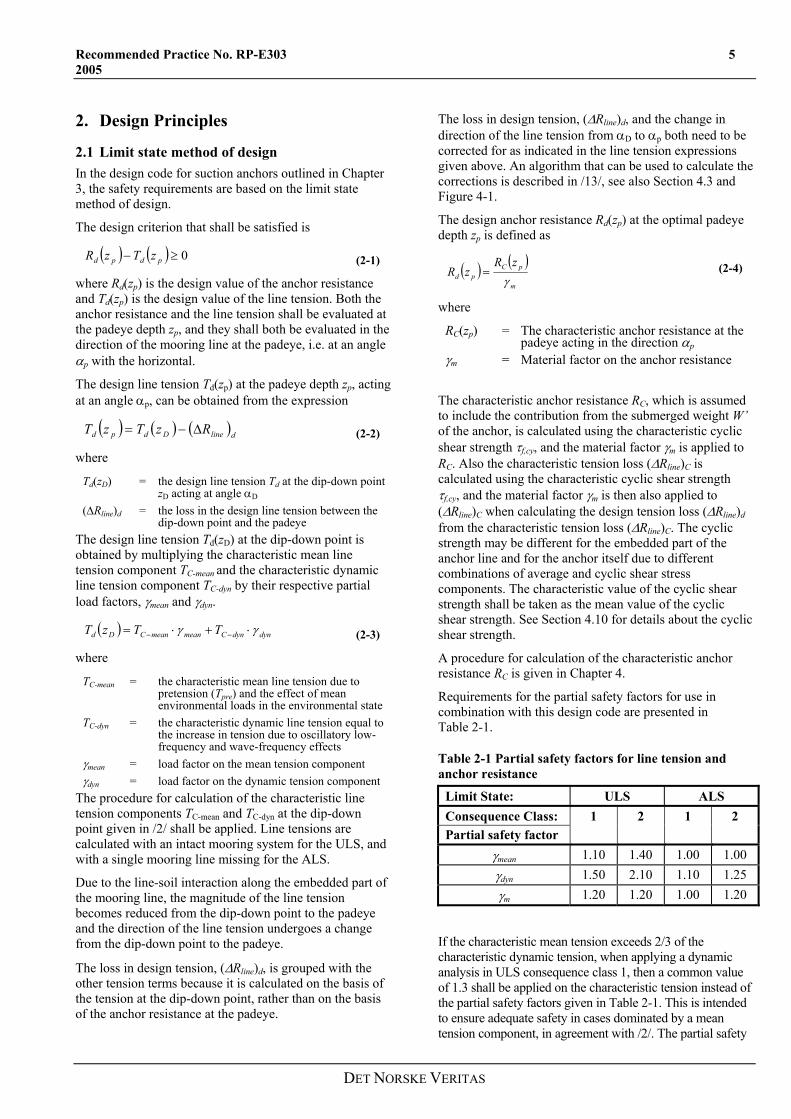
The design criterion that shall be satisfied is
( ) ( ) 0≥− pdpd zTzR (2-1)
where Rd(zp) is the design value of the anchor resistance and Td(zp) is the design value of the line tension. Both the anchor resistance and the line tension shall be evaluated at the padeye depth zp, and they shall both be evaluated in the direction of the mooring line at the padeye, i.e. at an angle αp with the horizontal.
The design line tension Td(zp) at the padeye depth zp, acting at an angle αp, can be obtained from the expression
( ) ( ) ( )dlineDdpd RzTzT ∆−= (2-2)
where
Td(zD) = the design line tension Td at the dip-down point zD acting at angle αD
(∆Rline)d = the loss in the design line tension between the dip-down point and the padeye
The design line tension Td(zD) at the dip-down point is obtained by multiplying the characteristic mean line tension component TC-mean and the characteristic dynamic line tension component TC-dyn by their respective partial load factors, γmean and γdyn.
( ) dyndynCmeanmeanCDd TTzT γγ ⋅+⋅= −− (2-3)
where
TC-mean = the characteristic mean line tension due to pretension (Tpre) and the effect of mean environmental loads in the environmental state
TC-dyn = the characteristic dynamic line tension equal to the increase in tension due to oscillatory low-frequency and wave-frequency effects
γmean = load factor on the mean tension component γdyn = load factor on the dynamic tension component
The procedure for calculation of the characteristic line tension components TC-mean and TC-dyn at the dip-down point given in /2/ shall be applied. Line tensions are calculated with an intact mooring system for the ULS, and with a single mooring line missing for the ALS.
Due to the line-soil interaction along the embedded part of the mooring line, the magnitude of the line tension becomes reduced from the dip-down point to the padeye and the direction of the line tension undergoes a change from the dip-down point to the padeye.
The loss in design tension, (∆Rline)d, is grouped with the other tension terms because it is calculated on the basis of the tension at the dip-down point, rather than on the basis of the anchor resistance at the padeye.
The loss in design tension, (∆Rline)d, and the change in direction of the line tension from αD to αp both need to be corrected for as indicated in the line tension expressions given above. An algorithm that can be used to calculate the corrections is described in /13/, see also Section 4.3 and Figure 4-1.
The design anchor resistance Rd(zp) at the optimal padeye depth zp is defined as
( ) ( )m
pCpd
zRzR
γ= (2-4)
where
RC(zp) = The characteristic anchor resistance at the padeye acting in the direction αp
γm = Material factor on the anchor resistance
The characteristic anchor resistance RC, which is assumed to include the contribution from the submerged weight W’ of the anchor, is calculated using the characteristic cyclic shear strength τf,cy, and the material factor γm is applied to RC. Also the characteristic tension loss (∆Rline)C is calculated using the characteristic cyclic shear strength τf,cy, and the material factor γm is then also applied to (∆Rline)C when calculating the design tension loss (∆Rline)d from the characteristic tension loss (∆Rline)C. The cyclic strength may be different for the embedded part of the anchor line and for the anchor itself due to different combinations of average and cyclic shear stress components. The characteristic value of the cyclic shear strength shall be taken as the mean value of the cyclic shear strength. See Section 4.10 for details about the cyclic shear strength.
A procedure for calculation of the characteristic anchor resistance RC is given in Chapter 4.
Requirements for the partial safety factors for use in combination with this design code are presented in Table 2-1.
Table 2-1 Partial safety factors for line tension and anchor resistance
Limit State: ULS ALS Consequence Class: Partial safety factor
1 2 1 2
γmean 1.10 1.40 1.00 1.00 γdyn 1.50 2.10 1.10 1.25 γm 1.20 1.20 1.00 1.20
If the characteristic mean tension exceeds 2/3 of the characteristic dynamic tension, when applying a dynamic analysis in ULS consequence class 1, then a common value of 1.3 shall be applied on the characteristic tension instead of the partial safety factors given in Table 2-1. This is intended to ensure adequate safety in cases dominated by a mean tension component, in agreement with /2/. The partial safety
DET NORSKE VERITAS
6 Recommended Practice No. RP-E303 2005
factor on the characteristic anchor resistance given in Table 2-1 is applicable in such cases provided that the effects of creep and drainage on the shear strength under the long-term load are accounted for . The limit states and the consequence classes in Table 2-1 are described in the next two sections.
2.2 Limit states The primary function of an anchor, in an offshore mooring system, shall be to hold the lower end of a mooring line in place, under all environmental conditions. Since extreme environmental conditions give rise to the highest mooring line tensions, the designer must focus attention on these conditions.
If the extreme line tension causes the anchor to move beyond its failure displacement, then the anchor has failed to fulfil its intended function. The failure displacement is the displacement required for the anchor to mobilise its maximum resistance and may be of the order of 10%-30% of the anchor diameter. Conversely, the overall mooring system must obviously be designed to tolerate anchor displacements up to the failure displacement without adverse effects.
The mooring system shall be analysed according to the design criterion for each of the following two limit states:
a) An ultimate limit state (ULS) to ensure that the individual mooring lines have adequate strength to withstand the load effects imposed by extreme environmental actions.
b) An accidental damage limit state (ALS) to ensure that the mooring system has adequate resistance to withstand the failure of one mooring line, failure of one thruster, or one failure in the thruster system for unknown reasons.
The two limit states defined above for the mooring system are valid also for the anchors, which form an integral part of the mooring system.
In the context of designing a mooring system, the primary objective with the ULS design shall ensure that the mooring system stays intact, i.e. the ULS design serves to protect against the occurrence of a one-line failure.
This document is valid for anchors with the padeye located at the depth that gives a translational mode of failure, without rotation of the anchor. This gives the highest resistance for a given anchor, and is referred to as the optimal load attachment point.
A suction anchor with no rotation has in principle two translational failure mode components:
1) Vertical pullout due to the vertical load component at the padeye
2) Horizontal displacement due to the horizontal load component
In practice, the actual failure mode will most often include both vertical and horizontal components. The failure mechanism in clay around suction anchors is discussed in Section 4.2.
The two most important results from the calculations according to the present design code are
- the anchor resistance R for the line angle αp at the padeye, and
- the required depth zp of the padeye that would lead to a purely translational mode of anchor failure for the actual anchor and soil conditions.
The anchor resistance will be smaller if the depth of the load attachment point deviates from the depth that gives a purely translational failure mode.
2.3 Consequence classes Two consequence classes are considered for both the ULS and the ALS, defined as follows:
Class 1 Failure is unlikely to lead to unacceptable consequences such as loss of life, collision with an adjacent platform, uncontrolled outflow of oil or gas, capsizing or sinking.
Class 2 Failure may well lead to unacceptable consequences of these types.
Guidance Note A considerable body of experience exists for the design of drilling platforms in moderate water depths, with acceptable service performance. This design experience is taken to be well represented by the requirements set in /2/ for consequence class 1 (CC1).
The amount of experience with floating production systems is much less than for drilling platforms and was not considered sufficient to set a target level for CC2. Instead, general guidance from /12/ was applied. This guidance indicates a factor of 10 between the target failure probabilities of the two consequence classes.
A wide variety of design scenarios may arise in practice, and the following guidance briefly discusses a few cases to illustrate the intended use of the consequence classes. In this context, it should be understood that additional line failures and platform loss of position are to be expected after an initial line failure in the ULS, because:
- repeated dynamic loads of comparable magnitude can be expected after the most extreme load in a storm,
- tensions tend to increase in the remaining lines after an initial line failure, and
- the random variability in the strength of undamaged lines is normally small.
On the other hand, an initial failure in the ALS may well be due to a damaged line with sub-standard line strength, and would not be equally likely to lead to platform loss of position.
For the ULS, the same line of reasoning applies to anchors as to mooring lines:
- if random soil conditions do not vary much between anchors,
- if the cumulative effect of the load cycles on the anchor resistance is relatively small, and
DET NORSKE VERITAS
Recommended Practice No. RP-E303 7 2005
- if there is little residual resistance or little residual line tension after an initial anchor failure.
However, it is complicated to evaluate these details of the anchor behaviour and to take them into account in the design of the rest of the mooring and riser systems. Hence, it is usually advisable to treat an anchor failure in the same way as a line failure in CC2. This would be referred to as a brittle failure in structural design.
It should be recognised in the design that failure in the vertical direction of a suction anchor is more critical than failure in the horizontal direction due to reduced depths of penetration and load attachment point associated with vertical displacements. Failure modes and the failure mechanism of a suction anchor are discussed in Sections 2.2 and 4.2.
If a platform is designed to produce petroleum under the most severe environmental conditions at that location, then the mooring lines and anchors are normally designed for consequence class 2 (CC2), because of the hazards associated with loss of position under these conditions. CC1 need not be considered in this case, except perhaps for post-installation conditions, prior to starting production.
If a production platform is intended to be shut down under severe environmental conditions, and appropriate safeguards are applied such that there is little risk from a loss of position, then the mooring lines and anchors may be designed for CC1 under the most severe environmental conditions. An additional design check in CC2 is then required for the most severe environmental conditions at which production may occur.
A mobile drilling platform would be considered to be in CC2 while it is drilling or employed in well testing. It would be in CC1 after ceasing operation, if there is little risk from a loss of position.
If loss of position would lead to appreciable risk of damage to a nearby platform through collision, or to subsea installations through dragging anchors, then CC2 would apply. Ref./2/ provides some more guidance on consequence classes with respect to the distance to nearby platforms.
At locations with a large difference between survival conditions and the limiting conditions for operations it may be sufficient with a cursory check of CC2 during operating conditions. This may well be the case in the Gulf of Mexico, if design to CC1 under hurricane conditions implies a large margin to CC2 under operating conditions. At other locations with a more continuous range of environmental conditions, checks of both CC1 under survival conditions and CC2 under operating conditions may need to be carried out in detail, to ensure an acceptable design.
--- End of Guidance Note ---
3. Available Methods for Design of Suction Anchors
3.1 Advanced models The most advanced models for analysis of suction anchors are capable of modeling the actual soil strength profile (including strength anisotropy, loading rate effects and cyclic degradation effects), realistic failure mechanisms (including effects of tilt and misorientation), coupling between vertical and horizontal resistance components, 3D effects, set-up effects at the interface between the skirt wall and the clay, and a potential vertical crack on the active side. The coupling between vertical and horizontal resistances occurs when the failure mechanism is a
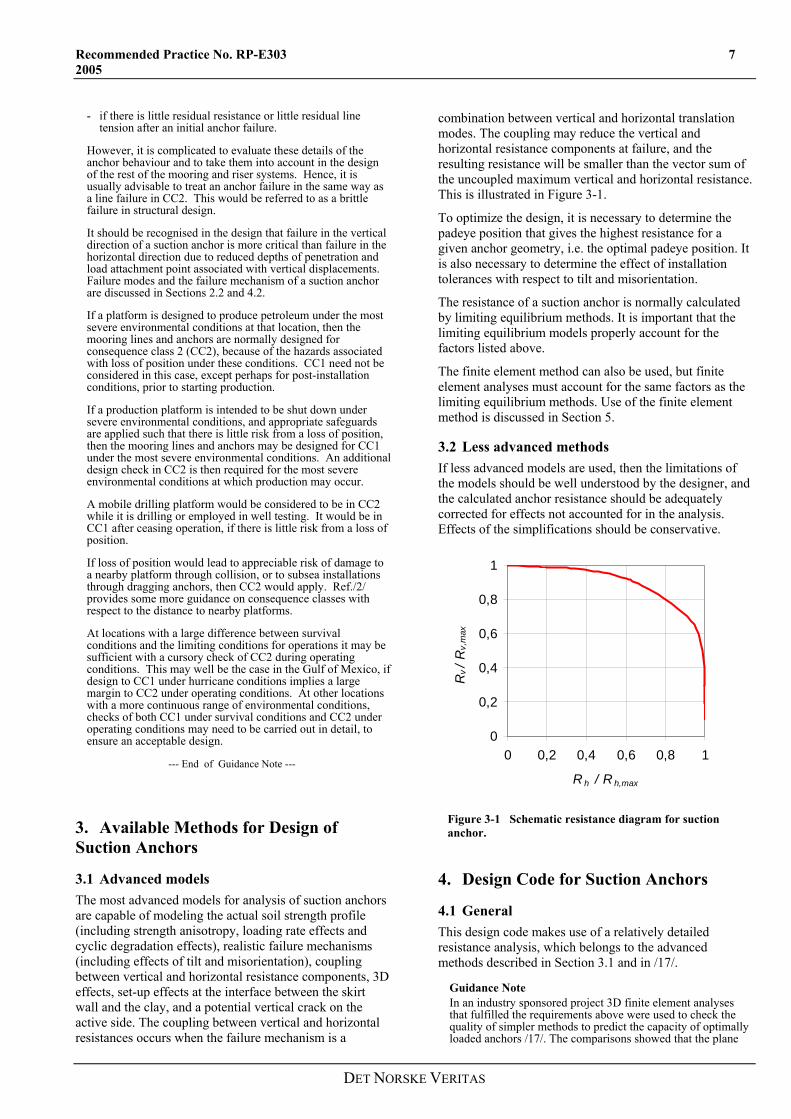
combination between vertical and horizontal translation modes. The coupling may reduce the vertical and horizontal resistance components at failure, and the resulting resistance will be smaller than the vector sum of the uncoupled maximum vertical and horizontal resistance. This is illustrated in Figure 3-1.
To optimize the design, it is necessary to determine the padeye position that gives the highest resistance for a given anchor geometry, i.e. the optimal padeye position. It is also necessary to determine the effect of installation tolerances with respect to tilt and misorientation.
The resistance of a suction anchor is normally calculated by limiting equilibrium methods. It is important that the limiting equilibrium models properly account for the factors listed above.
The finite element method can also be used, but finite element analyses must account for the same factors as the limiting equilibrium methods. Use of the finite element method is discussed in Section 5.
3.2 Less advanced methods If less advanced models are used, then the limitations of the models should be well understood by the designer, and the calculated anchor resistance should be adequately corrected for effects not accounted for in the analysis. Effects of the simplifications should be conservative.
0
0,2
0,4
0,6
0,8
1
0 0,2 0,4 0,6 0,8 1
R h / R h,max
Rv / R
v,m
ax
Figure 3-1 Schematic resistance diagram for suction anchor.
4. Design Code for Suction Anchors
4.1 General This design code makes use of a relatively detailed resistance analysis, which belongs to the advanced methods described in Section 3.1 and in /17/.
Guidance Note In an industry sponsored project 3D finite element analyses that fulfilled the requirements above were used to check the quality of simpler methods to predict the capacity of optimally loaded anchors /17/. The comparisons showed that the plane
DET NORSKE VERITAS

8 Recommended Practice No. RP-E303 2005
limiting equilibrium method used for the calibration of this code and a quasi 3D finite element model, where 3D effects were accounted for by side shear on a 2D model, generally gave good agreement with the 3D finite element analyses. A plastic limit analysis method using a function fitted to approximate upper bound results, /18/, also gave good results. Available plastic limit analysis mechanisms that rigorously satisfied upper bound constraints indicated significant errors for shallow caissons, but gave good agreement for the longer caissons.
The capacity at intermediate load angles where there is coupling between vertical and horizontal failure mechanisms was well predicted when the interaction was determined by optimizing the failure mechanism in plane limiting equilibrium analyses as in the calibration of this code. If the interaction is based on results from previous finite element analyses and model tests, one should be cautious if the conditions differ from those in previous analyses or model tests.
--- End of Guidance Note ---
The calculation method and input to the analyses will be subject to an assessment in each case.
The limit equilibrium model adopted in the calibration of this code is described in Section 4.5. It should be noted, however, that many other analytical methods will meet the requirements in this code, see the Guidance Note above.
The partial safety factors are calibrated with respect to this type of analysis. However, less detailed resistance analyses may also be used, provided the conditions stated in Section 3.2 are followed.
The method of resistance analysis applied shall be described in the design report, and the effects of simplifications relative to the present method shall be made clear.
4.2 Failure mechanism The failure mechanism in the clay around an anchor will depend on various factors, like the load inclination, the anchor depth to diameter ratio, the depth of the load attachment point, the shear strength profile, and whether the anchor has an open or a closed top.
If the load inclination is close to vertical, the anchor will tend to move out of the ground, mainly mobilizing the shear strength along the outside skirt wall and the underpressure inside the anchor (and thus the inverse bearing capacity of the soil at skirt tip level). If the anchor has an open top, the inverse bearing capacity will not be mobilized if the inside skirt friction is lower than the inverse bearing capacity at skirt tip level. The design case with vents left open on the top cover has not been included in the calibration of the partial safety factors in this design code. The inverse bearing capacity will in this case depend on the flow resistance of the vents in relation to the loading rate. If this situation occurs it has to be evaluated on a case-by-case basis.
If the load inclination is more towards the horizontal, the resistance at the upper part of the anchor will consist of passive and active resistances against the front and back and side shear along the anchor sides. Deeper down, the soil may flow around the anchor in the horizontal plane, or underneath the anchor.
For intermediate load inclinations, there will be an interaction between the vertical and the horizontal capacities. This interaction may lead to vertical and horizontal failure load components that are smaller than the vertical and horizontal failure loads under pure vertical or pure horizontal loading, see Figure 3-1.
It is important that the calculation model represents properly the failure mechanisms described above and accounts for the interaction that may occur between the vertical and horizontal failure modes.
4.3 Calculation of line-soil interaction effects Results from a mooring system analysis will give the mooring line tension and line uplift angle at the dip-down point zD, at the seabed, for each mooring line. The dip-down point is the point where the mooring line intersects the seabed. When the load is transferred through the soil from the dip-down point to the pad-eye and the line drags through the soil, the line tension becomes reduced and the line angle becomes altered due to the combined effect of soil friction and soil normal stress acting on the embedded line. This is illustrated in Figure 4-1.
A procedure that can be used to calculate corrections in line tension and uplift angle is described in /13/.
αD
Td(zD)
αp
Td(zp)fn
fs
Figure 4-1 Change of tension and uplift angle between dip-down point and padeye depth.
4.4 Geometrical idealisation and 3D effects Most limiting equilibrium models are plane models, where the actual base geometry is approximated by a rectangle. Cylindrical geometry with asymmetrical failure can be used in analyses of failure with soil moving around the anchor in the horizontal plane. Cylindrical geometry should be used to determine vertical resistance in cases with dominant vertical loads.
Plane limiting equilibrium programmes should use a rectangle with width equal to the diameter (e.g. /3/). The 3D effects in the active and passive zones can be taken into account by roughness factors at the two plane vertical
DET NORSKE VERITAS
Recommended Practice No. RP-E303 9 2005
sides of the modelled anchor and at the sides of the active and passive zones in the soil. The side shear can be calculated based on the DSS shear strength, with a roughness factor of 0.5 for the side of the anchor and 0.6 at the sides of the active and passive zones (/3/). These factors are based on interpretation of model tests and 3D finite element analyses. The roughness factor at the side of the anchor should be corrected for the set-up factors (see Section 4.5).
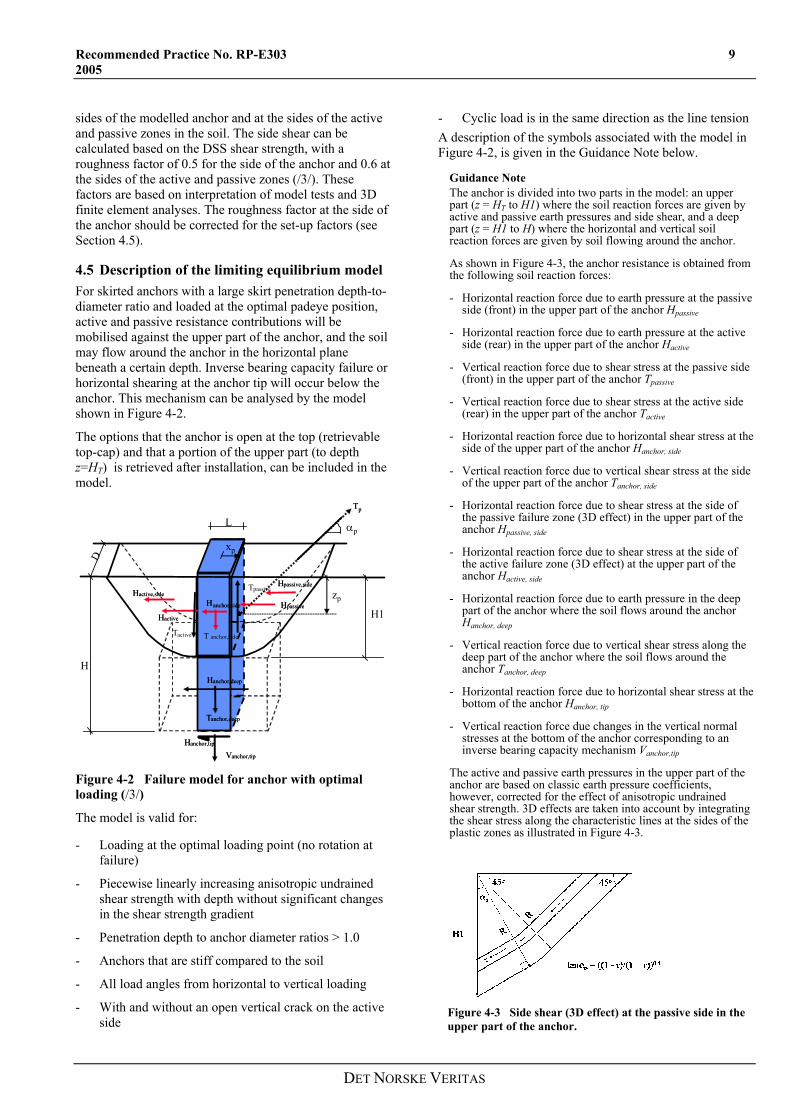
4.5 Description of the limiting equilibrium model For skirted anchors with a large skirt penetration depth-to-diameter ratio and loaded at the optimal padeye position, active and passive resistance contributions will be mobilised against the upper part of the anchor, and the soil may flow around the anchor in the horizontal plane beneath a certain depth. Inverse bearing capacity failure or horizontal shearing at the anchor tip will occur below the anchor. This mechanism can be analysed by the model shown in Figure 4-2.
The options that the anchor is open at the top (retrievable top-cap) and that a portion of the upper part (to depth z=HT) is retrieved after installation, can be included in the model. TpTp
HactiveHactive
HpassiveHpassive
Hanchor,tipHanchor,tip
Hactive,sideHactive,side
Hpassive,sideHpassive,side
Hanchor,sideHanchor,side
L
D
T anchor,side
T passive
Tactive
Tanchor,deepTanchor,deep
Hanchor,deepHanchor,deep
Vanchor,tipVanchor,tip
H
H1
zp
xp
αp
Figure 4-2 Failure model for anchor with optimal loading (/3/)
The model is valid for:
- Loading at the optimal loading point (no rotation at failure)
- Piecewise linearly increasing anisotropic undrained shear strength with depth without significant changes in the shear strength gradient
- Penetration depth to anchor diameter ratios > 1.0
- Anchors that are stiff compared to the soil
- All load angles from horizontal to vertical loading
- With and without an open vertical crack on the active side
- Cyclic load is in the same direction as the line tension A description of the symbols associated with the model in Figure 4-2, is given in the Guidance Note below.
Guidance Note The anchor is divided into two parts in the model: an upper part (z = HT to H1) where the soil reaction forces are given by active and passive earth pressures and side shear, and a deep part (z = H1 to H) where the horizontal and vertical soil reaction forces are given by soil flowing around the anchor.
As shown in Figure 4-3, the anchor resistance is obtained from the following soil reaction forces:
- Horizontal reaction force due to earth pressure at the passive side (front) in the upper part of the anchor Hpassive
- Horizontal reaction force due to earth pressure at the active side (rear) in the upper part of the anchor Hactive
- Vertical reaction force due to shear stress at the passive side (front) in the upper part of the anchor Tpassive
- Vertical reaction force due to shear stress at the active side (rear) in the upper part of the anchor Tactive
- Horizontal reaction force due to horizontal shear stress at the side of the upper part of the anchor Hanchor, side
- Vertical reaction force due to vertical shear stress at the side of the upper part of the anchor Tanchor, side
- Horizontal reaction force due to shear stress at the side of the passive failure zone (3D effect) in the upper part of the anchor Hpassive, side
- Horizontal reaction force due to shear stress at the side of the active failure zone (3D effect) at the upper part of the anchor Hactive, side
- Horizontal reaction force due to earth pressure in the deep part of the anchor where the soil flows around the anchor Hanchor, deep
- Vertical reaction force due to vertical shear stress along the deep part of the anchor where the soil flows around the anchor Tanchor, deep
- Horizontal reaction force due to horizontal shear stress at the bottom of the anchor Hanchor, tip
- Vertical reaction force due changes in the vertical normal stresses at the bottom of the anchor corresponding to an inverse bearing capacity mechanism Vanchor,tip
The active and passive earth pressures in the upper part of the anchor are based on classic earth pressure coefficients, however, corrected for the effect of anisotropic undrained shear strength. 3D effects are taken into account by integrating the shear stress along the characteristic lines at the sides of the plastic zones as illustrated in Figure 4-3.
Figure 4-3 Side shear (3D effect) at the passive side in the upper part of the anchor.
DET NORSKE VERITAS
10 Recommended Practice No. RP-E303 2005
The roughness factor r in Figure 4-3 is defined as the ratio between the vertical shear stress along the anchor wall (positive upwards at the passive side) and the direct simple shear strength. The shear stress at the side of the plastic zone τside is taken equal to a factor αss times the direct simple shear strength on a vertical plane. The factor αss is found to be close to 0.6 by 3D finite element analyses.
The direction of the shear stress at the side of the anchor is given by the displacement direction of the anchor at failure. In the situation with an assumed open vertical crack on the active side, Hactive, Tactive and Hactive side are set equal to zero.
The earth pressure in the deep part of the anchor, where the soil is assumed to flow around the anchor, is based on solutions from the method of characteristics of a perfectly smooth and a fully rough wall /14/. However, the solutions are corrected for the effect of the varying adhesion factor at the skirt wall/soil interface αout and the vertical shear stress at the skirt wall. The correction factors are found by finite element analyses. The depth to the deep part of the anchor H1 is equal to the depth where the resultant horizontal stress from active and passive earth pressures, including shear stress at the side of the anchor, becomes larger than the earth pressure from the failure mechanism corresponding to soil that flows around the anchor.
--- End of Guidance Note ---
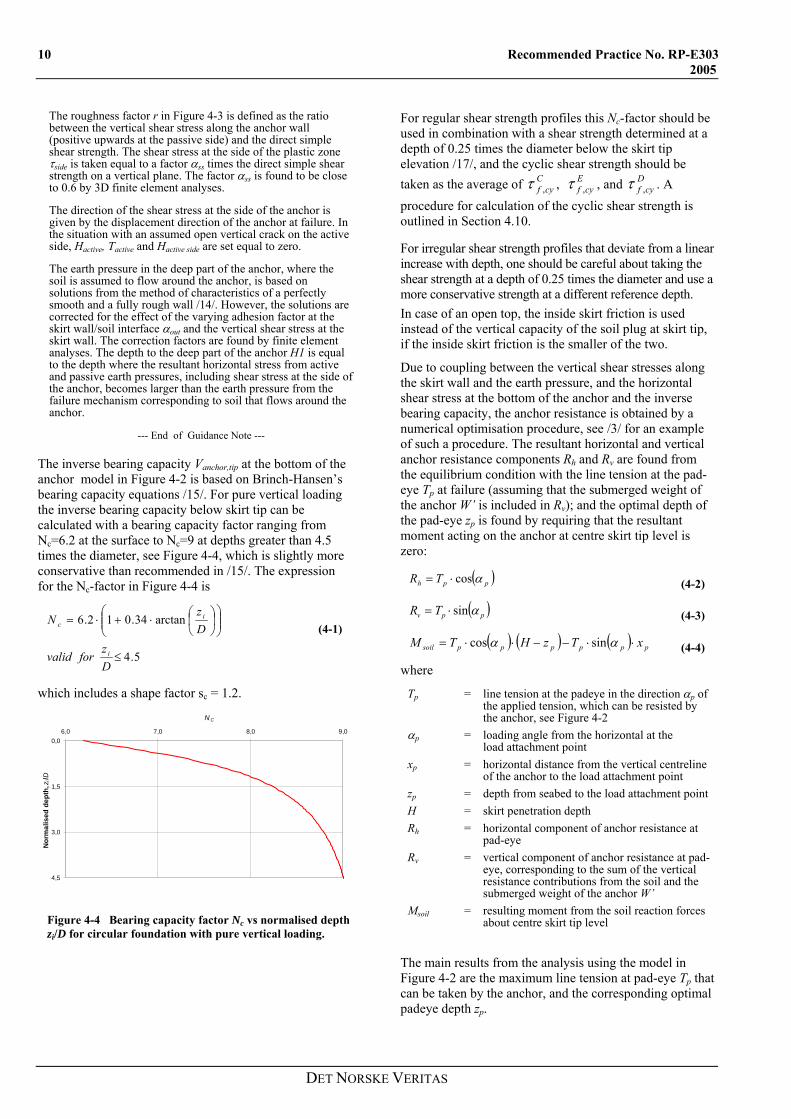
The inverse bearing capacity Vanchor,tip at the bottom of the anchor model in Figure 4-2 is based on Brinch-Hansen’s bearing capacity equations /15/. For pure vertical loading the inverse bearing capacity below skirt tip can be calculated with a bearing capacity factor ranging from Nc=6.2 at the surface to Nc=9 at depths greater than 4.5 times the diameter, see Figure 4-4, which is slightly more conservative than recommended in /15/. The expression for the Nc-factor in Figure 4-4 is
5.4
arctan34.012.6
≤
⎟⎟⎠
⎞⎜⎜⎝
⎛⎟⎠⎞
⎜⎝⎛⋅+⋅=
Dz
forvalid
Dz
N
i
ic
(4-1)
which includes a shape factor sc = 1.2.
0,0
1,5
3,0
4,5
6,0 7,0 8,0 9,0
N C
Nor
mal
ised
dep
th, z
i/D
Figure 4-4 Bearing capacity factor Nc vs normalised depth zi/D for circular foundation with pure vertical loading.
For regular shear strength profiles this Nc-factor should be used in combination with a shear strength determined at a depth of 0.25 times the diameter below the skirt tip elevation /17/, and the cyclic shear strength should be taken as the average of , , and . A procedure for calculation of the cyclic shear strength is outlined in Section 4.10.
Ccyf ,τ E
cyf ,τ Dcyf ,τ
For irregular shear strength profiles that deviate from a linear increase with depth, one should be careful about taking the shear strength at a depth of 0.25 times the diameter and use a more conservative strength at a different reference depth. In case of an open top, the inside skirt friction is used instead of the vertical capacity of the soil plug at skirt tip, if the inside skirt friction is the smaller of the two.
Due to coupling between the vertical shear stresses along the skirt wall and the earth pressure, and the horizontal shear stress at the bottom of the anchor and the inverse bearing capacity, the anchor resistance is obtained by a numerical optimisation procedure, see /3/ for an example of such a procedure. The resultant horizontal and vertical anchor resistance components Rh and Rv are found from the equilibrium condition with the line tension at the pad-eye Tp at failure (assuming that the submerged weight of the anchor W’ is included in Rv); and the optimal depth of the pad-eye zp is found by requiring that the resultant moment acting on the anchor at centre skirt tip level is zero:
( )pph TR αcos⋅= (4-2)
( )ppv TR αsin⋅= (4-3)
( ) ( ) ( ) ppppppsoil xTzHTM ⋅⋅−−⋅⋅= αα sincos (4-4)
where
Tp = line tension at the padeye in the direction αp of the applied tension, which can be resisted by the anchor, see Figure 4-2
αp = loading angle from the horizontal at the load attachment point
xp = horizontal distance from the vertical centreline of the anchor to the load attachment point
zp = depth from seabed to the load attachment point H = skirt penetration depth Rh = horizontal component of anchor resistance at
pad-eye Rv = vertical component of anchor resistance at pad-
eye, corresponding to the sum of the vertical resistance contributions from the soil and the submerged weight of the anchor W’
Msoil = resulting moment from the soil reaction forces about centre skirt tip level
The main results from the analysis using the model in Figure 4-2 are the maximum line tension at pad-eye Tp that can be taken by the anchor, and the corresponding optimal padeye depth zp.
DET NORSKE VERITAS
Recommended Practice No. RP-E303 11 2005
Guidance Note The reaction forces shown in Figure 4-2 are generally functions of the following nine roughness factors, r=τ/τf,cy:
rpassive ractive ranchor,tip rpassive,side ractive,side
rh,anchor,side rv,anchor,side ranchor,deep ranchor,inside
τ = τa + τcy is the sum of mobilized average and cyclic shear stress and τf,cy is the corresponding cyclic shear strength of the intact clay on the same plane as τ. A procedure for calculation of τf,cy is presented in Section 4.10.
The roughness factors ractive, rpassive, rh,anchor,side, rv,anchor,side, ranchor,deep and ranchor,inside should not exceed the “set-up” factors given in Sections 4.7 and 4.8, after the set-up factor for anchor side shear has been multiplied by the side shear factor of 0.5.
--- End of Guidance Note ---
The coupling between the vertical and horizontal anchor resistance should be done by optimisation of the mobilisation of the roughness factors at the active and passive back and front of the anchor and the degree of mobilisation of the shear stress in the soil beneath the anchor at skirt tip level /3/. These factors depend on the relative displacements between the structure and the soil and can be determined by optimisation of the equilibrium equations based on plasticity theory with respect to anchor resistance.
4.6 Optimal load attachment point Maximum anchor resistance is generally achieved when the failure mode is pure translation without rotation. The location of the optimal load attachment point can be calculated as the depth where the resulting overturning moment at the centre line at skirt tip level is zero.
4.7 Shear strength and “set-up” along outside skirt wall
4.7.1 General The ratio between the shear strength at the interface between clay and outside skirt wall and the original shear strength, α=su,rr/ is referred to as the set-up factor. D
cyf ,τ
Dcyf ,τ is the cyclic DSS strength of the intact clay, including
the effect of loading rate and cyclic degradation, and su,rr is the shear strength of the reconsolidated remoulded clay along the outside skirt wall.
The shear strength variation with time along the outside of the skirt wall may depend on whether the skirts are penetrated by underpressure or by self-weight, because a different amount of displaced soil may move outside the skirt in the two cases /8/. In the transition zone between self-weight penetration and penetration by underpressure, it can be assumed that the effect of self-weight penetration decreases linearly to zero at a depth of one anchor diameter below the self-weight penetration depth, see Section 4.7.2. In this transition zone, the solution for self-weight penetration should be used to the depth where it gives more favourable results than the solution with underpressure, see Section 4.7.3. The self-weight penetration depth is normally determined as part of the skirt penetration analyses and can be calculated as described in Appendix A.
Guidance Note In the calculation procedures presented in Sections 4.7.2 and 4.7.3 it is assumed that the steel surface of the suction anchors is not painted. Paint will reduce the side friction, which should be accounted for by reducing the calculated soil-wall interface friction resistance.
--- End of Guidance Note ---
4.7.2 Shear strength along skirts penetrated by self weight The set-up factor for penetration by weight may be calculated with the same procedures as for piles, since part of the soil displaced by the skirt moves outside the skirt and causes increased normal stresses. However, the ratio of wall thickness to diameter of a suction anchor is normally smaller than for a pile, and it is necessary to consider whether set-up in addition to the set-up from thixotropy should be relied upon for capacity calculations.
Guidance Note For piles in clay with plasticity index of Ip > 20%, /5/ gives
)0.1'/('
5.0 0
5.0
0
≤⎟⎟⎠
⎞⎜⎜⎝
⎛⋅=
−
psforps
uuα
)0.1'/('
5.0 0
25.0
0
>⎟⎟⎠
⎞⎜⎜⎝
⎛⋅=
−
psforps
uuα
(4-5)
with the constraint that α ≤ 1.0.
For silty clay (Ip < 20%), it is proposed to reduce α according to /6/ or /7/. Instrumented axial pile load tests reported in /6/
DET NORSKE VERITAS
12 Recommended Practice No. RP-E303 2005
gave α values as low as 0.22 for the normally consolidated, low plasticity silty clay and clayey silt deposits as compared to α values of 1.0 for normally consolidated, highly plastic clays. Adjustments are recommended in /6/ for clays with Ip>20% to the correlations given in /5/ between the α value and shear strength ratio su/p0’. Concurrence in this need for adjustments is expressed in /7/.
The time to reach 90% dissipation of the pore pressure from installation may be significant for weight penetration in soft clays, and full set-up may require many months or even years, depending on skirt diameter, skirt wall thickness and clay type. The time to 90% pore pressure dissipation may for soft clays be calculated by radial consolidation theory with the initial pore pressure decreasing linearly from the maximum excess pore pressure at the skirt wall to 1.1 times the radius of the plastified zone from cavity expansion theory, rp. The value of rp, calculated from cavity expansion theory, is:
)(5.0
500 pilesendedclosed
sGrr
up −⎟⎟
⎠
⎞⎜⎜⎝
⎛⋅=
( ) )(/5.0
20
21
20
500 pilesendedopenrrr
sGrr
up −⎥
⎦
⎤⎢⎣
⎡−⋅⋅=
(4-6)
where
r0 = external pile radius ri = internal pile radius G50 = secant shear modulus from τ = 0 to τ = 0.5⋅su
The recompression value of the coefficient of consolidation for unloading/reloading shall be used in these analyses, see /8/ for more details.
--- End of Guidance Note ---
There will also be a thixotropy effect in this case, and the initial value of α immediately after installation and before any pore pressure dissipation, can be calculated as α=Ct⋅(1/St), with the constraint that it does not exceed the α–values from /5/. The thixotropy factor, Ct, can be determined from the lower bound curves in /8/ or from laboratory tests on site specific soil.
4.7.3 Shear strength along skirts penetrated by underpressure Site specific set-up factors can be calculated based on data from laboratory tests on site specific soil, as described in /8/. The laboratory tests include DSS and oedometer tests on intact and remoulded clay and thixotropy tests on remoulded clay to establish the following parameters.
- Undrained shear strength of remoulded clay
- Reloading constrained modulus of intact clay
- Virgin constrained modulus of remoulded clay
- Permeability of intact and remoulded clay
- Thixotropy factor of remoulded clay
If site specific calculations are not performed, the set-up factors proposed in Table 4-1 can be used. There is not much data available about cyclic shear strength of reconsolidated remoulded clay. Unless site specific data
are available, it is conservatively recommended to use the same ratio between the remoulded and intact shear strengths for cyclic strengths as the one which is used for static strengths.
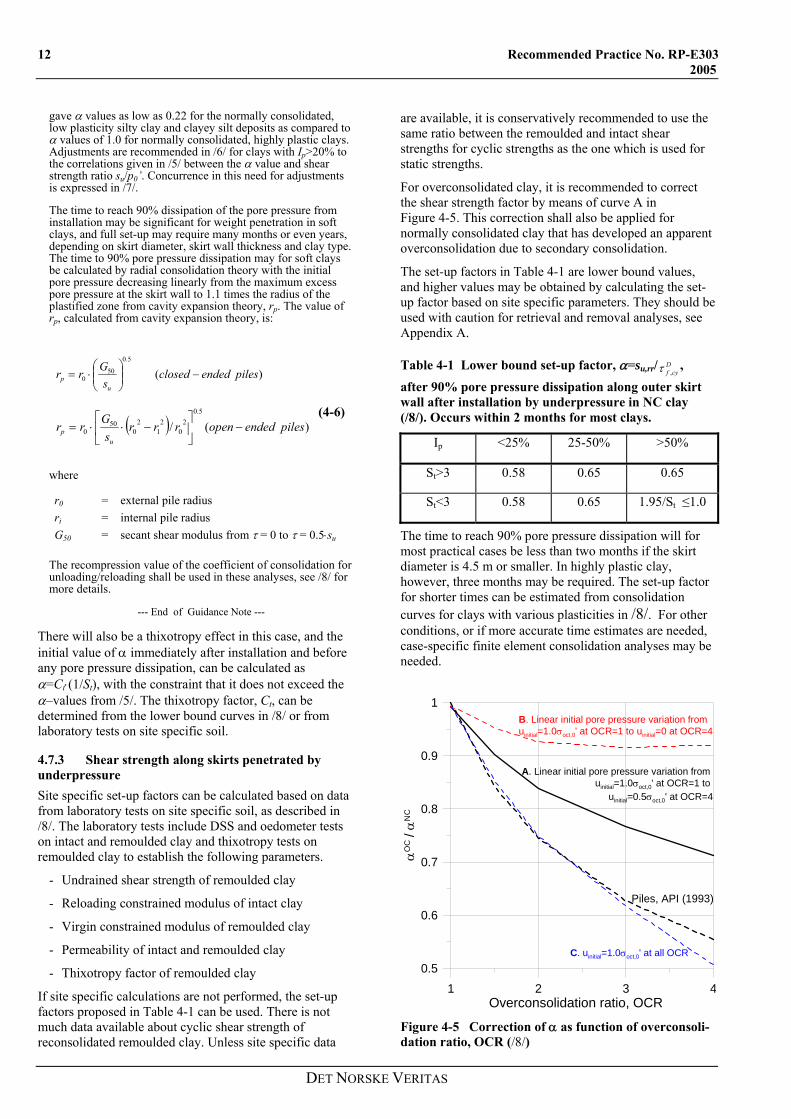
For overconsolidated clay, it is recommended to correct the shear strength factor by means of curve A in Figure 4-5. This correction shall also be applied for normally consolidated clay that has developed an apparent overconsolidation due to secondary consolidation.
The set-up factors in Table 4-1 are lower bound values, and higher values may be obtained by calculating the set-up factor based on site specific parameters. They should be used with caution for retrieval and removal analyses, see Appendix A.
Table 4-1 Lower bound set-up factor, α=su,rr/ , after 90% pore pressure dissipation along outer skirt wall after installation by underpressure in NC clay (/8/). Occurs within 2 months for most clays.
Dcyf ,τ
Ip <25% 25-50% >50%
St>3 0.58 0.65 0.65
St<3 0.58 0.65 1.95/St ≤1.0
The time to reach 90% pore pressure dissipation will for most practical cases be less than two months if the skirt diameter is 4.5 m or smaller. In highly plastic clay, however, three months may be required. The set-up factor for shorter times can be estimated from consolidation curves for clays with various plasticities in /8/. For other conditions, or if more accurate time estimates are needed, case-specific finite element consolidation analyses may be needed.
1 2 3 4Overconsolidation ratio, OCR
0.5
0.6
0.7
0.8
0.9
1
αO
C /
αN
C
Piles, API (1993)
A. Linear initial pore pressure variation from uinitial=1.0σoct,0' at OCR=1 to
uinitial=0.5σoct,0' at OCR=4
B. Linear initial pore pressure variation from uinitial=1.0σoct,0' at OCR=1 to uinitial=0 at OCR=4
C. uinitial=1.0σoct,0' at all OCR
Figure 4-5 Correction of α as function of overconsoli-dation ratio, OCR (/8/)
DET NORSKE VERITAS
Recommended Practice No. RP-E303 13 2005
4.8 Shear strength and set-up along inside skirt wall The shear strength along the inside skirt wall is needed for anchors with no top cap or in cases where one does not rely on the negative underpressure generated inside the anchor by the external loads.
The undrained shear strength along the inside skirt wall of a skirted anchor installed by underpressure can be expressed as
Dcyfrrus ,, τα ⋅= (4-7)
where
su,rr = undrained shear strength on the vertical plane along the inner skirt wall (reconsolidated remoulded shear strength)
Dcyf ,τ =
intact undrained cyclic DSS strength prior to skirt penetration, including effects of loading rate and cyclic degradation
α = set-up factor that can be determined as specified below
The shear strength along the inside skirt wall will depend on whether there are inside stiffeners or not /9/.
The set-up factor after 3 months along the skirt inside an anchor with no inside stiffeners can be estimated from Table 4-2.
Table 4-2 Lower bound inside set-up factor α for anchors with no inside stiffeners penetrated by underpressure in normally consolidated clay /9/. Use the expression that gives the highest factor. α shall not exceed 1.0.
Set-up factor α = su,wall/su,DIp (%)
10 days 3 months <30 1.15 / St 1.4 / St
30-50 1.15 / St
0.41-0.07(Ip-30)/20 1.4/St
0.55
50-80 (1.15+0.025ּ(Ip-50)) / St
0.34-0.16ּ(Ip-50)/30 1.9/St
0.55-0.17ּ(Ip-50)/30 >80 1.9/St 1.9/St
The set-up factors in Table 4-2 are valid for anchors penetrated by underpressure in normally consolidated clays, but they may be on the low side because shear stresses from the anchor weight are not included and the thixotropy factor is from the low range of thixotropy data. Calculation of a set-up factor based on site specific data may therefore give higher values. The inside set-up factor will increase with increasing overconsolidation ratio. A set-up factor of 1.0 has been calculated for Drammen Clay with OCR=4. The set-up factor may be different for anchors penetrated by weight, since less soil will then move into the anchor.
The set-up factor for the part of the plug that deforms back to the wall above internal ring stiffeners during penetration can in soft clay for most practical purposes be estimated based on sensitivity and thixotropy. The set-up factor for overconsolidated clay is higher than for normally consolidated clay. For Drammen Clay with OCR=4, the set up factor is in this case 0.8 after horizontal pore pressure redistribution and 0.7 after global pore pressure dissipation.
If the clay plug deforms back to the wall between ring stiffeners during penetration, the set-up factor can be determined from remoulded strength and thixotropy for clay from the upper part of the profile.
If the clay plug does not deform back to the wall soon after passing a stiffener during penetration, swelling may occur with time and the soil plug may deform back to the wall after some time, but the mobilised shear stress at the skirt wall is expected to be small and insignificant from a design point of view.
Since the set-up factors proposed above may be on the low side, they should be used with caution for retrieval and removal analyses, see Appendix A.
4.9 Effect of crack along outside skirt on the active side The anchor resistance may depend on whether an open crack can develop along the active side of the anchor during loading. The prediction of whether a crack will form or not is uncertain, and further research is needed to address this issue properly.
One approach is to use classical earth pressure theory, which would predict that an open crack would be possible for plane strain conditions when
4'
,zs Cu
⋅⟩
γ (4-8)
where
su,C average undrained triaxial compression shear
strength over the depth z, and
γ ’ effective unit weight of the clay.
A plane strain assumption is reasonable at the top of the soil, but at larger depths 3-D effects will cause the crack to occur be critical for smaller shear strengths than those predicted by plane strain assumptions (see /3/). The 3-D effects may be taken into account by including side shear at the sides of the soil wedge used to establish Eq. 4-6. The side shear may be calculated by using the same roughness factors as in the resistance analyses.
Guidance Note If an open vertical crack is assumed at the active side from seabed to the depth H1 (depth from where the soil flows around the anchor, see Figure 4-2), the contributions from the active earth pressure, Hactive,tot = Hactive + Hactive,side and Tactive are set equal to zero.
--- End of Guidance Note ---
DET NORSKE VERITAS

14 Recommended Practice No. RP-E303 2005
However, a crack may not necessarily form even if a crack is predicted to stand open according to the considerations above. The reason is that an underpressure will form at the interface between the clay and the anchor when the anchor tends to move away from the soil, and this underpressure will give a driving force on the soil wedge, trying to prevent the crack from forming. This underpressure may be lost if there are cracks or imperfections at this interface or in the soil in the top part of the soil deposit.
Since the prediction of formation of an open crack is uncertain, one may calculate the anchor resistance both with and without a crack, and use the lowest resistance. Alternatively, one may consider lowering the attachment point below the optimal position for a translation failure. If the attachment point is lowered far enough, the anchor will rotate backwards during failure and prevent formation of potential cracks. It should be checked that the attachment point is not lowered so much that a crack occurs on the front side of the anchor instead. It is also necessary to take into account the effect that the lower attachment point will have on the anchor resistance. The reduction may be estimated as outlined in Section 4.11.
4.10 Calculation of the cyclic shear strength
4.10.1 General The calculations should be based on anisotropic, stress path dependent undrained shear strengths. The strengths should be monotonic or cyclic, depending on the loading situation. The shear strengths are normally determined for triaxial compression, triaxial extension and DSS. The shear strengths for intermediate stress paths can be interpolated from these three based on the inclination of the potential failure surface (limiting equilibrium) or the direction of the major principal stress (finite element method). For strain softening clays, strain compatibility should be taken into account when the anisotropic monotonic shear strengths are established. Numerical analyses with a strain softening monotonic soil model are recommended when the strain softening is significant.
In cases where the monotonic load acts over a long period of time, it is important to consider the potential reduction in undrained shear strength due to creep effects. It is also important to evaluate whether drainage may occur and the effect drainage may have on the anchor resistance.
In this design code it is assumed that the loads are cyclic in nature and that the anchor resistance is calculated by use of the cyclic shear strength, τf,cy, which is discussed in Section 4.10.2 below.
4.10.2 Cyclic shear strength The cyclic shear strength τf,cy is dependent on the load history, i.e. the composition of the line tension amplitudes (number and magnitude) in the storm in question. The characteristic value of the cyclic shear strength for calculation of the characteristic anchor resistance RC shall be determined as the cyclic shear strength associated with the characteristic storm. The characteristic storm is the stationary sea state of specified duration with a return
period of 100 years. In practice, for determination of the characteristic cyclic shear strength, the characteristic storm shall be taken as that particular sea state along a 100-year environmental contour in the (HS, TP) space which produces the smallest cyclic shear strength. Here, HS and TP denote significant wave height and peak period, respectively.
Guidance Note The significant wave height HS is assumed constant during the stationary sea state that constitutes the characteristic storm. The duration of the characteristic storm may vary depending on the location and depending on the type of loading implied by the storm.
For winter storms in the North Sea, leading to wave-frequency loading of the anchor, it is common to consider stationary sea states with a duration of 3 hours. The characteristic storm for North Sea conditions is thus in principle a 3-hour sea state with a return period of 100 years. However, in the North Sea it is common practice to apply a 42-hour storm consisting of an 18-hour build-up phase, a 6-hour duration of the 100-year sea state and an 18-hour decay phase. This 42-hour idealised storm is conservative and produces a somewhat smaller cyclic shear strength than that produced by the 3-hour characteristic storm.
--- End of Guidance Note ---
The cyclic shear strength will also depend on the cyclic load period, and the cyclic laboratory tests should be run with a load period representative of the cyclic line load.
The resistance of a suction anchor will be based on the following three types of cyclic shear strengths:
Dcyf ,τ = DSS cyclic shear strength
Ccyf ,τ = triaxial compression cyclic shear strength
Ecyf ,τ = triaxial extension cyclic shear strength
In the following the DSS cyclic shear strength is used as the reference shear strength.
The relationship between the DSS cyclic strength and the triaxial cyclic strengths are given by the following equations:
DcyfC
Ccyf C ,, ττ ⋅= (4-9)
DcyfE
Ecyf C ,, ττ ⋅= (4-10)
Guidance Note Values of the ratios CC and CE for conversion between these strengths and values of other ratios for their relationships with su,D will be site-specific, and should ideally be derived based on results from adequate laboratory tests on soil specimens from the actual site. If such test results are not available results from tests on similar type of clay may be used as guidance, although conservative values should be chosen. References to published data bases are given in Appendix B.
--- End of Guidance Note ---
The relationship between the cyclic and the static undrained shear strength is expressed by means of the cyclic loading factor Ucy, which is defined as
DET NORSKE VERITAS
Recommended Practice No. RP-E303 15 2005
Du
Dcyf
cy sU
,
,τ=
(4-11)
where is the cyclic shear strength for the specified storm stress amplitude history at a particular average stress, and s
Dcyf ,τ
u,D is the monotonic undrained DSS shear strength. The cyclic loading factor is further addressed in Section 4.10.3.
Values of the factors CC, CE and Ucy will be site-specific, and should ideally be derived based on results from appropriate laboratory tests on soil specimens from the actual site. If such test results are not available results from tests on similar type of clay may be used as guidance, although conservative values should be chosen. References to published data bases are given in Appendix B.
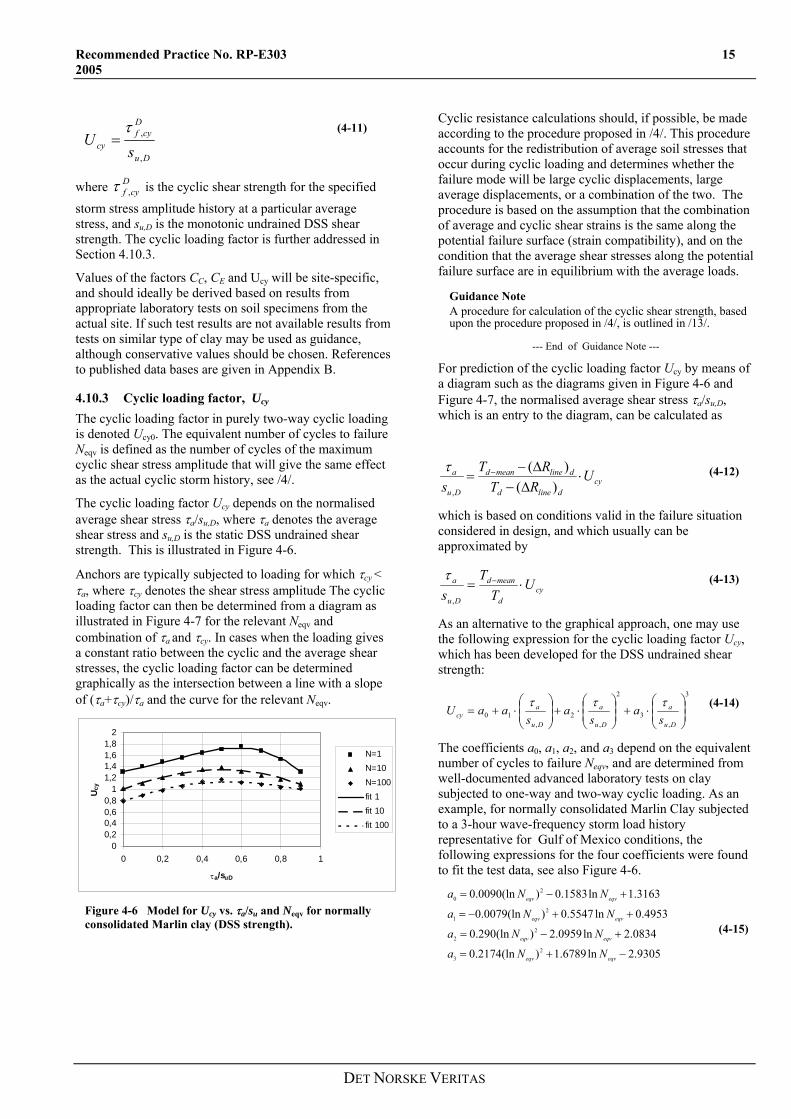
4.10.3 Cyclic loading factor, Ucy The cyclic loading factor in purely two-way cyclic loading is denoted Ucy0. The equivalent number of cycles to failure Neqv is defined as the number of cycles of the maximum cyclic shear stress amplitude that will give the same effect as the actual cyclic storm history, see /4/.
The cyclic loading factor Ucy depends on the normalised average shear stress τa/su,D, where τa denotes the average shear stress and su,D is the static DSS undrained shear strength. This is illustrated in Figure 4-6.
Anchors are typically subjected to loading for which τcy < τa, where τcy denotes the shear stress amplitude The cyclic loading factor can then be determined from a diagram as illustrated in Figure 4-7 for the relevant Neqv and combination of τa and τcy. In cases when the loading gives a constant ratio between the cyclic and the average shear stresses, the cyclic loading factor can be determined graphically as the intersection between a line with a slope of (τa+τcy)/τa and the curve for the relevant Neqv.
00,20,40,60,8
11,21,41,61,8
2
0 0,2 0,4 0,6 0,8 1
τa/suD
U cy
N=1N=10N=100fit 1fit 10fit 100
Figure 4-6 Model for Ucy vs. τa/su and Neqv for normally consolidated Marlin clay (DSS strength).
Cyclic resistance calculations should, if possible, be made according to the procedure proposed in /4/. This procedure accounts for the redistribution of average soil stresses that occur during cyclic loading and determines whether the failure mode will be large cyclic displacements, large average displacements, or a combination of the two. The procedure is based on the assumption that the combination of average and cyclic shear strains is the same along the potential failure surface (strain compatibility), and on the condition that the average shear stresses along the potential failure surface are in equilibrium with the average loads.
Guidance Note A procedure for calculation of the cyclic shear strength, based upon the procedure proposed in /4/, is outlined in /13/.
--- End of Guidance Note ---
For prediction of the cyclic loading factor Ucy by means of a diagram such as the diagrams given in Figure 4-6 and Figure 4-7, the normalised average shear stress τa/su,D, which is an entry to the diagram, can be calculated as
cydlined
dlinemeand
Du
a URT
RTs
⋅∆−
∆−= −
)()(
,
τ
(4-12)
which is based on conditions valid in the failure situation considered in design, and which usually can be approximated by
cyd
meand
Du
a UT
Ts
⋅= −
,
τ
(4-13)
As an alternative to the graphical approach, one may use the following expression for the cyclic loading factor Ucy, which has been developed for the DSS undrained shear strength:
3
,3
2
,2
,10 ⎟
⎟⎠
⎞⎜⎜⎝
⎛⋅+⎟
⎟⎠
⎞⎜⎜⎝
⎛⋅+⎟
⎟⎠
⎞⎜⎜⎝
⎛⋅+=
Du
a
Du
a
Du
acy s
as
as
aaUτττ
(4-14)
The coefficients a0, a1, a2, and a3 depend on the equivalent number of cycles to failure Neqv, and are determined from well-documented advanced laboratory tests on clay subjected to one-way and two-way cyclic loading. As an example, for normally consolidated Marlin Clay subjected to a 3-hour wave-frequency storm load history representative for Gulf of Mexico conditions, the following expressions for the four coefficients were found to fit the test data, see also Figure 4-6.
9305.2ln6789.1)(ln2174.0
0834.2ln0959.2)(ln290.0
4953.0ln5547.0)(ln0079.0
3163.1ln1583.0)(ln0090.0
23
22
21
20
−+=
+−=
++−=
+−=
eqveqv
eqveqv
eqveqv
eqveqv
NNa
NNa
NNa
NNa
(4-15)
DET NORSKE VERITAS
16 Recommended Practice No. RP-E303 2005
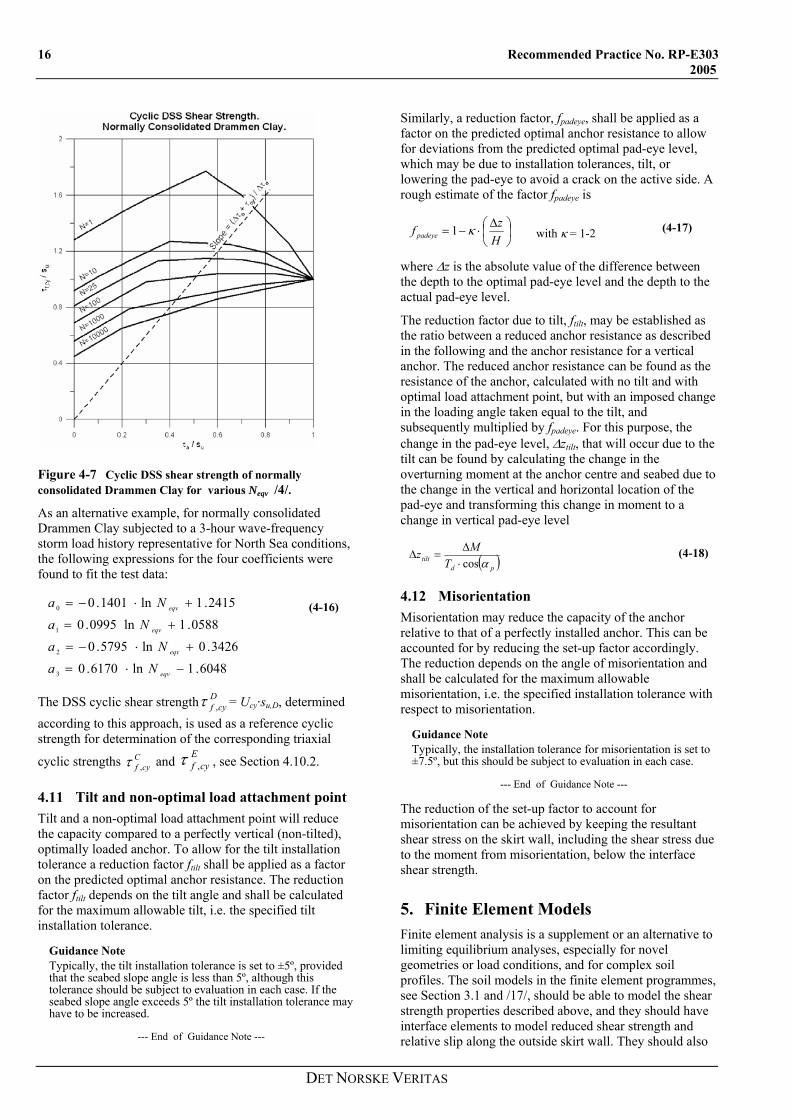
Figure 4-7 Cyclic DSS shear strength of normally consolidated Drammen Clay for various N eqv /4/.
As an alternative example, for normally consolidated Drammen Clay subjected to a 3-hour wave-frequency storm load history representative for North Sea conditions, the following expressions for the four coefficients were found to fit the test data:
6048.1ln6170.03426.0ln5795.0
0588.1ln0995.02415.1ln1401.0
3
2
1
0
−⋅=
+⋅−=
+=
+⋅−=
eqv
eqv
eqv
eqv
NaNa
NaNa
(4-16)
The DSS cyclic shear strength = UDcyf ,τ cy·su,D, determined
according to this approach, is used as a reference cyclic strength for determination of the corresponding triaxial
cyclic strengths and , see Section 4.10.2. Ccyf ,τ E
cyf ,τ
4.11 Tilt and non-optimal load attachment point Tilt and a non-optimal load attachment point will reduce the capacity compared to a perfectly vertical (non-tilted), optimally loaded anchor. To allow for the tilt installation tolerance a reduction factor ftilt shall be applied as a factor on the predicted optimal anchor resistance. The reduction factor ftilt depends on the tilt angle and shall be calculated for the maximum allowable tilt, i.e. the specified tilt installation tolerance.
Guidance Note Typically, the tilt installation tolerance is set to ±5º, provided that the seabed slope angle is less than 5º, although this tolerance should be subject to evaluation in each case. If the seabed slope angle exceeds 5º the tilt installation tolerance may have to be increased.
--- End of Guidance Note ---
Similarly, a reduction factor, fpadeye, shall be applied as a factor on the predicted optimal anchor resistance to allow for deviations from the predicted optimal pad-eye level, which may be due to installation tolerances, tilt, or lowering the pad-eye to avoid a crack on the active side. A rough estimate of the factor fpadeye is
⎟⎠⎞
⎜⎝⎛ ∆
⋅−=H
zf padeye κ1 with κ = 1-2 (4-17)
where ∆z is the absolute value of the difference between the depth to the optimal pad-eye level and the depth to the actual pad-eye level.
The reduction factor due to tilt, ftilt, may be established as the ratio between a reduced anchor resistance as described in the following and the anchor resistance for a vertical anchor. The reduced anchor resistance can be found as the resistance of the anchor, calculated with no tilt and with optimal load attachment point, but with an imposed change in the loading angle taken equal to the tilt, and subsequently multiplied by fpadeye. For this purpose, the change in the pad-eye level, ∆ztilt, that will occur due to the tilt can be found by calculating the change in the overturning moment at the anchor centre and seabed due to the change in the vertical and horizontal location of the pad-eye and transforming this change in moment to a change in vertical pad-eye level
( )pdtilt T
Mzαcos⋅
∆=∆ (4-18)
4.12 Misorientation Misorientation may reduce the capacity of the anchor relative to that of a perfectly installed anchor. This can be accounted for by reducing the set-up factor accordingly. The reduction depends on the angle of misorientation and shall be calculated for the maximum allowable misorientation, i.e. the specified installation tolerance with respect to misorientation.
Guidance Note Typically, the installation tolerance for misorientation is set to ±7.5º, but this should be subject to evaluation in each case.
--- End of Guidance Note ---
The reduction of the set-up factor to account for misorientation can be achieved by keeping the resultant shear stress on the skirt wall, including the shear stress due to the moment from misorientation, below the interface shear strength.
5. Finite Element Models Finite element analysis is a supplement or an alternative to limiting equilibrium analyses, especially for novel geometries or load conditions, and for complex soil profiles. The soil models in the finite element programmes, see Section 3.1 and /17/, should be able to model the shear strength properties described above, and they should have interface elements to model reduced shear strength and relative slip along the outside skirt wall. They should also
DET NORSKE VERITAS
Recommended Practice No. RP-E303 17 2005
have a formulation that enables accurate determination of the failure mechanism and the failure load with only small overshoot.
In 3D finite element programmes geometrical modelling and 3D effects are automatically accounted for. The limitation with 3D finite element programmes is that they are more time consuming to use.
Special quasi 3D finite element programmes based on the same geometrical transformation as the limiting equilibrium programmes can also be used. The 3D effects should then be modelled by side shear as in the limiting equilibrium models, but the side shear factors may deviate from those in the limiting equilibrium models.
Finite element models automatically find the critical failure mechanism, ensure coupling between vertical and horizontal resistance, can account for complex strength profiles, and they are better suited to determine the effect of tilt than limiting equilibrium models. They may also be best suited to calculate the resistance of anchors that are not designed with optimal load attachment point.
6. Probability-Based Design As an alternative to the deterministic design specified in Chapter 4, a full probabilistic design may be carried out to meet the safety level implied by the deterministic design code for the relevant consequence class.
Such an analysis should be at least as refined as the structural reliability analysis used to calibrate the present design code, /10/, /16/, and must be checked against the results of the calibration, at least for one test case.
The structural reliability, which is a measure of the structural safety, is defined as the probability that failure will not occur, i.e. the probability that a specified failure criterion will not be exceeded, within a specified period of time.
This section provides requirements for structural reliability analyses that are undertaken in order to document compliance with this design code for a particular suction anchor subject to design.
Acceptable procedures for structural reliability analyses are documented in /12/.
Reliability analyses shall be based on Level 3 reliability methods. These methods utilise probability of failure as a measure of safety and require knowledge of the probability distribution of all governing load and resistance variables. The probability of failure and the structural reliability are complementary probabilities, i.e. they sum to 1.0.
Target reliabilities shall be commensurate with the consequences of failure. In practice, in the context of this design code, they shall properly reflect the relevant consequence class. For Consequence Class 1, the target failure probability is a nominal annual probability of failure of 10−4. For Consequence Class 2, the target failure probability is a nominal annual probability of failure of 10−5.
7. Verification of Anchor Installation The installation of a suction anchor must be monitored to make sure that the installation proceeds as expected and that the anchor is installed as designed. The measurements should include penetration depth, applied underpressure, penetration rate, plug heave, tilt, and orientation. The lowering speed at time of touch-down at the sea bottom can be critical, in particular for large caissons with relatively limited top venting for water evacuation. It is strongly recommended that underpressure during installation should be monitored inside the anchor, rather than within the pumping unit, in order to avoid errors due to pipe losses and Venturi effects.
Methods for verification of the as-installed depth of the suction anchor should be developed, tested and verified with the involvement of anchor manufacturers, installation contractors and oil companies.
Reliable methods for measuring the tilt and misorientation of the anchor should also be developed as well as methods for measuring the plug heave after completed anchor installation.
The results from installation measurements shall be used for comparison with the installation acceptance criteria, which should reflect the tolerances allowed for and safety criteria specified at the design stage. These measurements will represent an important input for the final acceptance of the as-installed anchor.
8. References /1/
Dahlberg, R., Ronold, K.O., Strøm, P.J., Andersen, K.H. and Jostad, H.P. (2005), Project Summary, Joint Industry Project on Reliability-Based Calibration of Design Code for Suction Anchors, DNV Report No. 2005-0150. Høvik.
/2/
Offshore Standard, DNV OS-E301 (2004), Position Mooring, Det Norske Veritas. Høvik.
/3/
Andersen, K.H. and H.P. Jostad (1999), Foundation Design of Skirted Foundations and Anchors in Clay, Offshore Technology Conference, Paper OTC10824, May 1999. Houston.
/4/
Andersen, K.H. and R. Lauritzsen (1988), Bearing capacity for foundation with cyclic loads, J of Geotechnical Engineering ASCE, Vol. 114, No. 5, pp. 540-555.
/5/
API (1993) Recommended practice for planning, designing and constructing fixed offshore platforms. American Petroleum Institute, API RP 2A, 20th Edition..
/6/
Karlsrud, K., Kalsnes, B. and Nowacki, F. (1992), Response of Piles in Soft Clay and Silt Deposits to Static and Cyclic Loading Based on Recent Instrumented Pile Load Tests, Offshore
DET NORSKE VERITAS

18 Recommended Practice No. RP-E303 2005
Site Investigation and Foundation Behaviour, Society for Underwater Technology. London.
/7/
Pelletier, J.H., Murff, J.D. and Young, A.G. (1993), Historical Development and Assessment of the API Design Method for Axially Loaded Piles, Offshore Technology Conference, Paper OTC7157, pp. 253-282. Houston.
/8/
Andersen, K.H. and H.P. Jostad (2002), Shear Strength along Outside Wall of Suction Anchors in Clay after Installation, XII ISOPE Conference, 26-31 May 2002. Kyushu.
/9/
Andersen, K.H. and Jostad, H.P. (2004). Shear strength along inside of suction anchor skirt wall in clay. Proc. Paper 16844, Offshore Technology Conference, Houston, May 2004.
/10/
Ronold, K. O., Dahlberg, R., Strøm, P. J., Andersen, K. H. and Jostad, H. P. (2004), JIP Reliability-Based Calibration of Design Code for Suction Anchors: Reliability-Based Calibration of Design Code for Suction Anchors in Clay, DNV Report No. 2004-1217, Rev. 01, dated 22 December 2004. Høvik.
/11/ Dahlberg, R. and Mathisen, J. (2002), Consistent Design Codes for Anchors and Mooring Lines, Conference on Offshore Mechanics and Arctic Engineering (OMAE), Paper 28424. Oslo.
/12/ Det Norske Veritas (1992), Structural Reliability Analysis of Marine Structures, Classification Notes No. 30.6. Høvik.
/13/ Det Norske Veritas (2002), Design and Installation of Plate Anchors in Clay, DNV Recommended Practice RP-E302, December, 2002. Høvik.
/14/ Randolph, M.F. and Houlsby, G.T. (1984), The Limiting Pressure on a Circular Pile Loaded Laterally in Cohesive Soil, Geotechnique, Vol. 34, No. 4, pp. 613-623.
/15/ Brinch-Hansen, J. (1970), A Revised and Extended Formula for Bearing Capacity, Geoteknisk Institutt, Bulletin No. 28, pp. 5-11. Copenhagen.
/16/ Ronold, K.O., Dahlberg, R., Strøm, P.J., Andersen, K.H. and Jostad, H.P. (2004), JIP Reliability-Based Calibration of Design Code for Suction Anchors: Variation Studies, DNV Report No. 2004-1214, Rev. 01, Det Norske Veritas. Høvik.
/17/ Andersen, K.H., Murff, J.D., Randolph, M.F., Clukey, E.C., Erbrich, C., Jostad, H.P., Hansen, B., Aubery, C., Sharma, P. and Supachawarote, C. (2005), Suction Anchors for Deepwater Applications, ISFOG, International Symposium on Frontiers in Offshore Geotechnics, 19-21 September 2005. Perth.
/18/ Murff, J. D. and Hamilton, J. M. 1993. P-ultimate for undrained analysis of laterally loaded piles. J. of Geotechnical Engrg, ASCE, Vol. 119, No. 1, pp. 91-107.
/19 Offshore Standard, DNV OS-C101 (2004), Design of Offshore Steel Structures, General (LRFD Method), Det Norske Veritas. Høvik.
DET NORSKE VERITAS
Recommended Practice No. RP-E303 19 2005
Appendix A Installation, Retrieval and Removal Analyses A1 General The installation analyses of suction anchors contain calculation of skirt penetration resistance, underpressure needed to achieve target penetration depth, allowable underpressure (underpressure giving either large soil heave inside the skirts or cavitation in the water), and soil heave inside the caisson.
Recommended calculation procedures for the various items are presented below. The recommendations are based on the procedures given in /3/, supplemented by procedures to determine the effect of internal stiffeners based on more recent work (e.g. in /9/).
A2 Penetration resistance A2.1 Basic equations The penetration resistance, Qtot, for skirts without stiffeners is calculated as the sum of the side shear along the skirt walls, Qside, and the bearing capacity at the skirt tip, Qtip; i.e.:
( ) tipav
tipucav
Duwall
tipsidetot
AzsNsA
QQQ
⋅⋅+⋅+⋅⋅=
+=
',, γα (A-1)
where
Awall = skirt wall area (sum of inside and outside)
Atip = skirt tip area
α = shear strength factor (normally assumed equal to the inverse of the sensitivity; if the skirt wall is painted or treated in other ways, this must be taken into account in the α-factor)
avDus , = average DSS shear strength over penetration
depth av
tipus , = average undrained shear strength at skirt tip level (average of triaxial compression, triaxial extension and DSS shear strengths)
γ ' = effective unit weight of soil
Nc = bearing capacity factor, plane strain conditions
z = skirt penetration depth
The skirt tip resistance may be reduced if underpressure is used to penetrate the skirts. The skirt tip resistance may also be influenced by the shear stress along the skirt wall. However, the skirt tip resistance is normally not significant for steel skirts in clay, and these effects are therefore neglected in the equation above.
A2.2 Inside stiffeners Inside stiffeners may influence the skirt penetration resistance. The skirt penetration resistance may increase due to the bearing capacity of stiffeners, and the shear strength above the stiffener may be reduced due to the disturbance from the stiffener /9/.
In cases without ring stiffeners, and below the first ring stiffener in cases with ring stiffeners, the shear strength along the inside skirt wall is calculated as for the outside skirt wall.
In cases with internal ring stiffeners, it should be checked whether the upper part of the clay plug will deform back to the skirt wall after passing the 1st ring stiffener. This can be done by calculating the equilibrium between the shear stresses from the weight of the clay plug and a certain percent of the mean triaxial compression strength over the height of the clay plug /9/. The percent of the triaxial compression strength can be determined from results of special triaxial tests deformed in extension followed by compression to simulate the strain history of a soil element that enters into the anchor, passes a ring stiffener and expands laterally after having passed the ring stiffener.
If there is only one ring stiffener, the shear strength along the inside skirt wall is set to zero to the depth where the clay plug deforms back to the wall. Below this depth, the shear strength along the inside skirt wall is calculated as for the external wall.
In cases with more than one ring stiffener, the shear strength along the inside skirt wall above the first stiffener is set equal to either zero or the remoulded shear strength of clay from the upper part of the profile, assuming that either water or clay from the upper part of the profile will be trapped in the compartments between the stiffeners. It is assumed that water is trapped if the plug can stand to a depth that is larger than the distance between the stiffeners.
The bearing capacity of a stiffener can be calculated by bearing capacity formulas. The bearing capacity factor may be influenced by remoulded clay along the skirt wall, remoulded clay trapped in a wedge below the stiffener, and remoulded clay along the skirt wall above the stiffener. The bearing capacity factors are therefore likely to be smaller than the theoretical bearing capacity factors for homogeneous soil.
If the distance between ring stiffeners is less than about 10 times the stiffener width, there may be interaction between the stiffeners, and the resistance may be less than the sum of the resistances from the individual stiffeners. If the clay plug does not deform back to the skirt wall, there will be no interface shear strength above the first stiffener. If there is trapped clay between the stiffeners, it is also likely that the critical shear surface will follow a cylinder along the inner diameter of the ring stiffeners, thus mobilizing bearing capacity only for the first ring stiffener.
DET NORSKE VERITAS
20 Recommended Practice No. RP-E303 2005
A2.3 Outside stiffeners The bearing capacity of outside stiffeners is normally calculated by bearing capacity formulas with considerations of reduced shear strength due to disturbance during penetration. The interface strength above outside stiffeners is uncertain. Outside stiffeners may reduce the interface strength and even cause a gap along the skirt wall. Since generally accepted calculation methods are not available for this problem, it is recommended not to use outside stiffeners. In cases with variations in the skirt wall thickness, it is recommended to keep the external diameter constant.
The penetration resistance may be higher if there are sand layers or boulders in the clay.
A2.4 Soil heave inside skirts The soil heave inside the skirts during installation may be estimated by assuming that the clay replaced by skirts and inside stiffeners goes into the skirt compartment. It is then assumed that the applied underpressure is below the allowable underpressure as defined in Section A3 in the calculation of bottom heave at skirt tip level. More soil may move into the skirt if the allowable underpressure is set higher.
For the part of the anchor penetrated by self weight, one may reduce the amount of soil from the skirts to 50%, assuming that 50% of the soil replaced by the skirts goes to the outside when the anchor is penetrated by weight.
If the clay plug may stand under its own weight after passing a stiffener, or if water is trapped between ring stiffeners, that will add to the soil heave.
The skirt length must be increased by the height of the soil heave in order to achieve the target skirt penetration depth. It should also be remembered that tilt may necessitate an increase in skirt length to maintain the target effective skirt penetration depth.
A3 Underpressure A3.1 Necessary underpressure The underpressure, ∆un, needed within the skirt compartment to penetrate the skirts is calculated by:
( ) intotn AWQu /'−=∆ (A-2)
where
W’ submerged weight during installation
Ain plan view inside area where underpressure is applied
Stiffeners shall be included in the Qtot–value as outlined in Sections A2.2 and A2.3.
If the penetration process is stopped temporarily the resistance to further penetration will increase due to thixotropy effects before pore pressure dissipation becomes significant, see e.g. /8/ and /9/. Conservatively, the upper limit thixotropy factor in /8/ should be used, unless site specific data are available.
A3.2 Allowable underpressure The allowable underpressure with respect to large soil heave inside the cylinder due to bottom heave at skirt tip level can be calculated by bearing capacity considerations from:
inav
DuinsideLB
tipuca AsAsNu /,, ⋅⋅+⋅=∆ α (A-3)
where
Nc bearing capacity factor varying from 6.2 to 9 depending on depth/diameter ratio during penetration.
Ainside inside skirt wall area LB
tipus , 2/3 of the average of compression, extension and DSS shear strengths at skirt tip level. The factor 2/3 should be looked upon as a safety factor of 1.5 with respect to achieving full penetration when specifying the allowable underpressure. Using the strengths at skirt tip level may be conservative in cases with increasing strength with depth or if there are stronger layers within the expected failure zone. This should be taken into account if relevant.
Stiffeners and soil heave inside skirts should be accounted for according to Section A2.
In shallow water one must check that the allowable pressure does not exceed the cavitation pressure.
Guidance Note Although the structural design of the suction anchor is not addressed herein, it should be noted that this will require a close interaction between the geotechnical and structural disciplines. Of particular importance in this respect is the critical suction that could cause the cylinder wall to implode during installation. This critical suction is dependent on the effective buckling length of the cylinder, and will be a function of unsupported height and mutual stiffness ratio between cylinder wall and seabed soils. The critical suction will in many cases be governing for the wall thickness in the upper section of the suction anchor.
--- End of Guidance Note ---
A4 Retrieval and removal analyses Retrieval and removal can be achieved by pumping water into the confined skirt compartment, thus creating an overpressure that will drive the anchor out of the soil.
Guidance Note According to this design code, a distinction is made between retrieval and removal of a suction anchor as follows:
Retrieval Recovery as a contingency means during the installation phase, and subsequent re-installation
Removal Permanent recovery of anchor after completion of the operational phase
--- End of Guidance Note ---
The same equations as used for the penetration analysis are used for the retrieval and removal analysis, but “set-up”
DET NORSKE VERITAS
Recommended Practice No. RP-E303 21 2005
effects on the side shear along the skirt must be accounted for. Recommendations for determination of the “set-up”-factor for retrieval and removal analyses are given see /3/, /5/, /8/ and /9/. For removal analyses upper bound soil parameters should be used.
Load factors applicable to retrieval and removal analyses are given in /19/.
If the weight of the structure is carried by a crane, the submerged weight, W’, is set to zero.
DET NORSKE VERITAS
22 Recommended Practice No. RP-E303 2005
Appendix B General Requirements for Soil InvestigationsB1 Geophysical surveys The depth of sub-bottom profiling should correspond to the depth of rock or the expected depth of anchor penetration, plus at least the suction anchor diameter. The seismic profiles should be tied in to geotechnical borings within the mooring area, which will improve the basis for interpretation of the results from the geophysical survey. Emphasis should be on very high resolution tools for surveying the top 50 metres of sediments.
B2 Geotechnical surveys
The soil investigation should be planned and executed in such a way that the soil stratigraphy can be described in sufficient detail for both the anchor and the anchor line analysis. The soil investigations should cover the expected depth of anchor penetration, plus at least the suction anchor diameter.
The extent of the soil investigation, sampling frequency and depth of sampling/testing, will depend on a number of project specific factors, e.g. the number of anchor locations, soil stratigraphy and variability in soil conditions with depth and between the potential anchoring points, water depth, sea floor bathymetry, etc.
The challenge to secure soil samples of sufficient quality to determine realistic strength parameters increases with the water depth, and the efforts to improve the existing, and develop new, sampling procedures should continue. Nevertheless, in situ testing will become increasingly important for mapping of the soil conditions in deep waters.
If soil layering is such that the layer sequence and the variation of thickness and layer boundaries will become an important anchor design and installation consideration, it will be necessary to document the soil layer sequence at each anchor location. The thickness of all significant layers, and the thickness variation between the anchoring locations, should be known with reasonable accuracy prior to the design of the anchor foundation.
Piezocone penetration testing (PCPT) normally provides valuable and useful information about soil stratigraphy, but the undrained shear strength derived from such tests will be uncertain if the PCPT results are not calibrated against laboratory strength tests on recovered soil samples. If generally adopted correlation factors are used the undrained shear strength derived will be affected by the uncertainty in this correlation factor.
One should, however, be aware of the increasing effect of sample disturbance as the water depth increases, which may lead to conservative, or unconservative, laboratory determinations of the su-values depending on the laboratory testing procedures adopted.
Full flow penetrometers, like the T-bar, are tools under development for determination of the in situ undrained shear strength of soft clay. The T-bar measurements are less influenced by the water depth at the test site and has
the potential to measure low shear strengths at large water depth more accurately than the PCPT. However, the T-bar method is still quite new and must still be used with caution in commercial projects. Some empirical factors to translate T-bar resistance to shear strength are given in /B1/.
The number of borings and in situ testing that should be considered depends on the soil variability across the mooring pattern, which may be established by means of sub-bottom profiling. Typically, one boring and/or PCPT should be taken at each anchor location in cases with lateral variation in soil properties, or at least within each anchor cluster provided that the sub-bottom profiling shows little variation in soil properties across the mooring pattern. The soil parameters for design of suction anchors according to the recommendations in Chapter 4 will require high quality push sampling in combination with advanced laboratory testing and correlations with PCPT results. If other methods for soil sampling are chosen the effects on the quality of soil samples should be considered in the design. The soil investigation should consider that during the detailed platform and mooring design process, the anchor distances and mooring leg headings may change due to changes in field layout, platform properties and mooring leg properties.
The soil investigation and soil properties interpretation should ideally provide the following information needed for the reliable design of suction anchors for permanent mooring systems:
- Definition of soil characteristics, such as general soil description, layering, etc;
- Upper and lower bound undrained anisotropic shear strength properties;
- Submerged unit weight;
- Soil stress history and over-consolidation ratio (OCR);
- Soil consolidation, unloading and reconsolidation data (compressibility and permeability) in case of long term loading or if site specific “set-up” analyses shall be performed.
- Soil sensitivity, e.g. by laboratory fall cone or in situ vane tests;
- Cyclic shear strength under combined average and cyclic loads for triaxial and direct simple shear (DSS) stress paths;
- Creep data to define loss of strength under sustained load (in cases where large sustained loads, e.g. loop currents, are important). As for above, cyclic stresses should be superimposed on the sustained stresses if relevant for the actual load conditions;
- In case the behaviour of the soil plug and the shear strength along the inside skirt wall are important, one may also consider special triaxial tests with an extension to compression load history
DET NORSKE VERITAS
Recommended Practice No. RP-E303 23 2005
In case site specific “set-up” analyses are to be performed, one will also need:
- Remoulded soil consolidation characteristics (compressibility and permeability);
- Reconsolidated remoulded soil strength characteristics;
- Thixotropy;
If the shear strength along the outside skirt wall is important for design, see Section 4.7, one should consider performing laboratory tests on soil from the actual site. The thixotropy effect is based on the lower bound of the database. Higher shear strength factors may be justified by running thixotropy tests on site specific clay. The laboratory tests could include DSS and oedometer tests on remoulded and intact clay and thixotropy tests. The laboratory test results can then be used together with diagrams in /8/, to determine a more accurate site specific shear strength factor, α.
If the shear strength along the inside skirt wall is important for design, see Section 4.8, it is recommended to perform special laboratory tests on site specific clay, since the recommendations are based on limited data. Such laboratory tests should include extension/compression triaxial tests to determine whether the clay plug may stand under its own weight, and thixotropy, oedometer and DSS tests on remoulded clay to determine parameters to repeat the calculations described in /9/ with site specific parameters.
For calculation of the effect of cyclic loading on the long term anchor resistance, it is recommended to carry out a series of static and cyclic undrained DSS and triaxial tests. These tests should be carried out on representative soil samples of high quality, which shall be subjected to stress conditions that simulate the in situ conditions as closely as possible. A combined static/cyclic test programme should allow determination of the strength of the soil under the range of loading conditions that are expected to act on the anchor during a storm. Such a test programme will normally be defined so that the cyclic tests cover a representative combination of average and cyclic shear stresses. A mooring line will be subjected only to tensile loads, i.e. no compression loads, which means that the soil surrounding the anchor will be subjected to essentially a one-way type of cyclic loading.
The cyclic laboratory tests should be run with a load period representative of the line load period, as cyclic degradation will increase with increasing load period (/B4/).
When planning the cyclic test programme it is recommended to have in mind the subsequent use of the results, namely the construction of a strain contour diagram, as required for calculation of the cyclic shear strength (τf,cy). The scope and content of the cyclic test programme will always have to be tailored to the actual project, the need for site specific cyclic test data versus the project budget, etc.
In general, the average shear stress level, τa/su , representative of the design mean line tension over the design tension in a storm Td,mean/Td, will lie in the range 0.5-0.8, which implies that the cyclic test programme should concentrate on acquiring test data for this range of average shear stress levels. One may also consider that the failure path, starting from a cyclic/average shear stress ratio τcy/τa = 0 in a τcy/su vs. τa/su plot will develop along a line sloping more or less along a 45° path, either towards failure in compression, extension or DSS. It would be efficient from a testing point of view to locate the test cases so that the majority of the tests fall along this path.
Besides the cyclic tests, it will be desirable to carry out a few reference static tests, both triaxial compression, triaxial extension and DSS tests. If site specific soil data are not provided for assessment of the cyclic loading effect, a conservative assessment of this effect is warranted. For guidance in the planning and interpretation of a cyclic test programme, and in the assessment of the effects of cyclic loading, existing data (e.g. /B2/, /B3/ and /B4/) may be utilised. It is important not to underestimate the effect of cyclic loading in the absence of site specific test data.
B3 References
/B1/ Lunne, T., Randolph, M.F., Chung, S.F., Andersen, K.H. and Sjursen, M. (2005) Comparison of cone and T-bar factors in two onshore and one offshore clay sediments To be published in ISFOG, International Symposium on Frontiers in Offshore Geotechnics, 19-21 September 2005. Perth.
/B2/
Andersen, K.H., A. Kleven and D. Heien (1988) Cyclic soil data for design of gravity structures.J of Geotechnical Engineering ASCE, Vol. 114, No. 5, pp. 517-539.
/B3/ Jeanjean P., Andersen K.H., and Kalsnes, B. (1998) Soil Parameters for Design of Suction Caissons for Gulf of Mexico Deepwater Clays, Proc. Offshore Technology Conference, Houston, OTC 8830,Houston, May 1998.
/B4/
Andersen, K.H. (2004). Cyclic clay data for foundation design of structures subjected to wave loading. Invited General Lecture. Proc., Intern. Conf. on Cyclic Behaviour of Soils and Liquefaction Phenomena, CBS04, Bochum, Germany, 31.3-2.4, 2004. Proc. p. 371-387, A.A. Balkema Publishers, Ed Th. Triantafyllidis.
DET NORSKE VERITAS

DET NORSKE VERITAS
DNV (Det Norske Veritas) is an independent, autonomous Foundation working to safeguard life, property
and the environment. DNV comprises 300 offices in 100 countries, with 6,400 employees.