Embed Size (px)
Citation preview
Gillian Rozenberg
MicroscopicHaematology
a practical guide for the laboratory
3e


Gillian Rozenberg
Sydney Edinburgh London New York Philadelphia St Louis Toronto
Churchill Livingstoneis an imprint of Elsevier
Elsevier Australia. ACN 001 002 357(a division of Reed International Books Australia Pty Ltd)Tower 1, 475 Victoria Avenue, Chatswood, NSW 2067
This edition © 2011 Elsevier Australia
This publication is copyright. Except as expressly provided in the Copyright Act 1968 and the Copyright Amendment (Digital Agenda) Act 2000, no part of this publication may be reproduced, stored in any retrieval system or transmitted by any means (including electronic, mechanical, microcopying, photocopying, recording or otherwise) without prior written permission from the publisher.
Every attempt has been made to trace and acknowledge copyright, but in some cases this may not have been possible. The publisher apologises for any accidental infringement and would welcome any information to redress the situation.
This publication has been carefully reviewed and checked to ensure that the content is as accurate and current as possible at time of publication. We would recommend, however, that the reader verify any procedures, treatments, drug dosages or legal content described in this book. Neither the author, the contributors, nor the publisher assume any liability for injury and/or damage to persons or property arising from any error in or omission from this publication.
National Library of Australia Cataloguing-in-Publication Data___________________________________________________________________
Rozenberg, Gillian.
Microscopic haematology: a practical guide for the laboratory / Gillian Rozenberg.
3rd ed.
9780729540728 (pbk.)
Blood--Diseases--Diagnosis.Blood--Examination--Atlases.
616.150758___________________________________________________________________
Publisher: Melinda McEvoyDevelopmental Editor: Rebecca CornellPublishing Services Manager: Helena KlijnProject Coordinator: Natalie HamadEdited by Sybil KestevenProofread by Sarah Newton-JohnCover and internal design by Lisa PetroffIndex by Typeset by TnQ Books & JournalsPrinted by

v
CONTENTSPreface viiAbbreviations ixReviewers xiii
Part A Erythrocytes A1 Erythropoiesis 2 A2 Defi ciency anaemias 8 A3 Haemolytic anaemias 12 A4 Haemoglobin disorders 23 A5 Red cell membrane disorders 34 A6 Miscellaneous red cell abnormalities 42
Part B Leucocytes and platelets B1 Myeloid cells 46 B2 Monocytes and macrophages 92 B3 Platelets 101 B4 Lymphocytes 106 B5 Plasma cells 142 B6 Acute myeloid leukaemia (AML) and related precursor neoplasms 150
Part C Haematology relating to paediatrics C1 Red cell disorders in the neonate and childhood 185 C2 Bone marrow failure 191 C3 Benign disorders of leucocytes in the neonate and childhood 199 C4 Myeloproliferative neoplasms in the neonate and childhood 205 C5 Non-haemopoietic malignancies in the neonate and childhood 210 C6 Storage disorders in the neonate and childhood 218 C7 Platelet abnormalities in the neonate and childhood 223
Part D Blood parasites D1 Malarial parasites 230 D2 Non-malarial blood parasites 244
Index 249


vii
PREFACETh e third edition of Microscopic Haematology: A Practical Guide for the Laboratory, main-tains the standard and picture quality achieved in the second edition. Th e third edition includes descriptions of neoplasms according to the fourth edition of the WHO Classifi cation of Tumours of Haematopoietic and Lymphoid Tissues. Additional red cell disorders and white cell neoplasms, including non-Hodgkin lymphoma have been included in this edition. An additional ninety-two images have also been included.
I am indebted to a number of people for their assistance in compiling this book. I would like to thank Professor Robert Lindeman (Director of the Department of Haema-tology at the Prince of Wales Hospital, Sydney) for allowing me to access all the blood fi lms and bone marrow slides in our laboratory. I am especially indebted to Michael Oakey and Virginia Bentink for their invaluable help and experience in producing a CD-ROM of all 450 images. Th ank you to Pauline Dalzell for her expert assistance in updating the cytogenetics of haemopoietic and lymphoid neoplasms. Above all, I wish to thank Narelle Woodland (Senior Lecturer and Coordinator of Haematology at the University of Technol-ogy, Sydney) for her advice and continued support during my writing of this third edition.


ix
ABBREVIATIONSABL1 Abelson murine leukaemia viral oncogene homolog1aCML atypical chronic myeloid leukaemiaadd additionADP adenosine diphosphateAIDS acquired immunodefi ciency syndromeAIHA autoimmune haemolytic anaemiaALL acute lymphoblastic leukaemiaAMEGA amegakaryocyticAML acute myeloid leukaemiaAP-AAP alkaline phosphatase-anti-alkaline phosphataseAPL acute promyelocytic leukaemiaATLL adult T-cell leukaemia/lymphomaATPase adenosine triphosphataseATRA all-trans retinoic acidAUL acute undiff erentiated leukaemiaBCL2 B-cell CLL/lymphoma 2BCL6 B-cell CLL/lymphoma 6BCL10 B-cell CLL/lymphoma 10BCR breakpoint cluster regionBL Burkitt lymphomaBM bone marrowB-PLL B-cell prolymphocytic leukaemiaBSS Bernard-Soulier syndromeCCND1 cyclin D1cCD cytoplasmic cluster of diff erentiationCD cluster of diff erentiationCDA congenital dyserythropoietic anaemiaCEL chronic eosinophilic leukaemiaCHL classical Hodgkin lymphomaCLL/SLL chronic lymphocytic leukaemia/small lymphocytic lymphomaCMML chronic myelomonocytic leukaemiaCM cutaneous mastocytosisCML chronic myelogenous leukaemiaCML-AP chronic myelogenous leukaemia-accelerated phaseCML-BP chronic myelogenous leukaemia-blast phaseCML-CP chronic myelogenous leukaemia-chronic phaseCMV cytomegalovirusCNL chronic neutrophilic leukaemiaCNS central nervous systemCSF cerebrospinal fl uidCTCL cutaneous T-cell lymphomacyt-μ cytoplasmicDAT direct antiglobulin testDBA Diamond-Blackfan anaemiaDC dyskeratosis congenita

x Abbreviations
DEB diepoxybutanedel deletionder derivativeDIC disseminated intravascular coagulationDLBCL diff use large B-cell lymphomaDNA deoxyribonucleic acidEBV Epstein-Barr virusEDTA ethylenediamine tetraacetic acidESR erythrocyte sedimentation rateET essential thrombocythaemiaETV6 ETS variant geneEWS Ewing sarcomaFA Fanconi anaemiaFGFR1 fi broblast growth factor receptor 1FISH fl uorescence in situ hybridisationFLI1 interleukin 1 family, member 7 (zeta) FLT3 FMS-related tyrosine kinase 3G-CSF granulocyte colony-stimulating factorGP glycoproteinGPS gray platelet syndromeG-6-PD glucose-6-phosphate dehydrogenaseHbCS haemoglobin Constant SpringHbF fetal haemoglobinHbH haemoglobin HHCL hairy cell leukaemiaH&E haematoxylin and eosinHE hereditary elliptocytosisHELLP haemolysis, elevated liver enzymes and low platelet countHEMPAS hereditary erythroblastic multinuclearity with a positive acidifi ed
serum testHES hypereosinophilic syndromeHIV human immunodefi ciency virusHL Hodgkin lymphomaHPP hereditary pyropoikilocytosisHS hereditary spherocytosisHTLV-1 human T-cell leukaemia virus (human T-lymphotrophic virus) type 1HUS haemolytic uraemic syndromei isochromosomeIGH IgG heavy chain LocusIGK immunoglobulin kappaIGL immunoglobulin lambdaIL3 interleukin 3IM infectious mononucleosisinv inversionISSD infantile sialic acid storage diseaseITP idiopathic thrombocytopenic purpuraJAK2 Janus Kinase 2JMML juvenile myelomonocytic leukaemiaKIT V-KIT Hardy-Zuckerman 4 feline sarcoma viral oncogene homologLCH Langerhans’ cell histiocytosisLDHL lymphocyte-depleted classical Hodgkin’s lymphoma
xiAbbreviations
LGL large granular lymphocyteLPL lymphoplasmacytic lymphomaLRCHL lymphocyte-rich classical Hodgkin lymphomaMALT mucosa-associated lymphoid tissueMALT1 mucosa-associated lymphoid tissue lymphoma translocation gene 1MCCHL mixed cellularity classical Hodgkin lymphomaMCH mean cell haemoglobinMCHC mean cell haemoglobin concentrationMCL mast cell leukaemiaMCV mean cell volumeMDS myelodysplastic syndromeMDS/MPD,U myelodysplastic/myeloproliferative neoplasm, unclassifi ableMDS-U myelodysplastic syndrome, unclassifi ableMHA May-Hegglin anomalyMLL mixed lineage leukaemia geneMPAL mixed phenotype acute leukaemiaMPN,U myeloproliferative neoplasm, unclassifi ableMPO myeloperoxidaseMPV mean platelet volumeMYC V-MYC avian myelocytomatosis viral oncogene homologNaF sodium fl uorideNAP neutrophil alkaline phosphataseN/C ratio nuclear cytoplasmic ratioNEC necrotising enterocolitisNHL non-Hodgkin lymphomaNK natural killerNLPHL nodular lymphocyte predominant Hodgkin lymphomaNOS not otherwise specifi edNPM1 nucleophosmin/nucleoplasmin family member 1NRBCs nucleated red blood cellsNSCHL nodular sclerosis classical Hodgkin lymphomaPB peripheral bloodPAS periodic acid-Schiff PBX1 pre-B-cell leukaemia transcription factor 1PCH paroxysmal cold haemoglobinuriaPDGFRA platelet-derived growth factor receptor, alphaPDGFRB platelet-derived growth factor receptor, betaPDW platelet distribution widthPh Philadelphia chromosomePK pyruvate kinasePLL prolymphocytic leukaemiaPMF primary myelofi brosisPNH paroxysmal nocturnal haemoglobinuriaPV polycythaemia veraRA refractory anaemiaRAEB refractory anaemia with excess blastsRAEB-F refractory anaemia with excess blasts with fi brosisRARA retinoic acid receptor alpha geneRBC red blood cellRARS refractory anaemia with ring sideroblastsRCC refractory cytopenia of childhood
xii Abbreviations
RCMD refractory cytopenia with multilineage dysplasiaRCMD-RS refractory anaemia with multilineage dysplasia and ring sideroblastsRCUD refractory cytopenia with unilineage dysplasiaRDW red cell distribution widthRN refractory neutropeniaRNA ribonucleic acidRT refractory thrombocytopeniaRUNX1 runt-related transcription factor 1SBB Sudan black BSDS Shwachman-Diamond syndromeSIg surface immunoglobulinSM systemic mastocytosisSMZL splenic marginal zone lymphomat translocationTAM transient abnormal myelopoiesist-AML therapy-related acute myeloid leukaemiaTAR thrombocytopenia with absent radiiTCR T-cell receptorTdT terminal deoxynucleotidyl transferaseTEC transient erythroblastopenia of childhoodT-LGL T-cell large granular lymphocytic leukaemiat-MDS therapy-related myelodysplastic syndromet-MDS/MPN therapy-related myelodysplastic syndrome/myeloproliferative neoplasmTP53 Tumour protein p53T-PLL T-cell prolymphocytic leukaemiaTTP thrombotic thrombocytopenic purpuraWAS Wiskott-Aldrich syndromeWBC white blood cellWCC white cell countWHO World Health OrganizationZBTB16 zinc fi nger-and BTB domain-containing protein 16

xiii
REVIEWERSJohn M Bennett MDProfessor Emeritus, Department of MedicineProfessor, Department of Pathology and Laboratory MedicineUniversity of Rochester, New York, USAEditor-in-Chief: Leukemia Research JournalChair: Scientifi c Advisory Board, Bio-Reference Laboratories
Peter Greenberg MDProfessor of Medicine/Hematology DivisionDirector, Stanford MDS CenterStanford University Cancer CenterStanford, California, USA
Valerie Ng PhD, MDPresident, ACMC Medical Staff 2008–2010Chairman, Laboratory Medicine & Pathology Director, Clinical Laboratory Alameda County Medical Center/Highland General Hospital Oakland, California, USA
Philip John Wakem NZCS, Dip MLT(NZ), MMLSc, MNZIMLSProgramme Co-ordinator and Haematology Technical SpecialistPacifi c Paramedical Training Centre Wellington, New Zealand
Narelle Woodland MScSenior LecturerDept of Medical and Molecular BiosciencesUniversity of Technology (UTS)Sydney, New South Wales, Australia

PART A
ERYTHROCYTES

2
NORMOBLASTIC ERYTHROPOIESIS Erythropoiesis is divided into a number of stages. Th e earliest recognisable red cell precur-sor in the bone marrow is known as the proerythroblast; this gives rise to the basophilic erythroblast, the polychromatic erythroblast, the orthochromatic erythroblast, the poly-chromatic red cell (reticulocyte) and the mature red cell.
Normal erythropoiesis is characterised by the following progressive changes: (a) Reduction in cell size (b) Maturing of the cytoplasm: as the cytoplasm gradually acquires haemoglobin it
changes from a basophilic to an eosinophilic colour. Th is change is accompanied by a gradual loss of RNA
(c) Maturing of the nucleus: the chromatin strands gradually become condensed and pyknotic; nucleoli are lost and the nucleus is fi nally extruded at the orthochromatic stage while the cell is still within the bone marrow. Th e resulting polychromatic red cell or reticulocyte still contains some RNA, which, after a period of 1 – 2 days, completely disappears and a fully haemoglobinised mature red cell or erythrocyte results.
Th ese cell characteristics are seen in fi xed preparations stained with a Romanowsky stain.
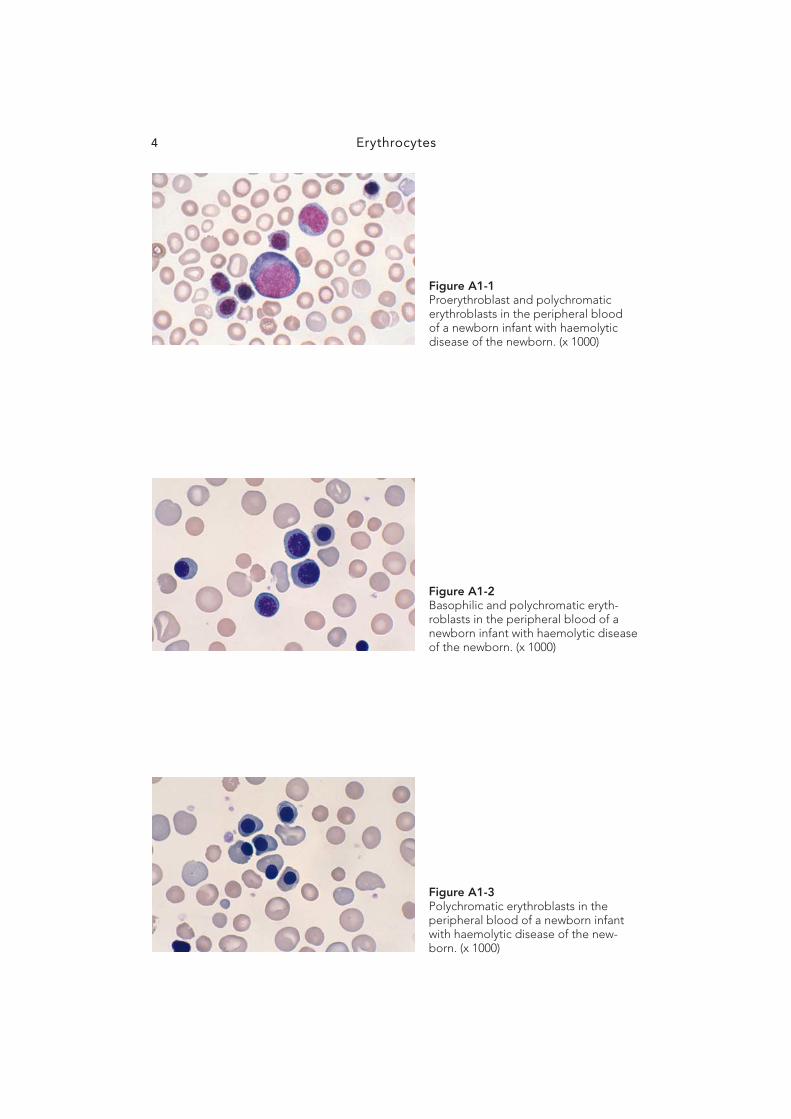
Proerythroblast Th e proerythroblast varies from 12 to 20 μ m in diameter and has a large nucleus that occupies most of the cell. Th e chromatin strands are fi ne, giving an even reticular appear-ance. Nucleoli are present. Th e cytoplasm is intensely basophilic—much more so than is seen in blast cells of the white cell series. Refer to Fig A1-1 .
Basophilic erythroblast Th e basophilic erythroblast varies from 10 to 16 μ m in diameter. Th e nucleus is still rela-tively large and the chromatin strands are thick, giving a coarse appearance; there are no nucleoli present. Th e cytoplasm is still very basophilic. Refer to Fig A1-2 .
Polychromatic erythroblast Th e polychromatic erythroblast varies from 8 to 14 μ m in diameter. Th e nucleus is smaller and the chromatin strands more dense, tending to form clumps giving a characteristic cartwheel-shaped appearance. Th e cytoplasm is no longer basophilic but polychromatic or mauve coloured as it has begun to acquire haemoglobin. Refer to Fig A1-3 .
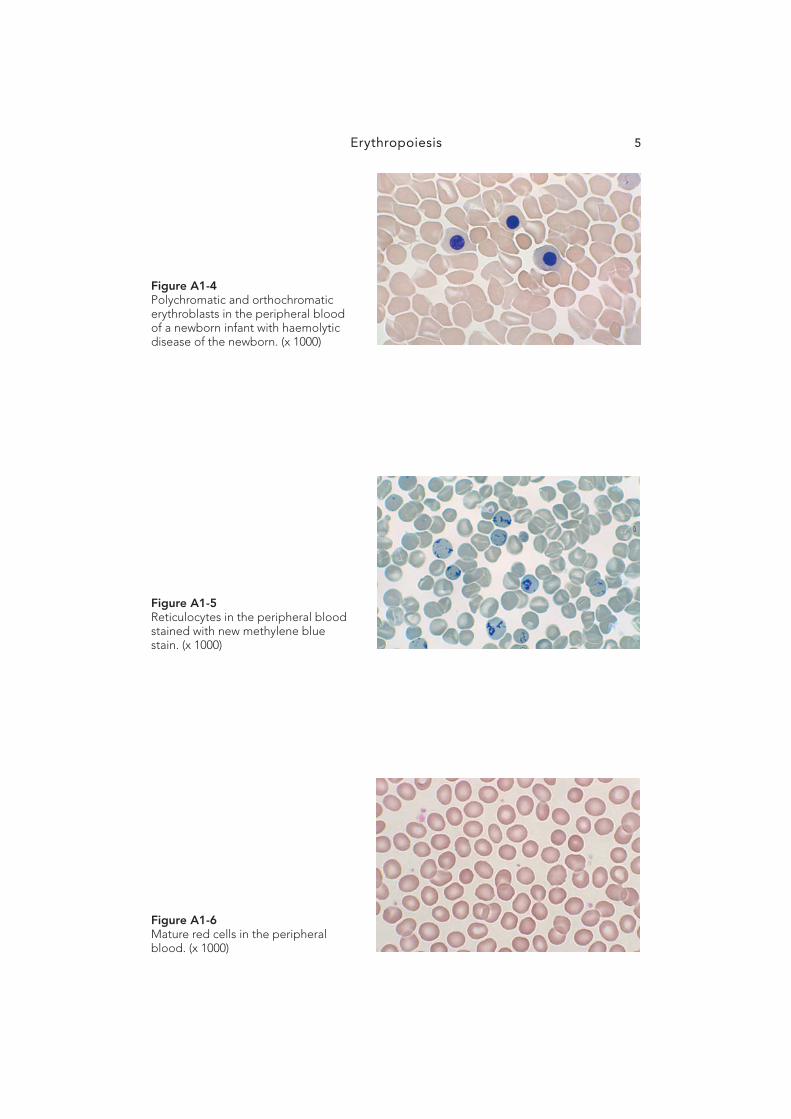
Orthochromatic erythroblast Th e orthochromatic erythroblast varies from 8 to 10 μ m in diameter. Th e nucleus is small, with a coarse, pyknotic chromatin pattern. Th e cytoplasm is pale pink with a polychro-matic hue signifying that it has acquired more haemoglobin. As the cell matures, the nucleus becomes smaller and is fi nally extruded whilst still within the bone marrow. Refer to Fig A1-4 .
A1 Erythropoiesis
Erythropoiesis 3
Polychromatic red cell Th e polychromatic red cell is a young erythrocyte that is slightly larger than the mature red cell. It is polychromatic in colour since it still contains some RNA remnants, which can be demonstrated by the use of a supravital stain such as new methylene blue or brilliant cresyl blue, in which case the cell is termed a reticulocyte. Once this cell has lost all its RNA, it develops into a mature fully haemoglobinised red cell or erythrocyte. Refer to Fig A1-5 .
Mature red cell Th e mature red cell (erythrocyte) is a biconcave disc approximately 7 μ m in diameter with an area of central pallor occupying less than one-third of its diameter. Red cells exhibit an eosinophilic reaction when stained with any of the Romanowsky stains. Th e average life span of a red cell is 120 days. Refer to Fig A1-6 .
MEGALOBLASTIC ERYTHROPOIESIS
Megaloblasts are abnormal erythroblasts produced in the bone marrow of patients defi cient in vitamin B 12 and/or folic acid. Vitamin B 12 and folic acid are vital for DNA synthesis and thus for the normal maturation and growth of red cells.
Megaloblastic changes occur in all stages of red cell maturation. Megaloblastic erythro-poiesis is classifi ed according to the normoblastic series: promegaloblast, basophilic mega-loblast, polychromatic megaloblast, orthochromatic megaloblast and mature macrocyte.
Megaloblasts diff er from normoblastic erythroblasts in the following respects: (a) Th ey are larger at every stage of their development. (b) Nuclear maturation is abnormal, since vitamin B 12 and folic acid are vital for DNA
synthesis. Defi ciency or absence of either leads to abnormal maturation of the nucleus and asynchronous development; the nucleus lags behind the cytoplasm at every stage in the maturation process. Th is is most evident in the polychromatic megaloblast, where the cytoplasm is polychromatic and the chromatin strands of the nucleus are still very fi ne and open—unlike the polychromatic erythroblast, where they are dense and form clumps.
(c) Mitoses are common and sometimes abnormal in appearance. Refer to Figs A1-7 to A1-12.
Erythrocytes4
Figure A1-2 Basophilic and polychromatic eryth-roblasts in the peripheral blood of a newborn infant with haemolytic disease of the newborn. (x 1000)
Figure A1-3 Polychromatic erythroblasts in the peripheral blood of a newborn infant with haemolytic disease of the new-born. (x 1000)
Figure A1-1 Proerythroblast and polychromatic erythroblasts in the peripheral blood of a newborn infant with haemolytic disease of the newborn. (x 1000)
Erythropoiesis 5
Figure A1-5 Reticulocytes in the peripheral blood stained with new methylene blue stain. (x 1000)
Figure A1-4 Polychromatic and orthochromatic erythroblasts in the peripheral blood of a newborn infant with haemolytic disease of the newborn. (x 1000)
Figure A1-6 Mature red cells in the peripheral blood. (x 1000)

Erythrocytes6
Figure A1-8 Promegaloblast, basophilic mega-loblasts and myeloid precursors in a bone marrow aspirate from a patient with megaloblastic anaemia. (x 1000)
Figure A1-7 Abnormal mitoses in the bone mar-row in megaloblastic anaemia. (x 1000)
Figure A1-9 Basophilic megaloblasts in the bone marrow in megaloblastic anaemia. (x 1000)

Erythropoiesis 7
Figure A1-10 Basophilic and polychromatic megaloblasts in the bone marrow in megaloblastic anaemia. (x 1000)
Figure A1-11 Polychromatic and orthochromatic megaloblast in the bone marrow in megaloblastic anaemia. (x 1000)
Figure A1-12 Megaloblastic mature red cells in the peripheral blood in megaloblastic anaemia. (x 1000)
8
Defi ciency anaemias A2
IRON DEFICIENCY ANAEMIA Iron defi ciency anaemia occurs when the iron content of the body is less than normal. It is characterised by decreased or absent iron stores, low serum iron concentration, high transferrin with low saturation, low haemoglobin concentration, low haematocrit and low red cell number. Th e red cells in iron defi ciency anaemia are microcytic and hypochromic. Specifi c red cell parameters such as the mean cell volume (MCV) and mean cell haemoglo-bin (MCH) are reduced, while the red cell distribution width (RDW) is increased.
A major cause of iron defi ciency anaemia is blood loss. It may also result from an inadequate diet and rarely from malabsorption. Pregnancy and growth are associated with greater require-ments for iron; thus the risk of development of iron defi ciency is high at these times. Microcytic hypochromic red cells are characterised by an MCV less than 80 fL and an MCH less than 27 pg. Red cell size may be assessed by comparing the red cell with a small lymphocyte.
Th e classical features found on the blood fi lm in iron defi ciency include anisocytosis, microcytes, hypochromasia, elliptocytes, and pencil cells and fragmented cells. Th rombo-cytosis is often present. When iron-defi ciency anaemia is treated, a dimorphic blood fi lm will result, that is, one in which there are two distinct populations of red cells: microcytic and hypochromic as well as normocytic and normochromic.
Severe cases of iron defi ciency anaemia may also be detected in the bone marrow by the presence of smaller than normal erythroblasts with ragged and incompletely haemo-globinised cytoplasm. Iron stores may be assessed from the bone marrow by performing a Perl’s Prussian blue stain. Haemosiderin, which is present in the marrow fragments, will stain a turquoise colour in the presence of iron; decreased or absent haemosiderin is char-acteristic of iron defi ciency. Refer to Figs A2-1 to A2-4 .
MEGALOBLASTIC ANAEMIA
Megaloblastic anaemia is due to a lack of vitamin B 12 and/or folic acid. Vitamin B 12 defi -ciency is usually due to malabsorption. One form of malabsorption is pernicious anaemia, an autoimmune disease in which there is a lack of intrinsic factor production by the gastric pari-etal cells. Less commonly, vitamin B 12 defi ciency results from dietary insuffi ciency. Folic acid defi ciency results from an inadequate diet, particularly of leafy green vegetables and fruit, the additional requirements of pregnancy and, less frequently, from impaired absorption.
Classical features of megaloblastic anaemia are seen in both the peripheral blood and bone marrow. Nuclear cytoplasmic asynchrony is a characteristic feature leading to mac-rocytic red cells with an MCV ranging from 100 to 150 fL. Th e red cells are oval in shape and may contain basophilic stippling and Howell-Jolly bodies. Teardrop poikilocytes are often present. Th e neutrophils are hypersegmented and giant metamyelocytes can be seen in the bone marrow. Megaloblastic anaemia due to inadequate diet often coexists with a microcytic hypochromic anaemia due to the presence of iron defi ciency. In such cases, hypochromic microcytes will also be present and the blood picture is described as a ‘mixed’ defi ciency. Refer to Figs A2-5 to A2-9 .

Deficiency anaemias 9
Figure A2-1 Iron defi ciency anaemia: peripheral blood fi lm showing hypochromic microcytes, elliptocytes and frag-mented cells. (x 1000)
Figure A2-2 Iron defi ciency anaemia: peripheral blood fi lm showing hypochromic microcytes, elliptocytes, pencil cells and fragmented cells. (x 1000)
Figure A2-3 Response to iron therapy in a child: dimorphic blood picture showing two populations of red cells: hypo-chromic microcytic and normochro-mic normocytic. (x 1000)

Erythrocytes10
Figure A2-4 Perl’s Prussian blue stain showing haemosiderin in a fragment of bone marrow. (x 1000)
Figure A2-5 Megaloblastic anaemia: peripheral blood showing many oval macro-cytes. (x 1000)
Figure A2-6 Round macrocytes in the peripheral blood in alcoholic liver disease with low serum and red cell folate levels. (x 1000)

Deficiency anaemias 11
Figure A2-7 ‘Mixed defi ciency’ in the peripheral blood fi lm from a 4-month-old child with vitamin B 12 , folic acid and iron defi ciency. This child was being breastfed by a vegan mother. (x 1000)
Figure A2-8 Megaloblastic anaemia: bone mar-row showing two giant metamyelo-cytes. (x 1000)
Figure A2-9 Megaloblastic anaemia: bone mar-row trephine infi ltrated with megalo-blasts. (H&E) (x 1000)

12
Haemolytic anaemias A3
AUTOIMMUNE HAEMOLYTIC ANAEMIA Autoimmune haemolytic anaemia (AIHA) is due to antibodies produced by the body’s immune system against its own red cells. Th ese antibodies are either warm or cold and in some instances may have a wide thermal amplitude extending from warm to cold.
Warm-antibody AIHA is the most common type; the antibodies produced are of the IgG class, which have maximal activity at 37°C. Cold-antibody AIHA results from the production of antibodies of the IgM class, which act at temperatures below 37°C.
Examination of the blood fi lm from a case of AIHA reveals the presence of spherocytes, polychromasia, and nucleated red cells. In cold AIHA, auto-agglutination will also be present.
Th e diagnosis of AIHA is established by performing a direct antiglobulin test (DAT) on the patient’s red cells. A positive result indicates the presence of antibody or complement on the red cell surface, thus confi rming the diagnosis of AIHA. Th e DAT can also be used to diff erentiate AIHA from hereditary spherocytosis (HS): both disorders have a similar blood picture but HS is characterised by a negative DAT. Refer to Figs A3-1 to A3-3 .
PAROXYSMAL COLD HAEMOGLOBINURIA (PCH)
Paroxysmal cold haemoglobinuria is an autoimmune haemolytic anaemia described by Julius Donath and Karl Landsteiner in 1904. It occurs in children under 5 years of age. Th e blood picture resembles that of an AIHA with spherocytes, reticulocytes and nucle-ated red cells. It is positive for the Donath-Landsteiner antibody which is a polyclonal IgG that binds to various red cell antigens such as I, i, P and p on the red cell surface. Th e P antigen is its primary target. Th e polyclonal IgG anti-P autoantibody binds to red blood cell surface antigens in the cold. When the blood returns to the warmer central circulation, the red cells are lysed with complement, giving rise to intravascular haemolysis. Th e anae-mia is DAT (C3d) positive. Th e blood fi lm sometimes shows monocytic and granulocytic erythrophagocytosis. Refer to Figs A3-4 to A3-6 .
NON-IMMUNE HAEMOLYTIC ANAEMIA
Clostridial sepsis Septicaemias induced by Clostridium welchii and C. perfringens give rise to severe rapidly progressive intravascular haemolytic anaemia characterised by the presence of micro-spherocytes. It is thought that these bacteria produce a toxin containing a proteolytic agent capable of destroying spectrin. Th is toxin is responsible for red cell membrane destruction often involving the entire red cell mass. Refer to Figs A3-7 and A3-8 .
Paroxysmal nocturnal haemoglobinuria (PNH) PNH is a haemopoietic stem cell disorder present in red cells, white cells and platelets. Th is red cell abnormality predisposes the red cells to intravascular complement-mediated lysis. Lack of red cell membrane proteins, in particular the ‘decay accelerating factor’
Haemolytic anaemias 13
(DAF CD55), the ‘membrane inhibitor of reactive lysis’ protein (MIRL CD59) and the ‘homologous restriction factor’ (HRF), leads to severe clinical haemolysis. Th ese proteins negatively regulate the haemolytic action of complement on red cells. Patients with PNH present with a severe anaemia with Hb levels ranging from less than 5.0 g/L to normal. Th ey may also present with pancytopenia as well as aplastic anaemia. Th ere is a macrocyto-sis due to the presence of increased reticulocytes and in some cases a microcytic hypochro-mic anaemia due to iron defi ciency. Refer to Fig A3-9 .
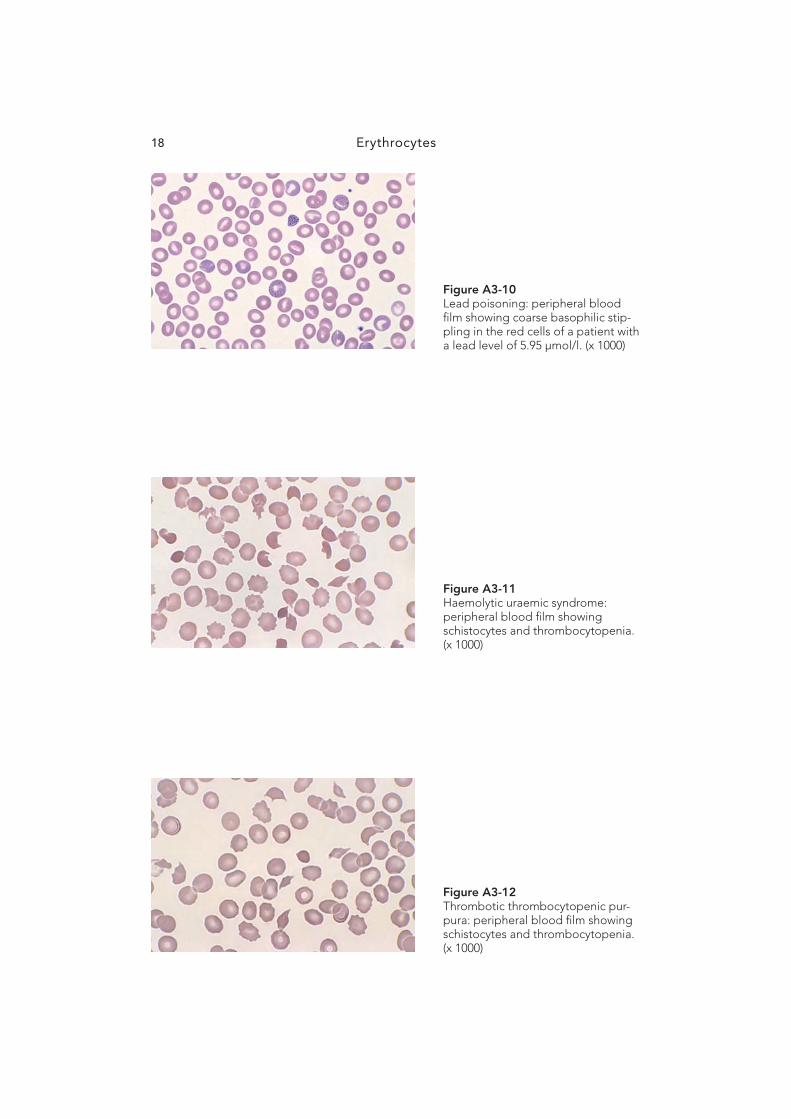
Haemolytic anaemia due to lead poisoning Th e ingestion of lead interferes with haem synthesis. It does so by inhibiting several of the enzymes directly involved with haem synthesis. Pyrimidine 5´-nucleotidase is one such enzyme. In its absence, pyrimidine nucleotides accumulate in the red cells, preventing iron from being incorporated into haem at a normal rate. Th is leads to a shortened red cell life span resulting in a mild haemolytic anaemia. Th e blood fi lm shows characteristic fi ne to coarse basophilic stippling in the red cells as seen with any of the Romanowsky stains. Th e anticoagulant ethylenediamine tetraacetic acid (EDTA) can mask lead-induced stippling if blood fi lms are not made fresh and fi xed immediately.
Refer to Fig A3-10 .
MICROANGIOPATHIC HAEMOLYTIC ANAEMIA
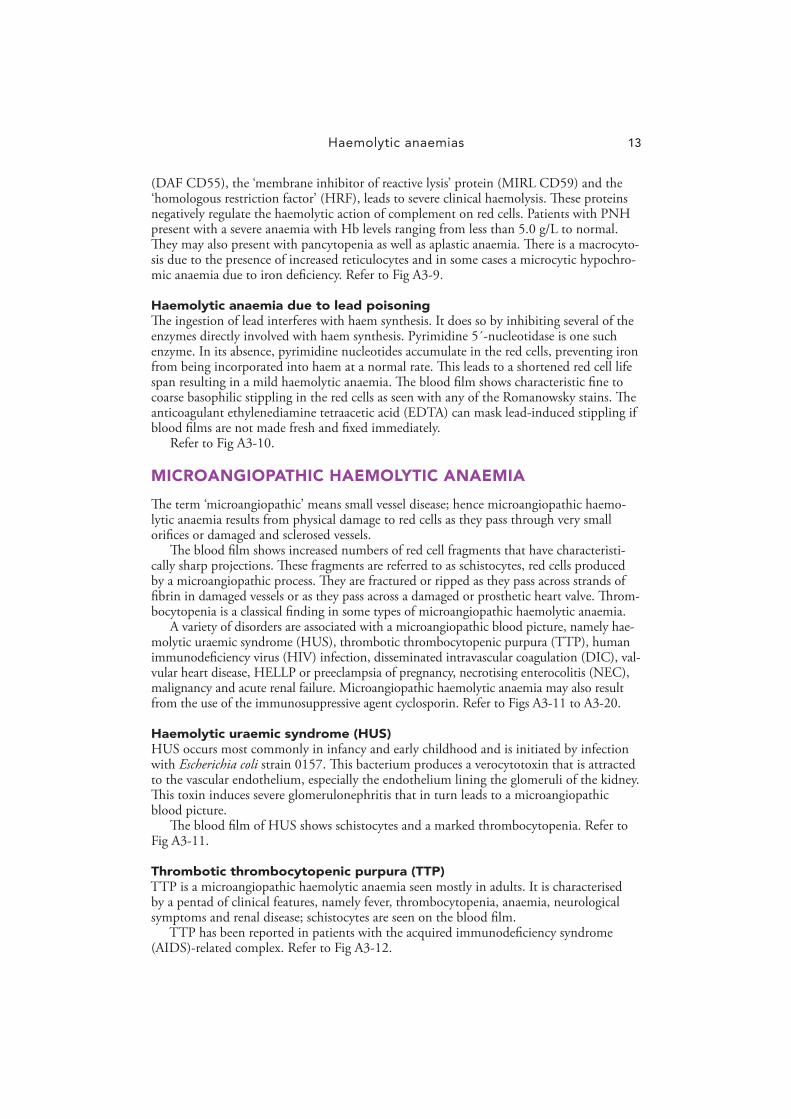
Th e term ‘microangiopathic’ means small vessel disease; hence microangiopathic haemo-lytic anaemia results from physical damage to red cells as they pass through very small orifi ces or damaged and sclerosed vessels.
Th e blood fi lm shows increased numbers of red cell fragments that have characteristi-cally sharp projections. Th ese fragments are referred to as schistocytes, red cells produced by a microangiopathic process. Th ey are fractured or ripped as they pass across strands of fi brin in damaged vessels or as they pass across a damaged or prosthetic heart valve. Th rom-bocytopenia is a classical fi nding in some types of microangiopathic haemolytic anaemia.
A variety of disorders are associated with a microangiopathic blood picture, namely hae-molytic uraemic syndrome (HUS), thrombotic thrombocytopenic purpura (TTP), human immunodefi ciency virus (HIV) infection, disseminated intravascular coagulation (DIC), val-vular heart disease, HELLP or preeclampsia of pregnancy, necrotising enterocolitis (NEC), malignancy and acute renal failure. Microangiopathic haemolytic anaemia may also result from the use of the immunosuppressive agent cyclosporin. Refer to Figs A3-11 to A3-20 .
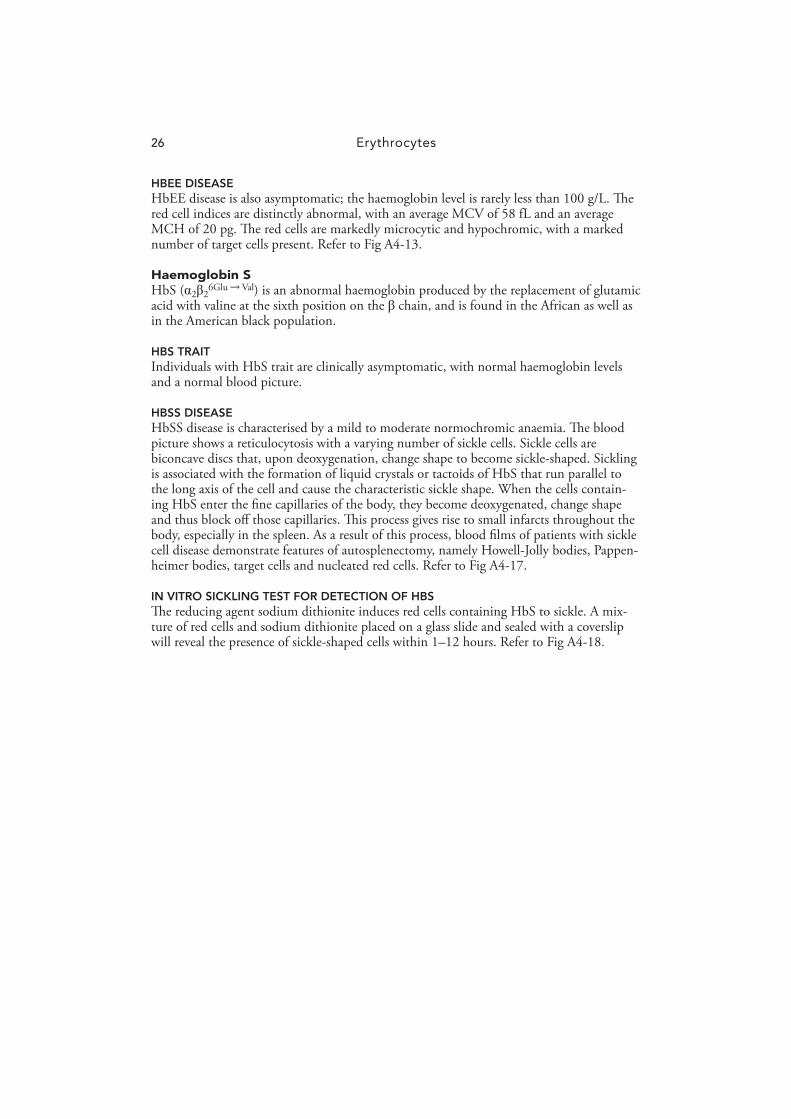
Haemolytic uraemic syndrome (HUS) HUS occurs most commonly in infancy and early childhood and is initiated by infection with Escherichia coli strain 0157. Th is bacterium produces a verocytotoxin that is attracted to the vascular endothelium, especially the endothelium lining the glomeruli of the kidney. Th is toxin induces severe glomerulonephritis that in turn leads to a microangiopathic blood picture.
Th e blood fi lm of HUS shows schistocytes and a marked thrombocytopenia. Refer to Fig A3-11 .
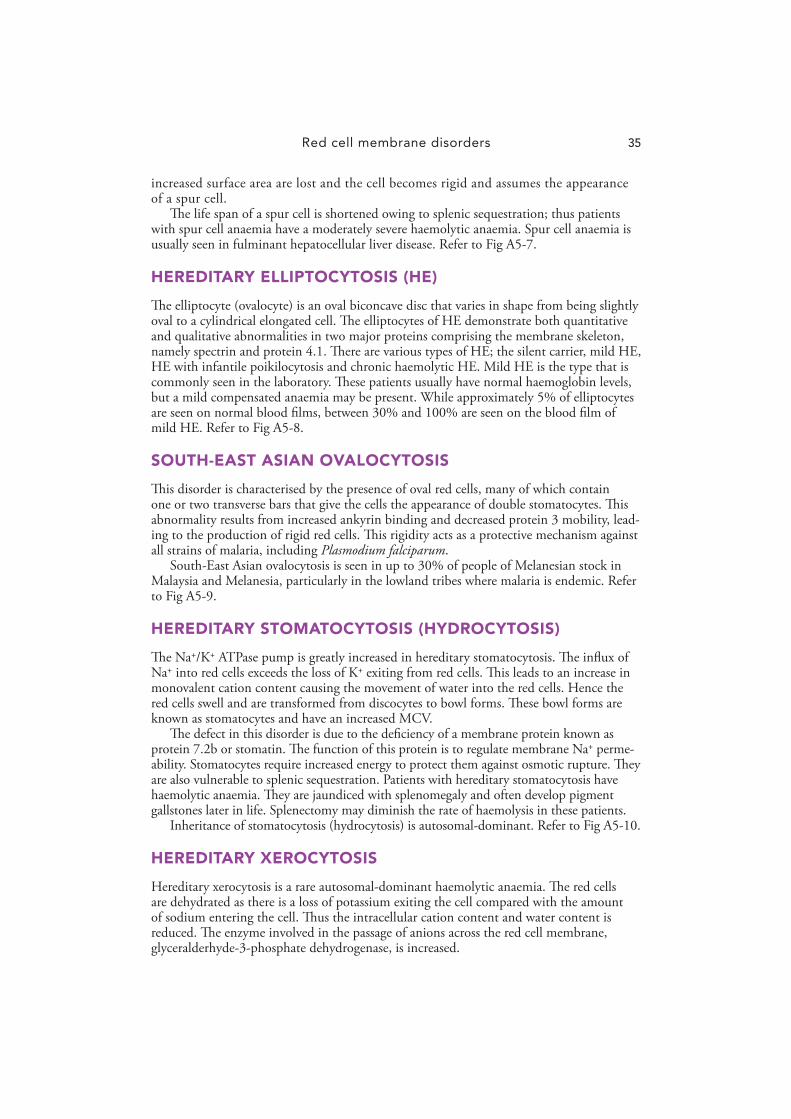
Thrombotic thrombocytopenic purpura (TTP) TTP is a microangiopathic haemolytic anaemia seen mostly in adults. It is characterised by a pentad of clinical features, namely fever, thrombocytopenia, anaemia, neurological symptoms and renal disease; schistocytes are seen on the blood fi lm.
TTP has been reported in patients with the acquired immunodefi ciency syndrome (AIDS)-related complex. Refer to Fig A3-12 .

Erythrocytes14
Disseminated intravascular coagulation (DIC) DIC occurs when small blood vessels become blocked by platelet and fi brin thrombi, thus altering the patency of the vessel and inducing intravascular haemolysis. Th e blood fi lm shows schistocytes and thrombocytopenia. Refer to Fig A3-14 .
Valvular heart disease Microangiopathic haemolytic anaemia occurs in valvular heart disease and also in some patients who have had prosthetic heart valves inserted. Th e high shear forces produced by the abnormal blood fl ow seen in such disorders produce a blood fi lm characterised by the presence of schistocytes, classical of a microangiopathic process. Th e platelet count is invariably normal. Refer to Fig A3-15 .
Malignancy A microangiopathic haemolytic anaemia may be associated with metastatic carcinoma, especially mucin-secreting adenocarcinoma of the breast and stomach. Metastases occur-ring in the microvascular system, especially the lung, give rise to a microangiopathic blood picture with thrombocytopenia. Refer to Fig A3-16 .
Cyclosporin Th e immunosuppressive agent cyclosporin is nephrotoxic and hence may give rise to a microangiopathic blood picture with thrombocytopenia. Refer to Fig A3-18 .
HELLP syndrome Th e HELLP syndrome (haemolysis, elevated liver enzymes and low platelet count) is a multisystem syndrome occurring in severe preeclampsia and eclampsia. It aff ects both primiparous and multiparous women in the third trimester of pregnancy. HELLP is char-acterised by a microangiopathic haemolytic anaemia, hepatic dysfunction, renal failure and in severe cases, DIC.
Delivery of the fetus is the initial treatment; however, the disease remains active after delivery and appears to achieve peak intensity during the 24 – 48 hour post delivery period. Refer to Fig A3-20 .
OXIDANT-DRUG-INDUCED HAEMOLYTIC ANAEMIA
Th e use of oxidant drugs can be easily recognised from the blood fi lm, provided that the patient has not had a splenectomy. Two frequently used oxidant drugs, dapsone and sulfasalazine (Salazopyrin), may give rise to a Heinz-body-positive haemolytic anaemia resulting in a blood picture characterised by the presence of bite and blister cells. Heinz bodies are precipitates of denatured haemoglobin and are the manifestation of the oxida-tive challenge that the red cell has suff ered. Th ey are rapidly removed or pitted out by the spleen, giving rise to bite cells. Should the red cell membrane of the bite cell rejoin, a blister cell will result. Th e red cells of premature and term neonates are more susceptible to oxidants. Prolonged exposure to naphthalene may give rise to a haemolytic anaemia in infants despite normal levels of the enzyme glucose-6-phosphate dehydrogenase (G-6-PD). Refer to Figs A3-21 to A3-24 .

Haemolytic anaemias 15
Figure A3-1 Autoimmune haemolytic anaemia (warm antibody): peripheral blood fi lm showing spherocytes, reticulo-cytes (polychromasia) and a nucle-ated red cell. (x 1000)
Figure A3-2 Autoimmune haemolytic anaemia (cold antibody): peripheral blood fi lm showing marked auto-agglutination. Blood samples with cold agglu-tination will have a falsely raised mean cell volume (MCV) unless the sample is prewarmed to 37°C prior to processing through the blood cell analyser. (x 400)
Figure A3-3 Peripheral blood fi lm showing the presence of a wide-thermal-amplitude auto-antibody giving rise to features of both a warm and cold autoimmune haemolytic anaemia. (x 1000)

Erythrocytes16
Figure A3-4 Paroxysmal cold haemoglobinuria: Donath Landsteiner antibody positive haemolytic anaemia. Peripheral blood fi lm showing auto-agglutination, spherocytes and reticulocytes. (x 400)
Figure A3-5 Paroxysmal cold haemoglobinuria: Donath Landsteiner antibody positive haemolytic anaemia. Peripheral blood fi lm showing auto-agglutination, spherocytes and reticulocytes. (x 1000)
Figure A3-6 Paroxysmal cold haemoglobinuria: Donath Landsteiner antibody posi-tive haemolytic anaemia. Peripheral blood fi lm showing granulocytic erythrophagocytosis. (x 1000)

Haemolytic anaemias 17
Figure A3-7 Clostridial sepsis: peripheral blood fi lm from a case of C. Perfringens septicaemia showing toxic granula-tion in the neutrophils and micro-spherocytes. (x 1000)
Figure A3-8 Clostridial sepsis: Perl’s Prussian blue stain on the urine deposit from the case in Figure A3-7 showing a strongly positive urinary haemo-siderin indicative of intravascular haemolysis. (x 1000)
Figure A3-9 Paroxysmal nocturnal haemoglobin-uria: peripheral blood fi lm showing a macrocytic anaemia together with increased polychromasia or reticulo-cytes. (x 1000)
Erythrocytes18
Figure A3-10 Lead poisoning: peripheral blood fi lm showing coarse basophilic stip-pling in the red cells of a patient with a lead level of 5.95 μ mol/l. (x 1000)
Figure A3-11 Haemolytic uraemic syndrome: peripheral blood fi lm showing schistocytes and thrombocytopenia. (x 1000)
Figure A3-12 Thrombotic thrombocytopenic pur-pura: peripheral blood fi lm showing schistocytes and thrombocytopenia. (x 1000)

Haemolytic anaemias 19
Figure A3-13 HIV infection: peripheral blood fi lm showing schistocytes and thrombo-cytopenia. (x 1000)
Figure A3-14 Disseminated intravascular coagula-tion: peripheral blood fi lm from a patient with chronic myelomono-cytic leukaemia (CMML) showing a marked number of schistocytes and thrombocytopenia. (x 1000)
Figure A3-15 Valvular heart disease: peripheral blood fi lm showing the presence of schistocytes. The platelet count is usually normal in valvular heart disease. (x 1000)

Erythrocytes20
Figure A3-16 Mucin-secreting cancer of the stomach: peripheral blood fi lm showing schisto-cytes and thrombocytopenia. (x 1000)
Figure A3-17 Acute renal failure: peripheral blood fi lm showing increased numbers of burr cells. (x 1000)
Figure A3-18 Cyclosporin-induced microangio-pathic haemolytic anaemia follow-ing a peripheral blood stem cell transplant showing the presence of schistocytes and thrombocytopenia. (x 1000)

Haemolytic anaemias 21
Figure A3-19 Necrotising enterocolitis: peripheral blood fi lm in a premature neonate showing schistocytes and thrombo-cytopenia. (x 1000)
Figure A3-20 HELLP syndrome: peripheral blood fi lm showing the presence of schisto-cytes in a primiparous woman in the third trimester of pregnancy. (x 1000)
Figure A3-21 Oxidant drug (dapsone)-induced haemolytic anaemia: peripheral blood fi lm showing the presence of bite and blister cells. (x 1000)

Erythrocytes22
Figure A3-22 Naphthalene-induced haemolytic anaemia: peripheral blood fi lm from a 19-day-old neonate showing bite and blister cells with a normal level of G-6-PD. (x 1000)
Figure A3-23 G-6-PD defi ciency: peripheral blood fi lm showing the presence of bite and blister cells following ingestion of fava beans (favism). (x 1000)
Figure A3-24 Heinz bodies in the peripheral blood fi lm of a splenectomised patient who is being treated with the oxidant drug dapsone. New methylene blue stain. (x 1000)

23
Th e thalassaemias are hereditary anaemias that occur as a result of a mutation that aff ects the synthesis of normal haemoglobin. Normal haemoglobin consists of two pairs of dis-similar polypeptide chains, � -like and non- � ( � , � or � ). Each chain encloses an iron-con-taining porphyrin known as haem. Th e normal haemoglobins are: • Haemoglobin A, consisting of two � - and two � -globin chains • Haemoglobin A 2 , consisting of two � - and two � -globin chains • Haemoglobin F, consisting of two � - and two � -globin chains.
� -Th alassaemia is characterised by a reduction or total lack of � -globin chains and � -thalassaemia by a reduction or total lack of � -globin chains. A microcytic hypochromic anaemia is associated with both � - and � -thalassaemia.
THE � -THALASSAEMIAS
� -Th alassaemia commonly occurs in populations from South-East Asia, the Mediterra-nean, Africa and China. It can arise when any number of the four � -globin genes are either reduced or absent and hence can be divided into four groups.
Number of genes affected Condition
1 Silent carrier � -thalassaemia trait
2 � -Thalassaemia trait
3 Haemoglobin H (HbH) disease
4 Hydrops fetalis
Silent carrier � -thalassaemia trait Silent carrier � -thalassaemia trait is characterised by minimal or no haematological changes, and the haemoglobin level and the mean cell volume (MCV) are low normal. Th ere is no obvious microcytosis seen on the blood fi lm. Th e diagnosis of silent carrier � -thalassaemia trait is made by family studies and/or gene analysis.
� -Thalassaemia trait Th is trait is characterised by a microcytic hypochromic blood fi lm; the average MCV is 68 fL and the average mean cell haemoglobin (MCH) is 22 pg. HbH inclusion bodies ( � 4 ) are present after the blood is incubated at 37°C for 2 hours with a supravital stain such as brilliant cresyl blue. Th ese inclusion bodies represent precipitates of HbH and give the cell a golfball-like appearance. Haemoglobin electrophoresis is normal in � -thalassaemia trait; thus it is vital to detect the occasional HbH cell whose presence enables the diagnosis of � -thalassaemia trait to be made. Refer to Fig A4-1 .
A4 Haemoglobin disorders

Erythrocytes24
Haemoglobin H disease HbH disease is characterised by a markedly microcytic hypochromic blood fi lm with increased numbers of target cells and red cell fragments. Th e average MCV is 57 fL and the average MCH is 21 pg. HbH inclusions are present in the great majority of red cells. Refer to Figs A4-2 and A4-3 .
Hydrops fetalis Infants with hydrops fetalis are delivered stillborn at 30 – 40 weeks. Th e hydrops is due to a failure to produce � -globin chains. If a blood fi lm can be obtained from the stillborn, it will show a characteristic population of large hypochromic macrocytes, marked polychro-masia, basophilic stippling and increased numbers of nucleated red cells. Refer to Fig A4-4 .
Haemoglobin constant spring Haemoglobin H disease can be associated with a haemoglobin known as Haemoglobin Constant Spring (HbCS). HbCS is an alpha chain variant rather than a deletion. Th e alpha chain is elongated by 31 additional amino acid residues at the C-terminal end mak-ing it very unstable. Th e presence of HbCS causes the red cells to break down faster than usual giving rise to a severe anaemia.
Th e red cells of HbCS are large and diff erent from those seen in any of the other forms of thalassaemia. Th ey are markedly overhydrated relative to those of the deletional forms of alpha thalassaemia. Coarse basophilic stippling is a characteristic feature of HbCS. Refer to Fig A4-5 .
THE � -THALASSAEMIAS
� -Th alassaemia commonly occurs in populations of Mediterranean and African origin, as well as in the Middle East, India, Pakistan, China and South-East Asia.
Th e � -thalassaemias include four syndromes: silent carrier � -thalassaemia trait, � -thalassaemia trait, � -thalassaemia intermedia and � -thalassaemia major.
Silent carrier � -thalassaemia trait Silent carrier � -thalassaemia trait is characterised by minimal or no haematological changes. Th e haemoglobin level and the MCV are low normal and there is no obvious microcytosis seen on the blood fi lm. Characteristically, silent carriers of � -thalassaemia have normal levels of HbA 2 . Diagnosis of silent carrier � -thalassaemia trait is made by fam-ily studies and/or gene analysis.
� -Thalassaemia trait Th is trait is characterised by a microcytic hypochromic red cell picture together with target cells, elliptocytes, and basophilic stippling. Th e average MCV is 63 fL and the average MCH is 20 pg.
In � -thalassaemia trait, the HbA2 level is increased above 3.5% and may be as high as 8.0%, while the HbF level is elevated in approximately 50% of patients, ranging from less than 1% to 5%. Refer to Fig A4-6 .
� -Thalassaemia intermedia Th is is a more severe form of � -thalassaemia trait but less severe than � -thalassaemia major. At the most severe end of the scale patients are transfusion dependent while at the less severe end they are transfusion independent. Th e red cell changes are more severe than those found in � -thalassaemia trait, with increased numbers of red cell poikilocytes. Tear-drop poikilocytes are a prominent feature. Refer to Fig A4-7 .

Haemoglobin disorders 25
� -Thalassaemia major As the neonate has substantial HbF at birth, anaemia in these patients usually develops during the fi rst few months of life and becomes progressively worse in time. Th ese infants will be transfusion dependent by the end of the fi rst year of life; a later onset of the condi-tion would suggest a case of thalassaemia intermedia.
� -Th alassaemia major is characterised by Hb levels as low as 30 g/L and variable amounts of HbF according to the transfusion status at the time of measurement. Th e acid elution or Kleihauer test shows that the HbF is evenly distributed among the red cells. Th e blood fi lm shows marked red cell poikilocytosis, microcytosis and hypochromasia, target cells, basophilic stippling, Pappenheimer bodies (siderotic granules) and a reticulocytosis with increased numbers of nucleated red cells. As a result of frequent transfusions, the blood picture is often dimorphic, and consequently the MCV and MCH are diffi cult to defi ne. Refer to Fig A4-8 .
ABNORMAL HAEMOGLOBINS
Haemoglobins C, E and S (HbC, HbE and HbS) are abnormal haemoglobins character-ised by an amino acid substitution in the � -globin chain.
Haemoglobin C HbC ( � 2 � 2 6Glu → Lys ) is an abnormal haemoglobin produced by the replacement of glu-tamic acid with lysine at the sixth position on the � chain. It is found in West Africans, particularly from Ghana and the Upper Volta.
HBC TRAIT Individuals with HbC trait are clinically normal. Target cells are present on an otherwise normal blood fi lm.
HBCC DISEASE HbCC disease is associated with a haemolytic anaemia; the haemoglobin level ranges from 80 to 120 g/L. Th e blood fi lm shows marked numbers of target cells, red cell fragments and microspherocytes. Upon careful examination, the red cells will be seen to contain intraerythrocytic crystals that dissolve readily when oxygen is released to the tissues. Th e MCV and MCH are slightly reduced as a result of the marked number of target cells that result from potassium effl ux from the red cells, shrinking their contents with dehydration, leading to an increased ratio of surface area to volume. Refer to Fig A4-10 .
IN VITRO TEST FOR DETECTION OF HBC An in vitro test to demonstrate the presence of HbC crystals may be performed by adding 3% NaCl to the red cells and examining a wet preparation under a coverslip after 4 hours or longer. Hypertonic dehydration of the red cells produces tetrahedral crystals in up to 75% of the cells. Refer to Fig A4-11 .
HAEMOGLOBIN E HbE ( � 2 � 2 26Glu → Lys ) is an abnormal haemoglobin produced by the replacement of glu-tamic acid with lysine at position 26 on the � chain. It is found in South-East Asians.
HBE TRAIT Individuals with HbE trait are asymptomatic, with haemoglobin levels of 120 g/L aver-age MCV of 74 fL and an average MCH of 25 pg. Occasional target cells may be present. Refer to Fig A4-12 .
Erythrocytes26
HBEE DISEASE HbEE disease is also asymptomatic; the haemoglobin level is rarely less than 100 g/L. Th e red cell indices are distinctly abnormal, with an average MCV of 58 fL and an average MCH of 20 pg. Th e red cells are markedly microcytic and hypochromic, with a marked number of target cells present. Refer to Fig A4-13 .
Haemoglobin S HbS ( � 2 � 2 6Glu → Val ) is an abnormal haemoglobin produced by the replacement of glutamic acid with valine at the sixth position on the � chain, and is found in the African as well as in the American black population.
HBS TRAIT Individuals with HbS trait are clinically asymptomatic, with normal haemoglobin levels and a normal blood picture.
HBSS DISEASE HbSS disease is characterised by a mild to moderate normochromic anaemia. Th e blood picture shows a reticulocytosis with a varying number of sickle cells. Sickle cells are biconcave discs that, upon deoxygenation, change shape to become sickle-shaped. Sickling is associated with the formation of liquid crystals or tactoids of HbS that run parallel to the long axis of the cell and cause the characteristic sickle shape. When the cells contain-ing HbS enter the fi ne capillaries of the body, they become deoxygenated, change shape and thus block off those capillaries. Th is process gives rise to small infarcts throughout the body, especially in the spleen. As a result of this process, blood fi lms of patients with sickle cell disease demonstrate features of autosplenectomy, namely Howell-Jolly bodies, Pappen-heimer bodies, target cells and nucleated red cells. Refer to Fig A4-17 .
IN VITRO SICKLING TEST FOR DETECTION OF HBS Th e reducing agent sodium dithionite induces red cells containing HbS to sickle. A mix-ture of red cells and sodium dithionite placed on a glass slide and sealed with a coverslip will reveal the presence of sickle-shaped cells within 1 – 12 hours. Refer to Fig A4-18 .

Haemoglobin disorders 27
Figure A4-1 � -Thalassaemia trait: peripheral blood fi lm showing a homogeneous population of microcytic hypochro-mic red cells. (x 1000)
Figure A4-2 HbH disease: peripheral blood fi lm showing microcytes, hypochromasia, target cells and fragmented cells. Cells resembling ‘bite’ cells may be present. These cells are a feature of an unstable Hb and are not indicative of an oxidant drug. (x 1000)
Figure A4-3 HbH disease: cresyl blue stain of peripheral blood fi lm showing HbH inclusion bodies ( � 4) that are pre-cipitates of HbH as a result of redox action of the cresyl blue dye. (x 1000)

Erythrocytes28
Figure A4-4 Hydrops fetalis: peripheral blood fi lm from a stillborn infant showing hypo-chromic macrocytes, polychromasia, basophilic stippling and increased numbers of dysplastic nucleated red cells. (x 1000)
Figure A4-5 HbHCS: peripheral blood fi lm show-ing microcytes, hypochromasia and coarse basophilic stippling. (x 1000)
Figure A4-6 � -Thalassaemia trait: peripheral blood fi lm showing microcytes, hypo-chromasia, target cells and baso-philic stippling (insoluble aggregates of free � chains). (x 1000)

Haemoglobin disorders 29
Figure A4-7 � -Thalassaemia intermedia: periph-eral blood fi lm showing microcytes, hypochromasia and increased red cell changes including teardrops. (x 1000)
Figure A4-8 � -Thalassaemia major: peripheral blood fi lm from a patient following splenectomy showing marked red cell changes, microcytes, hypo-chromasia, target cells, fragments, Howell-Jolly bodies, Pappenheimer bodies, reticulocytes and nucleated red blood cells. (x 1000)
Figure A4-9 Kleihauer (acid-elution test) demon-strating the presence of HbF in fetal red cells. The cells containing adult Hb appear as ghost cells. (x 1000)

Erythrocytes30
Figure A4-10 HbCC disease: peripheral blood fi lm showing occasional microcytes and target cells. Note the intraerythro-cytic crystals within some of the red cells. (x 1000)
Figure A4-11 HbCC disease: in vitro demonstra-tion of tetrahedral crystals of HbCC in peripheral blood. (x 1000)
Figure A4-12 HbE trait: peripheral blood fi lm showing a homogeneous population of microcytic hypochromic red cells. (x 1000)

Haemoglobin disorders 31
Figure A4-13 HbEE disease: peripheral blood fi lm showing microcytic hypochromic red cells with a marked number of target cells. (x 1000)
Figure A4-14 HbE/ � -thalassaemia trait: peripheral blood fi lm showing microcytic hypo-chromic red cells with an occasional target cell. (x 1000)
Figure A4-15 HbE/ � -thalassaemia trait: peripheral blood fi lm showing microcytic hypo-chromic red cells with elliptocytes and target cells. (x 1000)

Erythrocytes32
Figure A4-16 HbE/HbH disease: peripheral blood fi lm showing marked red cell changes, microcytic hypochromic red cells, target cells and fragments. (x 1000)
Figure A4-17 HbSS disease: peripheral blood fi lm showing sickle cells, an occasional Howell-Jolly body and reticulocyte. (x 1000)
Figure A4-18 HbS: in vitro sodium dithionite preparation showing sickle cells in the peripheral blood. (x 1000)

Haemoglobin disorders 33
Figure A4-19 HbS/ � -thalassaemia trait: periph-eral blood fi lm showing microcytic hypochromic cells with target and sickle cells as well as an occasional nucleated red cell. (x 1000)

34
HEREDITARY SPHEROCYTOSIS (HS) HS is characterised by red cells that lack an area of central pallor, have a smaller diameter than normal and are intensely haemoglobinised. Th ese cells are known as spherocytes. Th e presence of spherocytes results in a raised mean cell haemoglobin concentration (MCHC) of about 380 g/L. Th e mean cell haemoglobin (MCH) and mean cell volume (MCV) are within the normal range.
Spherocytes result from an intracorpuscular red cell membrane defect. Defi ciency of spectrin, ankyrin and band 3 protein leads to uncoupling of the skeletal lipid bilayer result-ing in membrane loss in the form of microvesicles. Th is loss of surface area leads to the formation of spherocytes.
HS is associated with a raised reticulocyte count and erythroid hyperplasia of the mar-row. Spherocytes haemolyse more readily in hypotonic salt solutions, resulting in a tail on the osmotic fragility curve. Refer to Figs A5-1 and A5-2 .
BURNS
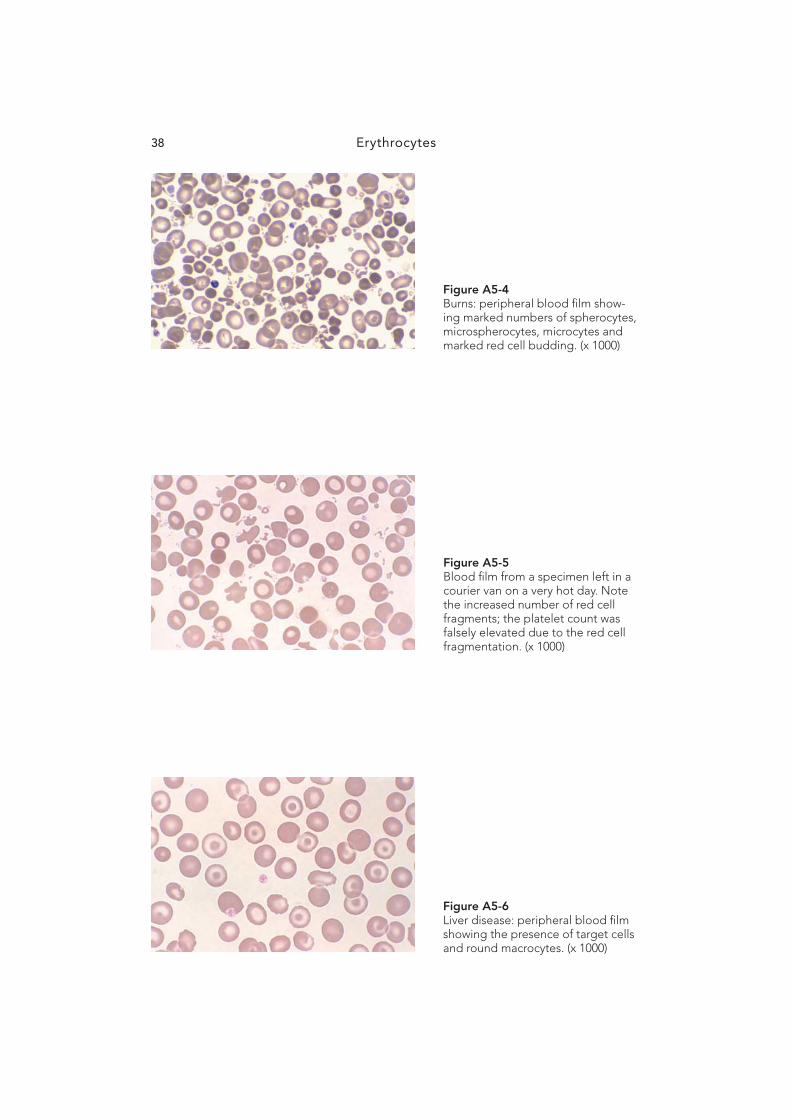
Th ird-degree burns induce changes on the blood fi lm that can be seen almost immediately after the event. Direct action of heat at 49°C denatures spectrin in the red cell membrane, giving rise to membrane budding, fragmentation, microcytes and microspherocytes. Th e presence of microcytes and microspherocytes falsely elevates the platelet number—hence the need for a manual count. Refer to Figs A5-3 and A5-4 .
LIVER DISEASE
Obstructive liver disease is characterised by the presence of target cells and round macro-cytes. Target cells have a characteristic distribution of haemoglobin in the cell centre as well as around the periphery. Th eir ratio of surface area to volume is greater than normal since the red cell membrane is expanded by the accumulation of lecithin and cholesterol from free exchange with plasma lipids. In obstructive jaundice and hepatitis with biliary obstruc-tion, there is an increase in free cholesterol and lecithin in the plasma due to the bile salts that inhibit the activity of the enzyme lecithin-cholesterol acyl transferase, which normally esterifi es cholesterol. Refer to Fig A5-6 .
SPUR CELL ANAEMIA
Spur cell anaemia is seen in hepatocellular disease rather than obstructive liver dis-ease; alcoholic liver disease is a classic example. Spur cells are produced in two stages. First, excess cholesterol produced by the patient’s diseased liver increases the surface area of the red cell, resulting in a red cell with a scalloped or undulating periphery. In the second stage, these scalloped cells are converted to spur cells by a process of splenic conditioning. Over a period of a few days, the membrane lipids as well as the
A5 Red cell membrane disorders
Red cell membrane disorders 35
increased surface area are lost and the cell becomes rigid and assumes the appearance of a spur cell.
Th e life span of a spur cell is shortened owing to splenic sequestration; thus patients with spur cell anaemia have a moderately severe haemolytic anaemia. Spur cell anaemia is usually seen in fulminant hepatocellular liver disease. Refer to Fig A5-7 .
HEREDITARY ELLIPTOCYTOSIS (HE)
Th e elliptocyte (ovalocyte) is an oval biconcave disc that varies in shape from being slightly oval to a cylindrical elongated cell. Th e elliptocytes of HE demonstrate both quantitative and qualitative abnormalities in two major proteins comprising the membrane skeleton, namely spectrin and protein 4.1. Th ere are various types of HE; the silent carrier, mild HE, HE with infantile poikilocytosis and chronic haemolytic HE. Mild HE is the type that is commonly seen in the laboratory. Th ese patients usually have normal haemoglobin levels, but a mild compensated anaemia may be present. While approximately 5% of elliptocytes are seen on normal blood fi lms, between 30% and 100% are seen on the blood fi lm of mild HE. Refer to Fig A5-8 .
SOUTH-EAST ASIAN OVALOCYTOSIS
Th is disorder is characterised by the presence of oval red cells, many of which contain one or two transverse bars that give the cells the appearance of double stomatocytes. Th is abnormality results from increased ankyrin binding and decreased protein 3 mobility, lead-ing to the production of rigid red cells. Th is rigidity acts as a protective mechanism against all strains of malaria, including Plasmodium falciparum .
South-East Asian ovalocytosis is seen in up to 30% of people of Melanesian stock in Malaysia and Melanesia, particularly in the lowland tribes where malaria is endemic. Refer to Fig A5-9 .
HEREDITARY STOMATOCYTOSIS (HYDROCYTOSIS)
Th e Na + /K + ATPase pump is greatly increased in hereditary stomatocytosis. Th e infl ux of Na + into red cells exceeds the loss of K + exiting from red cells. Th is leads to an increase in monovalent cation content causing the movement of water into the red cells. Hence the red cells swell and are transformed from discocytes to bowl forms. Th ese bowl forms are known as stomatocytes and have an increased MCV.
Th e defect in this disorder is due to the defi ciency of a membrane protein known as protein 7.2b or stomatin. Th e function of this protein is to regulate membrane Na + perme-ability. Stomatocytes require increased energy to protect them against osmotic rupture. Th ey are also vulnerable to splenic sequestration. Patients with hereditary stomatocytosis have haemolytic anaemia. Th ey are jaundiced with splenomegaly and often develop pigment gallstones later in life. Splenectomy may diminish the rate of haemolysis in these patients.
Inheritance of stomatocytosis (hydrocytosis) is autosomal-dominant. Refer to Fig A5-10 .
HEREDITARY XEROCYTOSIS
Hereditary xerocytosis is a rare autosomal-dominant haemolytic anaemia. Th e red cells are dehydrated as there is a loss of potassium exiting the cell compared with the amount of sodium entering the cell. Th us the intracellular cation content and water content is reduced. Th e enzyme involved in the passage of anions across the red cell membrane, glyceralderhyde-3-phosphate dehydrogenase, is increased.

Erythrocytes36
Th e blood picture is that of a severe haemolytic anaemia. Th e MCV may be slightly increased due to the presence of increased reticulocytes. Target cells are prominent and there may be some ‘puddling’ of haemoglobin towards the periphery of some of the cells. Refer to A5-11 .
ABETALIPOPROTEINAEMIA
Abetalipoproteinaemia is a rare autosomal-recessive disorder characterised by the pres-ence of acanthocytic red cells on the peripheral blood fi lm. Th e primary defect is due to a mutation and lack of activity in the microsomal triglyceride transfer protein needed to bind lipids to the � -apolipoprotein in plasma. Th e plasma triglycerides are almost absent and the plasma cholesterol is markedly decreased. Th ere is an increase in sphingomyelin in the outer half of the red cell membrane bilayer, increasing the surface layer of the cell. Th is � -apolipoprotein defect leads to the production of acanthocytic red cells, about 50 – 90% of the red cells being acanthocytes. Th e sphingomyelin accumulates with cell ageing; hence the nucleated precursor red cells and the reticulocytes are not aff ected.
Abetalipoproteinaemia is characterised clinically by ataxic neurologic disease, retinitis pigmentosa (often leading to blindness) and fat malabsorption. Th e neurologic abnormali-ties present between 5 and 10 years of age and continue until death in the second or third decade. Despite the marked acanthocytosis seen in these patients, anaemia and haemolysis are not seen. Th e haemoglobin levels are normal. Refer to Fig A5-12 .
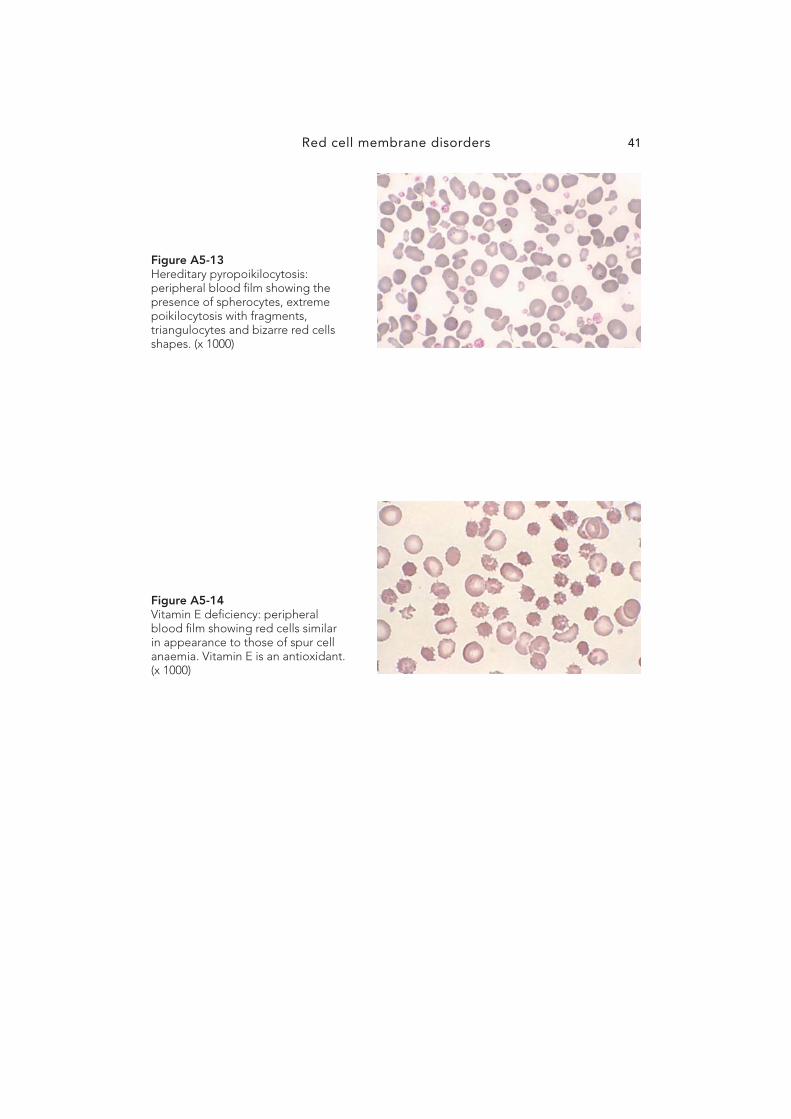
HEREDITARY PYROPOIKILOCYTOSIS (HPP)
HPP is an extremely rare disorder presenting in infancy and characterised by the presence of extreme poikilocytosis with red cell budding, triangular fragments, spherocytes and elliptocytes. Th e MCV is signifi cantly reduced owing to the presence of a large number of fragments.
Whereas normal red cells fragment at 49°C, the red cells in HPP fragment at 45 – 46°C. Prolonged heating at 37°C will also induce fragmentation; thus these patients suff er from a severe microangiopathic anaemia that is partially corrected by splenectomy. Refer to Fig A5-13 .
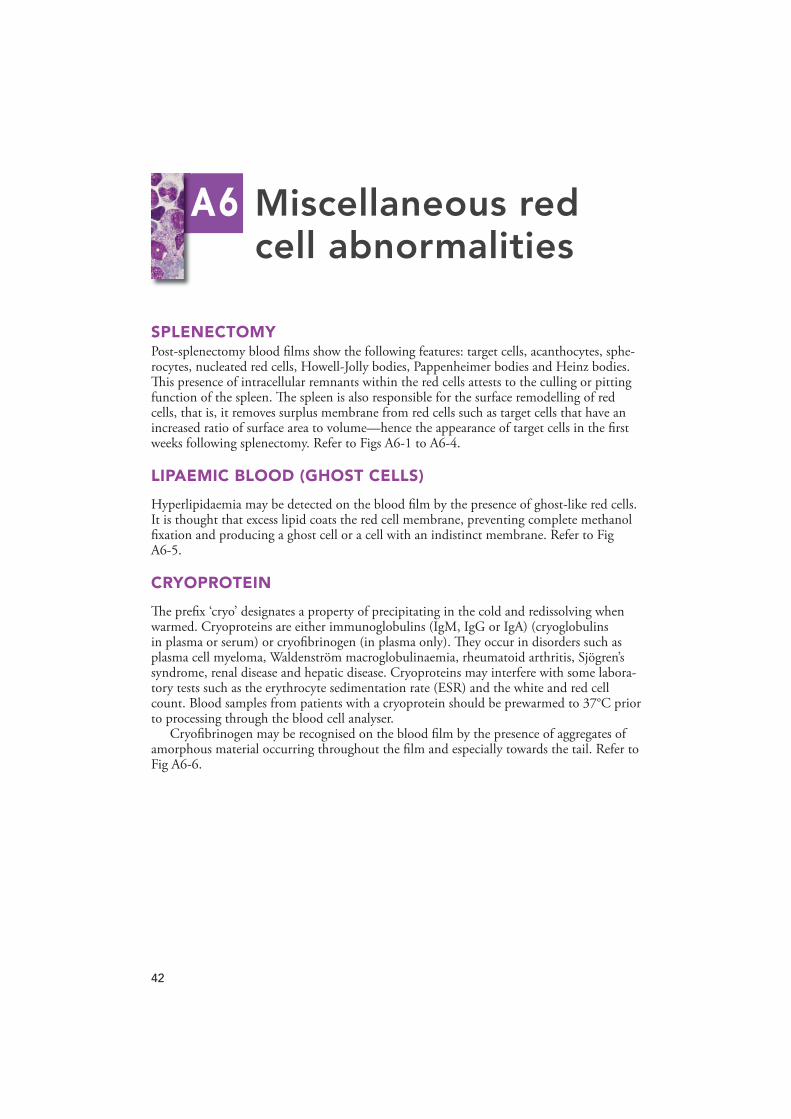
VITAMIN E DEFICIENCY
Vitamin E ( � -tocopherol) is a fat-soluble vitamin that appears to serve as an antioxidant in humans. Nutritional defi ciency of vitamin E is extremely rare as �-tocopherol occurs in many food products and the daily requirement is only 5 – 7 mg. Vitamin E defi ciency in humans is virtually limited to the neonatal period and to pathologic states associated with chronic fat malabsorption. Low birthweight infants are born with low serum and tissue concentrations of vitamin E. When these infants are fed a diet unusually rich in polyun-saturated fatty acids and inadequate vitamin E, a haemolytic anaemia will develop by 4 – 6 weeks of age. Th e anaemia is associated with morphologic alterations of the red cell mem-brane; a red cell similar to a spur cell is produced. A haemolytic anaemia due to increased splenic sequestration follows. Treatment with vitamin E produces a prompt reversal of this process. Modifi cations of infant formulas have all but eliminated vitamin E defi ciency in the preterm infant. Refer to Fig A5-14 .

Red cell membrane disorders 37
Figure A5-1 Hereditary spherocytosis: peripheral blood fi lm showing spherocytes and increased numbers of reticulocytes. (x 1000)
Figure A5-2 Hereditary spherocytosis in a 1-day-old neonate showing marked num-bers of spherocytes, polychromasia and nucleated red cells. (x 1000)
Figure A5-3 Burns: peripheral blood fi lm showing spherocytes and microspherocytes as well as red cell budding and micro-cytes. (x 1000)
Erythrocytes38
Figure A5-4 Burns: peripheral blood fi lm show-ing marked numbers of spherocytes, microspherocytes, microcytes and marked red cell budding. (x 1000)
Figure A5-5 Blood fi lm from a specimen left in a courier van on a very hot day. Note the increased number of red cell fragments; the platelet count was falsely elevated due to the red cell fragmentation. (x 1000)
Figure A5-6 Liver disease: peripheral blood fi lm showing the presence of target cells and round macrocytes. (x 1000)

Red cell membrane disorders 39
Figure A5-7 Spur cell anaemia: spur cells in the peripheral blood in fulminant liver disease secondary to alcohol. (x 1000)
Figure A5-8 Hereditary elliptocytosis: peripheral blood fi lm showing characteristic oval and elongated elliptocytes with rounded ends. (x 1000)
Figure A5-9 South-East Asian ovalocytosis: peripheral blood fi lm showing oval-shaped stomatocytes, some with two transverse slits. (x 1000)

Erythrocytes40
Figure A5-10 Hereditary stomatocytosis (hydro-cytosis): macrocytic red cells with a single slit instead of the characteristic area of central pallor. This is a post-splenectomy picture with an MCV of 130.6 fL. (x 1000)
Figure A5-11 Hereditary xerocytosis: peripheral blood fi lm showing target cells as well as ‘puddling’ of haemoglobin towards the periphery of some red cells. (x 1000)
Figure A5-12 Abetalipoproteinaemia: peripheral blood fi lm showing marked numbers of acanthocytes. (x 1000)
Red cell membrane disorders 41
Figure A5-13 Hereditary pyropoikilocytosis: peripheral blood fi lm showing the presence of spherocytes, extreme poikilocytosis with fragments, triangulocytes and bizarre red cells shapes. (x 1000)
Figure A5-14 Vitamin E defi ciency: peripheral blood fi lm showing red cells similar in appearance to those of spur cell anaemia. Vitamin E is an antioxidant. (x 1000)
42
SPLENECTOMY Post-splenectomy blood fi lms show the following features: target cells, acanthocytes, sphe-rocytes, nucleated red cells, Howell-Jolly bodies, Pappenheimer bodies and Heinz bodies. Th is presence of intracellular remnants within the red cells attests to the culling or pitting function of the spleen. Th e spleen is also responsible for the surface remodelling of red cells, that is, it removes surplus membrane from red cells such as target cells that have an increased ratio of surface area to volume—hence the appearance of target cells in the fi rst weeks following splenectomy. Refer to Figs A6-1 to A6-4 .
LIPAEMIC BLOOD (GHOST CELLS)
Hyperlipidaemia may be detected on the blood fi lm by the presence of ghost-like red cells. It is thought that excess lipid coats the red cell membrane, preventing complete methanol fi xation and producing a ghost cell or a cell with an indistinct membrane. Refer to Fig A6-5 .
CRYOPROTEIN
Th e prefi x ‘cryo’ designates a property of precipitating in the cold and redissolving when warmed. Cryoproteins are either immunoglobulins (IgM, IgG or IgA) (cryoglobulins in plasma or serum) or cryofi brinogen (in plasma only). Th ey occur in disorders such as plasma cell myeloma, Waldenström macroglobulinaemia, rheumatoid arthritis, Sjögren’s syndrome, renal disease and hepatic disease. Cryoproteins may interfere with some labora-tory tests such as the erythrocyte sedimentation rate (ESR) and the white and red cell count. Blood samples from patients with a cryoprotein should be prewarmed to 37°C prior to processing through the blood cell analyser.
Cryofi brinogen may be recognised on the blood fi lm by the presence of aggregates of amorphous material occurring throughout the fi lm and especially towards the tail. Refer to Fig A6-6 .
A6 Miscellaneous red cell abnormalities

Miscellaneous red cell abnormalities 43
Figure A6-1 Splenectomy: peripheral blood fi lm showing target cells and Howell-Jolly bodies (nuclear remnants). (x 1000)
Figure A6-2 Splenectomy: peripheral blood fi lm showing increased numbers of acan-thocytes (hyperchromic red cells with an irregular number of fi ne spines). (x 1000)
Figure A6-3 Splenectomy: peripheral blood fi lm showing increased numbers of Howell-Jolly bodies. (x 1000)

Erythrocytes44
Figure A6-4 Splenectomy: peripheral blood fi lm showing many Pappenheimer bod-ies. (x 1000)
Figure A6-5 Hyperlipidaemia: peripheral blood fi lm showing the presence of ghost cells with an indistinct cell mem-brane. (x 1000)
Figure A6-6 Cryoprotein: peripheral blood fi lm showing amorphous aggregates of cryofi brinogen in a patient with plasma cell myeloma. (x 1000)