Embed Size (px)
Citation preview

Roadshow presentationAnnual Results 2011
Forward-looking statement
This presentation contains statements of a forward-looking nature, based on currently available plans
and forecasts. Given the dynamics of the markets and the environments of the 31 countries in which
Vopak provides logistics services, the company cannot guarantee the accuracy and completeness of
such statements.
Unforeseen circumstances include, but are not limited to, exceptional income and expense items,
unexpected economic, political and foreign exchange developments, and possible changes to IFRS
reporting rules.
Statements of a forward-looking nature issued by the company must always be assessed in the
context of the events, risks and uncertainties of the markets and environments in which Vopak
operates. These factors could lead to actual results being materially different from those expected.
Roadshow presentation FY 2011 2

Contents
General Introduction
Achievements 2011
Business environment
Growth projects
Business performance
Financing
Outlook
Roadshow presentation FY 2011 3

Vopak and storage since 1616Almost four centuries of history
Discharge of
oil barrels at
Charlois site
Rotterdam 1900
Porter early
1600
First barrels of oil in Rotterdam 1862
Roadshow presentation FY 2011 4

84 Terminals in 31 countries
And a number of terminals under construction.
Roadshow presentation FY 2011 5

Key figures and some of our customers
Employees
Terminals
Countries
Capacity
Net Revenues ‘11
EBIT* ‘11
Market capitalization**
5,901 (incl. JVs)
84
31
27.9 Million cbm
€ 1,172 Million
€ 469 Million
€ 5.2 Billion
Roadshow presentation FY 2011
* Excluding exceptional items.** At year-end 2011.
6

Tank terminalKey role in oil and chemical supply chain
Customers
Oil, Gas and
Chemicals companies
Governments
Trading companies
Services
Storage
Blending
Break bulk
Make bulk
Drumming
Heating / cooling
Weighing
Products
Oil (derivatives)
Chemicals
Vegetable oils
Biofuels
Supply and transport
Vessels
Barges
Pipelines
Tank trucks
Rail wagons
Drums
LNG
LPG
Chemical
gases
Roadshow presentation FY 2011 7

Vopak’s role in the supply chain
Feedstock Production
FeedstockGathering
Production &Refining
ProductsTransmission
Independent Storage &Transshipment
Mid-Stream& End-userDistribution
Oil, Gas and Chemical supply chain
Roadshow presentation FY 2011 8

Strategic logistic functions of tank terminals
Vital link for incoming and outgoing
flows of oil and chemicals
Example
Rotterdam Europoort
Storage of products that are
exported or transferred to end users
Example
Vopak Terminal London
Complete integration with the
production process
Example
Sakra Terminal in Singapore
Roadshow presentation FY 2011 9

Logistics hub terminal
Example fuel oil Where large flows of products merge - logistics crossroad
Houston, Rotterdam/Antwerp, Singapore and Fujairah
Roadshow presentation FY 2011 10

Import/Export terminal
� Break or make bulk
� Local distribution
Roadshow presentation FY 2011 11

Industrial terminalStorage facilities integrated at chemical park
Vopak Terminals Singapore - Sakra Terminal
Exxon Mobil
Perstorp
Sumitomo Chemical
Mitsui Chemicals
Air Products
Chevron
Asahi Kasei Chemicals
SembCorp Utilities
Celanese
Kuraray
Dupont
Roadshow presentation FY 2011 12

Global mega trends drive Vopak’s markets
� GDP growth in
non-OECD� Increasing need
transport and
mobility
� Increasing
(sustainable)
energy need
� Population
growth, mainly
non-OECD
Roadshow presentation FY 2011 13

Non-OECD economies drive energy consumption growth,fossil fuels will remain the dominant energy provider until 2035
OECD China Rest of world
World primary energy demand by region in IEA New Policies ScenarioIn Mtoe
Source: IEA WEO 2010
World primary energy demand by fuel in IEA New Policies ScenarioIn Mtoe
Roadshow presentation FY 2011 14

Strengthening Vopak’s competitive position in a period of worldwide challenges
� Socio-economic unrests
(e.g. ‘Arab-spring’) � Geopolitical challenges� Financial turmoil and
economic uncertainties
Roadshow presentation FY 2011 15

Contents
General Introduction
Achievements 2011
Business environment
Growth projects
Business performance
Financing
Outlook
Roadshow presentation FY 2011 16

Robust results in 2011
2011
93.0
2010
93.0
2009
94.0
2008
95.0
2007
96.0
2006
94.0
Occupancy rate
In percent
90-95%-1.0
2011
27.8
2010
28.8
2009
28.3
2008
27.1
2007
21.8
2006
21.2
Storage capacity
In mln cbm
+6%
2011
636.0
2010
598.2
2009
513.4
2008
429.3
2007
369.5
2006
314.1
EBITDA Development*
In mln EUR
* Excluding exceptional items; including net result from Joint VenturesRoadshow presentation FY 2011 17

Personal and process safety
-15%
2011
1.1
2010
1.3
2009
1.4
2008
1.7
2007
1.4
2006
1.9
The lost time injury rate (LTIR) Total injuries leading to lost time per million hours worked
by own employees and contractors
-6%
2011
3.0
2010
3.2
2009
6.5
2008
5.8
2007
6.2
2006
7.1
Process Incidents
# incidents
Total Injury RateTotal injuries per million hours worked by own employees
+16%
2011
154.0
2010
133.0
2009
141.0
Roadshow presentation FY 2011 18

Focused strategy to execute
Customer LeadershipOperational Excellence
Our Foundation
• Safety, Health and Environment
• Our People
Our ability to construct,
operate and maintain
our terminals to
deliver our service at
competitive costs
Our ability to create
a relationship
with our customers
Our ability to find or
identify the right location
for our terminals
Growth LeadershipA B C
Roadshow presentation FY 2011 19

Various projects completed in 2011Storage capacity decreases by 1.0 million cbm
ACommissioned
Acquired
Divestment
Amsterdam Westpoort (1)
620,000 cbm; oil products
Kandla
261,600 cbm; chemicals
Altamira
Altamira LNG terminal 300,000 cbm; LNG
Terminal Bahamas 3,400,000 cbm; oil products
Gate terminal 540,000 cbm; LNG
Note: Above examples not representative of all projects completed in 2011.Roadshow presentation FY 2011 20

Strengthening competitive position: improve safety performance and efficiency
� Operational efficiency improvements
� Focus on master plans
EfficiencySafety
� Improving safety performance
� Reinforce our Vopak Fundamentals
on Safety
B
Roadshow presentation FY 2011 21

Serving markets from a product perspective C
� Customer segmentation
� Access to the right people
� Understand customer’s strategy
Account Management
� Port Attractiveness
� Relevance for Network
� Pro-active approach
Portfolio of Terminals
� Understand basic technology
� Understand imbalances
� Understand trade flow dynamics
Product strategy
Winning
clients and
ports
Roadshow presentation FY 2011 22

Contents
General Introduction
Achievements 2011
Business environment
Growth projects
Business performance
Financing
Outlook
Roadshow presentation FY 2011 23

Global energy product trends drive Vopak’s market
Oil products Chemical products Biofuels & Vegoils LNG
�Global Crude oil
trade business
�Europe’s gasoline
surplus
�Europe’s deficit for
middle distillates
�Asia’s deficit for
Fuel Oil
�Feedstock
advantage in ME
�Renewed Gulf
re-emerges due to
shale gas
�Rationalization in
Europe
�Politics, annual
harvest and
demand growth will
lead to increased
flows between US-
Brazil-Europe-Asia
�A globalizing
natural gas market
with new business
models
�LNG growth due to
imbalances,
security of supply
and environmental
push
Roadshow presentation FY 2011 24

Vopak market definition
Vopak’s competitive environment is defined as non-captive
marine tank storage for liquid oil and chemical products
Definition
Primary competition Independent competition renting only to third parties
Secondary competition Partly using the capacity for storing own products
(Some traders, distributors, producers, state-owned companies)
Captive competition Producers & traders using their capacity for storing only
their own products
Roadshow presentation FY 2011 25

Market share according to the definition
Storage market (cbm) Oil Chemicals Total
World Market 211 mln 53 mln 263 mln cbm
Primary Competition 132 mln 46 mln 178 mln cbm
Secondary Competition 79 mln 7 mln 86 mln cbm
Vopak Market Share
As % of total market 7% 21% 10.2%
As % of primary competition 12% 24% 15.1%
Vopak 15.7 mln 10.9 mln 26.9 mln cbm
Note: In mln cbm per February 2012; excluding storage market for LNG.
Roadshow presentation FY 2011 26

Demand growth in storage marketto support international trade flows
Additional Worldwide Storage Capacity Total
World Market, incl. Vopak 28.2 mln cbm
Growth % 10.7 %
Vopak 6.0 mln cbm
Growth as % of Vopak capacity 21.6 %*
Roadshow presentation FY 2011
* Based on current storage capacity of 27.8 million cbm.
27

Vopak: the global market leader
0 5 10 15 20 25 30
Vitol
CLH
IMTT
Buckeye
Magellan
SUMED terminal
Odfjell
Dalian Port
Horizon
Sunoco
CIM
VopakOiltanking
Kinder Morgan
NuStar
Storage capacity as per February 2012
In mln cbm
Note: Including inland capacity and Joint Ventures.Source: Vopak; company websites.
Roadshow presentation FY 2011 28

Contents
General Introduction
Achievements 2011
Business environment
Growth projects
Business performance
Financing
Outlook
Roadshow presentation FY 2011 29

Capacity developments 2010-2014
In mln cbm
Global products trends resulting in company growth through healthy demand for storage capacity
2011
93.0
2010
93.0
2009
94.0
2008
95.0
2007
96.0
2006
94.0
Occupancy rate
In percent
90-95%
+6.0
-1.0
31-12-2014
33.8
New terminals
4.2
Expansions
1.8
31-12-2011
27.8
New terminals
1.7
Expansions
0.8
Divest-ments
3.5
31-12-2010
28.8
Roadshow presentation FY 2011 30

Various projects under constructionTotal storage capacity under construction 6.0 million cbm
Under construction
Amsterdam Westpoort (2)
570,000 cbm; oil products
Pengerang
1,278,000 cbm; oil products
Fujairah
606,000 cbm; oil products
Europoort
400,000 cbm; oil products
Eemshaven
660,000 cbm; oil products
Hainan
1,350,000 cbm; oil products
Algeciras
403,000 cbm; oil products
Note: Above examples not representative of all projects under construction.Roadshow presentation FY 2011 31
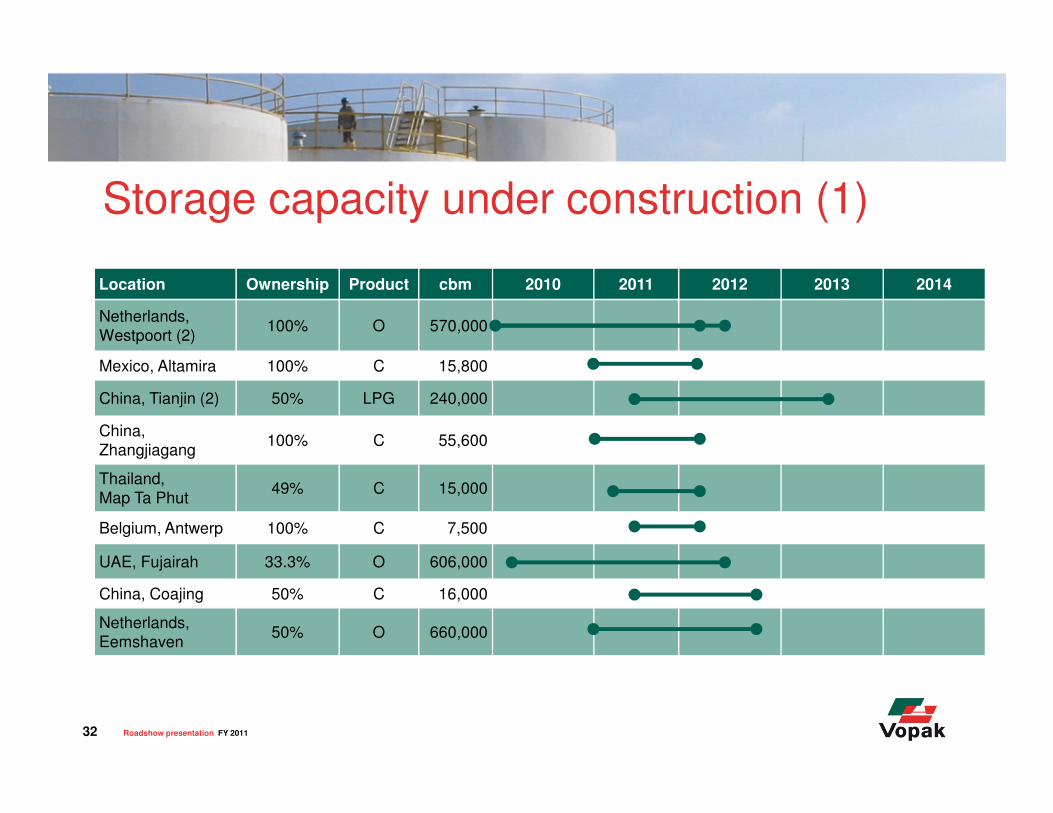
Storage capacity under construction (1)
Location Ownership Product cbm 2010 2011 2012 2013 2014
Netherlands,
Westpoort (2)100% O 570,000
Mexico, Altamira 100% C 15,800
China, Tianjin (2) 50% LPG 240,000
China,
Zhangjiagang100% C 55,600
Thailand,
Map Ta Phut49% C 15,000
Belgium, Antwerp 100% C 7,500
UAE, Fujairah 33.3% O 606,000
China, Coajing 50% C 16,000
Netherlands,
Eemshaven50% O 660,000
Roadshow presentation FY 2011 32

Storage capacity under construction (2)Location Ownership Product cbm 2010 2011 2012 2013 2014
Spain, Algeciras 80% O 403,000
Netherlands,
Rotterdam100% C 20,000
China,
Dongguan50% C 153,000
Singapore,
Banyan69.5% C 100,200
China, Hainan 49% O 1,350,000
Malaysia,
Pengerang44% O 1,278,000
Netherlands,
Europoort100% O 400,000
Total additional storage capacity (in million cbm) 2.1 2.2 1.7
Accumulated storage capacity (in million cbm) 27.8 29.9 32.1 33.8
Roadshow presentation FY 2011 33

Various projects under study Under study
Fos-sur-Mer
LNG
West-Java
LPG
Bioko Island
Oil products
Bahia Las Minas
Oil products
Perth Amboy
Oil products
Roadshow presentation FY 2011 34

Contents
General Introduction
Achievements 2011
Business environment
Growth projects
Business performance
Financing
Outlook
Roadshow presentation FY 2011 35

Contribution of Vopak value drivers in the past and present
Occupancy improvements
2003-06 2007-09 2010-2011 2012 >
Operational efficiency gains
Capacity expansion
PresentPresentPast Future
Playing field between 90 - 95%
Roadshow presentation FY 2011 36

Focused strategy delivers results
EBITDA Development 2006-2011*
In mln EUR
* Excluding exceptional items; including net result from Joint Ventures
+102%
2011
636.0
EBITDA
improvements
FX resultDivestments2006
314.1
� Healthy occupancy rate
� Improved revenue per cubic
meter
� Effective cost management
� Storage capacity growth
Roadshow presentation FY 2011 37

Contract duration portfolio did not change significantly since 2008
Contract position 2008
In percent of revenues
Contract position 2011
In percent of revenues
> 3 year 44%
1-3 year
37%
< 1 year
19%
> 3 year39%
1-3 year
41%
< 1 year
20%
Roadshow presentation FY 2011 38

Transition year 2011 in line with outlook
EBIT*
In million EUR1,171.9
+6%
20112010
1,106.3
Revenues
In million EUR
* Including net result from Joint Ventures.Note: Excluding exceptional items.
469.4
+5%
20112010
445.3
Earnings per share*
In EUR275.4
+4%
20112010
264.8
Net profit*
In million EUR2.16
+4%
20112010
2.08
Roadshow presentation FY 2011 39

+6.0
-1.0+7.6
2014
33.8
21.2
12.6
2013
32.1
11.3
2011
27.8
19.6
8.2
20.8
2010
28.8
18.3
10.5
2009
28.3
18.1
10.2
2008
27.1
17.5
9.6
2007
21.8
16.7
5.1
2006
21.2
15.8
5.4
2012
29.9
9.6
20.3
Storage capacityIn mln cbm
Revenue developments supported by robust demand for storage capacity
Subsidiaries
Joint ventures
Roadshow presentation FY 2011 40

Healthy occupancy rates between 90-95%
95
Q4
2008
95
Q3
2008
94
Q2
2008
95
Q1
2008
96
Q4
2011
94
Q3
2011
93
Q2
2011
93
Q1
2011
92
Q4
2010
92
Q3
2010
92
Q2
2010
93
Q1
2010
93
Q4
2009
93
Q3
2009
93
Q2
2009
95
Q1
2009
Occupancy rate
In percent
90-95%
Roadshow presentation FY 2011 41

Except from North America, all divisions contribute to 6% revenue growth
137.70%
20112010
138.3
North America
Note: Revenues in million EUR.
298.5+7%
20112010
278.1
OEMEA
308.7+13%
20112010
272.5
Asia
93.6+6%
20112010
88.2
Latin America
328.9+1%
20112010
325.1
CEMEA
Roadshow presentation FY 2011 42

EBIT excluding exceptional items increased by 5% to EUR 469.4 million
445.3EBIT excl. exceptional items
442.0
Operating profit
Net result Joint Ventures
(3.3)
358.6
83.4
Exceptional gain (loss)
EBIT incl. exceptional items
220.4
585.5
365.1
469.4
116.1
2010
In mln EUR
2011
In mln EUR
Delta
In percent
2%
164%
32%
5%
Net profit 264.8 275.4 4%
Roadshow presentation FY 2011 43

63% of EBIT generated in non-euro currencies
Total 2.6
Non allocated 0.1
Latin America 0.7
North America 1.6
Asia 5.4
CEMEA 0.4
OEMEA 0.2
FX translation-effect on EBITIn mln EUR
EBIT transactional currenciesIn percent
Other
24%
EUR37%
SGD28%
USD
11%
� Transactional currency exchange risks are
limited
� As a rule revenues, costs and financing are
denominated in the same currency
Note: Excluding exceptional items.Roadshow presentation FY 2011 44
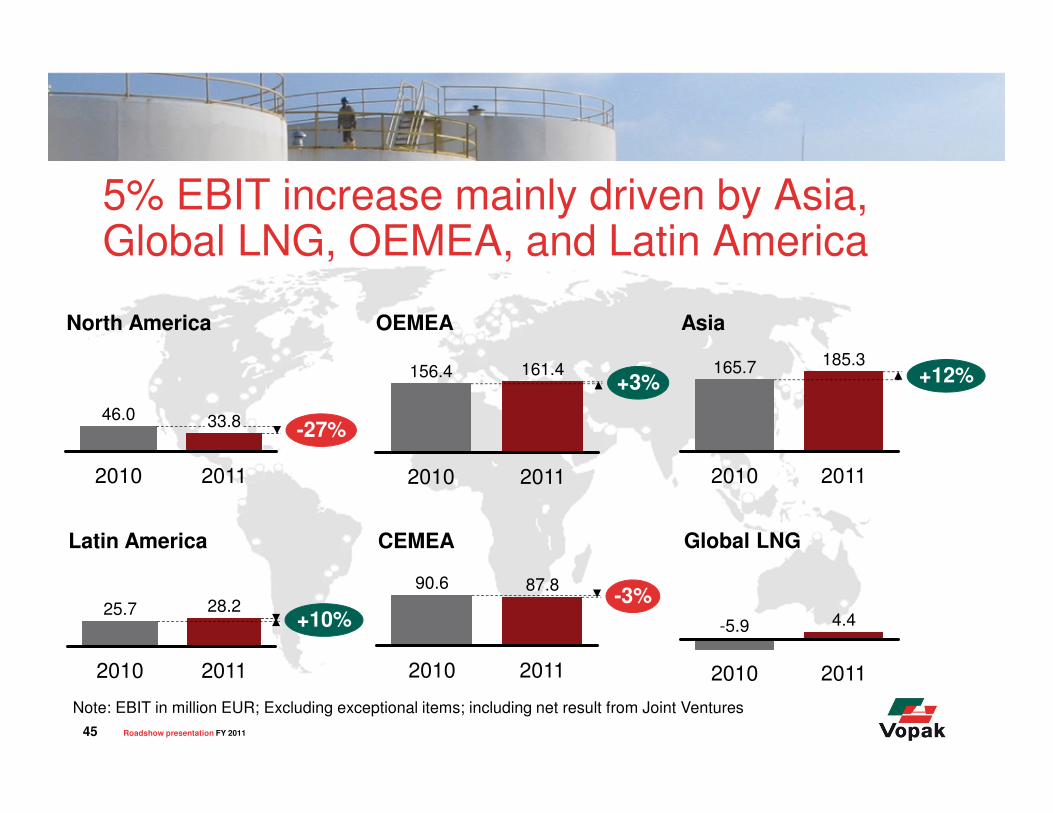
5% EBIT increase mainly driven by Asia, Global LNG, OEMEA, and Latin America
33.8 -27%
20112010
46.0
North America
Note: EBIT in million EUR; Excluding exceptional items; including net result from Joint Ventures
161.4+3%
20112010
156.4
OEMEA
185.3+12%
20112010
165.7
Asia
28.2+10%
20112010
25.7
Latin America
87.8-3%
20112010
90.6
CEMEA Global LNG
2011
4.4
2010
-5.9
Roadshow presentation FY 2011 45

1.2 -86%*
20112010
8.6
48.1+4%
20112010
46.129.6
0%
20112010
29.7
0.8
20112010
1.1-27%
2.1
2011
+40%
2010
1.5
2011
9.9
2010
-2,0
Net result from Joint Ventures increases with 8%
North America OEMEA Asia
Latin America CEMEA Global LNG
* Due to the sale of Vopak’s 20% equity stake in BORCO (Bahamas).Note: Results JVs in million EUR; Excluding exceptional items.
Roadshow presentation FY 2011 46

Revenues Incl. proportionate consolidation JVs tank storage
1,171.9
+6%
20112010
1,106.3
Revenues
Subsidiaries (Equity method)1,452.0
+6%
20112010
1,365.3
EBITDAIncl. proportionate consolidation JVs tank storage
EBITDA
Subsidiaries* (Equity method)
IFRS equity accounting versus proportionate consolidation
* Including net result from Joint Ventures.Note: In million EUR; Excluding exceptional items.
636.0+6%
20112010
598.2701.4
+5%
20112010
665.2
Roadshow presentation FY 2011 47

Former situation
CE
ME
A
Th
e N
eth
erl
an
ds
OE
ME
ACurrent situation
� The former divisions Vopak Chemicals
EMEA and Vopak Oil EMEA
� The current divisions Vopak Netherlands
and Vopak EMEA as of 1 January 2012
Further optimizing the organization structure
EM
EA
Roadshow presentation FY 2011 48
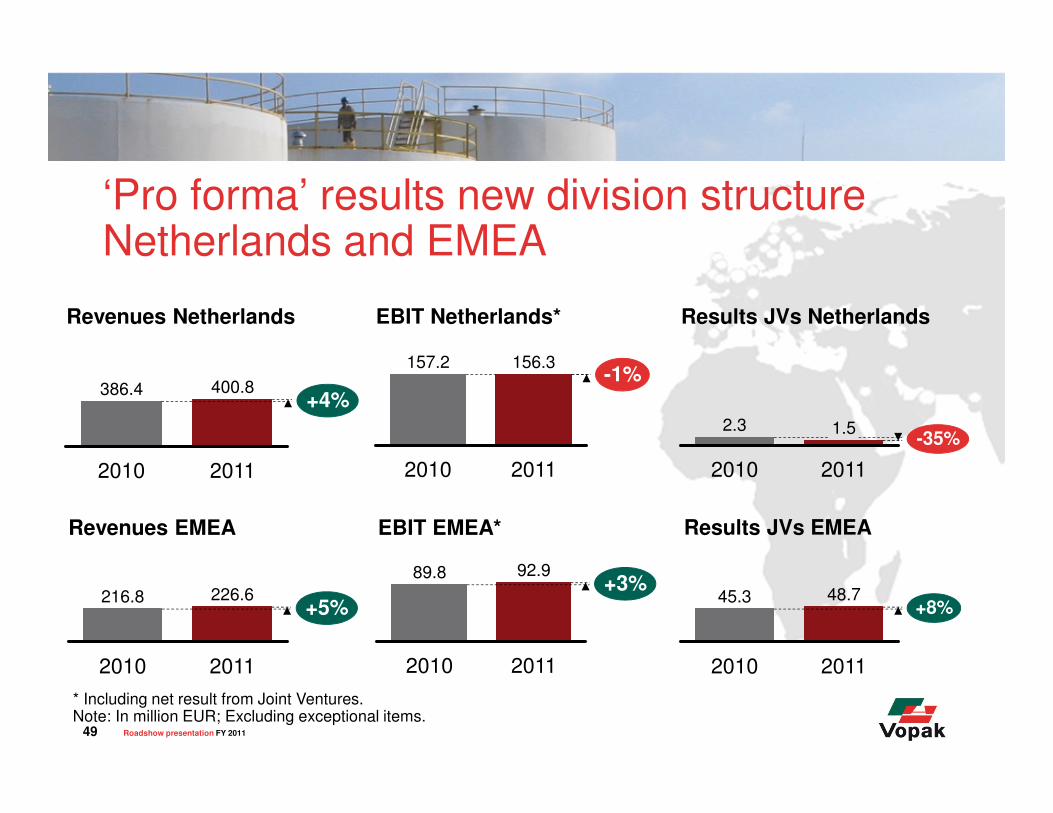
‘Pro forma’ results new division structure Netherlands and EMEA
400.8+4%
20112010
386.4
Revenues Netherlands
* Including net result from Joint Ventures.Note: In million EUR; Excluding exceptional items.
156.3-1%
20112010
157.2
EBIT Netherlands*
1.5-35%
20112010
2.3
Results JVs Netherlands
226.6+5%
20112010
216.8
Revenues EMEA
92.9+3%
20112010
89.8
EBIT EMEA* Results JVs EMEA
2011
48.7+8%
2010
45.3
Roadshow presentation FY 2011 49

Vopak is well positioned to maintain healthy EBIT(DA) margins
EBIT(DA) Margin*In percent
0
10
20
30
40
50
2004 2005 2006 2007 2008 2009 2010 2011
Focus on logistic efficiency improvements for our clients
has led to increased EBIT(DA) margins
* Excluding exceptional items; excluding Net result from Joint Ventures.
EBIT Margin
EBITDA Margin
Roadshow presentation FY 2011 50

Proposed 2011 dividend amounts to EUR 0.80 per ordinary share
+4%
1.62
0.55
2.16
2007
+14%
2011
1.31
0.80
2010
0.475
2.08
0.70
2006 2009
1.92
0.98
0.625
2008
0.375
Dividend share of EPS 2006-2011**In EUR
* Excluding exceptional items; attributable to holders of ordinary shares.** Excluding exceptional items; historical figures adjusted for 1:2 share split effectuated May 17, 2010.
Dividend share of EPS
Dividend policy: “Barring exceptional circumstances, the intention is to
pay an annual cash dividend of 25-40% of the net profit*”
Roadshow presentation FY 2011 51

Various other topics
“Net Finance costs aligned with expansion program.”
“Effective tax rate 2011.”
“Accounting consequences:
IAS 19 Employee Benefits
effective for 2013.”
“Sources and uses of cash in
2011.”
II
I
III
III
V
“Vopak’s Pensions.”
See appendix for further details
Roadshow presentation FY 2011 52

Quarterly EBIT development“Solid year-on-year growth”
EBIT development per Quarter*
In mln EUR
108.4113.398.6
Q1
109.5
+21%+6%
-4%0%
Q4
130.0
107.596.9
Q3
121.3114.8
104.2
Q2
109.7
85.6
EBIT 2011
EBIT 2010
EBIT 2009
* Excluding exceptional items.
Roadshow presentation FY 2011 53

Chemicals EMEA“Encouraging demand for chemical storage services”
EBIT development per Quarter*
In mln EUR
20.1
25.3
+8%
22.222.3
Q1
+21%-13%-21%
Q4
18.4
Q3
24.1
Q2
21.424.6
EBIT 2011
EBIT 2010
* Excluding exceptional items.
Capacity developmentsIn mln cbm
End 2011
4.33
Exp.End 2010
0.174.22
Div.
0.06
89% 90%
Occupancy rate FY 2010 FY 2011
Roadshow presentation FY 2011 54

Oil EMEA“Robust market conditions in the storage and handling of oil products”
EBIT development per Quarter*
In mln EUR
+27%
-1%-8%-5%
Q4
47.3
37.1
Q3
41.742.0
Q2
36.639.7
Q1
35.837.6
EBIT 2011
EBIT 2010
* Excluding exceptional items.
Capacity developmentsIn mln cbm
End 2011
12.28
Exp.
1.16
Div.
0.00
End 2010
11.12
95% 94%
Occupancy rate FY 2010 FY 2011
Roadshow presentation FY 2011 55

Asia“Continuous growth in Asia”
EBIT development per Quarter*
In mln EUR
+1%+5%+15%+29%
Q4
46.746.2
Q3
45.042.7
Q2
46.2
40.1
Q1
47.4
36.7
EBIT 2011
EBIT 2010
* Excluding exceptional items.
Capacity developmentsIn mln cbm
End 2011
7.09
Exp.
0.31
Div.
0.00
End 2010
6.78
92% 94%
Occupancy rate FY 2010 FY 2011
Roadshow presentation FY 2011 56

North America“Encouraging finish in a transition year”
EBIT development per Quarter*
In mln EUR
-26%
Q4
8.910.6
Q3
8.010.1
Q2
7.1
12.0
Q1
9.8
13.3-16%-21%
-41%
EBIT 2011
EBIT 2010
* Excluding exceptional items.
Capacity developmentsIn mln cbm
End 2011
2.32
Exp.
0.00
Div.
3.41
End 2010
5.73
94% 93%
Occupancy rate FY 2010 FY 2011
Roadshow presentation FY 2011 57

Latin America“Healthy demand for chemicals and palm oil”
EBIT development per Quarter*
In mln EUR
+60%+6%-10%0%
Q4
7.5
4.7
Q3
7.06.6
Q2
6.47.1
Q1
7.37.3
EBIT 2011
EBIT 2010
* Excluding exceptional items.
Capacity developmentsIn mln cbm
End 2011
0.99
Exp.
0.02
Div.
0.00
End 2010
0.97
90% 89%
Occupancy rate FY 2010 FY 2011
Roadshow presentation FY 2011 58

Results in HY2 2011 fuelled by expansions
610.8
+9%
HY2 2011HY2 2010
562.4
251.5
222.3 +13%
HY2 2011HY2 2010
HY2 2010
151.9
HY2 2011
+15%132.4 +14%
HY2 2011HY2 2010
1.041.19
* Including net result from Joint Ventures.Note: Excluding exceptional items.
EBIT*
In million EUR
Revenues
In million EUR
Earnings per share*
In EUR
Net profit*
In million EUR
Roadshow presentation FY 2011 59

Total investments
565535
800
446
268
711
201120102009200820072006
Total investments 2006-2011
In mln EUR
Total expansion CAPEX Group companies and JVs
In mln EUR
~1400
~500
Average yearly Sustaining Capex ~EUR150-200 mln
Total Capex(6.0 mln cbm under construction)
~1,900
Other Capex* ~1,400
Remaining Vopak share in Capex(Group Capex / equity share in JVs)
~500
* Group Capex spend; contributed Vopak equity share in JVs; total partners’ equity share in JVs; total non recourse financing in JVs.
Roadshow presentation FY 2011 60

Contents
General Introduction
Achievements 2011
Business environment
Growth projects
Business performance
Financing
Outlook
Roadshow presentation FY 2011 61

Strategic finance
0
1
2
3
4
5
2.63
2009
2.23
2008
2.54
2007
1.71
2006
1.61
2005
1.76
2004
2.20
2003*
2.42
3.75
2010
2.65
2011
Net senior debt : EBITDA ratio
* Based on Dutch GAAP.
Maximum Ratio under current US PP program
Maximum Ratio under other PP programs and syndicated revolving credit facility
Roadshow presentation FY 2011 62

Various other financing topics
“Debt funding program further strengthened during 2011.” “Maturity of debt
funding further enhanced.”
“Balanced debt
repayment schedule.”
VII
VI
VIII
See appendix for
further details
Roadshow presentation FY 2011 63

Contents
General Introduction
Achievements 2011
Business environment
Growth projects
Business performance
Financing
Outlook
Roadshow presentation FY 2011 64

Contribution of Vopak value drivers in the future
Occupancy improvements
2003-06 2007-09 2010-2011 2012 >
Operational efficiency gains
Capacity expansion
PresentPresentPast Future
Playing field between 90 - 95%
Roadshow presentation FY 2011 65

Solid
Outlook assumptions
Oil products Chemicals Biofuels & Vegoils LNG
Robust
~60%
Encouraging Solid
<1%
Mixed
~17.5-20%
Industrial terminals
~12.5% ~7.5-10%
2011
~60-65% ~2.5-5%~17.5-20% ~7.5-10% ~5-7.5%
2013
Note: width of the boxes do not represent actual percentages.
~x% Share of EBIT
Roadshow presentation FY 2011 66

Vopak expects to realize an EBITDA of between EUR 725-800 million in 2013
262.5
2004
231.8
2013
725-800
2011
636.0
2010
598.2
2009
513.4
2008
429.3
2007
369.5
2006
314.1
2005
EBITDA Development and guidanceIn EUR mln
Note: Excluding exceptional items; including Net result from Joint Ventures
Historical results
Guidance/Outlook
� Long-term
guidance
ROCE
average 16%
Roadshow presentation FY 2011 67

Note: Excluding exceptional items; including net result from Joint Ventures
Vopak expects to realize an EBITDA of between EUR 725-800 million in 2013
6% EBITDA growth
5% EBIT growth
4% EPS growth
Proposal cash dividend of EUR 0.80 per share (+14%)
Adequate funding of growth strategy secured
Roadshow presentation FY 2011 68

Forward-looking statement
This document contains statements of a forward-looking nature, based on currently available plans
and forecasts. Given the dynamics of the markets and the environments of the 31 countries in which
Vopak renders logistics services, the company cannot guarantee the accuracy and completeness of
forward-looking statements.
Unforeseen circumstances include, but are not limited to, exceptional income and expense items,
unexpected economic, political and foreign exchange developments, and possible changes to IFRS
reporting rules.
Statements of a forward-looking nature issued by the company must always be assessed in the
context of the events, risks and uncertainties of the markets and environments in which Vopak
operates. These factors could lead to actual results being materially different from those expected.
Roadshow presentation FY 2011 69

Royal Vopak
Westerlaan 10 Tel: +31 10 4002911
3016 CK Rotterdam Fax: +31 10 4139829
The Netherlands www.vopak.com

Net Finance costs aligned with expansion program
Net finance costs -68.4
Finance costs 73.0
Interest and
dividend income 4.6
Net finance costs 2010
In mln EUR
-78.6
85.9
7.3
2006
7.0
2011
4.7
2010
5.2
2009
5.4
2008
5.4
2007
6.3
Average interest rate
In percent
1,017.7
2008
996.7
2007
561.9
2006
425.7
2011
1,605.6
2010
1,431.4
2009
Net interest bearing debt
In mln EUR
Net finance costs 2011*
In mln EUR
* The increase is mainly attributable to the exceptional loss of EUR 5.0 million related to the sale of Vopak’s 20% equity stake in BORCO (Bahamas).
I
Roadshow presentation FY 2011 71
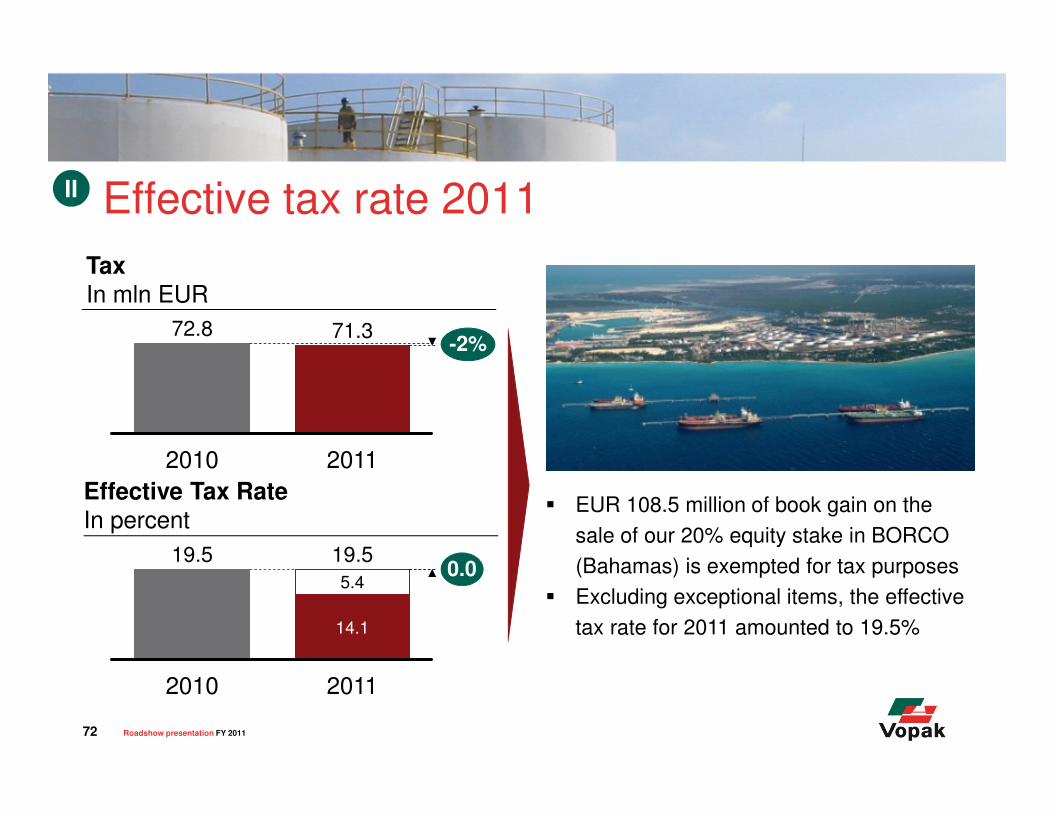
Effective tax rate 2011
Effective Tax Rate
In percent
-2%72.8 71.3
20112010
TaxIn mln EUR
0.05.4
19.5
2010
19.5
2011
14.1
� EUR 108.5 million of book gain on the
sale of our 20% equity stake in BORCO
(Bahamas) is exempted for tax purposes
� Excluding exceptional items, the effective
tax rate for 2011 amounted to 19.5%
II
Roadshow presentation FY 2011 72

Sources and uses of cash in 2011
Net Cash position
31/12/2011*
13.1
Divest-
ments
281.3
Invest-
ments
710.9
Tax paid
28.1
Net finance
costs
61.3
Gross
operating
cash flow
495.8
Net Cash position 1/1/2011*
147.8
FX /
(de)con-
solidation
2.9
-67.0
Financing
activities
181.4
Derivative
Settlement
Consolidated Statement of Cash Flows
In mln EUR
* Including bank overdrafts.
III
Roadshow presentation FY 2011 73

Vopak’s Pensions
Dutch 83%
Other 17%
� Cover ratio ultimo 2011
is 106%
� Return was 5% in 2011
� Pension contribution to
remain at the same,
maximum level of 30%
� An additional contribution
of EUR 50 million in 2011
Vopak’s Pension obligations
In percentDutch Pension Fund
Highlights
Other
20%
Dutch
80%
IV
Roadshow presentation FY 2011 74
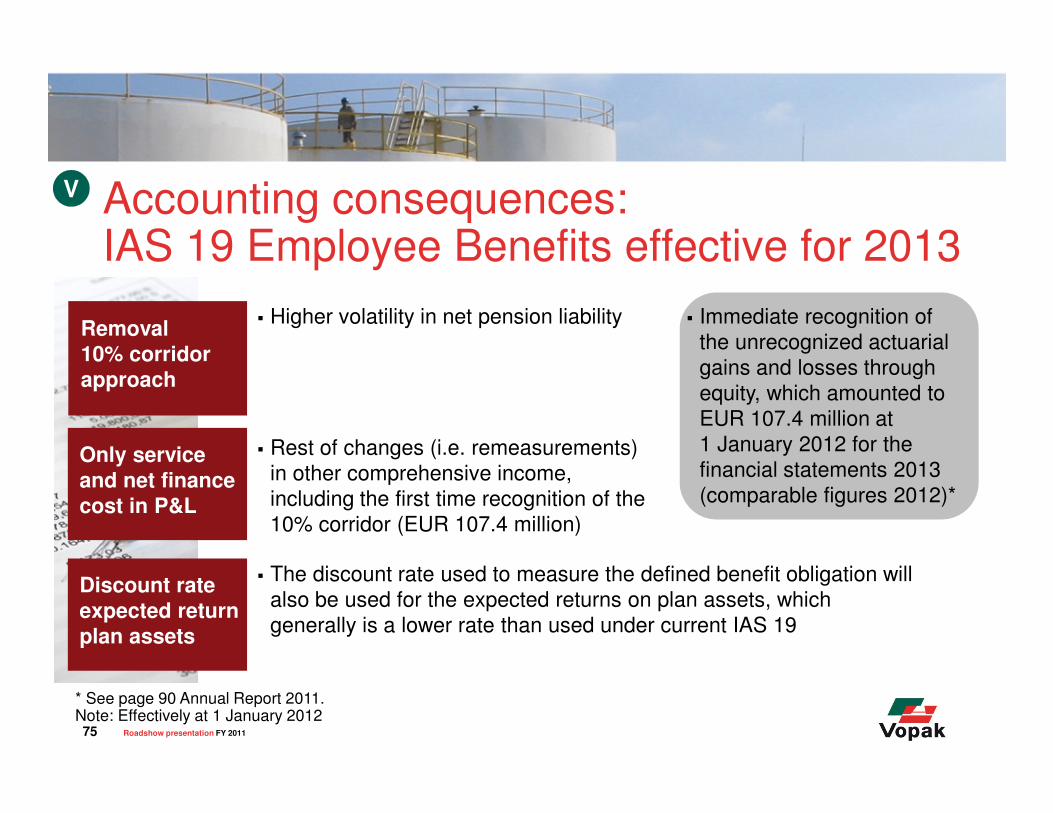
Accounting consequences: IAS 19 Employee Benefits effective for 2013
� Higher volatility in net pension liabilityRemoval
10% corridor
approach
Only service
and net finance
cost in P&L
� Rest of changes (i.e. remeasurements)
in other comprehensive income,
including the first time recognition of the
10% corridor (EUR 107.4 million)
Discount rate
expected return
plan assets
� The discount rate used to measure the defined benefit obligation will
also be used for the expected returns on plan assets, which
generally is a lower rate than used under current IAS 19
� Immediate recognition of
the unrecognized actuarial
gains and losses through
equity, which amounted to
EUR 107.4 million at
1 January 2012 for the
financial statements 2013
(comparable figures 2012)*
V
* See page 90 Annual Report 2011.Note: Effectively at 1 January 2012
Roadshow presentation FY 2011 75

Renewal RCF – 2 February 2012EUR 1.1 bln revolving credit facility (RCF)
Maturity 5 + 1 years
Debt funding program further strengthened during 2011
Renewal RCF – 2 February 2011EUR 1.2 bln revolving credit facility (RCF)
Maturity 5 + 1 + 1 years
Extension with 1 year
VI
Roadshow presentation FY 2011 76

Maturity of debt funding further enhanced
Maximum
Net Senior Debt/
EBITDA
3.75 3.75 3.75
Additional headroom
when financed with
subordinated debt
> 3.75 > 3.75
Minimum EBITDA /
Net Interest Payable3.5 3.5
Amount outstanding
Redemption
payment
- Up to 4.25 > 3.75
Term
Asian PPUS PP RCFCovenant
2001 2007 2009 SGD2009 SGD2010 JPY PP EUR 1.2 bln
4.0 3.5 3.5
65 mln 375 mln 674 mln
USD USD USD
2011-2016 2015-2022 2017-2029
210 mln 225 mln 20 bln
SGD SGD JPY
2014 2018 2040 2016*
* On 2 February 2012, extension of the facility with one additional year (EUR 1.1 billion).Note: PP = Private Placement and RCF = Revolving Credit Facility
EUR
100 mln
VII
Roadshow presentation FY 2011 77

Balanced debt repayment schedule2011 Overall weighted average interest rate 4.7%
Debt repayment schedule
In mln EUR
0
50
100
150
200
250
20132012 2022 2024 2029 2040202320202019 2021201820172016*20152014
* On 2 February 2012, revolving credit facility extension with one additional year (EUR 1.1 billion).
VIII
Roadshow presentation FY 2011 78

The world of Vopak
Roadshow presentation FY 2011 79