Embed Size (px)
Citation preview

1
October 23, 2017
Royal PhilipsThird Quarter 2017 Results
2
Important information
Forward-looking statements and other important informationThis document and the related oral presentation, including responses to questions following the presentation, contain certain forward-looking statements with respect to the financial condition, results of operations and business of Philips and certain of the plans and objectives of Philips with respect to these items. Examples of forward-looking statements include statements made about our strategy, estimates of sales growth, future EBITA and future developments in our organic business. By their nature, these statements involve risk and uncertainty because they relate to future events and circumstances and there are many factors that could cause actual results and developments to differ materially from those expressed or implied by these statements.
These factors include, but are not limited to, domestic and global economic and business conditions, developments within the euro zone, the successful implementation of our strategy and our ability to realize the benefits of this strategy, our ability to develop and market new products, changes in legislation, legal claims, changes in exchange and interest rates, changes in tax rates, pension costs and actuarial assumptions, raw materials and employee costs, our ability to identify and complete successful acquisitions and to integrate those acquisitions into our business, our ability to successfully exit certain businesses or restructure our operations, the rate of technological changes, political, economic and other developments in countries where Philips operates, industry consolidation and competition. As a result, Philips’ actual future results may differ materially from the plans, goals and expectations set forth in such forward-looking statements. For a discussion of factors that could cause future results to differ from such forward-looking statements, see the Risk management chapter included in the Annual Report 2016.
Third-party market share dataStatements regarding market share, including those regarding Philips’ competitive position, contained in this document are based on outside sources such as specialized research institutes, industry and dealer panels in combination with management estimates. Where information is not yet available to Philips, those statements may also be based on estimates and projections prepared by outside sources or management. Rankings are based on sales unless otherwise stated.
Use of non-GAAP InformationIn presenting and discussing the Philips’ financial position, operating results and cash flows, management uses certain non-GAAP financial measures. These non-GAAP financial measures should not be viewed in isolation as alternatives to the equivalent IFRS measures and should be used in conjunction with the most directly comparable IFRS measures. A reconciliation of such measures to the most directly comparable IFRS measures is contained in our Annual Report 2016 and Semi-Annual Report 2017. Further information on non-GAAP measures can be found in our Annual Report 2016.
Use of fair-value measurementsIn presenting the Philips’ financial position, fair values are used for the measurement of various items in accordance with the applicable accounting standards. These fair values are based on market prices, where available, and are obtained from sources that are deemed to be reliable. Readers are cautioned that these values are subject to changes over time and are only valid at the balance sheet date. When quoted prices or observable market data are not readily available, fair values are estimated using valuation models, which we believe are appropriate for their purpose. Such fair value estimates require management to make significant assumptions with respect to future developments, which are inherently uncertain and may therefore deviate from actual developments. Critical assumptions used are disclosed in our Annual Report 2016. Independent valuations may have been obtained to support management’s determination of fair values.
All amounts are in millions of Euro’s unless otherwise stated. Due to rounding, amounts may not add up precisely to totals provided. All reported data is unaudited. Financial reporting is in accordance with the accounting policies as stated in the Annual Report 2016, unless otherwise stated.
Market Abuse RegulationThis presentation contains inside information within the meaning of Article 7(1) of the EU Market Abuse Regulation.
3
Content
1. Company Overview and Strategy
2. Medium-term Financial Outlook
3. Financial Performance
Appendix
3
18
22
29
4
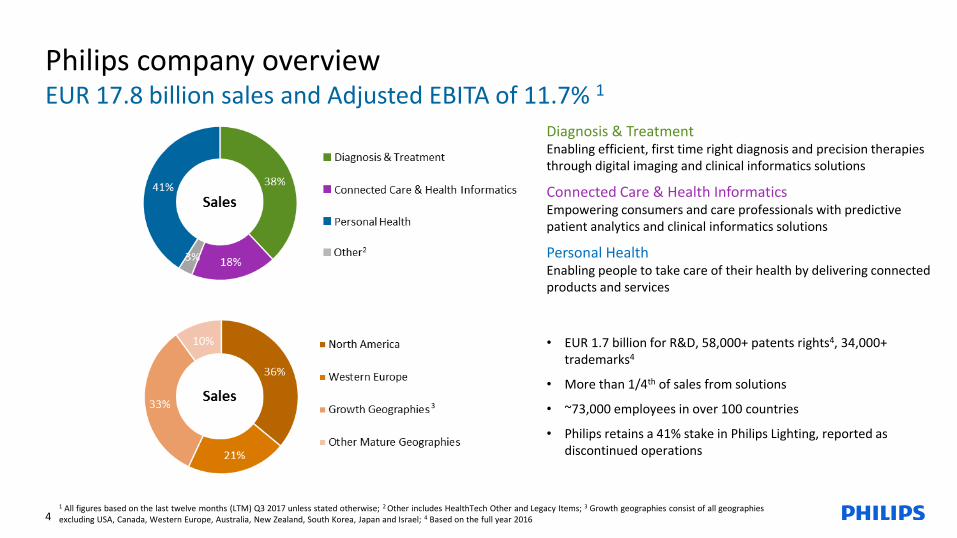
Philips company overviewEUR 17.8 billion sales and Adjusted EBITA of 11.7% 1
1 All figures based on the last twelve months (LTM) Q3 2017 unless stated otherwise; 2 Other includes HealthTech Other and Legacy Items; 3 Growth geographies consist of all geographies excluding USA, Canada, Western Europe, Australia, New Zealand, South Korea, Japan and Israel; 4 Based on the full year 2016
• EUR 1.7 billion for R&D, 58,000+ patents rights4, 34,000+ trademarks4
• More than 1/4th of sales from solutions
• ~73,000 employees in over 100 countries
• Philips retains a 41% stake in Philips Lighting, reported as discontinued operations
3
Diagnosis & TreatmentEnabling efficient, first time right diagnosis and precision therapies through digital imaging and clinical informatics solutions
Connected Care & Health InformaticsEmpowering consumers and care professionals with predictive patient analytics and clinical informatics solutions
Personal HealthEnabling people to take care of their health by delivering connected products and services
5
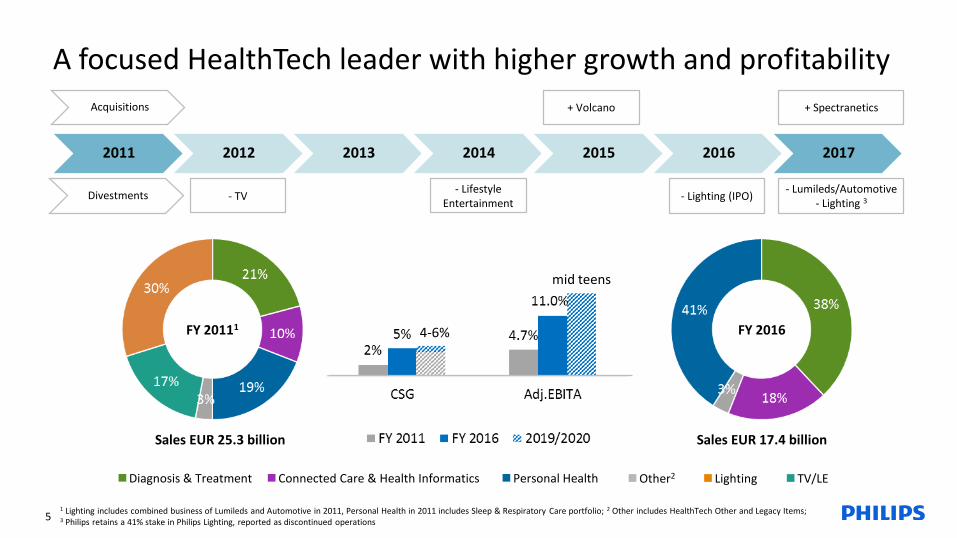
A focused HealthTech leader with higher growth and profitability
FY 20111 FY 2016
Diagnosis & Treatment LightingOther2 TV/LEPersonal Health
1 Lighting includes combined business of Lumileds and Automotive in 2011, Personal Health in 2011 includes Sleep & Respiratory Care portfolio; 2 Other includes HealthTech Other and Legacy Items; 3 Philips retains a 41% stake in Philips Lighting, reported as discontinued operations
Connected Care & Health Informatics
2011 2012 2013 2014 2015 2016 2017
- Lifestyle Entertainment
+ Volcano
- Lighting (IPO) - TV- Lumileds/Automotive
- Lighting 3
Sales EUR 25.3 billion Sales EUR 17.4 billion
4-6%
mid teens
+ SpectraneticsAcquisitions
Divestments
6
47
47
52
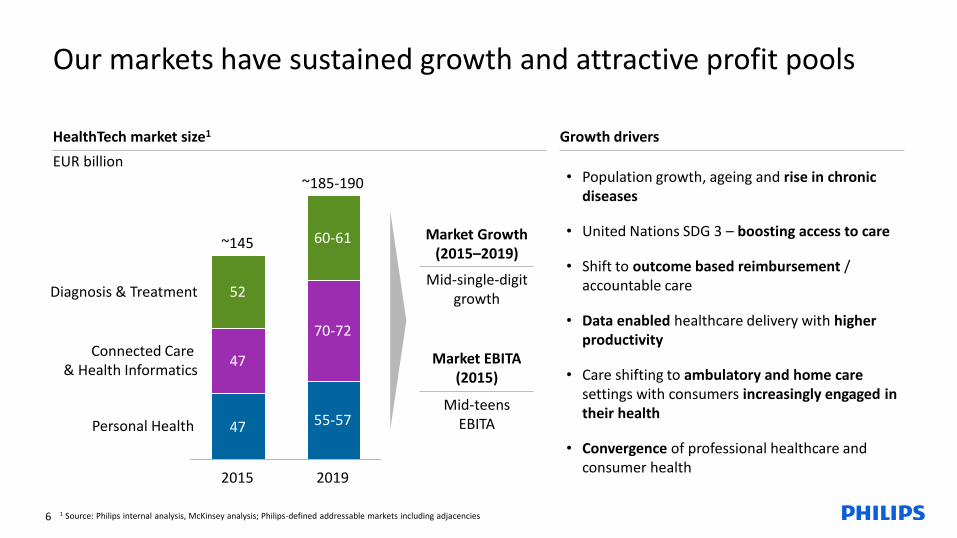
Our markets have sustained growth and attractive profit pools
Personal Health
Connected Care & Health Informatics
Diagnosis & Treatment
2019
~185-190
55-57
70-72
60-61
2015
~145
• Population growth, ageing and rise in chronic diseases
• United Nations SDG 3 – boosting access to care
• Shift to outcome based reimbursement / accountable care
• Data enabled healthcare delivery with higher productivity
• Care shifting to ambulatory and home care settings with consumers increasingly engaged in their health
• Convergence of professional healthcare and consumer health
EUR billion
Mid-teens EBITA
Mid-single-digitgrowth
Market Growth (2015–2019)
Market EBITA (2015)
HealthTech market size1 Growth drivers
1 Source: Philips internal analysis, McKinsey analysis; Philips-defined addressable markets including adjacencies

7
We deliver differentiated solutions to drive better outcomes for people and higher productivity for care providers across health continuum
Connected products and services supporting the health
and wellbeing of people
Integrated modalities and clinical informatics to deliver
definitive diagnosis
Real-time visualization & smart devices for minimally
invasive interventions
Connected therapeutic products & services for chronic care patients
Connecting patients and providers for more effective, coordinated, personalized careManage population health leveraging real-time patient data and clinical analytics
PreventionHealthy living Diagnosis Treatment Home care
Care pathways for Cardiology, Oncology, Respiratory, etc.

8
Operating through three segments across the health continuum
Patient Care & Monitoring Solutions Patient monitors, hospital ventilators, defibrillators
Healthcare Informatics Healthcare IT, clinical and imaging informatics
Population Health Management Home monitoring, remote cardiac monitoring
Key products
Diagnostic Imaging Computed tomography, magnetic resonance, digital X-ray
Ultrasound Ultrasound scanners
Image-Guided Therapy Interventional X-ray, devices for diagnosis and therapy
Health & Wellness Power toothbrushes, mother & child care
Sleep & Respiratory Care Home ventilators, CPAP, respiratory masks
Personal Care Male grooming, skin care
Domestic Appliances Air purification, small kitchen appliances
Adj. EBITA margin1Sales1 (EUR bn)
Personal Health
Diagnosis & Treatment
Connected Care & Health Informatics
Segments and businesses1,2 (share of revenues)
38%
18%
41%
1 All figures based on the last twelve months (LTM) Q3 2017 unless stated otherwise; 2 Excludes HealthTech Other and Legacy Items
16.5%
CSG 6%
9
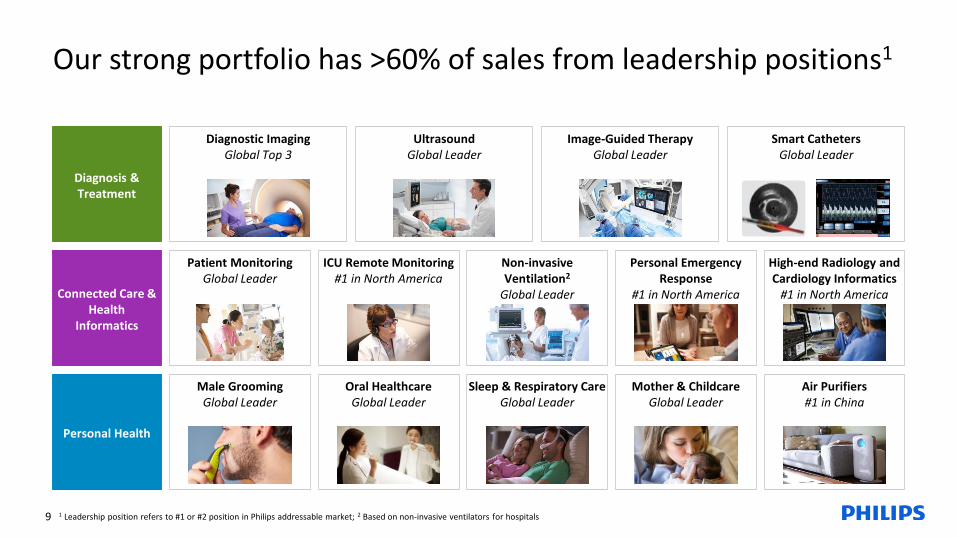
Our strong portfolio has >60% of sales from leadership positions1
Male GroomingGlobal Leader
Oral HealthcareGlobal Leader
Sleep & Respiratory Care Global Leader
Mother & ChildcareGlobal Leader
Air Purifiers #1 in China
Patient Monitoring Global Leader
ICU Remote Monitoring#1 in North America
Non-invasiveVentilation2
Global Leader
Personal Emergency Response
#1 in North America
High-end Radiology and Cardiology Informatics
#1 in North America
Diagnostic Imaging Global Top 3
Image-Guided TherapyGlobal Leader
UltrasoundGlobal Leader
Smart CathetersGlobal Leader
Diagnosis & Treatment
Connected Care & Health
Informatics
Personal Health
1 Leadership position refers to #1 or #2 position in Philips addressable market; 2 Based on non-invasive ventilators for hospitals
10
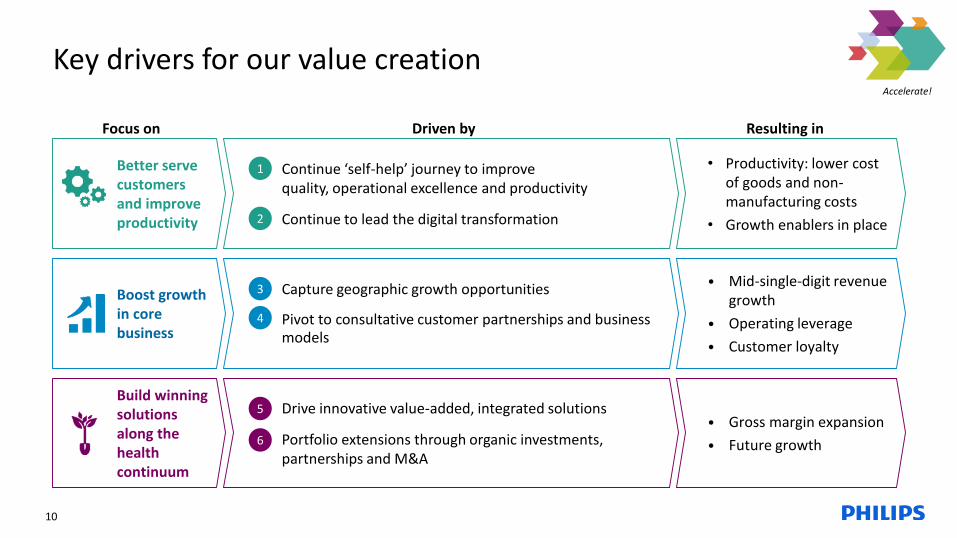
Key drivers for our value creation
Better serve customers and improve productivity
Boost growth in core business
Build winning solutions along the health continuum
• Productivity: lower cost of goods and non-manufacturing costs
• Growth enablers in place
Focus on Resulting in
• Mid-single-digit revenue growth
• Operating leverage
• Customer loyalty
• Gross margin expansion
• Future growth
1. Continue ‘self-help’ journey to improve quality, operational excellence and productivity
2. Continue to lead the digital transformation
1
2
3. Capture geographic growth opportunities
4. Pivot to consultative customer partnerships and business models
5. Drive innovative value-added, integrated solutions
6. Portfolio extensions through organic investments, partnerships and M&A
3
4
5
6
Driven by
Accelerate!

11
Excellence
Productivity programs1
• Operational excellence by applying the Philips Business System
• Continuous improvement, leveraging Philips Excellence practices
• ‘Design for Quality’ methodology in product design and Supplier Selection
• One Philips Quality Management System
Productivity driven by operating leverage and a EUR 1.2 billion program over the next three years comprising of:
• Consolidating geographical manufacturing footprint
• Procurement savings, led by proven DfX program
• Overhead cost reduction
MissionVision
Philips Business System
1 Targeted gross savings before inflation and price erosion
Continue ‘self-help’ journey to improve quality, operational excellence and productivity
Accelerate!

12
…deployed over patient-centric “HealthSuite” IoT cloud and process automation
…unlocking superior value for customers (examples)
Connected infrastructure
Connected solutions and
services
Connected customers
… through real time digital software and services…(examples)
#1 Cardio Informatics
Digital workflows
4 million sleeppatients connected
Patient outcomes
1 billion+ patients monitored in last 5 years
Predictive analytics
Connectingelderly care
Emergency response
Integrated clinical applicationsConnected digital propositions
Philips Integrated IT Landscape
End-to-end business processes
We have a unique position to tap into the HealthTech opportunityContinue to lead the digital transformation
13
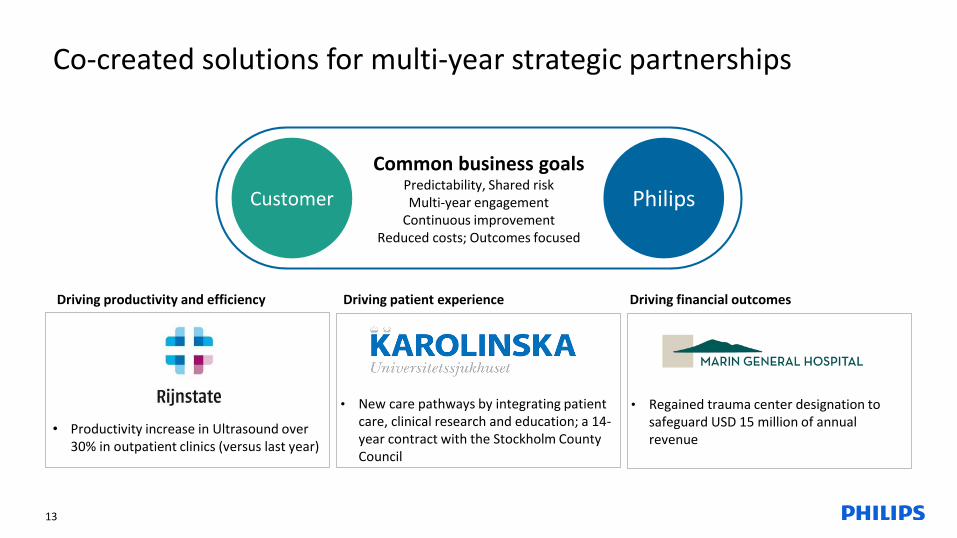
Co-created solutions for multi-year strategic partnerships
Common business goalsPredictability, Shared riskMulti-year engagement
Continuous improvementReduced costs; Outcomes focused
Customer Philips
• Regained trauma center designation to safeguard USD 15 million of annual revenue
• New care pathways by integrating patient care, clinical research and education; a 14-year contract with the Stockholm County Council
• Productivity increase in Ultrasound over 30% in outpatient clinics (versus last year)
Driving productivity and efficiency Driving patient experience Driving financial outcomes
14
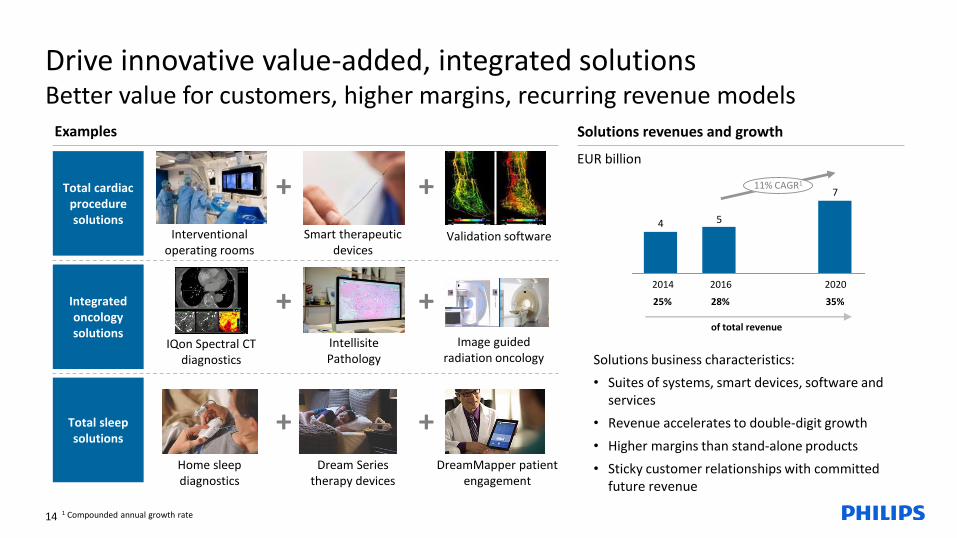
7
54
Total cardiac procedure solutions
Integrated oncology solutions
Total sleep solutions
Solutions business characteristics:
• Suites of systems, smart devices, software and services
• Revenue accelerates to double-digit growth
• Higher margins than stand-alone products
• Sticky customer relationships with committed future revenue
Home sleep diagnostics
Dream Series therapy devices
DreamMapper patient engagement
Interventional operating rooms
Validation software Smart therapeutic devices
+
+
+
+
+
+
IQon Spectral CT diagnostics
IntellisitePathology
Image guidedradiation oncology
2014 2016 2020
11% CAGR1
Examples Solutions revenues and growth
1 Compounded annual growth rate
EUR billion
Drive innovative value-added, integrated solutionsBetter value for customers, higher margins, recurring revenue models
of total revenue
25% 35%28%
15
Our innovations are a result of deep clinical collaborations with universities & hospitals and advanced R&D programs
• Annual spend of ~EUR 1.7 billion for research & development
– ~20% breakthrough innovation
– ~50% new product development
– ~30% sustaining engineering
• Strong IP portfolio consisting of 58,000+ patents1, 34,000+ trademarks1 and 40,000+ design rights1
• 60%+ R&D professionals in software
• Global R&D footprint
Commitment towards innovation Examples of collaborative clinical co-creation
1 Based on the full year 2016

16
Sustainability is an integral part of how we do business
Industry Group Leader in 2017, 2016, 2015
4th consecutive year of leadership in the Carbon Disclosure Project
“Champion for Change” award from Practice GreenHealth, 3rd consecutive year
As of January 2017, Philips in North America is 100% powered by wind energy
• 54% of sales from Green Products in 2015
• 41% reduction in carbon footprint in 10 years
• 2 billion lives improved
Success of EcoVision 2015 program
• Carbon neutral operations
• 70% turnover from green products; 15% will be circular
• Zero waste to landfill
• Supplier sustainability program with all our suppliers
• 2.5 billion lives improved by 2020
New 2020 program “Healthy people, sustainable planet” Recent accomplishments

17
Experienced management team driving growth, operational excellence and value creation
Innovation& StrategyJeroen Tas
Human ResourcesRonald de Jong
OperationsSophie Bechu
Legal Marnix van Ginneken
Global Markets1
Henk de JongPersonal HealthEgbert van Acht
CEOFrans van Houten
North AmericaBrent Shafer
CFOAbhijitBhattacharya
Greater ChinaAndy Ho
1 Excluding North America and China
CEO / CFO Segment Leaders Market Leaders Function Leaders
Diagnosis & TreatmentRobert Cascella
Connected Care & Health InformaticsCarla Kriwet
18
Content
1. Company Overview and Strategy
2. Medium-term Financial Outlook
3. Financial Performance
Appendix
3
18
22
29

19
2019 / 2020
17
20
15
20162014
Building Philips to EUR 20 billion1 sales with significantly improved returns Medium-term financial outlook
• Mid-single-digit growth rate (4-6%)
• On average 100bps Adj. EBITA margin improvement annually
• Free cash flow generation of ~EUR 1–1.5 billion annually
• Organic plan ROIC improves to mid-to-high teens
Diagnosis & Treatment
Connected Care & Health Informatics
Personal Health
• Performance improvement driven by:
– Operational excellence and growth in Diagnosis & Treatment
– Capture growth in Connected Care & Health Informatics
– Continue momentum in Personal Health
• Continued productivity initiatives to improve margins
• Balance Sheet improvements will contribute to improving cash flow and earnings
4% CAGR2
4-6% CAGR
Sales, EUR billion
1 Based on current foreign exchange rates; 2 Sales growth represents comparable compounded annual growth rates

20
Productivity initiatives of EUR 1.2 billion to drive 100 basis points annual improvement over the medium-term1
This plan is largely a “self-help” and a continuation of our Accelerate! approach
• Operating leverage in selling expenses and R&D
• Gross margin improvement:
– Consolidating geographical manufacturing footprint
– Procurement savings, led by proven DfX program
– Mix improvement
• Overhead reduction enabled by simplification of end-to-end businesses processes
Main driversAdj. EBITA step-up drivers
Indicative Adj. EBITA margin, %
Gross margin InflationOverhead cost reduction
Price erosion
Volume
~1.0
~1.0
~1.3
~1.1
~1.9
~0.5
Average annual improvement
1 3-4 years as of the end of 2016

21
Disciplined capital allocation balancing attractive shareholder returns and investments for growth
Continue to invest in high ROIC organic growth opportunities
Disciplined but more active approach to M&A, while continuing toadhere to strict return hurdles
– Strategic acquisitions of Volcano and Spectranetics for c. EUR 2.9billion
Dividend policy aimed at dividend stability
– Track record of stable or rising dividends over more than 20 years
New EUR 1.5 billion share buyback program for the coming two years.Completed EUR 3.5 billion of share buybacks between 2011-2016
Committed to a strong investment grade rating
Continued focus on driving balance sheet efficiency
Total shareholder returns since 2016 2
Total shareholder returns since 2012 1
Source: Bloomberg as of 20 October, 2017
Jan-2016 Apr-2016 Aug-2016 Nov-2016 Mar-2017 Jun-2017 Oct-2017
Philips HealthTech TSR Peer Index Euro STOXX 50
59.5 %
25.9 %
16.3 %
1 TSR Peer Index includes companies as described in the Philips Annual Report 2016; 2 HealthTech TSR Peer Index includes companies as described in the AGM 2017 agenda
Jan-2012 Dec-2012 Dec-2013 Nov-2014 Nov-2015 Oct-2016 Oct-2017
Philips TSR Peer Index Euro STOXX 50
169.2 %
126.4 %
84.6 %
22
Content
1. Company Overview and Strategy
2. Medium-term Financial Outlook
3. Financial Performance
Appendix
3
18
22
29
23 1 Sales calculated on the last twelve months basis. Inventories as a % of sales excludes inventories and sales related to acquisitions, divestments and discontinued operations
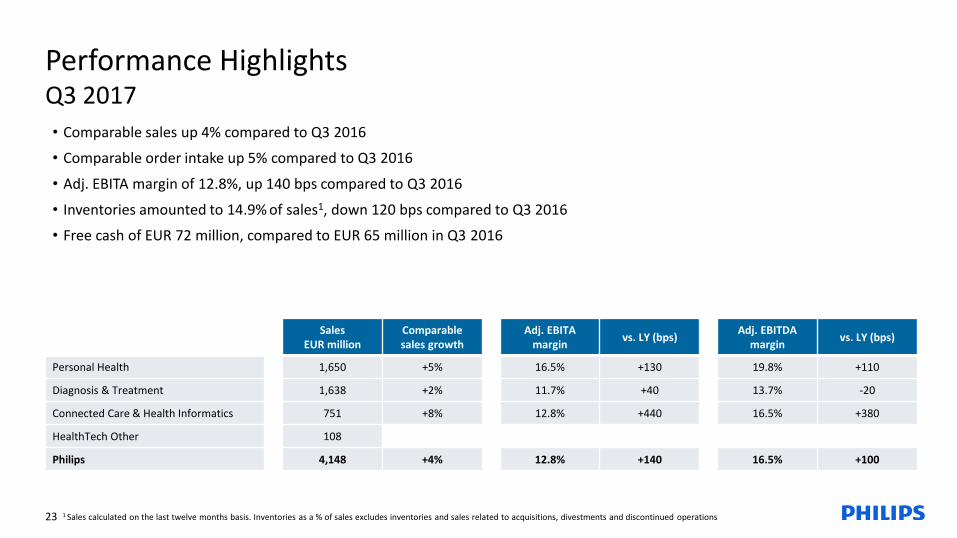
Performance HighlightsQ3 2017
• Comparable sales up 4% compared to Q3 2016
• Comparable order intake up 5% compared to Q3 2016
• Adj. EBITA margin of 12.8%, up 140 bps compared to Q3 2016
• Inventories amounted to 14.9% of sales1, down 120 bps compared to Q3 2016
• Free cash of EUR 72 million, compared to EUR 65 million in Q3 2016
Sales EUR million
Comparable sales growth
Adj. EBITA margin
vs. LY (bps)Adj. EBITDA
margin vs. LY (bps)
Personal Health 1,650 +5% 16.5% +130 19.8% +110
Diagnosis & Treatment 1,638 +2% 11.7% +40 13.7% -20
Connected Care & Health Informatics 751 +8% 12.8% +440 16.5% +380
HealthTech Other 108
Philips 4,148 +4% 12.8% +140 16.5% +100
24
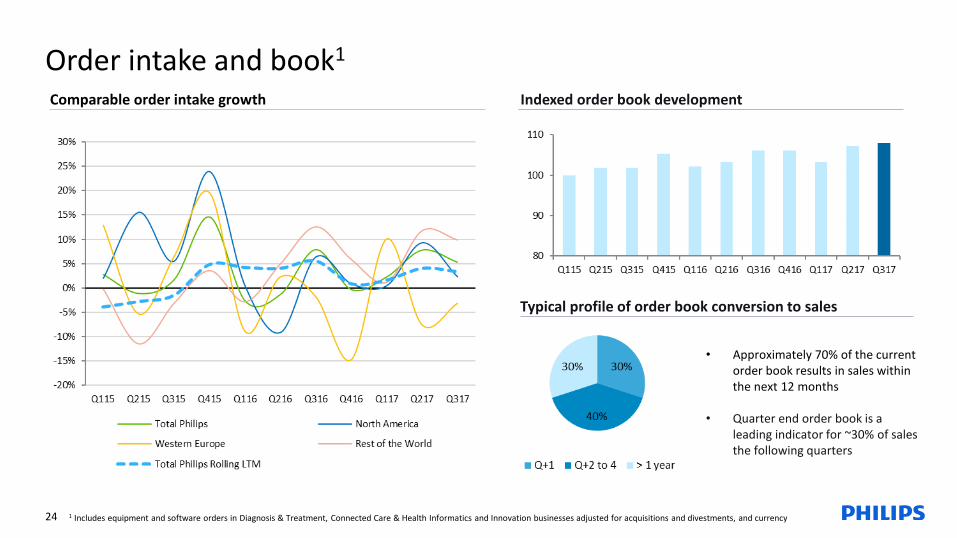
Order intake and book1
Comparable order intake growth
1 Includes equipment and software orders in Diagnosis & Treatment, Connected Care & Health Informatics and Innovation businesses adjusted for acquisitions and divestments, and currency
Indexed order book development
• Approximately 70% of the current order book results in sales within the next 12 months
• Quarter end order book is a leading indicator for ~30% of sales the following quarters
Typical profile of order book conversion to sales

25
Underlying improvements in profitability
EUR million3 years plan1 Q3 2017 YTD 2017
Procurement 700 77 179
Other productivity (net)2 500 69 171
Total (net) 1,200 146 350
1 As of the end of 2016; 2 Includes overhead cost reduction and other productivity in gross margin
Adjusted EBITA bridge for Q3 2017as a % of sales
Productivity initiatives contributing to medium-term targets
26
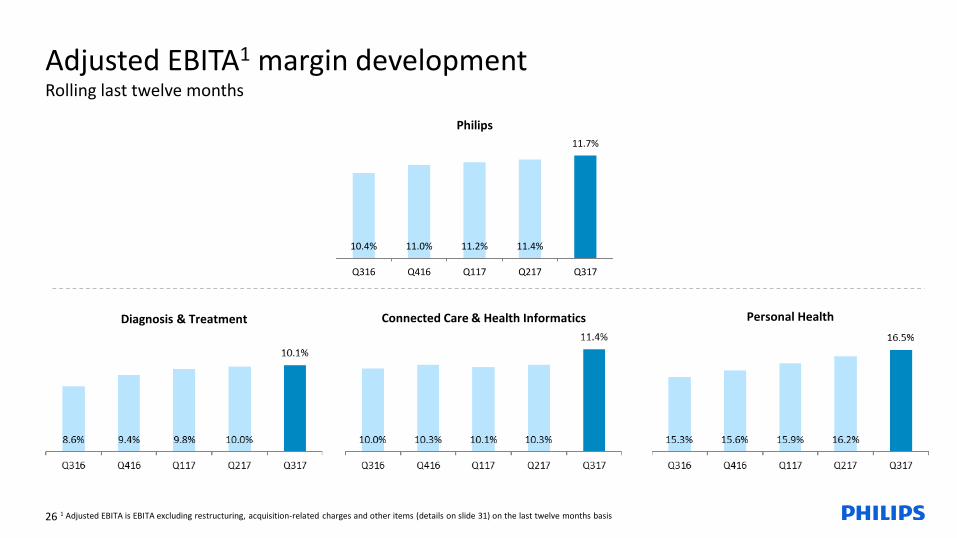
Philips
10.4% 11.0% 11.2% 11.4%
11.7%
Q316 Q416 Q117 Q217 Q317
Adjusted EBITA1 margin developmentRolling last twelve months
1 Adjusted EBITA is EBITA excluding restructuring, acquisition-related charges and other items (details on slide 31) on the last twelve months basis
Diagnosis & Treatment Personal HealthConnected Care & Health Informatics

27
Working capital and inventories
1 Working capital excluding HealthTech Other and Legacy Items; 2 Working capital as a % of LTM sales and Inventories as a % of LTM sales exclude acquisitions, divestments and discontinued operations
as % of LTM sales2Working capital1, EUR million as % of LTM sales2Inventories, EUR million
Diagnosis & Treatment Personal HealthConnected Care & Health Informatics

28
ROIC
ROIC excl. the charges related to Pension settlements in Q4 2015
Weighted Average Cost of Capital (WACC)
Development of Return on Invested Capital (ROIC)
• ROIC1 decreased to 13.2% in Q3 2017 compared to 15.4% in Q2 2017 mainly driven by acquisitions and increased one-off charges.
1 Philips calculates ROIC % as: EBIAT/ NOC; Quarterly ROIC % is based on LTM EBIAT and average NOC over the last 5 quarters; EBIAT are earnings before interest after tax; reported tax used to calculate EBIAT

29
Appendix

30
EUR million Q3 2016 Q3 2017
Sales 4,157 4,148
Income from operations (EBIT) 381 299
Financial expenses, net (189) (35)
Income taxes 16 (5)
Net income (loss) 383 423
Net cash flow from operating activities 259 295
Net capital expenditures (194) (223)
Free cash flow 65 72
EBITA 441 364
Adjusted EBITA 4741 5322
Adjusted EBITDA 6461 6862
Key financials
1 Q3 2016 excludes EUR (10)M of restructuring and acquisition-related charges and EUR (23)M other items. 2 Q3 2017 excludes EUR (120)M of restructuring and acquisition-related charges and EUR (47)M other items. 3 Capital expenditures and depreciations on property, plant and equipment only.
EUR million Q3 2016 Q3 2017 FY 2015 FY 2016
Gross CapEx3 93 107 432 360
Depreciation3 104 108 422 458
Capitalization of development costs 79 106 351 345
Amortization of development costs 56 92 242 225
Amortization of software and other intangible assets
72 78 308 293
31
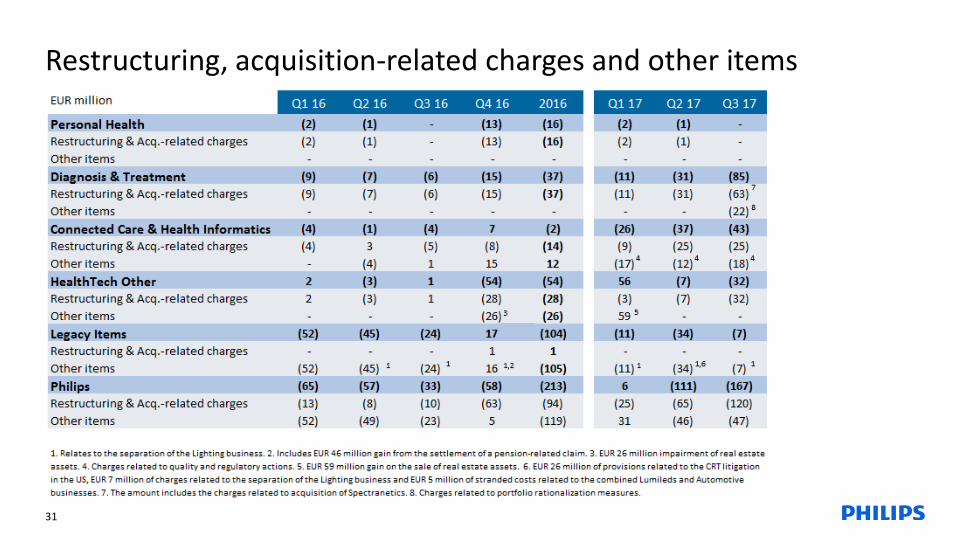
Restructuring, acquisition-related charges and other items
32
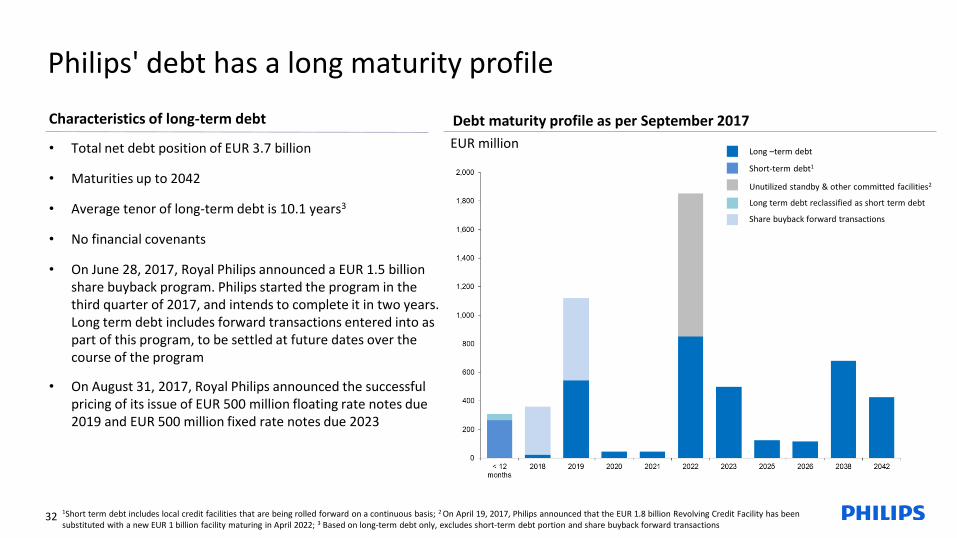
Philips' debt has a long maturity profile
Characteristics of long-term debt
• Total net debt position of EUR 3.7 billion
• Maturities up to 2042
• Average tenor of long-term debt is 10.1 years3
• No financial covenants
• On June 28, 2017, Royal Philips announced a EUR 1.5 billion share buyback program. Philips started the program in the third quarter of 2017, and intends to complete it in two years. Long term debt includes forward transactions entered into as part of this program, to be settled at future dates over the course of the program
• On August 31, 2017, Royal Philips announced the successful pricing of its issue of EUR 500 million floating rate notes due 2019 and EUR 500 million fixed rate notes due 2023
1Short term debt includes local credit facilities that are being rolled forward on a continuous basis; 2 On April 19, 2017, Philips announced that the EUR 1.8 billion Revolving Credit Facility has been substituted with a new EUR 1 billion facility maturing in April 2022; 3 Based on long-term debt only, excludes short-term debt portion and share buyback forward transactions
Debt maturity profile as per September 2017
EUR millionLong –term debt
Short-term debt1
Unutilized standby & other committed facilities2
Long term debt reclassified as short term debt
Share buyback forward transactions
33
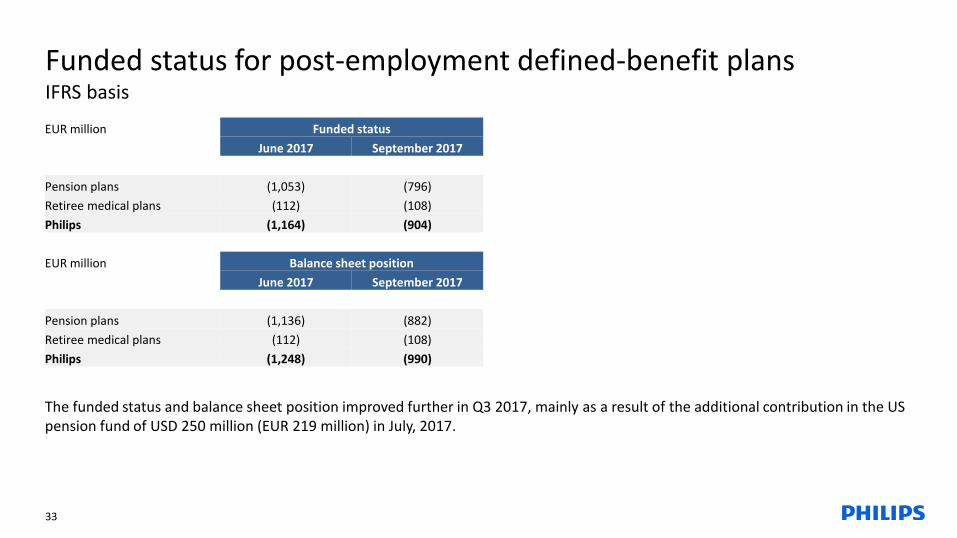
Funded status for post-employment defined-benefit plansIFRS basis
The funded status and balance sheet position improved further in Q3 2017, mainly as a result of the additional contribution in the US pension fund of USD 250 million (EUR 219 million) in July, 2017.
EUR million Funded status
June 2017 September 2017
Pension plans (1,053) (796)
Retiree medical plans (112) (108)
Philips (1,164) (904)
EUR million Balance sheet position
June 2017 September 2017
Pension plans (1,136) (882)
Retiree medical plans (112) (108)
Philips (1,248) (990)
34
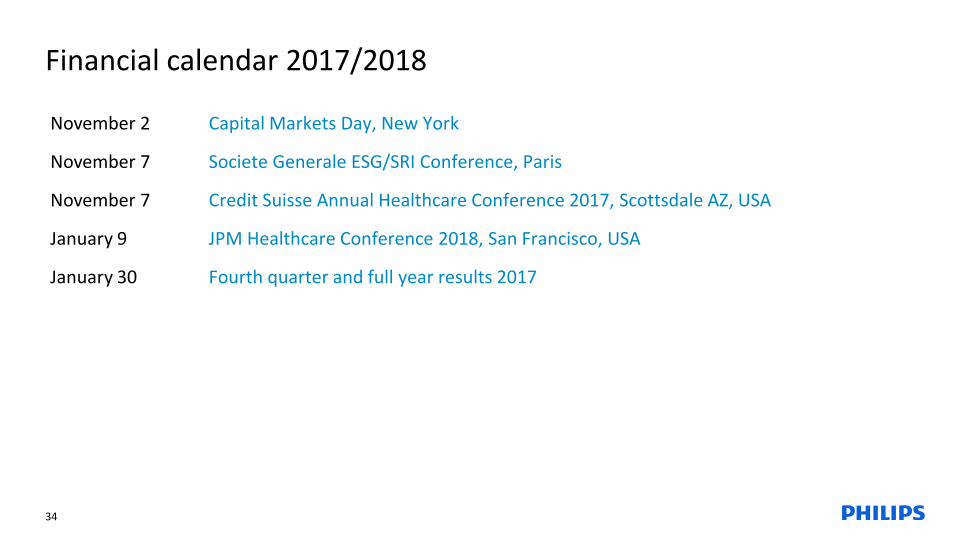
Financial calendar 2017/2018
November 2 Capital Markets Day, New York
November 7 Societe Generale ESG/SRI Conference, Paris
November 7 Credit Suisse Annual Healthcare Conference 2017, Scottsdale AZ, USA
January 9 JPM Healthcare Conference 2018, San Francisco, USA
January 30 Fourth quarter and full year results 2017

35