Embed Size (px)
Citation preview
1
Royal Economic Society’s Report on
The Gender Balance in UK Economics
Departments and Research Institutes in 2016
Silvana Tenreyro
London School of Economics
Chair of the RES Women’s Committee
30 March 2017
Acknowledgements.
I am immensely grateful to Diego Battiston and Stephen Maurer for superb research assistance; to Maria Molina
Domene, Piero Fortino, and Hillary Stein for helping at different stages of the 2015 and 2016 web-survey data
collection process; and to Martin Hannon for sending the departmental surveys and indefatigably chasing responses.
I am most thankful to Karen Mumford: the survey design and the report build on her previous work. All errors are
mine.
2
Executive Summary
This report covers the eleventh (2016) survey of gender balance amongst academic economists
in UK departments that are members of CHUDE (Conference of Heads of University Departments of
Economics), as well as several non-CHUDE departments and research institutions. The full web-
based survey covers 112 UK institutions. The web-based data were sent to Heads of Departments
to be verified or amended; the response rate was 57% (64 departments). The results in the main
text are based on the verified sample. The Appendix contains results from the full web-based
sample.
A few highlights:
women account for a 28% of all academic staff in UK economics departments.
women are under-represented among Professors; one in three men are Professors,
compared to one in seven women
the proportion of women is substantially higher in research jobs than in standard academic
jobs
20% of men and women have part-time employment in the sector; men are more often
found in senior positions than women
men and women share similar research disciplines, the most popular research discipline for
both is Microeconomics
Taking a longer perspective and comparing the 2016 balanced sample results to those of early
surveys, we observe:
in aggregate, the proportion of the workforce that is female has increased substantially over
the twenty years of surveys (in 1996 women made up 17.5% of the workforce; by 2016
this has risen to 28%)
the numbers of Professors (male and female) amongst all staff has doubled over the time
period (from 13% of all staff to 25.7%)
women are more than twice as common in the standard academic grades in 2016 than they
were in 1996; in 1996 women made up approximately 16.6% of the Lecturers (34.6% in
2016), 9.6% of the Readers/Senior Lecturers/Associate Professors (25.8% in 2016) and
4.2% of the Professors (15.5% in 2016).
It is also of interest to compare the results from the 2016 survey with that from 2014. Balanced
sample comparison is less than perfect; with that in mind, the findings indicate:
the proportion of women among academic economists increased from 27% to 28%
the representation of women in each grade rank showed small increases
female Professors are more commonly promoted within their department rather than hired
into the grade from outside
job separations are rarer for more senior women
3
1. Introduction to the 2016 survey
This report covers the eleventh survey of gender balance in academic employment in economics
in Britain in a series started in 1996 by the Royal Economic Society (RES) Women’s Committee
and repeated bi-annually thereafter.1
The web pages of ninety three CHUDE departments, seven non-CHUDE departments2,
and fifteen leading research institutes were surveyed in November-December 2016. The survey
collected information on academic staff (full-time and part-time) by grade of employment, gender,
and research discipline. It also collected information on promotions, new hires and job leavers.
These survey entries were then emailed to respective institutions for verification in January 2017.
The overall verified survey response rate from the 112 institutions was 57% (60% or 56 responses
from the 93 CHUDE departments, 14% or 1 response from the 7 non-CHUDE departments, and
58% or 7 responses from the 12 research institutes).3
Multiple attempts to obtain a return from each of the non-responding departments were
made; nevertheless, several did not participate perhaps reflecting a weakness in survey design or
apathy on the part of departments (Georgiadis and Manning, 2007; page 3). Section 2 of the report
presents results from the verified returns, which is referred to as the “Respondents Survey.” Results
from analyzing the full web based survey (verified and non-verified data containing all
departments and research institutes) are discussed in Section 3 of the report and additional results
are reported in the Appendix. Section 4 of the report compares findings across the Women’s
Committee surveys using balanced and unbalanced analyses and presents evidence of staff changes
over time. Section 5 presents concluding remarks.
1 Findings from previous surveys are reported in Mumford 1997; Booth and Burton with Mumford, 2000; Burton with
Joshi and Rowlatt, 2002; Burton and Joshi, 2004, Burton with Humphries, 2006; Azariadis and Manning, 2008;
Mumford, 2009; Blanco and Mumford, 2011; Blanco, Mitka, Mumford and Roman, 2013; Mitka, Mumford and
Sechel, 2015. 2 Tables A8 and A9 of the Appendix list all departments and research institutes surveyed, indicating respondents and
non respondents. 3 There are major difficulties in covering economists working outside conventional economics or business
departments.
4
2. Overview of the findings for the Respondents Survey, November 2014
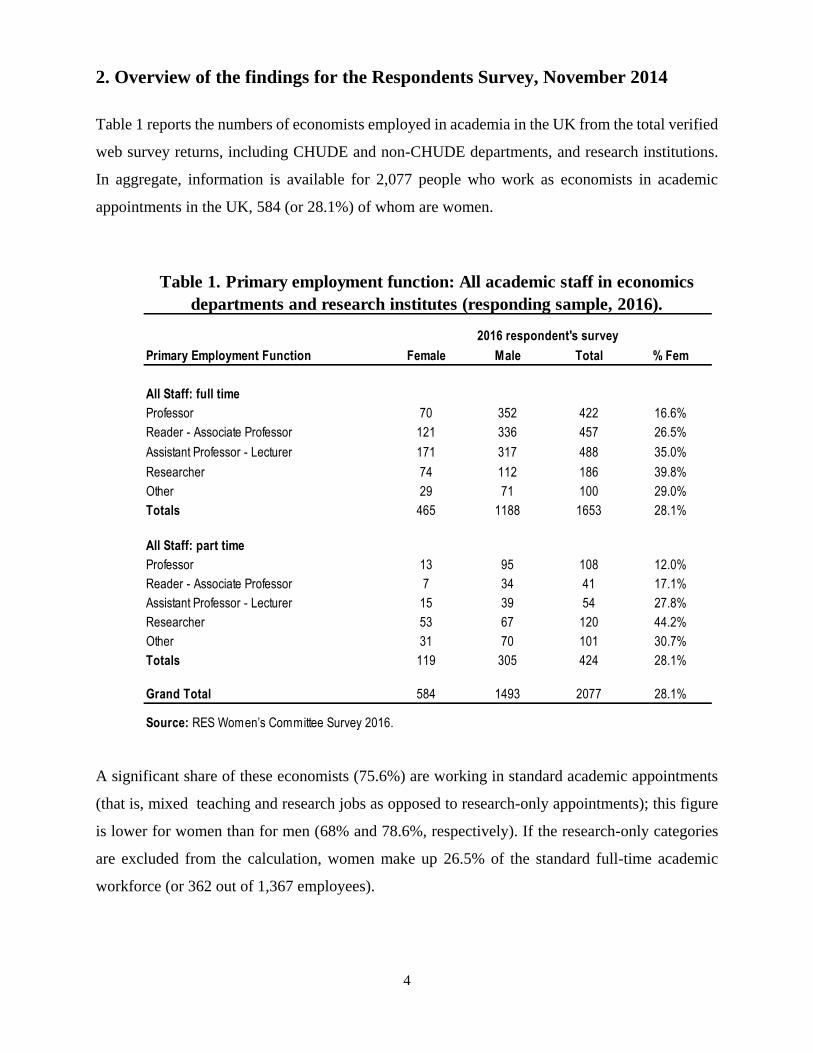
Table 1 reports the numbers of economists employed in academia in the UK from the total verified
web survey returns, including CHUDE and non-CHUDE departments, and research institutions.
In aggregate, information is available for 2,077 people who work as economists in academic
appointments in the UK, 584 (or 28.1%) of whom are women.
A significant share of these economists (75.6%) are working in standard academic appointments
(that is, mixed teaching and research jobs as opposed to research-only appointments); this figure
is lower for women than for men (68% and 78.6%, respectively). If the research-only categories
are excluded from the calculation, women make up 26.5% of the standard full-time academic
workforce (or 362 out of 1,367 employees).
Primary Employment Function Female Male Total % Fem
All Staff: full time
Professor 70 352 422 16.6%
Reader - Associate Professor 121 336 457 26.5%
Assistant Professor - Lecturer 171 317 488 35.0%
Researcher 74 112 186 39.8%
Other 29 71 100 29.0%
Totals 465 1188 1653 28.1%
All Staff: part time
Professor 13 95 108 12.0%
Reader - Associate Professor 7 34 41 17.1%
Assistant Professor - Lecturer 15 39 54 27.8%
Researcher 53 67 120 44.2%
Other 31 70 101 30.7%
Totals 119 305 424 28.1%
Grand Total 584 1493 2077 28.1%
Source: RES Women’s Committee Survey 2016.
2016 respondent's survey
Table 1. Primary employment function: All academic staff in economics
departments and research institutes (responding sample, 2016).
5
Women are substantially more likely to be employed at lower academic grade levels, as is
seen in the final column of Table 1. For example, amongst full time staff, the proportion female
decreases from 35% of the Permanent Lecturers or Assistant Professors, to 26.5% of the Readers
or Associate Professors and 16.6% of the Professors.
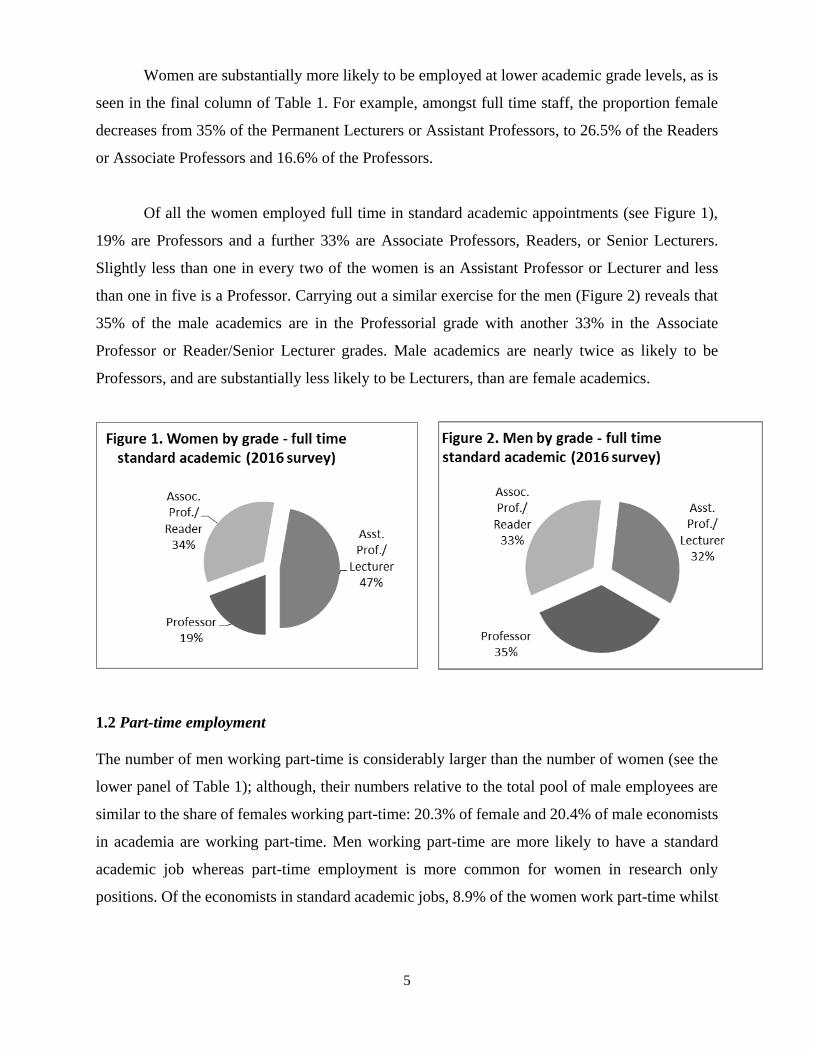
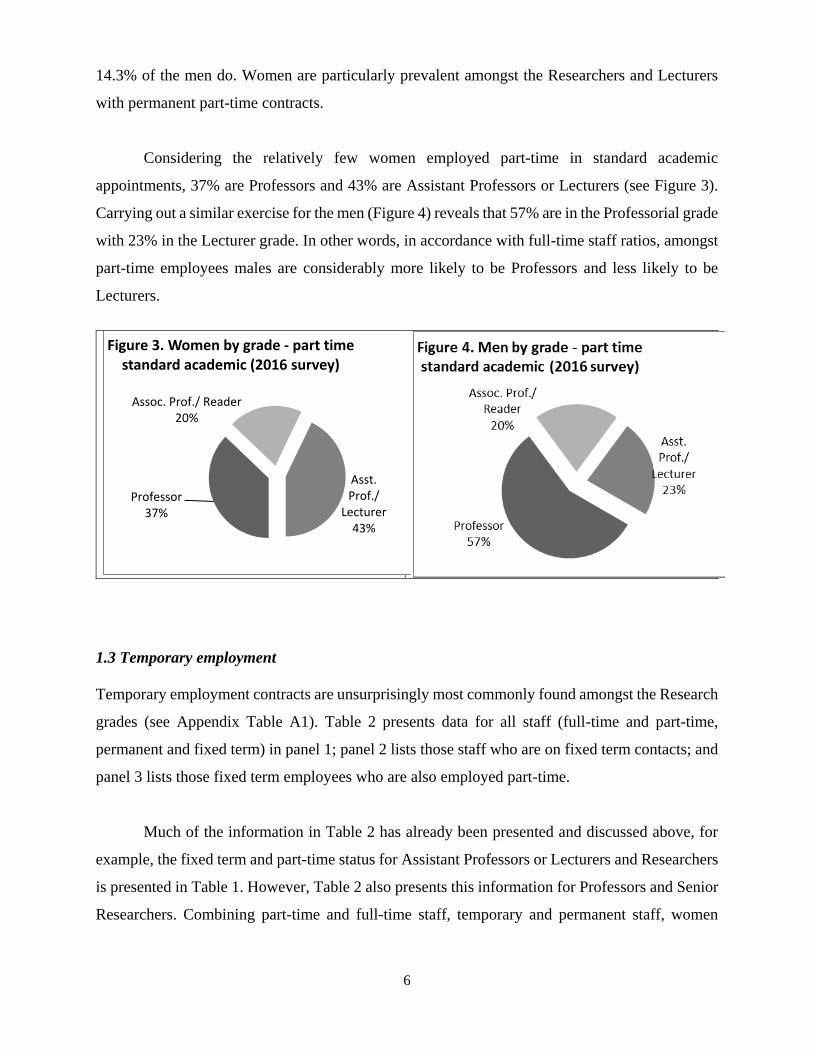
Of all the women employed full time in standard academic appointments (see Figure 1),
19% are Professors and a further 33% are Associate Professors, Readers, or Senior Lecturers.
Slightly less than one in every two of the women is an Assistant Professor or Lecturer and less
than one in five is a Professor. Carrying out a similar exercise for the men (Figure 2) reveals that
35% of the male academics are in the Professorial grade with another 33% in the Associate
Professor or Reader/Senior Lecturer grades. Male academics are nearly twice as likely to be
Professors, and are substantially less likely to be Lecturers, than are female academics.
1.2 Part-time employment
The number of men working part-time is considerably larger than the number of women (see the
lower panel of Table 1); although, their numbers relative to the total pool of male employees are
similar to the share of females working part-time: 20.3% of female and 20.4% of male economists
in academia are working part-time. Men working part-time are more likely to have a standard
academic job whereas part-time employment is more common for women in research only
positions. Of the economists in standard academic jobs, 8.9% of the women work part-time whilst
6
14.3% of the men do. Women are particularly prevalent amongst the Researchers and Lecturers
with permanent part-time contracts.
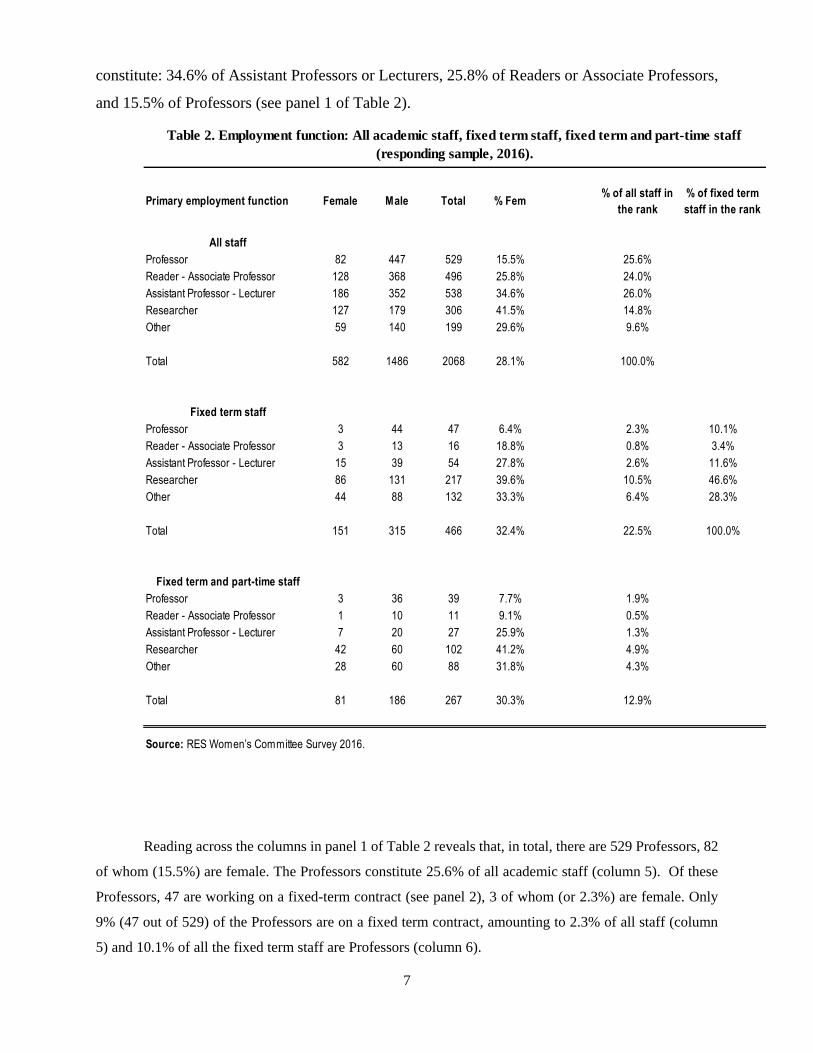
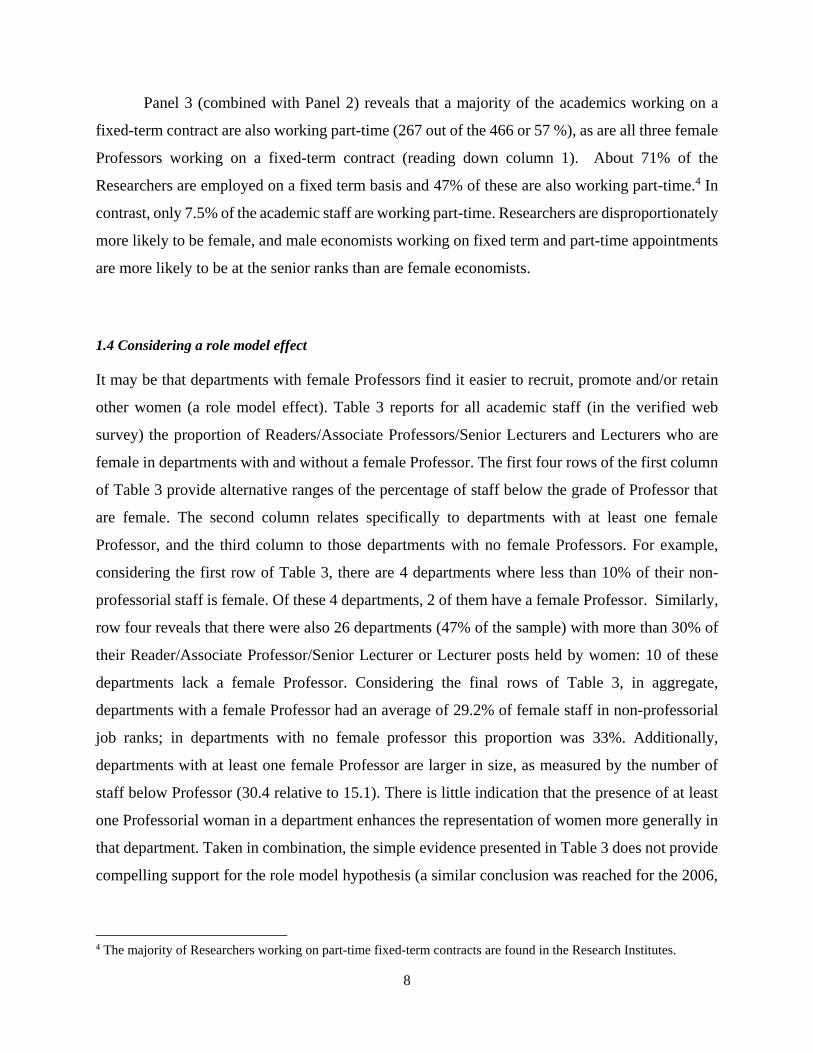
Considering the relatively few women employed part-time in standard academic
appointments, 37% are Professors and 43% are Assistant Professors or Lecturers (see Figure 3).
Carrying out a similar exercise for the men (Figure 4) reveals that 57% are in the Professorial grade
with 23% in the Lecturer grade. In other words, in accordance with full-time staff ratios, amongst
part-time employees males are considerably more likely to be Professors and less likely to be
Lecturers.
1.3 Temporary employment
Temporary employment contracts are unsurprisingly most commonly found amongst the Research
grades (see Appendix Table A1). Table 2 presents data for all staff (full-time and part-time,
permanent and fixed term) in panel 1; panel 2 lists those staff who are on fixed term contacts; and
panel 3 lists those fixed term employees who are also employed part-time.
Much of the information in Table 2 has already been presented and discussed above, for
example, the fixed term and part-time status for Assistant Professors or Lecturers and Researchers
is presented in Table 1. However, Table 2 also presents this information for Professors and Senior
Researchers. Combining part-time and full-time staff, temporary and permanent staff, women
Professor37%
Assoc. Prof./ Reader20%
Asst. Prof./
Lecturer43%
Figure 3. Women by grade - part time standard academic (2016 survey)
7
constitute: 34.6% of Assistant Professors or Lecturers, 25.8% of Readers or Associate Professors,
and 15.5% of Professors (see panel 1 of Table 2).
Reading across the columns in panel 1 of Table 2 reveals that, in total, there are 529 Professors, 82
of whom (15.5%) are female. The Professors constitute 25.6% of all academic staff (column 5). Of these
Professors, 47 are working on a fixed-term contract (see panel 2), 3 of whom (or 2.3%) are female. Only
9% (47 out of 529) of the Professors are on a fixed term contract, amounting to 2.3% of all staff (column
5) and 10.1% of all the fixed term staff are Professors (column 6).
Primary employment function Female Male Total % Fem% of all staff in
the rank
% of fixed term
staff in the rank
All staff
Professor 82 447 529 15.5% 25.6%
Reader - Associate Professor 128 368 496 25.8% 24.0%
Assistant Professor - Lecturer 186 352 538 34.6% 26.0%
Researcher 127 179 306 41.5% 14.8%
Other 59 140 199 29.6% 9.6%
Total 582 1486 2068 28.1% 100.0%
Fixed term staff
Professor 3 44 47 6.4% 2.3% 10.1%
Reader - Associate Professor 3 13 16 18.8% 0.8% 3.4%
Assistant Professor - Lecturer 15 39 54 27.8% 2.6% 11.6%
Researcher 86 131 217 39.6% 10.5% 46.6%
Other 44 88 132 33.3% 6.4% 28.3%
Total 151 315 466 32.4% 22.5% 100.0%
Fixed term and part-time staff
Professor 3 36 39 7.7% 1.9%
Reader - Associate Professor 1 10 11 9.1% 0.5%
Assistant Professor - Lecturer 7 20 27 25.9% 1.3%
Researcher 42 60 102 41.2% 4.9%
Other 28 60 88 31.8% 4.3%
Total 81 186 267 30.3% 12.9%
Source: RES Women’s Committee Survey 2016.
Table 2. Employment function: All academic staff, fixed term staff, fixed term and part-time staff
(responding sample, 2016).
8
Panel 3 (combined with Panel 2) reveals that a majority of the academics working on a
fixed-term contract are also working part-time (267 out of the 466 or 57 %), as are all three female
Professors working on a fixed-term contract (reading down column 1). About 71% of the
Researchers are employed on a fixed term basis and 47% of these are also working part-time.4 In
contrast, only 7.5% of the academic staff are working part-time. Researchers are disproportionately
more likely to be female, and male economists working on fixed term and part-time appointments
are more likely to be at the senior ranks than are female economists.
1.4 Considering a role model effect
It may be that departments with female Professors find it easier to recruit, promote and/or retain
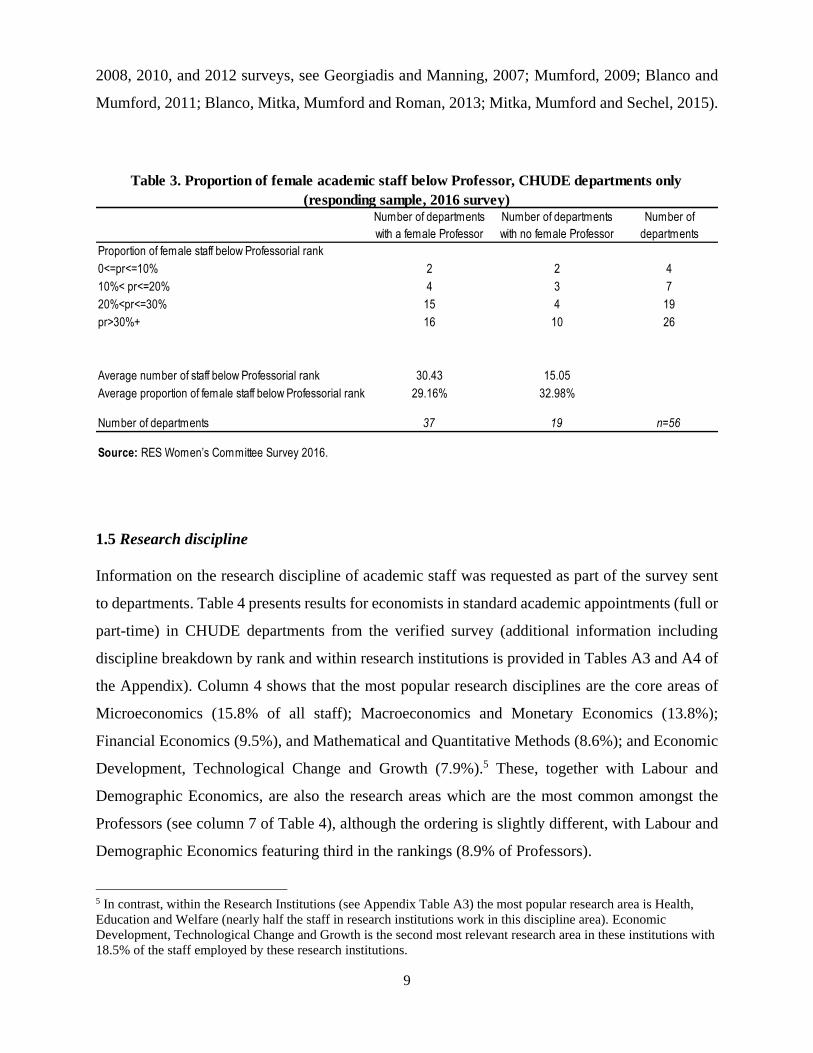
other women (a role model effect). Table 3 reports for all academic staff (in the verified web
survey) the proportion of Readers/Associate Professors/Senior Lecturers and Lecturers who are
female in departments with and without a female Professor. The first four rows of the first column
of Table 3 provide alternative ranges of the percentage of staff below the grade of Professor that
are female. The second column relates specifically to departments with at least one female
Professor, and the third column to those departments with no female Professors. For example,
considering the first row of Table 3, there are 4 departments where less than 10% of their non-
professorial staff is female. Of these 4 departments, 2 of them have a female Professor. Similarly,
row four reveals that there were also 26 departments (47% of the sample) with more than 30% of
their Reader/Associate Professor/Senior Lecturer or Lecturer posts held by women: 10 of these
departments lack a female Professor. Considering the final rows of Table 3, in aggregate,
departments with a female Professor had an average of 29.2% of female staff in non-professorial
job ranks; in departments with no female professor this proportion was 33%. Additionally,
departments with at least one female Professor are larger in size, as measured by the number of
staff below Professor (30.4 relative to 15.1). There is little indication that the presence of at least
one Professorial woman in a department enhances the representation of women more generally in
that department. Taken in combination, the simple evidence presented in Table 3 does not provide
compelling support for the role model hypothesis (a similar conclusion was reached for the 2006,
4 The majority of Researchers working on part-time fixed-term contracts are found in the Research Institutes.
9
2008, 2010, and 2012 surveys, see Georgiadis and Manning, 2007; Mumford, 2009; Blanco and
Mumford, 2011; Blanco, Mitka, Mumford and Roman, 2013; Mitka, Mumford and Sechel, 2015).
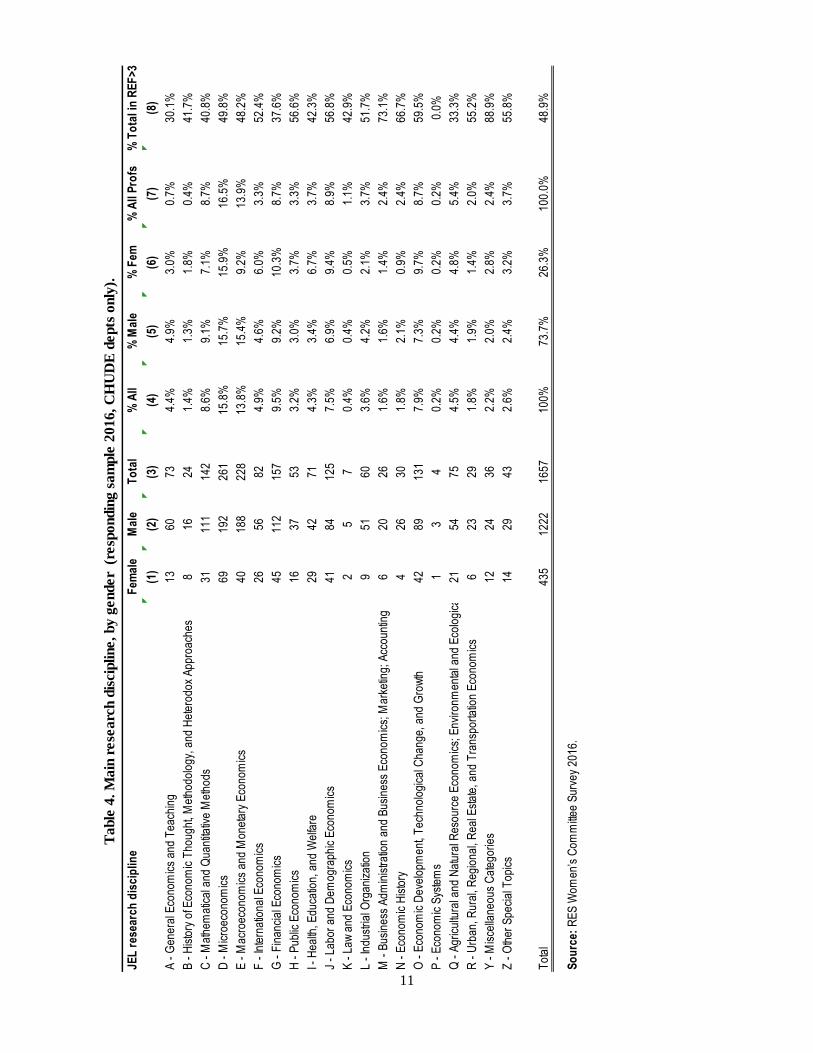
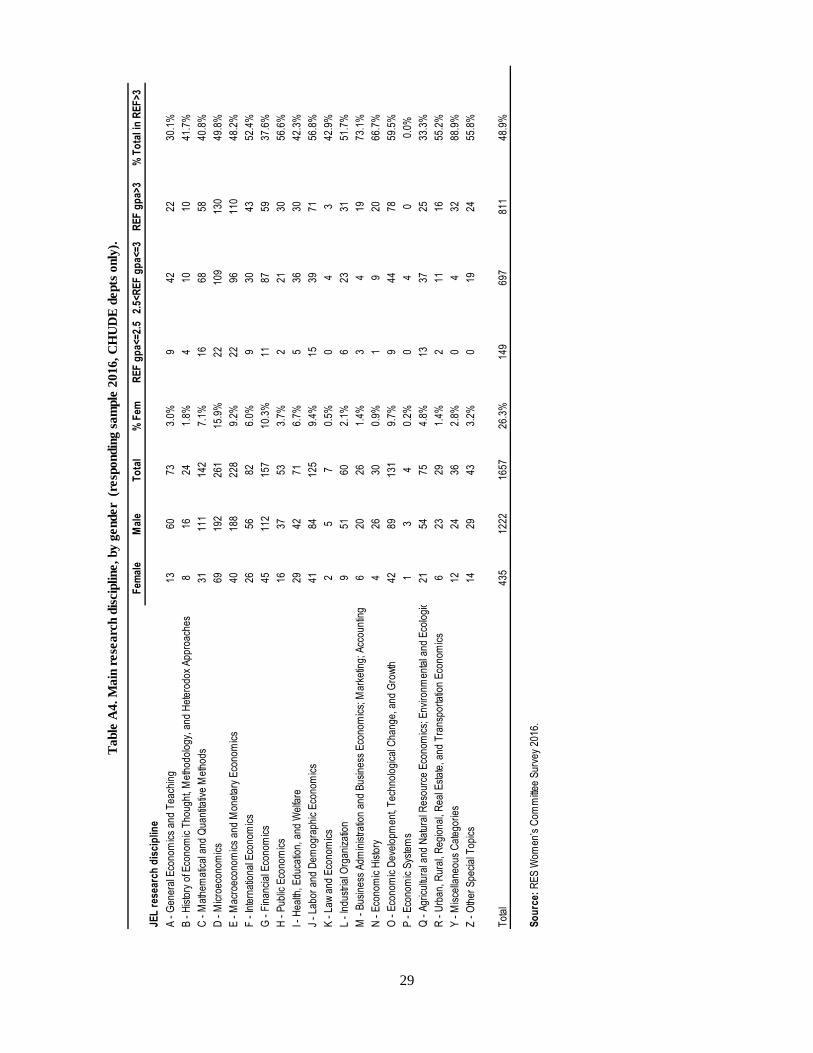
1.5 Research discipline
Information on the research discipline of academic staff was requested as part of the survey sent
to departments. Table 4 presents results for economists in standard academic appointments (full or
part-time) in CHUDE departments from the verified survey (additional information including
discipline breakdown by rank and within research institutions is provided in Tables A3 and A4 of
the Appendix). Column 4 shows that the most popular research disciplines are the core areas of
Microeconomics (15.8% of all staff); Macroeconomics and Monetary Economics (13.8%);
Financial Economics (9.5%), and Mathematical and Quantitative Methods (8.6%); and Economic
Development, Technological Change and Growth (7.9%).5 These, together with Labour and
Demographic Economics, are also the research areas which are the most common amongst the
Professors (see column 7 of Table 4), although the ordering is slightly different, with Labour and
Demographic Economics featuring third in the rankings (8.9% of Professors).
5 In contrast, within the Research Institutions (see Appendix Table A3) the most popular research area is Health,
Education and Welfare (nearly half the staff in research institutions work in this discipline area). Economic
Development, Technological Change and Growth is the second most relevant research area in these institutions with
18.5% of the staff employed by these research institutions.
Number of departments
with a female Professor
Number of departments
with no female Professor
Number of
departments
Proportion of female staff below Professorial rank
0<=pr<=10% 2 2 4
10%< pr<=20% 4 3 7
20%<pr<=30% 15 4 19
pr>30%+ 16 10 26
Average number of staff below Professorial rank 30.43 15.05
Average proportion of female staff below Professorial rank 29.16% 32.98%
Number of departments 37 19 n=56
Source: RES Women’s Committee Survey 2016.
Table 3. Proportion of female academic staff below Professor, CHUDE departments only
(responding sample, 2016 survey)
10
The five most popular research areas for women (see column 6) are Microeconomics;
Financial Economics; Economic Development, Technological Change and Growth; Labour and
Demographic Economics; and Macroeconomics and Monetary Economics. There are some
differences in the ordering between men and women, however, (as can be seen by comparing
columns 5 and 6 of Table 4). Men and women both have as the most popular area Microeconomics
(15.7% of the men and 15.9% of the women). The second most popular choice for both women
and men differs: men favor Macroeconomics and Monetary Policy and women favor Financial
Economics (at 15.4% and 10.3%, respectively). Women then opt for Economic Development,
Technological Change and Growth and Labour and Demographic Economics (9.4% and 9.7%
respectively) and men opt for Mathematical and Quantitative Methods (9.1%) and Financial
Economics (9.2%). For their fifth choice women favor Macroeconomics and Monetary Economics
whilst men choose Economic Development, Technological Change and Growth.
Column 8 of Table 4 provides the percentage of all those choosing that research discipline
who work in a department scoring above 3 in the last REF exercise. Of the 1657 standard academic
appointments, 811 or 48.9% worked in these higher ranked departments. In row one of Table 4,
we can see that of the 73 staff choosing General Economics and Teaching, 22 (or 30%) of these
staff members worked in a department scoring above 3 (see also Table A4). There are some small
number issues (reading across columns 3, 4 and 8) suggesting caution when interpreting the
percentages in column 8. Nevertheless, combining columns 3 and 8, the table suggests that
departments with higher REF scores have a significant proportion of staff specializing in the core
research areas mentioned above.
11
JEL
res
earc
h d
isci
plin
eF
emal
eM
ale
To
tal
% A
ll%
Mal
e%
Fem
% A
ll P
rofs
% T
ota
l in
RE
F>
3
(1)
(2)
(3)
(4)
(5)
(6)
(7)
(8)
A -
Gen
eral
Eco
nom
ics
and
Tea
chin
g1
36
07
34.
4%4.
9%3.
0%0.
7%30
.1%
B -
His
tory
of E
cono
mic
Tho
ught
, Met
hodo
logy
, and
Het
erod
ox A
ppro
ach
es8
16
24
1.4%
1.3%
1.8%
0.4%
41.7
%
C -
Mat
hem
atic
al a
nd Q
uant
itativ
e M
etho
ds3
11
11
14
28.
6%9.
1%7.
1%8.
7%40
.8%
D -
Mic
roec
ono
mic
s6
91
92
26
115
.8%
15.7
%15
.9%
16.5
%49
.8%
E -
Mac
roec
ono
mic
s an
d M
onet
ary
Eco
nom
ics
40
18
82
28
13.8
%15
.4%
9.2%
13.9
%48
.2%
F -
Inte
rnat
iona
l Eco
nom
ics
26
56
82
4.9%
4.6%
6.0%
3.3%
52.4
%
G -
Fin
anci
al E
cono
mic
s4
51
12
15
79.
5%9.
2%10
.3%
8.7%
37.6
%
H -
Pub
lic E
cono
mic
s1
63
75
33.
2%3.
0%3.
7%3.
3%56
.6%
I - H
ealth
, Edu
catio
n, a
nd W
elfa
re2
94
27
14.
3%3.
4%6.
7%3.
7%42
.3%
J -
Labo
r an
d D
emog
raph
ic E
cono
mic
s4
18
41
25
7.5%
6.9%
9.4%
8.9%
56.8
%
K -
Law
and
Eco
nom
ics
25
70.
4%0.
4%0.
5%1.
1%42
.9%
L -
Indu
stria
l Org
aniz
atio
n9
51
60
3.6%
4.2%
2.1%
3.7%
51.7
%
M -
Bus
ines
s A
dmin
istr
atio
n an
d B
usin
ess
Eco
nom
ics;
Mar
ketin
g; A
cco
untin
g6
20
26
1.6%
1.6%
1.4%
2.4%
73.1
%
N -
Eco
nom
ic H
isto
ry4
26
30
1.8%
2.1%
0.9%
2.4%
66.7
%
O -
Eco
nom
ic D
eve
lopm
ent,
Tec
hno
logi
cal C
hang
e, a
nd G
row
th4
28
91
31
7.9%
7.3%
9.7%
8.7%
59.5
%
P -
Eco
nom
ic S
yste
ms
13
40.
2%0.
2%0.
2%0.
2%0.
0%
Q -
Agr
icu
ltura
l and
Nat
ural
Res
our
ce E
cono
mic
s; E
nvir
onm
enta
l and
Eco
logi
cal
21
54
75
4.5%
4.4%
4.8%
5.4%
33.3
%
R -
Urb
an, R
ural
, Reg
iona
l, R
eal E
stat
e, a
nd T
rans
por
tatio
n E
cono
mic
s6
23
29
1.8%
1.9%
1.4%
2.0%
55.2
%
Y -
Mis
cella
neou
s C
ateg
orie
s1
22
43
62.
2%2.
0%2.
8%2.
4%88
.9%
Z -
Oth
er S
peci
al T
opic
s1
42
94
32.
6%2.
4%3.
2%3.
7%55
.8%
Tot
al4
35
12
22
16
57
10
0%
73.7
%26
.3%
100.
0%48
.9%
So
urc
e: R
ES
Wom
en’s
Com
mitt
ee S
urve
y 20
16.
Ta
ble
4.
Ma
in r
ese
arc
h d
iscip
line,
by
gender
(re
spo
ndin
g s
am
ple
20
16
, C
HU
DE
depts
only
).
12
1.7 Flows into and out of standard academic positions in the previous year
Changes in the stock of individuals in any job rank due to inflows from new hires, job separations
(resignations and retirements), and promotions (within and across departments) can also be
addressed from the data set. As the web based surveys are tracking individuals, we can calculate
movements more accurately (for example, tracking those who left one department but were hired
into another, and if they received a promotion in this move). Before 2010, the Women’s Committee
data on promotions only included promotions that were internal to departments and total staff
movements were essentially gross rather than net. (For comparison sake, full and balanced sample
(from the 2016 and 2014 surveys) analysis using the previous gross sample measures is provided
in Appendix tables A5 to A7.)
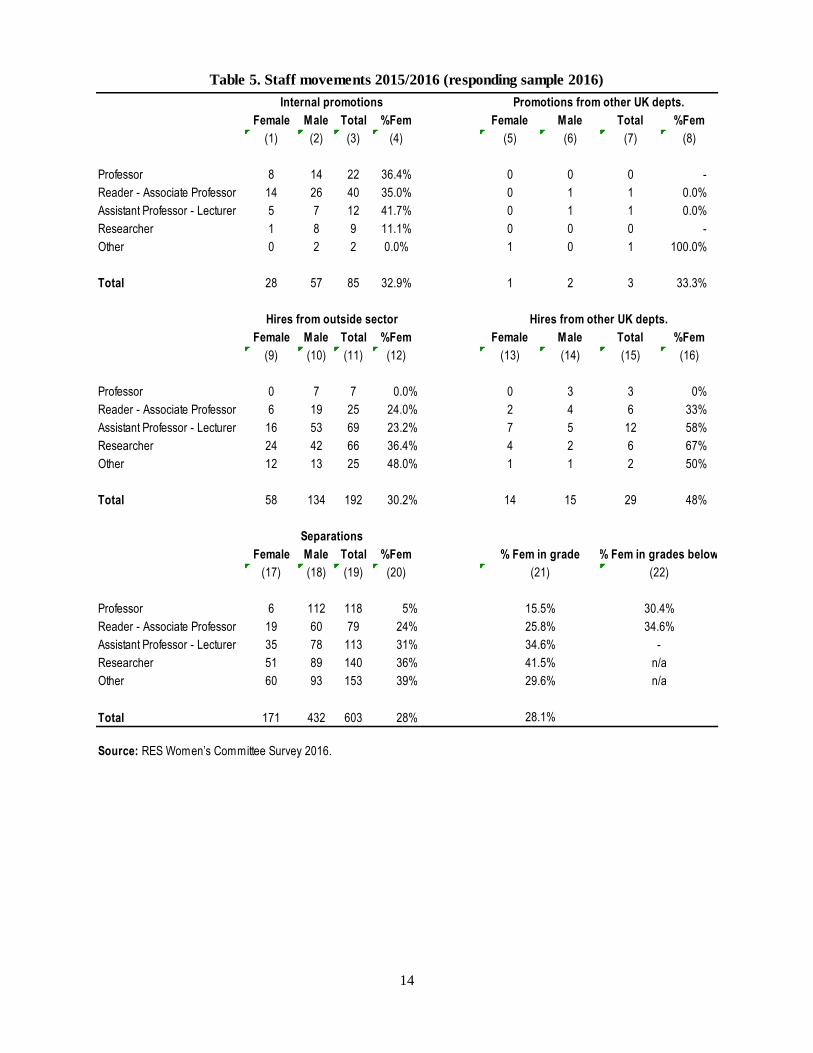
Table 5 presents staff movements in the 2015/16 academic year from the 2016 respondents
survey (i.e. the verified returns). Columns 1 to 4 are those promotions internal to the department,
columns 5 to 8 are those promoted from other UK departments. These numbers of promotions are
obviously small so we should be cautious about how valid the implications of these flows for
changes in relative employment stocks actually are. Nevertheless, Comparing columns 4 and 8
(showing the percentage female by rank amongst the flows) with columns 21 (showing the
percentage females amongst the stock by rank), suggests some small gains were made in the
2015/16 time period via promotions, especially amongst Professors and Readers.
Panel two of Table 5 provides information on hiring in the 2015/16 academic year: columns
9 to 12 present information on new staff hired in the last year. This is staff entering the sector; and
columns 13 to 16 are hires across UK departments. The sub-sample of respondents to this question
is particularly small so the numbers should be read with caution. We can see that there were 192
economists hired from outside of the UK academic sector (column 11) in the 2015/16 academic
year, and a further 29 economists hired from other UK departments (column 15). Hires from
outside of the UK academic sector are relatively less likely to be female than are either hires from
within the sector (comparing columns 12 and 16), or internal promotions into the grade rank
(column 4). Comparing columns 9 to 12 in Table 5 with columns 1 to 4 in Table 2, suggests that
these external hires are typically lowering the proportion female academics in each rank. In
13
aggregate, the representation of women amongst the hiring inflow seems to have contributed very
little to improve the overall representation of women in the stock by rank (column 21).
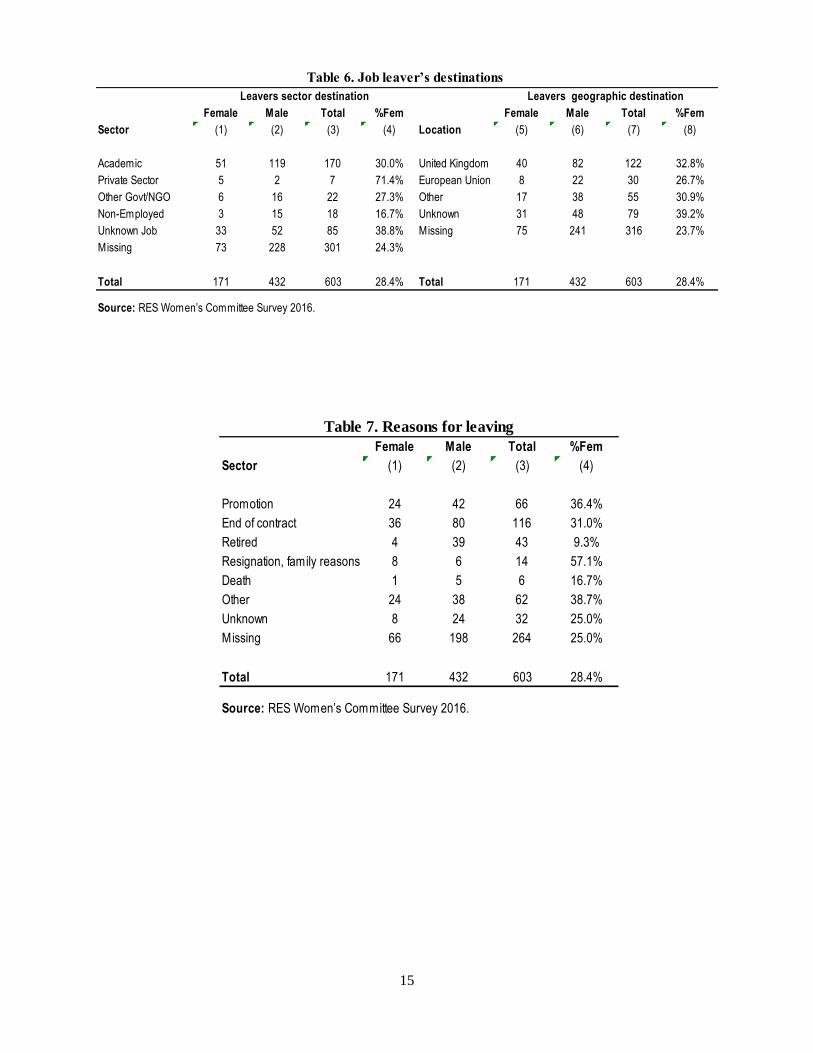
The third flow affecting the stock of academic economists is, of course, leavers (see panel
3 of Table 6). In aggregate, women make up a similar proportion of these separations as they do
of the total pool of academic economists (28% relative to 28.3%, columns 20 and 21).
Information on the job leaver’s destination was also gathered (see Table 6).6 The most
common destination employment for the job leavers is to another academic appointment (170 out
of the 302 leavers reporting destination or 56% of those reporting destination) followed by
‘unknown job’ (28% of those reporting destination), implying considerable churning within the
sector, with non-employment taking up a further 6%. The proportion of female economists across
job leavers (28.4%) is similar to the female share of the total workforce. A high proportion of
leavers go on to other academic appointments (51 out of 104 female leavers reporting destination
or 52%, and 58.3% of male leavers) or to unknown jobs (33.7% of the female leavers, and 25.5%
of the males). The relative findings for the UK and EU destinations suggest an international
marketplace exists for academic economists, both male and female, and that female economists
move in a similar proportion to their presence in the workforce.
The 2016 survey also asks departments about the reasons for these separations (see Table
7), the responses were not overly informative (in 59% of the cases, there are “other”, “unknown”
or “missing” responses). Of the remaining 245 cases, roughly one in four leavers moved for a
promotion (32% of the female leavers, 24% of the males); 17.6% retired (5.5% of females leavers,
22.7% of the males); about 5.7% cited family reasons for quitting their jobs (11% of the female
leavers and only 3.5% of the male leavers); and 47.3% reported that they had reached the end of
their contract. The higher proportion of female leavers due to family reasons might reflect the
combination of family tasks falling more heavily on women and insufficient family-friendly work
practices in UK departments.
6 Note there are 29 missing observations for sector destination (Table 6); 28 for geographic destination (Table 6) and
24 for reasons for leaving (Table 7).
14
Female Male Total %Fem Female Male Total %Fem
(1) (2) (3) (4) (5) (6) (7) (8)
Professor 8 14 22 36.4% 0 0 0 -
Reader - Associate Professor 14 26 40 35.0% 0 1 1 0.0%
Assistant Professor - Lecturer 5 7 12 41.7% 0 1 1 0.0%
Researcher 1 8 9 11.1% 0 0 0 -
Other 0 2 2 0.0% 1 0 1 100.0%
Total 28 57 85 32.9% 1 2 3 33.3%
Female Male Total %Fem Female Male Total %Fem
(9) (10) (11) (12) (13) (14) (15) (16)
Professor 0 7 7 0.0% 0 3 3 0%
Reader - Associate Professor 6 19 25 24.0% 2 4 6 33%
Assistant Professor - Lecturer 16 53 69 23.2% 7 5 12 58%
Researcher 24 42 66 36.4% 4 2 6 67%
Other 12 13 25 48.0% 1 1 2 50%
Total 58 134 192 30.2% 14 15 29 48%
Female Male Total %Fem
(17) (18) (19) (20)
Professor 6 112 118 5%
Reader - Associate Professor 19 60 79 24%
Assistant Professor - Lecturer 35 78 113 31%
Researcher 51 89 140 36%
Other 60 93 153 39%
Total 171 432 603 28%
Source: RES Women’s Committee Survey 2016.
28.1%
n/a
Promotions from other UK depts.
% Fem in grade
(21)
% Fem in grades below
(22)
30.4%
34.6%
-
n/a
15.5%
25.8%
34.6%
41.5%
29.6%
Table 5. Staff movements 2015/2016 (responding sample 2016)
Hires from outside sector Hires from other UK depts.
Internal promotions
Separations
15
Female Male Total %Fem Female Male Total %Fem
Sector (1) (2) (3) (4) Location (5) (6) (7) (8)
Academic 51 119 170 30.0% United Kingdom 40 82 122 32.8%
Private Sector 5 2 7 71.4% European Union 8 22 30 26.7%
Other Govt/NGO 6 16 22 27.3% Other 17 38 55 30.9%
Non-Employed 3 15 18 16.7% Unknown 31 48 79 39.2%
Unknown Job 33 52 85 38.8% Missing 75 241 316 23.7%
Missing 73 228 301 24.3%
Total 171 432 603 28.4% Total 171 432 603 28.4%
Source: RES Women’s Committee Survey 2016.
Table 6. Job leaver’s destinations
Leavers sector destination Leavers geographic destination
Female Male Total %Fem
Sector (1) (2) (3) (4)
Promotion 24 42 66 36.4%
End of contract 36 80 116 31.0%
Retired 4 39 43 9.3%
Resignation, family reasons 8 6 14 57.1%
Death 1 5 6 16.7%
Other 24 38 62 38.7%
Unknown 8 24 32 25.0%
Missing 66 198 264 25.0%
Total 171 432 603 28.4%
Source: RES Women’s Committee Survey 2016.
Table 7. Reasons for leaving
16
3. Overview of the findings for the full web-based survey, 2016.
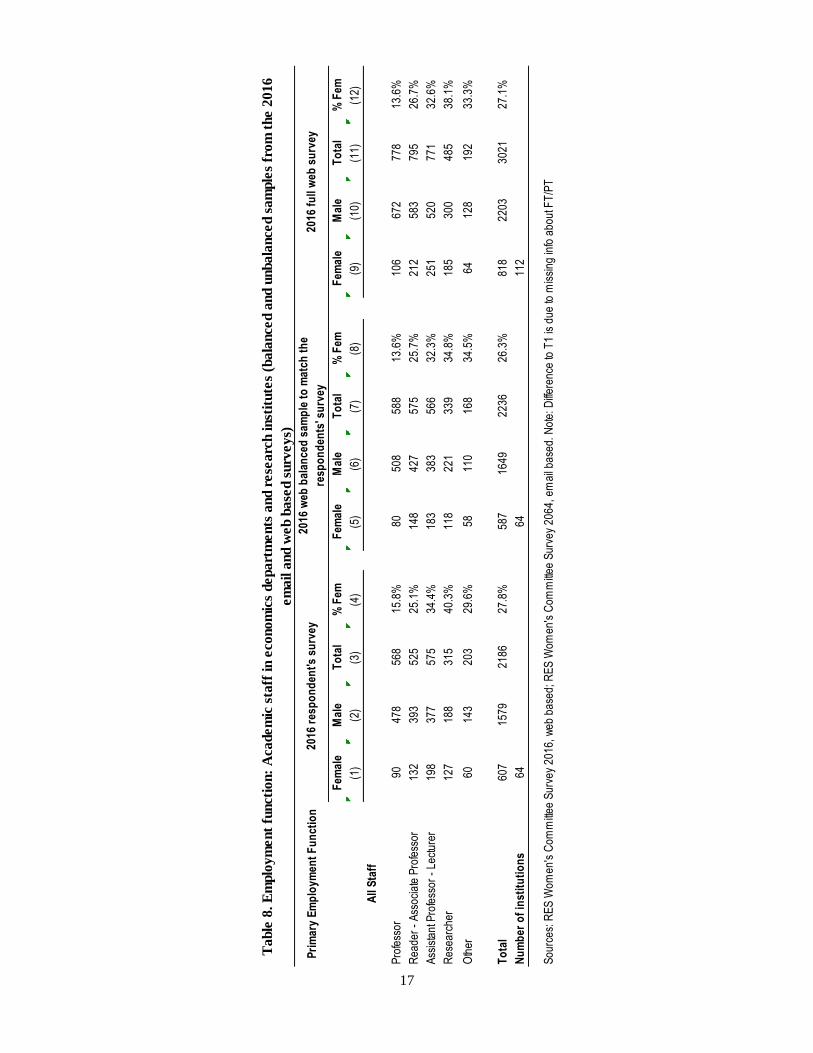
Table 8 provides the results from the 2016 respondents’ survey (the verified subset of the full web-
based survey), reported in columns 1 through 4; the results from the 2016 web-based survey
balanced to match the respondents’ sample in 2016, reported in columns 5 to 8; and results from
the full 2016 web-based survey (including all 112 departments), reported in columns 9 to 12. It
should be noted that there is obviously a limit to the information that can be reliably collected from
web pages. For example, information concerning full-time or part-time status, permanent or
temporary employment contracts is often ambiguous hence the fundamental need to seek
verification from the relevant institutions.
The full web-based survey balanced sample and the respondents’ verified survey differ in
the number of staff in each rank, with the web-based sample reporting more people than the
verified sample. This might be due to slow updating of webpages once people leave, or listing of
visiting or honorary positions not considered to be “salaried members of academic and research
staff”. There is, however a reasonable similarity in the shares of women within each rank.
Another finding from comparing the 2016 data sources is that including information from
the web pages of the non-responding departments into the totals (see columns 9 to 12) does not
suggest that the departments choosing not to participate in the 2014 email survey were less likely
to contain women. The overall female shares are only slightly lower. This was also true in 2014
(see Table 9) and is consistent with earlier findings (Mitka, Mumford and Sechel, 2015; Georgiadis
and Manning, 2007, page 3; Mumford, 2009, page 20; Blanco and Mumford, 2011, page 23; and
Blanco, Mitka, Mumford and Roman, 2013, page 18).
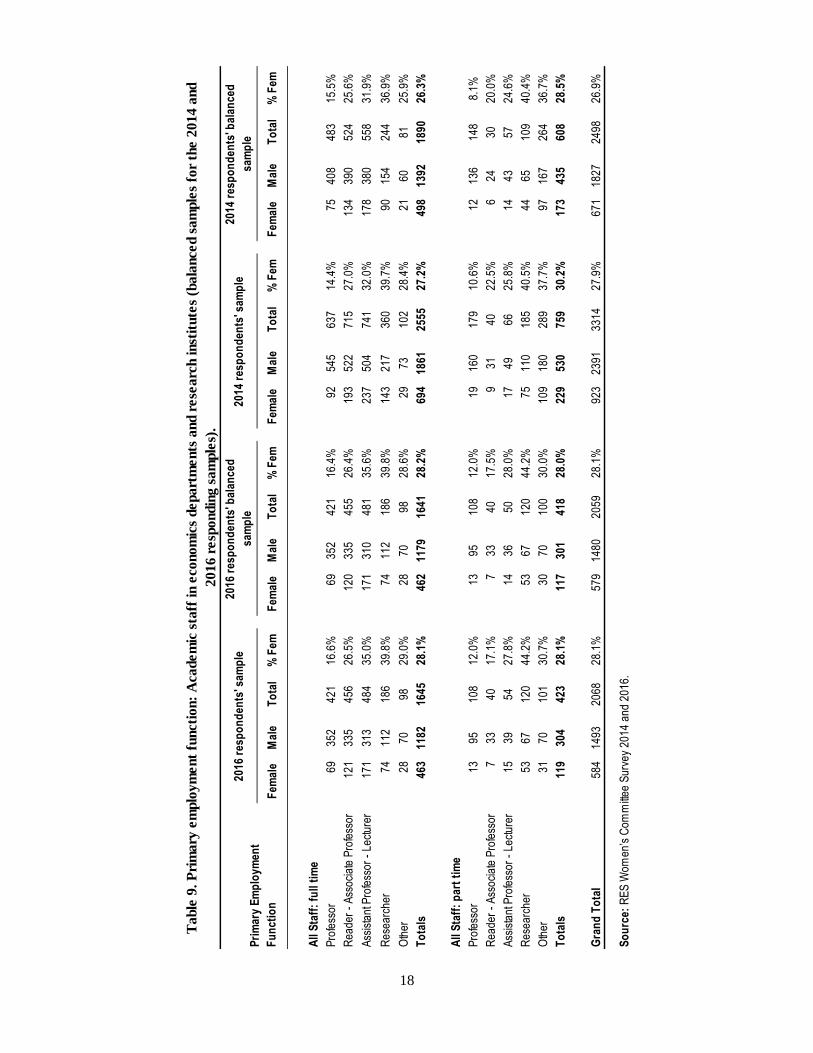
It was interesting to compare the balanced sample in 2014 and 2016. This corresponds to
the same sample of departments and institutions. To our surprise, the 2014 contained more
academics than the 2016 sample (Table 9). When we asked respondents why that was the case,
they acknowledged having misplaced students (research assistants) and administrative staff as
academic staff in the 2014 edition. With caution on the comparability of the two samples, the
results indicate that the share of female academic staff increased between 2014 and 2016 from
26.9% to 28.1% in the balanced sample (and 27.9% to 28.1% in the unbalanced sample).
17
Pri
mar
y E
mp
loym
ent
Fu
nct
ion
Fem
ale
Mal
eT
ota
l%
Fem
Fem
ale
Mal
eT
ota
l%
Fem
Fem
ale
Mal
eT
ota
l%
Fem
(1)
(2)
(3)
(4)
(5)
(6)
(7)
(8)
(9)
(10)
(11)
(12)
All
Sta
ff
Pro
fess
or
90
47
85
68
15.8
%8
05
08
58
813
.6%
10
66
72
77
813
.6%
Rea
der
- A
sso
ciat
e P
rofe
sso
r1
32
39
35
25
25.1
%1
48
42
75
75
25.7
%2
12
58
37
95
26.7
%
Ass
ista
nt P
rofe
sso
r -
Lect
urer
19
83
77
57
534
.4%
18
33
83
56
632
.3%
25
15
20
77
132
.6%
Res
ear
cher
12
71
88
31
540
.3%
11
82
21
33
934
.8%
18
53
00
48
538
.1%
Oth
er6
01
43
20
329
.6%
58
11
01
68
34.5
%6
41
28
19
233
.3%
To
tal
60
71
57
92
18
627
.8%
58
71
64
92
23
626
.3%
81
82
20
33
02
127
.1%
Nu
mb
er o
f in
stit
uti
on
s6
46
41
12
Sou
rce
s: R
ES
Wom
en's
Com
mitt
ee S
urve
y 20
16, w
eb b
ase
d; R
ES
Wom
en's
Com
mitt
ee S
urve
y 20
64, e
mai
l bas
ed.
Not
e: D
iffer
ence
to T
1 is
due
to m
issi
ng in
fo a
bout
FT
/PT
Table
8. E
mplo
ym
ent
functi
on:
Academ
ic s
taff
in e
conom
ics
depart
ments
and r
ese
arc
h inst
itute
s (b
ala
nced a
nd u
nbala
nced s
am
ple
s fr
om
the 2
016
em
ail a
nd w
eb b
ase
d s
urv
eys)
2016
res
po
nd
ent's
su
rvey
2016
web
bal
ance
d s
amp
le t
o m
atch
th
e
resp
on
den
ts' s
urv
ey20
16 f
ull
web
su
rvey
18
Fem
ale
Mal
e T
ota
l%
Fem
Fem
ale
Mal
e T
ota
l%
Fem
Fem
ale
Mal
e T
ota
l%
Fem
Fem
ale
Mal
e T
ota
l%
Fem
All
Sta
ff:
full
tim
e
Pro
fess
or
69
35
24
21
16.6
%6
93
52
42
116
.4%
92
54
56
37
14.4
%7
54
08
48
315
.5%
Rea
der
- A
sso
ciat
e P
rofe
sso
r1
21
33
54
56
26.5
%1
20
33
54
55
26.4
%1
93
52
27
15
27.0
%1
34
39
05
24
25.6
%
Ass
ista
nt P
rofe
sso
r -
Lect
urer
17
13
13
48
435
.0%
17
13
10
48
135
.6%
23
75
04
74
132
.0%
17
83
80
55
831
.9%
Res
ear
cher
74
11
21
86
39.8
%7
41
12
18
639
.8%
14
32
17
36
039
.7%
90
15
42
44
36.9
%
Oth
er2
87
09
829
.0%
28
70
98
28.6
%2
97
31
02
28.4
%2
16
08
125
.9%
To
tals
46
31
18
21
64
528
.1%
46
21
17
91
64
128
.2%
69
41
86
12
55
527
.2%
49
81
39
21
89
026
.3%
All
Sta
ff:
par
t ti
me
Pro
fess
or
13
95
10
812
.0%
13
95
10
812
.0%
19
16
01
79
10.6
%1
21
36
14
88.
1%
Rea
der
- A
sso
ciat
e P
rofe
sso
r7
33
40
17.1
%7
33
40
17.5
%9
31
40
22.5
%6
24
30
20.0
%
Ass
ista
nt P
rofe
sso
r -
Lect
urer
15
39
54
27.8
%1
43
65
028
.0%
17
49
66
25.8
%1
44
35
724
.6%
Res
ear
cher
53
67
12
044
.2%
53
67
12
044
.2%
75
11
01
85
40.5
%4
46
51
09
40.4
%
Oth
er3
17
01
01
30.7
%3
07
01
00
30.0
%1
09
18
02
89
37.7
%9
71
67
26
436
.7%
To
tals
11
93
04
42
328
.1%
11
73
01
41
828
.0%
22
95
30
75
930
.2%
17
34
35
60
828
.5%
Gra
nd
To
tal
58
41
49
32
06
828
.1%
57
91
48
02
05
928
.1%
92
32
39
13
31
427
.9%
67
11
82
72
49
826
.9%
So
urc
e: R
ES
Wom
en’s
Com
mitt
ee S
urve
y 20
14 a
nd 2
016.
2016
res
po
nd
ents
' bal
ance
d
sam
ple
2014
res
po
nd
ents
' bal
ance
d
sam
ple
20
14 r
esp
on
den
ts' s
amp
le
2016
res
po
nd
ents
' sam
ple
Table
9. P
rim
ary
em
plo
ym
ent
functi
on:
Academ
ic s
taff
in e
conom
ics
depart
ments
and r
ese
arc
h inst
itute
s (b
ala
nced s
am
ple
s fo
r th
e 2
014 a
nd
2016 r
esp
ondin
g s
am
ple
s).
Pri
mar
y E
mp
loym
ent
Fu
nct
ion
19
4. Staff changes over time.
A fundamental role for the newly established Royal Economic Society Women's Committee7 in
1996 was to monitor and, where necessary, collect data on the position of female economists in
academic appointments in the UK. In response to a shortage of available data suitable to its needs,
the Committee Chairs have carried out a series of biennial questionnaires to all Heads of
Departments listed as members of CHUDE (and to a selection of research institutions) since
December 1996.8 As discussed in the Introduction, this report covers the eleventh of these surveys.
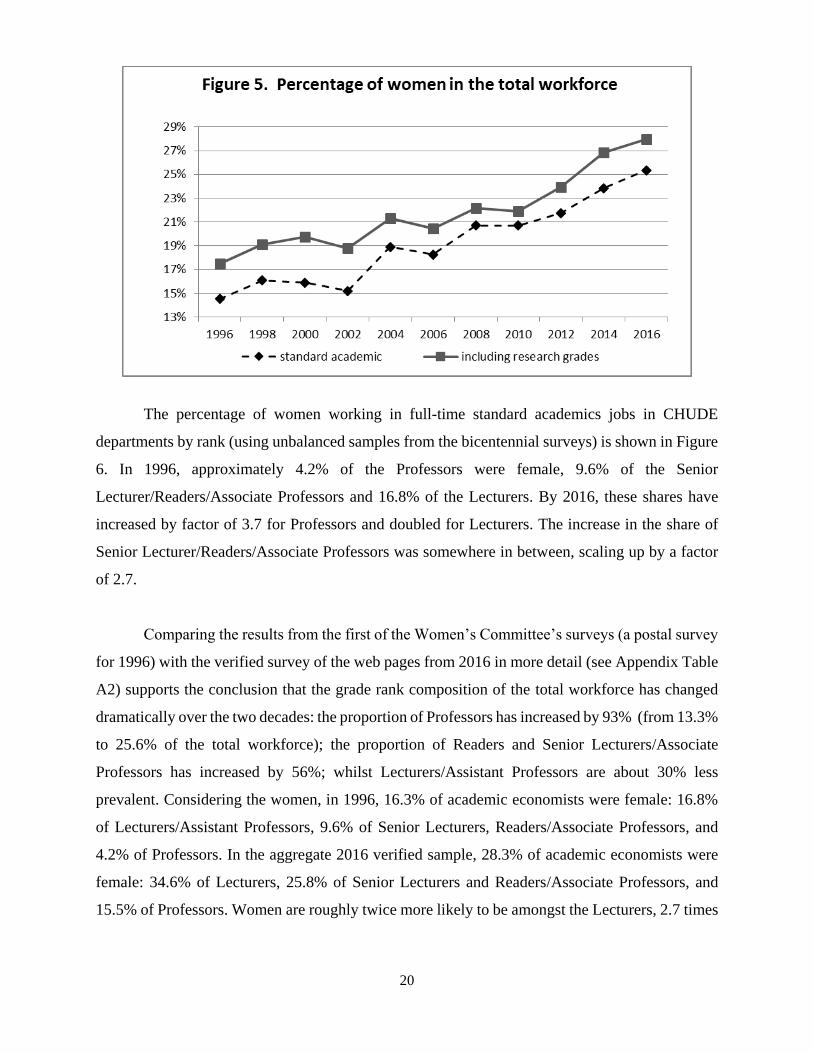
Figure 5 plots the percentage of women amongst the total academic economics workforce
(including research grades) and amongst the standard academic workforce for each of the
Women’s Committee surveys using unbalanced samples (reflecting the fullest sample information
for each of the surveys).9 An overall growth trend in the percentage of women in the workforce
can clearly be seen in Figure 5 (with or without the inclusion of the research grades).
7At its meeting in November 1996, the Council of the Royal Economic Society established a Women’s Committee to
promote the role of women in the UK economics profession. The founding membership of the Women’s Committee
was Denise Osborn (Chair), Tony Atkinson, Stephen Hall, David Hendry, Karen Mumford, Carol Propper, Maureen
Pike and Amanda Rowlatt. 8 The current survey also includes a small number of non-CHUDE university departments (as discussed in the
Introduction). 9 The samples changed quite dramatically in 2002 and 2006. In 2006 there were only 45 responding departments from
the CHUDE membership list (in contrast to the 79 in 2004 and the 93 included in the web survey of 2008). In 2002
the survey was sent to many more groups beside just those departments listed as CHUDE members (to 192 institutions
of which 55 were economics departments and a further 74 were business and management centres, Burton and Joshi,
2002; page 4). Constructing a genuinely balanced sample from 1996 to 2012 is not trivial, for example, some of the
departments and research institutions present in 1996 have merged and/or disappeared over the time period.
Furthermore, many institutions present a single return which appears to include economists working in different
research clusters within their institution. The web-based surveys reveal that many of individuals associated with
research institutions are also employed on standard academic appointments in departments; this is especially true for
more senior ranked economists. (For more discussion of the matching of the samples over time see Mumford, 2009).
20
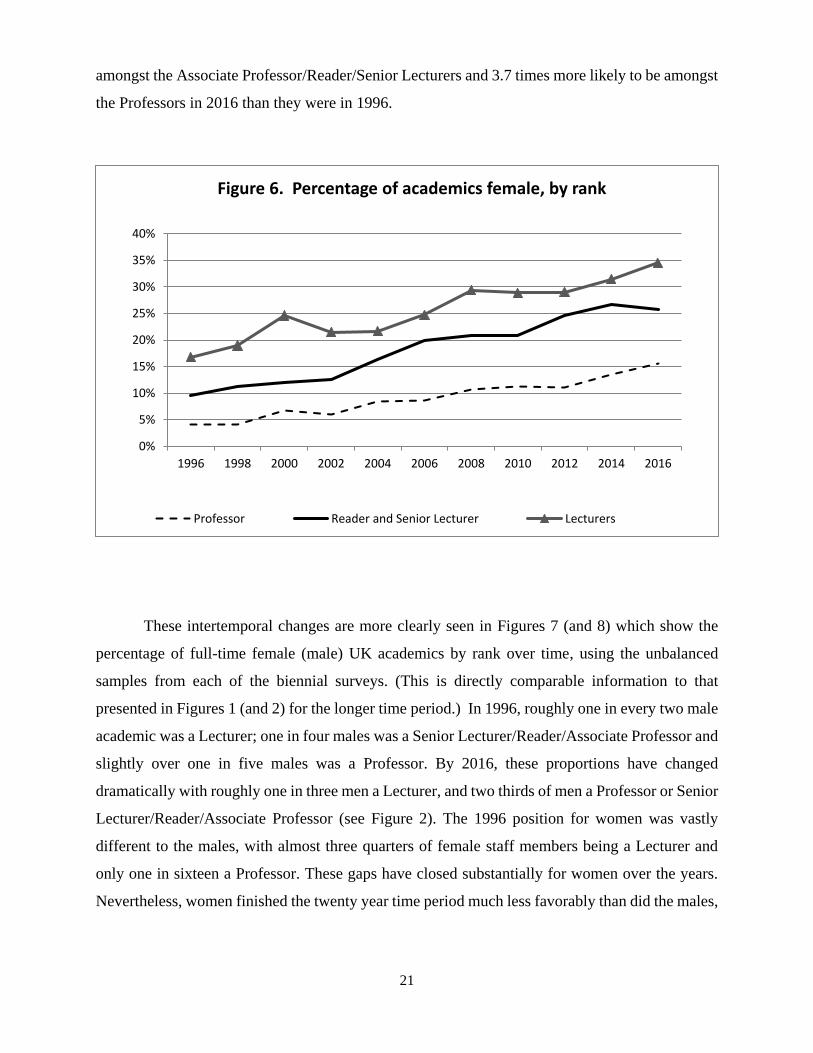
The percentage of women working in full-time standard academics jobs in CHUDE
departments by rank (using unbalanced samples from the bicentennial surveys) is shown in Figure
6. In 1996, approximately 4.2% of the Professors were female, 9.6% of the Senior
Lecturer/Readers/Associate Professors and 16.8% of the Lecturers. By 2016, these shares have
increased by factor of 3.7 for Professors and doubled for Lecturers. The increase in the share of
Senior Lecturer/Readers/Associate Professors was somewhere in between, scaling up by a factor
of 2.7.
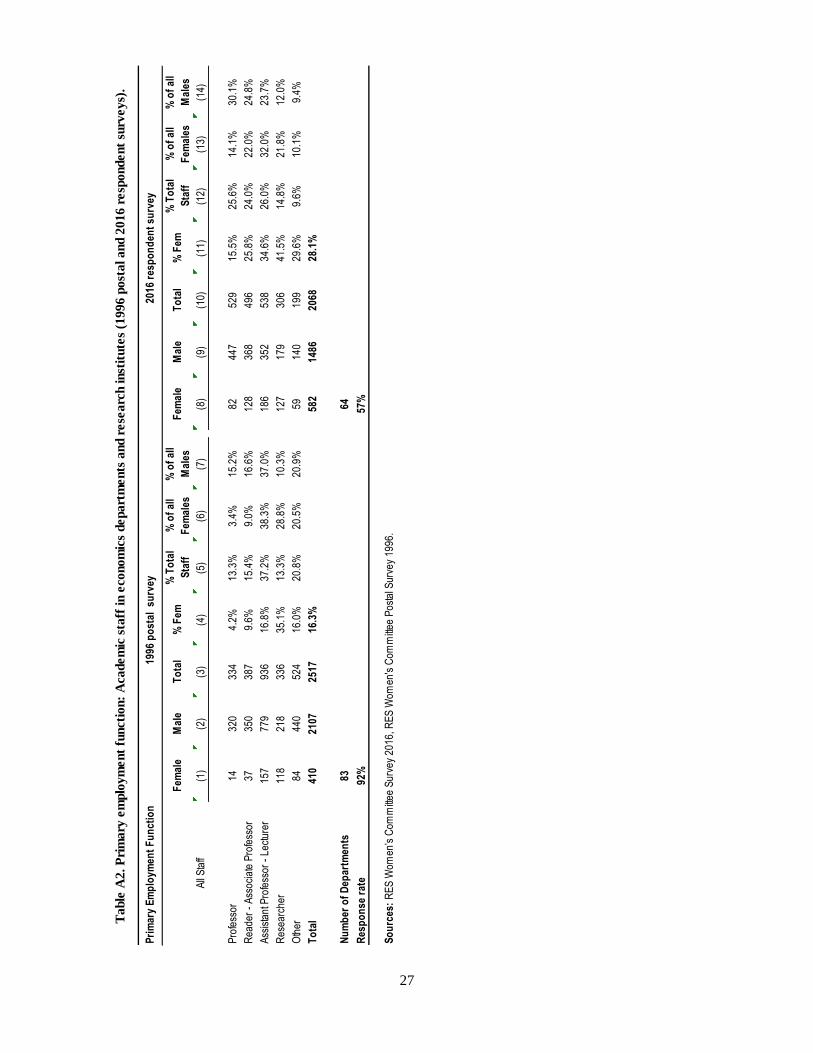
Comparing the results from the first of the Women’s Committee’s surveys (a postal survey
for 1996) with the verified survey of the web pages from 2016 in more detail (see Appendix Table
A2) supports the conclusion that the grade rank composition of the total workforce has changed
dramatically over the two decades: the proportion of Professors has increased by 93% (from 13.3%
to 25.6% of the total workforce); the proportion of Readers and Senior Lecturers/Associate
Professors has increased by 56%; whilst Lecturers/Assistant Professors are about 30% less
prevalent. Considering the women, in 1996, 16.3% of academic economists were female: 16.8%
of Lecturers/Assistant Professors, 9.6% of Senior Lecturers, Readers/Associate Professors, and
4.2% of Professors. In the aggregate 2016 verified sample, 28.3% of academic economists were
female: 34.6% of Lecturers, 25.8% of Senior Lecturers and Readers/Associate Professors, and
15.5% of Professors. Women are roughly twice more likely to be amongst the Lecturers, 2.7 times
21
amongst the Associate Professor/Reader/Senior Lecturers and 3.7 times more likely to be amongst
the Professors in 2016 than they were in 1996.
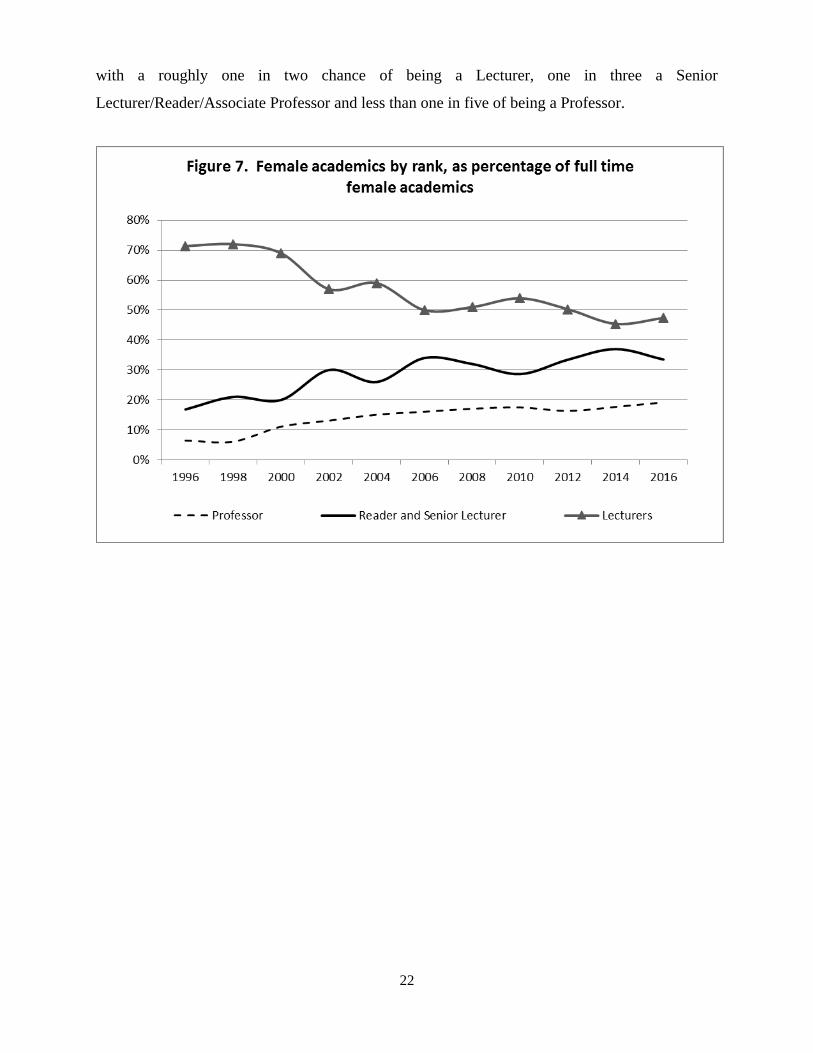
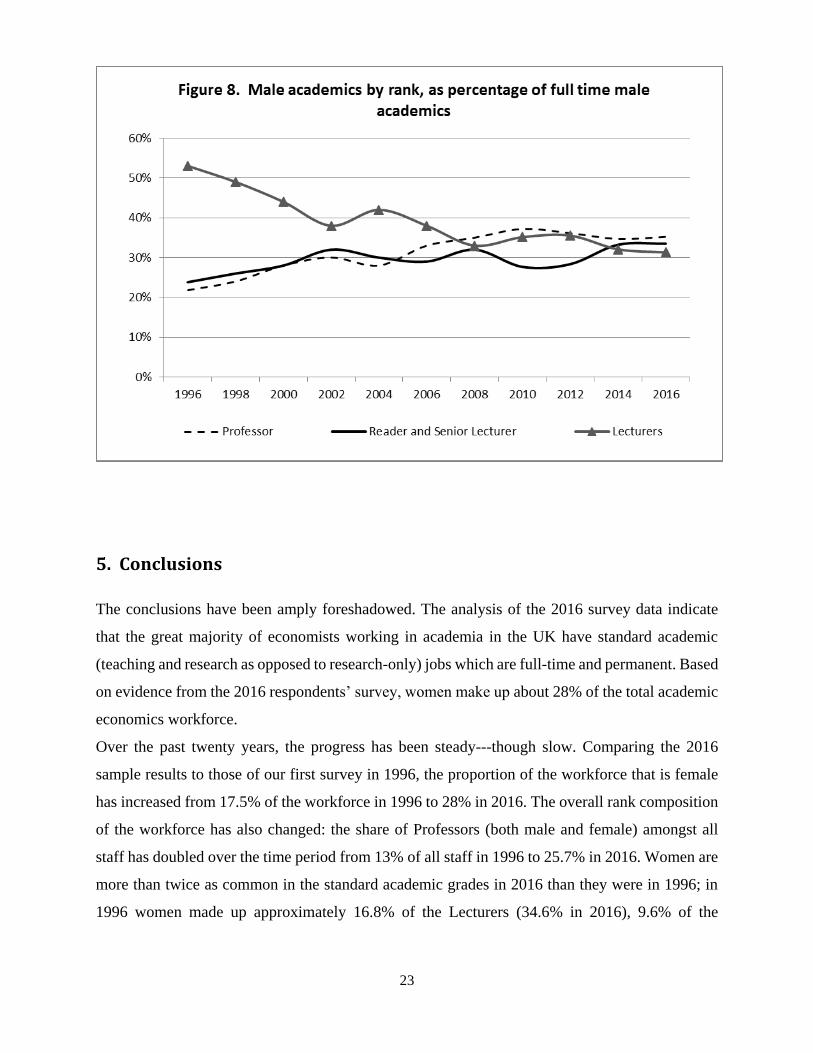
These intertemporal changes are more clearly seen in Figures 7 (and 8) which show the
percentage of full-time female (male) UK academics by rank over time, using the unbalanced
samples from each of the biennial surveys. (This is directly comparable information to that
presented in Figures 1 (and 2) for the longer time period.) In 1996, roughly one in every two male
academic was a Lecturer; one in four males was a Senior Lecturer/Reader/Associate Professor and
slightly over one in five males was a Professor. By 2016, these proportions have changed
dramatically with roughly one in three men a Lecturer, and two thirds of men a Professor or Senior
Lecturer/Reader/Associate Professor (see Figure 2). The 1996 position for women was vastly
different to the males, with almost three quarters of female staff members being a Lecturer and
only one in sixteen a Professor. These gaps have closed substantially for women over the years.
Nevertheless, women finished the twenty year time period much less favorably than did the males,
0%
5%
10%
15%
20%
25%
30%
35%
40%
1996 1998 2000 2002 2004 2006 2008 2010 2012 2014 2016
Figure 6. Percentage of academics female, by rank
Professor Reader and Senior Lecturer Lecturers
22
with a roughly one in two chance of being a Lecturer, one in three a Senior
Lecturer/Reader/Associate Professor and less than one in five of being a Professor.
23
5. Conclusions
The conclusions have been amply foreshadowed. The analysis of the 2016 survey data indicate
that the great majority of economists working in academia in the UK have standard academic
(teaching and research as opposed to research-only) jobs which are full-time and permanent. Based
on evidence from the 2016 respondents’ survey, women make up about 28% of the total academic
economics workforce.
Over the past twenty years, the progress has been steady---though slow. Comparing the 2016
sample results to those of our first survey in 1996, the proportion of the workforce that is female
has increased from 17.5% of the workforce in 1996 to 28% in 2016. The overall rank composition
of the workforce has also changed: the share of Professors (both male and female) amongst all
staff has doubled over the time period from 13% of all staff in 1996 to 25.7% in 2016. Women are
more than twice as common in the standard academic grades in 2016 than they were in 1996; in
1996 women made up approximately 16.8% of the Lecturers (34.6% in 2016), 9.6% of the
24
Readers/Senior Lecturers/Associate Professors (25.8% in 2016) and 4.2% of the Professors (15.5%
in 2016).
Recent changes in the stock of individuals in any job rank due to inflows from new hires, job
separations (resignations and retirements), and promotions (within departments) were addressed
by tracking individuals’ movements and balanced-sample comparisons across the surveys. The
findings indicate that, in contrast to males, female Professors are considerably more likely to be
promoted in their own department rather than hired from another department within the UK.
Furthermore, hires from outside the UK academic sector are less likely to be female than male
academics. A significantly larger share of women tends to leave or resign due to family reasons.
In aggregate, the relative numbers of women are increasing in the higher grade ranks but the rate
of change is slow. Comparison with 2014 yields an increase in the proportion of women among
academic economists over the two years from 27% to 28.1% in the balanced sample of respondents
(and 27.9% to 28.1% in the unbalanced sample). At the current rate of increase, it could take
another 50 years before the profession reaches a 50-50 gender balance. Changes in retirement
legislation may result in a decline in male exit rates and slow the relative growth in female
representation. Similarly, the observed decline in the share of female undergraduate students
studying economics may slow down the progress towards more gender balance in economics in
the UK.
25
References
Blackaby, David, and Jeff Frank, (2000). “Ethnic and other minority representation in UK
academic economics”, The Economic Journal, June 2000, F293-311.
Blanco, Laura, and Mumford, Karen, (2011). “Royal Economic Society Women’s Committee
Survey on the Gender and Ethnic Balance of Academic Economics 2010”, RES Report.
Blanco, Laura, Mitka, Malgorzata, Mumford, Karen, and Roman, J., (2013). “The Gender
Balance of Academic Economics 2012: Royal Economic Society Women’s Committee
Survey”, RES Report.
Booth, Alison L, and Jonathan Burton, with Karen Mumford, (2000). “The Position of Women
in UK Academic Economics”, in The Economic Journal, June 2000, F312-F333.
Burton, Jonathan and Heather Joshi, (2002). “Royal Economic Society Survey on the Gender and
Ethnic Balance of Academic Economics 2002”, RES report.
Burton, Jonathan with Jane Humphries, (2006). “Royal Economic Society Survey on the Gender
and Ethnic Balance of Academic Economics 2004”, RES report.
Burton, Jonathan, with Amanda Rowlatt and Heather Joshi, (2002). “Royal Economic Society
Survey on the Gender and Ethnic balance of academic economics 2000”, ISER Working
Paper, 2002-4.
Georgiadis, Andreas and Alan Manning. (2006). “Royal Economic Society Survey on the
Gender and Ethnic Balance of Academic Economics 2006”, RES report.
Mitka, Malgorzata, Karen Mumford, and Christina Sechel (2015). “The Gender Balance of
Academic Economics 2014: Royal Economic Society Women’s Committee Survey”
Mumford, Karen, (1997). “The Gender Balance of Academic Economists in the UK”, report to
the Royal Economic Society Women’s Committee, June 1997.
Mumford, Karen. (2009). “Royal Economic Society Survey on the Gender and Ethnic Balance of
Academic Economics 2008”, RES report.
26
Appendix
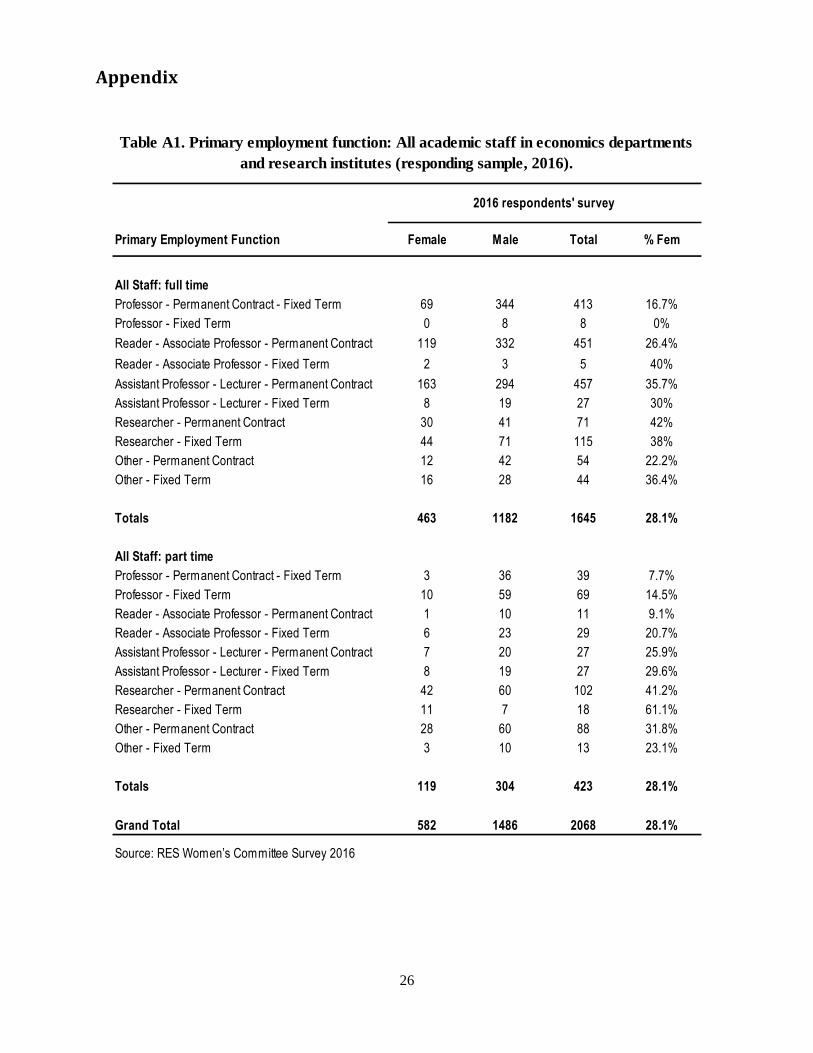
Primary Employment Function Female Male Total % Fem
All Staff: full time
Professor - Permanent Contract - Fixed Term 69 344 413 16.7%
Professor - Fixed Term 0 8 8 0%
Reader - Associate Professor - Permanent Contract 119 332 451 26.4%
Reader - Associate Professor - Fixed Term 2 3 5 40%
Assistant Professor - Lecturer - Permanent Contract 163 294 457 35.7%
Assistant Professor - Lecturer - Fixed Term 8 19 27 30%
Researcher - Permanent Contract 30 41 71 42%
Researcher - Fixed Term 44 71 115 38%
Other - Permanent Contract 12 42 54 22.2%
Other - Fixed Term 16 28 44 36.4%
Totals 463 1182 1645 28.1%
All Staff: part time
Professor - Permanent Contract - Fixed Term 3 36 39 7.7%
Professor - Fixed Term 10 59 69 14.5%
Reader - Associate Professor - Permanent Contract 1 10 11 9.1%
Reader - Associate Professor - Fixed Term 6 23 29 20.7%
Assistant Professor - Lecturer - Permanent Contract 7 20 27 25.9%
Assistant Professor - Lecturer - Fixed Term 8 19 27 29.6%
Researcher - Permanent Contract 42 60 102 41.2%
Researcher - Fixed Term 11 7 18 61.1%
Other - Permanent Contract 28 60 88 31.8%
Other - Fixed Term 3 10 13 23.1%
Totals 119 304 423 28.1%
Grand Total 582 1486 2068 28.1%
Source: RES Women’s Committee Survey 2016
Table A1. Primary employment function: All academic staff in economics departments
and research institutes (responding sample, 2016).
2016 respondents' survey
27
Fem
ale
Mal
e T
ota
l%
Fem
% T
ota
l
Sta
ff
% o
f al
l
Fem
ales
% o
f al
l
Mal
esF
emal
e M
ale
To
tal
% F
em%
To
tal
Sta
ff
% o
f al
l
Fem
ales
% o
f al
l
Mal
es
All
Sta
ff(1
)(2
)(3
)(4
)(5
)(6
)(7
)(8
)(9
)(1
0)(1
1)(1
2)(1
3)(1
4)
Pro
fess
or
14
32
03
34
4.2%
13.3
%3.
4%15
.2%
82
44
75
29
15.5
%25
.6%
14.1
%30
.1%
Rea
der
- A
sso
ciat
e P
rofe
sso
r3
73
50
38
79.
6%15
.4%
9.0%
16.6
%1
28
36
84
96
25.8
%24
.0%
22.0
%24
.8%
Ass
ista
nt P
rofe
sso
r -
Lect
urer
15
77
79
93
616
.8%
37.2
%38
.3%
37.0
%1
86
35
25
38
34.6
%26
.0%
32.0
%23
.7%
Res
ear
cher
11
82
18
33
635
.1%
13.3
%28
.8%
10.3
%1
27
17
93
06
41.5
%14
.8%
21.8
%12
.0%
Oth
er8
44
40
52
416
.0%
20.8
%20
.5%
20.9
%5
91
40
19
929
.6%
9.6%
10.1
%9.
4%
To
tal
41
02
10
72
51
716
.3%
58
21
48
62
06
828
.1%
Nu
mb
er o
f D
epar
tmen
ts8
36
4
Res
po
nse
rat
e9
2%
57
%
So
urc
es:
RE
S W
omen
’s C
omm
ittee
Sur
vey
2016
, RE
S W
omen
's C
omm
ittee
Pos
tal S
urve
y 19
96.
Table
A2. P
rim
ary
em
plo
ym
ent
functi
on:
Academ
ic s
taff
in e
cono
mic
s depa
rtm
ents
and r
ese
arc
h inst
itute
s (1
996 p
ost
al a
nd 2
016
resp
ondent
surv
ey
s).
Pri
mar
y E
mp
loym
ent
Fu
nct
ion
1996
po
stal
su
rvey
2016
res
po
nd
ent
surv
ey
28
JEL research discipline ProfessorReader - Associate
Professor
Assistant Professor -
LecturerResearcher Other Total % All % Prof
(1) (2) (3) (4) (5) (6) (7) (8)
CHUDE departments
A - General Economics and Teaching 3 27 19 0 24 73 4.4% 0.7%
B - History of Economic Thought, Methodology, and Heterodox Approaches 2 14 5 0 3 24 1.4% 0.4%
C - Mathematical and Quantitative Methods 40 40 43 10 9 142 8.6% 8.7%
D - Microeconomics 76 76 77 18 14 261 15.8% 16.5%
E - Macroeconomics and Monetary Economics 64 59 80 6 19 228 13.8% 13.9%
F - International Economics 15 25 31 4 7 82 4.9% 3.3%
G - Financial Economics 40 52 52 3 10 157 9.5% 8.7%
H - Public Economics 15 13 16 3 6 53 3.2% 3.3%
I - Health, Education, and Welfare 17 16 17 15 6 71 4.3% 3.7%
J - Labor and Demographic Economics 41 33 34 10 7 125 7.5% 8.9%
K - Law and Economics 5 1 0 0 1 7 0.4% 1.1%
L - Industrial Organization 17 14 21 2 6 60 3.6% 3.7%
M - Business Administration and Business Economics; Marketing; Accounting 11 7 6 1 1 26 1.6% 2.4%
N - Economic History 11 10 5 3 1 30 1.8% 2.4%
O - Economic Development, Technological Change, and Growth 40 30 38 8 15 131 7.9% 8.7%
P - Economic Systems 1 2 1 0 0 4 0.2% 0.2%
Q - Agricultural and Natural Resource Economics; Environmental and Ecological 25 14 19 12 5 75 4.5% 5.4%
R - Urban, Rural, Regional, Real Estate, and Transportation Economics 9 14 4 2 0 29 1.8% 2.0%
Y - Miscellaneous Categories 11 11 8 3 3 36 2.2% 2.4%
Z - Other Special Topics 17 9 14 2 1 43 2.6% 3.7%
Total 460 467 490 102 138 1657 100% 100%
Research groups and non-CHUDE departments
A - General Economics and Teaching 0 1 0 0 0 1 0.5% 0.0%
B - History of Economic Thought, Methodology, and Heterodox Approaches 0 0 1 0 1 2 0.9% 0.0%
C - Mathematical and Quantitative Methods 1 0 3 0 0 4 1.9% 3.4%
D - Microeconomics 0 0 1 6 0 7 3.3% 0.0%
E - Macroeconomics and Monetary Economics 0 0 1 8 0 9 4.3% 0.0%
F - International Economics 0 0 0 4 0 4 1.9% 0.0%
G - Financial Economics 0 0 1 0 0 1 0.5% 0.0%
H - Public Economics 0 0 0 0 0 0 0.0% 0.0%
I - Health, Education, and Welfare 23 4 1 70 1 99 46.9% 79.3%
J - Labor and Demographic Economics 3 0 0 16 0 19 9.0% 10.3%
K - Law and Economics 0 0 0 0 0 0 0.0% 0.0%
L - Industrial Organization 0 0 0 0 0 0 0.0% 0.0%
M - Business Administration and Business Economics; Marketing; Accounting 0 0 0 0 0 0 0.0% 0.0%
N - Economic History 0 0 0 0 0 0 0.0% 0.0%
O - Economic Development, Technological Change, and Growth 1 0 0 38 0 39 18.5% 3.4%
P - Economic Systems 0 0 0 0 0 0 0.0% 0.0%
Q - Agricultural and Natural Resource Economics; Environmental and Ecological 0 0 0 1 0 1 0.5% 0.0%
R - Urban, Rural, Regional, Real Estate, and Transportation Economics 0 0 0 14 0 14 6.6% 0.0%
Y - Miscellaneous Categories 0 0 0 8 0 8 3.8% 0.0%
Z - Other Special Topics 1 0 0 2 0 3 1.4% 3.4%
Total 29 5 8 167 2 211 100% 100%
Source: RES Women’s Committee Survey 2016.
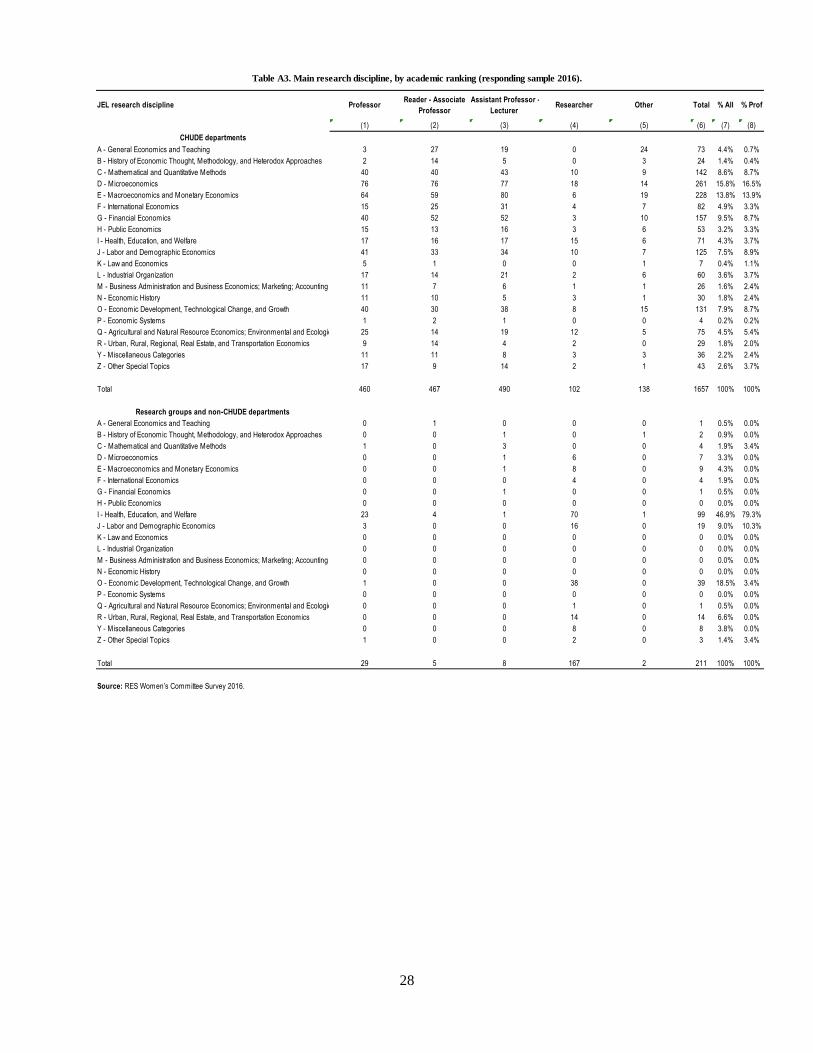
Table A3. Main research discipline, by academic ranking (responding sample 2016).
29
Fem
ale
Mal
eT
ota
l%
Fem
RE
F g
pa<
=2.
52.
5<R
EF
gp
a<=
3R
EF
gp
a>3
% T
ota
l in
RE
F>
3
JEL
res
earc
h d
isci
plin
e
A -
Gen
eral
Eco
nom
ics
and
Tea
chin
g1
36
07
33.
0%9
42
22
30.1
%
B -
His
tory
of E
cono
mic
Tho
ught
, Met
hodo
logy
, and
Het
erod
ox A
ppro
ach
es8
16
24
1.8%
41
01
041
.7%
C -
Mat
hem
atic
al a
nd Q
uant
itativ
e M
etho
ds3
11
11
14
27.
1%1
66
85
840
.8%
D -
Mic
roec
ono
mic
s6
91
92
26
115
.9%
22
10
91
30
49.8
%
E -
Mac
roec
ono
mic
s an
d M
onet
ary
Eco
nom
ics
40
18
82
28
9.2%
22
96
11
048
.2%
F -
Inte
rnat
iona
l Eco
nom
ics
26
56
82
6.0%
93
04
352
.4%
G -
Fin
anci
al E
cono
mic
s4
51
12
15
710
.3%
11
87
59
37.6
%
H -
Pub
lic E
cono
mic
s1
63
75
33.
7%2
21
30
56.6
%
I - H
ealth
, Edu
catio
n, a
nd W
elfa
re2
94
27
16.
7%5
36
30
42.3
%
J -
Labo
r an
d D
emog
raph
ic E
cono
mic
s4
18
41
25
9.4%
15
39
71
56.8
%
K -
Law
and
Eco
nom
ics
25
70.
5%0
43
42.9
%
L -
Indu
stria
l Org
aniz
atio
n9
51
60
2.1%
62
33
151
.7%
M -
Bus
ines
s A
dmin
istr
atio
n an
d B
usin
ess
Eco
nom
ics;
Mar
ketin
g; A
cco
untin
g6
20
26
1.4%
34
19
73.1
%
N -
Eco
nom
ic H
isto
ry4
26
30
0.9%
19
20
66.7
%
O -
Eco
nom
ic D
eve
lopm
ent,
Tec
hno
logi
cal C
hang
e, a
nd G
row
th4
28
91
31
9.7%
94
47
859
.5%
P -
Eco
nom
ic S
yste
ms
13
40.
2%0
40
0.0%
Q -
Agr
icu
ltura
l and
Nat
ural
Res
our
ce E
cono
mic
s; E
nvir
onm
enta
l and
Eco
logi
cal
21
54
75
4.8%
13
37
25
33.3
%
R -
Urb
an, R
ural
, Reg
iona
l, R
eal E
stat
e, a
nd T
rans
por
tatio
n E
cono
mic
s6
23
29
1.4%
21
11
655
.2%
Y -
Mis
cella
neou
s C
ateg
orie
s1
22
43
62.
8%0
43
288
.9%
Z -
Oth
er S
peci
al T
opic
s1
42
94
33.
2%0
19
24
55.8
%
Tot
al4
35
12
22
16
57
26.3
%1
49
69
78
11
48.9
%
So
urc
e: R
ES
Wom
en’s
Com
mitt
ee S
urve
y 20
16.
Table
A4. M
ain
rese
arc
h d
iscip
line, by g
ender
(re
spondin
g s
am
ple
20
16, C
HU
DE
depts
only
).
30
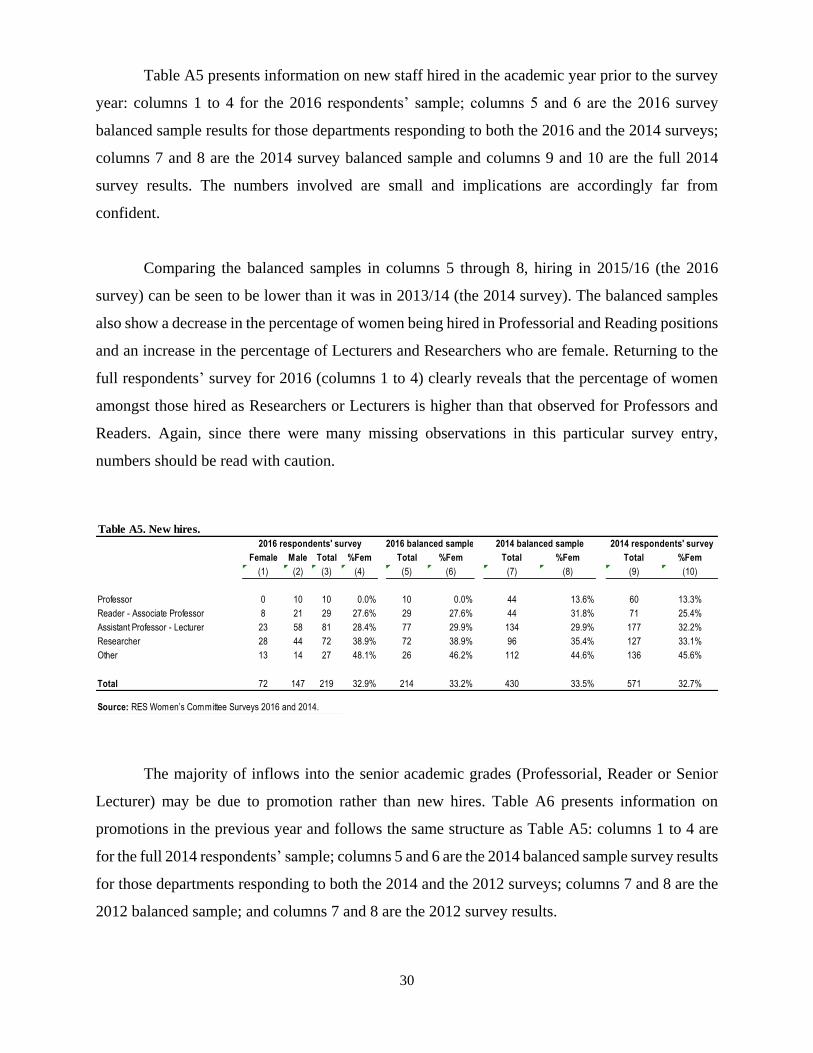
Table A5 presents information on new staff hired in the academic year prior to the survey
year: columns 1 to 4 for the 2016 respondents’ sample; columns 5 and 6 are the 2016 survey
balanced sample results for those departments responding to both the 2016 and the 2014 surveys;
columns 7 and 8 are the 2014 survey balanced sample and columns 9 and 10 are the full 2014
survey results. The numbers involved are small and implications are accordingly far from
confident.
Comparing the balanced samples in columns 5 through 8, hiring in 2015/16 (the 2016
survey) can be seen to be lower than it was in 2013/14 (the 2014 survey). The balanced samples
also show a decrease in the percentage of women being hired in Professorial and Reading positions
and an increase in the percentage of Lecturers and Researchers who are female. Returning to the
full respondents’ survey for 2016 (columns 1 to 4) clearly reveals that the percentage of women
amongst those hired as Researchers or Lecturers is higher than that observed for Professors and
Readers. Again, since there were many missing observations in this particular survey entry,
numbers should be read with caution.
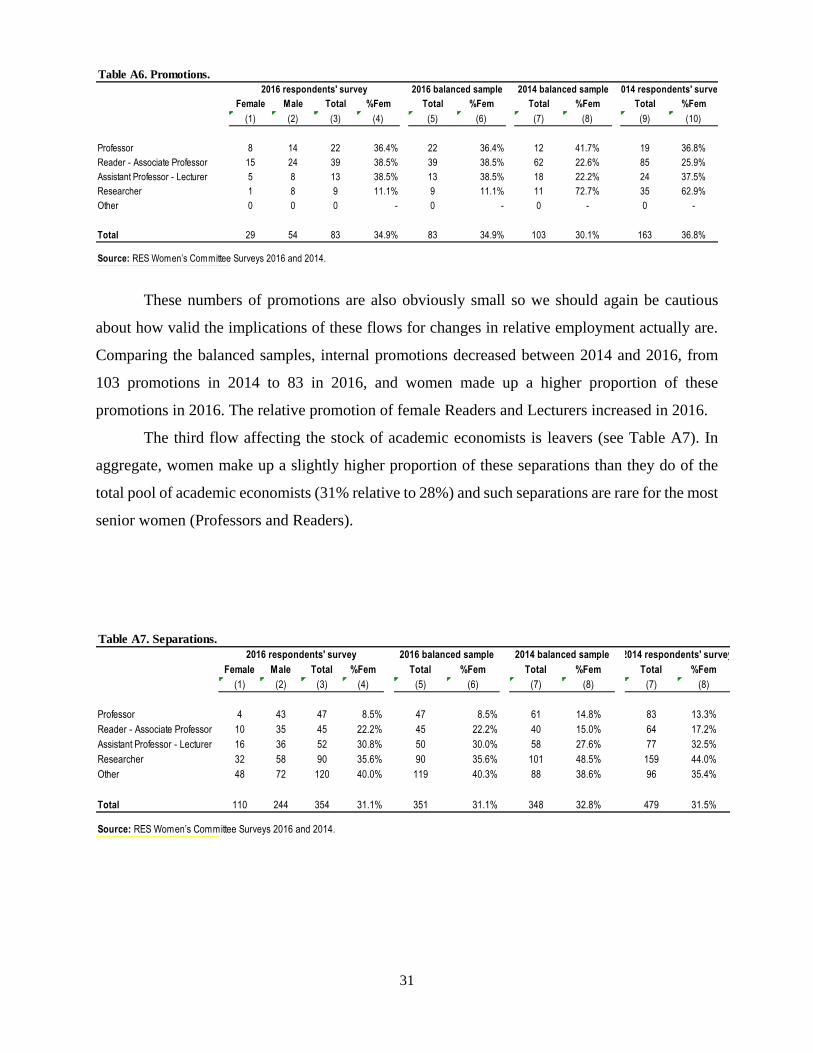
The majority of inflows into the senior academic grades (Professorial, Reader or Senior
Lecturer) may be due to promotion rather than new hires. Table A6 presents information on
promotions in the previous year and follows the same structure as Table A5: columns 1 to 4 are
for the full 2014 respondents’ sample; columns 5 and 6 are the 2014 balanced sample survey results
for those departments responding to both the 2014 and the 2012 surveys; columns 7 and 8 are the
2012 balanced sample; and columns 7 and 8 are the 2012 survey results.
Female Male Total %Fem Total %Fem Total %Fem Total %Fem
(1) (2) (3) (4) (5) (6) (7) (8) (9) (10)
Professor 0 10 10 0.0% 10 0.0% 44 13.6% 60 13.3%
Reader - Associate Professor 8 21 29 27.6% 29 27.6% 44 31.8% 71 25.4%
Assistant Professor - Lecturer 23 58 81 28.4% 77 29.9% 134 29.9% 177 32.2%
Researcher 28 44 72 38.9% 72 38.9% 96 35.4% 127 33.1%
Other 13 14 27 48.1% 26 46.2% 112 44.6% 136 45.6%
Total 72 147 219 32.9% 214 33.2% 430 33.5% 571 32.7%
Source: RES Women’s Committee Surveys 2016 and 2014.
Table A5. New hires.
2016 respondents' survey 2014 respondents' survey2016 balanced sample 2014 balanced sample
31
These numbers of promotions are also obviously small so we should again be cautious
about how valid the implications of these flows for changes in relative employment actually are.
Comparing the balanced samples, internal promotions decreased between 2014 and 2016, from
103 promotions in 2014 to 83 in 2016, and women made up a higher proportion of these
promotions in 2016. The relative promotion of female Readers and Lecturers increased in 2016.
The third flow affecting the stock of academic economists is leavers (see Table A7). In
aggregate, women make up a slightly higher proportion of these separations than they do of the
total pool of academic economists (31% relative to 28%) and such separations are rare for the most
senior women (Professors and Readers).
Female Male Total %Fem Total %Fem Total %Fem Total %Fem
(1) (2) (3) (4) (5) (6) (7) (8) (9) (10)
Professor 8 14 22 36.4% 22 36.4% 12 41.7% 19 36.8%
Reader - Associate Professor 15 24 39 38.5% 39 38.5% 62 22.6% 85 25.9%
Assistant Professor - Lecturer 5 8 13 38.5% 13 38.5% 18 22.2% 24 37.5%
Researcher 1 8 9 11.1% 9 11.1% 11 72.7% 35 62.9%
Other 0 0 0 - 0 - 0 - 0 -
Total 29 54 83 34.9% 83 34.9% 103 30.1% 163 36.8%
Source: RES Women’s Committee Surveys 2016 and 2014.
Table A6. Promotions.
2016 respondents' survey 2016 balanced sample 2014 respondents' survey2014 balanced sample
Female Male Total %Fem Total %Fem Total %Fem Total %Fem
(1) (2) (3) (4) (5) (6) (7) (8) (7) (8)
Professor 4 43 47 8.5% 47 8.5% 61 14.8% 83 13.3%
Reader - Associate Professor 10 35 45 22.2% 45 22.2% 40 15.0% 64 17.2%
Assistant Professor - Lecturer 16 36 52 30.8% 50 30.0% 58 27.6% 77 32.5%
Researcher 32 58 90 35.6% 90 35.6% 101 48.5% 159 44.0%
Other 48 72 120 40.0% 119 40.3% 88 38.6% 96 35.4%
Total 110 244 354 31.1% 351 31.1% 348 32.8% 479 31.5%
Source: RES Women’s Committee Surveys 2016 and 2014.
Table A7. Separations.
2016 respondents' survey 2016 balanced sample 2014 respondents' survey2014 balanced sample
32
Aberystwyth University School of Oriental and African Studies (SOAS) University of Liverpool
Aston University Birmingham Swansea University University of London Birkbeck
Cardiff Metropolitan University University of Aberdeen University of Manchester
City University London University of Bangor University of Nottingham
Durham University University of Birmingham University of Oxford
Heriot-Watt University University of Bristol University of Portsmouth
Lancaster University University of Buckingham University of Reading
Liverpool John Moores University University of Cambridge University of Sheffield
London Business School University of Derby University of Southampton
London School of Economics and Political Science University of Dundee University of St Andrews
Manchester Business School University of Edinburgh University of Stirling
Manchester Metropolitan University University of Essex University of Surrey
Middlesex University University of Exeter University of Sussex
Newcastle University University of Hertfordshire University of Ulster
Nottingham Trent University University of Huddersfield University of Warwick
Oxford Brookes University University of Hull University of Westminster
Queen Mary University of London University of Kent University of York
Queens University Belfast University of Leeds University of the West of England Bristol
Royal Holloway University of London University of Leicester
Anglia Ruskin University London South Bank University University of East London
Brunel University Loughborough University University of Glasgow
Cardiff University Napier University University of Greenwich
Coventry University Northumbria University University of Plymouth
Cranfield University Open University University of Salford
De Montfort University Robert Gordon University University of South Wales
Glasgow Caledonian University Staffordshire University University of South Wales (HEPRU)
Imperial College London University College London University of Strathclyde
Keele University University of Abertay Dundee University of Teesside
King's College London University of Bath University of Wolverhampton
Kingston University University of Bradford University of the West of Scotland
Leeds Beckett University University of Central Lancashire
London Metropolitan University University of East Anglia
Source: RES Women’s Committee Survey 2016.
Table A8. CHUDE Departments, by responding statuts
Respondents
Non-respondents
33
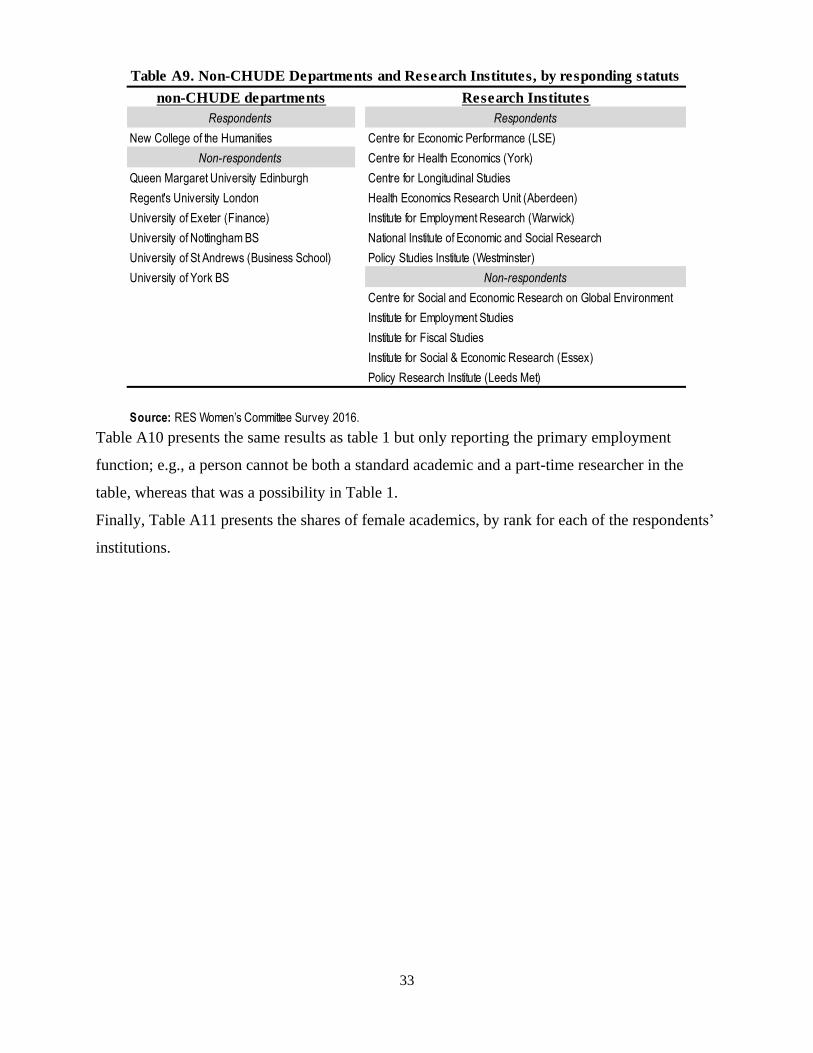
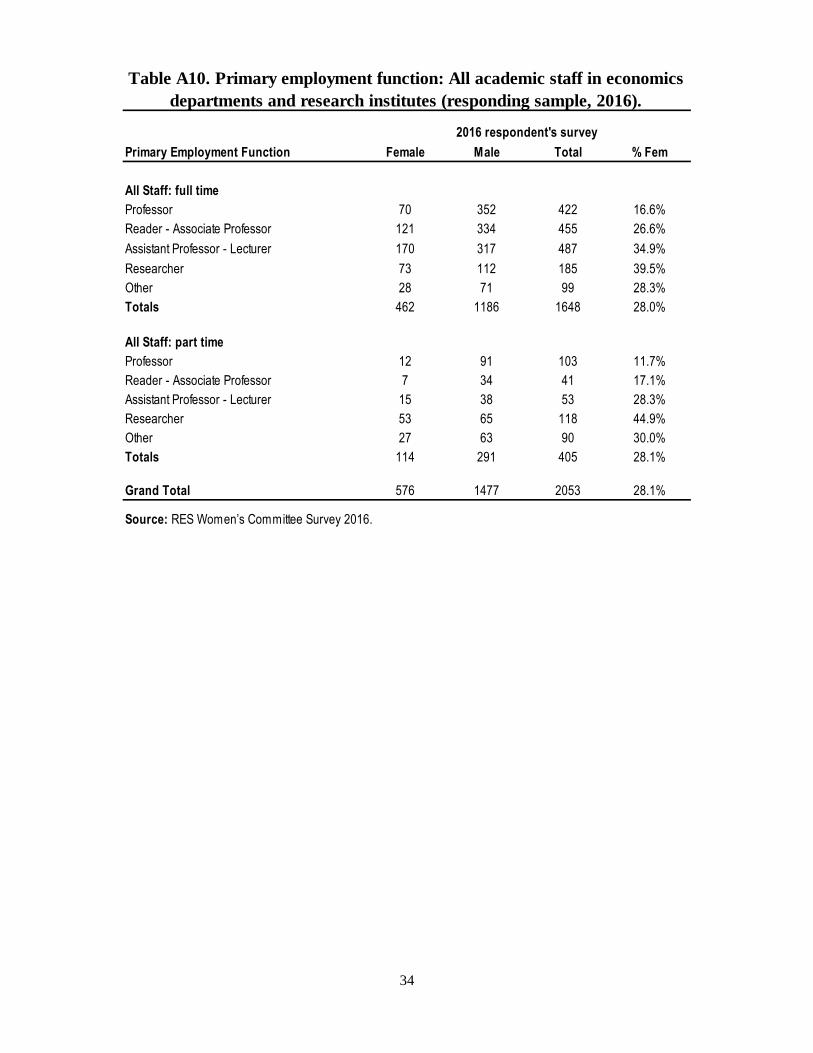
Table A10 presents the same results as table 1 but only reporting the primary employment
function; e.g., a person cannot be both a standard academic and a part-time researcher in the
table, whereas that was a possibility in Table 1.
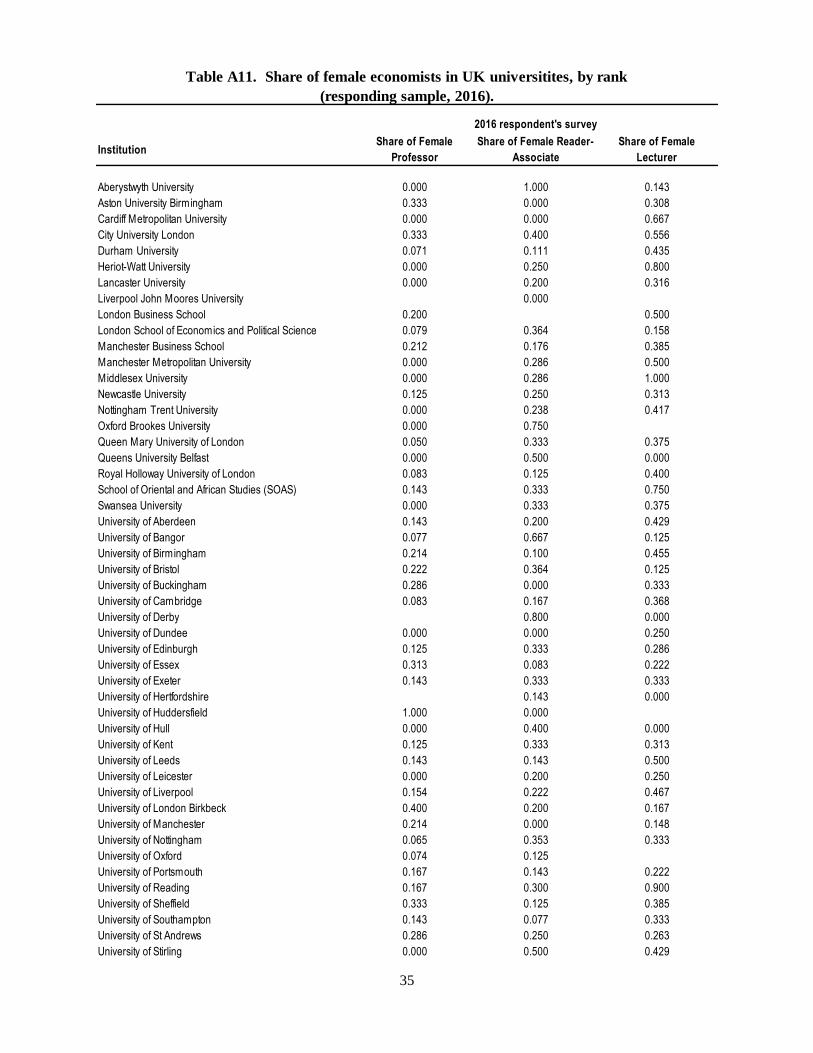
Finally, Table A11 presents the shares of female academics, by rank for each of the respondents’
institutions.
non-CHUDE departments Research Institutes
Respondents Respondents
New College of the Humanities Centre for Economic Performance (LSE)
Non-respondents Centre for Health Economics (York)
Queen Margaret University Edinburgh Centre for Longitudinal Studies
Regent's University London Health Economics Research Unit (Aberdeen)
University of Exeter (Finance) Institute for Employment Research (Warwick)
University of Nottingham BS National Institute of Economic and Social Research
University of St Andrews (Business School) Policy Studies Institute (Westminster)
University of York BS Non-respondents
Centre for Social and Economic Research on Global Environment
Institute for Employment Studies
Institute for Fiscal Studies
Institute for Social & Economic Research (Essex)
Policy Research Institute (Leeds Met)
Source: RES Women’s Committee Survey 2016.
Table A9. Non-CHUDE Departments and Research Institutes, by responding statuts
34
Primary Employment Function Female Male Total % Fem
All Staff: full time
Professor 70 352 422 16.6%
Reader - Associate Professor 121 334 455 26.6%
Assistant Professor - Lecturer 170 317 487 34.9%
Researcher 73 112 185 39.5%
Other 28 71 99 28.3%
Totals 462 1186 1648 28.0%
All Staff: part time
Professor 12 91 103 11.7%
Reader - Associate Professor 7 34 41 17.1%
Assistant Professor - Lecturer 15 38 53 28.3%
Researcher 53 65 118 44.9%
Other 27 63 90 30.0%
Totals 114 291 405 28.1%
Grand Total 576 1477 2053 28.1%
Source: RES Women’s Committee Survey 2016.
Table A10. Primary employment function: All academic staff in economics
departments and research institutes (responding sample, 2016).
2016 respondent's survey
35
InstitutionShare of Female
Professor
Share of Female Reader-
Associate
Share of Female
Lecturer
Aberystwyth University 0.000 1.000 0.143
Aston University Birmingham 0.333 0.000 0.308
Cardiff Metropolitan University 0.000 0.000 0.667
City University London 0.333 0.400 0.556
Durham University 0.071 0.111 0.435
Heriot-Watt University 0.000 0.250 0.800
Lancaster University 0.000 0.200 0.316
Liverpool John Moores University 0.000
London Business School 0.200 0.500
London School of Economics and Political Science 0.079 0.364 0.158
Manchester Business School 0.212 0.176 0.385
Manchester Metropolitan University 0.000 0.286 0.500
Middlesex University 0.000 0.286 1.000
Newcastle University 0.125 0.250 0.313
Nottingham Trent University 0.000 0.238 0.417
Oxford Brookes University 0.000 0.750
Queen Mary University of London 0.050 0.333 0.375
Queens University Belfast 0.000 0.500 0.000
Royal Holloway University of London 0.083 0.125 0.400
School of Oriental and African Studies (SOAS) 0.143 0.333 0.750
Swansea University 0.000 0.333 0.375
University of Aberdeen 0.143 0.200 0.429
University of Bangor 0.077 0.667 0.125
University of Birmingham 0.214 0.100 0.455
University of Bristol 0.222 0.364 0.125
University of Buckingham 0.286 0.000 0.333
University of Cambridge 0.083 0.167 0.368
University of Derby 0.800 0.000
University of Dundee 0.000 0.000 0.250
University of Edinburgh 0.125 0.333 0.286
University of Essex 0.313 0.083 0.222
University of Exeter 0.143 0.333 0.333
University of Hertfordshire 0.143 0.000
University of Huddersfield 1.000 0.000
University of Hull 0.000 0.400 0.000
University of Kent 0.125 0.333 0.313
University of Leeds 0.143 0.143 0.500
University of Leicester 0.000 0.200 0.250
University of Liverpool 0.154 0.222 0.467
University of London Birkbeck 0.400 0.200 0.167
University of Manchester 0.214 0.000 0.148
University of Nottingham 0.065 0.353 0.333
University of Oxford 0.074 0.125
University of Portsmouth 0.167 0.143 0.222
University of Reading 0.167 0.300 0.900
University of Sheffield 0.333 0.125 0.385
University of Southampton 0.143 0.077 0.333
University of St Andrews 0.286 0.250 0.263
University of Stirling 0.000 0.500 0.429
Table A11. Share of female economists in UK universitites, by rank
(responding sample, 2016).
2016 respondent's survey
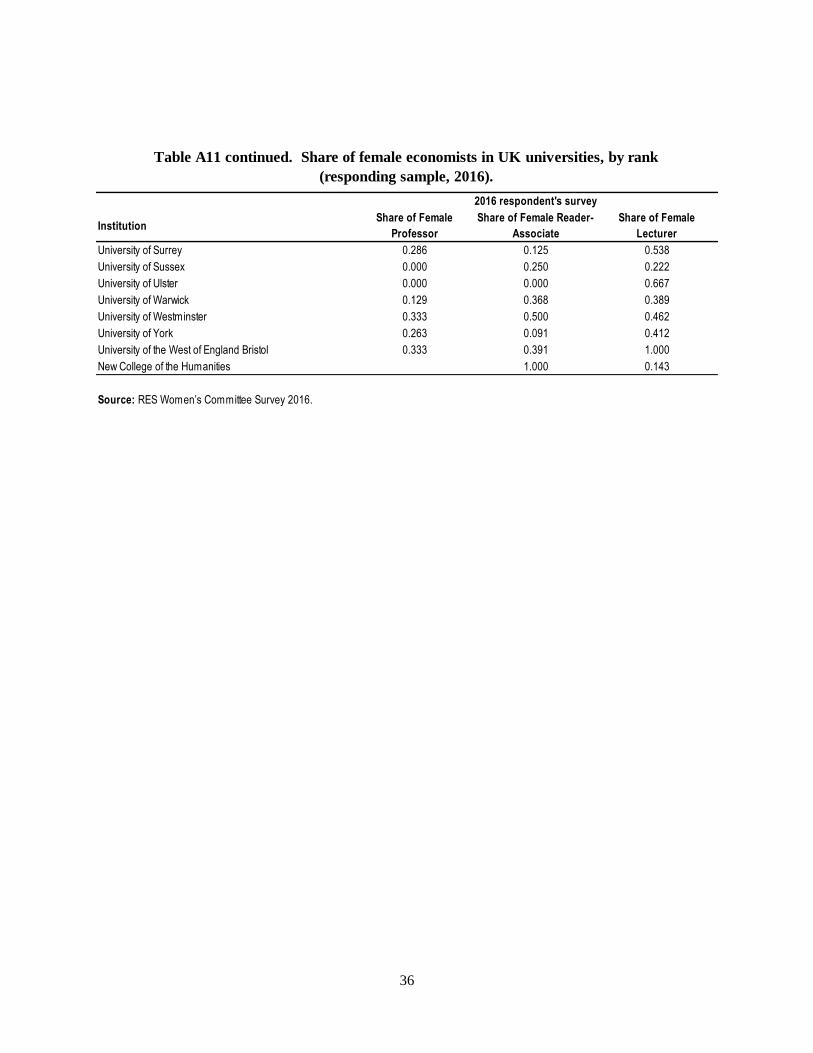
36
InstitutionShare of Female
Professor
Share of Female Reader-
Associate
Share of Female
Lecturer
University of Surrey 0.286 0.125 0.538
University of Sussex 0.000 0.250 0.222
University of Ulster 0.000 0.000 0.667
University of Warwick 0.129 0.368 0.389
University of Westminster 0.333 0.500 0.462
University of York 0.263 0.091 0.412
University of the West of England Bristol 0.333 0.391 1.000
New College of the Humanities 1.000 0.143
Source: RES Women’s Committee Survey 2016.
Table A11 continued. Share of female economists in UK universities, by rank
(responding sample, 2016).
2016 respondent's survey