Embed Size (px)
Citation preview

August 25, 2021
Royal Bank of Canada
Third Quarter Results
All amounts are in Canadian dollars unless otherw ise indicated and are based on financial statements prepared
in compliance w ith International Accounting Standard 34 Interim Financial Reporting, unless otherw ise noted.
Our Q3 2021 Report to Shareholders and Supplementary Financial Information are available on our w ebsite at:
http://w ww.rbc.com/investorrelations.

Royal Bank of Canada1 Third Quarter 2021 Results
From time to time, we make written or oral forward-looking statements within the meaning of certain securities laws, including the “safe harbour” provisions of the United States Private Securities Litigation Reform Act of 1995 and any applicable Canadian securities legislation. We may make forward-looking statements in this presentation, in other filings with Canadian regulators or the SEC, in other reports to shareholders, and in other communications, including statements by our President and Chief Executive Officer. Forward-looking statements in this document include, but are not limited to, statements relating to our financial performance objectives, vision and strategic goals, and the potential continued impacts of the coronavirus (COVID-19) pandemic on our business operations, financial results and financial condition, and on the global economy and financial market conditi ons, including statements about our actions in support of our employees, clients and communities, and projections relating to real gross domestic product and unemployment rates in Canada and the United States, respectively. The forward-looking information contained in this presentation is presented for the purpose of assisting the holders of our securities and financial analysts in understanding our financial position and results of operations as at and for the periods ended on the dates presented, as well as our financial performance objectives, vision and strategic goals, and may not be appropriate for other purposes. Forward-looking statements are typically identified by words such as “believe”, “expect”, “foresee”, “forecast”, “anticipate”, “intend”, “estimate”, “goal”, “plan” and “project” and similar expressions of future or conditional verbs such as “will”, “may”, “should”, “could” or “would”.
By their very nature, forward-looking statements require us to make assumptions and are subject to inherent risks and uncertainties, which give rise to the possibility that our predictions, forecasts, projections, expectations or conclusions will not prove to be accurate, that our assumptions may not be correct and that our financial performance objectives, vision and strategic goals will not be achieved. We caution readers not to place undue reliance on these statements as a number of risk factors could cause our actual results to differ materially from the expectations expressed in such forward-looking statements. These factors – many of which are beyond our control and the effects of which can be difficult to predict – include: credit, market, liquidity and funding, insurance, operational, regulatory compliance (which could lead to us being subject to various legal and regulatory proceedings, the potential outcome of which could include regulatory restrictions, penalties and fines), strategic, reputation, legal and regulatory environment, competitive and systemic risks and other risks discussed in the risk sections and Significant developments: COVID-19 section of our annual report for the fiscal year ended October 31, 2020 (the 2020 Annual Report) and the Risk management and Impact of COVID-19 pandemic sections of our Q3 2021 Report to Shareholders; including business and economic conditions, information technology and cyber risks, Canadian housing and household indebtedness, geopolitical uncertainty, privacy, data and third party related risks, regulatory changes, environmental and social risk (inc luding climate change), and digital disruption and innovation, culture and conduct, the business and economic conditions in the geographic regions in which we operate, the effects of changes in government fiscal, monetary and other policies, tax risk and transparency, and the emergence of widespread health emergencies or public health crises such as pandemics and epidemics, including the COVID-19 pandemic and its impact on the global economy and financial market conditions and our business operations, and financial results, condition and objectives.
We caution that the foregoing list of risk factors is not exhaustive and other factors could also adversely affect our result s. When relying on our forward-looking statements to make decisions with respect to us, investors and others should carefully consider the foregoing factors and other uncertainties and potential events. Material economic assumptions underlying the forward looking-statements contained in this presentation are set out in the Economic, market and regulatory review and outlook section and for each business segment under the Strategic priorities and Outlook headings in our 2020 Annual Report, as updated by the Economic, market and regulatory review and outlook and Impact of COVID-19 pandemic sections of our Q3 2021 Report to Shareholders. Except as required by law, we do not undertake to update any forward-looking statement, whether written or oral, that may be made from time to time by us or on our behalf.
Additional information about these and other factors can be found in the risk sections and Significant developments: COVID-19 section of our 2020 Annual Report and the Risk management and Impact of COVID-19 pandemic sections of our Q3 2021 Report to Shareholders.
Information contained in or otherwise accessible through the websites mentioned does not form part of this presentation. All references in this presentation to websites are inactive textual references and are for your information only.
Caution regarding forward-looking statements

Dave McKay
President and Chief Executive Officer
Overview

Royal Bank of Canada3 Third Quarter 2021 Results
19.6%
P&CB$4.7
Wealth Management
$3.4
Insurance$1.8
I&TS$0.5
Capital Markets
$2.5 +7% YoY
+8% YoY
(21)% or +5% YoY
net of Insurance
FV change (3)
7% YoY
(10)% YoY
Growth largely driven by higher variable
compensation Partially offset by FX impact of $249MM
Discretionary costs continue to be well contained
Tangible Book
Value per Share
+17% YoY
Premium return on equity
Strong client activity and volume growth underpinned by balance sheet strength
Return on Equity(9)
Strong credit performance
Revenue of $12.8BN, down 1% YoY or up 3%
YoY(3) net of Insurance fair value change Higher Canadian Banking and Wealth
Management (non-U.S.) revenue, partly offset by lower revenue in Capital Markets
Strong capital ratio (CET1)
$(540)MM of total PCL includes $(638)MM
release of PCL on performing loans PCL on impaired loans ratio of 8 bps, down
3 bps QoQ ACL on loans is down $658MM QoQ
o Total ACL on loans ratio is 14 bps higher
than pre-pandemic levels in Q1/2020, and down 22 bps from the Q4/2020 peak
PCL(8) on loans ratio
(28) bps(down 23 bps QoQ)
ACL on loans
$4.9BN0.67% of L&A
Favourable impact of model parameter updates
Record internal capital generation was partially offset by strong RWA business growth
$1.5BN common dividends paid in Q3/2021
Return on Tangible Common Equity(2)
12.0%
12.5% 12.5%12.8%
13.6%
Q3/20 Q4/20 Q1/21 Q2/21 Q3/21
+80 bps
QoQ
Pre-Provision,
Pre-Tax
Earnings(6)
Reported Diluted
EPS
$5.0BN
$2.97
per share
Adjusted Diluted
EPS(7)
$3.00
per share
Net Income $4.3BN
+6%
YoY
+34%
YoY
+35%
YoY
+35%
YoY
Book Value per
Share
+12% YoY
23.0%
Strong earnings growthDiversified revenue streams ($BN) Expenses well controlled (YoY)(1)
Q3/2021
(1) Amounts exclude Corporate Support. (2) This is a non-GAAP measure. See note 1 on slide 38. (3) This is a non-GAAP measure. See note 2 on slide 38. (4) This is a non-GAAP measure. See note 3 on slide 38. (5) This is a non-GAAP measure. See note 4 on slide 38. (6) This is a non-GAAP measure. See note 5 on slide 38. (7) This is a non-GAAP measure. See note 6 on slide 38 (8). See note 7 on slide 38. (9) ROE does not have a standardized meaning
under GAAP. See note 8 on slide 38.
+390 bps YoY
0.6%
(1.4%)
1.5%
Non-interest expense
(NIE)
NIE excl. VC & SBC (4)
NIE excl. FX and growth in VC & SBC (5)

Royal Bank of Canada4 Third Quarter 2021 Results
38 49 53
44
61
75
82
110128
Q3/2019 Q3/2020 Q3/2021
CNB Loans CNB Deposits
Strong volume growth and market share gains in our largest businesses
Canadian Banking average loans and acceptances ($ billions)(1)
Wealth Management (non-U.S.) AUM and AUA ($ billions)
City National (CNB) average loans and deposits (US$ billions)
U.S. Wealth Management AUM and AUA (US$ billions)
Canadian Banking average deposits ($ billions)
Capital Markets equity and debt issuance volumes (US$ billions)(2)
357 378 413
8589
91442467
504
Q3/2019 Q3/2020 Q3/2021
Retail Wholesale
$62BN growth over 2 years
213243 259
165
203230
378
446489
Q3/2019 Q3/2020 Q3/2021
Personal Business
512 513
602584653
757
Q3/2019 Q3/2020 Q3/2021
AUA AUM
408436
553
117 135 175
Q3/2019 Q3/2020 Q3/2021
AUA AUM
$111BN growth over 2 years $173BN AUM growth over 2 years
82 176 104
10
18
14
Q3/2019 Q3/2020 Q3/2021
DCM ECM
(1) Wholesale includes small business. (2) Dealogic.
US$15BN loan growth over 2 years
8% YoY
7% 2-YR CAGR
10% YoY
14% 2-YR CAGR
16% YoY
14% 2-YR CAGR
US$58BN AUM growth over 2 years
16% YoY
25% 2-YR CAGR
16% 2-YR CAGR
27% YoY

Royal Bank of Canada5 Third Quarter 2021 Results
Canadian Banking: Moving Beyond Banking for Canadian businesses
Start my business
Attract more clients
Manage my team
Manage my cashflow
Simplify my business
+
Help people early in their
entrepreneurial journey Help businesses find
customers and drive sales
Provide support with
human resources needsReceive money and make
payments
Run businesses more
efficiently
Beyond Banking provides more value to business clients along their journey
through RBC solutions and strategic partners
Leading market share in business loans(1)
Deepening client relationships
(1) Business Loans market share is based on loans in the $0-$25MM category for the Big 6 Chartered Canadian Banks.
RBC Insight Edge
RBC Small Business Navigator

Royal Bank of Canada6 Third Quarter 2021 Results
Higher risk-adjusted NIM and revenue
Canadian Banking: Increasing client flows into mutual funds
% of total client net flows(1) into mutual funds (Based on cumulative net flows since Q3/2020)
Stable revenue yield despite lower interest rates
-2%
4%
12%
22%25%
Q3/2020 Q4/2020 Q1/2021 Q2/2021 Q3/2021
(7) bps YoY
Increasing portion of net retail inflows have been invested into
mutual funds
o Inflows into mutual funds largely from savings accounts, chequing accounts and GICs
Canadian Banking’s diversified fee-based revenue streams and improving credit quality have helped to offset the impact of lower
net interest margin
o Higher mutual fund distribution fees have driven higher non-interest income in Canadian Banking
o Higher securities brokerage commissions, service charges,
foreign exchange revenue and card service revenue reflecting increased client activity have also benefitted overall Canadian
Banking revenue yields
2.58% 2.56% 2.54% 2.55% 2.51%
1.06% 1.03% 1.12% 1.19% 1.12%
3.63% 3.59% 3.65% 3.74% 3.63%
Q3/20 Q4/20 Q1/21 Q2/21 Q3/21
Canadian Banking NIM CB NIR yield CB revenue yield
+6 bps YoY
(1) Total client net flows include chequing, savings, and GIC deposits as well as net flows into Direct Investing and mutual funds. (2) See note 9 on slide 38. (3) See note 10 on slide 38. (4) See note 11 on
slide 38. (5) See note 12 on slide 38.
(2) (3)
2.58% 2.56% 2.54% 2.55%2.51%
2.34%
2.42%2.35%
2.38% 2.38%
3.40%
3.45%3.47%
3.57%
3.50%
3.00%
3.10%
3.20%
3.30%
3.40%
3.50%
3.60%
2.20%
2.40%
2.60%
2.80%
3.00%
3.20%
Q3/20 Q4/20 Q1/21 Q2/21 Q3/21
CB NIM CB risk-adjusted NIM CB risk-adjusted revenue yield
+4 bps YoY
(7) bps YoY
+10 bps YoY
(4) (5)
Flat YoY

Rod Bolger
Chief Financial Officer
Financial Review
Royal Bank of Canada8 Third Quarter 2021 Results
1,367
562 216 76
949
2,113
738
23488
1,129
Personal &Commercial
Banking
WealthManagement
Insurance I&TS Capital Markets
Q3/20 Q3/21
PCL releases add to strong volume growth and expense discipline Earnings
Net income up 34% YoY; Pre-provision, pre-tax earnings up 6%
Revenue
Net interest income (see slide 10) down 2% YoY
o Strong volume growth offset lower spreads in Canadian Banking and City National, which in turn was more than offset by lower
trading revenue in Capital Markets
o Net interest income (ex-trading) up 6% YoY(8)
Non-interest income (see slide 12) down 1% YoY
o Up 8% YoY net of Insurance fair change value change(1) and changes in U.S. Wealth Management WAP(5)
o Higher investment management and mutual fund revenue in
Wealth Management and Canadian Banking, as well as higher investment banking revenue partly offset by lower trading revenue
Non-Interest Expense Compensation: Up 2% YoY driven by higher variable compensation
in Wealth Management, partly offset by lower compensation on
decreased revenue in Capital Markets and lower share-based compensation in U.S. Wealth Management
Non-compensation: Down 2% YoY due to lower occupancy and related costs more than offsetting higher technology and marketing
spend
Provision for Credit Losses
PCL on loans(6): (28) bps, down 68 bps YoY (down 23 bps QoQ)
o PCL on performing loans (slide 20): $(638)MM release primarily
driven by improvements in our macroeconomic outlook and credit quality
o PCL on impaired loans (slide 22): 8 bps, down 15 bps YoY
(down 3 bps QoQ)
Tax Rate
Effective tax rate of 22.9%, up 140 bps YoY
o 24.7%(adjusted for TEB(7)), up 80 bps YoY
($ millions, except for EPS and ROE) Q3/2021Reported
YoY QoQ
Revenue 12,756 (1)% 10%
Revenue Net of Insurance FV Change(1) 12,281 3% 1%
Non-Interest Expense 6,420 1% 1%
Insurance PBCAE 1,304 (27)% 775%
Pre-Provision, Pre-Tax Earnings(2) 5,032 6% (1)%
Provision for Credit Losses (PCL) (540) ($1,215) ($444)
PCL on Performing Loans (Stage 1 & 2) (638) ($918) ($378)
PCL on Impaired Loans (Stage 3) 146 ($252) ($31)
Income Before Income Taxes 5,572 37% 7%
Net Income 4,296 34% 7%
Diluted Earnings per Share (EPS) $2.97 35% 8%
Adjusted Diluted EPS(3) $3.00 35% 8%
Return on Common Equity (ROE)(4) 19.6% 3.9 pts 20 bps
Net Income ($ millions)
+55%+$746MM
(1) This is a non-GAAP measure. See note 13 on slide 38. (2) This is a non-GAAP measure. See note 5 on slide 38. (3) This is a non-GAAP measure. See note 6 on slide 38. (4) ROE does not have a
standard meaning under GAAP. See note 8 on slide 38. (5) This is a non-GAAP measure. See note 14 on slide 38. (6) See note 7 on slide 38. (7) This is a non-GAAP measure. See note 15 on slide 38.
(8) This is a non-GAAP measure. For more information see slide 41.
+31%+$176MM
+8%+$18MM
16%+$12MM
19%+$180MM

Royal Bank of Canada9 Third Quarter 2021 Results
12.8%
13.6%
49 bps
69 bps (35) bps(1) bp
Q2/2021* Internal CapitalGeneration
RWADecrease - Models
& MethodologyUpdates
RWA Growth -Business
Other Q3/2021*
Strong capital and earnings growth continue to underpin shareholder returns
CET1 ratio of 13.6%, up 80 bps QoQ, reflecting:
Favourable impact of model parameter updates
Record internal capital generation
Partly offset by RWA growth supporting client-driven business activities
Remaining cumulative IFRS 9 capital modification benefit of 11 bps (QoQ down 5 bps)
Leverage ratio of 5.0%, flat QoQ
RWA decreased $12.6 billion, mainly reflecting:
Model parameter updates
Net credit upgrades, mainly in wholesale loan book
o Cumulative impact from net credit downgrades in the wholesale loan book and counterparty credit
risk portfolio have increased RWA by $8.5 billion post-Q1/2020
Partly offset by strong business growth, primarily in wholesale lending, including loan underwriting
commitments, residential mortgages and personal lending
Reversal of SVaR Multiplier
555.6 543.0
(33.5) (1.9)
14.9 6.2 1.8
Q2/2021* Model ParameterUpdates
Net CreditUpgrades
BusinessGrowth
Reversal ofSVaR Multiplier
ForeignExchange& Other
Q3/2021*
CET1 Movement
RWA Movement ($ billions)
*Represents rounded figures. For more information, refer to the Capital Management section of our Q3/2021 Report to Sharehold ers.
(1) Internal capital generation represents Net income available to shareholders, less common and preferred share dividends and distributions on other equity instruments. (2) Includes 80 bps relating to the
model parameter updates, 3 bps of other market risk model changes and (14) bps relating to the reversal of SVaR multipliers. (3) Includes (5) bps relating to capital modification associated with Stage 1
and Stage 2 allowances, and 4 bps decrease in RWA from net credit upgrades.
(1)
(3)
(2)

Royal Bank of Canada10 Third Quarter 2021 Results
413 449
(60)96
Q3/20 Net Interest
Income
Volume Margins Q3/21 Net Interest
Income
+9% YoYNIM
YoY: (25) bpsQoQ: (10) bps
See slide 29
4,172 4,282 4,295 4,212 4,429
967 728 740 642 623
1.49% 1.52% 1.50% 1.50% 1.51%
0%
0%
0%
1%
1%
1%
1%
1%
2%
0
1,000
2,000
3,000
4,000
5,000
6,000
7,000
Q3/2020 Q4/2020 Q1/2021 Q2/2021 Q3/2021
NII (excl. trading) Trading NII NIM (%)
2,933
3,085
(138)290
Q3/20 Net Interest
Income
Volume & Mix Margins Q3/21 Net Interest
Income
+5% YoYNIM
YoY: (7) bpsQoQ: (4) bpsSee slide 29
Net interest income: Strong volume growth offset by lower trading results
All-Bank Net Interest Income ($ millions)
Canadian Banking Net Interest Income ($ millions) City National Net Interest Income (US$ millions)
Net interest income down 2% YoY as strong volume growth was more than offset by lower spreads and lower trading revenue in Capital Markets
o Net interest income (ex-trading) was up 6%(1) due to strong volume growth in Canadian Banking and City National
All-bank NIM on average earning assets was up 2 bps YoY (up 1 bp QoQ)
Liquidity Coverage Ratio of 125%, down 8 pts QoQ
5,139 5,010 5,035
(36) %
+6 %
(2) %
YoY
Average YoY Volume Growth ($ billions)
+2 bps
4,854
City National (US$BN)
37
43
Residential mortgages
Deposits
Canadian Banking (C$BN)
2
2
14
Commercial loans
Other loans
Deposits
5,052
(1) This is a non-GAAP measure. For more information see slide 41.
(1)

Royal Bank of Canada11 Third Quarter 2021 Results
Interest rate sensitivity: Well positioned for rising interest rates
25 bps increase in interest rates
(1) Represents the 12-month revenue exposure (before-tax) to an immediate and sustained shift in interest rates. (2) Includes benefits from our sweep deposits.
Canadian
Banking$90 million
U.S. Wealth
Management (2)US$80 million
Short-term rates
(flattening curve)(1)
$175 million
Across the curve(1)
US$90 million
100 bps change in interest rates across the curve
Canadian dollar
impact$635 million
U.S. dollar
impact
All-bank
$367 million
$1,002 million
($616) million
($236) million
($852) million
As at July 31, 2021, an immediate and sustained +100 bps would
have had a positive impact to our net interest income of $1 billion over a 12-month period
The quarter-over-quarter change in NII sensitivity was largely attributable to deposit growth predominantly in Canada impacting
mainly the +100 bps shock, while the -100 bps shock remained relatively stable reflecting low prevailing interest rates
The below sensitivities are based upon exposures at a specific time, which can change in response to business activities and
management actions
Roughly half of the Canadian Banking and CNB deposit base is
non-interest bearing or low-rate deposits
Most of U.S. Wealth Management (including CNB) sensitivity to
higher interest rates is from the short-end of the curve
Increase(1) Decrease(1)Net Interest
income ($MM)Revenue ($MM)

Royal Bank of Canada12 Third Quarter 2021 Results
Non-interest income: Strong market-related performance across businesses
Non-Interest Income by Segment(1) ($ millions)
Q3/2021 Highlights
Non-interest income was down 1% YoY; up 7% net of
Insurance FV change(1)
Higher investment management & custodial fees and mutual
fund revenue, largely in Wealth Management and Canadian Banking
Record performance in Investment Banking reflecting robust fee activity in loan syndication and M&A
Lower trading revenue in Capital Markets as the prior year benefitted from elevated market volatility which drove robust
client activity, as well as tightening credit spreads resulting in mark-to-market gains (including reversals of loan underwriting
markdowns)
Higher service charges and card service revenue reflecting the
benefits of increased client activity
Other non-interest income:
Unfavourable change in the fair value of hedges related to our U.S. share-based compensation plans in U.S. Wealth
Management (U.S. WM WAP gains / losses)(6), which are largely offset in non-interest expense
Non-Interest Income(1) ($ millions)
7,229
6,784
54
64
246
-
(105)
(444)
94
536
Q3/21 Revenue (net of FV change)
Other non-interest income
Insurance (net of FV change)
Service charges & card service revenue
FX revenue, other than trading
Trading revenue
Underwriting, advisory & credit fees
Investment, brokerage & custodial fees
Q3/20 Revenue (net of FV change)(1)
(2)
(3)
(5)(6)
(4)
(1)
Mark
et-
rela
ted
U.S. WM WAPOther Misc.
(1) This is a non-GAAP measure. See note 13 on slide 38. (2) Comprised of investment management & custodial fees, Securities brokerage commissions and Mutual fund revenue. (3) Comprised of
Underwriting and other advisory fees and Credit fees. (4) Comprised of service charges and card service revenue. (5) See note 16 on slide 39. (6) This is a non-GAAP measure. See note 14 on slide 38.
$ millions (unless otherwise stated) Q3/2021Reported
YoY QoQ
Personal & Commercial Banking 1,445 14% 0%
Canadian Banking 1,378 15% 0%
Wealth Management 2,742 11% 1%
Wealth Management (Excl. WM WAP) (6) 2,691 17% 4%
U.S. WM WAP (6) 51 (67)% (62)%
Capital Markets 1,341 (5)% (16)%
Insurance (Net of FV change) 1,279 5% 16%
I&TS and Corporate Support 422 0% (8)%
Total (net of FV chg.) (1) 7,229 7% (1)%
Total (net of FV chg. & Excl. WAP) (1)(6) 7,178 8% 0%
(1)

Royal Bank of Canada13 Third Quarter 2021 Results
7.4%7.9%
0.4%
6.5%
-4.1%
2.6%
7.4%
0.6%
5.8%
2.9%
2.1%
0.4%
-2.9%-0.5% -0.4%
1.5%
Q4/19 Q1/20 Q2/20 Q3/20 Q4/20 Q1/21 Q2/21 Q3/21
Non-interest expense YoY growth
Non-interest expense YoY growth (excluding FX and growth in VC and SBC)
Non-interest expense: Disciplined expense management
Non-Interest Expense ($ millions) Q3/2021 Highlights
Non-interest expense was up 1% YoY
Down 1% YoY excluding variable and share-based compensation (which includes changes in U.S. WM WAP)(2)
Up 1.5% YoY growth excluding the impact of FX and the growth in variable and share-based compensation(3)
‒ Higher variable compensation commensurate with improved results in Wealth Management partly offset by lower variable
compensation in Capital Markets alongside lower revenues
Less favourable market conditions supported a change in the fair
value of our U.S. share-based compensation plans in U.S. Wealth Management (U.S. WM WAP (gains)/ losses)(2), largely offset in
Other revenue
Higher investments in technology and equipment spend to enable
sales and service
Lower occupancy costs across each segment, mainly reflecting
lower facility and cleaning costs6,420
6,380
(30)
9
(8)
(28)
18
(76)
181
(26)
Q3/21 Expenses
Other non-interest expenses
Professional fees
Occupancy
Marketing & travel costs
Equipment and amortization
U.S. WM WAP
Variable & share-basedcompensation (ex-U.S. WM WAP)
Salaries & Benefits
Q3/20 Expenses
+3% YoYNon-Interest Expense by Segment ($ millions)
+7% YoY
Com
pensatio
n
(1)
(2)
(1) See note 17 on slide 39. (2) This is a non-GAAP measure. See note 3 on slide 38. (3) This is a non-GAAP measure. See note 4 on slide 38.
$ millions (unless otherwise stated) Q3/2021Reported
YoY QoQ
Personal & Commercial Banking 1,998 1% 4%
Canadian Banking 1,849 2% 4%
Wealth Management 2,493 6% 0%
Wealth Management (Ex-U.S. WM WAP) (2) 2,434 9% 3%
U.S. WM WAP (2) 59 (56)% (52)%
Capital Markets 1,363 (7)% (7)%
Insurance 155 11% 11%
I&TS and Corporate Support 411 (3)% 14%
Total 6,420 1% 1%
Non-Interest Expense Growth (YoY)
(3)
(2)

Royal Bank of Canada14 Third Quarter 2021 Results
Strong revenue growth and operating leverage in Personal & Commercial Banking
1,367
1,9082,113
Q3/2020 Q2/2021 Q3/2021
55%
11%
Net Income ($ millions) Q3/2021 Highlights
Canadian Banking
$ millions (unless otherwise stated)Q3/2021
Reported
YoY QoQ
Revenue 4,463 8% 3%
Personal Banking 3,390 9% 2%
Business Banking 1,073 6% 4%
Non-Interest Expense 1,849 2% 4%
Pre-Provision, Pre-Tax Earnings(1) 2,614 13% 2%
Provision for Credit Losses (PCL) (122) ($636) ($157)
Net Income 2,024 52% 8%
ROE (2) 36.2% 9.9 pts 0.8 pts
Net Interest Margin 2.51% (7) bps (4) bps
Efficiency Ratio 41.4% (2.5)% 0.6%
Average loans & acceptances, net ($BN) 500.4 8% 2%
Average deposits ($BN) 489.0 10% 3%
Assets Under Administration ($BN)(3) 350.3 22% 5%
Number of employees (full-time equivalent) 34,498 5% 2%
Number of banking branches 1,189 (1)% 0%
Canadian Banking
Net income up 52% YoY
Pre-provision, pre-tax earnings up 13%(1) YoY
Revenue up 8% YoY
Net interest income up 5% YoY
Strong volume growth of 9% with average YoY deposit and
loan growth of 10% and 8%, respectively (see slide 26)
NIM of 2.51%, down 7 bps YoY, primarily due to lower interest
rates. NIM down 4 bps QoQ.
Non-interest income up 15% YoY
Higher mutual fund distribution fees driven by market appreciation and stronger net sales
Higher service charges, foreign exchange revenue, and card service revenue reflecting increased client activity
Expenses up 2% YoY
Higher staff-related costs, partially offset by the prior year impact of additional compensation for certain employees, primarily those
client-facing amidst the COVID-19 pandemic
Positive operating leverage: Q3/2021: 6.1%; YTD: 3.0%
Lower PCL YoY (see slides 20 & 22)
Caribbean & U.S. Banking
Net income of $89MM, up $52MM YoY, primarily due to lower PCL.
Revenue and expenses were also lower, mainly driven by the impact of FX translation, and the divestiture of our Eastern
Caribbean operations which closed in Q2/2021
(1) This is a non-GAAP measure. See note 5 on slide 38. (2) ROE does not have a standardized meaning under GAAP. See note 8 on slide 38. (3) Spot balances.

Royal Bank of Canada15 Third Quarter 2021 Results
562
691738
Q3/2020 Q2/2021 Q3/2021
Record results in Wealth Management driven by market performance and net sales
Net Income ($ millions) Q3/2021 Highlights
$ millions (unless otherwise stated) Q3/2021Reported
YoY QoQ
Revenue 3,424 8% 1%
Wealth Management (Non-U.S.) 1,781 18% 5%
U.S. Wealth Management 1,643 (1)% (3)%
Non-Interest Expense 2,493 6% 0%
Pre-Provision, Pre-Tax Earnings(1) 931 16% 4%
Provision for Credit Losses (PCL) (21) ($95) ($19)
Net Income 738 31% 7%
U.S. Wealth Management (see slide 31) 236 36% -
ROE(2) 18.1% 4.8 pts 0.9 pts
Efficiency Ratio 72.8% (1.8) pts (0.7) pts
Wealth Management (non-U.S.) 62.1% (2.9) pts (1.3) pts
Assets Under Administration ($BN)(5) 1,292.8 18% 5%
Assets Under Management ($BN)(5) 975.6 17% 6%
Average loans & acceptances, net ($BN) 83.8 3% 1%
Average deposits ($BN) 142.8 9% 2%
Net income up 31% YoY
Pre-provision, pre-tax earnings up 16%(1) YoY
Revenue increased 8% YoY (up 12% ex-U.S. WAP
gains/(losses)(3)
Wealth Management (non-U.S.) revenue up 18% YoY
Higher average fee-based client assets reflecting market
appreciation and net sales
U.S. Wealth Management (incl. CNB) revenue down 1% YoY
Revenue up 6% ex-U.S. WAP gains/(losses)(3)
Higher average fee-based client assets reflecting market
appreciation and net sales
Strong average volume growth of 12% in loans and 22% in
deposits (in US$)
Impact of foreign exchange translation
Lower spreads on net interest income
Expenses up 6% YoY
Expenses up 9% ex-U.S. WAP (gains)/losses(4)
Higher variable compensation
Higher staff-related costs in support of business growth and
higher technology-related costs
Impact of foreign exchange translation
Lower PCL YoY (see slides 20 & 22)
7%
31%
($ billions) Q3/2021 Q3/2020 Q2/2021
RBC GAM net sales (see slide 28) 10.2 10.4 14.7
(1) This is a non-GAAP measure. See note 5 on slide 38. (2) ROE does not have a standardized meaning under GAAP. See note 8 on slide 38. (3) This is a non-GAAP measure. See note 14 on slide 38.
(4) This is a non-GAAP measure. See note 3 on slide 38. (5) Spot balances.

Royal Bank of Canada16 Third Quarter 2021 Results
Net income up 8% YoY
Revenue down 21% YoY (up 5% net of Insurance FV
change)(1)
Change in fair value of investments backing policyholder
liabilities, which is largely offset in PBCAE
Impact of realized investment gains in the prior year
Longevity reinsurance growth and higher Canadian Insurance sales partially offset by lower International life volumes
PBCAE down 27% YoY
Change in fair value of investments backing policyholder liabilities, which is largely offset in revenue
Impact of new longevity reinsurance contracts
Lower claims costs mainly in our travel and disability products
Actuarial adjustments
Business growth in International Insurance
Expenses up 11% YoY
Higher legal costs as well as costs associated with ongoing efficiency initiatives
216 187
234
Q3/2020 Q2/2021 Q3/2021
Solid results in Insurance
Net Income ($ millions) Q3/2021 Highlights
$ millions (unless otherwise stated) Q3/2021Reported
YoY QoQ
Revenue 1,754 (21)% 227%
Revenue net of insurance FV change(1) 1,279 5% 16%
Non-Interest Expense 155 11% 11%
PBCAE 1,304 (27)% n.m. (2)
Pre-Provision, Pre-Tax Earnings(3) 295 3% 19%
Net Income 234 8% 25%
ROE(4) 39.5% 3.6 pts 7.4 pts
Net earned premiums 1,094 12% 18%
Premiums and deposits 1,321 17% 14%
Canadian Insurance 645 20% 15%
International Insurance 676 14% 12%
25%
8%
(1) This is a non-GAAP measure. See note 13 on slide 38. (2) Not meaningful. (3) This is a non-GAAP measure. See note 5 on slide 38. (4) ROE does not have a standardized meaning under GAAP. See
note 8 on slide 38.

Royal Bank of Canada17 Third Quarter 2021 Results
76
120
88
Q3/2020 Q2/2021 Q3/2021
Net income up 16% YoY
Revenue up 7% YoY
Higher funding and liquidity revenue as the prior year reflected
unfavourable impacts from interest rate movements and a heightened impact from elevated enterprise liquidity
Lower client deposit revenue, largely driven by margin compression
Expenses up 3% YoY
Higher technology-related costs
Investor & Treasury Services results impacted by lower deposit revenue
Net Income ($ millions) Q3/2021 Highlights
$ millions (unless otherwise stated) Q3/2021Reported
YoY QoQ
Revenue 517 7% (3)%
Non-Interest Expense 401 3% 7%
Pre-Provision, Pre-Tax Earnings(1) 116 21% (27)%
Provision for Credit Losses (PCL) (3) $1 ($1)
Net Income 88 16% (27)%
ROE(2) 11.1% 2.7 pts (3.2) pts
Efficiency ratio 77.6% (2.6) pts 7.4 pts
Assets Under Administration ($BN)(3) 4,704.4 5% 4%
Average deposits ($BN) 221.1 13% 0%
Client deposits 64.6 (2)% 1%
Wholesale funding deposits 156.5 20% 0%
(27)%
16%
(1) This is a non-GAAP measure. See note 5 on slide 38. (2) ROE does not have a standardized meaning under GAAP. See note 8 on slide 38. (3) Spot balances.

Royal Bank of Canada18 Third Quarter 2021 Results
949 1,071 1,129
Q3/2020 Q2/2021 Q3/2021
Record Investment Banking revenue in Capital Markets
Net Income ($ millions) Q3/2021 Highlights
19%
5%
Net income up 19% YoY
Pre-provision, pre-tax earnings down 14%(1) YoY
Revenue down 10% YoY
Corporate and Investment Banking revenue up 19% YoY
Record Investment Banking revenue driven by higher loan syndication and M&A activity across most regions
Lower fixed income trading revenue in the U.S. and Europe as the prior year included reversal of loan underwriting markdowns
QoQ: Higher loan syndication and M&A activity across most regions, partially offset by lower equity and debt origination fees
Global Markets revenue down 31% YoY
Lower fixed income trading revenue across all regions as the
prior year benefitted from increased client activity amidst elevated market volatility and tightening credit spreads
Lower equity trading revenue largely in the U.S. due to reduced client activity compared to the prior year which was
characterized by favourable market conditions
QoQ: Lower equity and fixed income trading revenue across
most regions as the current quarter saw softer results due to the impact of market normalization, albeit remaining above pre-
pandemic trading levels
Expenses down 7% YoY
Impact of foreign exchange translation and lower compensation on
decreased revenue
Lower PCL YoY (see slides 20 & 22)
$ millions (unless otherwise stated) Q3/2021Reported
YoY QoQ
Revenue 2,463 (10)% (9)%
Corporate and Investment Banking 1,289 19% 8%
Investment Banking 699 38% 11%
Lending and Other 590 3% 4%
Global Markets 1,232 (31)% (21)%
Equities 329 (20)% (30)%
FICC 642 (35)% (19)%
Repo & Secured Financing 261 (29)% (11)%
Non-Interest Expense 1,363 (7)% (7)%
Pre-Provision, Pre-Tax Earnings(1) 1,100 (14)% (12)%
Provision for Credit Losses (PCL) (337) ($415) ($210)
Net Income 1,129 19% 5%
ROE(2) 19.7% 4.0 pts 0.8 pts
Efficiency ratio 55.3% 1.8 pts 1.3 pts
Average loans & acceptances, net ($BN) 98.2 (16)% 1%
(1) This is a non-GAAP measure. See note 5 on slide 38. (2) ROE does not have a standardized meaning under GAAP. See note 8 on slide 38.

Graeme Hepworth
Chief Risk Officer
Risk Review

Royal Bank of Canada20 Third Quarter 2021 Results
3,471
6,115
5,525
5,033 4,867 4,867
146
(638)
(166)
ACL (Q1/20) Peak ACL
(Q4/20)ACL (Q2/21) PCL on Impaired Loans PCL on Performing
LoansNet write-offs, FX &
OtherACL (Q3/21)
ACL declining with improvements in macroeconomic and credit quality outlook
ACL on loans of $4.9 billion was down $658 million QoQ, and ACL as a percentage of loans and acceptances of 0.67% was down 12 bps QoQ
We continue to release reserves, which are down from a peak of 0.89% of loans and acceptances in Q4/20, in line with the economic
recovery. During the quarter, we saw pandemic-related government restrictions easing and significant progress on vaccine distribution
Our ACL remains above pre-pandemic levels of 0.53% of loans and acceptances. Uncertainty remains around the impact of the COVID-19 Delta variant, and defaults continue to be mitigated by government support programs
In Q3/21, we released $638 million of reserves on performing loans, which was ~2.5x our release last quarter, and reflects continued
improvements in our macroeconomic outlook and the credit quality of our portfolios during the quarter
The release of reserves on performing loans is primarily driven by Capital Markets ($284 million) and Canadian Banking ($281 million), primarily in the Cards and Personal Lending portfolios
Our year-to-date release of reserves on performing loans of $995 million represents ~40% of provisions built during Q2-Q4/2020
Movement in Allowance for Credit Losses on Loans ($ millions)
ACL to L&A0.89%
--
ACL to L&A0.67%
ACL to L&A0.53%
ACL to L&A0.79%

Royal Bank of Canada21 Third Quarter 2021 Results
GIL below pre-pandemic levels with new formations at 9-year lows
Gross Impaired Loans (GIL) ($ millions, bps)
New Formations ($ millions) (1) Net Formations ($ millions)
Total GIL decreased $216 million (down 5 bps QoQ)
Canadian Banking
GIL decreased $112 million, as muted new formations were more than
offset by relatively stable write-offs, in both our retail and commercial portfolios
Capital Markets
GIL decreased $94 million, due to the resolution of two previously impaired loans in the Real Estate and Related, and Mining and Metals
sectors
Wealth Management (including CNB)
GIL decreased $18 million, as muted new formations were more than offset by continued resolution of previously impaired loans (through
repayments or return to performing) at CNB
Key Drivers of GIL (QoQ)
-
-
(1) See note 18 on slide 39.
461
182 383 307
178
63
90 56 78
48
511
226 70 114
55
230
53 21 106
12
1,265
551 530 605
293
Q3/20 Q4/20 Q1/21 Q2/21 Q3/21
Canadian Banking Caribbean & U.S. Banking
Capital Markets Wealth Management
$3,857
$3,195 $2,872 $2,777 $2,561
57
47
41 40
35
Q3/20 Q4/20 Q1/21 Q2/21 Q3/21
2,777
2,561 2,561
293
(39)
(124)
(268)
(78)
Q2/21 GIL NewFormations
Returning toPerforming
Repayments Write-Offs Other Q3/21 GIL

Royal Bank of Canada22 Third Quarter 2021 Results
PCL on impaired loans lower for the fifth consecutive quarter
Total RBC ($ millions, bps) Wealth Management ($ millions, bps)
Canadian Banking ($ millions, bps) Capital Markets ($ millions, bps)
Lower provisions QoQ in Canadian Banking, partially offset by
lower recoveries QoQ in Capital Markets Provisions remain muted, with a $2 million net recovery in the
quarter
Retail: Lower provisions QoQ, primarily in personal lending and
small business. Provisions for residential mortgages and write-offs on cards were relatively stable QoQ
Commercial: Lower provisions QoQ, primarily due to reversals on
previously impaired accounts in the Automotive sector this quarter
In Q3/2021, a provision in the Transportation sector was more than
offset by net reversals in the Real Estate and Related, and Oil and Gas sectors
Lower recoveries QoQ, given higher reversals on previously impaired loans in the Oil and Gas and Other Services sectors last quarter
$398
$251 $218 $177 $146
23
1513
11
8
Q3/20 Q4/20 Q1/21 Q2/21 Q3/21
$43
$-$(27)
$3
$(2)
21
0
-13
2 -1
Q3/20 Q4/20 Q1/21 Q2/21 Q3/21
$264
$169 $217 $195
$161
23
14
1816
13
Q3/20 Q4/20 Q1/21 Q2/21 Q3/21
$73 $68
$18
$(29)$(16)
25 27
7
-13-7
Q3/20 Q4/20 Q1/21 Q2/21 Q3/21
$0

Royal Bank of Canada23 Third Quarter 2021 Results
Office25%
Retail21%Industrial &
Warehouse25%
Multi-family20%
Residential Construction
7%
Land Development2%
Commercial Real Estate (CRE) portfolio summary
Canada55%U.S.
31%
Other International
14%
(1) Loan to Value ratio is for mortgage-secured properties. (2) Other includes Insurance, I&TS and Corporate Support.
P&CB43%
Capital Markets
38%
Wealth Management
18%
Other1%
Office
2.1% of total
loans &
acceptances
Retail
1.7% of total
loans &
acceptances
Other
4.7% of total
loans &
acceptances
Stable rent collections and occupancy rates supporting low delinquency rates
Average LTV <65%(1)
Canadian Banking: 2/3rd of office exposure is to <$10 million loans; mostly low-rise
buildings outside of the downtown core of major urban centres
Capital Markets: exposure geographically diversified, with 80% current occupancy
10% of retail exposure to non-investment grade enclosed malls, where rent
collections have been lower due to store closures and reduced foot traffic
Majority of retail exposure to grocery-anchored open-air centres, where rent
collections have been strong aided by curb-side pick-ups and government rental relief programs
Multi-family segment least impacted by COVID-19; rent collection close to pre-
pandemic levels
Strong demand for Industrial & Warehouse, due in part to the growth in on-line
shopping
Q3/2021 Highlights
Exposure by Property Type
Exposure by Business Segment Exposure by Geography
CRE exposure of $61 billion at Q3/2021
accounts for 8.5% of total loans and acceptances
Remains well-diversified by geography, business, and property type
(2)

Appendices

Royal Bank of Canada25 Third Quarter 2021 Results
ESG performance highlights: Putting our Purpose into practice
Royal Bank of Canada is a purpose-driven, principles-led organization
Climate change: accelerating clean
economic growth
• Enterprise climate change strategy, RBC
Climate Blueprint, aims to support clients in the net-zero transition
• Joined pilot project on climate risk
scenarios stress testing led by the Bank of Canada and OSFI
• Joined PCAF(5) to advance the
measurement of our indirect emissions
• Committed to net-zero emissions in
our lending by 2050 and carbon neutral
in our global operations since 2017
• Over 125 organizations supported with
over $27 million in funding through RBC
Tech for Nature since 2019
Building & attracting talent
and driving a diverse &
inclusive culture
• 46% women executives(1) and
42% women(1) on RBC’s Board of Directors
• 21% of executives(1)(2) are
BIPOC
• #4 globally in the Refinitiv
Diversity & Inclusion Index,
ranking over 9,000 listed companies
• Increasing our staffing goals for
BIPOC executives from 20% to 30% with a focus on increasing
Black and Indigenous
representation(3)
Preparing youth for the
future of work
• Through RBC Future Launch,
we are dedicating $500
million over 10 years to help
young people gain meaningful employment through work
experience, skills
development and networking;
we have reached over 2.5 million(4) Canadian youth
through 500+ partner
programs since 2017
• Committed to investing $50
million from 2020 to 2025 to
create meaningful and
transformative pathways to prosperity for 25,000 BIPOC
youth(3)
Sustainable finance and
responsible investment
• $73.3 billion(4) in sustainable
finance in 2020, building towards our target of $500 billion by 2025
• Successfully completed a US$750
million Green Bond offering in Q3/2021, in partnership with a
syndicate of diverse-owned broker
dealers
• Focused strategy to integrate ESG
across all businesses in Capital
Markets led by a dedicated
Sustainable Finance Group
• Total value of socially responsible
investments and impact assets
under management grew to $12.5 billion(4)
How we deliver value
RBC is recognized as an “Outperformer” or “Leader” by our top tier ESG rating agencies(6) and indices, including:
ESG Risk Rating of
16.9 (low risk)“A” Rating
Banking industry ranking
in 98th percentile
Overall score 78
90th percentile
‘A-’ score for our
2020 Climate
Change response
(1) See note 19 on slide 39. (2) See note 20 on slide 39. (3) RBC’s Actions Against Systemic Racism. (4) As of FY2020. (5) The Partnership for Carbon Accounting Financials (PCAF). (6) See note 21 on slide 39.

Royal Bank of Canada26 Third Quarter 2021 Results
Percentage Change (1) YoY QoQ
Residential Mortgages 12.9% 3.1%
HELOC(3) (5.1)% (0.3)%
Other Personal 1.0% 0.5%
Credit Cards (2.4)% 3.1%
Business (Including Small Business) 2.5% 2.0%
243 255 259
203222 230
477489
Q3/2020 Q2/2021 Q3/2021
Strong volume growth in Canadian Banking
(1) Totals may not add and percentage change may not reflect actual change due to rounding. (2) Real estate secured lending (RESL) includes residential mortgages and HELOC. (3) Home Equity Line of
Credit.
Percentage Change (1) YoY QoQ
Personal Deposits 6.5% 1.8%
Business Deposits 13.1% 3.3%
2%
8%
3%
10%
Average Gross Loans & Acceptances(1) ($ billions) Average Deposits(1) ($ billions)
283 311 320
7876 76
8990 91
17 1617467
Q3/2020 Q2/2021 Q3/2021
504492 446
RESL(2)
10.9%
RESL(2)
2.7%

Royal Bank of Canada27 Third Quarter 2021 Results
7,527
7,873 7,876
Q3/20 Q2/21 Q3/21
87,994
111,616 111,634
Q3/20 Q2/21 Q3/21
94.5%93.5% 93.5%
Q3/20 Q2/21 Q3/21
Our 14MM+ Canadian Banking clients continue to adopt our digital channels
4,917
5,266 5,394
Q3/20 Q2/21 Q3/21
1,204 1,193 1,189
Q3/20 Q2/21 Q3/21
53.8%
56.8% 56.4%
Q3/20 Q2/21 Q3/21
(1) These figures (in 000s) represent the 90-Day Active customers in Canadian Banking only and are spot values. (2) Digital Adoption rate calculated using 90-day active users. (3) These figures (in 000s)
represent the total number of application logins using a mobile device. (4) Financial transactions only.
Active Mobile Users (000s)(1)Active Digital Users (000s)(1)
Self-Serve Transactions(4) BranchesMobile Sessions (000s)(3)
Digital Adoption Rate(2)
5% 260 bps 10%
27% (100) bps (1)%

Royal Bank of Canada28 Third Quarter 2021 Results
8.9
6.2
0.9
1.9 7.6
5.9
-0.8
2.0
4.0
0.4
-1.0 -0.6
Q3/2020 Q2/2021 Q3/2021
Long-Term Institutional Long-Term Canadian Retail
Money Market Institutional Money Market Canadian Retail
10.4 10.2
14.7
Strong net sales at RBC Global Asset Management
RBC Global Asset Management AUM(1) ($ billions) RBC Global Asset Management Net Sales($ billions)
255 293 310
109
111 112
73 62
67 83
93 98
Q3/2020 Q2/2021 Q3/2021
Canadian Retail Canadian Institutional
U.S. Institutional International Institutional
587559
520
5%
13%
Total
$35.3BN
Long-Term Canadian Retail
$21.5BN
Last 12 months ended Q3/2021
(1) See note 22 on slide 39.

Royal Bank of Canada29 Third Quarter 2021 Results
2.55%2.50% 2.51%(0.01%)
0.01%
Q2/21 NIM Asset mix Asset spreads Deposit
spreads &
Other
Deposit
growth
Q3/21 NIM
(0.02)%
2.29%
2.19%(0.07%) (0.02%) (0.01%)
Q2/21 NIM Asset Mix Investment
Yields
Other Q3/21 NIM
Movements in net interest margins
All-Bank Asset Yields(1)
Canadian Banking NIM on Average Earning Assets CNB NIM on Average Earning Assets
All-Bank Deposit Costs(2)
0.72%
0.63%0.58%
0.55% 0.48%
0.09% 0.09% 0.07% 0.06% 0.07%
1.41%
1.16% 1.15%1.09%
0.96%
Q3/2020 Q4/2020 Q1/2021 Q2/2021 Q3/2021
Total deposit costs
Personal chequing &
savings deposit costs
3.37% 3.34%3.28% 3.24%
3.16%
2.36%
1.93%
1.77%1.85%
1.79%
2.31%
2.27%2.15% 2.13% 2.09%
Q3/2020 Q4/2020 Q1/2021 Q2/2021 Q3/2021
Loan yield
Total earning asset yield
Term deposit costs
Securities yield
(1) See note 23 on slide 39. (2) See note 24 on slide 39.
(0.02)%

Royal Bank of Canada30 Third Quarter 2021 Results
42 76 7086
114 121
454
466 451
582
656 642
Q3/2020 Q2/2021 Q3/2021
Capital Markets & Other CNB U.S. Wealth Management (excl. CNB)
Solid results from our U.S. operations
Net Income (US$ millions)
Q3/2021 Highlights
US$ millions (unless otherwise stated) Q3/21 YoY QoQ
Revenue 2,453 2% (6)%
Pre-Provision, Pre-Tax Earnings(4) 672 (13)% (13)%
Provision for Credit Losses (PCL) (111) ($201) ($42)
PCL on Performing Loans (Stage 1 & 2) (89) ($99) ($32)
PCL on Impaired Loans (Stage 3) (2) ($80) $8
Net Income 642 10% (2)%
Adj. Pre-Provision, Pre-Tax Earnings(4)(5) 708 (12)% (13)%
Adj. Net Income(5) 668 10% (2)%
Pre-Provision, Pre-Tax Earnings (C$) (4) 827 (21)% (15)%
Net Income (C$MM) 792 0% (4)%
Adj. Pre-Provision, Pre-Tax Earnings (C$)(4)(5) 871 (21)% (14)%
Adj. Net Income (C$)(5) 825 (0)% (3)%
The U.S. represented 20% or over $3BN of total bank net income
over the last 12 months(2)(6)
Q3/2021 U.S. earnings were up 10% YoY, largely due to lower
PCL
The U.S. represented 26% of total bank revenue in the last 12
months, benefiting from record Capital Markets revenue, strong volume growth and higher fee-based client assets(2)(6)
Q3/2021 U.S. revenue was up 2% YoY, with higher Wealth Management revenue partly offset by lower Capital Markets
revenue
U.S. PCL on loans ratio of (40) bps versus (31) bps at Q2/2021
U.S. Operations Revenue (US$ billions)(2)
WM (ex-CNB NII)
37%
CNB Net Interest Income
18%
Capital Markets
45%
Other(3)
<0.5%
Total U.S.
$9.8 billion
Last 12 months ended Q3/2021
(2%)
10%
(1)
(1) Capital Markets and Other net income includes U.S. portions of U.S. Banking, Capital Markets, Wealth Management excluding U.S. Wealth Management (including CNB), Insurance and I&TS. (2) This
is a non-GAAP measure. See note 25 on slide 39. (3) Other revenue includes U.S. portions of U.S. Banking, Insurance and I&TS. (4) This is a non-GAAP measure. See note 5 on slide 38. (5) This is a
non-GAAP measure. See note 26 on slide 39. (6) Based on C$ figures.

Royal Bank of Canada31 Third Quarter 2021 Results
Net income up 49%YoY
Pre-provision, pre-tax earnings(4) up 2% YoY
Revenue up 9% YoY
Revenue up 17% ex-U.S. WAP gains/(losses)(2)
Higher average fee-based client assets reflecting market appreciation and net sales
Net interest income at CNB up 9% YoY
CNB Wholesale loans up 6% YoY
CNB Retail loans up 13% YoY, largely due to strong growth in residential mortgages
CNB Deposits up 23% YoY
CNB NIM down 25 bps YoY (down 10 bps QoQ)
Expenses up 11% YoY
Expenses up 17% ex-U.S. WAP gains/(losses)(3)
Higher expenses, mostly variable compensation due to higher revenue and improved business results
Lower PCL YoY (see slides 20 & 22)
Strong client-driven growth in U.S. Wealth Management (incl. CNB)
Q3/2021 Highlights (US$)Net Income (US$ millions)
US$ millions (unless otherwise stated)(1) Q3/2021 YoY QoQ
Revenue 1,334 9% (2)%
Revenue excl. U.S. WAP gains/(losses )(2) 1,293 17% 3%
Expenses 1,126 11% (1)%
Expenses excl. U.S. WAP (gains)/losses (3) 1,078 17% 4%
Pre-Provision, Pre-Tax Earnings(4) 208 2% (7)%
Adjusted Pre-Provision, Pre-Tax Earnings(4)(5) 244 2% (6)%
Provision For Credit Losses (15) ($70) ($13)
Net Income 191 49% 1%
Adjusted Net Income(5) 217 40% 0%
Assets Under Administration (AUA) $BN 553 27% 4%
Assets Under Management (AUM) $BN 175 30% 5%
CNB Net Interest Income 449 9% 4%
CNB NIM 2.19% (25) bps (10) bps
CNB Average Wholesale Loans ($BN) 36 6% (3)%
CNB Average Retail Loans ($BN) 17 13% 0%
CNB Average Deposits ($BN) 75 23% 6%
CNB Net Income 121 41% 6%
CNB Adjusted Net Income(5) 147 30% 5%
128190 191
Q3/2020 Q2/2021 Q3/2021
1%
49%
(1) All balance sheet figures (except for AUA and AUM) represent average balances. (2) This is a non-GAAP measure. See note 27 on slide 40. (3) This is a non-GAAP measure. See note 28 on slide 40.
(4) This is a non-GAAP measure. See note 5 on slide 38. (5) This is a non-GAAP measure. See note 26 on slide 39.

Royal Bank of Canada32 Third Quarter 2021 Results
30 26 27
51
35 35
20
19 18
510 580 635
Q3/2020 Q2/2021 Q3/2021
Other International U.S.
Canada Lending & Syndication Revenue
(1)
598 704 659
1,518 1,5121,341
481 387342
151 115121
2,748 2,7182,463
Q3/2020 Q2/2021 Q3/2021
Canada U.S. U.K. & Europe Australia, Asia & Other
Capital Markets revenue and loan breakdown by geography
101
80
Capital Markets Revenue Breakdown by Geography ($ millions)
Capital Markets Lending & Syndication Revenue ($ millions) & Average Loans Outstanding by Region(1)
($ billions)
80
Average loans outstanding have decreased since last year compared
to elevated client demand during the peak of the pandemic
While many of these facilities have been repaid, we continue to
deepen client relationships including financing to support their strategic objectives
Robust M&A activity has propelled an increase in Loan Syndication revenues over the last few quarters
Approximately 57% of our total Capital Markets exposure(2) is investment grade
Canada: Up YoY mainly driven by increases in M&A, equity
origination and loan syndication activities, partially offset by lower fixed income and commodities trading
U.S.: Down YoY, driven by lower fixed income and equity trading, partially offset by higher loan syndication and M&A
U.K. & Europe: Down YoY, mainly due to lower fixed income trading and debt origination
Australia, Asia & Other: Down YoY, driven by decreases in equity trading, equity origination, and fixed income trading
(1) This is a non-GAAP measure. See note 29 on slide 40. (2) Total exposure represents exposure at default (EAD) which is the expected gross exposure upon the default of an obligor.

Royal Bank of Canada33 Third Quarter 2021 Results
PCL and GIL ratios lower QoQ across all portfolios, reflecting low new formations, due in part
to the impact of ongoing government support
<6203%
620-680
6% 681-720
10%
>72081%
1117
25
12 14
5
7
9
77
0
5
10
15
20
25
30
35
40
Q3/20 Q4/20 Q1/21 Q2/21 Q3/21
30-59 Days 60-89 Days
Strong underlying credit quality in Canadian Banking (CB)
Canadian Banking PCL on Impaired Loans and Gross Impaired Loans
CB Delinquencies By Days Past Due (bps) (5) CB 30-89 Day Delinquencies by Product (bps) (5)
30-89 day delinquencies of 21 bps increased 2 bps QoQ, with the
increase coming in loans 30-59 days past due
Q3/21 AvgLoan
Balances ($BN)
PCL on Impaired Loans (bps) (1)
Gross Impaired Loans(bps)
AvgFICO Score (Q3/21)Q3/20 Q2/21 Q3/21 Q3/20 Q2/21 Q3/21
Residential Mortgages (2) 320.1 1 1 1 17 16 14 792
Personal Lending 76.0 42 37 26 34 28 23 780
Credit Cards 16.5 250 203 186 66 (3) 78 (3) 57 (3) 744
Small Business (4) 11.5 100 30 14 172 104 92 n.a.
Commercial (4) 79.9 26 18 12 70 69 64 n.a.
Total 504.0 23 16 13 30 28 25 788
CB Retail FICO Score Distribution (Q3/21)
Credit quality remains high with just 3% of the
portfolio with a FICO score below 620
788 weighted
average
(1) See note 30 on slide 40. (2) Includes $11BN of mortgages on multi-unit residential buildings originated in P&CB Business Banking. (3) Represents 90+ Days Past Due, as there are no GIL balances for
Credit Cards. (4) In Q2/21, following capital treatment guideline change, ~$5.4BN of exposure previously classified as Commercial was reclassified as Small Business exposure. (5) See note 31 on slide 40.
0
20
40
60
80
100
120
140
160
Residential
MortgagesHELOCs Personal
Lending
(Excluding
HELOCs)
Cards Small
BusinessCommercial
Q3/20 Q4/20 Q1/21 Q2/21 Q3/21
Commercial and small business delinquencies were up QoQ, but are
lower YoY, and remain at or below pre-pandemic levels
Royal Bank of Canada34 Third Quarter 2021 Results
21%
21%50%
33% 47% 49%
79%
79%50%
67%
53% 51%
$63.4
$41.4 $39.7
$19.8 $17.1
Ontario B.C. &
Territories
Alberta Quebec Manitoba &
Sask.
Atlantic
Insured Uninsured
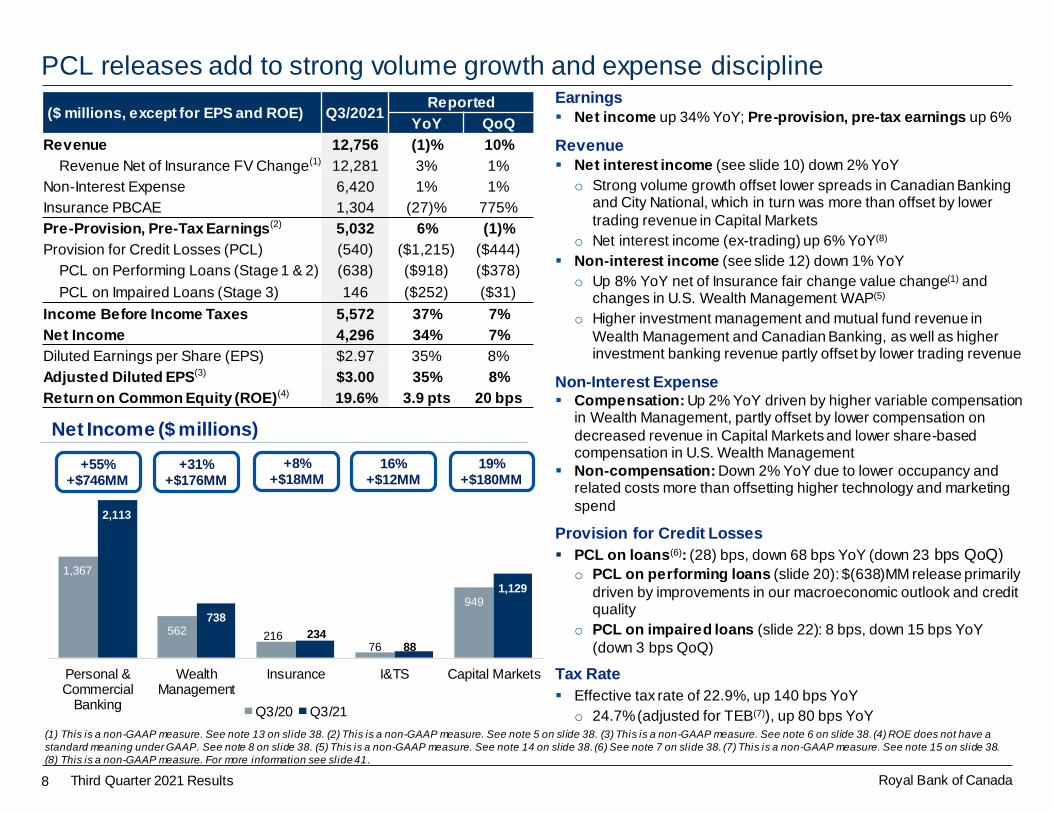
Canadian residential portfolio has strong underlying credit quality
Strong underlying quality of uninsured residential lending portfolio(1)
53% of uninsured portfolio have a FICO score >800
GTA and GVA average FICO scores remain above the Canadian average
Only 1.4% of our residential lending portfolio has an LTV >80% and FICO score of 720 or lower, and is predominately all insured
Condominium outstanding balance is 11% of residential lending portfolio
Canadian Residential Mortgage Portfolio(2) ($ billions)
Q3/2021 Highlights Canadian Banking Residential Lending Portfolio(1)
Total $349BN Uninsured $275.3BN
Mortgage $314BN $240.3BN
HELOC $35BN $35BN
LTV (2) 49% 47%
GVA 45% 45%
GTA 46% 46%
Average FICO Score(1) 801 806
90+ Days Past Due(1)(3) 15 bps 11 bps
GVA 9 bps 9 bps
GTA 6 bps 6 bps
LTV(1)
47% 46% 59% 51% 52% 51%
$100.0
(29%)
$246.0
(71%)
Canadian Banking Residential Lending Portfolio(1)
41%
23%
16%
3%
0% 10% 20% 30% 40% 50%
<50%
50%-65%
65%-80%
>80%
% of Total Canadian Banking Residential Lending Portfolio
>720
681-720
620-680
<620
LTV (2)
FICO Scores
(1) See note 32 on slide 40. (2) See note 33 on slide 40. (3) The 90+ day past due rate includes all accounts that are either 90 days or more past due or are in impaired status.
$164.6

Royal Bank of Canada35 Third Quarter 2021 Results
Product Stage 1 Stage 2 Stage 1 & 2 Stage 3 Total ($BN) Stage 1 Stage 2 Stage 1 & 2 Stage 3 Total ($BN)
Residential mortgages 97.8% 2.0% 99.8% 0.2% 357.8 98.5% 1.3% 99.8% 0.2% 370.5
Other Retail 89.5% 10.2% 99.7% 0.3% 118.2 90.7% 9.1% 99.7% 0.3% 121.2
Personal 91.6% 8.1% 99.7% 0.3% 90.5 92.4% 7.3% 99.8% 0.2% 92.2
Credit cards 80.9% 19.1% 100.0% 0.0% 16.6 84.1% 15.9% 100.0% 0.0% 17.4
Small business 85.0% 13.9% 99.0% 1.0% 11.1 86.3% 12.8% 99.1% 0.9% 11.6
Retail 95.7% 4.0% 99.8% 0.2% 476.0 96.6% 3.2% 99.8% 0.2% 491.6
Wholesale 88.7% 10.5% 99.2% 0.8% 212.8 91.3% 8.0% 99.3% 0.7% 219.5
Total Loans 93.6% 6.0% 99.6% 0.4% 688.7 94.9% 4.7% 99.6% 0.4% 711.1
Q3 / 2021
% of Loans & Acceptances% of Loans & Acceptances
Q2 / 2021
Product Stage 1 Stage 2 Stage 1 & 2 Stage 3 Total Stage 1 Stage 2 Stage 1 & 2 Stage 3 Total
Residential mortgages 0.1% 2.1% 0.1% 22.0% 0.14% 0.1% 2.2% 0.1% 23.2% 0.12%
Other Retail 0.8% 12.9% 2.1% 38.4% 2.20% 0.8% 12.2% 1.8% 39.0% 1.92%
Personal 0.6% 9.2% 1.3% 41.4% 1.41% 0.6% 8.9% 1.2% 42.7% 1.28%
Credit cards 2.4% 25.6% 6.8% - 6.84% 1.9% 24.7% 5.5% - 5.54%
Small business 0.9% 4.6% 1.4% 31.9% 1.70% 0.9% 3.8% 1.3% 31.8% 1.55%
Retail 0.2% 8.9% 0.6% 27.7% 0.65% 0.2% 9.1% 0.5% 28.3% 0.56%
Wholesale 0.4% 4.8% 0.9% 30.6% 1.14% 0.3% 5.3% 0.7% 31.9% 0.95%
Total ACL 0.3% 6.7% 0.7% 29.5% 0.79% 0.3% 7.1% 0.6% 30.5% 0.67%
Q3 / 2021
% of Loans & Acceptances% of Loans & Acceptances
Q2 / 2021
ACL coverage: Lower-risk residential mortgages a large part of our balance sheet
(1)
(1)
Allocation of ACL by Product
Allocation of Loans By Product Within Each IFRS 9 Stage
(1)
(1)
(1) See note 34 on slide 40.

Royal Bank of Canada36 Third Quarter 2021 Results
Market risk trading revenue and VaR
($ millions)
During Q3/2021, there were no days with net trading losses
VaR remained stable QoQ
The historical period used to compute VaR covers the past 2 years
(1) Includes loan underwriting commitments.
-120
-100
-80
-60
-40
-20
0
20
40
60
80
Trading Revenue (1) VaR(1)

Royal Bank of Canada37 Third Quarter 2021 Results
Impact of foreign currency translation
Estimated impact of foreign currency translation on key income statement items
Relevant average exchange rates that impact our business
(1) Average amounts are calculated using month-end spot rates for the period.
Q3/21 vs. Q3/21 vs.
Q3/20 Q2/21
Increase (decrease):
Total revenue (347) (63)
PCL 12 -
Non-interest expense (249) (46)
Income taxes (20) (3)
Net income (90) (14)
Impact on EPS
Basic (0.06) (0.01)
Diluted (0.06) (0.01)
(Millions of Canadian dollars,
except per share amounts)
For the three months ended
Q3/20 Q2/21 Q3/21 YoY QoQ
U.S. dollar 0.737 0.798 0.812 10% 2%
British pound 0.585 0.577 0.581 -1% 1%
Euro 0.648 0.669 0.678 5% 1%
(Average foreign currency
equivalent of C$1.00) (1)
For the three months ended

Royal Bank of Canada38 Third Quarter 2021 Results
Additional Notes (slides 3 to 11)Slide 3
1. Return on Average Tangible Common Shareholders’ Equity (ROTCE) does not have a standardized meaning under GAAP and may not be comparable to similar measures disclosed by other financial institutions. Net income available to shareholders excluding the after-tax impact of amortization and write down of other intangibles (excluding software) and goodwill divided by average tangible common equity. ROTCE is based on actual balances of average tangible common equity before rounding. This is a non-GAAP measure. For more information, see slide 41.
2. Revenue net of insurance fair value change of investments backing policyholder liabilities (Q3/21: $475MM; Q3/20: $997MM). This is a non-GAAP measure. For more information, see slide 41.
3. Non-interest expense YoY growth excluding variable and stock based compensation, including changes in U.S. Wealth Management wealth accumulation plans (WAP Q3/21: $59MM; Q2/21: $124MM, Q3/20: $135MM) is a non-GAAP measure. For more information, see slide 41.
4. Non interest expense YoY growth excluding the impact of FX and the growth in variable and share-based compensation is a non-GAAP measure. For more information, see slide 41.
5. Pre-provision, pre-tax earnings is calculated as income before income taxes and PCL. This is a non-GAAP measure. For more information, see slide 41.
6. Adjusted for (i) after-tax effect of amortization of other intangibles (Q3/21: $47MM; Q2/21: $46MM; Q3/20: $47MM) and (ii) dilutive impact of exchangeable shares (Q3/21: $nil; Q2/21: $nil; Q3/20: $4MM). These are non-GAAP measures. For more information, see slide 41.
7. PCL on loans ratio is calculated using PCL on loans as a percentage of average net loans and acceptances.
8. Return on equity (ROE) does not have a standardized meaning under GAAP and may not be comparable to similar measures disclosed by other financial institutions. For more information, see slide 41.
Slide 6
9. CB NIR Yield is defined as Canadian Banking non-interest income divided by average earning assets. This metric does not have a standardized meaning and may not be comparable to similar measures disclosed by other financial institutions. For more information, see slide 41.
10 CB Revenue Yield is defined as Canadian Banking total revenue divided by average earning assets. This metric does not have a standardized meaning and may not be comparable to similar measures disclosed by other financial institutions. For more information, see slide 41.
11. CB Risk-adjusted NIM is defined as Canadian Banking net interest income less PCL on impaired loans divided by average earning assets. This metric does not have a standardized meaning and may not be comparable to similar measures disclosed by other financial institutions. For more information, see slide 41.
12. CB Risk-adjusted revenue yield is defined as Canadian Banking revenue less PCL on impaired loans divided by average earning assets. This metric does not have a standardized meaning and may not be comparable to similar measures disclosed by other financial institutions. For more information, see slide 41.
Slide 8
13. Revenue and non-interest income net of Insurance fair value change of investments backing policyholder liabilities (Q3/21: $475MM; Q2/21: -$568MM; Q3/20: $997MM). This is a non-GAAP measure. For more information, see slide 41.
14. Revenue and non-interest income net of U.S. Wealth Management wealth accumulation plans (WAP) gains/(losses), which was $51MM in Q3/21, $134MM in Q2/21 and $156MM in Q3/20. This is a non-GAAP measure. For more information, see slide 41.
15. Effective tax rate adjusted for TEB (Q3/21: $130MM Q2/21: $135MM, Q3/20: $126MM) is a non-GAAP measure. For more information, see slide 41.

Royal Bank of Canada39 Third Quarter 2021 Results
Additional Notes (slides 12 to 30)Slide 12
16. Comprised of Net gain on investment securities, Share of profit (loss) in joint ventures and associates, U.S. WM wealth accumulation plans (WAP) gains / (losses) and Other.
Slide 13
17. Other non-interest expenses include YoY change in non-interest expense from the following line items: Telecommunications, Postage and courier, Stationery and printing, Business and capital taxes, Employee training, Donations, Outsourced item processing, Impairment of other intangibles, Impairment of investments in joint ventures and associates and Other.
Slide 21
18. New formations for collectively assessed portfolios in Canadian Banking and Caribbean Banking are net of amounts returned to performing, repayments, sales, FX, and other movements, as amounts are not reasonably determinable.
Slide 25
19. Represents data as at October 30, 2020 for our businesses in Canada governed by the Employment Equity Act (Canada); Board composition is reflective as of February, 2021.
20. Based on employee self-identification and aligned to the definitions of the Employment Equity Act in Canada.
21. Includes Sustainalytics, FTSE4Good, MSCI, Vigeo EIRIS and S&P Corporate Sustainability Assessment. As of FY2020.
Slide 28
22. Spot balances.
Slide 29
23. Loan yield is calculated as interest income on loans as a percentage of average total net loans. Total earning asset yield is calculated as interest income on assets as a percentage of average total earning assets. Securities yield is calculated as interest and dividend income on securities as a percentage of average securities, net of applicable allowance. These metrics do not have a standardized meaning and may not be comparable to similar measures disclosed by other financial institutions. For more information, see slide 41.
24. Total deposit costs is calculated as interest expense on deposits and other as a percentage of average deposits. Term-deposit costs is calculated as interest expense on term-deposits as a percentage of average term-deposits. Personal chequing & savings deposit costs is calculated as interest expense on personal chequing & savings deposits as a percentage of average personal chequing & savings deposits. These metrics do not have a standardized meaning and may not be comparable to similar measures disclosed by other financial institutions. For more information, see sl ide 41.
Slide 30
25. Excludes Corporate Support. Revenue is on a Tax Equivalent Basis (TEB). These are non-GAAP measures. For more information, see slide 41.
26. Adjusted net income and adjusted pre-provision, pre-tax earnings for every quarter excludes CNB’s amortization of intangibles, which were US$26MM/C$33MM after-tax (US$36MM/C$44MM before-tax) in Q3/2021, US$26MM/C$33MM after-tax (US$36MM/C$45MM before-tax) in Q2/2021 and US$27MM/C$37MM after-tax (US$37MM/C$50MM before-tax) in Q3/2020. This is a non-GAAP measure. For more information, see slide 41.
Royal Bank of Canada40 Third Quarter 2021 Results
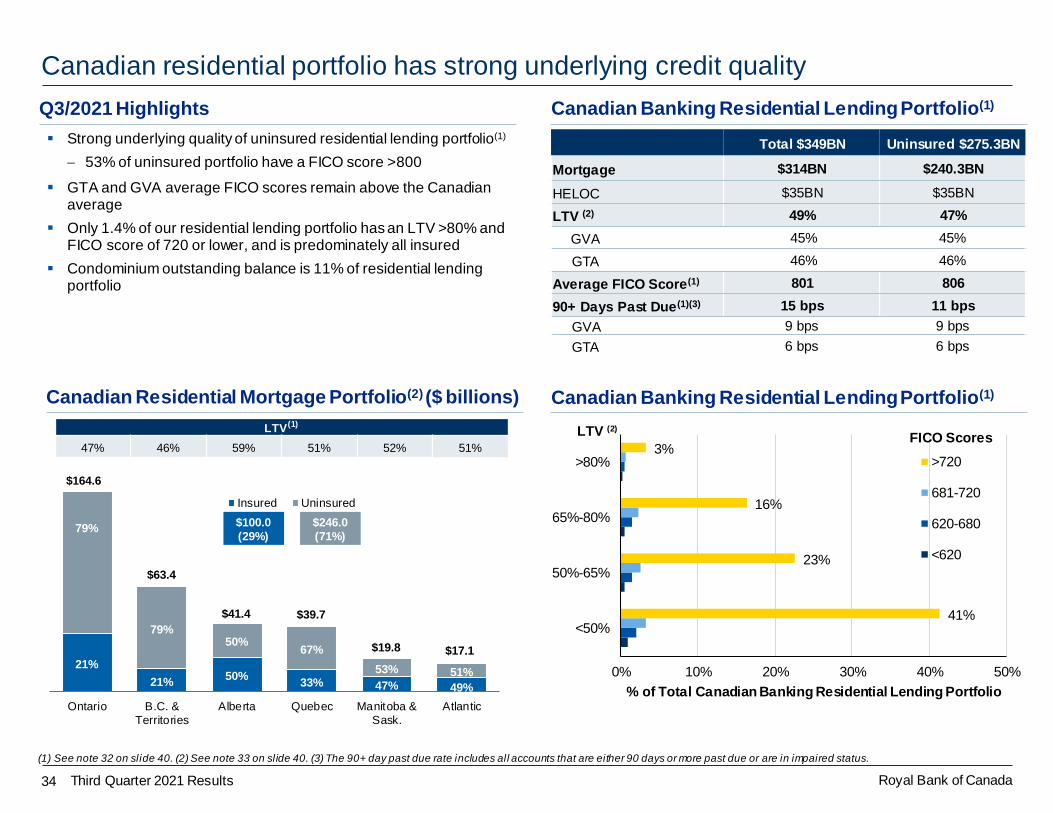
Additional Notes (slides 31 to 37)Slide 31
27. Revenue net of U.S. Wealth Management wealth accumulation plans (WAP) gains/(losses) which where US$41MM in Q3/21, US$108MM in Q2/21 and US$115MM in Q3/20, is a non-GAAP measure. For more information, see slide 41.
28. Expenses net of U.S. Wealth Management WAP (gains)/losses, which were US$48MM in Q3/21, US$99MM in Q2/21 and US$100MM in Q3/20, is a non-GAAP measure. For more information, see slide 41.
Slide 32
29. Average loans outstanding includes wholesale loans, acceptances, and off balance sheet letters of credit and guarantees for our Capital Markets portfolio, on a single name basis. Excludes mortgage investments, securitized mortgages and other non-core items. This is a non-GAAP measure. For more information, see slide 41.
Slide 33
30. Calculated using average net of allowance on impaired loans.
31. Includes restrained accounts, where loans 30-59 days past due result from administrative processes, such as mortgage loans where payments have been restricted pending payout due to sale or refinancing.
Slide 34
32. Based on $314.0BN in residential mortgages with non-commercial clients and $35.0BN in HELOC in Canadian Banking. Based on spot balances. Totals may not add due to rounding. Weighted by mortgage balances and adjusted for property values based on the Teranet – National Bank National Composite House Price Index.
33. Canadian residential mortgage portfolio of $346.0BN comprised of $314.0BN of residential mortgages in Canadian Banking, $2.6BN in other Canadian business platforms, $11.2BN of mortgages with commercial clients ($7.8BN insured) and $18.2BN of residential mortgages in Capital Markets held for securitization purposes (all insured).
Slide 35
34. Items not subject to impairment are loans held at FVTPL: Residential mortgages (Q3/21: $252MM, Q2/21: $243MM); Wholesale (Q3/21: $10.6BN, Q2/21: $8.6BN).

Royal Bank of Canada41 Third Quarter 2021 Results
Note to users
Investor Relations Contacts
We use a variety of financial measures to evaluate our performance. In addition to generally accepted accounting principles ( GAAP) prescribed
measures, we use certain key performance and non-GAAP measures we believe provide useful information to investors regarding our financial condition and result of operations. Readers are cautioned that key performance measures, such as ROE and non-GAAP measures, including results
excluding Corporate Support, adjusted earnings per share, pre-provision, pre-tax earnings, adjusted pre-provision and pre-tax earnings, Capital Markets average loans and acceptances excluding certain items, revenue, expenses, non-interest income and non-interest expense excluding
various items, City National adjusted net income and effective tax rate adjusted for TEB do not have any standardized meanings prescribed by GAAP, and therefore are unlikely to be comparable to similar measures disclosed by other financial institutions.
Additional information about our ROE and non-GAAP measures can be found under the “Key performance and non-GAAP measures” sections of our Q3/2021 Report to Shareholders and 2020 Annual Report.
Definitions can be found under the “Glossary” sections in our Q3/2021 Supplementary Financial Information and our 2020 Annual Report.
Nadine Ahn, SVP Wholesale Finance and Investor Relations (416) 974-3355Asim Imran, Vice President, Investor Relations (416) 955-7804Marco Giurleo, Senior Director, Investor Relations (416) 955-2546
www.rbc.com/investorrelations