Embed Size (px)
Citation preview
Investor Relations
Royal Bank of Canada Fixed Income PresentationQ1/2014
All amounts are in Canadian dollars. Financial information is based on financial statements prepared in compliance with International Accounting Standard 34 Interim Financial Reporting and is presented on a consolidated basis unless otherwise noted. Our Q1 2014 Report to Shareholders and Supplementary Financial Information are available on our website at rbc.com/investorrelations.
1Investor Relations – Fixed Income Presentation
Caution regarding forward-looking statements
From time to time, we make written or oral forward-looking statements within the meaning of certain securities laws, including the “safe harbour” provisions of the United States Private Securities Litigation Reform Act of 1995 and any applicable Canadian securities legislation. We may make forward-looking statements in this RBC Fixed Income Presentation, in filings with Canadian regulators or the United States (U.S.) Securities and Exchange Commission, in reports to shareholders and in other communications. Forward-looking statements in this Fixed Income Presentation include, but are not limited to, statements relating to our financial performance, objectives, vision and strategic goals, the housing market in Canada and the Canadian economy. The forward-looking information contained in this presentation is presented for the purpose of assisting the holders of our securities and financial analysts in understanding our financial position and results of operations as at and for the periods ended on the dates presented, and our financial performance, objectives, vision and strategic goals and priorities, and may not be appropriate for other purposes. Forward-looking statements are typically identified by words such as “believe”, “expect”, “foresee”, “forecast”, “anticipate”, “intend”, “estimate”, “goal”, “plan” and “project” and similar expressions of future or conditional verbs such as “will”, “may”, “should”, “could” or “would”.
By their very nature, forward-looking statements require us to make assumptions and are subject to inherent risks and uncertainties, which give rise to the possibility that our predictions, forecasts, projections, expectations or conclusions will not prove to be accurate, that our assumptions may not be correct and that our financial performance objectives, vision and strategic goals, the Canadian economy and the Canadian housing market will not be achieved. We caution readers not to place undue reliance on these statements as a number of risk factors could cause our actual results to differ materially from the expectations expressed in such forward-looking statements. These factors – many of which are beyond our control and the effects of which can be difficult to predict – include: credit, market, liquidity and funding, insurance, regulatory compliance, operational, strategic, reputation and competitive risks and other risks discussed in the Risk management and Overview of other risks sections of our 2013 Annual Report; the impact of regulatory reforms, including relating to the Basel Committee on Banking Supervision’s (BCBS) global standards for capital and liquidity reform, the Dodd-Frank Wall Street Reform and Consumer Protection Act and the regulations issued and to be issued thereunder, over-the-counter derivatives reform, the payments system in Canada, the U.S. Foreign Account Tax Compliance Act (FATCA), and regulatory reforms in the United Kingdom (U.K.) and Europe; the high levels of Canadian household debt; cybersecurity; the business and economic conditions in Canada, the U.S. and certain other countries in which we operate; the effects of changes in government fiscal, monetary and other policies; our ability to attract and retain employees; the accuracy and completeness of information concerning our clients and counterparties; the development and integration of our distribution networks; model, information technology and social media risk; and the impact of environmental issues.
We caution that the foregoing list of risk factors is not exhaustive and other factors could also adversely affect our results. When relying on our forward- looking statements to make decisions with respect to us, investors and others should carefully consider the foregoing factors and other uncertainties and potential events. Material economic assumptions underlying the forward looking-statements contained in this Fixed Income Presentation are set out in the Overview and outlook section and for each business segment under the heading Outlook and priorities in our 2013 Annual Report, as updated by the Overview section in our Q1 2014 Report to Shareholders. Except as required by law, we do not undertake to update any forward-looking statement, whether written or oral, that may be made from time to time by us or on our behalf.
Additional information about these and other factors can be found in the Risk management and the Overview of other risks sections in our 2013 Annual Report and in the Risk management section of our Q1 2014 Report to Shareholders.
Information contained in or otherwise accessible through the websites mentioned does not form part of this Fixed Income Presentation . All references in this Fixed Income Presentation to websites are inactive textual references and are for your information only.

Investor Relations
Canadian EconomySECTION I

3Investor Relations – Fixed Income Presentation
-30
-9
3 614
208 7 9
2
-6
-56
-33-26
-19-17
-3
6 8 8 1013 1410
'95-
96'9
6-97
'97-
98'9
8-99
'99-
00'0
0-01
'01-
02'0
2-03
'03-
04'0
4-05
'05-
06'0
6-07
'07-
08'0
8-09
'09-
10'1
0-11
'11-
12'1
2-13
'13-
14F
'14-
15F
'15-
16F
'16-
17F
'17-
18F
'18-
19F
(1) World Economic Forum, 2013. (2) National statistics offices, RBC Economics Research.
Strong fiscal position
Canadian Government Budget Balance(3)
($ billion)
Strong rating as a result of fiscal prudence, conservative bank lending practices and solid economy
Lowest net debt to GDP ratio among G-7 peers
Proactively responded to crisis with strong fiscal stimulus and monetary policy
#1 for soundness of banks for the 6th consecutive year(1)
G7 Net debt as a % of nominal GDP(4)
2012
Gov Net Debt (% of GDP)
xItaly
100% 35%50%140%
AA‐
A+
A
BBB+
x
xJapan
UK
x
USA
xFrance
AAA
AA+
Canadax
Germanyx
S&P Rating1.3
1.7 1.82.2
2.6
1.9
1.30.9
0.4
Italy
Japa
n
Ger
man
y
Fran
ce
U.K
.
U.S
.
Can
ada
Cda
201
3F
Cda
201
4F
G7 Real GDP Growth (%)(2)
2000-2012
(3) Department of Finance Canada, RBC Economics Research.(4) S&P, International Monetary Fund (IMF), RBC Economics Research.
75%

4Investor Relations – Fixed Income Presentation
62
63
64
65
66
67
68
69
1990 1992 1994 1996 1998 2000 2002 2004 2006 2008 2010 2012 2014
3
5
7
9
11
13
15
1990 1992 1994 1996 1998 2000 2002 2004 2006 2008 2010 2012 2014
Attractive economic fundamentals
11%
11%
11%
4%
20%13%
7%
7%
8%
9%
Finance, Insurance & Real Estate
Manufacturing
Wholesale and Retail Trade
Scientific, Technical & Educational Serv.
Public Administration and Utilities
Mining, Oil & gas extractions
Construction
Health Care
Transportation, Warehousing
Other
Labour Force Participation Rate(2)
U.S.Canada
A diversified economy resulting in balanced economic growth
Stable inflation remaining close to lower level of the 1-3% target range
Canada’s unemployment rates are trending favourably and have shown less volatility to global shocks
Canadian GDP by Industry(1)
(November 2013) U.S.Canada
Unemployment (%)(2)
(1) Source: Statistics Canada, RBC Economics Research.(2) Statistics Canada, Bureau of Labor Statistics, RBC Economics Research.

5Investor Relations – Fixed Income Presentation
Canada(1) U.S.(1)
Regulation
Government influences mortgage underwriting policies through control of insurance eligibility rules
Fully insured if LTV is over 80%
Must meet 5-year fixed rate mortgage standards
Government-backed, on homes <$1 million
Down-payment > 20% on non-owner occupied properties
Re-financing cap of 80% on non-insured mortgages
Agency insured only if conforming and LTV under 80%
No regulatory LTV limit – can be over 100%
Not government-backed if private insurer defaults
Consumer Behaviour
Mortgage interest not tax deductible
Greater incentive to pay off mortgage
Mortgage interest is tax deductible
Less incentive to pay down mortgage
Lender Behaviour
Strong underwriting discipline; extensive documentation
Most mortgages are held on balance sheet
Conservative lending policies have historically led to low delinquency rates
Wide range of underwriting and documentation requirements
Most mortgages securitized
Lenders Recourse
Ability to foreclose on non-performing mortgages, with no stay periods
Full recourse against borrowers(2)
Stay period from 90 days to one year to foreclose on non-performing mortgages
Limited recourse against borrowers in key states
(1) Current regulation and lenders recourse.(2) Alberta has some limited restrictions on full recourse.
Structural backdrop to the Canadian housing market

6Investor Relations – Fixed Income Presentation
Canadian housing market fundamentals remain sound
We expect housing activity will continue to moderate to more sustainable levels over the medium term, in line with household formation in Canada
Housing affordability is at reasonable levels in most markets with supply and demand in balance Positive demographics and low interest rates Policy measures promoting a healthy housing market
Household debt service costs ratios are well within the mean, with little movement towards higher risk
Lenders maintaining strong underwriting discipline and require extensive documentation Most mortgages held on balance sheet and conservative lending policies have led to low delinquency rates
(1) Statistics Canada, Federal Reserve Board, Bureau of Economic Analysis, RBC Economics Research. PDI: Personal disposable income.(2) Canadian Real Estate Association, Statistics Canada, RBC Economics Research.
0
50
100
150
200
250
300
1990 1992 1994 1996 1998 2000 2002 2004 2006 2008 2010 2012 2014
4
5
6
7
8
9
10
11
12
1990 1992 1994 1996 1998 2000 2002 2004 2006 2008 2010 2012 2014
Canadian House Price & Labour Income(2)
(Indexed 1990=100)
IncomeHouse PriceU.S.Canada
Household Debt Service Costs(1)
(Mortgage & non-mortgage interest payments as a % of PDI)

7Investor Relations – Fixed Income Presentation
0
1
2
3
4
5
6
1990 1992 1994 1996 1998 2000 2002 2004 2006 2008 2010 2012 201435
40
45
50
55
60
65
70
75
80
1990 1992 1994 1996 1998 2000 2002 2004 2006 2008 2010 2012 2014
Canadians have significant equity ownership in their homes
U.S.Canada
(1) Statistics Canada Census and U.S. Census Bureau. (2) Statistics Canada, Federal Reserve Board, RBC Economics Research. (3) Canadian Bankers' Association, Mortgage BankersAssociation, RBC Economics Research.
Canadians carry a significant and stable amount of equity in their homes
Canadian borrowers are more incented to pay off their mortgage as interest is not tax deductible yet rate of home ownership is comparable to the U.S., at approximately 69%(1)
Mortgage delinquency rates remain low in Canada and have been stable through recent credit cycle
RBC stress tests its residential mortgage and broader retail portfolios to dramatic movements in house prices, interest rates and unemployment
U.S.Canada
Homeowners Equity as % of Total Value of Real Estate Assets(2)
(Owners’ equity as a % of residential real estate assets)
Mortgage Delinquencies(3)
(Mortgages 90+ days in arrears as a % of total mortgages)

8Investor Relations – Fixed Income Presentation
Undeveloped land around Toronto / Vancouver is limited, causing shift to centralized condo housing ‘Green belt’ surrounding Toronto has limited urban sprawl, increasing the demand for condos in the core
Vancouver is restricted in its ability for urban sprawl due to land constraints away from the city centre
Canada has one of the highest per capita rates of permanent immigration in the world(1)
20.6% of Canada’s population is foreign born (6.8 million), highest proportion among the G8 population(1)
62.5% of all new immigrants to Canada move to Toronto, Vancouver or Montreal(1)
RBC’s exposure to condo development is limited – less than 3% of our total commercial loan book
Condo mortgages represent just over 9% of our residential mortgage portfolio
The Toronto and Vancouver downtown condo markets
“Green belt” surrounding Greater Toronto area Vancouver limited by mountains, sea, U.S. border
(1) National Household Survey, May 8, 2013. Statistics Canada.

Investor Relations
Royal Bank of CanadaSECTION II

10Investor Relations – Fixed Income Presentation
22%
5%
7%
11%
55%
RBC’s key strengths
(1) Amounts exclude Corporate Support. These are non-GAPP measures. For further information, see the Business segment results and Results by geographic segment sections of our Q1/2014 Report to Shareholders. For additional information see slide 22.
Diversified business mix, with the right balance of retail and wholesale
Almost two-thirds of revenue from Canada
Strategic approach in key businesses in the U.S. and select international markets
18%
18%
64%
Earnings by business segment(1) Latest twelve months ended January 31, 2014
CanadaU.S.
International
Personal & Commercial
Banking
Wealth Management
Insurance
Capital MarketsInvestor & Treasury Services
Revenue by geography(1) Latest twelve months ended January 31, 2014
11Investor Relations – Fixed Income Presentation
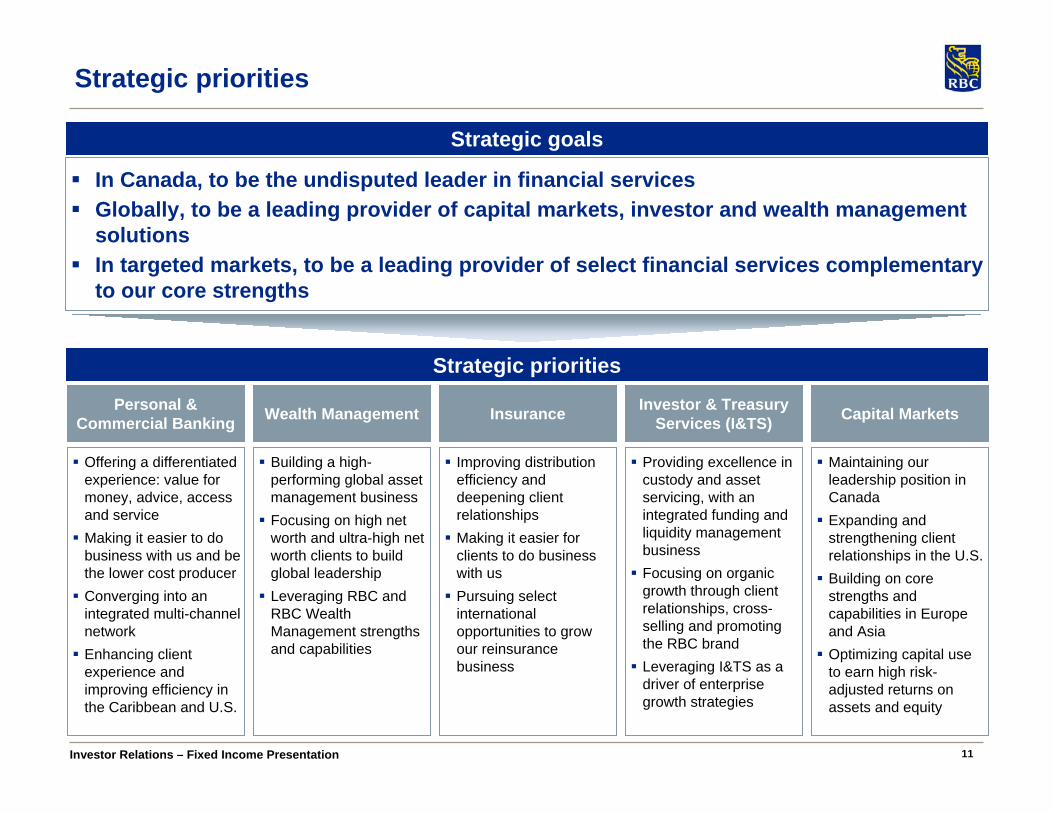
Strategic priorities
Offering a differentiated experience: value for money, advice, access and service Making it easier to do
business with us and be the lower cost producer Converging into an
integrated multi-channel network Enhancing client
experience and improving efficiency in the Caribbean and U.S.
Personal & Commercial Banking
Building a high- performing global asset management business Focusing on high net
worth and ultra-high net worth clients to build global leadership Leveraging RBC and
RBC Wealth Management strengths and capabilities
Wealth Management
Strategic goals
Improving distribution efficiency and deepening client relationships Making it easier for
clients to do business with us Pursuing select
international opportunities to grow our reinsurance business
Insurance
Providing excellence in custody and asset servicing, with an integrated funding and liquidity management business Focusing on organic
growth through client relationships, cross- selling and promoting the RBC brand Leveraging I&TS as a
driver of enterprise growth strategies
Investor & Treasury Services (I&TS)
Maintaining our leadership position in Canada Expanding and
strengthening client relationships in the U.S. Building on core
strengths and capabilities in Europe and Asia Optimizing capital use
to earn high risk- adjusted returns on assets and equity
Capital Markets
Strategic priorities
In Canada, to be the undisputed leader in financial services Globally, to be a leading provider of capital markets, investor and wealth management
solutions In targeted markets, to be a leading provider of select financial services complementary
to our core strengths
12Investor Relations – Fixed Income Presentation
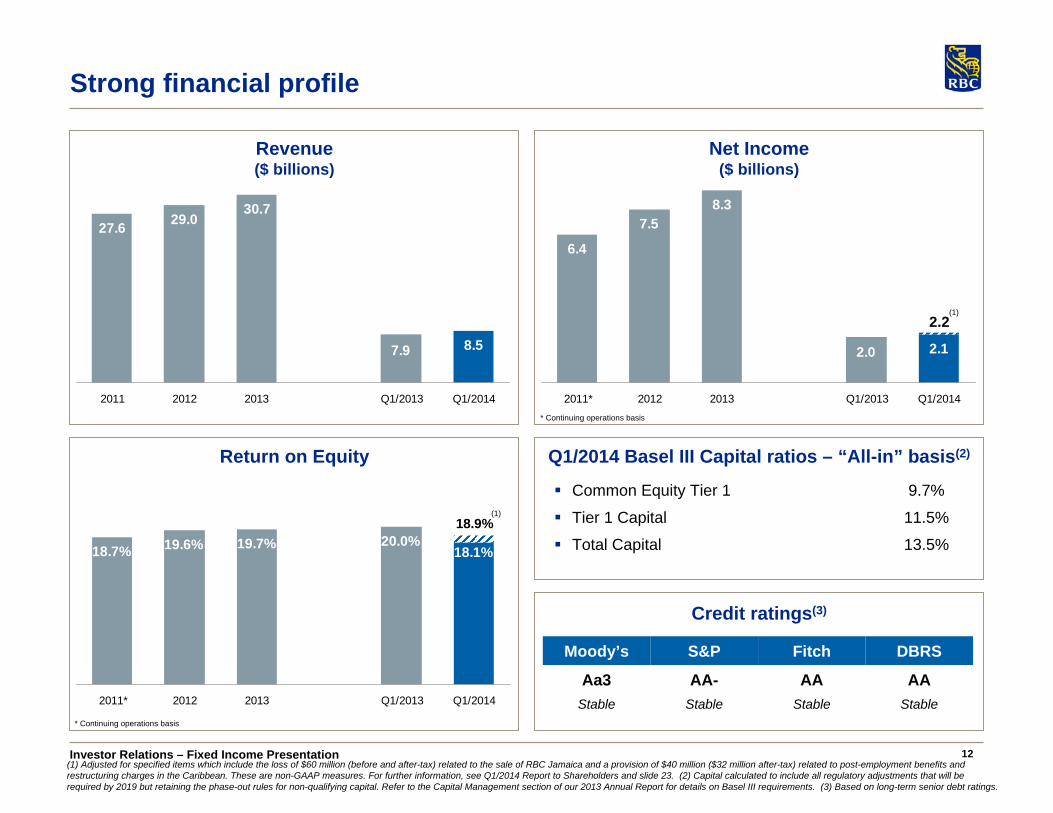
Strong financial profile
27.6 29.030.7
8.57.9
2011 2012 2013 Q1/2013 Q1/2014
6.4
7.58.3
2.12.0
2011* 2012 2013 Q1/2013 Q1/2014
18.7% 19.6% 19.7% 18.1%20.0%
2011* 2012 2013 Q1/2013 Q1/2014
Revenue($ billions)
Net Income ($ billions)
Return on Equity Q1/2014 Basel III Capital ratios – “All-in” basis(2)
(1) Adjusted for specified items which include the loss of $60 million (before and after-tax) related to the sale of RBC Jamaica and a provision of $40 million ($32 million after-tax) related to post-employment benefits and restructuring charges in the Caribbean. These are non-GAAP measures. For further information, see Q1/2014 Report to Shareholders and slide 23. (2) Capital calculated to include all regulatory adjustments that will be required by 2019 but retaining the phase-out rules for non-qualifying capital. Refer to the Capital Management section of our 2013 Annual Report for details on Basel III requirements. (3) Based on long-term senior debt ratings.
Common Equity Tier 1
Tier 1 Capital
Total Capital
9.7%
11.5%
13.5%
Credit ratings(3)
Moody’s S&P Fitch DBRS
Aa3 AA- AA AAStable Stable Stable Stable
18.9%
2.2
(1)
(1)
* Continuing operations basis
* Continuing operations basis
13Investor Relations – Fixed Income Presentation
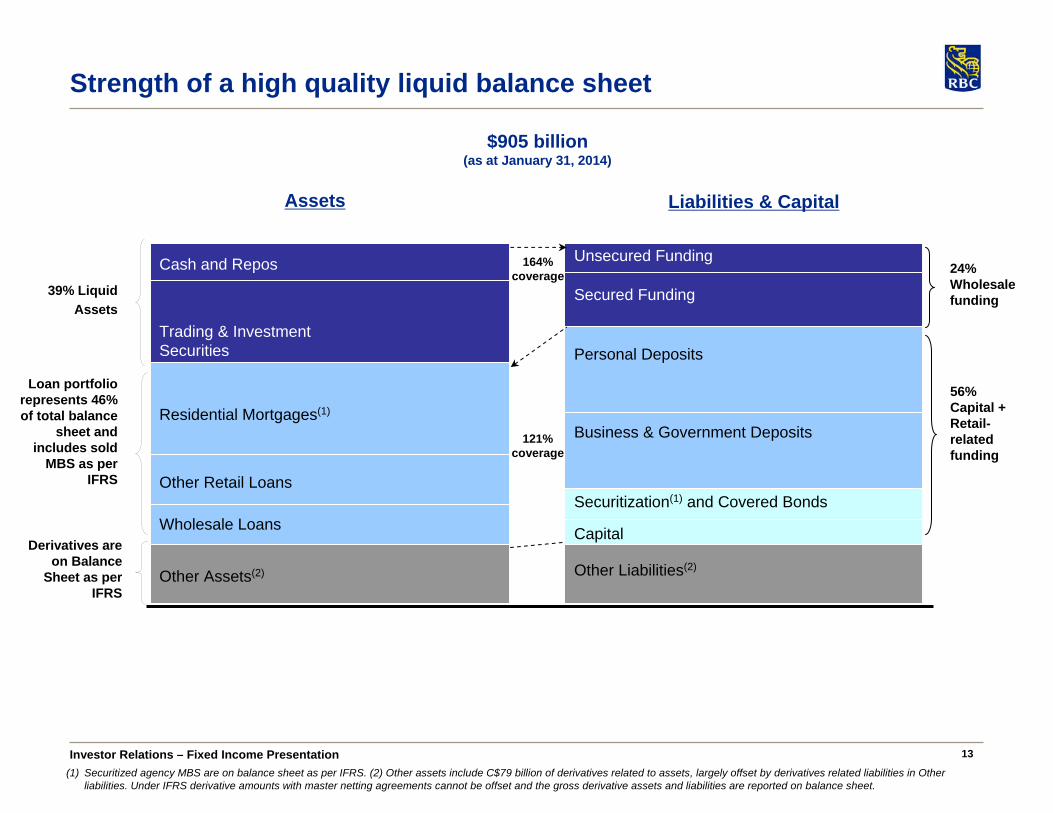
Assets
39% Liquid Assets
$905 billion(as at January 31, 2014)
Loan portfolio represents 46% of total balance
sheet and includes sold
MBS as per IFRS
Liabilities & Capital
56% Capital + Retail- related funding
24% Wholesale funding
121% coverage
164% coverage
Derivatives are on Balance
Sheet as per IFRS
Cash and Repos
Residential Mortgages(1)
Other Assets(2)
Wholesale Loans
Other Retail Loans
Trading & Investment Securities
Strength of a high quality liquid balance sheet
(1) Securitized agency MBS are on balance sheet as per IFRS. (2) Other assets include C$79 billion of derivatives related to assets, largely offset by derivatives related liabilities in Other liabilities. Under IFRS derivative amounts with master netting agreements cannot be offset and the gross derivative assets and liabilities are reported on balance sheet.
Unsecured Funding
Business & Government Deposits
Personal Deposits
Capital
Other Liabilities(2)
Secured Funding
Securitization(1) and Covered Bonds

14Investor Relations – Fixed Income Presentation
On February 26, 2014, RBC announced a quarterly dividend increase of $0.04 or 6% to $0.71 per share
RBC has increased the dividend 6 times since May 2011, a total increase of 42%
History of delivering value to our shareholders
Our goal is to maximize shareholder returns by achieving top quartile TSR over 3-5 years
Dividend history*($ per share)
$1.18
$1.44
$1.82
$2.00 $2.00 $2.00$2.08
$2.28
$2.53
2005 2006 2007 2008 2009 2010 2011 2012 2013
CAGR 8.8%
Dividend
Current quarterly dividend: $0.67
Q1/2014 payout ratio of 48%, in line with our target of 40-50%
Share buybacks
2014 normal course issuer bid to repurchase up to 30 million common shares
(1) Annualized TSR as at February 24, 2014. Based on the global peer group approved by our Board of Directors. For the list of peers, refer to our 2013 Annual Report.
* Dividends declared per common share.
Total shareholder return (TSR)(1)
RBC Peer Avg.3 Year 13% 9%
5 Year 25% 23%
10 Year 12% 5%

Investor Relations
Global Funding StrategySECTION III

16Investor Relations – Fixed Income Presentation
Strong deposit growth
Gaining Canadian market share
Initiated successful strategies to grow relationship deposit base
Between October 2010 to November 2013, our share of the Canadian personal deposit market has grown from 18.7% to 20.0%(1)
Leveraging our Wealth Management network with targeted strategies and product development
Canadian relationship business deposits continue to grow at faster pace than the market
RBC Relationship Deposits($ billions)
(1) Canadian deposit market is based on Canadian Banking personal deposits and Wealth Management advisory channel deposits. Source: OSFI (M4 report).(2) High Interest Savings Account; Includes CAD and USD deposits.(3) Sourced largely from RBC Wealth Management network.
RBC Canadian Deposits($ billions)
Leveraging our international reach
Acquired the remaining 50% of RBC Investor Services deposits
U.S. retail bank operates as a deposit gatherer Supporting deposit growth in Channel Islands and
other offshore wealth management centres
Leveraging the strength of our distribution
Oct 2010 Jan 2014HISA(2) $ 18 $ 27Advisory Channel Deposits(3) $ 13 $ 30Other Personal Deposits $ 131 $ 142Business Deposits $ 131 $ 176 Total Deposits $ 293 $ 375
30
50
70
90
110
130
150
170
Jan-07 Jan-08 Jan-09 Jan-10 Jan-11 Jan-12 Jan-13
Ave
rage
Bal
ance
s ($
B C
AD
)
8.8% CAGR
8.7% CAGR
Total Cdn Business Deposits
Total Cdn Personal Deposits
Nov-13
17Investor Relations – Fixed Income Presentation
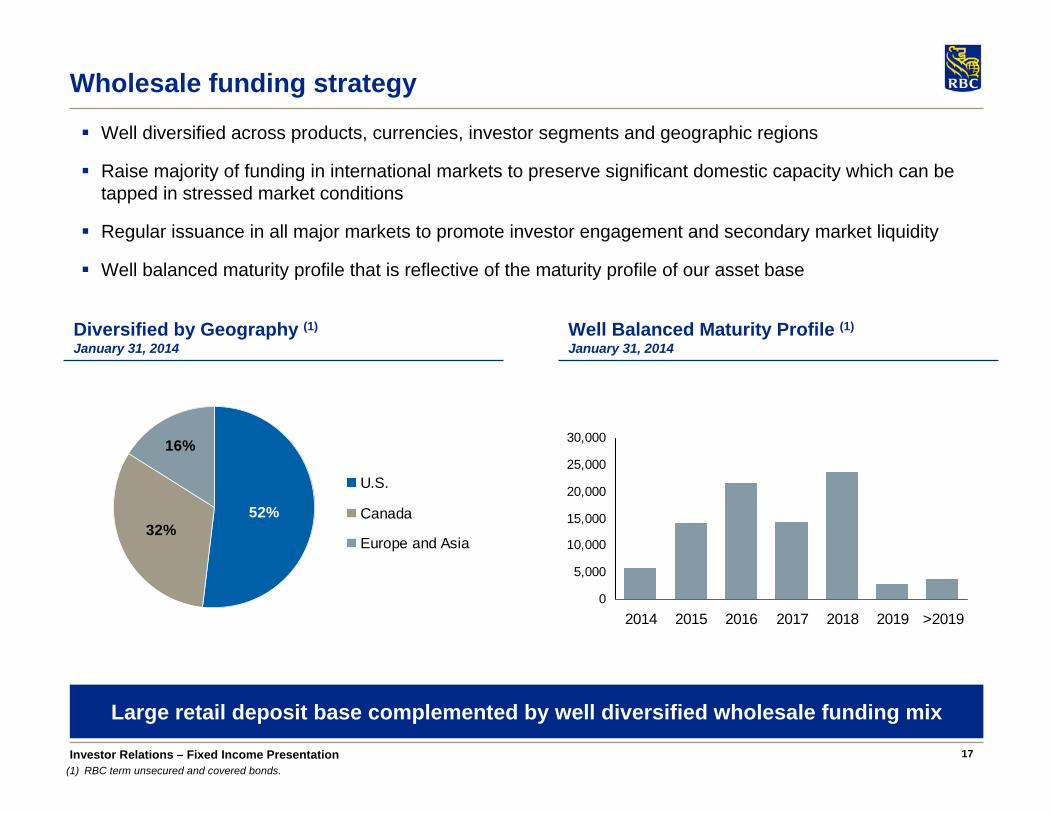
Wholesale funding strategy
52%32%
16%
U.S.
Canada
Europe and Asia
(1) RBC term unsecured and covered bonds.
Well diversified across products, currencies, investor segments and geographic regions
Raise majority of funding in international markets to preserve significant domestic capacity which can be tapped in stressed market conditions
Regular issuance in all major markets to promote investor engagement and secondary market liquidity
Well balanced maturity profile that is reflective of the maturity profile of our asset base
Diversified by Geography (1)
January 31, 2014Well Balanced Maturity Profile (1)
January 31, 2014
0
5,000
10,000
15,000
20,000
25,000
30,000
2014 2015 2016 2017 2018 2019 >2019
Large retail deposit base complemented by well diversified wholesale funding mix
18Investor Relations – Fixed Income Presentation
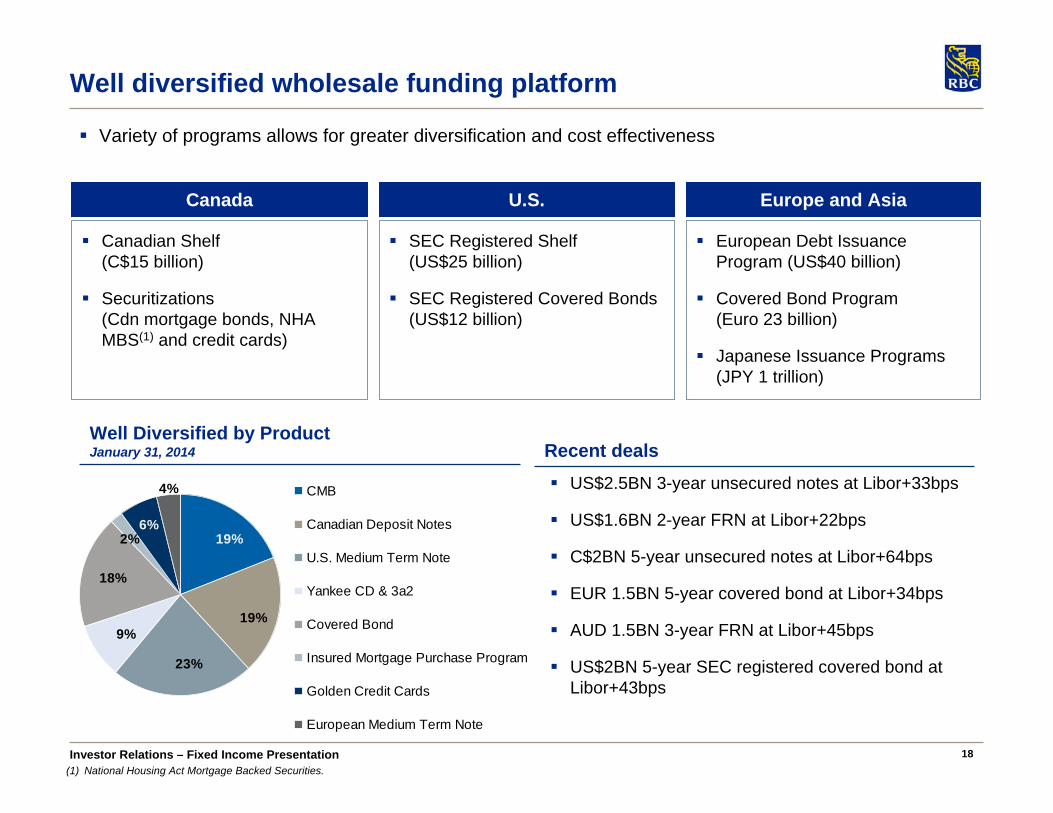
19%
19%
23%
9%
18%
2%6%
4% CMB
Canadian Deposit Notes
U.S. Medium Term Note
Yankee CD & 3a2
Covered Bond
Insured Mortgage Purchase Program
Golden Credit Cards
European Medium Term Note
Variety of programs allows for greater diversification and cost effectiveness
Well diversified wholesale funding platform
(1) National Housing Act Mortgage Backed Securities.
Well Diversified by ProductJanuary 31, 2014
US$2.5BN 3-year unsecured notes at Libor+33bps
US$1.6BN 2-year FRN at Libor+22bps
C$2BN 5-year unsecured notes at Libor+64bps
EUR 1.5BN 5-year covered bond at Libor+34bps
AUD 1.5BN 3-year FRN at Libor+45bps
US$2BN 5-year SEC registered covered bond at Libor+43bps
Recent deals
SEC Registered Shelf (US$25 billion)
SEC Registered Covered Bonds (US$12 billion)
U.S.
European Debt Issuance Program (US$40 billion)
Covered Bond Program (Euro 23 billion)
Japanese Issuance Programs (JPY 1 trillion)
Europe and Asia
Canadian Shelf (C$15 billion)
Securitizations (Cdn mortgage bonds, NHA MBS(1) and credit cards)
Canada

19Investor Relations – Fixed Income Presentation
RBC Covered Bond Program
U.S. Registration
U.S. covered bond program is SEC registered
Issued US$7.75 billion across four deals since September 2012
Index eligible and Trace eligible
Strong Issuer
Largest Canadian bank by market capitalization
Strong credit ratings; Aa3/AA-/AA/AA(1)
Well capitalized and consistent profitability
Well diversified business mix
Canadian Legislative Changes
New Canadian legislation protects claims of covered bond investors and overrides any other conflicting law related to bankruptcy and insolvency
Extensive regulatory oversight and pool audit requirements
Mandatory property value indexation beginning June 2014
Globally Active
Active program in five different currencies: EUR, CAD, USD, CHF and AUD
C$22 billion currently outstanding
Five benchmark transactions since July 2013: EUR 1.5 billion 5-year US$2 billion 5-yearUS$1.75 billion 3-year EUR 2 billion 7-year AUD 1.25 billion 3-year
(1) Ratings by Moody’s, S&P, Fitch and DBRS, respectively .

Investor Relations
Appendix – Legislation and PoliciesSECTION IV

21Investor Relations – Fixed Income Presentation
Legislation and policies – promoting a healthy housing market
July 2012
Maximum amortization on government-backed insured mortgages reduced to 25 years from 30 years
Maximum amount that can be borrowed on a mortgage refinancing lowered to 80% from 85%
CMHC insurance availability is limited to homes with a purchase price of <$1 million lowered from $3.5 million
Set the borrower’s maximum gross debt service ratio at 39% and maximum total debt service ratio at 44%
February 2010
Borrowers must meet the standards for a five-year fixed rate mortgage
Maximum amount that can be borrowed on a mortgage refinancing lowered to 90% from 95%
Minimum down payment of 20% is required in order to qualify for government-backed mortgage insurance on non-owner-occupied properties
March 2011
Maximum amortization on government-backed insured mortgages reduced to 30 years from 35 years
Maximum amount that can be borrowed on a mortgage refinancing lowered to 85% from 90%
July 2008
Maximum amortization on government-backed insured mortgages reduced to 35 years from 40 years
A minimum 5% down payment is required in order to qualify for government-backed insured mortgages
Additional – minimum credit score requirements, new loan documentation standards, setting a maximum of 45% on borrowers total debt service ratio

22Investor Relations – Fixed Income Presentation
Note to users
Amy Cairncross, VP & Head (416) 955-7803Lynda Gauthier, Director (416) 955-7808Christopher Taylor, Associate Director (416) 955-7872
www.rbc.com/investorrelations
Investor Relations Contacts
We use a variety of financial measures to evaluate our performance. In addition to generally accepted accounting principles (GAAP) prescribed measures, we use certain non-GAAP measures we believe provide useful information to investors regarding our financial condition and result of operations. Readers are cautioned that non-GAAP measures, such as earnings and revenue excluding Corporate Support and specified items do not have any standardized meanings prescribed by GAAP, and therefore are unlikely to be comparable to similar measures disclosed by other financial institutions.
Additional information about our non-GAAP measures can be found under the “Key performance and non-GAAP measures” section of our Q1 2014 Report to Shareholders and our 2013 Annual report.
Definitions can be found under the “Glossary” sections in our Q1 2014 Supplementary Financial Information and our 2013 Annual Report.