Embed Size (px)
Citation preview

5
Rover-Based Van
Won S. Kim*, RoberJet Pro
The Mars Exploration Rothe art in rover operations onby scientists on Earth, the MEMartian surface operations, iinstrument placement in a sinkey technologies to achieve approach towards the designdifferent visual tracking alNormalized cross-correlation performed best in terms of tended to be more accurate wexperiments with the scalstraightforward, sideways, anmotion step sizes. The papertracking software written andflight system. The ported visseveral technology demonstra
T present, the baseline operation oof-the-art technology for instrumen
rover, MER baseline operation requiresrock (Fig. 1). Once the target rock is example, about 2 to 4 m away from the later sends them to Earth. Using these imposition for instrument deployment. Asclose-up target images and sends them texact target position for instrument plaplaces the instrument on the target positi
A
Rover travels First-sol up to commands
2 to 4 m away
Figure 1. Baseline operational scenbaseline operation requires 3 sols to
* Senior Member of Technical Staff, Jet P† Member of Technical Staff, Jet Propuls
America
AIAA Space 2005, Long Beach, Aug. 200
isual Target Tracking Validation d Mission Infusion
t D. Steele†, Adnan I. Ansar†, Khaled Ali†, Issa Nesnas*
pulsion Laboratory, Pasadena, CA, 91109
vers (MER’03), Spirit and Opportunity, represent the state of Mars. To place an instrument on 10 to 20 m target designated R baseline operations require 3 sols (Martian days). In future
t is desirable to achieve the entire 10-m target approach and gle sol, increasing the science return significantly. One of the this capability is visual target tracking during the rover ated target. This paper presents validation experiments of
gorithms using the rover’s navigation camera (navcam). (NCC) matching with template image scaling (magnification) tracking reliability and accuracy. Although affine tracking hen it worked, it was less reliable. Various navcam tracking
ed NCC matching were performed and analyzed for d turn-in-place rover motions to determine the appropriate also presents on-going efforts of infusing the visual target tested in the CLARAty software environment into the MER
ual target tracking software will be tested on Mars as one of tions planned for MER extended flight experiments.
I. Introduction f the Mars Exploration Rover (MER’03) flight mission represents the state-t placement on Mars. When a target rock is about 10 to 20 m away from the 3 sols (Martian days) to place an instrument on the target position of the selected, scientists and mission operators decide a waypoint that is, for target. As the rover moves to the waypoint, it takes images of the rock and
ages, scientists and ground operators determine the rover base placement the rover reaches the base placement position in the second sol, it takes o Earth. Using these images, scientists and mission operators determine the cement and generate the required arm motion commands. The rover arm on in the third sol.
Rover moves Arm Second-sol Third-sol to base places commands commands position instrument
ario for instrument placement. Mars Exploration Rover (MER’03) place an instrument on a rock from 10 to 20 m away.
ropulsion Laboratory, MS. 198-219, 4800 Oak Grove Drive. ion Laboratory, MS. 198-219, 4800 Oak Grove Drive.
n Institute of Aeronautics and Astronautics
1
In future Mars missions such as Mars Science Laboratory (MSL’09), it is desirable to achieve the entire target approach and instrument placement from 10 to 20 m away in a single sol as an enhanced operation. Reducing the 3-sol baseline operation to a single-sol operation increases Mars science return significantly. If scientists spend on average 8 to 10 sols per rock assuming 3-sol baseline instrument placement, then the enhanced single-sol instrument placement capability will reduce 8 to 10 sols/rock to 6 to 8 sols/rock, resulting in 20% to 25% increase in science return.
II. Rover-Based Visual Target Tracking System Various promising technologies have been or are being demonstrated to enable single-sol instrument
placement1-6. Two key technologies needed to achieve single-sol target approach and instrument placement operations are 1) visual tracking for approach with hazard avoidance and 2) rover-based manipulation to place an instrument with collision avoidance. This paper focuses on visual target tracking. When no visual target tracking is used, the target positioning error after 10-m travel to the target is in order of 20 cm at minimum due to the stereo range error and the rover pose estimation error7. With visual target tracking, the target positioning error can be within a few cm. Fig. 2 shows the functional diagram of a rover-based visual target tracking system1,2 consisting of 2D image feature tracking, mast camera pointing7, and camera handoff software. The rover moves in short steps and the designated feature is tracked at these discrete intervals. Due to limited computational resources available on-board flight rovers, it is not possible to use continuous or frame rate target tracking techniques. The 2D image feature tracker tracks the target image at each step as the rover approaches the target in small steps. The 2D/3D tracker is essentially the 2D image feature tracker with active camera pointing using stereo camera views. Active camera pointing points the camera to the target each time the rover moves to a new position, so that the target is re-positioned to the center of subsequent camera images. Active camera pointing prevents the target from moving out of the camera view, and greatly reduces the search area for the 2D tracker feature image matcher. Pointing the camera towards the target requires knowledge of the target position in 3D space relative to the rover position. A rover pose estimator such as the visual odometer provides the rover pose estimate, while the triangulation of the target image points in stereo camera views provides the target position estimate in 3D space.
2D/3D Tracking
2D Image Feature Tracking Rover Rover Pose
III. Rover Technology Validation To reduce mission risk, flight projects normally opt to use existing proven technologies rather than new
technologies which tend to have limited experimental performance data. Therefore, new technologies are often perceived as too risky and, hence, are not integrated into mission or simply take a long time to infuse to flight missions. This is, in part, due to the lack of performance characterization and risk assessment of these new technologies by a non-developer. The validation process has been set up to close this gap and facilitate the flight mission infusion of new technologies by providing extensive experimental performance data (Fig. 3). It should be noted, however, that the technology validation process is different from the flight product test and verification. In the flight system, the test and verification process is to conduct pass/failure test for various test cases. On the other hand, the new technology validation process is a cooperative process tightly coupled with technology developers.
Figure 2. A rover-based visual target tracking system. It performs mast camera pointing and 2D image feature tracking as the rover approaches the target. It also performs camera handoff as needed.
Locomotor Navigator
Estimator (Visual Odometer)
Mast Camera Pointing
Normalized Cross- Correlation
Target Position Scale/ (Stereo Affine Vision) Matching Optional
Camera Handoff
American Institute of Aeronautics and Astronautics
2
Instead of treating the technology system delivered as a black box, a white box approach is taken to validate the new technology. The validation team examines and validates the system performance on component level, determining error budgets and performance reliabilities as well as identifying problems and anomalies. Critical bug fixes and desirable enhancements are often suggested by the validation team. This validation process with bug fixes and enhancements iterates until the system is considered stabilized. The final validation report is provided to flight projects for their review and selection of the technology.
The technology development and research environment used for the visual tracking delivery was the CLARAty (Coupled Layer Architecture for Robotic Autonomy) test bed. CLARAty8,9 provides a common software environment that enables implementation of comprehensive control for planetary rovers and robotic systems. CLARAty’s primary goal is the integration of disparate robotic research efforts within the NASA community and various universities nationwide. CLARAty emphasizes the need for interoperability on various robotic systems that have different hardware architectures and operating systems. It encompasses various software components developed for rover autonomy, such as I/O control, motion control and coordination, manipulation, mobility, vision, terrain map generation, obstacle detection/avoidance, navigation, position estimation, and planning and execution modules. Its enabling capability has been demonstrated using the Rocky7, Rocky8, FIDO, and K9 rover platforms as well as in simulations running under VxWorks, Linux, and Solaris. Newer technology components can easily be inserted and tested.
Technology Rover
A. Affine Matching Last year, extensive validation experiments were performed on a CLARAty implementation of the iterative
pyramidal Lucas-Kanade affine tracker10,11, which was the early, initial delivery. The affine tracker creates a template window image od a given size, say 29×29 centered at the designated target point to track. As the rover moves a short distance and takes a new image from its mast-mounted camera, the tracker determines the new target image position in the new image using a Newton-Raphson style iterative method to minimize the difference between the template image and the new target image. The tracker supports three kinds of transforms for matching the template image to the subsequent image: pure translation, scale, and affine transforms. The pure translation matching uses two parameters, tx and ty, that shifts the feature in x and y coordinates to find the matching location of the feature in the new image. The scale transform uses a scale parameter in addition to the two translation parameters. The scale parameter resizes the feature template image window for matching. The affine transform uses 6 parameters to match: 4 deformation parameters in addition to 2 translation parameters. The four deformation parameters are the elements of a 2×2 affine deformation matrix that allows scaling, rotation, stretch, and shearing of the 2D planar template image window, which assumes a planar feature. Further, matching is done by pyramidal feature matching. First, feature matching starts with low-resolution coarse matching at the highest pyramid level. Then the tracker uses lower pyramid levels to refine the target location, and finishes with full-resolution fine matching at pyramid level 0. The pyramidal feature matcher uses the same template window size for all pyramid levels, where increasing the pyramid level by one reduces the image size by half, doubling the effective window size. Since initial tests indicated a combined tracking configuration of pure translation followed by affine monitoring/correction performed best, this revised configurat
To obtain a statistical overview of the affine tracion (Fig. 4) was used as the affine tracker.
ker performance, we ran the affine tracker on three image sequences of 4-m straightforward, 90º roll, and 45º yaw camera motions. At the time of this early delivery, no mast camera pointing capability was provided, and thus rover forward motion tests were limited to about 4 m, starting from about 10 m away from the target to about 6 m away. The image was collected at each 1-cm step forward motion. In off-line tracking tests, the image skip
Figure 3. Mission infusion of new rover technologies. The technology validation process facilitates the flight mission infusion of new technologies developed in research environment.
Development Integration in CLARAty
Technology Validation
Flight Projects
Pure Affine Translation MatcherMatcher
Figure 4. A revised affine tracker configuration. Iterative pure translation followed by affine matching was used as the “affine” tracker for the first set of validation experiments presented in this subsection.
American Institute of Aeronautics and Astronautics
3

parameter was used to emulate a larger step size. Targets were selected over several rocks of small, medium, and large image sizes. The target window size was set to 15×15 pixels. The number of pyramid levels was set to 3 for straightforward camera motion and to 4 for roll and sideways-yaw camera motions to accommodate larger image displacements. The template update interval was set to 10 or every 10-th image processed for all motions. The image skip was set to 4 for forward motion and 0 for roll and yaw motions. These parameter settings make the template update occur every 50 cm of forward motion, every 10º of roll motion, and every 2.5º of sideways-yaw camera motion. Table 1 shows the test results of affine tracking for forward, roll, and yaw camera motions with 16 and 8 mm lenses. The average tracking performances were 80% to 100%. The travel distance of the forward motion was a full 4 m for all lenses. The total roll motion was full 90º for the 8-mm lens but 50º for the 16-mm lens due to target images going out of the camera view. The total sideways-yaw motion was a full 45º with the center of the circle at the target for both 16-mm and 8-mm lenses. Fig. 5 shows the beginning and end images of the affine tracking for results recorded in Table 1 of 4-m forward camera motions with 8 mm lens. All 20 targets on small-image-size and medium-image-size rocks tracked 100%, while 5 out of 25 targets on large-image-size rocks failed. The failed targets do not seem to have enough texture to track well. The initial target positions were selected in a grid pattern (Fig. 5 left), and tracking was considered success if the final target position (Fig. 5 right) still stays within a grid pattern. Namely, small drifts were allowed in the tracking success criterion.
16 mm (17ºx13º) 8 mm (33ºx25º)
Forward Motion (4 m) 65/65 (100%) 40/45 (89%) 13/16 (81%) 14/14 (100%) Roll Motion (50°, 90°) 10/12 (83%) 14/16 (88%) Sideways-Yaw Motion (90°)
Table 1. Tracking percentage of affine tracker with forward, roll, and sideways-yaw camera motions. Forward motion was limited to a total of 4 m, starting from about 10 m away from the target to 6 m away since active camera pointing was not available during this early experiment.
Figure 5. Affine tracker with straightforward motion. Beginning (left) and end (right) images of 4-m straightforward camera motion with 16 mm lens. Targets were selected on several rocks of small, medium, and large image sizes in grid patterns by using text-based entry. No mast pointing was used.
Extensive experiments were performed, and the validation results of the affine tracker are summarized here12. 1) Pure translation tracked more reliably, while affine transform tracked more accurately. Pure translation
matching tracked more reliably than affine transform matching, but drifted more and was less accurate. Affine transform matching tracked more accurately when it tracked, but lost targets more easily than pure translation.
2) A combined configuration of pure translation followed by affine transform performed best. Based on the above observation, the software was re-configured to allow a combined tracking configuration of pure translation followed by affine monitoring/correction. This combined tracking configuration demonstrated
American Institute of Aeronautics and Astronautics
4

the best tracking performance. Thus we conducted the test and validation of the “affine” tracker using this combined configuration.
3) Low-texture targets needed larger window sizes. The ideal window size was affected by two sources of error. If the window was too small, there was often too little texture to track well. If the window was too large, the terrain sometimes violated the planarity assumption of the affine tracker and did not track well. Experiments indicated that typically 15×15 pixels appeared to be a good size for small rocks, and 29×29 pixels for large rocks.
4) Increasing the number of pyramid levels helped to track larger image displacements between images. Large image displacements require a large effective window size to prevent a target feature from leaving the tracking window entirely. As the number of pyramid levels increases by one, the effective window size doubles. For example, a 15×15 window size with 4 pyramid levels has an effective window size of 15×23 = 120 pixels at the top pyramid level. Likewise, 29×29 window size with 3 pyramid levels has the similar effective window size. Experimental results showed that combinations of widow size and pyramid levels having similar window size yielded similar tracking performance in terms of handling large image displacements between images. In terms of texture, however, the 15×15 window performed better for high-texture targets, while the 29×29 window was better for low-texture targets on large-image-size rocks.
5) The best template update was every 5% to 10% change in distance to target or every 5º to 10º change in roll and yaw motions. Upper bounds for the template window update interval were about 2 m for straightforward motion at about 10-m target distance (20% change in distance to target) and 20º for roll and yaw motions. However, the optimal update interval depends upon targets and other factors. Typically, every 50 cm change at 10-m target distance (5% change in distance to target) for forward motion and every 5º to 10 º change in roll or yaw motion appeared to be good template update intervals.
6) The affine tracker using the 15×15 window with 3 pyramid levels tracked up to about 30 pixels as the maximum image displacement. The maximum displacement dictates the tracking range of the active camera control.
7) Tracking performance was fair with unfavorable sunlight directions, while it was poor with dramatic sunlight changes. Images collected at 9-AM made dark shadows on the rock surfaces facing the camera. Even though the lighting and shadow conditions for 9 AM were significantly poorer than those at 2 PM and 4 PM, the tracking performance for 9 AM was reasonably good, demonstrating fair tracking performance even with unfavorable sunlight directions. In the other experiment, there were dramatic changes in ambient sunlight when patches of opaque clouds moved across the sun. For 8-mm images, automatic gain control (AGC) was helpful in holding constant the average intensity of the camera image, resulting in 44% successful tracking. For 4-mm images, the field of view was wider and a good portion of the image was the bright sky. As the brightness of the sky changed dramatically while opaque clouds passing across the sun, AGC tried to compensate for this lighting change and inadvertently caused the image intensity of the terrain surface to change dramatically. In this case, AGC was not helpful, resulting in 0% tracking. Incidentally, this dramatic lighting change due to dark clouds would not happen in a Martian environment.
8) Tracking tests with Rocky8 mast cameras demonstrated the necessity of active camera control. Targets tracked well for the first 1.8 m until the rover went over a rock, which caused large image displacements (sometimes over 100 pixels). By 2.4 m, all targets were lost. This clearly indicates that active camera control with 2-D/3-D tracking is essential.
9) Average tracking performances were above 80% up to 100% with the 15×15 window for all forward, roll, and yaw camera motions. Targets on small rocks tracked 100%, while several targets on large rocks were lost with the 15×15 window size. Forward-motion tests were limited to 4 m, since full 10-m forward-motion tests require active camera pointing.
10) Increasing the window size to 29×29 with 4 pyramid levels resulted in near 100% tracking for low-texture targets on large rocks, and the main causes of tracking failures were identified. Targets on large rocks often did not have enough texture to track well with small windows. When the window size was increased to 29×29, the tracking performance improved to or near 100%. Increasing the number of pyramid levels from 3 to 4 also helped with tracking some targets that often had large image displacements between images. Tracking failures occurred when there were problems with occlusions during the course of the tracking, significant background changes beyond occluding boundaries of the target rock, shadow changes, large image displacements, and target windows containing highly non-planar objects such as two or more portions of separate rocks.
American Institute of Aeronautics and Astronautics
5

Two critical issues surfaced from the above experimental validation results. The first issue is that the affine matching had a very limited matching range of up to only about 30 pixels as described in item 6 above. However, the rover pose estimator (in particular, yaw estimation) is often not accurate enough to point the camera within 30-pixel range. In contrast to brute-force search, the affine tracker does iterative search and has a rather limited matching range. This is because the iterative search does successive approximations to the solution, which can be a local minimum. Therefore, the above validation results indicate that for the pure translation matching in Fig. 4, a brute-force search method, not an iterative search, should be tried to see if it can cover a large search space. The second issue is that the current implementation of the affine tracker is fairly sensitive to lighting changes. The use of normalized images should alleviate the lighting problem.
B. Normalized Cross-Correlation After the shortcomings of the affine tracker were discovered through the previous validation experiments, a new
visual tracker was delivered. The iterative tracker was replaced by a normalized cross-correlation matcher (NCC) matcher (Fig. 6). The NCC matcher does a brute-force search, increasing the search range virtually to the entire image area. However, it is still desirable to limit the search area for computational efficiency and maintaining higher reliability under poor imaging conditions. Initial tests indicated that iterative scale/affine matching was still not as reliable as brute-force NCC, although scale/affine matching helped improve accuracy when it tracked.
It is thus desirable to consider an alternate approach to scale/affine matching to take into account the target image size change as the rover gets closer to the target. The mast camera pointing computes the estimated target position relative to the rover after each rover move using point stereo triangulation and a rover pose estimator. Thus, the estimated target distance can be easily computed. Since the target image size in the template window is inversely proportional to the target distance from the camera based on perspective projection imaging geometry, the template image magnification can be made accordingly before applying NCC. So, in the third configuration (Fig. 7), the template image magnification is preceded by NCC, while the iterative scale/affine matcher was removed. Another NCC configuration option is to allow template window resize.
Normalized Template Normalized Scale/Affine Cross Image Cross Matcher Correlation Magnification Correlation
Figure 7. Normalized cross-correlation preceded by template image magnification. Template image magnification according to target distance change made the tracking performance more reliable, allowing larger rover motion step size.
Figure 6. Normalized cross-correlation followed by affine matching. The scale/affine matcher made the tracking performance less reliable although more accurate when tracked by taking into account the target image size and orientation change.
C. Tracking with Straightforward Rover Motions Tracking experiments were conducted to compare the performances of different tracker configurations and
options of Fig. 6 and 7. The beginning and end images of the image sequence tested are shown in Fig. 8. In the initial image, targets selected were about 10 m away from the rover. In the final image of tracking, targets were about 2.3 m away. The template window size of the target image was 21×21 pixels. Note that target images are magnified by a factor of 4 across the 7.7-m forward traverse. Further, the viewing angle changed significantly: mostly looking forward in the initial image while mostly looking down in the final one. Since the actual on-line tracker tracks only one target per run, it would take too much time to collect enough data for tracking performance comparison. Instead, we implemented an off-line tracker. The off-line tracker is ideal for evaluating the various tracker algorithms, since it enables multiple runs with different target selections using one image sequence collected from the actual on-line run. In Fig. 8, 20 target windows from 20 off-line tracker runs are overlaid. This multiple-target overlay helps to examine tracking drifts more easily.
American Institute of Aeronautics and Astronautics
6
Figure 8. Tracking with straightforward rover motions. Targets were about 10 m away from the rover in the initial image (left), and about 2.3 m away in the final image (right). The image sequence was collected in 30 rover step motions from an actual on-line run. Target windows resulting from 20 off-line tracker runs were overlaid.
Since the target image size changes inversely with the target distance, in the experiments the rover step size was
decreased by 5% for each step so that the target image size was magnified by a constant 5% for each step. The rover motion step size was reduced from 0.5 m at 10 m away to 0.12 m at 2.26 m for a total of 7.74 m traverse with 30 steps of 0.50, 0.48, 0.45, 0.43, 0.41, 0.39, 0.37, 0.35, 0.33, 0.32, 0.30, 0.28, 0.27, 0.26, 0.24, 0.23, 0.22, 0.21, 0.20, 0.19, 0.18, 0.17, 0.16, 0.15, 0.15, 0.14, 0.13, 0.13, and 0.12 m. The navcam stereo image pairs were collected at each rover step motion. The actual image sequence was first collected by running the actual tracker using the Rocky8 Rover in the Mars Yard. After collecting the image sequence, the off-line tracker was then used to perform various off-line tracking experiments. The image skip was also used as an experimental control parameter. A larger image skip means a larger step size. Figs. 8 and 9 show the experimental results of comparing different tracker configurations.
1. pure NCC at full resolution with no pyramidal matching (Fig. 9) 2. NCC with template image magnification (Fig. 9) 3. NCC with template window resize (Fig. 9) 4. NCC with both template image magnification and template window resize (Fig. 9) 5. NCC followed by iterative pyramidal affine matching (Fig. 10) 6. NCC followed by iterative pyramidal scale matching (Fig. 10) 7. NCC with template image magnification, followed by pyramidal affine matching (Fig. 10) 8. NCC with template image magnification, followed by pyramidal scale matching (Fig. 10)
The results in Fig. 9 clearly demonstrate that NCC with template image magnification (yellow triangles) is the
key to achieving reliable tracking performance. In this image sequence, it performed well even when the image skip is 8 or about 40% step size change. The appropriate step size change, however, will depend upon the rover pose estimator accuracy which is affected by various factors such as terrain and soil properties. Resizing the template window (cyan x’s) performed very poorly. Pure NCC (pink squares) without template resizing or magnification tracked fairly (80%) for no image skip or 5% step size change, but deteriorates rapidly as the step size increases. NCC with both template window resizing and image magnification (blue diamonds) was not as good as NCC with image magnification. Further, resizing the template window slows down the computational efficiency since the template window size becomes larger as the rover gets closer to the target. Results in Fig. 10 indicate that adding scale or affine matching after NCC makes the tracking performance significantly less reliable. In particular, the image #24 happened to be very bad for iterative affine/scale matching, although it did not cause any trouble with NCC’s of Fig. 9. The tracking success rate for skip 0 went below 50% level for all four configurations of Fig. 10. Considering the peculiarity of the image #24, it was taken out in plotting Fig. 10. The results of Figs. 9 and 10 indicate that NCC with template image magnification is the winner.
Fig. 11 illustrates final tracking outcomes of 20 targets in the last image for various tracker configurations. Pure NCC tracked 16 targets out of 20 (80% tracking) with no image skip (5% step size change), and tracked 3 (15% tracking) with image skip of 4 (25% step size change). NCC followed by iterative scaling matching tracked 14 (70%
American Institute of Aeronautics and Astronautics
7

tracking) with no image skip, and tracked 4 (20% tracking) with image skip of 4. By contrast, NCC with template image magnification tracked all 20 targets (100% tracking) with 5% step size change, and lost 1 (95% tracking) with 25% step size change. The one target loss appears to be due to low texture of the target image.
0%
10%
20%
30%
40%
50%
60%
70%
80%
90%
100%
0 2 4 6 8 10
Images Skipped
% T
rack
ed
Pure NCCMagnify/NCCResize/NCCMagnify-Resize/NCC
Figure 9. Comparing tracking performance of various NCC configurations with straightforward rover motions. Normalized cross-correlation (NCC) with template image magnification is the clear winner.
0%
10%
20%
30%
40%
50%
60%
70%
80%
90%
100%
0 2 4 6 8 10
Images Skipped
% T
rack
ed
NCC/AffineNCC/ScaleMagnify-NCC/AffineMagnify-NCC/Scale
Figure 10. Comparing tracking performance of various NCC-affine match configurations with straightforward rover motions. Iterative scale/affine matching makes the tracking less reliable.
American Institute of Aeronautics and Astronautics
8

Figure 11. Tracking outcomes of 20 targets appearing in the last image for three tracker configurations. Pure NCC with image skip 0 (upper left) and image skip of 4 (upper right). NCC followed by scale matching with image skip 0 (middle left) and image skip of 4 (middle right). NCC with template image magnification with image skip 0 (lower left) and image skip of 4 (lower right).
American Institute of Aeronautics and Astronautics
9
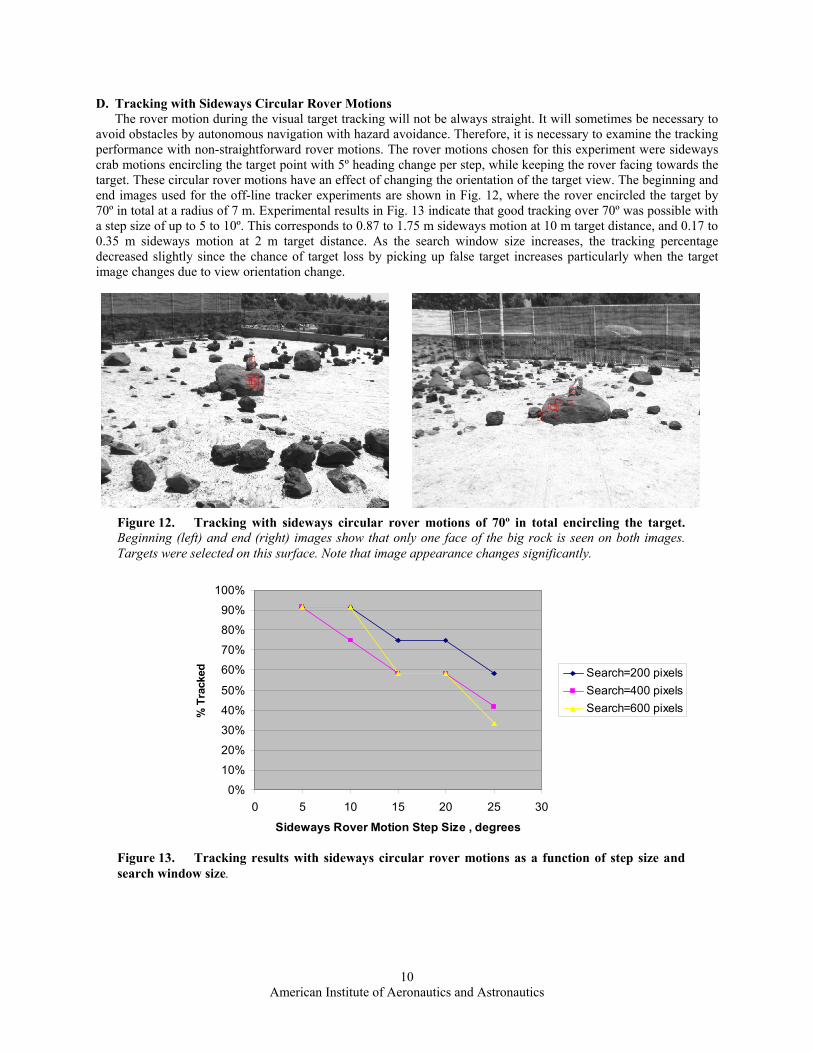
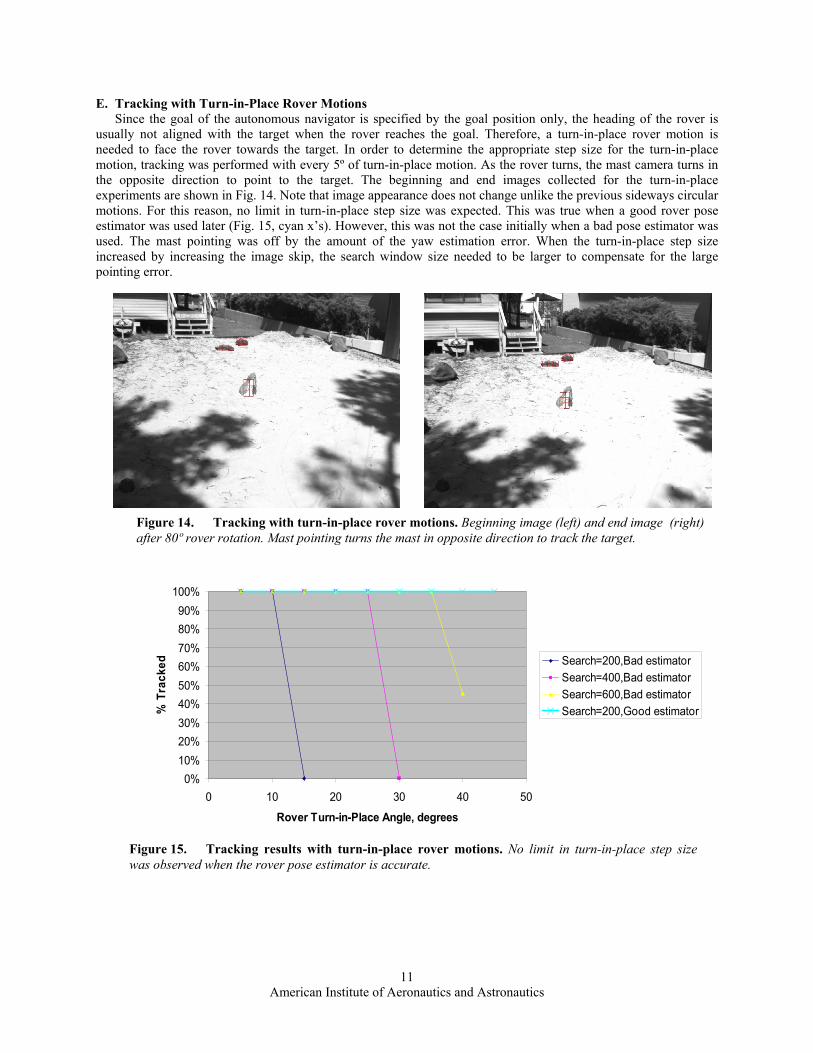
D. Tracking with Sideways Circular Rover Motions The rover motion during the visual target tracking will not be always straight. It will sometimes be necessary to
avoid obstacles by autonomous navigation with hazard avoidance. Therefore, it is necessary to examine the tracking performance with non-straightforward rover motions. The rover motions chosen for this experiment were sideways crab motions encircling the target point with 5º heading change per step, while keeping the rover facing towards the target. These circular rover motions have an effect of changing the orientation of the target view. The beginning and end images used for the off-line tracker experiments are shown in Fig. 12, where the rover encircled the target by 70º in total at a radius of 7 m. Experimental results in Fig. 13 indicate that good tracking over 70º was possible with a step size of up to 5 to 10º. This corresponds to 0.87 to 1.75 m sideways motion at 10 m target distance, and 0.17 to 0.35 m sideways motion at 2 m target distance. As the search window size increases, the tracking percentage decreased slightly since the chance of target loss by picking up false target increases particularly when the target image changes due to view orientation change.
Figure 12. Tracking with sideways circular rover motions of 70º in total encircling the target. Beginning (left) and end (right) images show that only one face of the big rock is seen on both images. Targets were selected on this surface. Note that image appearance changes significantly.
0%
10%
20%
30%
40%
50%
60%
70%
80%
90%
100%
0 5 10 15 20 25 30
Sideways Rover Motion Step Size , degrees
% T
rack
ed Search=200 pixelsSearch=400 pixelsSearch=600 pixels
Figure 13. Tracking results with sideways circular rover motions as a function of step size and search window size.
American Institute of Aeronautics and Astronautics
10
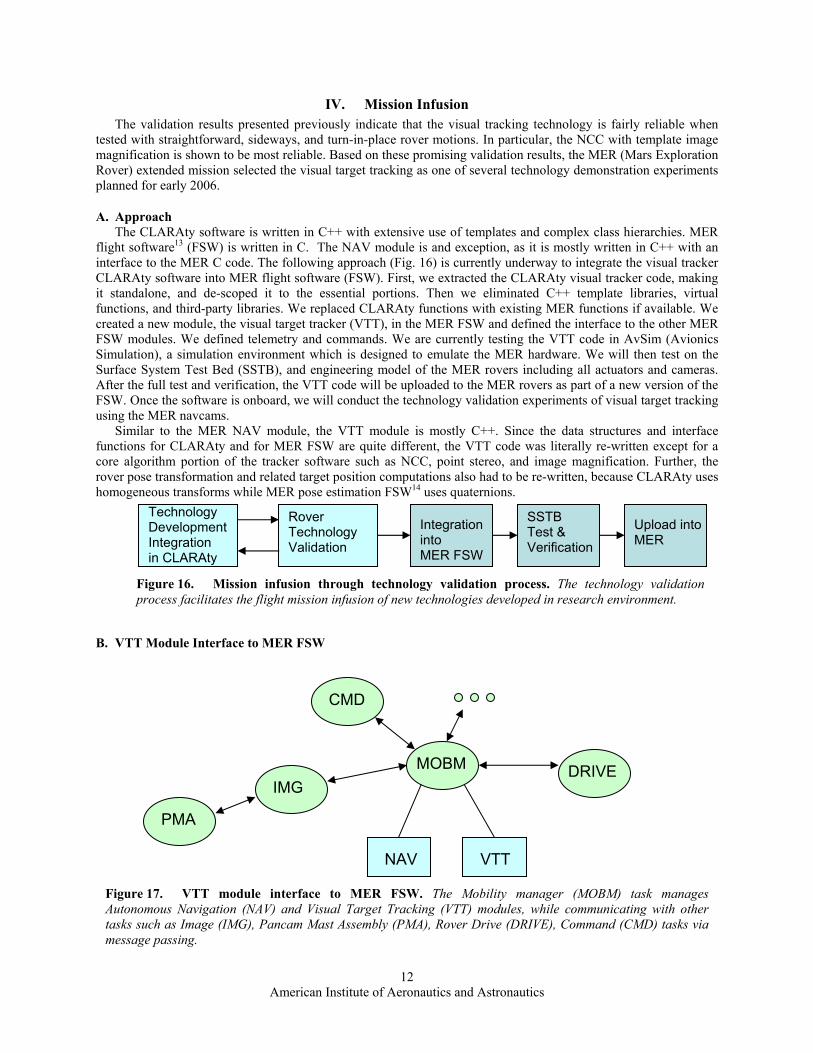
E. Tracking with Turn-in-Place Rover Motions Since the goal of the autonomous navigator is specified by the goal position only, the heading of the rover is
r reaches the goal. Therefore, a turn-in-place rover motion is nee
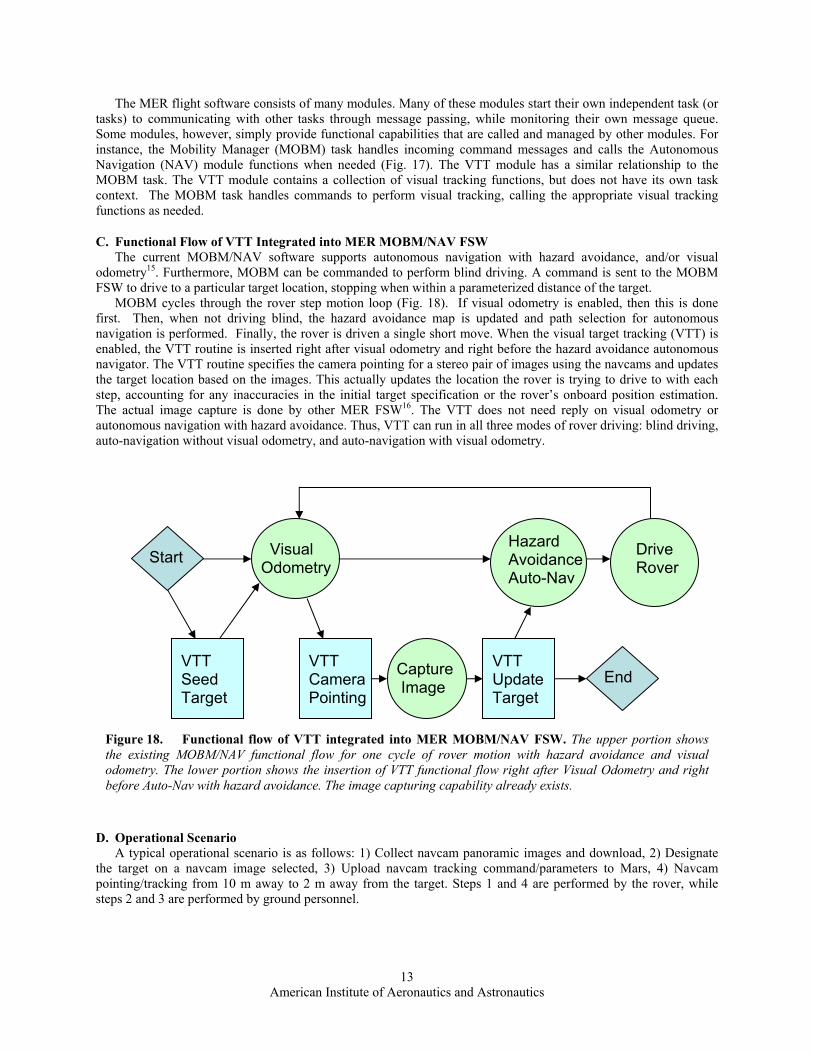
Figure 15. Tracking results with turn-in-place rover motions. No limit in turn-in-place step size was observed when the rover pose estimator is accurate.
usually not aligned with the target when the roveded to face the rover towards the target. In order to determine the appropriate step size for the turn-in-place
motion, tracking was performed with every 5º of turn-in-place motion. As the rover turns, the mast camera turns in the opposite direction to point to the target. The beginning and end images collected for the turn-in-place experiments are shown in Fig. 14. Note that image appearance does not change unlike the previous sideways circular motions. For this reason, no limit in turn-in-place step size was expected. This was true when a good rover pose estimator was used later (Fig. 15, cyan x’s). However, this was not the case initially when a bad pose estimator was used. The mast pointing was off by the amount of the yaw estimation error. When the turn-in-place step size increased by increasing the image skip, the search window size needed to be larger to compensate for the large pointing error.
0%10%20%30%40%50%60%70%80%90%
100%
0 10 20 30 40 50
Rover Turn-in-Place Angle, degrees
% T
rack
ed Search=200,Bad estimatorSearch=400,Bad estimatorSearch=600,Bad estimatorSearch=200,Good estimator
after 80º rover rotation. Mast pointing turns the mast iFigure 14. Tracking with turn-in-place rover motions. Beginning image (left) and end image (right)
n opposite direction to track the target.
American Institute of Aeronautics and Astronautics
11
IV. Mission Infusion The validation results presented previously indicate that the visual tracking technology is fairly reliable when
tested with straightforward, sideways, and t n-place rover m rticular, the NCC with template image magnification is shown to be most reliable d alidation results, the MER (Mars Exploration Ro
are is written in C++ with extensive use of templates and complex class hierarchies. MER flight software (FSW) is written in C. The NAV module is and exception, as it is mostly written in C++ with an
The following approach (Fig. 16) is currently underway to integrate the visual tracker CL
the tracker software such as NCC, point stereo, and image magnification. Further, the rov
B.
Fi sion infu technolo n pro nologpr s the flight ion of new t evelop envir t.
urn-i otions. In pa. Base on these promising v
ver) extended mission selected the visual target tracking as one of several technology demonstration experiments planned for early 2006.
A. Approach The CLARAty softw
13
interface to the MER C code. ARAty software into MER flight software (FSW). First, we extracted the CLARAty visual tracker code, making
it standalone, and de-scoped it to the essential portions. Then we eliminated C++ template libraries, virtual functions, and third-party libraries. We replaced CLARAty functions with existing MER functions if available. We created a new module, the visual target tracker (VTT), in the MER FSW and defined the interface to the other MER FSW modules. We defined telemetry and commands. We are currently testing the VTT code in AvSim (Avionics Simulation), a simulation environment which is designed to emulate the MER hardware. We will then test on the Surface System Test Bed (SSTB), and engineering model of the MER rovers including all actuators and cameras. After the full test and verification, the VTT code will be uploaded to the MER rovers as part of a new version of the FSW. Once the software is onboard, we will conduct the technology validation experiments of visual target tracking using the MER navcams.
Similar to the MER NAV module, the VTT module is mostly C++. Since the data structures and interface functions for CLARAty and for MER FSW are quite different, the VTT code was literally re-written except for a core algorithm portion of
er pose transformation and related target position computations also had to be re-written, because CLARAty uses homogeneous transforms while MER pose estimation FSW14 uses quaternions.
Technology Development Integration
Rover Technology Validation
Integration into
SSTB Test & Upload into
in CLARAty
gure 16. Mis sion through gy validatio cess. The tech y valionmen
dation ocess facilitate mission infus echnologies d ed in research
VTT Module Interface to MER FSW
MER FSW Verification MER
Figure 17. VTT module interface to MER FSW. The Mobility manager (MOBM) task manages Autonomous Navigation (NAV) and Visual Target Tracking (VTT) modules, while communicating with other tasks such as Image (IMG), Pancam Mast Assembly (PMA), Rover Drive (DRIVE), Command (CMD) tasks via message passing.
PMA
IMG MOBM DRIVE
CMD
NAV VTT
American Institute of Aeronautics and Astronautics
12
The MER flight software consists of many modules. Many of these modules start their own independent task (or tasks) to communicating with other tasks through message passing, while monitoring their own message queue. Some modules, however, simply provide functional capabilities that are called and managed by other modules. For instance, the Mobility Manager (MOBM) task handles incoming command messages and calls the Autonomous Navigation (NAV) module functions when needed (Fig. 17). The VTT module has a similar relationship to the MOBM task. The VTT module contains a collection of visual tracking functions, but does not have its own task context. The MOBM task handles commands to perform king, calling the e visual tracking functions as needed.
C. Functio of VTT Integrated into MER MOBM/NAV FSW The cur BM/NAV software supports autonomous navigation with hazard avoidance, and/or visual
odometry15. Furthermore, MOBM can be commanded to perform blind driving. A command is sent to the MOBM FSW to drive to a particular target location, stopping w in a parameterized distance of the target.
MOBM cycles through the rover step motion loo 18). If vi ometry is enabled, then this is done fine nth ased on the images. This actually updates the location the rover is trying to drive to with eachste
D. Operational Scenario A typical operational scenario is as follows: 1) Collect navcam panoramic images and download, 2) Designate
the target on a navcam image selected, 3) Upload navcam tracking command/parameters to Mars, 4) Navcam pointing/tracking from 10 m away to 2 m away from the target. Steps 1 and 4 are performed by the rover, while steps 2 and 3 are performed by ground personnel.
The upper portion shows the existing MOBM/NAV functional flow for one cycle of rover motion with hazard avoidance and visual odometry. The lower portion shows the insertion of VTT functional flow right after Visual Odometry and right before Auto-Nav with hazard avoidance. The image capturing capability already exists.
visual trac appropriat
nal Flowrent MO
hen withp (Fig. sual od
rst. Then, when not driving blind, the hazard avoidance map is updated and path selection for autonomous avigation is performed. Finally, the rover is driven a single short move. When the visual target tracking (VTT) is nabled, the VTT routine is inserted right after visual odometry and right before the hazard avoidance autonomousavigator. The VTT routine specifies the camera pointing for a stereo pair of images using the navcams and updates e target location b p, accounting for any inaccuracies in the initial target specification or the rover’s onboard position estimation.
The actual image capture is done by other MER FSW16. The VTT does not need reply on visual odometry or autonomous navigation with hazard avoidance. Thus, VTT can run in all three modes of rover driving: blind driving, auto-navigation without visual odometry, and auto-navigation with visual odometry.
F gure 18. Functional flow of VTT integrated into MER MOBM/NAV FSW. i
Visual Odometry
Drive Rover
Hazard Avoidance Auto-Nav
VTT Camera Pointing
VTT Update Target
VTT Seed Target
Capture Image End
Start
American Institute of Aeronautics and Astronautics
13
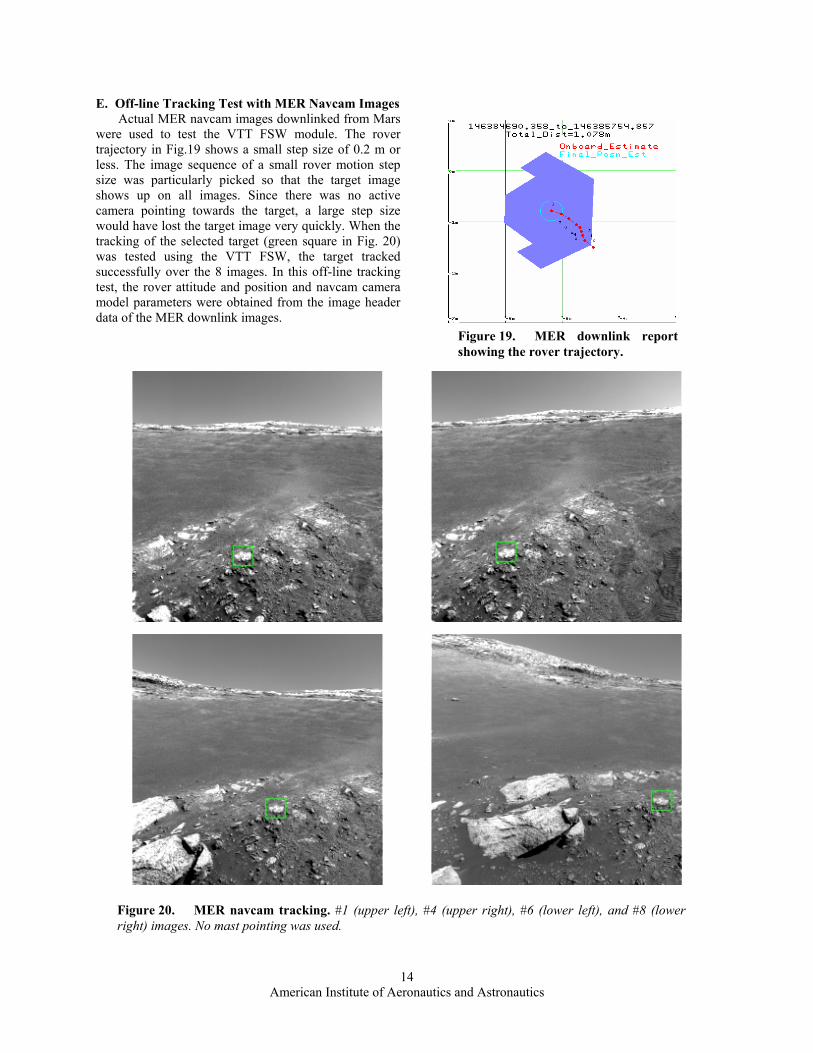
E. Off-line Tracking Test with MER Navcam Images Actual MER navcam images downlinked from Mars
were used to test the VTT FSW module. The rover trajectory in Fig.19 shows a small step size of 0.2 m or less. The image sequence of a small rover motion step size was particularly picked so that the target image shows up on all images. Si no active camera pointing towards the step size would have lost the target image very quickly. When the tracking of the selected target (green square in Fig. 20) was tested using the VTT FSW, the target tracked successfully over the 8 images. In this off-line tracking test, the rover a position an m camera model paramete obtained from the image headedata of the MER k images.
Figure 20. MER navcam tracking. #1 (upper left), #4 (upper right), #6 (lower left), and #8 (lower right) images. No mast pointing was used.
nce there was target, a large
ttitude and d navcars were downlin
r
Figur ER downlink report showing the rover trajectory.
e 19. M
American Institute of Aeronautics and Astronautics
14

V. Conclusion The validation of the visual target tracking technology and the on-going effort of its infusion to a flight mission
is presented as an example demonstrating the role of the technology validation process. It facilitates the infusion of new technologies into flight missions. The technology validation effort indicated that NCC matching with template image magnification performed best with good tracking reliability. As a result, this technology is currently being infused into MER software and planned for upload in early 2006.
Acknowledgments This work was performed at the Jet Propulsion Laboratory, California Institute of Technology, under a contract
with the National Aeronautics and Space Administration. This work is supported by NASA Mars Science Laboratory (MSL) Focused Technology Program.
References 1Bajracharya M., Diaz-Calderon A., Robinson M., Powell M., “Target Tracking, Approach, and Camera Handoff for
Automated Instrument Placement,” IEEE Aerospace Conference, Big Sky, Montana, Mar. 2005. 2Nesnas I., Bajracharya M., Madison R., Bandari E., Kunz C., Deans M., Bualat M., “Visual Target Tracking for Rover-
based Planetary Exploration,” IEEE Aerospace Conference, Big Sky, Montana, 2004. 3Pederson L., Bualat M., Smith D. E., Washington R., “Integrated Demonstration of Instrument Placement, Robust Execution
and Contingent Planning”, Int. Symp. on Artificial Intelligence and Robotics in Space (i-SAIRAS), Nara, Japan, 2003. 4Deans M., Kunz C., Sargent R., Pederson L., “Terrain Model Registration for Single Cycle Instrument Placement,” Int.
Symp. on Artificial Intelligence and Robotics in Space (i-SAIRAS), 2003. 5Huntsberger, T., Aghazarian H., Cheng Y., Baumgartner E. T., Tunstel E., Leger C., Trebi-Ollennu A., and Schenker P. S.,
“Rover Autonomy for Long Range Navigation and Science Data Acquisition on Planetary Surfaces,” IEEE Int. Conf. on Robotics and Automation, Washington, D.C., May 2002.
6Maimone M., Nesnas I., Das H., “Autonomous Rock Tracking and Acquisition from a Mars Rover,” Int. Symp. on Artificial Intelligence and Robotics in Space (i-SAIRAS), Noordwijk, The Netherlands, Jun. 1999.
7Kim W. S., Ansar A., Steele R., “Rover Mast Calibration, Exact Camera Pointing, and Camera Handoff for Visual Target Tracking,” Int. Conf. on Automation and Robotics (ICAR), Jul. 2005.
8Volpe R., Nesnas I., Estlin T., Mutz D., Petras R., Das H., "CLARAty: Coupled Layer Architecture for Robotic Autonomy," JPL Technical Report D-19975, Dec. 2000.
9Nesnas A., Wright A., Bajracharya M., Simmons R., Estlin T., Kim W., "CLARAty: An Architecture for Reusable Robotic Software," SPIE Aerosense Conference, Orlando, Florida, Apr. 2003.
10Lucas B. D., Kanade T., “An Iterative Image Registration Technique with an Application to Stereo Vision,” IJCAI, 1981, pp. 674-679.
11Bouguet J., “Pyramidal Implementation of the Lucas Kanade Feature Tracker: Description of the Algorithm,” Intel Corporation, Microprocessor Research Labs, 2000.
teoftware”, IEEE Conference on Systems, Man and Cybernetics, Waikoloa,
Hawaii, Oct. 2005. 14Ali K., Vanelli C., Biesiadecki J., Maimone M., Cheng Y., San Martin A., Alexander J., “Attitude and Position Estimation
on the Mars Exploration Rovers”, IEEE Conference ys ybernetics, Waikoloa, Hawaii, Oct. 2005. 15Cheng Y., Maimone M., Matthies L., “Visua Exploration Rovers”, IEEE Conference on Systems,
Ma
12Kim W. S., S inke R., Steele R., “2-D Target Tracking Technology Validation Report,” JPL D-28523, Apr. 2004. 13Reeves G., “Mars Exploration Rovers Flight S
on S tems, Man and Cl Odometry on the Mars
n and Cybernetics, Waikoloa, Hawaii, Oct. 2005. 16Litwin T., Maki J., “Imaging Services Flight Software on the Mars Exploration Rovers”, IEEE Conference on Systems,
Man and Cybernetics, Waikoloa, Hawaii, Oct. 2005.
American Institute of Aeronautics and Astronautics
15