Embed Size (px)
Citation preview
ROUX‐en‐Y GASTRIC BYPASS
AS TREATMENT FOR MORBID OBESITY
Studies of dietary intake, eating behavior and
meal‐related symptoms
Doctoral thesis
Anna Laurenius
Department of Gastrosurgical Research and Education
Institute of Clinical Sciences at Sahlgrenska Academy
2013
Roux‐en‐Y gastric bypass as treatment for morbid obesity: Studies of dietary intake, eating behavior and meal‐related symptoms © Anna Laurenius, 2013 Correspondence: Anna Laurenius Department of Gastrosurgical Research and Education Sahlgrenska Academy at University of Gothenburg SE 413 45 Gothenburg Sweden Telephone: +46 31 342 83 68 Email: [email protected] Published papers have been reprinted with permission from the copyright holders. Illustrations: Cover illustration courtesy of Johnson & Johnson, Ethicon Endo‐Surgery Europe GmbH Figure 1 Reproduced with permission from Massachusetts Medical Society Figure 2 Reproduced with permission from Journal of Internal Medicine Figure 3 Reproduced with permission of The Swedish Association of Clinical Dietitians ISBN: 978‐91‐628‐8624‐0 Printed in Gothenburg, Sweden, 2013 Ale Tryckteam AB The electronic version of the thesis is available at http://hdl.handle.net/2077/32372

Till André, Dick, Evamaria, Gert, Lisbeth, Marie, Åsa, Åke och alla andra opererade som så frikostigt delat med sig av sin tid och sina erfarenheter
ROUX‐en‐Y GASTRIC BYPASS
AS TREATMENT FOR MORBID OBESITY
Studies of dietary intake, eating behavior and
meal‐related symptoms
Anna Laurenius
Department of Gastrosurgical Research and Education, Institute of Clinical Sciences Sahlgrenska Academy at University of Gothenburg, Sweden
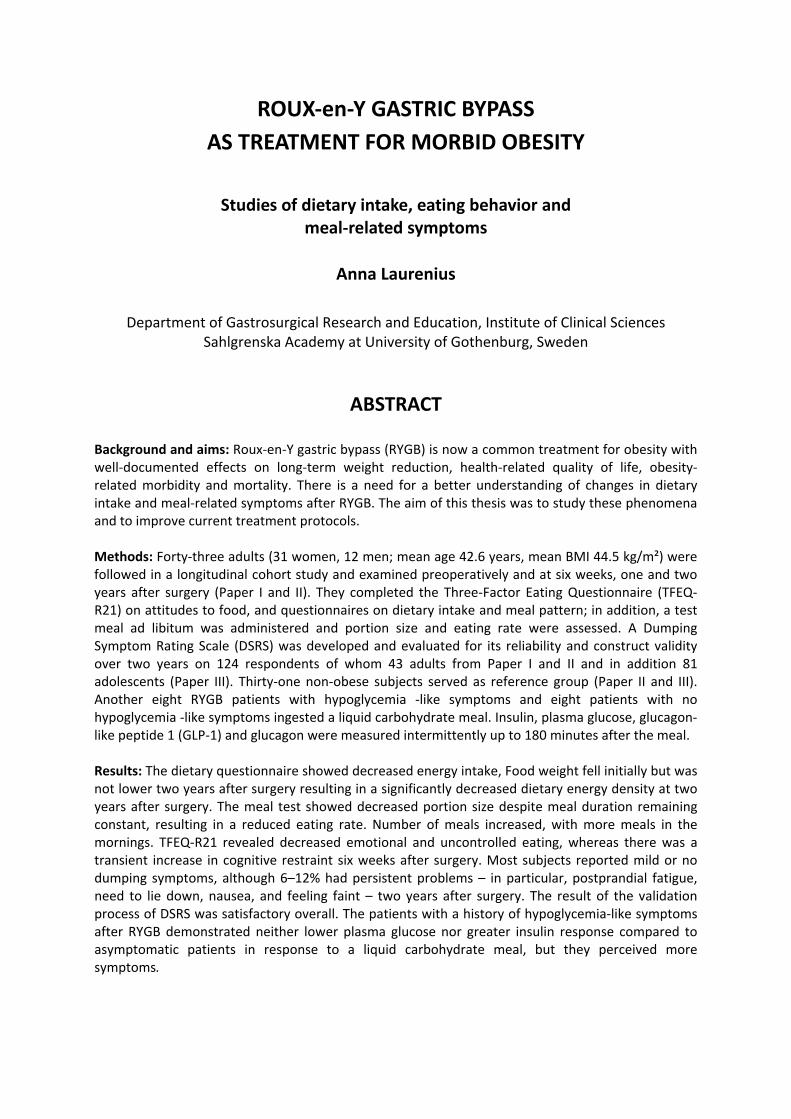
ABSTRACT Background and aims: Roux‐en‐Y gastric bypass (RYGB) is now a common treatment for obesity with well‐documented effects on long‐term weight reduction, health‐related quality of life, obesity‐related morbidity and mortality. There is a need for a better understanding of changes in dietary intake and meal‐related symptoms after RYGB. The aim of this thesis was to study these phenomena and to improve current treatment protocols. Methods: Forty‐three adults (31 women, 12 men; mean age 42.6 years, mean BMI 44.5 kg/m²) were followed in a longitudinal cohort study and examined preoperatively and at six weeks, one and two years after surgery (Paper I and II). They completed the Three‐Factor Eating Questionnaire (TFEQ‐R21) on attitudes to food, and questionnaires on dietary intake and meal pattern; in addition, a test meal ad libitum was administered and portion size and eating rate were assessed. A Dumping Symptom Rating Scale (DSRS) was developed and evaluated for its reliability and construct validity over two years on 124 respondents of whom 43 adults from Paper I and II and in addition 81 adolescents (Paper III). Thirty‐one non‐obese subjects served as reference group (Paper II and III). Another eight RYGB patients with hypoglycemia ‐like symptoms and eight patients with no hypoglycemia ‐like symptoms ingested a liquid carbohydrate meal. Insulin, plasma glucose, glucagon‐like peptide 1 (GLP‐1) and glucagon were measured intermittently up to 180 minutes after the meal. Results: The dietary questionnaire showed decreased energy intake, Food weight fell initially but was not lower two years after surgery resulting in a significantly decreased dietary energy density at two years after surgery. The meal test showed decreased portion size despite meal duration remaining constant, resulting in a reduced eating rate. Number of meals increased, with more meals in the mornings. TFEQ‐R21 revealed decreased emotional and uncontrolled eating, whereas there was a transient increase in cognitive restraint six weeks after surgery. Most subjects reported mild or no dumping symptoms, although 6–12% had persistent problems – in particular, postprandial fatigue, need to lie down, nausea, and feeling faint – two years after surgery. The result of the validation process of DSRS was satisfactory overall. The patients with a history of hypoglycemia‐like symptoms after RYGB demonstrated neither lower plasma glucose nor greater insulin response compared to asymptomatic patients in response to a liquid carbohydrate meal, but they perceived more symptoms.

Conclusion: After RYGB, patients displayed major changes in eating behavior and meal pattern, suggesting that RYGB drives the individual to an eating behavior that promotes weight loss. Despite lack of association between the reduction in dietary energy density and percentage weight loss, changes in food choice were overall nutritionally beneficial. Dumping symptoms were rarely evident, but some patients reported persistent problems up to two years after surgery. DSRS is a reliable clinical screening instrument to identify patients with pronounced dumping symptoms. The mechanisms of action behind the origin of hypoglycemia‐like symptoms remain obscure and need further exploration. Keywords: Roux‐en‐Y gastric bypass, dietary energy density, food choice, meal size, eating rate, meal pattern, eating behavior, dumping syndrome, construct validity, hypoglycemia ISBN: 978‐91‐628‐8624‐0
SAMMANFATTNING PÅ SVENSKA Bakgrund och syfte: Roux‐en‐Y gastric bypass (RYGB) är numera en vanlig behandling av fetma med väldokumenterade effekter på långsiktig viktminskning och hälsorelaterad livskvalitet, fetma‐relaterad sjuklighet och dödlighet. Det finns ett behov av en bättre kunskap av förändringar i kostintag och måltids‐relaterade symtom efter RYGB. Syftet med denna avhandling var att studera dessa fenomen och förbättra nuvarande behandlings‐rutiner. Metod: Fyrtiotre vuxna (31 kvinnor, 12 män, medelålder 42,6 år, BMI 44,5 kg / m²) följdes i en longitudinell kohortstudie och undersöktes preoperativt och vid sex veckor, ett och två år efter operationen (Artikel I och II). De besvarade Three‐factor Eating Questionnaire (TFEQ‐R21) angående attityder till mat samt frågeformulär om kostintag och måltidsmönster och dessutom serverades en testmåltid ad libitum där portionsstorlek och äthastighet uppmättes. Dumpning Symptom Rating Scale (DSRS) utvecklades och utvärderades för sin reliabilitet och konstruktionsvaliditet upp till två år på 124 respondenter varav 43 vuxna från papper I och II och dessutom 81 ungdomar (Artikel III). Trettien normalviktiga patienter, utgjorde en referensgrupp (Artikel II och III). Ytterligare åtta RYGB patienter med hypoglykemi‐liknande symptom och åtta patienter utan hypoglykemi‐liknande symptom intog en flytande kolhydratrik måltid. Insulin, plasma‐glukos, glukagon‐liknande peptid 1 (GLP‐1) och glukagon mättes intermittent upp till 180 minuter postprandiellt. Resultat: Estimerat kostintag visade minskat energiintag. Födoämnesvikten minskade inledningsvis men var inte lägre två år postoperativt vilket resulterade i en minskad energidensitet. Vid testmåltiden minskade portionsstorleken, medan måltids‐durationen var konstant vilket innebar en signifikant sänkt äthastighet. Antal måltider ökade något och fler måltider intogs på förmiddagen. TFEQ‐R21 påvisade att känslomässigt och okontrollerat ätande minskade, medan det fanns en övergående ökning av kognitiv återhållsamhet sex veckor efter operationen. De flesta patienter rapporterade milda eller inga dumpning‐symtom, även om 6‐12% hade bestående problem två år efter operationen, i synnerhet trötthet efter måltid, behov av att ligga ner, illamående och svimningskänsla. Resultatet av valideringsproceduren av DSRS var överlag tillfredsställande. Patienter som efter gastric bypass uppvisat hypoglykemi‐liknande symptom visade sig varken ha lägre plasmaglukos eller större insulinsvar jämfört med symptomfria patienter som svar på en flytande kolhydratrik måltid, men de rapporterade mer upplevda symtom. Konklusion: Efter gastric bypass uppvisar patienter ett påtagligt förändrat livsmedelsval och måltidsmönster, vilket tyder på att gastric bypass driver individen till ett ätbeteende som främjar viktminskning. Trots bristen på samband mellan sänkningen av kostens energidensitet och procentuell viktförlust, var förändringar i livsmedel val övergripande näringsmässigt fördelaktigt. Även om de flesta patienterna rapporterade inga eller milda dumpingsymtom hade några kvarstående problem upp till två år postoperativt. DSRS är ett pålitligt klinisk screening‐instrument för att identifiera patienter med uttalade dumpningsymptom. Verkningsmekanismer bakom uppkomsten av de dunkla hypoglykemi‐liknande symptomen kvarstår och behöver ytterligare utforskning.
i
LIST OF PAPERS
This thesis is based on the following studies, referred to in the text by their Roman numerals. I Laurenius A, Larsson I, Melanson KJ, Lindroos AK, Lönroth H, Bosaeus I Olbers T. Decreased energy density and changes in food selection following Roux‐en‐Y gastric bypass. Eur J Clin Nutr 2013; 67:168‐173 II Laurenius A, Larsson I, Bueter M, Melanson KJ, Bosaeus I, Berteus Forslund H, Lönroth H,
Fändriks L, Olbers T. Changes in eating behavior and meal pattern following Roux‐en‐Y gastric bypass. Int J Obes 2012; 36:348‐355 III Laurenius A, Olbers T, Näslund I, Karlsson J. Dumping syndrome following gastric bypass: validation of the Dumping Symptom Rating Scale Obes Surg 2013; [epub ahead of print] IV Laurenius A, Werling M, Le Roux CW, Fändriks L, Olbers T. Oral glucose provocation in patients demonstrating hypoglycemia‐like symptoms after Roux‐
en‐Y gastric bypass In manuscript.
ii
TABLE OF CONTENTS
ABBREVIATIONS ........................................................................................................................ iv
1 INTRODUCTION.................................................................................................................. 1
2 BACKGROUND.................................................................................................................... 3
2.1 Surgical treatment ....................................................................................................... 3
2.2 Mechanisms of weight reduction by RYGB ................................................................. 6
2.3 Gastrointestinal symptoms in obesity and after RYGB ............................................... 7
2.4 Dietary intake and eating behavior in obesity and after RYGB................................... 7 2.4.1 Dietary guidelines for gastric bypass............................................................................... 7 2.4.2 Measuring dietary intake in obese people...................................................................... 8 2.4.3 Dietary intake and eating behavior in obesity ................................................................ 8 2.4.4 Dietary intake and eating behavior after RYGB............................................................... 9
2.5 The Nutrition Care Process.......................................................................................... 9 2.5.1 Nutritional diagnosis related to gastric bypass ............................................................. 10 2.5.2 Binge eating disorder and RYGB surgery....................................................................... 12 2.5.3 Dumping syndrome ....................................................................................................... 12 2.5.4 Reactive hypoglycemia.................................................................................................. 13 2.5.5 Psychosocial impact on outcome after RYGB................................................................ 13
3 HYPOTHESES AND AIMS OF THE THESIS ......................................................................... 15
4 PATIENTS AND METHODS ............................................................................................... 16
4.1 Study populations...................................................................................................... 16
4.2 Methods..................................................................................................................... 21 4.2.1 The SOS dietary questionnaire (Paper I) ....................................................................... 21 4.2.2 Dietary energy density (Paper I).................................................................................... 21 4.2.3 Ad libitum meal test (Paper II)....................................................................................... 21 4.2.4 Test meal (Paper II)........................................................................................................ 21 4.2.5 Portion size, meal duration and eating rate (Paper II) .................................................. 21 4.2.6 Visual Analogue Scales for hunger and satiety (Paper II) .............................................. 22 4.2.7 The Meal Pattern Questionnaire (Paper II) ................................................................... 22 4.2.8 The Three‐Factor Eating Questionnaire (Paper II)......................................................... 22 4.2.9 The Dumping Symptom Rating Scale (Paper III)............................................................ 22 4.2.10 The Gastrointestinal Symptom Rating Scale (Paper III)................................................. 22 4.2.11 Oral carbohydrate provocation test (Paper IV) ............................................................. 23 4.2.12 Pulse and blood pressure assessments (Paper IV) ........................................................ 23 4.2.13 Blood analysis (Paper IV) ............................................................................................... 23 4.2.14 Perceived symptoms (Paper IV) .................................................................................... 23
4.3 Statistical and psychometric methods ...................................................................... 23
iii
5 RESULTS............................................................................................................................ 26
5.1 PAPER I – Data on DED and changes in food selection ............................................. 26
5.2 PAPER II – Data on eating behavior and meal pattern.............................................. 27
5.3 PAPER III – Data on the Dumping Syndrome Rating Scale ........................................ 29
5.4 PAPER IV – Data on hypoglycemia‐associated symptoms ........................................ 31
6 DISCUSSION ..................................................................................................................... 33
6.1 Methodological considerations ................................................................................. 33 6.1.1 Study design .................................................................................................................. 33 6.1.2 Study populations.......................................................................................................... 33 6.1.3 Participation rates ......................................................................................................... 34 6.1.4 Self‐reported food intake from the SOS dietary questionnaire .................................... 34 6.1.5 Dietary energy density .................................................................................................. 34 6.1.6 Ad libitum test meal for measuring portion size, meal duration and eating rate......... 35 6.1.7 Visual analogue scales for hunger and satiety .............................................................. 36 6.1.8 The Three‐Factor Eating Questionnaire ........................................................................ 36 6.1.9 Validation process for the Dumping Symptom Rating Scale......................................... 36 6.1.10 Oral carbohydrate provocation test.............................................................................. 36
6.2 Results in perspective................................................................................................ 36 6.2.1 PAPER I – Dietary energy density and food selection ................................................... 36 6.2.2 PAPER II – Eating behavior and meal pattern ............................................................... 39 6.2.3 PAPER III – Data on the Dumping Syndrome Rating Scale ............................................ 40 6.2.4 PAPER IV – Data on hypoglycemia‐associated symptoms ............................................ 42 6.2.5 Proposed dietary guidelines.......................................................................................... 43 6.2.6 Strengths and limitations .............................................................................................. 46
7 CONCLUSIONS.................................................................................................................. 48
8 FUTURE PERSPECTIVES .................................................................................................... 49
ACKNOWLEDGEMENTS ............................................................................................................ 50
iv
ABBREVIATIONS ANOVA Analysis of variances
ASY Asymptomatic
AUC Area under the curve
BED Binge eating disorder
BMI Body mass index
CR Cognitive restraint
DED Dietary energy density
CI Confidence interval
DS Dumping syndrome
DSRS Dumping Symptom Rating Scale
EBMIL Excessive body mass index loss
EE Emotional eating
EI Energy intake
FFQ Food frequency questionnaire
FW Food weight
GI Gastrointestinal
GLP‐1 Glucagon‐like peptide 1
GSRS Gastrointestinal Symptom Rating Scale
HRQoL Health‐related quality of life
h hour
NCP Nutritional care process
PAL Physical activity level
RMR Resting metabolic rate
RYGB Roux‐en‐Y gastric bypass
SD Standard deviation
SOReg Scandinavian Obesity Surgery Register
SY Symptomatic
TFEQ‐R21 Three‐factor Eating Questionnaire – Revised 21 questions
UE Uncontrolled eating
VAS Visual analogue scale
VBG Vertical banded gastroplasty
WL Weight loss
1
1 INTRODUCTION The prevalence of obesity has more than doubled since 1980 and obesity is now considered a worldwide epidemic. In 2008, more than 1.4 billion adults, aged 20 and older, were overweight (body mass index (BMI) 25–30). Of these, over 200 million men and nearly 300 million women were obese (BMI >30) (1). In a recent Swedish longitudinal study, 18% were overweight and a further 7% were obese at 20 years of age (2). Obesity is associated with increased incidence of several co‐morbidities and premature death, in addition to social stigma and quality‐of‐life impairments. The fundamental cause of overweight and obesity is an energy imbalance between calories consumed and calories expended. Conventional obesity treatment requires multi‐component interventions that must be delivered over the long term (3) and drug treatment has so far been insufficiently effective in combating obesity (4). Based on the difficulty of treating obesity with the conventional methods available to date, the number of bariatric surgeries has increased dramatically (5). The increase in bariatric surgery worldwide naturally focuses attention on dietary intake, eating behavior, and the meal‐related symptoms that can occur after these operations. These are important issues in the assessment and treatment of obesity in general, as well as for the individual undergoing surgery. However, there are few studies examining what changes people make in dietary intake and eating behavior after obesity surgery. Furthermore, the specific dietary and behavioral advice given to patients undergoing bariatric surgery shows a low standard of scientific evidence (6). The idea for this project is derived from a randomized study in which obese patients were treated with vertical banded gastroplasty (VBG) or Roux‐en‐Y gastric bypass (RYGB). During the initial study (6) it was observed that RYGB patients followed a healthier diet and expressed more satisfaction with their food intake compared to banded patients (7); thus, the randomized study led to the choice of RYGB as the preferred obesity surgical treatment. The aim of this project was to learn more specifically about the patients’ dietary changes in order to improve current treatment protocols and understand mechanisms of RYGB in action. Moreover, the goal was to study meal‐related symptoms following RYGB. Meal‐related symptoms after RYGB may occur in direct connection to the meal, but they can also occur one to three hours after the meal. A well‐reported consequence of gastric surgery is the “dumping syndrome” (DS) – a cluster of symptoms occurring shortly after food reaches the small bowel. However, there are no validated tools to discriminate between different symptoms or their severity and frequency, rendering the syndrome diffuse and difficult to assess. In addition, late dumping, or postprandial reactive hypoglycemia, has become more and more common as the number of RYGB surgery procedures increases. It is unclear whether patients with hypoglycemia‐associated symptoms differ from other RYGB patients in terms of objective parameters such as glucose, insulin, gastrointestinal (GI) hormones, heart rate and blood pressure. The overall aim of this thesis was to examine changes in dietary intake, eating behavior, and meal‐related symptoms following RYGB surgery in order to enhance current knowledge and to improve treatment protocols. More specifically, the goal was to examine changes in dietary energy density (DED) and food choice (Paper I), as well as portion size, meal duration and eating rate, hunger, satiation, and maintained satiety in relation to voluntary food intake (Paper II). In addition, changes in diurnal distribution and number of meals and eating behavior were examined in terms of cognitive restraint, uncontrolled eating (UE), and emotional eating (EE) (Paper II). A further aim was to

2
investigate the severity and frequency of DS by means of validation of a questionnaire (Paper III). A final aim was to examine plasma glucose, serum insulin, GI hormones, pulse and blood pressure as well as perceived symptoms of reactive hypoglycemia (Paper IV), after a standardized oral glucose load in symptomatic (SY) and asymptomatic (ASY) RYGB patients.
3
2 BACKGROUND
2.1 Surgical treatment
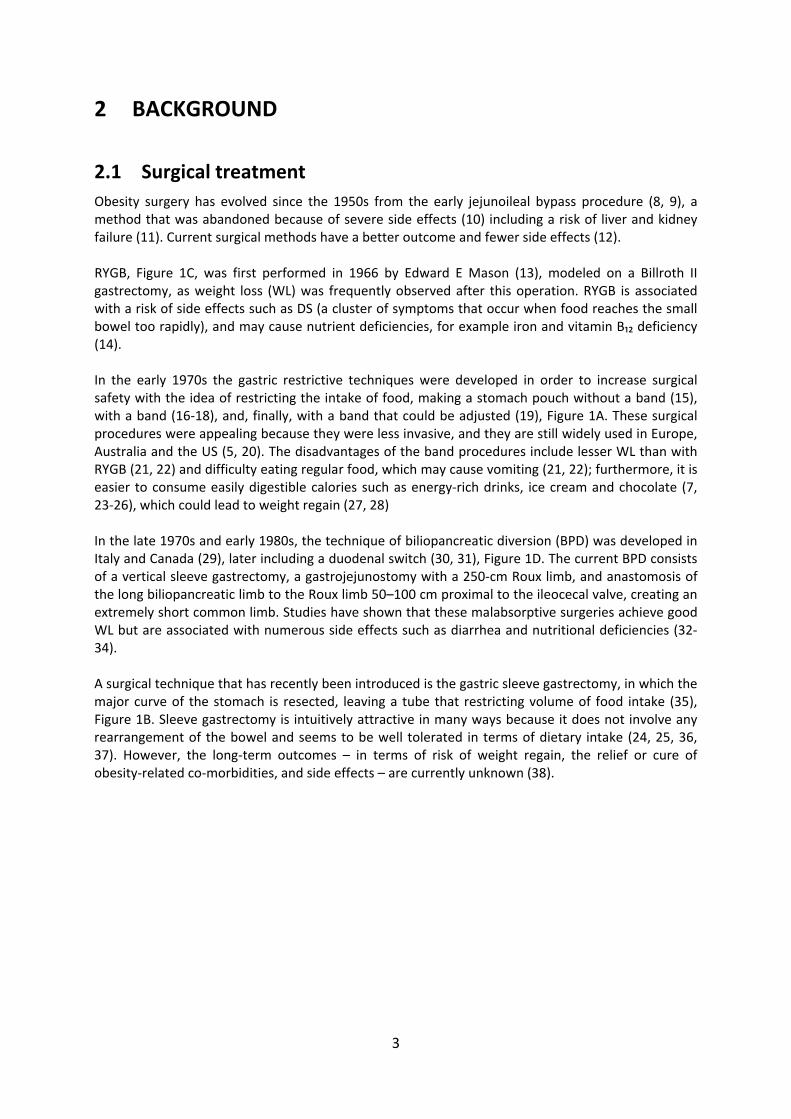
Obesity surgery has evolved since the 1950s from the early jejunoileal bypass procedure (8, 9), a method that was abandoned because of severe side effects (10) including a risk of liver and kidney failure (11). Current surgical methods have a better outcome and fewer side effects (12). RYGB, Figure 1C, was first performed in 1966 by Edward E Mason (13), modeled on a Billroth II gastrectomy, as weight loss (WL) was frequently observed after this operation. RYGB is associated with a risk of side effects such as DS (a cluster of symptoms that occur when food reaches the small bowel too rapidly), and may cause nutrient deficiencies, for example iron and vitamin B₁₂ deficiency (14). In the early 1970s the gastric restrictive techniques were developed in order to increase surgical safety with the idea of restricting the intake of food, making a stomach pouch without a band (15), with a band (16‐18), and, finally, with a band that could be adjusted (19), Figure 1A. These surgical procedures were appealing because they were less invasive, and they are still widely used in Europe, Australia and the US (5, 20). The disadvantages of the band procedures include lesser WL than with RYGB (21, 22) and difficulty eating regular food, which may cause vomiting (21, 22); furthermore, it is easier to consume easily digestible calories such as energy‐rich drinks, ice cream and chocolate (7, 23‐26), which could lead to weight regain (27, 28) In the late 1970s and early 1980s, the technique of biliopancreatic diversion (BPD) was developed in Italy and Canada (29), later including a duodenal switch (30, 31), Figure 1D. The current BPD consists of a vertical sleeve gastrectomy, a gastrojejunostomy with a 250‐cm Roux limb, and anastomosis of the long biliopancreatic limb to the Roux limb 50–100 cm proximal to the ileocecal valve, creating an extremely short common limb. Studies have shown that these malabsorptive surgeries achieve good WL but are associated with numerous side effects such as diarrhea and nutritional deficiencies (32‐34). A surgical technique that has recently been introduced is the gastric sleeve gastrectomy, in which the major curve of the stomach is resected, leaving a tube that restricting volume of food intake (35), Figure 1B. Sleeve gastrectomy is intuitively attractive in many ways because it does not involve any rearrangement of the bowel and seems to be well tolerated in terms of dietary intake (24, 25, 36, 37). However, the long‐term outcomes – in terms of risk of weight regain, the relief or cure of obesity‐related co‐morbidities, and side effects – are currently unknown (38).
4
Figure 1A. Adjustable gastric banding Figure 1B. Sleeve gastrectomy Figure 1C. Roux‐en‐Y gastric bypass Figure 1D. Biliopancreatic diversion with duodenal switch. Reproduced from New England Journal of Medicine (39) with permission. The technology of RYGB has evolved over the years and the procedure is nowadays performed laparoscopically (40, 41). No organs or tissues are removed during a RYGB; instead, the food passage in the upper gut is altered. A small stomach pouch of approximately 15–25 mL is divided from the rest of the stomach. Then the small intestine is divided some 50–60 cm from the duodeno‐jejunal junction and the distal part is brought up to and connected to the small pouch. The biliopancreatic limb (carrying bile, pancreatic fluid and gastric juices) is connected to the Roux limb (which is the first
5
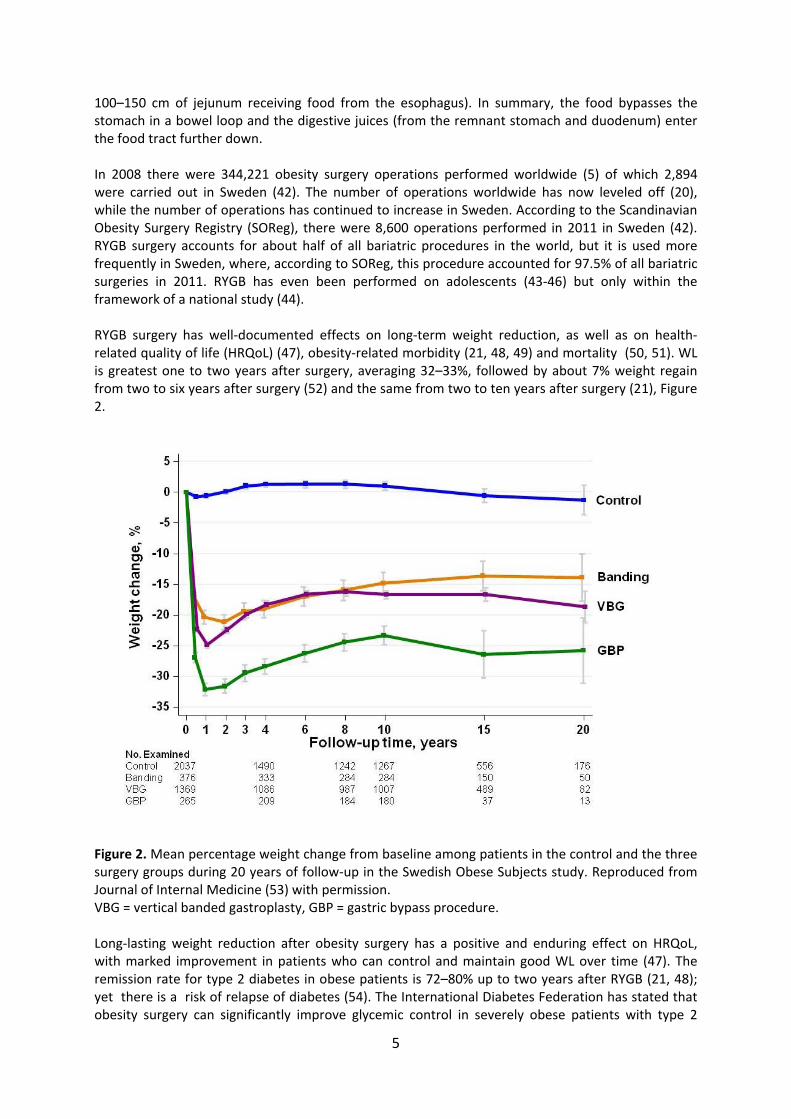
100–150 cm of jejunum receiving food from the esophagus). In summary, the food bypasses the stomach in a bowel loop and the digestive juices (from the remnant stomach and duodenum) enter the food tract further down. In 2008 there were 344,221 obesity surgery operations performed worldwide (5) of which 2,894 were carried out in Sweden (42). The number of operations worldwide has now leveled off (20), while the number of operations has continued to increase in Sweden. According to the Scandinavian Obesity Surgery Registry (SOReg), there were 8,600 operations performed in 2011 in Sweden (42). RYGB surgery accounts for about half of all bariatric procedures in the world, but it is used more frequently in Sweden, where, according to SOReg, this procedure accounted for 97.5% of all bariatric surgeries in 2011. RYGB has even been performed on adolescents (43‐46) but only within the framework of a national study (44). RYGB surgery has well‐documented effects on long‐term weight reduction, as well as on health‐related quality of life (HRQoL) (47), obesity‐related morbidity (21, 48, 49) and mortality (50, 51). WL is greatest one to two years after surgery, averaging 32–33%, followed by about 7% weight regain from two to six years after surgery (52) and the same from two to ten years after surgery (21), Figure 2.
Figure 2. Mean percentage weight change from baseline among patients in the control and the three surgery groups during 20 years of follow‐up in the Swedish Obese Subjects study. Reproduced from Journal of Internal Medicine (53) with permission. VBG = vertical banded gastroplasty, GBP = gastric bypass procedure. Long‐lasting weight reduction after obesity surgery has a positive and enduring effect on HRQoL, with marked improvement in patients who can control and maintain good WL over time (47). The remission rate for type 2 diabetes in obese patients is 72–80% up to two years after RYGB (21, 48); yet there is a risk of relapse of diabetes (54). The International Diabetes Federation has stated that obesity surgery can significantly improve glycemic control in severely obese patients with type 2
6
diabetes and that surgery can be considered as eligible treatment for individuals not achieving recommended treatment targets with medical therapies (55). RYGB is also effective in alleviating or curing other obesity‐related morbidity, namely, sleep apnea (56), high blood pressure (57), cardiovascular disease (21, 58, 59), reduced knee pain in patients with osteoarthritis (60), and polycystic ovarian syndrome (61). Compared with obese controls receiving non‐surgical treatment, it seems that health care costs are initially greater in the surgery group, but drug costs decrease in the long term (62, 63). If quality of life is taken into account, by calculating quality‐adjusted life‐year (QALY), the economic benefits are even greater (64). Not only can the RYGB procedure relieve or cure other diseases, it has also been shown to have a preventive effect on the development of diabetes (65) and cancer (66). Mortality rate in the short term, as a direct result of surgical complications, is 0.02% according to SOReg (67); in the long term, mortality rates are lower than those of a well‐matched control group (50).
2.2 Mechanisms of weight reduction by RYGB
The mechanism of action in RYGB is complex and a number of reports have demonstrated a multifactor background for the observed changes in dietary intake. A profound increase in dietary response for several GI hormones promoting satiety (68‐71) and a reduction in post‐surgery hedonic hunger (72, 73), as well as food preference and taste changes (74‐78), have been reported. It has been demonstrated that the motivation to eat after RYGB decreases due to reduced reward (78, 79), and activation in the brain reward network areas of high‐calorie food is reduced after RYGB surgery (80). Furthermore, animal studies have shown that weight loss following gastric bypass is not accompanied by the same reduction in energy expenditure as after conventional weight loss (81). A long‐term study after bariatric surgery demonstrated that patients after RYGB had higher energy expenditure over 24 h compared to a matched subject group with VBG (82). The main driver for this difference was a larger meal‐induced thermogenesis in RYGB patients. DS has been suggested as one of the mechanisms for reduced energy intake (EI) by RYGB. DS is regarded as a beneficial feature of the RYGB operation, as the patient learns to avoid energy‐dense foods and to eat less at each meal. Dumping may be seen as a negative feedback mechanism (similar to negative conditioning) triggered by particular dishes, tastes, and smells that have been associated with vomiting and nausea (83‐88). Although malabsorption is not the main mechanism of the effect of RYGB, it cannot be ignored (89‐91). Reduced energy absorption after RYGB with a Roux limb length of 150 cm and a biliopancreatic limb from 40–75 cm beyond the ligament of Treitz was found to be equivalent to excretion of 170 kcal/day or 11% of total EI as measured 14 months after surgery, with large individual variations (89). This compares to 116 kcal or 4.4% in a sample of healthy people (92). Further indications that fat malabsorption cannot be overlooked is shown in the increased number of reports of kidney stone formation after RYGB (93‐101), a mechanism that is well known from research on inflammatory bowel diseases (102). The treatment of oxalate stones includes a fat‐reduced diet (102), reduced intake of foods rich in oxalate, increased calcium intake and manipulation of GI flora by using probiotics (103).
7
Gastric pouch sizes do not correspond with weight loss or regain after gastric bypass (104‐108), instead the Roux limb seems to be important for regulating food intake after RYGB surgery (109), as the thresholds for eliciting distension‐induced sensations have been shown to be strongly and negatively correlated to the preferred meal size. In addition to the physiological mechanisms, genetic factors strongly influence the effect of RYGB on body weight (110, 111).
2.3 Gastrointestinal symptoms in obesity and after RYGB
Increasing BMI is associated with increased prevalence of upper GI symptoms, like bloating, and diarrhea (112, 113). It seems that morbidly obese patients experience more intense GI symptoms compared to normal‐weight persons, and many of these symptoms can be reversed both in the short term (114, 115) and long term (116) after RYGB.
2.4 Dietary intake and eating behavior in obesity and after RYGB
2.4.1 Dietary guidelines for gastric bypass
The first guidelines regarding the overall care of patients undergoing bariatric surgery were developed in 1991 (117) by the American National Institute of Health, giving recommendations concerning indications and contraindications for patients presenting for surgery; the guidelines stated that preoperative assessment should be made of a multidisciplinary team and that lifelong follow‐up is needed. In 2004 (updated 2009), the first evidence‐based guidelines were developed by the Betsy Lehman Center Expert Panel on Weight Loss Surgery (118, 119). European interdisciplinary guidelines were developed in 2007 by the Bariatric Scientific Collaborative Group (120). This was followed in 2008 by the Allied Health Nutritional Guidelines for the Surgical Weight Loss Patient (14) and the US guidelines for clinical practice for nutritional, metabolic and non‐surgical support of the bariatric surgery patient (6). In 2010, the Endocrine Society clinical practice guideline Endocrine and Nutritional Management of the Post‐Bariatric Surgery Patient was developed (121). Nutrition evaluation and treatment should be started before surgery because nutritional deficiencies are common in obese patients (6, 14, 34, 119). Furthermore preoperative WL is recommended, given that the high prevalence of liver steatosis makes it difficult to perform surgery with laparoscopic techniques, and that WL may reduce complication rates (122, 123). Most surgical WL programs encourage the use of a protocol‐derived staged meal progression to achieve the best possible conditions for weight reduction and to minimize side effects like early satiety, and DS (6, 14, 120, 121, 124, 125). American guidelines recommend the following dietary advice: patients should adhere to a plan of multiple small meals each day, chewing their food thoroughly without drinking beverages at the same time (more than 30 minutes apart). Patients should be advised to adhere to a balanced meal plan that consists of more than five servings of fruits and vegetables daily for optimal fiber consumption, colonic function, and phytochemical consumption. Protein intake should average 60–120 g daily. Candies should be avoided after RYGB to minimize DS symptoms and to reduce calorie intake. Fluids should be consumed slowly and in sufficient amounts to maintain adequate hydration (>1.5 L daily) (6). Other reports provide advice including the total avoidance of high‐calorie liquids (126), taking 20 minutes or more to eat a meal (127), and prioritizing protein intake at the meal (124). The scientific background to existing guidelines (6, 14, 121, 128) covers vitamin and mineral needs more comprehensively than eating behavior and eating patterns; however, aspects of vitamin and mineral needs after bariatric surgery lie beyond the scope of this thesis.
8
2.4.2 Measuring dietary intake in obese people
It is undoubtedly difficult to verify how and what people eat (129); there are many sources of bias related to self‐reporting of food intake, including a risk of selective under‐reporting of socially undesirable foods (130, 131). The risk of under‐reporting may be related to the degree of obesity (132). Selective under‐reporting of certain food types such as foods of low social desirability by obese individuals has implications for the analysis and interpretation of dietary surveys (133, 134). Proper dietary survey methodology is essential to get as close to the truth as possible. It has been shown, for example, that a four‐day diet registration leads to an under‐reporting of EI of approximately 35% (135) compared to using a dietary questionnaire that captures habitual intake over time (135). Moreover, it has been demonstrated that under‐reporting is related to BMI (132, 136). However, there are ways to verify the accuracy of reported dietary intake; for example, protein intake can be validated by comparing with nitrogen excretion in urine (135, 137) and EI can be validated using the doubly labeled water technique (138). To overcome the limitations of different assessment tools, complementary direct measurement of food intake and food selection has been proposed (139, 140).
2.4.3 Dietary intake and eating behavior in obesity
Short‐term experimental studies show that people tend to eat a consistent volume of food (141); thus, even small changes in DED may have significant effects on EI. The higher the energy percentage of fat in the diet, the higher the prevalence of obesity in a population (142). A meta‐analysis has shown that reduced intake of fat is related to reduced weight (143). A low‐fat diet is considered to contain 25–30 E% fat, a moderate‐fat diet 30–45 E% fat, and a high‐fat diet over 45 E% fat (144). Portion size is an important factor for EI. Increased portion sizes of energy‐dense foods affect total EI, as shown in a study of US children and adolescents (145). Increased portion size of foods also increases EI in normal‐weight and overweight men and women (146‐148). There is controversy about whether the number of meals affects BMI. Epidemiological as well as experimental studies have shown inconsistent results regarding an association between meal frequency and BMI (149‐151). There seems to be greater correlation between skipping breakfast and higher BMI (148, 152, 153). Being obese is also associated with a meal pattern shifted to later during the day (148). Population studies have demonstrated that eating rate – the time period in which food is consumed – is positively correlated with BMI (154‐156). Experimental studies have shown that reduction in eating rate is accompanied with reduced caloric intake and increased satiety (157, 158). Eating behavior is a term that has no precise definition and can thus have several meanings. It may, for example, be defined as the skipping of breakfast, meal frequency, snacking, irregular eating, portion size, or eating rate (159), “grazing” or “nibbling”. Grazing behavior is described as repeated episodes of consumption of smaller quantities of foods over a long period of time with accompanying feelings of loss of control (160). Nibbling has been defined as eating in an unplanned and repetitious manner between meals and snacks without an accompanying sense of loss of control (161, 162). Other types of eating behavior have been identified, such as cognitive restraint (CR), uncontrolled eating (UE) and emotional eating (EE) (163, 164). The CR scale assesses the tendency to control food
9
intake in order to influence body weight and body shape. The UE scale assesses the tendency to lose control over eating when feeling hungry or when exposed to external stimuli. The EE scale measures the propensity to overeat in relation to negative mood states, e.g., when feeling lonely, anxious, or depressed. Energy‐dense foods are positively associated with UE and emotional eaters had a higher snacking food intake (165). CR is widespread in affluent societies; CR has been shown to be negatively associated with BMI (the higher the CR, the lower the BMI) in an obese sample (166, 167). People who demonstrate more CR experience greater WL after RYGB (168) but research also suggests that CR plays a paradoxical role in the development of obesity (169, 170). Eating or meal pattern is defined as type of meals, meal order and meal diurnal distribution. Finally, eating disorders are well defined and classified, for example, binge eating disorder (see section 2.5.2) and night eating disorder.
2.4.4 Dietary intake and eating behavior after RYGB
The popularity of RYGB can be attributed to its success in achieving excellent WL together with improved dietary quality. Patients tend to decrease fat intake and increase their intake of more low‐fat foods and fruit and vegetables after RYGB (7, 24, 26, 68, 140, 171‐174). It has been suggested that this change in food choice after RYGB is due to altered taste (75, 140), aversion to fatty foods (110, 171, 175) and increased risk of DS (see section 2.5.3) (176) which itself has been regarded as a beneficial feature of RYGB promoting avoidance of high caloric foods. Studying dietary preferences and eating behavior in rat models is a way to test hypotheses based on results from human studies. Animal studies have shown that, after RYGB, rats reduced their intake of sucrose (76, 177) and fat (91, 175, 178); they also decreased portion size (178) and increased meal frequency (178). Fewer studies address changes in eating behavior include meal size and number of meals, although some studies on meal frequency after RYGB indicate that a high meal frequency may be related to lower WL (179, 180). Post‐bariatric surgery patients seem to view grazing as a healthy eating behavior characterized by consciously choosing food that is consumed frequently in small amounts throughout the day (181). In contrast, grazing may also be viewed as an unhealthy eating pattern characterized by unplanned, mindless, continuous food consumption (181).
2.5 The Nutrition Care Process
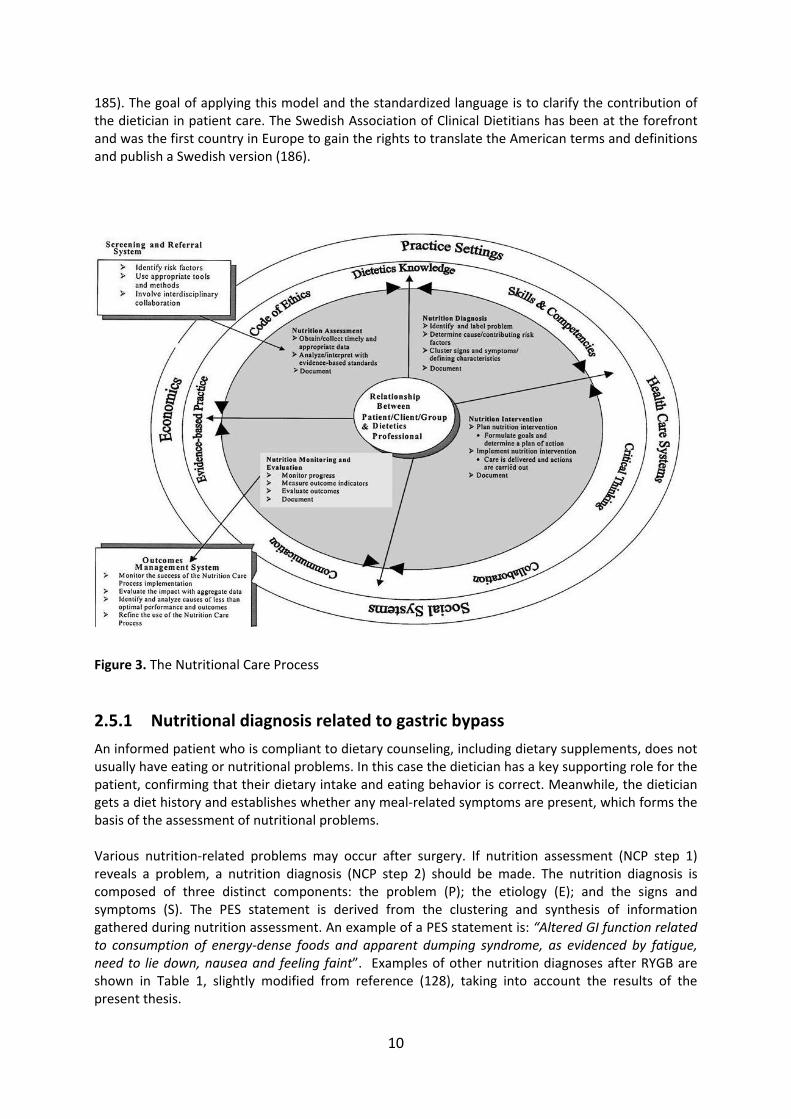
The aim of the Nutrition Care Process (NCP), developed by Academy of Nutrition and Dietetics (182), is to improve the consistency and quality of individualized care for patients or groups through the four steps in Figure 3: 1. nutrition assessment; 2. nutrition diagnosis; 3. nutrition intervention; and 4. monitoring and evaluation. The NCP is a systematic problem‐solving method enabling dieticians to think critically and make decisions regarding practice‐related problems (183); the methodology includes a standardized terminology for documentation, the International Dietetics & Nutrition Terminology (IDNT) (184,
10
185). The goal of applying this model and the standardized language is to clarify the contribution of the dietician in patient care. The Swedish Association of Clinical Dietitians has been at the forefront and was the first country in Europe to gain the rights to translate the American terms and definitions and publish a Swedish version (186).
Figure 3. The Nutritional Care Process
2.5.1 Nutritional diagnosis related to gastric bypass
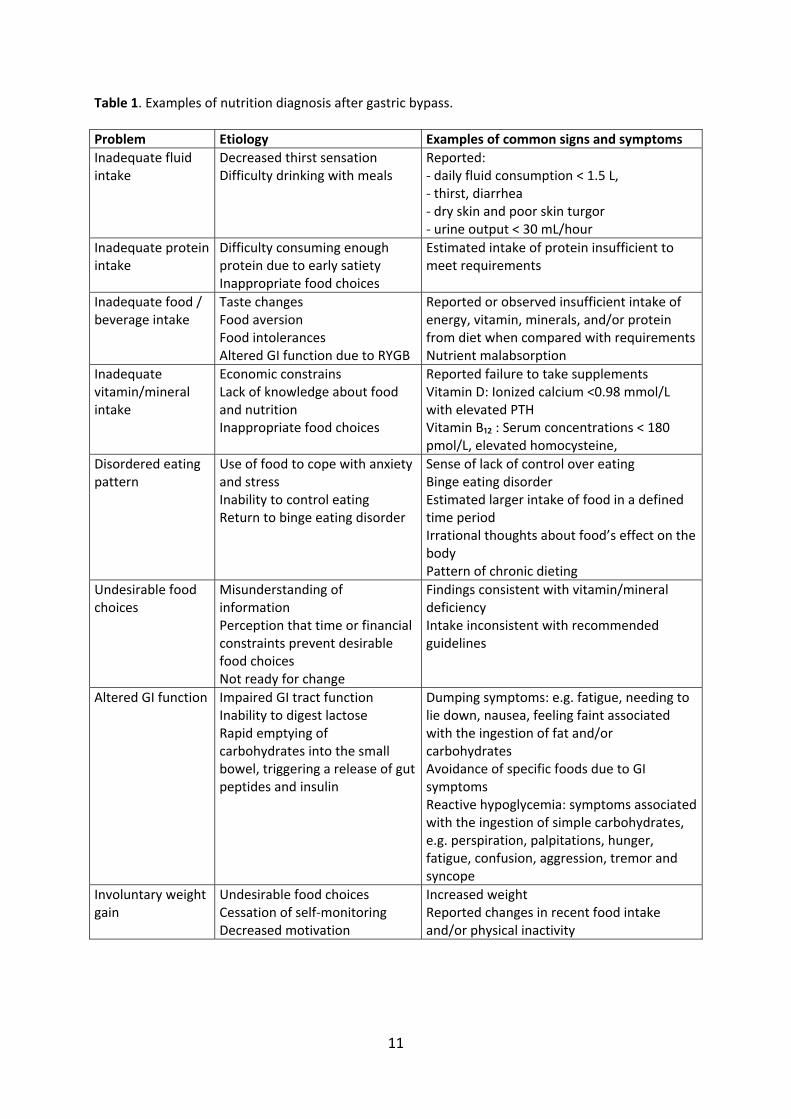
An informed patient who is compliant to dietary counseling, including dietary supplements, does not usually have eating or nutritional problems. In this case the dietician has a key supporting role for the patient, confirming that their dietary intake and eating behavior is correct. Meanwhile, the dietician gets a diet history and establishes whether any meal‐related symptoms are present, which forms the basis of the assessment of nutritional problems. Various nutrition‐related problems may occur after surgery. If nutrition assessment (NCP step 1) reveals a problem, a nutrition diagnosis (NCP step 2) should be made. The nutrition diagnosis is composed of three distinct components: the problem (P); the etiology (E); and the signs and symptoms (S). The PES statement is derived from the clustering and synthesis of information gathered during nutrition assessment. An example of a PES statement is: “Altered GI function related to consumption of energy‐dense foods and apparent dumping syndrome, as evidenced by fatigue, need to lie down, nausea and feeling faint”. Examples of other nutrition diagnoses after RYGB are shown in Table 1, slightly modified from reference (128), taking into account the results of the present thesis.
11
Table 1. Examples of nutrition diagnosis after gastric bypass.
Problem Etiology Examples of common signs and symptoms
Inadequate fluid intake
Decreased thirst sensation Difficulty drinking with meals
Reported: ‐ daily fluid consumption < 1.5 L, ‐ thirst, diarrhea ‐ dry skin and poor skin turgor ‐ urine output < 30 mL/hour
Inadequate protein intake
Difficulty consuming enough protein due to early satiety Inappropriate food choices
Estimated intake of protein insufficient to meet requirements
Inadequate food / beverage intake
Taste changes Food aversion Food intolerances Altered GI function due to RYGB
Reported or observed insufficient intake of energy, vitamin, minerals, and/or protein from diet when compared with requirementsNutrient malabsorption
Inadequate vitamin/mineral intake
Economic constrains Lack of knowledge about food and nutrition Inappropriate food choices
Reported failure to take supplements Vitamin D: Ionized calcium <0.98 mmol/L with elevated PTH Vitamin B₁₂ : Serum concentrations < 180 pmol/L, elevated homocysteine,
Disordered eating pattern
Use of food to cope with anxiety and stress Inability to control eating Return to binge eating disorder
Sense of lack of control over eating Binge eating disorder Estimated larger intake of food in a defined time period Irrational thoughts about food’s effect on the body Pattern of chronic dieting
Undesirable food choices
Misunderstanding of information Perception that time or financial constraints prevent desirable food choices Not ready for change
Findings consistent with vitamin/mineral deficiency Intake inconsistent with recommended guidelines
Altered GI function Impaired GI tract function Inability to digest lactose Rapid emptying of carbohydrates into the small bowel, triggering a release of gut peptides and insulin
Dumping symptoms: e.g. fatigue, needing to lie down, nausea, feeling faint associated with the ingestion of fat and/or carbohydrates Avoidance of specific foods due to GI symptoms Reactive hypoglycemia: symptoms associated with the ingestion of simple carbohydrates, e.g. perspiration, palpitations, hunger, fatigue, confusion, aggression, tremor and syncope
Involuntary weight gain
Undesirable food choices Cessation of self‐monitoring Decreased motivation
Increased weight Reported changes in recent food intake and/or physical inactivity
12
Binge eating disorder (BED) is classified under the nutritional diagnosis “disordered eating pattern”; DS and reactive hypoglycemia are classified under the nutritional diagnosis “altered GI function”. Feeling faint has sometimes been referred to as fainting esteem.
2.5.2 Binge eating disorder and RYGB surgery
BED is characterized by the consumption of an unusually large amount of food in a brief period of time (such as two hours), with the patient reporting subjective loss of control during the overeating episode. BED patients do not engage in a compensatory behavior, such as vomiting, laxative abuse, or excessive exercise, after the binge episode, which distinguishes BED from bulimia nervosa. Approximately 10% to 78% of patients seeking bariatric surgery are thought to suffer from BED preoperatively (187‐191); the variation in prevalence may be due to different examination methods. BED is not considered as a contraindication for RYGB and some studies have shown that patients with BED lose the same amount of weight as non‐BED patients (84, 192‐196), while other studies have shown worse outcomes in terms of long‐term weight reduction and quality of life (160, 162, 194, 197, 198).
2.5.3 Dumping syndrome
DS is a well‐known consequence of upper gastrointestinal surgery (199, 200). DS refers to symptoms occurring shortly after food reaches the small bowel. The arrival of hyperosmolar contents to the small bowel causes fluid to move from the intravascular component to the intestinal lumen (201) leading to a decrease in the circulating volume. The fluid shift into the small bowel might also cause duodenal distention, followed by cramp‐like contractions. Another mechanism that contributes to the pathogenesis of DS is the increased release of several GI peptide hormones (202). The mode of action of these hormones might include changes in GI motility and secretion, as well as hemodynamic effects; for example, systemic hemoconcentration and hypotension occur as a result of vasodilatation induced by neurotensin or vasoactive intestinal polypeptide (203). DS occurs about 10–30 minutes after a meal (87, 88) and comprises both GI and vasomotor symptoms. GI symptoms include abdominal pain, diarrhea, borborygmi, nausea and bloating. Vasomotor symptoms include fatigue, a need to lie down after meals, facial flushing, palpitations, perspiration, tachycardia, hypotension, and syncope. DS has been suggested as a possible cause of WL after RYGB through a negative feedback mechanism when consuming high‐energy dense foods similar to negative feedback responses to particular dishes’ tastes and smells (taste aversion) that have been associated with vomiting and with nausea. However, Clinical studies have shown that the amount of WL following RYGB does not correlate with the severity of DS (86, 168, 204, 205). There are major differences in the reported prevalence of DS, from 10% of patients after gastric surgery (206) to 75% after RYGB (86). In 1970, Sigstad proposed a diagnostic index based on the occurrence of different DS symptoms after gastric resections (207), which has been used to examine the association between dumping and WL after RYGB (86). This index is designed to be used in a provocation test, with the questions expressed in the present tense, and therefore it is not suitable for measuring DS retrospectively (for example during the preceding week). Diagnosis has also been based on clinical information (208, 209) or a one‐item ordinal scale (210). None of these methods can discriminate between different qualities or symptoms of DS.
13
2.5.4 Reactive hypoglycemia
DS is a well‐recognized syndrome after gastric surgery, with symptoms occurring shortly after food ingestion (176). Dumping is often categorized as either “early”, i.e. 10–30 min after food ingestion, or “late”, i.e. 1–3 h afterwards (176, 211). As the symptoms and timings are so different (176), symptoms within 30 minutes after food intake are referred to as “dumping” while symptoms after 30 minutes as “hypoglycemia‐like symptoms”. The latter commonly include perspiration, palpitations, hunger, fatigue, confusion, aggression, tremor, and syncope (176, 211). Hypoglycemia‐like symptoms after RYGB can be disabling if unrecognized and untreated, but the consensus is that dietary intervention should be the first‐line treatment (212‐214). Medications can be added and studies using acarbose to reduce carbohydrate absorption rate (215) and somatostatin analogues to inhibit excessive hormonal response (216) have demonstrated moderate effects. Partial or total pancreatectomy are now viewed as too radical because, although beta cell mass decreases (217‐219), symptoms do not always improve, or may reoccur (220). Postprandial hypoglycemia‐like symptoms have been described following gastric surgery for ulcer disease (221, 222) and RYGB (213, 223, 224). In 2007, Goldfine et al. demonstrated that patients with hypoglycemia‐like symptoms after RYGB had higher incretin and insulin in response to a mixed meal compared to ASY patients (224). However, other studies have been unable to confirm this, and instead report no differences between SY and ASY patients in incretin and insulin secretion (225‐227). Furthermore, Halperin et al. studied SY and ASY patients using 72 h continuous blood glucose monitoring as patients consumed their usual diet but also during a mixed meal tolerance test (228). The conclusion was that continuous blood glucose monitoring both had a low sensitivity and specificity for diagnosing post RYGB hypoglycemia.
2.5.5 Psychosocial impact on outcome after RYGB
Recent studies have demonstrated the importance of self‐monitoring to achieve a good long‐term result in terms of weight reduction, reduced risk of weight regain and avoidance of negative symptoms (229‐234). Sarwer et al. have shown that baseline cognitive restraint and adherence to the recommended postoperative diet were associated with greater WL after RYGB surgery (230). Other factors that predict the development and maintenance of weight include surgeon follow‐up visits and postoperative support groups (232‐234), although those who attend appointments may be those who have lost most weight. Sarwer’s group claims that it is possible to apply lessons from the National Weight Control Registry (235‐237), even when it comes to bariatric surgery (229). This voluntary registry includes individuals from throughout the world who have maintained a minimum 13.5 kg WL for one year. By sharing their experiences of success with researchers, they enabled the identification of behavioral strategies critical to long‐term weight control. Sarwer et al. suggest an increased use of the following strategies for success: self‐monitoring of weight and food intake; continued patient–provider contact; and physical activity (229). Profound WL after bariatric surgery was shown to be associated with increased eating self‐efficacy (an individual’s confidence in their ability to execute a behavior in the face of perceived obstacles or challenging situations) in a population of obese adults seeking medical treatment for obesity (238). Major factors that influence weight regain are related to poor diet quality, sedentary lifestyle, and lack of nutritional counseling follow‐up (239).
14
Dietary counseling (231, 240), individual food preferences and dislikes, food culture, previous experiences of dieting, emotional state and behavior may all influence GI function. Moreover, voluntary psychological mechanisms, such as the awareness of and behavioral response to general and abdominal discomfort when eating, are equally important (176). Physical activity and sustained intake of dietary protein may be good strategies for increasing non‐resting and then total energy expenditure, as well as for preventing a decline in muscle mass and resting energy expenditure (241). In a systematic meta‐analysis, 15 of 17 studies showed that physical activity was associated with a mean of 3.6 kg greater WL after bariatric surgery (242) compared with a more sedentary lifestyle.
15
3 HYPOTHESES AND AIMS OF THE THESIS The overall aim of this thesis was to examine changes in dietary intake, eating behavior and meal‐related symptoms among RYGB patients in order to enhance current knowledge and to improve existing treatment protocols. The more specific goals are outlined below.
Paper I To test the hypothesis that dietary energy density decreases after gastric bypass surgery. To analyze whether changes in food selection are based on dietary energy density. To analyze whether changes in dietary energy density are associated with changes in body weight.
Paper II To examine changes in portion size, meal duration and eating rate in relation to voluntary food intake. To evaluate pre‐meal hunger, post‐meal satiation and maintained satiety in relation to voluntary food intake. To examine the changes in diurnal distribution and number of meals. To examine changes in general attitude to food as evidenced by cognitive restraint, uncontrolled eating and emotional eating.
Paper III To describe symptom severity and frequency of different qualities of dumping syndrome in adults and adolescents. To evaluate the construct validity of the Dumping Symptom Rating Scale (DSRS).
Paper IV To test the hypothesis that symptomatic patients with a history of hypoglycemia‐like symptoms would have lower plasma glucoses compared to asymptomatic patients 60 – 120 min after a liquid carbohydrate meal. To test the hypothesis that symptomatic patients would have greater GLP‐1 and higher insulin responses compared to asymptomatic patients after a liquid carbohydrate meal. To test the hypothesis that symptomatic patients would have a lower glucagon response compared to asymptomatic patients after a liquid carbohydrate meal.
16
4 PATIENTS AND METHODS
4.1 Study populations
Patients on the waiting list for RYGB were invited to participate in Studies I and II. The inclusion criterion was BMI 35–50 kg/m². Exclusion criteria were inability to understand instructions and insulin‐treated diabetes mellitus (because gastroparesis, a well‐known complication of diabetes, may influence food choice). Fifty patients were recruited during the period from April 2004 to April 2008. Altogether, 47 patients (35 women and 12 men) were enrolled, of whom 43 completed the protocol, Table 2. In Study III, the same cohort of adults as in Studies I and II was used and an additional sample of 94 eligible obese adolescents was offered RYGB treatment (44). Twelve declined surgical treatment and the remaining 82 were enrolled in the study (53 girls and 29 boys, mean age 16.5 [1.2] years, mean BMI 45.5 [6.0] kg/m²) between February 2006 and April 2009, Table 2. Inclusion criteria were completion of a psychological evaluation, puberty status (Tanner score 4–5) and at least one year with active conservative treatment that had failed. Exclusion criteria were lack of compliance, specific obesity syndrome, Prader–Willi syndrome, brain injuries that may lead to obesity and specific genetic defects (MC4R, Leptin deficiency). Of the 82 enrolled, one refused surgery on the day of the operation; thus, 81 individuals underwent surgery and were included in the validation of the DSRS. The adolescents were examined before RYGB surgery and one and two years afterward. Preoperatively, 17% of participants (21 of 124 visits) did not complete the DSRS, and 14% (36 of 248 visits) failed to complete it postoperatively, due to an administrative error in which the questionnaire was not distributed to all participants, Figure 4. Thirty‐one non‐obese subjects served as a reference group in Studies II and III. The reference group included healthy volunteers who had expressed interest in being included in studies at the Sahlgrenska Academy, including students and staff at the University Hospital, as well as people who had no ties to the hospital. In Paper IV, two groups of patients following RYGB were identified from Sahlgrenska University Hospital where during a ten year period more than 1500 patients had a RYGB. Out of this group we identified eight patients having demonstrated clinically relevant hypoglycemia‐like symptoms on several occasions (symptomatic patients (SY)). They were either referred from primary care or identified in the outpatient clinic as having severe hypoglycemia‐like symptoms as defined by Whipple's triad (243) which comprises: 1. Symptoms or signs, such as perspiration, palpitations, hunger, fatigue, confusion, aggression, tremor and syncope; 2. A low plasma glucose concentration; and 3. Resolution of those symptoms or signs after carbohydrate intake. Eight other RYGB patients matched for sex, age and body mass index (BMI), but with no hypoglycemia‐like symptoms were recruited from the same cohort and labeled asymptomatic patients (ASY). None of the included patients were diabetic or showed signs of insulin resistance at
17
the time of enrollment. A group with non‐obese, non‐operated healthy volunteers were included as a reference. No economical or other compensation was given to the RYGB participants in any of the studies. The non‐obese reference subjects received 50 Euros each for participating in Study II and III. The study protocols were approved by the Regional Ethical Review Board in Gothenburg (Dnr: S 674‐03, Dnr: S 584‐07 and Dnr: S 060‐09) and all participants signed an informed consent form. Parents gave the informed consent for adolescents who were below 18 years of age. The surgical procedures were all primary bariatric procedures completed laparoscopically by the same surgeons (Torsten Olbers and Hans Lönroth). The RYGB technique, as described in detail elsewhere (41), included an antecolic‐antegastric Roux‐en‐Y construction with a 10–20 mL gastric pouch and a 100–150 cm Roux limb. Participants were enrolled between April and October 2012 and all visits were completed in December 2012 (Paper IV), Table 2.
18
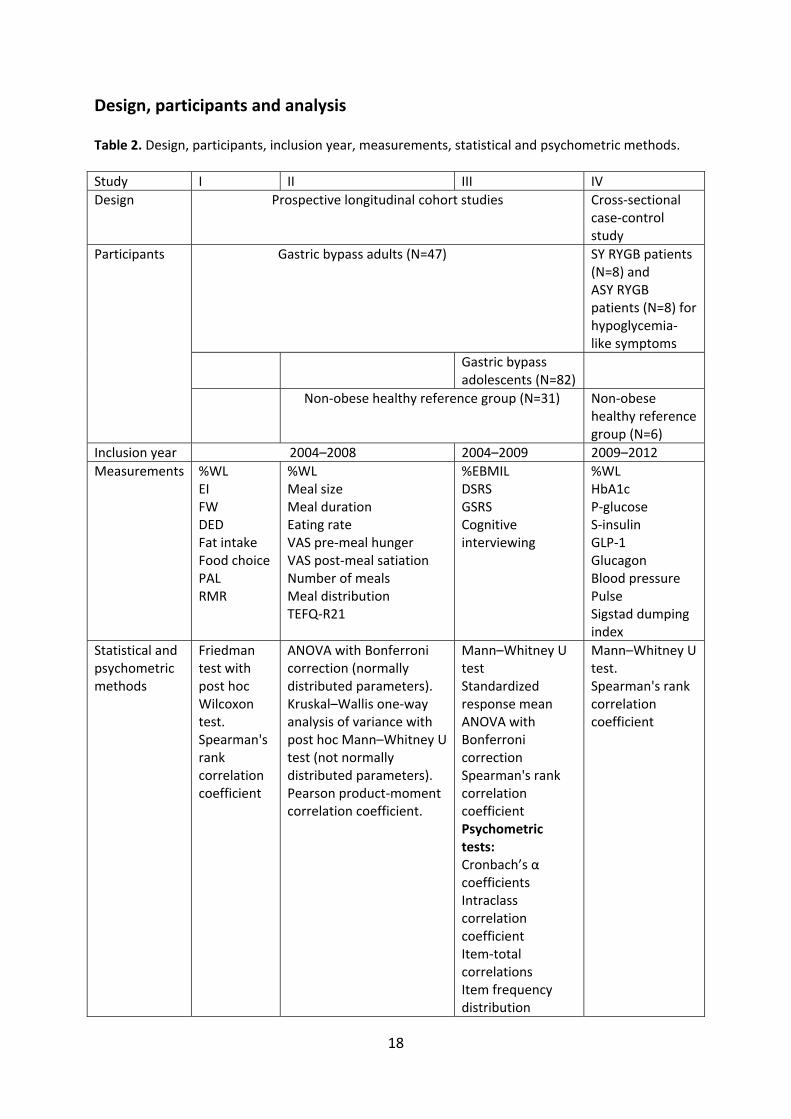
Design, participants and analysis Table 2. Design, participants, inclusion year, measurements, statistical and psychometric methods.
Study I II III IV
Design Prospective longitudinal cohort studies
Cross‐sectional case‐control study
Gastric bypass adults (N=47)
SY RYGB patients (N=8) and ASY RYGB patients (N=8) for hypoglycemia‐like symptoms
Gastric bypass adolescents (N=82)
Participants
Non‐obese healthy reference group (N=31) Non‐obese healthy reference group (N=6)
Inclusion year 2004–2008 2004–2009 2009–2012
Measurements %WL EI FW DED Fat intake Food choice PAL RMR
%WL Meal size Meal duration Eating rate VAS pre‐meal hunger VAS post‐meal satiation Number of meals Meal distribution TEFQ‐R21
%EBMIL DSRS GSRS Cognitive interviewing
%WL HbA1c P‐glucose S‐insulin GLP‐1 Glucagon Blood pressure Pulse Sigstad dumping index
Statistical and psychometric methods
Friedman test with post hoc Wilcoxon test. Spearman's rank correlation coefficient
ANOVA with Bonferroni correction (normally distributed parameters). Kruskal–Wallis one‐way analysis of variance with post hoc Mann–Whitney U test (not normally distributed parameters). Pearson product‐moment correlation coefficient.
Mann–Whitney U test Standardized response mean ANOVA with Bonferroni correction Spearman's rank correlation coefficient Psychometric tests: Cronbach’s α coefficients Intraclass correlation coefficient Item‐total correlations Item frequency distribution
Mann–Whitney U test. Spearman's rank correlation coefficient

19
SY = symptomatic ASY = asymptomatic DED = dietary energy density (kcal/g) EI = energy intake FW = food weight GLP‐1 = glucagon‐like peptide 1 GSRS = Gastrointestinal Symptom Rating Scale PAL = physical activity level RMR = resting metabolic rate %WL = percent weight loss %EBMIL = excessive body mass index loss

20
Figure 4. Flow chart showing participant distribution in Studies I, II, III and IV, as well as excluded patients, dropouts and patients not receiving questionnaires.
Obese adults N = 50
Obese adolescens N=82
Healthy non‐obese reference group, N = 31
RYGB patients with a history of hypoglycemia‐like symptoms, N = 8
RYGB control group without a history of hypoglycemia‐like symptoms, N = 8
Healthy non‐obese reference group N = 6
Study I
RYGB adults, N= 43 N = 47
Study II RYGB adults N= 47 Healthy non‐obese reference group N = 31
Study III
RYGB adults N= 47 RYGB adolescens N = 81
Study IV
RYGB with hypoglycemia‐like symptoms and without hypoglycemia‐like symptoms N = 8 + 8 Healthy non‐obese reference group N = 6
Study I
RYGB adults, N= 43
Study II RYGB adults N= 43 Healthy non‐obese reference group N = 31
Study III
RYGB adults N= 43 RYGB adolescens N = 81
Study IV RYGB with hypoglycemia‐like symptoms and without hypoglycemia‐like symptoms N = 8 + 8 Healthy non‐obese reference group N = 6
Dropout, N = 0 Missing data, N = 0
Dropout, N = 4
Missing data, N = 4 of 172 visits
Dropout, N = 4 Missing data, N = 4 of 172 visits = 2%
Dropout, N = 4 Missing data, 57 of 372 questionnairs = 15%
Declined, N = 3
Declined, N = 1
21
4.2 Methods
4.2.1 The SOS dietary questionnaire (Paper I)
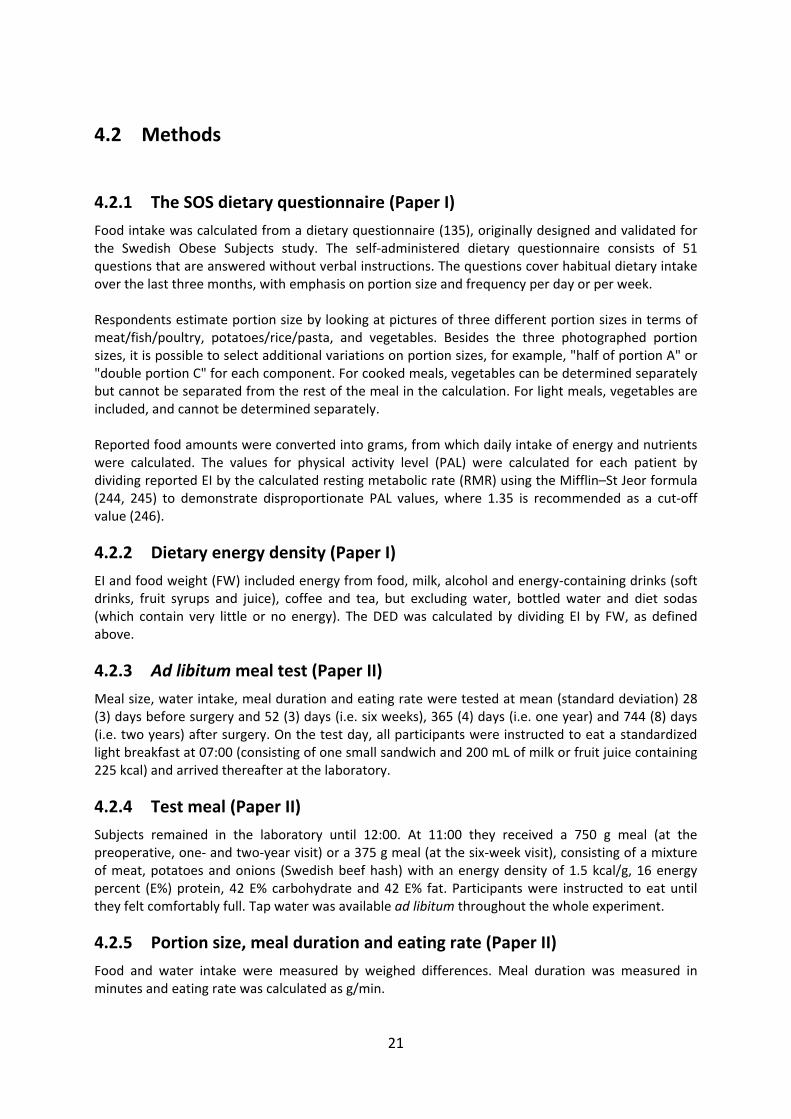
Food intake was calculated from a dietary questionnaire (135), originally designed and validated for the Swedish Obese Subjects study. The self‐administered dietary questionnaire consists of 51 questions that are answered without verbal instructions. The questions cover habitual dietary intake over the last three months, with emphasis on portion size and frequency per day or per week. Respondents estimate portion size by looking at pictures of three different portion sizes in terms of meat/fish/poultry, potatoes/rice/pasta, and vegetables. Besides the three photographed portion sizes, it is possible to select additional variations on portion sizes, for example, "half of portion A" or "double portion C" for each component. For cooked meals, vegetables can be determined separately but cannot be separated from the rest of the meal in the calculation. For light meals, vegetables are included, and cannot be determined separately. Reported food amounts were converted into grams, from which daily intake of energy and nutrients were calculated. The values for physical activity level (PAL) were calculated for each patient by dividing reported EI by the calculated resting metabolic rate (RMR) using the Mifflin–St Jeor formula (244, 245) to demonstrate disproportionate PAL values, where 1.35 is recommended as a cut‐off value (246).
4.2.2 Dietary energy density (Paper I)
EI and food weight (FW) included energy from food, milk, alcohol and energy‐containing drinks (soft drinks, fruit syrups and juice), coffee and tea, but excluding water, bottled water and diet sodas (which contain very little or no energy). The DED was calculated by dividing EI by FW, as defined above.
4.2.3 Ad libitum meal test (Paper II)
Meal size, water intake, meal duration and eating rate were tested at mean (standard deviation) 28 (3) days before surgery and 52 (3) days (i.e. six weeks), 365 (4) days (i.e. one year) and 744 (8) days (i.e. two years) after surgery. On the test day, all participants were instructed to eat a standardized light breakfast at 07:00 (consisting of one small sandwich and 200 mL of milk or fruit juice containing 225 kcal) and arrived thereafter at the laboratory.
4.2.4 Test meal (Paper II)
Subjects remained in the laboratory until 12:00. At 11:00 they received a 750 g meal (at the preoperative, one‐ and two‐year visit) or a 375 g meal (at the six‐week visit), consisting of a mixture of meat, potatoes and onions (Swedish beef hash) with an energy density of 1.5 kcal/g, 16 energy percent (E%) protein, 42 E% carbohydrate and 42 E% fat. Participants were instructed to eat until they felt comfortably full. Tap water was available ad libitum throughout the whole experiment.
4.2.5 Portion size, meal duration and eating rate (Paper II)
Food and water intake were measured by weighed differences. Meal duration was measured in minutes and eating rate was calculated as g/min.
22
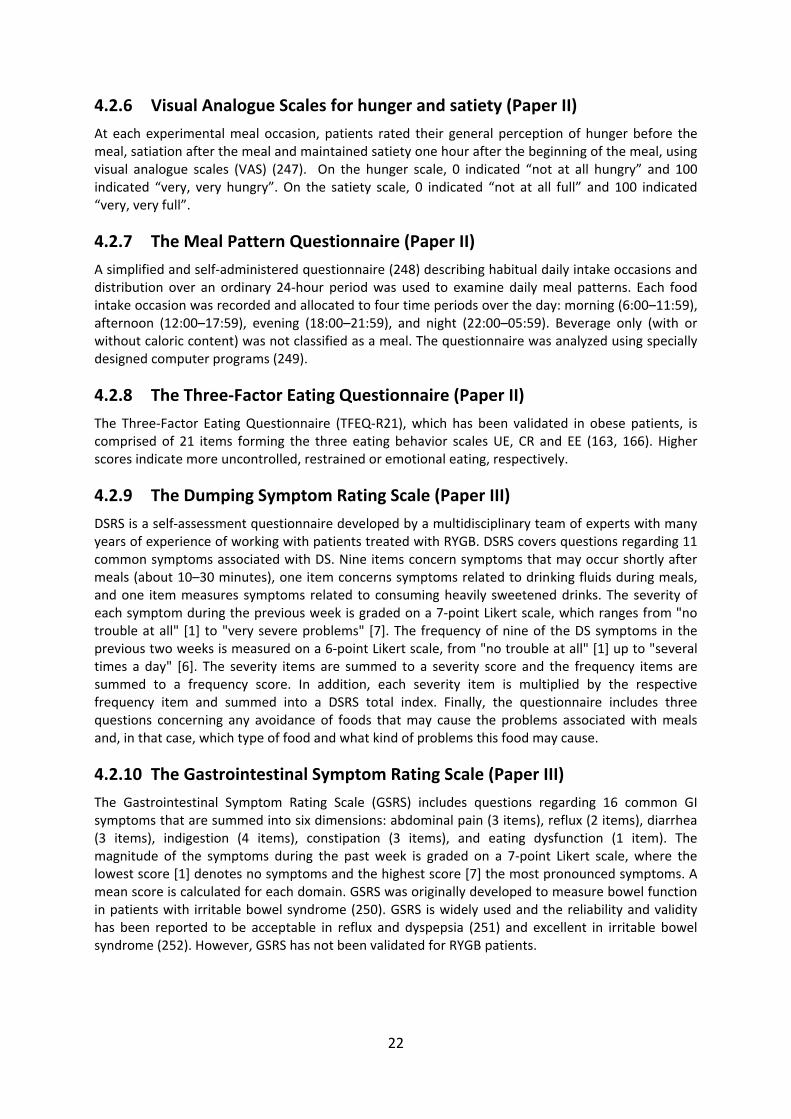
4.2.6 Visual Analogue Scales for hunger and satiety (Paper II)
At each experimental meal occasion, patients rated their general perception of hunger before the meal, satiation after the meal and maintained satiety one hour after the beginning of the meal, using visual analogue scales (VAS) (247). On the hunger scale, 0 indicated “not at all hungry” and 100 indicated “very, very hungry”. On the satiety scale, 0 indicated “not at all full” and 100 indicated “very, very full”.
4.2.7 The Meal Pattern Questionnaire (Paper II)
A simplified and self‐administered questionnaire (248) describing habitual daily intake occasions and distribution over an ordinary 24‐hour period was used to examine daily meal patterns. Each food intake occasion was recorded and allocated to four time periods over the day: morning (6:00–11:59), afternoon (12:00–17:59), evening (18:00–21:59), and night (22:00–05:59). Beverage only (with or without caloric content) was not classified as a meal. The questionnaire was analyzed using specially designed computer programs (249).
4.2.8 The Three‐Factor Eating Questionnaire (Paper II)
The Three‐Factor Eating Questionnaire (TFEQ‐R21), which has been validated in obese patients, is comprised of 21 items forming the three eating behavior scales UE, CR and EE (163, 166). Higher scores indicate more uncontrolled, restrained or emotional eating, respectively.
4.2.9 The Dumping Symptom Rating Scale (Paper III)
DSRS is a self‐assessment questionnaire developed by a multidisciplinary team of experts with many years of experience of working with patients treated with RYGB. DSRS covers questions regarding 11 common symptoms associated with DS. Nine items concern symptoms that may occur shortly after meals (about 10–30 minutes), one item concerns symptoms related to drinking fluids during meals, and one item measures symptoms related to consuming heavily sweetened drinks. The severity of each symptom during the previous week is graded on a 7‐point Likert scale, which ranges from "no trouble at all" [1] to "very severe problems" [7]. The frequency of nine of the DS symptoms in the previous two weeks is measured on a 6‐point Likert scale, from "no trouble at all" [1] up to "several times a day" [6]. The severity items are summed to a severity score and the frequency items are summed to a frequency score. In addition, each severity item is multiplied by the respective frequency item and summed into a DSRS total index. Finally, the questionnaire includes three questions concerning any avoidance of foods that may cause the problems associated with meals and, in that case, which type of food and what kind of problems this food may cause.
4.2.10 The Gastrointestinal Symptom Rating Scale (Paper III)
The Gastrointestinal Symptom Rating Scale (GSRS) includes questions regarding 16 common GI symptoms that are summed into six dimensions: abdominal pain (3 items), reflux (2 items), diarrhea (3 items), indigestion (4 items), constipation (3 items), and eating dysfunction (1 item). The magnitude of the symptoms during the past week is graded on a 7‐point Likert scale, where the lowest score [1] denotes no symptoms and the highest score [7] the most pronounced symptoms. A mean score is calculated for each domain. GSRS was originally developed to measure bowel function in patients with irritable bowel syndrome (250). GSRS is widely used and the reliability and validity has been reported to be acceptable in reflux and dyspepsia (251) and excellent in irritable bowel syndrome (252). However, GSRS has not been validated for RYGB patients.
23
4.2.11 Oral carbohydrate provocation test (Paper IV)
The patients arrived at the laboratory in the morning after an over‐night fast with the instruction not to eat or drink anything after midnight. An antecubital venous cannula was inserted and blood samples were drawn immediately before a liquid test meal and 1, 15, 30, 60, 90, 120, 150, and 180 minutes after finishing the meal. At each time point also blood pressure, pulse rate and symptom score were assessed.
The carbohydrate‐rich drink contained 443 kilocalories (kcal) and a volume of 300 mL consisting of 113 g Resource® Addera Plus, Nestlé HealthCare Nutrition, 113 g Nutrical, Nutricia Nordica AB, and 98 g cold water, which was weighed on a calibrated scale. The nutritional content was 99.5 g carbohydrate, 0.1 g fat and 5.7 g protein. Participants were asked to finish the drink as fast as possible and the time for intake was recorded.
4.2.12 Pulse and blood pressure assessments (Paper IV)
Pulse (beats/min) and blood pressure (mmHg), systolic and diastolic, were recorded at each test point.
4.2.13 Blood analysis (Paper IV)
Blood samples were collected in tubes containing EDTA and aprotinin 10 000 kallikrein inhibition units per mL. The samples were immediately centrifuged at 4°C over 10 minutes at 3100 rpm and then stored at −70°C until analysis. GLP‐1 was analyzed before meal (fasting value) and at 30, 60 and 180 minutes after the meal, whereas insulin, plasma glucose, and glucagon were analyzed at all time points. Total GLP‐1 and glucagon concentrations were measured in duplicate using radioimmunoassays, as described previously (253) Plasma glucose (mmol/L), insulin (mIU/L), glucagon‐like peptide 1 (GLP‐1) pmol/L and glucagon pmol/L. Fasting and postprandial GLP‐1 was analyzed at 30, 60 and 180 minutes, whereas insulin, plasma glucose, and glucagon were also analyzed at 1, 15, 90, 120 and 150 minutes after the meal.
4.2.14 Perceived symptoms (Paper IV)
Reported symptoms were assessed according to Sigstad’s Dumping Index in an interview at each test point (207), Appendix 1, Paper IV. More severe symptoms give a higher score and all qualities are summarized into a total score. A total score of 7 or above is suggestive of DS and the maximum score is 25. The questionnaire was translated into Swedish by the authors and the meaning of the Swedish terms was discussed thoroughly in the research group.
4.3 Statistical and psychometric methods
Paper I Due to limited sample size and skewed distribution, the Friedman test and post hoc Wilcoxon test were chosen to study the changes between pre‐ and post‐surgery states. Values from the non‐obese reference group are presented without any statistical comparisons to the surgical group. Due to skewed distribution, Spearman's rank correlation coefficient was used to analyze associations between changes in DED and %WL.
Paper II

24
Normal distribution was tested with the Kolmogorov–Smirnoff test for both the reference group and the gastric bypass group at all measurement occasions. A non‐significant result suggests that the variable may be normally distributed, which means that the one‐way ANOVA is appropriate as a significance test. The Bonferroni correction was used to reduce the risk of type I error. Apart from number of meals, all variables related to the meal test (meal size, water intake, meal duration, eating rate, pre‐meal hunger, post‐meal satiation and maintained satiety) as well as the three factors in TFEQ were normally distributed one and two years after surgery. Therefore, the simplified and self‐administered questionnaire describing habitual daily food intake occasions, for all time points in the study, was calculated with the non‐parametric Kruskal–Wallis test and post hoc Mann–Whitney U test to adjust for type I error. Pearson product‐moment correlation coefficient was used to examine associations.
Paper III The construct validation process was extensive because using more methods for reliability measurement makes the instrument more trustworthy. By analyzing adults and adolescents separately, using cross‐validation, it is possible to demonstrate similar psychometric results from two different samples. This approach strengthens the results of the validation and also indicates that the instrument is suitable for various subgroups. Cronbach’s α coefficients were computed as an internal consistency estimate of reliability of the scale scores. A coefficient of at least 0.70 is considered adequate (254). To further test the reliability of the DSRS, test‐retest was performed in 17 consecutive gastric bypass adult patients who completed their regular two‐year visit during the study. The DSRS was first completed at the hospital visit and again at home seven days later. The intraclass correlation coefficient, using a two‐way mixed model with absolute agreement, was calculated for each item to assess test–retest reliability. The reference values for the strength of agreement are according to Altman, who considers < 0.20 as poor agreement, 0.21–0.40 as fair, 0.41–0.60 as moderate, 0.61–0.80 as good and 0.81–1.00 as a very good agreement (255). Item‐total correlations were calculated to test the scaling assumptions. Item–scale convergent validity is indicated if each item correlates substantially (r ≥ 0.40, corrected for overlap) with its own scale. The frequency distribution of the DSRS symptom severity and frequency items was calculated and floor and ceiling effects (i.e. respondents obtaining minimum and maximum scores, respectively) were examined. Known‐groups validity is a form of construct validation in which the validity is determined by the degree to which an instrument can demonstrate different scores for groups known to vary on the variables being measured; this was tested with the Mann–Whitney U test by comparing DSRS total index between RYGB patients (adult and adolescents) two years after surgery and a normal‐weight reference group. Effect size of change was calculated from baseline to two years after surgery using the standardized response mean, which is the mean of the change in scores (recorded at assessment of the same subject at two different occasions) divided by the SD of these changes in scores. A standardized response mean of ≤0.2 is considered “trivial”, 0.2–0.5 “small”, 0.5–0.8 “moderate” and ≥0.8 “large”. Significant differences in the various dimensions of GSRS between preoperative and postoperative state were calculated using ANOVA with the Bonferroni correction in order to avoid type I errors. Spearman's rank correlation coefficient was used to test for significant associations between the DSRS total index and the GSRS domains. Criteria for interpreting the magnitude of correlation were

25
taken from Guyatt et al. (256). Spearman’s correlation was also used to investigate the association between the DSRS total index and percent excessive body mass index loss (% EBMIL) instead of %WL (which was used in the other papers) because the journal has this as standard.
Paper IV The Mann–Whitney U test was used to compare results between SY and ASY patients. Values from the non‐obese reference group are presented without any statistical comparisons to the surgical groups. Spearman’s correlation was used to test for significant associations between perceived symptoms and physiological response. In all papers, data are expressed as mean (SD) for demographic data and mean (95% confidence interval, CI) for other variables except for foods avoided in Paper III, where the standard deviation (SD) was used and in Figure 1, Paper IV, where standard error of the mean was used. Results were considered significant with two‐tailed p‐values ≤0.05. All the statistical analyses were carried out using SPSS, version 18.0 (SPSS Inc. Chicago, Illinois).

26
5 RESULTS
5.1 PAPER I – Data on DED and changes in food selection
Body weight change Body weight decreased from 131.7 kg (SD 19.9) preoperatively to 114.1 kg (16.8; p<0.001) at six weeks after surgery. After one year, body weight further decreased to 91.2 kg (16.8; p<0.001) and stabilized at 89.9 kg (18.4; p<0.001) at two years. WL was 13.5% (3.2) at six weeks, 30.7% (6.7) at one year and 31.8% (9.3) two years after surgery (p<0.001 for all).
Energy intake, food weight and DED EI decreased from 2990 kcal to 1774, 2131 and 2425 kcal after six weeks, one and two years after surgery, respectively (p<0.001 at all time points). FW changed from 2844 grams/day (g/d) to 1870 g/d at six weeks (p<0.001) and 2416 g/d after one year (p<0.05), but was not significantly different from baseline after two years, 2602 g/d (p=0.105). DED decreased from 1.07 kcal/g to 0.78 kcal/g at six weeks (p<0.001), 0.90 kcal/g (p<0.001) and 0.96 kcal/g (p=0.001) after one and two years, respectively.
Associations between DED and weight change There was no correlation between changes in DED and %WL, either one year after surgery, r=‐0.215 (p=0.183), or two years after surgery, r=‐0.046 (p=0.775).
Fat intake and food choice Energy percent (E%) from fat decreased substantially – from 37.0 E% to 25.3 E% – at six weeks after surgery (p<0.001) and was still significantly lower after one year, 34.3 E% (p<0.001), and after two years, 35.3 E% (p<0.001), compared with pre‐surgery levels (Table 2). The largest change in EI from foods with different DED was found six weeks after the gastric bypass, when EI from very low DED foods had increased, with a concomitant reduction in EI from high DED foods. The increased percentage of foods from very low DED food groups was maintained at one year, but not at two years, after surgery. The decreased E% intake from high DED food sources was not maintained at one or two years after surgery compared with baseline levels. EI from low and medium DED did not change at any time point after surgery. EI from fruit increased significantly, and was maintained one and two years after surgery.
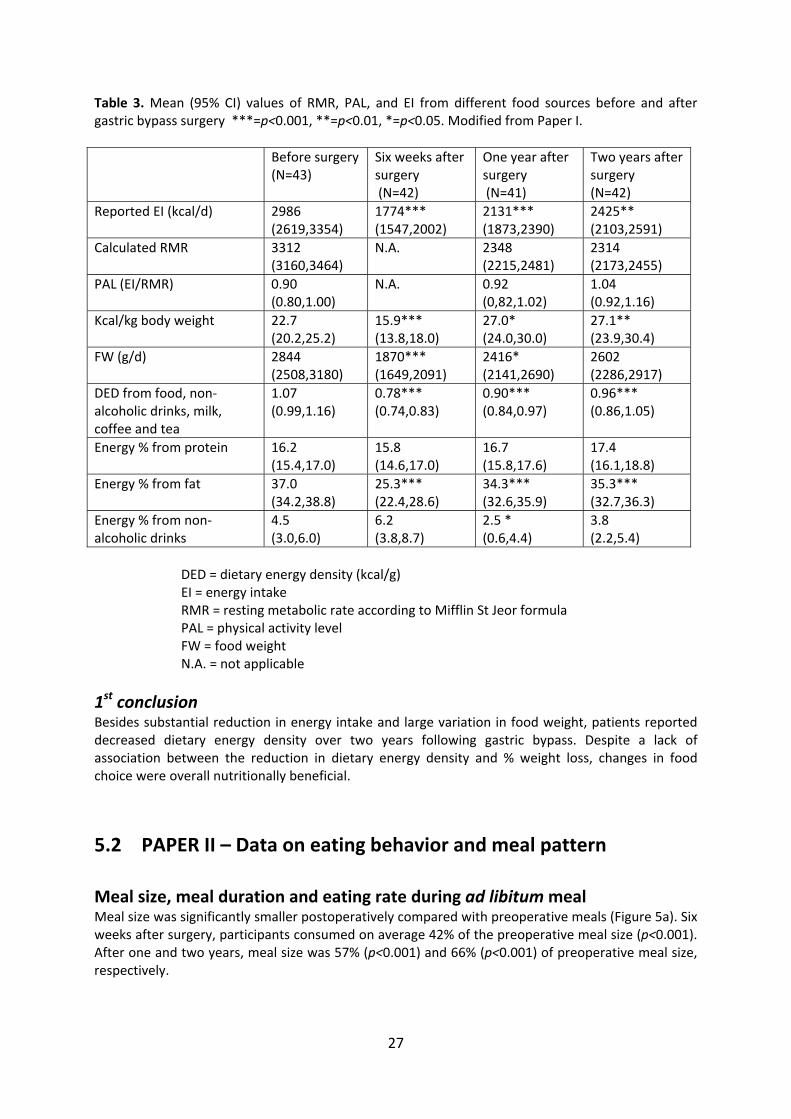
27
Table 3. Mean (95% CI) values of RMR, PAL, and EI from different food sources before and after gastric bypass surgery ***=p<0.001, **=p<0.01, *=p<0.05. Modified from Paper I.
Before surgery (N=43)
Six weeks after surgery (N=42)
One year after surgery (N=41)
Two years after surgery (N=42)
Reported EI (kcal/d) 2986 (2619,3354)
1774*** (1547,2002)
2131*** (1873,2390)
2425** (2103,2591)
Calculated RMR 3312 (3160,3464)
N.A. 2348 (2215,2481)
2314 (2173,2455)
PAL (EI/RMR) 0.90 (0.80,1.00)
N.A. 0.92 (0,82,1.02)
1.04 (0.92,1.16)
Kcal/kg body weight 22.7 (20.2,25.2)
15.9*** (13.8,18.0)
27.0* (24.0,30.0)
27.1** (23.9,30.4)
FW (g/d) 2844 (2508,3180)
1870*** (1649,2091)
2416* (2141,2690)
2602 (2286,2917)
DED from food, non‐alcoholic drinks, milk, coffee and tea
1.07 (0.99,1.16)
0.78*** (0.74,0.83)
0.90*** (0.84,0.97)
0.96*** (0.86,1.05)
Energy % from protein
16.2 (15.4,17.0)
15.8 (14.6,17.0)
16.7 (15.8,17.6)
17.4 (16.1,18.8)
Energy % from fat 37.0 (34.2,38.8)
25.3*** (22.4,28.6)
34.3*** (32.6,35.9)
35.3*** (32.7,36.3)
Energy % from non‐alcoholic drinks
4.5 (3.0,6.0)
6.2 (3.8,8.7)
2.5 * (0.6,4.4)
3.8 (2.2,5.4)
DED = dietary energy density (kcal/g) EI = energy intake RMR = resting metabolic rate according to Mifflin St Jeor formula PAL = physical activity level FW = food weight N.A. = not applicable
1st conclusion Besides substantial reduction in energy intake and large variation in food weight, patients reported decreased dietary energy density over two years following gastric bypass. Despite a lack of association between the reduction in dietary energy density and % weight loss, changes in food choice were overall nutritionally beneficial.
5.2 PAPER II – Data on eating behavior and meal pattern
Meal size, meal duration and eating rate during ad libitum meal Meal size was significantly smaller postoperatively compared with preoperative meals (Figure 5a). Six weeks after surgery, participants consumed on average 42% of the preoperative meal size (p<0.001). After one and two years, meal size was 57% (p<0.001) and 66% (p<0.001) of preoperative meal size, respectively.

28
The mean meal duration was 12.0 minutes (95% CI 10.6–13.4) preoperatively, 12.0 minutes (10.3,13.6) at six weeks, 10.9 minutes (9.6,12.3) after one year and 11.2 minutes (9.8,12.6) after two years, with no difference at any time point preoperatively and postoperatively, Figure 5b. Mean meal duration in the non‐obese reference group was 13.0 (11.7,14.4) minutes, which did not differ significantly compared with the RYGB group either preoperatively (p=0.282) or two years after surgery (p=0.459). Mean eating rate, measured as amount of food consumed per minute, was 45% six weeks after surgery compared with the preoperative eating rate, (p<0.001) and then increased after one year to 65% (p<0.001) and at two years to 72% (p<0.001) of the preoperative rate, Figure 5c. Eating rate did not differ significantly between the RYGB group and the non‐obese reference group either before surgery (p=0.059) or two years after surgery (p=0.657).
Figure 5. (a) Average meal size (g), (b) meal duration (min), and (c) eating rate (g minˉ¹) of RYGB patients preoperatively (N=43) and six weeks (N=42), one year (N=41) and two years (N=42) after surgery (light bars) and a reference group (N=31, dark bars), mean and 95% CI. ***p<0.001.
Number of meals and meal distribution Number of meals per day increased postoperatively, but only became significantly higher at one year (p<0.001). Patients had increased their number of meals during the morning hours both at one year (p<0.001) and two years (p=0.028).
Pre‐meal hunger, post‐meal satiation and maintained satiety At no time point was a statistically significant effect of RYGB surgery found on the perception of hunger before the meal, satiation after the meal or maintained satiety one hour after meal start.
Cognitive and emotional aspects of eating behavior – TFEQ‐R21 CR increased in the short term (6 weeks), but in the long term (1 and 2 years) after surgery there were no significant differences compared with the preoperative state. Patients seemed to experience fewer problems with UE and EE after surgery. UE decreased 6 weeks post‐surgery compared with pre‐surgery (P<0.001). This reduction persisted after 1 year (P<0.001), and 2 years (P=0.003). EE showed consistency with UE in decreasing at 6 weeks after surgery (P<0.001). The reduction persisted at 1 year (P<0.001) and at 2 years (P=0.046), Figure 6.
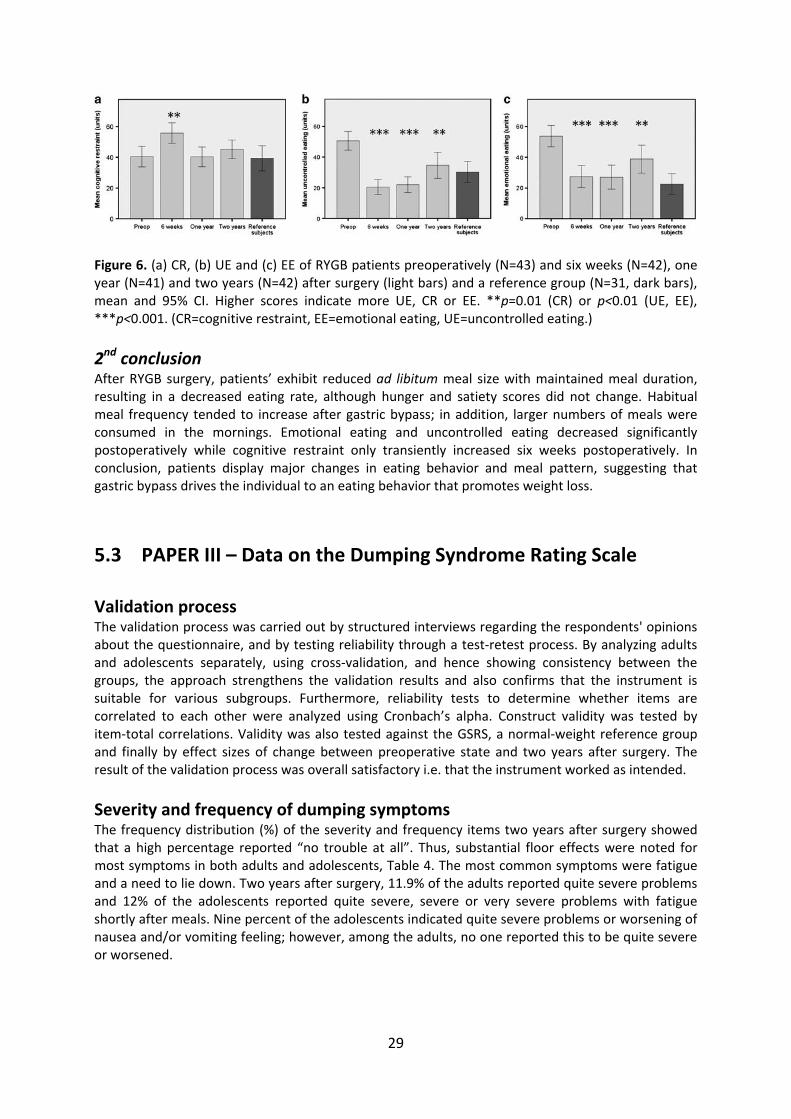
29
Figure 6. (a) CR, (b) UE and (c) EE of RYGB patients preoperatively (N=43) and six weeks (N=42), one year (N=41) and two years (N=42) after surgery (light bars) and a reference group (N=31, dark bars), mean and 95% CI. Higher scores indicate more UE, CR or EE. **p=0.01 (CR) or p<0.01 (UE, EE), ***p<0.001. (CR=cognitive restraint, EE=emotional eating, UE=uncontrolled eating.)
2nd conclusion After RYGB surgery, patients’ exhibit reduced ad libitum meal size with maintained meal duration, resulting in a decreased eating rate, although hunger and satiety scores did not change. Habitual meal frequency tended to increase after gastric bypass; in addition, larger numbers of meals were consumed in the mornings. Emotional eating and uncontrolled eating decreased significantly postoperatively while cognitive restraint only transiently increased six weeks postoperatively. In conclusion, patients display major changes in eating behavior and meal pattern, suggesting that gastric bypass drives the individual to an eating behavior that promotes weight loss.
5.3 PAPER III – Data on the Dumping Syndrome Rating Scale
Validation process The validation process was carried out by structured interviews regarding the respondents' opinions about the questionnaire, and by testing reliability through a test‐retest process. By analyzing adults and adolescents separately, using cross‐validation, and hence showing consistency between the groups, the approach strengthens the validation results and also confirms that the instrument is suitable for various subgroups. Furthermore, reliability tests to determine whether items are correlated to each other were analyzed using Cronbach’s alpha. Construct validity was tested by item‐total correlations. Validity was also tested against the GSRS, a normal‐weight reference group and finally by effect sizes of change between preoperative state and two years after surgery. The result of the validation process was overall satisfactory i.e. that the instrument worked as intended.
Severity and frequency of dumping symptoms The frequency distribution (%) of the severity and frequency items two years after surgery showed that a high percentage reported “no trouble at all”. Thus, substantial floor effects were noted for most symptoms in both adults and adolescents, Table 4. The most common symptoms were fatigue and a need to lie down. Two years after surgery, 11.9% of the adults reported quite severe problems and 12% of the adolescents reported quite severe, severe or very severe problems with fatigue shortly after meals. Nine percent of the adolescents indicated quite severe problems or worsening of nausea and/or vomiting feeling; however, among the adults, no one reported this to be quite severe or worsened.
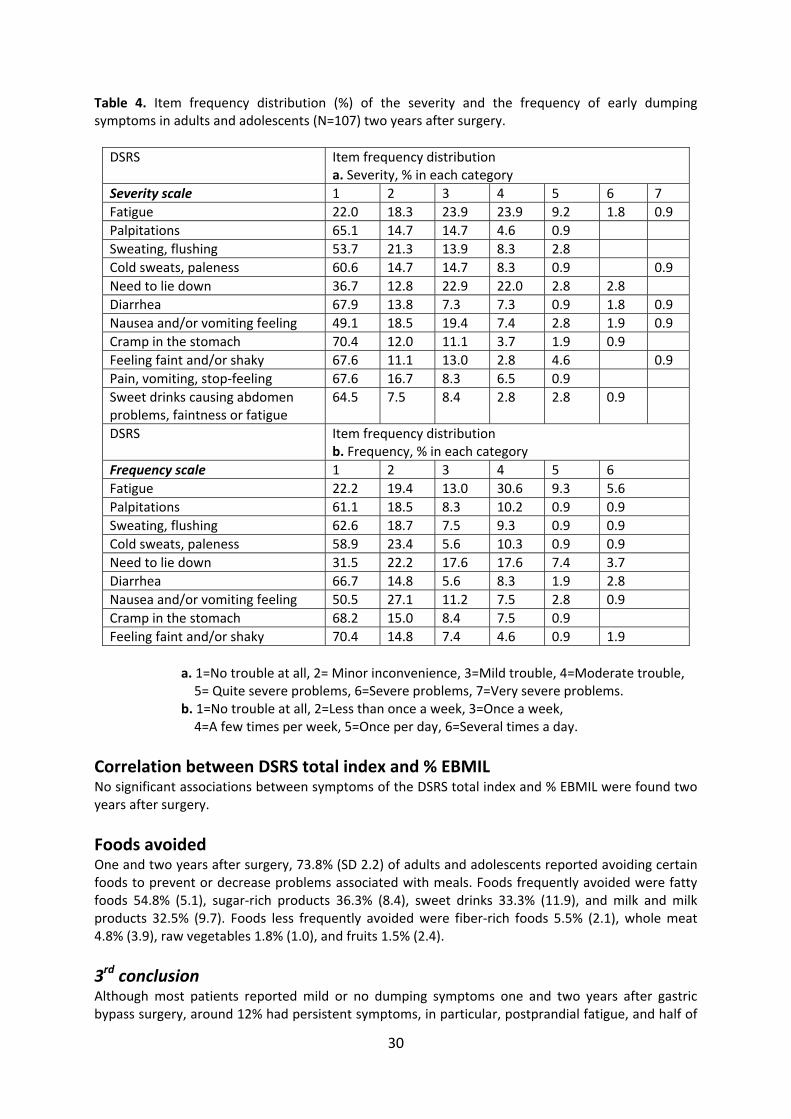
30
Table 4. Item frequency distribution (%) of the severity and the frequency of early dumping symptoms in adults and adolescents (N=107) two years after surgery.
DSRS Item frequency distribution a. Severity, % in each category
Severity scale 1 2 3 4 5 6 7
Fatigue 22.0 18.3 23.9 23.9 9.2 1.8 0.9
Palpitations 65.1 14.7 14.7 4.6 0.9
Sweating, flushing 53.7 21.3 13.9 8.3 2.8
Cold sweats, paleness 60.6 14.7 14.7 8.3 0.9 0.9
Need to lie down 36.7 12.8 22.9 22.0 2.8 2.8
Diarrhea 67.9 13.8 7.3 7.3 0.9 1.8 0.9
Nausea and/or vomiting feeling 49.1 18.5 19.4 7.4 2.8 1.9 0.9
Cramp in the stomach 70.4 12.0 11.1 3.7 1.9 0.9
Feeling faint and/or shaky 67.6 11.1 13.0 2.8 4.6 0.9
Pain, vomiting, stop‐feeling 67.6 16.7 8.3 6.5 0.9
Sweet drinks causing abdomen problems, faintness or fatigue
64.5 7.5 8.4 2.8 2.8 0.9
DSRS Item frequency distribution b. Frequency, % in each category
Frequency scale 1 2 3 4 5 6
Fatigue 22.2 19.4 13.0 30.6 9.3 5.6
Palpitations 61.1 18.5 8.3 10.2 0.9 0.9
Sweating, flushing 62.6 18.7 7.5 9.3 0.9 0.9
Cold sweats, paleness 58.9 23.4 5.6 10.3 0.9 0.9
Need to lie down 31.5 22.2 17.6 17.6 7.4 3.7
Diarrhea 66.7 14.8 5.6 8.3 1.9 2.8
Nausea and/or vomiting feeling 50.5 27.1 11.2 7.5 2.8 0.9
Cramp in the stomach 68.2 15.0 8.4 7.5 0.9
Feeling faint and/or shaky 70.4 14.8 7.4 4.6 0.9 1.9
a. 1=No trouble at all, 2= Minor inconvenience, 3=Mild trouble, 4=Moderate trouble, 5= Quite severe problems, 6=Severe problems, 7=Very severe problems. b. 1=No trouble at all, 2=Less than once a week, 3=Once a week, 4=A few times per week, 5=Once per day, 6=Several times a day.
Correlation between DSRS total index and % EBMIL No significant associations between symptoms of the DSRS total index and % EBMIL were found two years after surgery.
Foods avoided One and two years after surgery, 73.8% (SD 2.2) of adults and adolescents reported avoiding certain foods to prevent or decrease problems associated with meals. Foods frequently avoided were fatty foods 54.8% (5.1), sugar‐rich products 36.3% (8.4), sweet drinks 33.3% (11.9), and milk and milk products 32.5% (9.7). Foods less frequently avoided were fiber‐rich foods 5.5% (2.1), whole meat 4.8% (3.9), raw vegetables 1.8% (1.0), and fruits 1.5% (2.4).
3rd conclusion Although most patients reported mild or no dumping symptoms one and two years after gastric bypass surgery, around 12% had persistent symptoms, in particular, postprandial fatigue, and half of
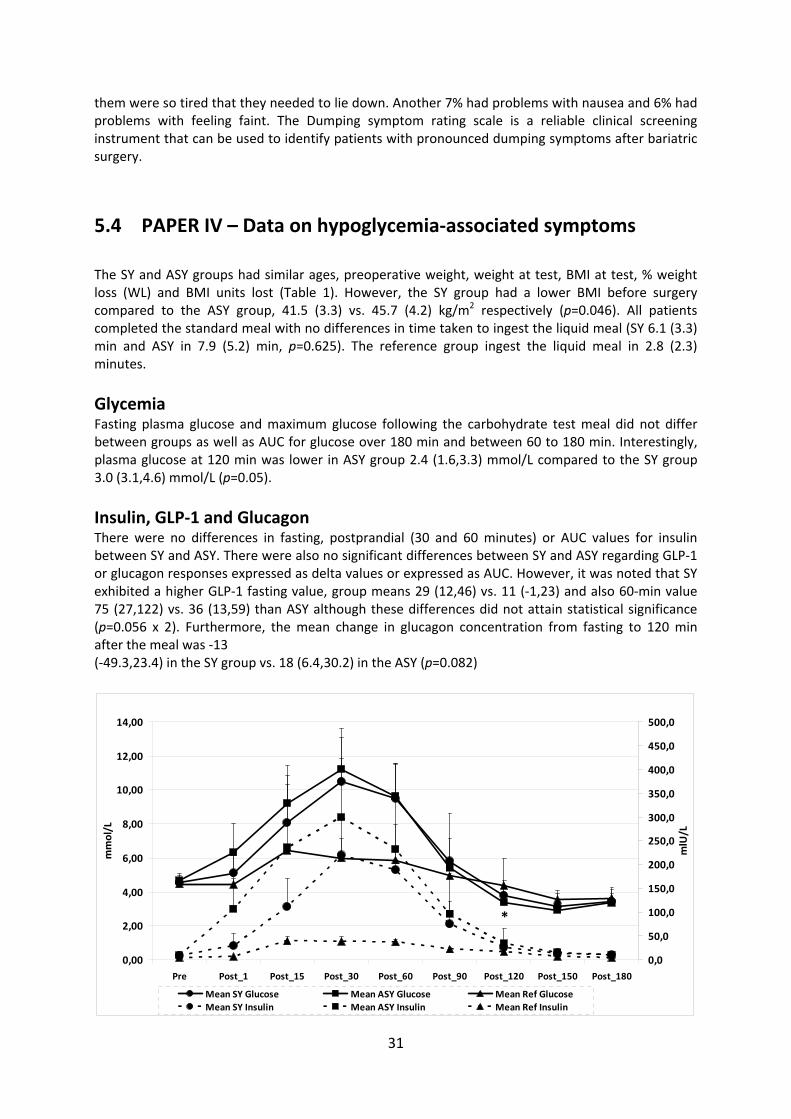
31
them were so tired that they needed to lie down. Another 7% had problems with nausea and 6% had problems with feeling faint. The Dumping symptom rating scale is a reliable clinical screening instrument that can be used to identify patients with pronounced dumping symptoms after bariatric surgery.
5.4 PAPER IV – Data on hypoglycemia‐associated symptoms
The SY and ASY groups had similar ages, preoperative weight, weight at test, BMI at test, % weight loss (WL) and BMI units lost (Table 1). However, the SY group had a lower BMI before surgery compared to the ASY group, 41.5 (3.3) vs. 45.7 (4.2) kg/m2 respectively (p=0.046). All patients completed the standard meal with no differences in time taken to ingest the liquid meal (SY 6.1 (3.3) min and ASY in 7.9 (5.2) min, p=0.625). The reference group ingest the liquid meal in 2.8 (2.3) minutes.
Glycemia Fasting plasma glucose and maximum glucose following the carbohydrate test meal did not differ between groups as well as AUC for glucose over 180 min and between 60 to 180 min. Interestingly, plasma glucose at 120 min was lower in ASY group 2.4 (1.6,3.3) mmol/L compared to the SY group 3.0 (3.1,4.6) mmol/L (p=0.05).
Insulin, GLP‐1 and Glucagon There were no differences in fasting, postprandial (30 and 60 minutes) or AUC values for insulin between SY and ASY. There were also no significant differences between SY and ASY regarding GLP‐1 or glucagon responses expressed as delta values or expressed as AUC. However, it was noted that SY exhibited a higher GLP‐1 fasting value, group means 29 (12,46) vs. 11 (‐1,23) and also 60‐min value 75 (27,122) vs. 36 (13,59) than ASY although these differences did not attain statistical significance (p=0.056 x 2). Furthermore, the mean change in glucagon concentration from fasting to 120 min after the meal was ‐13 (‐49.3,23.4) in the SY group vs. 18 (6.4,30.2) in the ASY (p=0.082)
0,00
2,00
4,00
6,00
8,00
10,00
12,00
14,00
Pre Post_1 Post_15 Post_30 Post_60 Post_90 Post_120 Post_150 Post_180
mmol/L
0,0
50,0
100,0
150,0
200,0
250,0
300,0
350,0
400,0
450,0
500,0
mlU/L
Mean SY Glucose Mean ASY Glucose Mean Ref Glucose
Mean SY Insulin Mean ASY Insulin Mean Ref Insulin
*
32
Figure 7. Plasma glucose levels (mmol/L) on the left y‐axis and Insulin levels (mIU/L) on the right y‐axis. Mean and standard error of the mean for the SY, ASY and reference groups. SY = symptomatic ASY = asymptomatic * = Significant difference in glucose levels between the SY and ASY group 120 minutes post‐operatively; no other significant differences were observed. Values from the non‐obese reference group are presented without any statistical comparisons to the SY and ASY groups.
Blood pressure and pulse Both the SY and ASY group exhibited reduced systolic as well as diastolic blood pressure after the test meal without any significant difference. However, there was a significant difference in AUC pulse rate between SY and ASY over 180 min 13009 (11148,14870) vs. 11569 (10837,12300) beats, (p=0.038), and the period from 60 to 180 minutes 9276 (7901,10650) vs. 8293 (7709,8877) beats, (p=0.050).
Perceived symptoms Following the liquid meal SY had a higher AUC Sigstad over 180 min, 1116 (‐340,1893) vs. 202 (‐15,419), (p=0.050) and also between 60 to 180 minutes 970 (‐274,1667) vs. 170 (‐39,379), (p=0.028), compared to ASY.
Correlations between perceived symptoms and physiological response Calculations using Spearman nonparametric correlation coefficient showed that there were no significant correlations between perceived symptoms and objective parameters except for the ASY patients where there was a negative correlation between Sigstad AUC and glucose AUC (r²=‐0.74 p=0.037).
4th conclusion The patients with a history of hypoglycemia‐like symptoms after RYGB neither demonstrated lower plasma glucose nor greater insulin response compared to asymptomatic patients in response to a liquid carbohydrate meal, but perceived more symptoms. The mechanisms of action behind the origin of such symptoms remain obscure and need further exploration.
33
6 DISCUSSION This thesis focused on changes in dietary intake, eating behavior and meal‐related symptoms in patients who have undergone RYGB surgery, an area that area which is not sufficiently explored, yet being critical to the outcome of surgery. The results contribute to the understanding of the components forming the basis of the negative energy balance facilitated by RYGB. Furthermore, the experimental longitudinal study design enabled direct measurement of eating behavior and perceptions of eating during a test meal. The results have also filled gaps in current knowledge about dumping symptoms, both in terms severity and frequency of the various symptoms. Finally, by assessing factors assumed to contribute to reactive hypoglycemia‐like symptoms we could negate some current concepts regarding origin of symptoms.
6.1 Methodological considerations
6.1.1 Study design
Three of the four studies (Papers I, II and III) used the same participants, who were followed longitudinally from the time just before surgery to six weeks, one year and two years after surgery, Figure 4. This is the design of choice to monitor changes over time, but with repeated measurements the number of potential participants often decreases. The experimental part also restricted the number of participants, resulting in a low number of eligible participants answering the various questionnaires. This applies in particular to the dietary questionnaire, which often requires more participants due to the difficulty of measuring food intake with precision, posing the risk of specific reporting errors and random errors. In Paper II and IV, healthy participants were used as a non‐obese reference group without statistical comparisons between them and RYGB participants. The importance of having the reference group may be questioned; however, a general comparison can be of value to get an impression of how dietary intake and eating behavior are reported and which response is elicited by a glucose provocation in the normal state. It might have been more interesting to use a matched obese control group and the ideal would have been a randomized study between surgical and non‐surgical treatment.
6.1.2 Study populations
It took a long time to recruit the adults included in Studies I, II and III. During this time, far more patients were operated and the number of potential participants was 1,500. The ideal would be to have a consecutive series but this was not possible for practical reasons, with several ongoing studies and lack of space at the laboratory. The percentage body %WL found in this study was similar to what has been reported previously for this surgical technique (5), which could indicate that this was a representative sample. In contrast, the adolescents in Paper III were a consecutive series. Paper IV also had a small sample size (n=8+8), which increases the risk of type 2 errors. In addition, the correlation calculations have limitations, as r² is sensitive to outliers, and the material was not uniform, making it difficult to obtain strong correlations.
34
6.1.3 Participation rates
Fifty patients were asked to participate in studies I, II and III, of whom three declined. Of the 47 enrolled participants, two women were excluded in the preoperative assessment because they reported an unreasonably high daily EI and did not complete the one‐ and two‐year visits. Another two women developed breast cancer and chronic obstructive pulmonary disease, respectively, and were excluded because these diseases can affect appetite. The level of attendance to follow‐up visits was high: only 4 out of 172 visits (2%) could not be performed. During the postoperative follow‐up, one patient could not attend the six‐week visit because she had to present for cholecystectomy surgery. At one year, one patient was pregnant and another did not show up to the prescheduled visit and could not be reached thereafter; at two years, one patient was breastfeeding. Otherwise, all patients attended all planned visits in the study (Paper I and II). All analyses are based on 43 participants. In Paper III, 17% of participants (21 of 124 visits) did not complete the DSRS preoperatively and 14% (36 of 248 visits) did not complete it postoperatively, due to administrative errors in which the questionnaire was not distributed to all participants. However, no dropout analysis was performed.
6.1.4 Self‐reported food intake from the SOS dietary questionnaire
In the absence of more sophisticated ways of measuring the accuracy of reported energy balance, such as doubly labeled water, estimation was made of the reported intake in relation to expected PAL. Although participants reported higher EI compared with many other studies (27, 180, 230, 257, 258), Table 5, the PAL value indicates that there has been under‐reporting. The values for PAL were calculated for each patient by dividing reported EI by the calculated RMR using the Mifflin–St Jeor formula (244, 245) to demonstrate disproportionate PAL values, where 1.35 is recommended as a cut‐off value (246). A cut‐off value of 1.35 can be considered low, considering that PAL values are often set at 1.6–1.8, but this is to compensate for a higher percentage of body fat, which has a lower energy expenditure than fat free mass (244, 245). By using the cut‐off value of 1.35, the sample had a PAL value of 0.90 preoperatively and 0.92 two years after surgery, suggesting significant under‐reporting, Table 3. There may be selective under‐reporting of intake of high energy density foods, as these are often seen as socially undesirable (133), even though food frequency questionnaires (FFQ) capture food intake more accurately than dietary records do (134). The dietary questionnaire used in this study has been validated on energy and protein intake in groups of normal‐weight and obese respondents and used in severely obese populations in long‐term follow‐ups after bariatric surgery (135, 259); however it has not been validated following bariatric surgery. In addition to the risk of under‐reporting of energy‐dense foods, dietary questionnaires do not estimate EI with precision because of random errors; measures of dietary intake should thus be assessed with caution. Apart from specific reporting bias, dietary questionnaires also entail random errors and measures of dietary intake at the individual level should thus be assessed with caution (260).
6.1.5 Dietary energy density
DED can be calculated in different ways, which may complicate the interpretation of these data. In particular, DED is affected by the inclusion of drinks, and there are differences of opinion on whether
35
drinks are included or not (261‐263). Therefore, the inclusion of drinks should be clearly indicated when reporting energy density values (264). In Paper I, drinks were included, with the exception of tap water, bottled water and diet sodas (which contain very little or no energy). Thus, the calculation of DED was based on EI and FW from food, milk, alcohol, energy‐containing drinks (soft drinks, fruit syrups and juice), coffee and tea. The DED was calculated by dividing EI by FW, as defined above. Non‐alcoholic drinks, coffee and tea were included for two reasons: first, because the dietary questionnaire showed that the percentage intake of these beverages did not increase postoperatively, Table 3; second, results from the SOS study demonstrated that urine volumes do not increase after surgery, which is an indication that fluid intake does not increase (57). There was no correlation between the reduction of DED and %WL, which may be due to several factors. For example: insufficient number of participants, limitations in dietary assessment method (134), the large intra‐individual variation in post‐surgery FW – as much as 1400 g after one year compared to pre‐surgery and 800 g after two years compared to pre‐surgery – and intra‐individual variations of physiological response in terms of GI hormones, as well as the importance of the Roux limb for regulating food intake after RYGB surgery. In view of these factors, we may have to develop specific sets of dietary intake questionnaires for bariatric surgery patients.
6.1.6 Ad libitum test meal for measuring portion size, meal duration and eating rate
The test meals were administered in a laboratory setting, which may not reflect the participants’ normal eating habits. However, laboratory measurements of food intake have been shown to have good reliability in terms of meal size and eating rate (265, 266) in normal weight and obese people. In addition to the study protocol, patients received standard dietary advice. A careful distinction was made between the usual dietary advice and the study instructions in order to avoid influencing patients’ choice of meal size and eating rate in the laboratory. Any comments and discussions about food and eating behavior arising during the experiments were answered in a neutral manner, and as soon as possible the topic of conversation was changed to something else to avoid the risk of affecting the experimental situation. Moreover, no precise guidance on appropriate meal sizes was given. The test meal of Swedish beef hash has a high fat content, 42 E% but was chosen because it has previously been used in meal experiments; it contains a mixture of potatoes and meat, which is important because protein and carbohydrates provide different degrees of satiation, and it is a popular dish in Sweden. Nevertheless, it is unclear whether hash is a good test meal after gastric bypass; given that patients after RYGB often change their food choices to a more low‐fat diet, these participants might have eaten larger portions if served a more low‐fat meal. In addition, some pointed out that the choice of test meal was not ideal, especially six weeks after surgery. It would have been of great value to investigate whether similar test meals with differing fat content or energy density resulted in different portion sizes after RYGB, especially considering that people usually eat a constant volume of food (141).
36
6.1.7 Visual analogue scales for hunger and satiety
One of the limitations of using visual analogue scales in single‐meal studies is that they have a large inter‐individual variability; however, this may be of less concern in this within‐subjects design. Thus, within‐subjects comparisons are more sensitive and accurate than between‐subjects comparisons, which could therefore reduce the number of participants needed for studies with appetite scores (247).
6.1.8 The Three‐Factor Eating Questionnaire
Several studies have used an old version of TFEQ (162, 168, 188, 193, 267‐269) measuring cognitive restraint, hunger and disinhibition (disinhibition refers to a tendency to eat opportunistically, for example, eating in the company of others who are eating, being responsive to the palatability of food and eating in response to negative mood). However, when this version was psychometrically tested using factor analysis, it was found that the internal structure for disinhibition was weak and most disinhibition and hunger items could be grouped in one global factor labeled uncontrolled eating (UE). A third cluster containing items on emotional eating (EE) was also identified (163).
6.1.9 Validation process for the Dumping Symptom Rating Scale
The number of participants was considered sufficient and the fact that the DSRS was validated on two subgroups, both exhibiting similar results, strengthens the applicability of the instrument to different groups. A construct is not restricted to one set of observable indicators or attributes; it is instead common to several sets of indicators. Thus, construct validity can be evaluated, as in Paper III, by a whole battery of statistical methods that indicate whether a common factor can be shown to exist. However, construct validity is a continuous process; in addition to employing several statistical methods, the judgment is also based on the accumulation of correlations from numerous studies using the instrument, a process that has already begun. Furthermore, DSRS should be useful at the individual level, but cut‐off values for suspected DS must be developed for this purpose. However, it is not easy to determine when dumping syndrome is present; one suggestion is to use interviews and another is to rely on clinical judgment.
6.1.10 Oral carbohydrate provocation test
The commonly used carbohydrate provocation tests of 75 grams of carbohydrate/315 kcal, was shown in pilot studies to be suboptimal and a larger stimulus of carbohydrates (99.5 g carbohydrates / 443 kcal) was chosen to enable symptoms to appear. However, the use of non‐standardized provocation drinks makes it more difficult to compare different studies. Furthermore, Sigstad’s Dumping Index has limitations since many symptoms are closely related, such as "sleepiness, drowsiness, apathy, falling asleep" as compared to "weakness, exhaustion" and "desire to lie or sit down".
6.2 Results in perspective
6.2.1 PAPER I – Dietary energy density and food selection
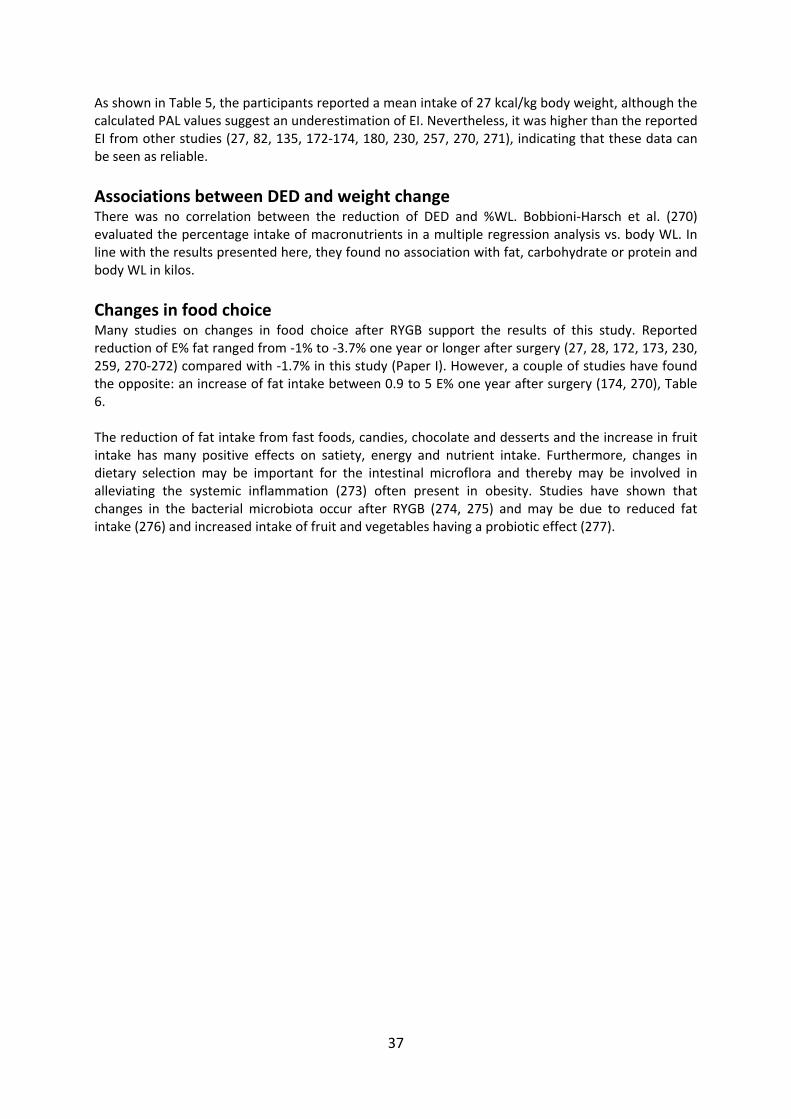
37
As shown in Table 5, the participants reported a mean intake of 27 kcal/kg body weight, although the calculated PAL values suggest an underestimation of EI. Nevertheless, it was higher than the reported EI from other studies (27, 82, 135, 172‐174, 180, 230, 257, 270, 271), indicating that these data can be seen as reliable.
Associations between DED and weight change There was no correlation between the reduction of DED and %WL. Bobbioni‐Harsch et al. (270) evaluated the percentage intake of macronutrients in a multiple regression analysis vs. body WL. In line with the results presented here, they found no association with fat, carbohydrate or protein and body WL in kilos.
Changes in food choice Many studies on changes in food choice after RYGB support the results of this study. Reported reduction of E% fat ranged from ‐1% to ‐3.7% one year or longer after surgery (27, 28, 172, 173, 230, 259, 270‐272) compared with ‐1.7% in this study (Paper I). However, a couple of studies have found the opposite: an increase of fat intake between 0.9 to 5 E% one year after surgery (174, 270), Table 6. The reduction of fat intake from fast foods, candies, chocolate and desserts and the increase in fruit intake has many positive effects on satiety, energy and nutrient intake. Furthermore, changes in dietary selection may be important for the intestinal microflora and thereby may be involved in alleviating the systemic inflammation (273) often present in obesity. Studies have shown that changes in the bacterial microbiota occur after RYGB (274, 275) and may be due to reduced fat intake (276) and increased intake of fruit and vegetables having a probiotic effect (277).
38
Table 5. Body weight, reported EI and kcal/kg body weight from 14 follow‐up studies of RYGB
Months after surgery EI (kcal) kcal/kg body weight
Study Method N Weight (kg)
12 months 18 months 24 months ≥30 months
Kenler et al. 1990 (27)
24 h dietary recall
51 95.0 1300 = 14 kcal/kg
Lindroos et al. 1993 (135)
SOS dietary questionnaire
34 78.9 1885 = 24 kcal/kg
Trostler et al. 1995 (174)
7 days food record
19 76 M 2000 = 26 kcal/kg W 738 = 10 kcal/kg
Bobbioni‐Harsch et al. 2002 (270)
3 days food record
50 80.9 1421 = 18 kcal/kg
Warde‐Kamar et al. 2004 (257)
24 h dietary recall
62 96 1773 = 18 kcal/kg
Olbers et al. 2006 (82)
SOS dietary questionnaire
36 86 1465 = 17 kcal/kg
Sarwer et al. 2008 (230)
FFQ 200 84 1358 = 16 kcal/kg
Leite Faria et al. 2009 (180)
4 day food record
75 81.9 1475 = 18 kcal/kg
Bavaresco et al. 2010 (173)
24 h dietary recall
48 90.7 1034 = 11 kcal/kg
Kruseman et al. 2010 (172)
4 day food record
80 92.1 1680 = 18 kcal/kg
Johnson et al. 2012 (271)
FFQ 72 95.2 1650 = 23 kcal/kg
Laurenius et al. 2013 (Paper I)
SOS dietary questionnaire
47 89.9 2425 = 27 kcal/kg
M = men W = women FFQ = Food Frequency Questionnaire
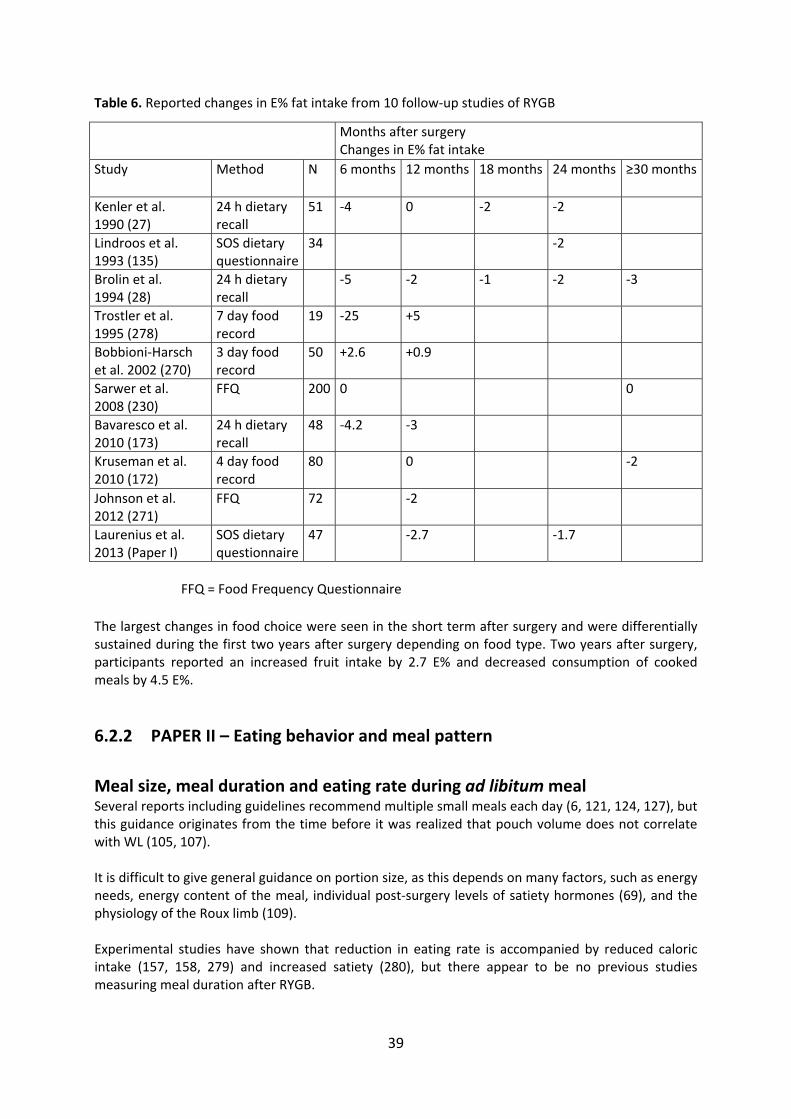
39
Table 6. Reported changes in E% fat intake from 10 follow‐up studies of RYGB
FFQ = Food Frequency Questionnaire
The largest changes in food choice were seen in the short term after surgery and were differentially sustained during the first two years after surgery depending on food type. Two years after surgery, participants reported an increased fruit intake by 2.7 E% and decreased consumption of cooked meals by 4.5 E%.
6.2.2 PAPER II – Eating behavior and meal pattern
Meal size, meal duration and eating rate during ad libitum meal Several reports including guidelines recommend multiple small meals each day (6, 121, 124, 127), but this guidance originates from the time before it was realized that pouch volume does not correlate with WL (105, 107). It is difficult to give general guidance on portion size, as this depends on many factors, such as energy needs, energy content of the meal, individual post‐surgery levels of satiety hormones (69), and the physiology of the Roux limb (109). Experimental studies have shown that reduction in eating rate is accompanied by reduced caloric intake (157, 158, 279) and increased satiety (280), but there appear to be no previous studies measuring meal duration after RYGB.
Months after surgery Changes in E% fat intake
Study Method N 6 months 12 months 18 months 24 months ≥30 months
Kenler et al. 1990 (27)
24 h dietary recall
51 ‐4 0 ‐2 ‐2
Lindroos et al. 1993 (135)
SOS dietary questionnaire
34 ‐2
Brolin et al. 1994 (28)
24 h dietary recall
‐5 ‐2 ‐1 ‐2 ‐3
Trostler et al. 1995 (278)
7 day food record
19 ‐25 +5
Bobbioni‐Harsch et al. 2002 (270)
3 day food record
50 +2.6 +0.9
Sarwer et al. 2008 (230)
FFQ 200 0 0
Bavaresco et al. 2010 (173)
24 h dietary recall
48 ‐4.2 ‐3
Kruseman et al. 2010 (172)
4 day food record
80 0 ‐2
Johnson et al. 2012 (271)
FFQ 72 ‐2
Laurenius et al. 2013 (Paper I)
SOS dietary questionnaire
47 ‐2.7 ‐1.7
40
Pre‐meal hunger, post‐meal satiation and maintained satiety The biological drive to eat is complex and linked to the satiating efficiency of foods (281). Satiating efficiency describes the capacity of a food to suppress hunger and to inhibit further eating. The satiety cascade – classified as sensory, cognitive, postingestive and postabsorptive processes – operates through the impact of food on physiological and biochemical mechanisms (281). Satiation can be defined as the process that brings a period of eating to halt. It should be distinguished from satiety, which is defined as inhibition of hunger and eating that arises as a consequence of food consumption (281). This study has shown that appetite ratings were unaltered after RYGB, as the reduced food intake in grams did not correlate with scoring of pre‐meal hunger or post‐meal satiation. This may indicate improved signaling of satiety, reflected by greater satiety per kcal ingested. It has been shown that the appetite changes after RYGB (as measured by the TFEQ dimensions CR, UE and EE) and that this is related to the degree of hunger and satiety hormones, which may contribute to the reduced propensity to overeat and the observed weight loss (282).
Number of meals and meal distribution The reported number of meals in previous studies was 5.4 at 30 months after surgery (257) and 5.2 two years after surgery (283). This study showed 5.4 meals two years after surgery, which is well in line with those studies. The number of meals increased slightly following RYGB, but was only significant at one year, from 4.9 to 5.8 meals per day (Paper II). In this study, number of meals showed no association with %WL either at one or two years postoperatively, in contrast to other studies, which have demonstrated a relationship between frequent eating and poor WL (179, 180). Furthermore, other studies have shown that frequent eating in the form of grazing is a high‐risk behavior following bariatric surgery (284, 285). Thus, recommending a snack is still controversial.
Cognitive and emotional aspects of eating behavior Two studies have comparable results after RYGB to the results of Paper II in all three dimensions (33, 282). It may be important to measure CR in the diet surveys because it is found that patients with high CR underestimate their intake of candies, desserts and snacks to a greater degree than those with low CR and thus have a lower DED (134).
6.2.3 PAPER III – Data on the Dumping Syndrome Rating Scale
Validation process In the social sciences and psychometrics, construct validity refers to whether a scale measures or correlates with the theorized psychological scientific construct that it purports to measure. Put another way, construct validity answers the question, "Are we actually measuring (is this a valid form for measuring) the construct we think we are measuring?" A scale (e.g. DSRS) seeks to operationalize the concept, typically measuring several observable phenomena (the various dumping symptoms) that supposedly reflect the underlying psychological concept (DS). Construct validity is a means of assessing how well this has been accomplished. In other words, it is the extent to which what was to be measured actually was measured.
Severity and frequency of DS symptoms DS has often been described as a complication of gastric bypass (176, 200, 209, 286). Some researchers, however, view DS rather as a consequence or even a desirable feature of RYGB (86,
41
168). The clinical experience is that most RYGB patients quickly learn the limits for what and how much they can eat without getting dumping symptoms. As with other studies (86, 168, 204), this study failed to show a connection between DS and %WL (Paper III). However, such a relationship is difficult to demonstrate, as some people, through favorable food choice and eating behavior after RYGB, reduce their exposure to dumping and increase their prospect of a good WL outcome.
Paper III is the first study that has been able to discriminate in detail between the different qualities of dumping symptoms and assess how often symptoms occur. The most common symptoms in terms of both severity and frequency were found to be fatigue, need to lie down, nausea and a feeling of faintness. Previous studies also cited symptoms of palpitations, perspiration, flushing, diarrhea and abdominal pain (87, 176, 206), but these were not the dominant symptoms in this study. In this study, 5–10% of patients maintained problems even long after RYGB surgery, which is in line with other studies (87, 88, 204, 206). Interestingly, in a qualitative follow‐up study of RYGB, patients did not describe dumping symptoms as negative; on the contrary, the patients appreciated the strong bodily signal that made them avoid meals containing a high level of carbohydrates or fat (287). This raises the question of whether DS really is a problem, and whether the patient’s ability to cope with the symptoms is dependent on how the caregiver presents the DS – as a complication or as a tool. Furthermore, obesity itself is such a huge stigma that patients may perceive DS after RYGB as a relatively minor problem that they can cope with, just as they have been shown to cope with other
GI problems (32, 33).
Foods avoided Reports have often singled out sugar‐rich products as the foods that cause DS (85, 86, 88, 176). This study shows instead that fatty foods are the most commonly avoided because of their tendency to cause dumping symptoms which have also been observed after rapid gastric emptying from other causes than RYGB (288). The foods that patients claimed to avoid to minimize DS (Paper III) are well in line with how patients report their changes in dietary intake after RYGB (Paper I). This means that taste changes may not be the only mechanism behind the changes in food choice following RYGB. RYGB may provide such negative feedback responses to energy‐dense food that patients after surgery reject foods that they have learned will cause DS. Furthermore, it is interesting to see that high‐fiber and bulky foods like fruits and vegetables do not seem to elicit any dumping symptoms, which suggests that mechanical constraint through gastric volume reduction is not one of the mechanisms after RYGB (104‐108).
Correlation between DSRS total index and % EBMIL Paper III showed no correlation between the degree of dumping symptoms and WL, which no other study has been able to demonstrate either (86, 168, 204). DS could still play a role, since it is possible that those who report severe problems with DS are also those who have problems with their eating behavior.
Gastrointestinal symptoms Scores on the GSRS eating dysfunction question (which assesses early satiety, difficulties in eating normal portions, and postprandial pain) did not deteriorate postoperatively, indicating that changes in eating conditions after RYGB are well tolerated. However, eating dysfunction had moderate to strong association with six of the nine symptoms of the DSRS total index. Also, the strong to moderate relationship between GSRS abdominal pain and several of the dumping symptoms could
42
indicate that those who had difficulty limiting their portions were also those who experienced severe DS.
6.2.4 PAPER IV – Data on hypoglycemia‐associated symptoms
Blood analyses and perceived symptoms An important finding in the present study was that patients with history of hypoglycemia‐like symptoms after RYGB reported significantly more symptoms (Sigstad) during the 3 hours observation period after a carbohydrate meal, which was associated with a higher pulse rate. However, despite both the subjective symptoms and the autonomic neural reaction (manifested as an enhanced tachycardia) the symptomatic patients (SY) did not exhibit lower blood glucose levels when compared to an asymptomatic group (ASY). Furthermore, the carbohydrate meal‐induced changes in plasma concentrations of insulin, GLP‐1 and glucagon were similar. There were, however, considerable individual variations with marked overlap between symptomatic and asymptomatic patients. The definition of biochemical hypoglycemia is a plasma glucose concentration below 3.9 mmol/L (70 mg/dL) (207). Unspecific symptoms of discomfort (see Whipple’s triad as defined in Methods) occur in the majority of individuals at and below a glucose concentration of approximately 3.0 mmol/L (55 mg/dL) (243). These hypoglycemia‐associated symptoms are a warning for neuroglycopenia which, if persistent, can lead to irrational behaviour and ultimately to unconsciousness. Most of our patients with RYBG had a marked decrease in blood glucose 1‐3 h after an oral carbohydrate load. This phenomenon is commonly called hyperinsulinemic hypoglycemia (or reactive hypoglycemia ) (289) and is explained as an ‘overshoot’ in the secretion of insulin following an often refined carbohydrate load. A possible mechanism is the enhanced incretin effect (i.e. GLP‐1) that occurs following RYGB as ingested nutrients almost instantly are exposed to the small intestine. Intuitively we hypothesized that RYGB patients with a history of hypoglycemia‐like symptoms (the SY patients) also should be the ones with lowest plasma glucose after the carbohydrate provocation. However, we were unable to demonstrate any correlation between biochemical hypoglycemia and perceived symptoms in these patients. Furthermore, the term hypoglycemia unawareness refers to patients who do not experience typical warning symptoms despite having plasma glucose levels below 3.0 mmol/L (290). In the present investigation it was noted that some of the SY as well as the ASY patients did not experience any symptoms during the test, even with plasma glucose below 2 mmol/L. Goldfine et al suggested that an exaggerated postprandial insulin response contributed to hypoglycemia‐like symptoms after RYGB (224). In the present study we confirm postprandial hyperinsulinemia concentrations in the RYGB patients (as compared to the non‐operated reference group; Fig 1) but the insulin responses did not differ between the symptomatic (SY) and asymptomatic (ASY) study groups. In contrast to the findings of Goldfine et al the present results support that symptomatic patients do not substantially differ from asymptomatic individuals despite that both groups present postprandial hyperinsulinemia (225‐227). Hence, it is apparent that a carbohydrate rich meal in RYGB patients results in a marked insulin response. However, the level of insulin release per se does not predict which individuals will be symptomatic or not. The present study also confirms an increased release of GLP‐1 in RYGB patients after a meal (83, 224). However, we were unable to show a statistical difference between the symptomatic (SY) and asymptomatic (ASY) groups regarding GLP‐1 and glucagon levels. Glucagon has been proposed as a treatment option for symptomatic hypoglycemia in RYGB patients, but initial experience
43
demonstrated limited clinical effect (291). However, we cannot exclude the possibility that an insufficient glucagon response is involved in hypoglycemia and related symptoms after RYGB, as there was a trend of higher GLP‐1 and lower glucagon responses. This may represent a type 2 statistical error. The pathophysiological basis for hypoglycemia‐like symptoms remains obscure. It may be that the velocity of plasma glucose reduction may be a factor (243, 292). Another factor could be the inter‐individual differences in glucose uptake and utilization in certain parts of the brain, thereby promoting central neuroglycopenia. An indirect sign of CNS activation was the observation that the SY‐group demonstrated a higher pulse rate compared to ASY indicating more pronounced induction of the sympathetic nerve activity to the heart. As the systemic glycemic control did not differ between the groups it can be speculated that this effect originated from the CNS, possibly at the hypothalamic level. It is apparent that the greater perception of symptoms in SY group and the link between the symptoms and causes in patients after RYGB needs further exploration.
6.2.5 Proposed dietary guidelines
The overall aim of this thesis was to enhance knowledge and to improve current treatment protocols regarding meal pattern, food intake, and meal‐related symptoms. Of course, the present four papers cannot be a sufficient basis for new recommendations, but the new insights they provide can still lead to improvements to the current clinical dietary guidelines. Dietary advice is based on the nutrition diagnosis and the treatment goals are to mitigate or relieve symptoms. Patients often report a reduced fat intake and an increased intake of vegetables and fruits, and the number of meals per day increases postoperatively, especially during morning hours. For most patients who have undergone RYGB, DS is not a major problem – rather a tool – but some have persisting problems. Hypoglycemia‐like symptoms are less common but more serious than the DS. The dietician has an important role, as both the DS and hypoglycemia‐like symptoms can be treated by modification of food intake and eating behavior. However, dieticians and other healthcare providers have to understand the mechanisms behind weight reduction with RYGB and to realize the large inter‐individual variations in eating capacity and thus EI. Thus it is vital that healthcare providers understand that, although the surgery is standardized, it is experienced very differently from person to person. The reason for this may depend on different physiological responses to the release of satiety hormones after surgery, as well as genetic predisposition and of course personality, including different coping strategies. Thus, some patients may rely more on the physiological signals after RYGB, while others need to be more active in different self‐monitoring behaviors. Consequently, follow‐up and treatment should be adapted to each individual's needs. The dietician plays a key role before and after surgery in patient education and behavior change and can lead the follow‐up after bariatric surgery (125, 293). Findings support the importance of comprehensive nutrition education for achieving more effective weight reduction following gastric bypass (231, 240) and the dietician can facilitate significant changes in several eating behaviors believed to be important to successful long‐term weight maintenance (231). Sarwer et al. have identified several strategies from the nonsurgical WL literature that might help to optimize long‐term weight maintenance after surgery (229). Dietary counseling may also help minimize the frequency of troublesome GI symptoms (121, 231).
General guidelines to help people eat healthily The Swedish National Food Agency (144) has put together five general guidelines to help people eat healthily; this advice should not be disregarded since a nutritionally balanced diet is even more important after RYGB:
44
• Eat plenty of fruits and vegetables, approximately 500 g per day. This corresponds, for example, to three pieces of fruit and two large handfuls of vegetables. • Choose primarily whole grains when you eat bread cereals, grains, pasta and rice. • Choose keyhole‐labeled foods. (The keyhole is a Nordic labeling scheme that helps consumers identify food that contains less fat, salt and sugar and more whole grain and fiber.) • Eat fish often, preferably three times a week. • Use a liquid margarine or oil in cooking.
Dietary guidelines given for overweight and obesity The following evidence‐based dietary guidelines are given to overweight and obese people and may also be given after RYGB, although their impact depends on the individual's physiological response to the surgery (294): • Eat a low‐fat (25–35 E% fat), reduced‐energy diet of good nutritional value. • Eat at regular intervals, including breakfast. • Eat reduced portion sizes. • Limit consumption of space food. (Space food refers to food and drink that is unnecessary from a nutritional viewpoint, for example, candy, juice, soft drinks, cakes, ice cream, snacks, French fries, creams and alcohol.)
Specific dietary guidelines after gastric bypass surgery In addition to general guidelines to help people eat healthily and dietary guidelines given for overweight and obesity, dieticians should apply the specific advice below after RYGB, based on previous research and on considerations from this thesis.
1. Encourage a low‐fat intake. A low‐fat intake, 25–35 E% (294) should be encouraged in dietary management after RYGB surgery for several reasons. Fat provides more than twice as much energy per gram (9 kcal/g) than protein and carbohydrates (each 4 kcal/g); in addition, fat is the energetic nutrient that is most difficult to digest and absorb after RYGB surgery (89). Fat malabsorption results in large malodorous stools entraining fat‐soluble vitamins, which increases the risk of deficiencies, especially among those who are not compliant with the recommendation to take nutritional supplements postoperatively. In addition, fat malabsorption increases the risk for kidney stone formation. Furthermore, fatty foods are found to be associated with DS.
2. Encourage the consumption of plenty of fruit and vegetables. These foods have low energy content, contain essential vitamins, minerals, antioxidants and phytochemicals (144, 295), have a high level of satiety (141, 296) and are in general well tolerated after RYGB (24, 26, 68, 82, 171‐174, 297). As with all obese patients, the RYGB‐operated patient needs need to be aware of reduced EI and nutrient density in the diet to maintain a lower body weight in the long term and to avoid nutrient deficiencies.
3. Individualize portion size. Appropriate portion size depends on many factors, such as energy needs, energy density of the meal, individual post‐surgery levels of satiety hormones and the physiology of the Roux limb. Vegetables are important as they can reduce EI if replacing foods with higher ED, and not only added on top of the regular portion (298).
4. Recommend a reduced eating rate. A reduced eating rate may decrease the risk of DS and a high EI. The latter is also decreased by increased satiety (158, 299).
45
5. Individualize meal frequency. A general recommendation to increase meal frequency after RYGB surgery is not supported by this thesis. It is most likely to be appropriate to recommend snacks in the first postoperative phase, when cognitive restraint is high; subsequently, the dietician must take account of individual variations in main meal portion size, energy requirements, energy content of the meals, the time between main meals and periods of physical activity, and response to physiological changes such as satiety sensations. Eating regularly may be important but it should not be equated with frequent eating.
6. Preventing DS Paper III showed that fatty food was identified as the food that most participants avoided to prevent or decrease DS problems associated with meals. In practice, it is often the combination of carbohydrate and fat that causes DS, not only sweet foods, as previously thought. Common foods that RYGB‐operated patients report to cause symptoms are ice cream, mashed potatoes, sausages, cakes and chocolate. Not only food choice can cause DS, but also eating behavior. Irregular meal times, portion size, eating rate, and drinks with meals have all been associated with DS. To skip the main meal or not eat for many hours can lead to overeating at the next meal; some regularity can reduce the risk of consuming large portions at a fast eating rate. It seems that most RYGB‐operated patients can drink with their meal without getting DS, but it depends most likely on the amount and content of the drink. Most patients manage some mouthfuls of water without getting symptoms.
7. Preventing reactive hypoglycemia Since it seems to be more the rule than the exception that simple carbohydrate results in hypoglycemia‐like symptoms, RYGB patients should be informed of the risk preoperatively. A low carbohydrate diet proposed by some researchers is rarely accepted by RYGB‐operated patients because as the subsequent high fat content often results in DS. Despite the lack of research on how carbohydrates with different glycemic index affect blood sugar after RYGB, a diet with low glycemic index can still be recommended because it has a good nutritional content and provides good satiety; avoiding simple carbohydrates is probably the key to minimizing the risk of hypoglycemia. To what extent meal distribution, increased protein intake and not drinking with the meal play a role, only future research will tell. Hypoglycemia‐like symptoms do not occur until one to three hours after the meal, and therefore the patient does not always connect the symptoms with the previous meal. Patients with DS and reactive hypoglycemia should be monitored according to the four steps of the nutritional care process.
8. Provide strategies for successful long‐term weight maintenance As mentioned above, there is a risk of weight gain over time, especially in patients with increased appetite, for whom the satiety hormone responses are attenuated (69) and in patients with poor diet quality, sedentary lifestyle, and lack of follow‐up. The following strategies taken from the National Weight Control Registry may be useful in patients with inadequate weight loss or weight regain (229, 235‐237).
a. Reduction in EI, reduced fat intake, eating breakfast every day and maintaining regular eating habits on weekdays and holidays. b. Self‐monitoring of food and beverage intake and body weight. Self‐monitoring of food and beverage is the cornerstone of behaviorally based WL treatment. A number of apps for calculating average daily caloric consumption are available on the Internet and in smartphones. Regular weighing on a scale is recommended at least once a week. Monitoring changes in weight provides patients with feedback and, as with self‐
46
monitoring of caloric intake, can allow them to modify their behavior in the future to reverse small amounts of weight gain. c. Continued patient‐caregiver contact. These postoperative visits can be used not only to monitor patients’ WL, but also to counsel them on issues related to dietary adherence and eating behavior, which are often forgotten or neglected after surgery. d. Physical activity. In self‐report surveys completed by patients postoperatively, 80% reported participation in some degree of physical activity. A study of RYGB patients found that 150 minutes per week of at least moderate intensity physical activity was associated with greater WL at six and twelve months postoperatively (300).
6.2.6 Strengths and limitations
Strengths This thesis has produced several results that are clinically useful, including changes in food intake and eating behavior, data on severity and frequency of the various dumping symptoms, and a study showing that objective variables did not differ between SY and ASY patients after an oral carbohydrate load. A strength of Paper II is that the portion size was measured both preoperatively and up to two years postoperatively. Even more interesting is the meal duration and eating rate, both of which add new and potentially important clinical insights that are important for future research on mechanisms and for clinicians in the nutrition care process. Paper III is apparently the first study that has been able to discriminate in detail between the different qualities of dumping symptoms and to assess how often symptoms occur. This study showed that fatigue, a need to lie down, and nausea were the most pronounced symptoms. In contrast, symptoms previously reported to be the most associated with DS, such as palpitations, sweating, diarrhea, cramp, and pain, were not as pronounced. The study also demonstrated that fatty foods were more associated with DS than sweet foods.
Limitations The limitations of this thesis are that it is based on relatively small sample sizes, potentially affecting the generalizability of the results. On the other hand, three of the studies were longitudinal and two were experimental, limiting the number of participants. Also, Paper I did not gather data on changes in physical activity and body composition after RYGB surgery. This information may have increased our understanding of associations, or lack thereof, among changes in EI, FW, DED and WL after gastric bypass surgery. In addition, this thesis has not discussed intake or recommendation of protein. A limitation of Paper II is that the test meals were administered in a laboratory setting, which may not reflect the participants’ normal eating habits. Furthermore, Swedish beef hash has a high fat content, 42 E%. Given that patients often change their food choices after RYGB to a low‐fat diet, they may have eaten larger portions if they had been served a more low‐fat meal. In addition, the thesis has not been able to quantify the effect of the preoperative dietary education that may have had different effects in different participants on postoperative eating behavior. Since some variables
47
tended to return to preoperative values, it would be of great value to extend the studies in Papers I and II into the longer term after RYGB. A limitation of Paper III is the small sample sizes of participants answering the GSRS. Another limitation is missing data from adolescents. Limitations of Paper IV include a small sample size constituting a risk for type 2 errors for the borderline non‐significant group differences in meal induced GLP‐1 and glucagon. For the same reason the correlation analyses have limitations, as r² is sensitive to outliers. The commonly used carbohydrate provocation tests of 75 grams of carbohydrate/315 kcal, was shown in out pilot studies to be suboptimal and we opted for a larger stimulus of carbohydrates (99.5 g carbohydrates / 443 kcal) to enable symptoms to appear. However, the use of various provocation drinks makes it more difficult to compare different studies. Furthermore, Sigstad’s Dumping Index has limitations since many symptoms are closely related, such as "sleepiness, drowsiness, apathy, falling asleep" as compared to "weakness, exhaustion" and "desire to lie or sit down".
48
7 CONCLUSIONS • Besides substantial reduction in energy intake and large variation in food weight, patients reported decreased dietary energy density over two years following gastric bypass. Despite a lack of association between the reduction in dietary energy density and % weight loss, changes in food choice were overall nutritionally beneficial. • After gastric bypass surgery, patients’ exhibit reduced ad libitum meal size with maintained meal duration, resulting in a decreased eating rate, although hunger and satiety scores did not change. Habitual meal frequency tended to increase after gastric bypass; in addition, larger numbers of meals were consumed in the mornings. Emotional eating and uncontrolled eating decreased significantly postoperatively while cognitive restraint only transiently increased six weeks postoperatively. In conclusion, patients display major changes in eating behavior and meal pattern, suggesting that gastric bypass drives the individual to an eating behavior that promotes weight loss. • Although most patients reported mild or no dumping symptoms one and two years after gastric bypass surgery, around 12% had persistent symptoms, in particular, postprandial fatigue, and half of them were so tired that they needed to lie down. Another 7% had problems with nausea and 6% had problems with feeling faint. The Dumping symptom rating scale is a reliable clinical screening instrument that can be used to identify patients with pronounced dumping symptoms after bariatric surgery. • The patients with a history of hypoglycemia‐like symptoms after RYGB neither demonstrated lower plasma glucose nor greater insulin response compared to asymptomatic patients in response to a liquid carbohydrate meal, but perceived more symptoms. The mechanisms of action behind the origin of such symptoms remain obscure and need further exploration.
49
8 FUTURE PERSPECTIVES Several studies have examined dietary intake after RYGB in terms of EI, macronutrient intake and food choice. Given the risk of under‐reporting of socially undesirable foods, these studies must be interpreted with caution. In the future, we need studies that can validate food intake, preferably validated with the doubly labeled water technique. Further studies in larger patient groups should examine changes in DED and whether lack of decrease in DED is a risk factor for weight regain after gastric bypass. We also need studies including analyses of specific changes in food preference and selection in relation to energy density after gastric bypass. The data on food choice and other ingestive behaviors have important implications for understanding the mechanisms of bariatric surgery. Potential mechanisms for postoperative changes in eating rate and general attitude to food warrant further investigation. For example, changes in appetite regulatory hormones may lead to less intense hunger, which in turn may reduce eating rate and EI (69, 301), given that hunger level is positively associated with eating rate and EI (302), and that interactions between eating rate and satiety hormones have been demonstrated in humans (280). The risk of DS is also likely to play a role in the reduced eating rate. DSRS needs to be revised to a 4‐point scale as the current 7‐point scale had a pronounced floor effect, i.e. a high percentage reported mild or no dumping symptoms. The validation process should be continued by studying the new 4‐point scale in different populations, different types of bariatric surgery and at different lengths of time after surgery. It would be worthwhile to proceed with a qualitative study of the 12% of patients with persistent DS problems. It would be of value to hear their opinion on different aspects of DS. Moreover, it would be of great importance to examine the relationship between dietary intake, eating behavior and DS more thoroughly; for example, whether there is any association between DED and DS or eating rate. Is it the symptoms rather than the GI hormones and taste changes that make RYGB patients change their dietary intake and eating behavior, or is all interconnected? Finally, it would be interesting to examine the effect of various carbohydrates, for example based on their glycemic index, on the development of reactive hypoglycemia. If hypoglycemia can be avoided through dietary interventions, then there is a need for more clinical efforts and further research on how different foods affect glucose and insulin responses after RYGB. In summary, we need more research to increase the evidence behind dietary and behavioral treatment after RYGB, in order to optimize treatment outcome.
50
ACKNOWLEDGEMENTS I would like to express my sincere gratitude and appreciation to all who have contributed to this thesis. Special thanks are due to the following individuals: My supervisor Dr Torsten Olbers, for your friendship and for your very deep interest and expertise regarding mechanisms of dietary changes after gastric bypass surgery. Special thanks for the past months of discussions and support. My co‐supervisor Professor Hans Lönroth, for your invaluable support during my postgraduate studies and for being proud of my work. My co‐supervisor Dr Ingrid Larsson, for being an excellent supervisor, and for being such an encouraging and wise person. Professor Lars Fändriks, for inspiring meetings in the planning of the studies, for your deep knowledge and tireless interest in exploring the physiology of food intake after gastric bypass; this has made me realize that my work as a bariatric dietitian is very valuable. Also thanks for all the inspiring scientific meetings at “Gastlab”. Associate professor Jan Karlsson, under your supervision the extensive work with Paper III became a pure delight! Professor Ingvar Bosaeus, for all the important things you learned and shared about bowel function in the intestinal failure clinic and for your important contribution to Paper I. My co‐authors Heléne Bertéus Forslund, Marco Bueter, Anna Karin Lindroos, Kathleen Melanson, Ingmar Näslund, Carel le Roux and Malin Werling, for your valuable contributions to the papers. Research colleagues and staff at the laboratory of Gastrosurgical Research and Education: Per Björklund, Niclas Björnfot, Anna Casselbrant, My Engström, Sören Lundberg, Almantas Maleckas, Carel le Roux, Emma Spak, Ville Wallenius and Malin Werling, for interesting discussions and for your friendship. My patients, you are amazing! You have generously shared your experience of RYGB surgery. With the increased knowledge I hope that nutritional counseling will improve. My manager, Petra Sixt, for encouragement and interest of my research. All the friendly staff in the surgical clinics at Sahlgrenska and Östra, with special thanks to Sylvi Abamson, Åsa Bergström, Wiveka Björkvall, Jessica Dahl, Bengt Hallerbäck, Monika Fagevik Olsén, Lena Gunnebo, Serdjan Kositic and Ylva Laurenius. Eva Andersson, EpiStat, for excellent statistical counseling. Catriona Chaplin, CMC Scientific English for Publication, for highly professional and careful language revision. Björn Henning, for excellent support regarding the nutritional calculation program.
51
Dr Elisabet Rothenberg, for valuable discussions regarding the nutrition care process. My colleagues in the Department of Clinical Nutrition, for many years of friendship, an inspiring working environment and with specific nutritional knowledge. Special thanks to Soheila Badiei, Maria Bengtsson, Sofia Björkman, Katrin Bloch Jörgensen, Birgitta Edvinson, Pia Henfridsson, Hanna Johansson, Agneta Lind, Ingegerd Olofsson and My Vakk. My colleagues in our “Swedish bariatric network”, all of whom have the pleasure of working with bariatric surgery. Special thanks to Malin Bruto, Karin Fransson, Marie Odin, Alexandra Roth and Anna Ståhlberg. To all my friends, who showed interest in my work and encouraged me through the years. My parents Britt and Göran, who have always instilled the importance of education and are now unappeasably proud, but who unfortunately are unable to attend the viva exam. My twin sister Eva and her children Nils and Charlotta, whose friendship means a lot. Finally, but most important, my family: Pelle who has always supported me with great love and humor, and my pride and joy, Ebba, Louise and Erik, thanks for everything. I love you! This thesis was supported by grants from Western Region in Sweden No; VGFOUGSB‐6526, VGFOUGSB‐87141, ALFGBG‐11866, ALFGBG‐151481 and Swedish Nutrition Foundation.
52
REFERENCES 1. WHO. Obesity and overweight.
http://wwwwhoint/mediacentre/factsheets/fs311/en/indexhtml 2012: Fact sheet No.311. 2. Fahraeus C, Wendt LK, Nilsson M, Isaksson H, Alm A, Andersson‐Gare B. Overweight and
obesity in twenty‐year‐old Swedes in relation to birthweight and weight development during childhood. Acta Paediatr 2012; 101: 637‐642.
3. Kirk SF, Penney TL, McHugh TL, Sharma AM. Effective weight management practice: a review
of the lifestyle intervention evidence. Int J Obes (Lond) 2012; 36: 178‐185. 4. Leblanc ES, O'Connor E, Whitlock EP, Patnode CD, Kapka T. Effectiveness of primary care‐
relevant treatments for obesity in adults: a systematic evidence review for the U.S. Preventive Services Task Force. Ann Intern Med 2011; 155: 434‐447.
5. Buchwald H, Oien DM. Metabolic/bariatric surgery Worldwide 2008. Obes Surg 2009; 19:
1605‐1611. 6. Mechanick JI, Kushner RF, Sugerman HJ, Gonzalez‐Campoy JM, Collazo‐Clavell ML, Spitz AF,
et al. American Association of Clinical Endocrinologists, The Obesity Society, and American Society for Metabolic & Bariatric Surgery medical guidelines for clinical practice for the perioperative nutritional, metabolic, and nonsurgical support of the bariatric surgery patient. Obesity (Silver Spring) 2009; 17 Suppl 1: S1‐70, v.
7. Olbers T, Fagevik‐Olsen M, Maleckas A, Lonroth H. Randomized clinical trial of laparoscopic
Roux‐en‐Y gastric bypass versus laparoscopic vertical banded gastroplasty for obesity. Br J Surg 2005; 92: 557‐562.
8. Kremen AJ, Linner JH, Nelson CH. An experimental evaluation of the nutritional importance
of proximal and distal small intestine. Ann Surg 1954; 140: 439‐448. 9. Vage V, Solhaug JH, Berstad A, Svanes K, Viste A. Jejunoileal bypass in the treatment of
morbid obesity: a 25‐year follow‐up study of 36 patients. Obes Surg 2002; 12: 312‐318. 10. Gourlay RH, Reynolds C. Complications of surgery for morbid obesity. Am J Surg 1978; 136:
54‐60. 11. Stockeld D, Backman L, Granstrom L. Jejunoileal Bypass Operations With a Side‐to‐side
Anastomosis in the Treatment of Morbid Obesity. Obes Surg 1991; 1: 161‐164. 12. Padwal R, Klarenbach S, Wiebe N, Birch D, Karmali S, Manns B, et al. Bariatric surgery: a
systematic review and network meta‐analysis of randomized trials. Obes Rev 2011; 12: 602‐621.
13. Mason EE, Ito C. Gastric bypass in obesity. 1967. Obes Res 1996; 4: 316‐319. 14. Aills L, Blankenship J, Buffington C, Furtado M, Parrott J. ASMBS Allied Health Nutritional
Guidelines for the Surgical Weight Loss Patient. Surg Obes Relat Dis 2008; 4: S73‐108.
53
15. Printen KJ, Mason EE. Gastric surgery for relief of morbid obesity. Arch Surg 1973; 106: 428‐
431. 16. Laws HL. Standardized gastroplasty orifice. Am J Surg 1981; 141: 393‐394. 17. Mason EE. Vertical banded gastroplasty for obesity. Arch Surg 1982; 117: 701‐706. 18. Lonroth H, Dalenback J, Haglind E, Josefsson K, Olbe L, Fagevik Olsen M, et al. Vertical
banded gastroplasty by laparoscopic technique in the treatment of morbid obesity. Surg Laparosc Endosc 1996; 6: 102‐107.
19. Forsell P, Hallberg D, Hellers G. A Gastric Band with Adjustable Inner Diameter for Obesity
Surgery: Preliminary Studies. Obes Surg 1993; 3: 303‐306. 20. Buchwald H, Oien DM. Metabolic/Bariatric Surgery Worldwide 2011. Obes Surg 2013; 23:
427‐436. 21. Sjostrom L, Lindroos AK, Peltonen M, Torgerson J, Bouchard C, Carlsson B, et al. Lifestyle,
diabetes, and cardiovascular risk factors 10 years after bariatric surgery. N Engl J Med 2004; 351: 2683‐2693.
22. Buchwald H, Avidor Y, Braunwald E, Jensen MD, Pories W, Fahrbach K, et al. Bariatric surgery:
a systematic review and meta‐analysis. Jama 2004; 292: 1724‐1737. 23. Delin CR, Anderson PG. A preliminary comparison of the psychological impact of laparoscopic
gastric banding and gastric bypass surgery for morbid obesity. Obes Surg 1999; 9: 155‐160. 24. Overs SE, Freeman RA, Zarshenas N, Walton KL, Jorgensen JO. Food tolerance and
gastrointestinal quality of life following three bariatric procedures: adjustable gastric banding, Roux‐en‐Y gastric bypass, and sleeve gastrectomy. Obes Surg 2012; 22: 536‐543.
25. Schweiger C, Weiss R, Keidar A. Effect of different bariatric operations on food tolerance and
quality of eating. Obes Surg 2010; 20: 1393‐1399. 26. Ernst B, Thurnheer M, Wilms B, Schultes B. Differential changes in dietary habits after gastric
bypass versus gastric banding operations. Obes Surg 2009; 19: 274‐280. 27. Kenler HA, Brolin RE, Cody RP. Changes in eating behavior after horizontal gastroplasty and
Roux‐en‐Y gastric bypass. Am J Clin Nutr 1990; 52: 87‐92. 28. Brolin RL, Robertson LB, Kenler HA, Cody RP. Weight loss and dietary intake after vertical
banded gastroplasty and Roux‐en‐Y gastric bypass. Ann Surg 1994; 220: 782‐790. 29. Scopinaro N, Gianetta E, Adami GF, Friedman D, Traverso E, Marinari GM, et al.
Biliopancreatic diversion for obesity at eighteen years. Surgery 1996; 119: 261‐268. 30. Biron S, Hould FS, Lebel S, Marceau S, Lescelleur O, Simard S, et al. Twenty years of
biliopancreatic diversion: what is the goal of the surgery? Obes Surg 2004; 14: 160‐164. 31. Hess DS, Hess DW. Biliopancreatic diversion with a duodenal switch. Obes Surg 1998; 8: 267‐
282.
54
32. Laurenius A, Taha O, Maleckas A, Lonroth H, Olbers T. Laparoscopic biliopancreatic
diversion/duodenal switch or laparoscopic Roux‐en‐Y gastric bypass for super‐obesity‐weight loss versus side effects. Surg Obes Relat Dis 2010; 6: 408‐414.
33. Sovik TT, Karlsson J, Aasheim ET, Fagerland MW, Bjorkman S, Engstrom M, et al.
Gastrointestinal function and eating behavior after gastric bypass and duodenal switch. Surg Obes Relat Dis 2012 Jun 28. [Epub ahead of print].
34. Aasheim ET, Bjorkman S, Sovik TT, Engstrom M, Hanvold SE, Mala T, et al. Vitamin status
after bariatric surgery: a randomized study of gastric bypass and duodenal switch. Am J Clin Nutr 2009; 90: 15‐22.
35. Rosenthal RJ, Diaz AA, Arvidsson D, Baker RS, Basso N, Bellanger D, et al. International Sleeve
Gastrectomy Expert Panel Consensus Statement: best practice guidelines based on experience of >12,000 cases. Surg Obes Relat Dis 2012; 8: 8‐19.
36. Himpens J, Dapri G, Cadiere GB. A prospective randomized study between laparoscopic
gastric banding and laparoscopic isolated sleeve gastrectomy: results after 1 and 3 years. Obes Surg 2006; 16: 1450‐1456.
37. Stefater MA, Wilson‐Perez HE, Chambers AP, Sandoval DA, Seeley RJ. All bariatric surgeries
are not created equal: insights from mechanistic comparisons. Endocr Rev 2012; 33: 595‐622. 38. Lee WJ, Chong K, Ser KH, Lee YC, Chen SC, Chen JC, et al. Gastric bypass vs sleeve
gastrectomy for type 2 diabetes mellitus: a randomized controlled trial. Arch Surg 2011; 146: 143‐148.
39. DeMaria EJ. Bariatric surgery for morbid obesity. N Engl J Med 2007; 356: 2176‐2183. 40. Lonroth H, Dalenback J, Haglind E, Lundell L. Laparoscopic gastric bypass. Another option in
bariatric surgery. Surg Endosc 1996; 10: 636‐638. 41. Olbers T, Lonroth H, Fagevik‐Olsen M, Lundell L. Laparoscopic gastric bypass: development of
technique, respiratory function, and long‐term outcome. Obes Surg 2003; 13: 364‐370. 42. Näslund I. SORegs årsrapport 2011. 2012; www.ucr.uu.se/soreg. 43. Inge TH, Xanthakos SA, Zeller MH. Bariatric surgery for pediatric extreme obesity: now or
later? Int J Obes (Lond) 2007; 31: 1‐14. 44. Olbers T, Gronowitz E, Werling M, Marlid S, Flodmark CE, Peltonen M, et al. Two‐year
outcome of laparoscopic Roux‐en‐Y gastric bypass in adolescents with severe obesity: results from a Swedish Nationwide Study (AMOS). Int J Obes (Lond) 2012; 36: 1388‐1395.
45. Ingelfinger JR. Bariatric surgery in adolescents. N Engl J Med 2011; 365: 1365‐1367. 46. Michalsky M, Kramer RE, Fullmer MA, Polfuss M, Porter R, Ward‐Begnoche W, et al.
Developing criteria for pediatric/adolescent bariatric surgery programs. Pediatrics 2011; 128 Suppl 2: S65‐70.

55
47. Karlsson J, Taft C, Ryden A, Sjostrom L, Sullivan M. Ten‐year trends in health‐related quality of life after surgical and conventional treatment for severe obesity: the SOS intervention study. Int J Obes (Lond) 2007; 31: 1248‐1261.
48. Buchwald H, Estok R, Fahrbach K, Banel D, Jensen MD, Pories WJ, et al. Weight and type 2
diabetes after bariatric surgery: systematic review and meta‐analysis. Am J Med 2009; 122: 248‐256 e245.
49. Anderwald CH, Tura A, Promintzer‐Schifferl M, Prager G, Stadler M, Ludvik B, et al.
Alterations in gastrointestinal, endocrine, and metabolic processes after bariatric Roux‐en‐Y gastric bypass surgery. Diabetes Care 2012; 35: 2580‐2587.
50. Sjostrom L, Narbro K, Sjostrom CD, Karason K, Larsson B, Wedel H, et al. Effects of bariatric
surgery on mortality in Swedish obese subjects. N Engl J Med 2007; 357: 741‐752. 51. Adams TD, Gress RE, Smith SC, Halverson RC, Simper SC, Rosamond WD, et al. Long‐term
mortality after gastric bypass surgery. N Engl J Med 2007; 357: 753‐761. 52. Adams TD, Davidson LE, Litwin SE, Kolotkin RL, LaMonte MJ, Pendleton RC, et al. Health
benefits of gastric bypass surgery after 6 years. JAMA 2012; 308: 1122‐1131. 53. Sjostrom L. Review of the key results from the Swedish Obese Subjects (SOS) trial ‐ a
prospective controlled intervention study of bariatric surgery. J Intern Med 2013; 273: 219‐234.
54. Arterburn DE, Bogart A, Sherwood NE, Sidney S, Coleman KJ, Haneuse S, et al. A multisite
study of long‐term remission and relapse of type 2 diabetes mellitus following gastric bypass. Obes Surg 2013; 23: 93‐102.
55. Dixon JB, Zimmet P, Alberti KG, Rubino F. Bariatric surgery: an IDF statement for obese Type
2 diabetes. Diabet Med 2011; 28: 628‐642. 56. Grunstein RR, Stenlof K, Hedner JA, Peltonen M, Karason K, Sjostrom L. Two year reduction in
sleep apnea symptoms and associated diabetes incidence after weight loss in severe obesity. Sleep 2007; 30: 703‐710.
57. Hallersund P, Sjöström L, Olbers T, Lönroth H, Jacobsson P, Wallenius V, et al. Gastric Bypass
Surgery Is Followed by Lowered Blood Pressure and Increased Diuresis ‐ Long Term Results from the Swedish Obese Subjects (SOS) Study. PLoS ONE 2012; 7(11): e49696.
58. Blackburn GL, Mun EC. Therapy insight: weight‐loss surgery and major cardiovascular risk
factors. Nat Clin Pract Cardiovasc Med 2005; 2: 585‐591. 59. Sjostrom L, Peltonen M, Jacobson P, Sjostrom CD, Karason K, Wedel H, et al. Bariatric surgery
and long‐term cardiovascular events. JAMA 2012; 307: 56‐65. 60. Peltonen E, G. M., Lindroos AK, D. R., Torgerson JV, L. M., Mattar SG, Korytkowski MT,
Gosman G, et al. Musculoskeletal pain in the obese: a comparison with a general population and long‐term changes after conventional and surgical obesityEffective treatment of polycystic ovarian syndrome with Roux‐en‐Y gastric bypass. PainSurg Obes Relat Dis 20032005; 1041: 549‐5777‐5780.
56
61. Eid GM, Cottam DR, Velcu LM, Mattar SG, Korytkowski MT, Gosman G, et al. Effective treatment of polycystic ovarian syndrome with Roux‐en‐Y gastric bypass. Surg Obes Relat Dis 2005; 1: 77‐80.
62. Neovius M, Narbro K, Keating C, Peltonen M, Sjoholm K, Agren G, et al. Health care use
during 20 years following bariatric surgery. JAMA 2012; 308: 1132‐1141. 63. Maklin S, Malmivaara A, Linna M, Victorzon M, Koivukangas V, Sintonen H. Cost‐utility of
bariatric surgery for morbid obesity in Finland. Br J Surg 2011; 98: 1422‐1429. 64. Campbell J, McGarry LA, Shikora SA, Hale BC, Lee JT, Weinstein MC. Cost‐effectiveness of
laparoscopic gastric banding and bypass for morbid obesity. Am J Manag Care 2010; 16: e174‐187.
65. Carlsson LM, Peltonen M, Ahlin S, Anveden A, Bouchard C, Carlsson B, et al. Bariatric surgery
and prevention of type 2 diabetes in Swedish obese subjects. N Engl J Med 2012; 367: 695‐704.
66. Sjostrom L, Gummesson A, Sjostrom CD, Narbro K, Peltonen M, Wedel H, et al. Effects of
bariatric surgery on cancer incidence in obese patients in Sweden (Swedish Obese Subjects Study): a prospective, controlled intervention trial. Lancet Oncol 2009; 10: 653‐662.
67. Näslund I. SORegs årsrapport 2012. 2012; www.ucr.uu.se/soreg. 68. Halmi KA, Mason E, Falk JR, Stunkard A. Appetitive behavior after gastric bypass for obesity.
Int J Obes 1981; 5: 457‐464. 69. le Roux CW, Welbourn R, Werling M, Osborne A, Kokkinos A, Laurenius A, et al. Gut
hormones as mediators of appetite and weight loss after Roux‐en‐Y gastric bypass. Ann Surg 2007; 246: 780‐785.
70. Bueter M, le Roux CW. Gastrointestinal hormones, energy balance and bariatric surgery. Int J
Obes (Lond) 2011; 35 Suppl 3: S35‐39. 71. Astrup A. Weight loss produced by gastric bypass surgery: more gut feelings hit the brain. Am
J Clin Nutr 2012; 96: 457‐458. 72. Schultes B, Ernst B, Wilms B, Thurnheer M, Hallschmid M. Hedonic hunger is increased in
severely obese patients and is reduced after gastric bypass surgery. Am J Clin Nutr 2012; 92: 277‐283.
73. Ullrich J, Ernst B, Wilms B, Thurnheer M, Schultes B. Roux‐en Y gastric bypass surgery reduces
hedonic hunger and improves dietary habits in severely obese subjects. Obes Surg 2013; 23: 50‐55.
74. Tichansky DS, Boughter JD, Jr., Madan AK. Taste change after laparoscopic Roux‐en‐Y gastric
bypass and laparoscopic adjustable gastric banding. Surg Obes Relat Dis 2006; 2: 440‐444. 75. Miras AD, le Roux CW. Bariatric surgery and taste: novel mechanisms of weight loss. Curr
Opin Gastroenterol 2010; 26: 140‐145.
57
76. Bueter M, Miras AD, Chichger H, Fenske W, Ghatei MA, Bloom SR, et al. Alterations of sucrose preference after Roux‐en‐Y gastric bypass. Physiol Behav 2011; 104: 709‐721.
77. Papamargaritis D, Panteliou E, Miras AD, le Roux CW. Mechanisms of weight loss, diabetes
control and changes in food choices after gastrointestinal surgery. Curr Atheroscler Rep 2012; 14: 616‐623.
78. Miras AD, Jackson RN, Jackson SN, Goldstone AP, Olbers T, Hackenberg T, et al. Gastric
bypass surgery for obesity decreases the reward value of a sweet‐fat stimulus as assessed in a progressive ratio task. Am J Clin Nutr 2012; 96: 467‐473.
79. Berthoud HR, Zheng H, Shin AC. Food reward in the obese and after weight loss induced by
calorie restriction and bariatric surgery. Ann N Y Acad Sci 2012; 1264: 36‐48. 80. Ochner CN, Kwok Y, Conceicao E, Pantazatos SP, Puma LM, Carnell S, et al. Selective
reduction in neural responses to high calorie foods following gastric bypass surgery. Ann Surg 2011; 253: 502‐507.
81. Bueter M, Lowenstein C, Olbers T, Wang M, Cluny NL, Bloom SR, et al. Gastric bypass
increases energy expenditure in rats. Gastroenterology 2010; 138: 1845‐1853. 82. Olbers T, Bjorkman S, Lindroos A, Maleckas A, Lonn L, Sjostrom L, et al. Body composition,
dietary intake, and energy expenditure after laparoscopic Roux‐en‐Y gastric bypass and laparoscopic vertical banded gastroplasty: a randomized clinical trial. Ann Surg 2006; 244: 715‐722.
83. Kellum JM, Kuemmerle JF, O'Dorisio TM, Rayford P, Martin D, Engle K, et al. Gastrointestinal
hormone responses to meals before and after gastric bypass and vertical banded gastroplasty. Ann Surg 1990; 211: 763‐770; discussion 770‐761.
84. Hsu LK, Benotti PN, Dwyer J, Roberts SB, Saltzman E, Shikora S, et al. Nonsurgical factors that
influence the outcome of bariatric surgery: a review. Psychosom Med 1998; 60: 338‐346. 85. Sugerman HJ, Kellum JM, Engle KM, Wolfe L, Starkey JV, Birkenhauer R, et al. Gastric bypass
for treating severe obesity. Am J Clin Nutr 1992; 55: 560S‐566S. 86. Mallory GN, Macgregor AM, Rand CS. The Influence of Dumping on Weight Loss After Gastric
Restrictive Surgery for Morbid Obesity. Obes Surg 1996; 6: 474‐478. 87. Ukleja A. Dumping syndrome: pathophysiology and treatment. Nutr Clin Pract 2005; 20: 517‐
525. 88. Deitel M. The change in the dumping syndrome concept. Obes Surg 2008; 18: 1622‐1624. 89. Odstrcil EA, Martinez JG, Santa Ana CA, Xue B, Schneider RE, Steffer KJ, et al. The
contribution of malabsorption to the reduction in net energy absorption after long‐limb Roux‐en‐Y gastric bypass. Am J Clin Nutr 2010; 92: 704‐713.
90. Potoczna N, Harfmann S, Steffen R, Briggs R, Bieri N, Horber FF. Bowel habits after bariatric
surgery. Obes Surg 2008; 18: 1287‐1296.
58
91. Shin AC, Zheng H, Townsend RL, Patterson LM, Holmes GM, Berthoud HR. Longitudinal Assessment of Food Intake, Fecal Energy Loss, and Energy Expenditure After Roux‐en‐Y Gastric Bypass Surgery in High‐Fat‐Fed Obese Rats. Obes Surg 2013; 23: 531‐540.
92. Goranzon H, Forsum E, Thilen M. Calculation and determination of metabolizable energy in
mixed diets to humans. Am J Clin Nutr 1983; 38: 954‐963. 93. Sinha MK, Collazo‐Clavell ML, Rule A, Milliner DS, Nelson W, Sarr MG, et al. Hyperoxaluric
nephrolithiasis is a complication of Roux‐en‐Y gastric bypass surgery. Kidney Int 2007; 72: 100‐107.
94. Lieske JC, Kumar R, Collazo‐Clavell ML. Nephrolithiasis after bariatric surgery for obesity.
Semin Nephrol 2008; 28: 163‐173. 95. Duffey BG, Pedro RN, Makhlouf A, Kriedberg C, Stessman M, Hinck B, et al. Roux‐en‐Y gastric
bypass is associated with early increased risk factors for development of calcium oxalate nephrolithiasis. J Am Coll Surg 2008; 206: 1145‐1153.
96. Matlaga BR, Shore AD, Magnuson T, Clark JM, Johns R, Makary MA. Effect of gastric bypass
surgery on kidney stone disease. J Urol 2009; 181: 2573‐2577. 97. Whitson JM, Stackhouse GB, Stoller ML. Hyperoxaluria after modern bariatric surgery: case
series and literature review. Int Urol Nephrol 2010; 42: 369‐374. 98. Duffey BG, Alanee S, Pedro RN, Hinck B, Kriedberg C, Ikramuddin S, et al. Hyperoxaluria is a
long‐term consequence of Roux‐en‐Y Gastric bypass: a 2‐year prospective longitudinal study. J Am Coll Surg 2010; 211: 8‐15.
99. Tasca A. Metabolic syndrome and bariatric surgery in stone disease etiology. Curr Opin Urol
2011; 21: 129‐133. 100. Kumar R, Lieske JC, Collazo‐Clavell ML, Sarr MG, Olson ER, Vrtiska TJ, et al. Fat malabsorption
and increased intestinal oxalate absorption are common after Roux‐en‐Y gastric bypass surgery. Surgery 2011; 149: 654‐661.
101. Nasr SH, D'Agati VD, Said SM, Stokes MB, Largoza MV, Radhakrishnan J, et al. Oxalate
nephropathy complicating Roux‐en‐Y Gastric Bypass: an underrecognized cause of irreversible renal failure. Clin J Am Soc Nephrol 2008; 3: 1676‐1683.
102. Andersson H, Jagenburg R. Fat‐reduced diet in the treatment of hyperoxaluria in patients
with ileopathy. Gut 1974; 15: 360‐366. 103. Lieske JC. Gastric bypass procedures and renal calculi‐‐how should we counsel patients and
bariatric surgeons? J Urol 2009; 182: 2105‐2106. 104. MacLean LD, Rhode BM, Nohr CW. Late outcome of isolated gastric bypass. Ann Surg 2000;
231: 524‐528. 105. Flanagan L. Measurement of Functional Pouch Volume following the Gastric Bypass
Procedure. Obes Surg 1996; 6: 38‐43. 106. Madan AK, Tichansky DS, Phillips JC. Does pouch size matter? Obes Surg 2007; 17: 317‐320.
59
107. O'Connor EA, Carlin AM. Lack of correlation between variation in small‐volume gastric pouch
size and weight loss after laparoscopic Roux‐en‐Y gastric bypass. Surg Obes Relat Dis 2008; 4: 399‐403.
108. Topart P, Becouarn G, Ritz P. Pouch size after gastric bypass does not correlate with weight
loss outcome. Obes Surg 2011; 21: 1350‐1354. 109. Bjorklund P, Laurenius A, Een E, Olbers T, Lonroth H, Fandriks L. Is the Roux limb a
determinant for meal size after gastric bypass surgery? Obes Surg 2010; 20: 1408‐1414. 110. Thirlby RC, Bahiraei F, Randall J, Drewnoski A. Effect of Roux‐en‐Y gastric bypass on satiety
and food likes: the role of genetics. J Gastrointest Surg 2006; 10: 270‐277. 111. Hatoum IJ, Greenawalt DM, Cotsapas C, Reitman ML, Daly MJ, Kaplan LM. Heritability of the
weight loss response to gastric bypass surgery. J Clin Endocrinol Metab 2011; 96: E1630‐1633.
112. Delgado‐Aros S, Locke GR, 3rd, Camilleri M, Talley NJ, Fett S, Zinsmeister AR, et al. Obesity is
associated with increased risk of gastrointestinal symptoms: a population‐based study. Am J Gastroenterol 2004; 99: 1801‐1806.
113. Eslick GD. Gastrointestinal symptoms and obesity: a meta‐analysis. Obes Rev 2012; 13: 469‐
479. 114. Foster A, Laws HL, Gonzalez QH, Clements RH. Gastrointestinal symptomatic outcome after
laparoscopic Roux‐en‐Y gastric bypass. J Gastrointest Surg 2003; 7: 750‐753. 115. Clements RH, Gonzalez QH, Foster A, Richards WO, McDowell J, Bondora A, et al.
Gastrointestinal symptoms are more intense in morbidly obese patients and are improved with laparoscopic Roux‐en‐Y gastric bypass. Obes Surg 2003; 13: 610‐614.
116. Ballem N, Yellumahanthi K, Wolfe M, Wesley MM, Clements RH. Gastrointestinal symptom
improvement after Roux‐en‐Y gastric bypass: long‐term analysis. Surg Obes Relat Dis 2009; 5: 553‐558.
117. NIH conference. Gastrointestinal surgery for severe obesity. Consensus Development
Conference Panel. Ann Intern Med 1991; 115: 956‐961. 118. Blackburn GL, Hutter MM, Harvey AM, Apovian CM, Boulton HR, Cummings S, et al. Expert
panel on weight loss surgery: executive report update. Obesity (Silver Spring) 2009; 17: 842‐862.
119. Apovian CM, Cummings S, Anderson W, Borud L, Boyer K, Day K, et al. Best practice updates
for multidisciplinary care in weight loss surgery. Obesity (Silver Spring) 2009; 17: 871‐879. 120. Fried M, Hainer V, Basdevant A, Buchwald H, Deitel M, Finer N, et al. Inter‐disciplinary
European guidelines on surgery of severe obesity. Int J Obes (Lond) 2007; 31: 569‐577. 121. Heber D, Greenway FL, Kaplan LM, Livingston E, Salvador J, Still C. Endocrine and nutritional
management of the post‐bariatric surgery patient: an Endocrine Society Clinical Practice Guideline. J Clin Endocrinol Metab 2010; 95: 4823‐4843.
60
122. Colles SL, Dixon JB, Marks P, Strauss BJ, O'Brien PE. Preoperative weight loss with a very‐low‐
energy diet: quantitation of changes in liver and abdominal fat by serial imaging. Am J Clin Nutr 2006; 84: 304‐311.
123. Tarnoff M, Kaplan LM, Shikora S. An evidenced‐based assessment of preoperative weight loss
in bariatric surgery. Obes Surg 2008; 18: 1059‐1061. 124. Parkes E. Nutritional Management of Patients after Bariatric Surgery. Am J Med Sci 2006;
331: 207–213. 125. Kulick D, Hark L, Deen D. The bariatric surgery patient: a growing role for registered
dietitians. J Am Diet Assoc 2010; 110: 593‐599. 126. Halverson JD, Zuckerman GR, Koehler RE, Gentry K, Michael HE, DeSchryver‐Kecskemeti K.
Gastric bypass for morbid obesity: a medical‐‐surgical assessment. Ann Surg 1981; 194: 152‐160.
127. Marcason W. What are the dietary guidelines following bariatric surgery? J Am Diet Assoc
2004; 104: 487‐488. 128. Biesemeier CK Garland J, et al. Weight Management Dietetic Practice Group. American
Dietetic Association Pocket guide to bariatric surgery. Chicago, Illinois. 2009. 129. Lissner L, Heitmann BL, Lindroos AK. Measuring intake in free‐living human subjects: a
question of bias. Proc Nutr Soc 1998; 57: 333‐339. 130. Lissner L, Lindroos AK. Is dietary underreporting macronutrient‐specific? Eur J Clin Nutr 1994;
48: 453‐454. 131. Heitmann BL, Lissner L. Dietary underreporting by obese individuals‐‐is it specific or non‐
specific? BMJ 1995; 311: 986‐989. 132. Braam LA, Ocke MC, Bueno‐de‐Mesquita HB, Seidell JC. Determinants of obesity‐related
underreporting of energy intake. Am J Epidemiol 1998; 147: 1081‐1086. 133. Lissner L. Measuring food intake in studies of obesity. Public Health Nutr 2002; 5: 889‐892. 134. Svendsen M, Tonstad S. Accuracy of food intake reporting in obese subjects with metabolic
risk factors. Br J Nutr 2006; 95: 640‐649. 135. Lindroos AK, Lissner L, Sjostrom L. Validity and reproducibility of a self‐administered dietary
questionnaire in obese and non‐obese subjects. Eur J Clin Nutr 1993; 47: 461‐481. 136. Heerstrass DW, Ocke MC, Bueno‐de‐Mesquita HB, Peeters PH, Seidell JC. Underreporting of
energy, protein and potassium intake in relation to body mass index. International journal of epidemiology 1998; 27: 186‐193.
137. Isaksson B. Urinary nitrogen output as a validity test in dietary surveys. Am J Clin Nutr 1980;
33: 4‐5.
61
138. Schoeller DA, van Santen E. Measurement of energy expenditure in humans by doubly labeled water method. J Appl Physiol 1982; 53: 955‐959.
139. Stubbs RJ, Johnstone AM, O'Reilly LM, Poppitt SD. Methodological issues relating to the
measurement of food, energy and nutrient intake in human laboratory‐based studies. Proc Nutr Soc 1998; 57: 357‐372.
140. Mathes CM, Spector AC. Food selection and taste changes in humans after Roux‐en‐Y gastric
bypass surgery: a direct‐measures approach. Physiol Behav 2012; 107: 476‐483. 141. Rolls BJ. The relationship between dietary energy density and energy intake. Physiol Behav
2009; 97: 609‐615. 142. Food and agriculture organization of the United Nations
http://faostatfaoorg/site/354/defaultaspx 2011. 143. Yu‐Poth S, Zhao G, Etherton T, Naglak M, Jonnalagadda S, Kris‐Etherton PM. Effects of the
National Cholesterol Education Program's Step I and Step II dietary intervention programs on cardiovascular disease risk factors: a meta‐analysis. Am J Clin Nutr 1999; 69: 632‐646.
144. National Food Agency in Sweden http://www.slv.se/sv/grupp1/Mat‐och‐naring/kostrad/.
2013. 145. Piernas C, Popkin BM. Increased portion sizes from energy‐dense foods affect total energy
intake at eating occasions in US children and adolescents: patterns and trends by age group and sociodemographic characteristics, 1977‐2006. Am J Clin Nutr 2011; 94: 1324‐1332.
146. Rolls BJ, Morris EL, Roe LS. Portion size of food affects energy intake in normal‐weight and
overweight men and women. Am J Clin Nutr 2002; 76: 1207‐1213. 147. Kant AK, Graubard BI, Mattes RD. Association of food form with self‐reported 24‐h energy
intake and meal patterns in US adults: NHANES 2003‐2008. Am J Clin Nutr 2012; 96: 1369‐1378.
148. Berg C, Lappas G, Wolk A, Strandhagen E, Toren K, Rosengren A, et al. Eating patterns and
portion size associated with obesity in a Swedish population. Appetite 2009; 52: 21‐26. 149. Kant AK, Schatzkin A, Graubard BI, Ballard‐Barbash R. Frequency of eating occasions and
weight change in the NHANES I Epidemiologic Follow‐up Study. Int J Obes Relat Metab Disord 1995; 19: 468‐474.
150. Ma Y, Bertone ER, Stanek EJ, 3rd, Reed GW, Hebert JR, Cohen NL, et al. Association between
eating patterns and obesity in a free‐living US adult population. Am J Epidemiol 2003; 158: 85‐92.
151. Berteus Forslund H, Torgerson JS, Sjostrom L, Lindroos AK. Snacking frequency in relation to
energy intake and food choices in obese men and women compared to a reference population. Int J Obes (Lond) 2005; 29: 711‐719.
152. Jaaskelainen A, Schwab U, Kolehmainen M, Pirkola J, Jarvelin MR, Laitinen J. Associations of
meal frequency and breakfast with obesity and metabolic syndrome traits in adolescents of
62
Northern Finland Birth Cohort 1986. Nutr Metab Cardiovasc Dis 2012 Aug 14. [Epub ahead of print].
153. Deshmukh‐Taskar P, Nicklas TA, Radcliffe JD, O'Neil CE, Liu Y. The relationship of breakfast
skipping and type of breakfast consumed with overweight/obesity, abdominal obesity, other cardiometabolic risk factors and the metabolic syndrome in young adults. The National Health and Nutrition Examination Survey (NHANES): 1999‐2006. Public Health Nutr 2012: 1‐10.
154. Kral JG, Buckley MC, Kissileff HR, Schaffner F. Metabolic correlates of eating behavior in
severe obesity. Int J Obes Relat Metab Disord 2001; 25: 258‐264. 155. Sasaki S, Katagiri A, Tsuji T, Shimoda T, Amano K. Self‐reported rate of eating correlates with
body mass index in 18‐y‐old Japanese women. Int J Obes Relat Metab Disord 2003; 27: 1405‐1410.
156. Otsuka R, Tamakoshi K, Yatsuya H, Murata C, Sekiya A, Wada K, et al. Eating fast leads to
obesity: findings based on self‐administered questionnaires among middle‐aged Japanese men and women. J Epidemiol 2006; 16: 117‐124.
157. Martin CK, Anton SD, Walden H, Arnett C, Greenway FL, Williamson DA. Slower eating rate
reduces the food intake of men, but not women: implications for behavioral weight control. Behav Res Ther 2007; 45: 2349‐2359.
158. Andrade AM, Greene GW, Melanson KJ. Eating slowly led to decreases in energy intake
within meals in healthy women. J Am Diet Assoc 2008; 108: 1186‐1191. 159. Mesas AE, Munoz‐Pareja M, Lopez‐Garcia E, Rodriguez‐Artalejo F. Selected eating behaviours
and excess body weight: a systematic review. Obes Rev 2012; 13: 106‐135. 160. Kofman MD, Lent MR, Swencionis C. Maladaptive eating patterns, quality of life, and weight
outcomes following gastric bypass: results of an Internet survey. Obesity (Silver Spring) 2010; 18: 1938‐1943.
161. Reas DL, Wisting L, Kapstad H, Lask B. Nibbling: frequency and relationship to BMI, pattern of
eating, and shape, weight, and eating concerns among university women. Eat Behav 2012; 13: 65‐66.
162. de Zwaan M, Hilbert A, Swan‐Kremeier L, Simonich H, Lancaster K, Howell LM, et al.
Comprehensive interview assessment of eating behavior 18‐35 months after gastric bypass surgery for morbid obesity. Surg Obes Relat Dis 2010; 6: 79‐85.
163. Karlsson J, Persson LO, Sjostrom L, Sullivan M. Psychometric properties and factor structure
of the Three‐Factor Eating Questionnaire (TFEQ) in obese men and women. Results from the Swedish Obese Subjects (SOS) study. Int J Obes Relat Metab Disord 2000; 24: 1715‐1725.
164. Chesler BE. Emotional eating: a virtually untreated risk factor for outcome following bariatric
surgery. ScientificWorldJournal 2012; 2012: 365961. 165. de Lauzon B, Romon M, Deschamps V, Lafay L, Borys JM, Karlsson J, et al. The Three‐Factor
Eating Questionnaire‐R18 is able to distinguish among different eating patterns in a general population. J Nutr 2004; 134: 2372‐2380.

63
166. Cappelleri JC, Bushmakin AG, Gerber RA, Leidy NK, Sexton CC, Lowe MR, et al. Psychometric
analysis of the Three‐Factor Eating Questionnaire‐R21: results from a large diverse sample of obese and non‐obese participants. Int J Obes (Lond) 2009; 33: 611‐620.
167. Johnson F, Pratt M, Wardle J. Dietary restraint and self‐regulation in eating behavior. Int J
Obes (Lond) 2011; 36: 665‐674. 168. Banerjee A, Ding Y, Mikami DJ, Needleman BJ. The role of dumping syndrome in weight loss
after gastric bypass surgery. Surg Endosc 2012 Dec 12. [Epub ahead of print]. 169. Blundell JE, Gillett A. Control of food intake in the obese. Obes Res 2001; 9 Suppl 4: 263S‐
270S. 170. de Lauzon‐Guillain B, Basdevant A, Romon M, Karlsson J, Borys JM, Charles MA. Is restrained
eating a risk factor for weight gain in a general population? Am J Clin Nutr 2006; 83: 132‐138. 171. Thomas JR, Gizis F, Marcus E. Food selections of Roux‐en‐Y gastric bypass patients up to 2.5
years postsurgery. J Am Diet Assoc 2010; 110: 608‐612. 172. Kruseman M, Leimgruber A, Zumbach F, Golay A. Dietary, weight, and psychological changes
among patients with obesity, 8 years after gastric bypass. J Am Diet Assoc 2010; 110: 527‐534.
173. Bavaresco M, Paganini S, Lima TP, Salgado W, Jr., Ceneviva R, Dos Santos JE, et al. Nutritional
course of patients submitted to bariatric surgery. Obes Surg 2010; 20: 716‐721. 174. Trostler N, Mann A, Zilberbush N, Avinoach E, Charuzi II. Weight Loss and Food Intake 18
Months following Vertical Banded Gastroplasty or Gastric Bypass for Severe Obesity. Obes Surg 1995; 5: 39‐51.
175. le Roux CW, Bueter M, Theis N, Werling M, Ashrafian H, Lowenstein C, et al. Gastric bypass
reduces fat intake and preference. Am J Physiol Regul Integr Comp Physiol 2011; 301: R1057‐1066.
176. Tack J, Arts J, Caenepeel P, De Wulf D, Bisschops R. Pathophysiology, diagnosis and
management of postoperative dumping syndrome. Nat Rev Gastroenterol Hepatol 2009; 6: 583‐590.
177. Tichansky DS, Glatt AR, Madan AK, Harper J, Tokita K, Boughter JD. Decrease in sweet taste in
rats after gastric bypass surgery. Surg Endosc 2011; 25: 1176‐1181. 178. Zheng H, Shin AC, Lenard NR, Townsend RL, Patterson LM, Sigalet DL, et al. Meal patterns,
satiety, and food choice in a rat model of Roux‐en‐Y gastric bypass surgery. Am J Physiol Regul Integr Comp Physiol 2009; 297: R1273‐1282.
179. Ribeiro AG, Costa MJ, Faintuch J, Dias MC. A higher meal frequency may be associated with
diminished weight loss after bariatric surgery. Clinics (Sao Paulo) 2009; 64: 1053‐1058. 180. Leite Faria S, de Oliveira Kelly E, Pereira Faria O, Kiyomi Ito M. Snack‐eating patients
experience lesser weight loss after Roux‐en‐Y gastric bypass surgery. Obes Surg 2009; 19: 1293‐1296.
64
181. Zunker C, Karr T, Saunders R, Mitchell JE. Eating behaviors post‐bariatric surgery: a
qualitative study of grazing. Obes Surg 2012; 22: 1225‐1231. 182. http://www.eatright.org/healthProfessionals/content.aspx?id=7077. 183. Nutrition care process and model part I: the 2008 update. J Am Diet Assoc 2008; 108: 1113‐
1117. 184. Nutrition care process part II: using the International Dietetics and Nutrition Terminology to
document the nutrition care process. J Am Diet Assoc 2008; 108: 1287‐1293. 185. Academy of Nutrition and Dietetics Pocket Guide to International Dietetics & Nutrition
Terminology (IDNT) Reference Manual: Standardized Language for the Nutrition Care Process. 2013.
186. Internationell Dietetik & Nutritionsterminologi version 4, Svensk översättning av IDNT;
Introduktion, termer och definitioner. 2013. 187. Adami GF, Gandolfo P, Bauer B, Scopinaro N. Binge eating in massively obese patients
undergoing bariatric surgery. Int J Eat Disord 1995; 17: 45‐50. 188. Kalarchian MA, Wilson GT, Brolin RE, Bradley L. Effects of bariatric surgery on binge eating
and related psychopathology. Eat Weight Disord 1999; 4: 1‐5. 189. Grupski AE, Hood MM, Hall BJ, Azarbad L, Fitzpatrick SL, Corsica JA. Examining the binge
eating scale in screening for binge eating disorder in bariatric surgery candidates. Obes Surg 2013; 23: 1‐6.
190. Dahl JK, Eriksen L, Vedul‐Kjelsas E, Strommen M, Kulseng B, Marvik R, et al. Prevalence of all
relevant eating disorders in patients waiting for bariatric surgery: a comparison between patients with and without eating disorders. Eat Weight Disord 2010; 15: e247‐255.
191. Hsu LK, Mulliken B, McDonagh B, Krupa Das S, Rand W, Fairburn CG, et al. Binge eating
disorder in extreme obesity. Int J Obes Relat Metab Disord 2002; 26: 1398‐1403. 192. White MA, Masheb RM, Rothschild BS, Burke‐Martindale CH, Grilo CM. The prognostic
significance of regular binge eating in extremely obese gastric bypass patients: 12‐month postoperative outcomes. J Clin Psychiatry 2006; 67: 1928‐1935.
193. Bocchieri‐Ricciardi LE, Chen EY, Munoz D, Fischer S, Dymek‐Valentine M, Alverdy JC, et al.
Pre‐surgery binge eating status: effect on eating behavior and weight outcome after gastric bypass. Obes Surg 2006; 16: 1198‐1204.
194. de Man Lapidoth J, Ghaderi A, Norring C. Binge eating in surgical weight‐loss treatments.
Long‐term associations with weight loss, health related quality of life (HRQL), and psychopathology. Eat Weight Disord 2011; 16: e263‐269.
195. Wadden TA, Faulconbridge LF, Jones‐Corneille LR, Sarwer DB, Fabricatore AN, Thomas JG, et
al. Binge eating disorder and the outcome of bariatric surgery at one year: a prospective, observational study. Obesity (Silver Spring) 2011; 19: 1220‐1228.
65
196. Alger‐Mayer S, Rosati C, Polimeni JM, Malone M. Preoperative binge eating status and gastric bypass surgery: a long‐term outcome study. Obes Surg 2009; 19: 139‐145.
197. Kalarchian MA, Marcus MD, Wilson GT, Labouvie EW, Brolin RE, LaMarca LB. Binge eating
among gastric bypass patients at long‐term follow‐up. Obes Surg 2002; 12: 270‐275. 198. Sallet PC, Sallet JA, Dixon JB, Collis E, Pisani CE, Levy A, et al. Eating behavior as a prognostic
factor for weight loss after gastric bypass. Obes Surg 2007; 17: 445‐451. 199. Yamamoto H, Mori T, Tsuchihashi H, Akabori H, Naito H, Tani T. A possible role of GLP‐1 in
the pathophysiology of early dumping syndrome. Dig Dis Sci 2005; 50: 2263‐2267. 200. Abell TL, Minocha A. Gastrointestinal complications of bariatric surgery: diagnosis and
therapy. Am J Med Sci 2006; 331: 214‐218. 201. Johnson LP, Sloop RD, Jesseph JE. Etiologic significance of the early symptomatic phase in the
dumping syndrome. Ann Surg 1962; 156: 173‐179. 202. Yamashita Y, Toge T, Adrian TE. Gastrointestinal hormone in dumping syndrome and reflux
esophagitis after gastric surgery. J Smooth Muscle Res 1997; 33: 37‐48. 203. Sirinek KR, O'Dorisio TM, Howe B, McFee AS. Neurotensin, vasoactive intestinal peptide, and
Roux‐en‐Y gastrojejunostomy. Their role in the dumping syndrome. Arch Surg 1985; 120: 605‐609.
204. Naslund I, Wickbom G, Christoffersson E, Agren G. A prospective randomized comparison of
gastric bypass and gastroplasty. Complications and early results. Acta Chir Scand 1986; 152: 681‐689.
205. Cummings DE, Overduin J, Foster‐Schubert KE. Gastric bypass for obesity: mechanisms of
weight loss and diabetes resolution. J Clin Endocrinol Metab 2004; 89: 2608‐2615. 206. Penning C, Vecht J, Masclee AA. Efficacy of depot long‐acting release octreotide therapy in
severe dumping syndrome. Aliment Pharmacol Ther 2005; 22: 963‐969. 207. Sigstad H. A clinical diagnostic index in the diagnosis of the dumping syndrome. Changes in
plasma volume and blood sugar after a test meal. Acta Med Scand 1970; 188: 479‐486. 208. Padoin AV, Galvao Neto M, Moretto M, Barancelli F, Schroer CE, Mottin CC. Obese patients
with type 2 diabetes submitted to banded gastric bypass: greater incidence of dumping syndrome. Obes Surg 2009; 19: 1481‐1484.
209. Hammer HF. Medical complications of bariatric surgery: focus on malabsorption and
dumping syndrome. Dig Dis 2012; 30: 182‐186. 210. Hedberg J, Hedenstrom H, Karlsson FA, Eden‐Engstrom B, Sundbom M. Gastric Emptying and
Postprandial PYY Response After Biliopancreatic Diversion with Duodenal Switch. Obes Surg 2010; 21: 609‐615.
211. McLaughlin T, Peck M, Holst J, Deacon C. Reversible hyperinsulinemic hypoglycemia after
gastric bypass: a consequence of altered nutrient delivery. J Clin Endocrinol Metab 2010; 95: 1851‐1855.
66
212. Bantle JP, Ikramuddin S, Kellogg TA, Buchwald H. Hyperinsulinemic hypoglycemia developing
late after gastric bypass. Obes Surg 2007; 17: 592‐594. 213. Kellogg TA, Bantle JP, Leslie DB, Redmond JB, Slusarek B, Swan T, et al. Postgastric bypass
hyperinsulinemic hypoglycemia syndrome: characterization and response to a modified diet. Surg Obes Relat Dis 2008; 4: 492‐499.
214. Ritz P, Vaurs C, Bertrand M, Anduze Y, Guillaume E, Hanaire H. Usefulness of acarbose and
dietary modifications to limit glycemic variability following Roux‐en‐Y gastric bypass as assessed by continuous glucose monitoring. Diabetes Technol Ther 2012; 14: 736‐740.
215. Moreira RO, Moreira RB, Machado NA, Goncalves TB, Coutinho WF. Post‐prandial
hypoglycemia after bariatric surgery: pharmacological treatment with verapamil and acarbose. Obes Surg 2008; 18: 1618‐1621.
216. Vecht J, Lamers CB, Masclee AA. Long‐term results of octreotide‐therapy in severe dumping
syndrome. Clin Endocrinol (Oxf) 1999; 51: 619‐624. 217. Patti ME, McMahon G, Mun EC, Bitton A, Holst JJ, Goldsmith J, et al. Severe hypoglycaemia
post‐gastric bypass requiring partial pancreatectomy: evidence for inappropriate insulin secretion and pancreatic islet hyperplasia. Diabetologia 2005; 48: 2236‐2240.
218. Mathavan VK, Arregui M, Davis C, Singh K, Patel A, Meacham J. Management of postgastric
bypass noninsulinoma pancreatogenous hypoglycemia. Surg Endosc 2010; 24: 2547‐2555. 219. Service GJ, Thompson GB, Service FJ, Andrews JC, Collazo‐Clavell ML, Lloyd RV.
Hyperinsulinemic hypoglycemia with nesidioblastosis after gastric‐bypass surgery. N Engl J Med 2005; 353: 249‐254.
220. Ritz P, Hanaire H. Post‐bypass hypoglycaemia: a review of current findings. Diabetes Metab
2011; 37: 274‐281. 221. Castenfors H, Eliasch H, Hultman E. Effects of ingestion of hyperosmotic glucose solution on
the splanchnic circulation in normal subjects and in partially gastrectomized patients reacting with circulatory collapse. Scand J Clin Lab Invest 1961; 13: 512‐524.
222. Berkowitz D, Glassman S. Carbohydrate metabolism in the subtotal gastrectomy patient. Am
J Gastroenterol 1966; 46: 119‐129. 223. Halverson JD, Kramer J, Cave A, Permutt A, Santiago J. Altered glucose tolerance, insulin
response, and insulin sensitivity after massive weight reduction subsequent to gastric bypass. Surgery 1982; 92: 235‐240.
224. Goldfine AB, Mun EC, Devine E, Bernier R, Baz‐Hecht M, Jones DB, et al. Patients with
neuroglycopenia after gastric bypass surgery have exaggerated incretin and insulin secretory responses to a mixed meal. J Clin Endocrinol Metab 2007; 92: 4678‐4685.
225. Kim SH, Liu TC, Abbasi F, Lamendola C, Morton JM, Reaven GM, et al. Plasma glucose and
insulin regulation is abnormal following gastric bypass surgery with or without neuroglycopenia. Obes Surg 2009; 19: 1550‐1556.
67
226. Salehi M, Prigeon RL, D'Alessio DA. Gastric bypass surgery enhances glucagon‐like peptide 1‐stimulated postprandial insulin secretion in humans. Diabetes 2011; 60: 2308‐2314.
227. Rabiee A, Magruder JT, Salas‐Carrillo R, Carlson O, Egan JM, Askin FB, et al. Hyperinsulinemic
hypoglycemia after Roux‐en‐Y gastric bypass: unraveling the role of gut hormonal and pancreatic endocrine dysfunction. J Surg Res 2011; 167: 199‐205.
228. Halperin F, Patti ME, Skow M, Bajwa M, Goldfine AB. Continuous glucose monitoring for
evaluation of glycemic excursions after gastric bypass. J Obes 2011; 2011: 869536. 229. Sarwer DB, Dilks RJ, West‐Smith L. Dietary intake and eating behavior after bariatric surgery:
threats to weight loss maintenance and strategies for success. Surg Obes Relat Dis 2011; 7: 644‐651.
230. Sarwer DB, Wadden TA, Moore RH, Baker AW, Gibbons LM, Raper SE, et al. Preoperative
eating behavior, postoperative dietary adherence, and weight loss after gastric bypass surgery. Surg Obes Relat Dis 2008; 4: 640‐646.
231. Sarwer DB, Moore RH, Spitzer JC, Wadden TA, Raper SE, Williams NN. A pilot study
investigating the efficacy of postoperative dietary counseling to improve outcomes after bariatric surgery. Surg Obes Relat Dis 2012; 8: 561‐568.
232. Hatoum IJ, Stein HK, Merrifield BF, Kaplan LM. Capacity for physical activity predicts weight
loss after Roux‐en‐Y gastric bypass. Obesity (Silver Spring) 2009; 17: 92‐99. 233. Livhits M, Mercado C, Yermilov I, Parikh JA, Dutson E, Mehran A, et al. Behavioral factors
associated with successful weight loss after gastric bypass. Am Surg 2010; 76: 1139‐1142. 234. Beck NN, Johannsen M, Stoving RK, Mehlsen M, Zachariae R. Do postoperative
psychotherapeutic interventions and support groups influence weight loss following bariatric surgery? A systematic review and meta‐analysis of randomized and nonrandomized trials. Obes Surg 2012; 22: 1790‐1797.
235. Klem ML, Wing RR, McGuire MT, Seagle HM, Hill JO. A descriptive study of individuals
successful at long‐term maintenance of substantial weight loss. Am J Clin Nutr 1997; 66: 239‐246.
236. Wing RR, Phelan S. Long‐term weight loss maintenance. Am J Clin Nutr 2005; 82: 222S‐225S. 237. Wing RR, Tate DF, Gorin AA, Raynor HA, Fava JL. A self‐regulation program for maintenance
of weight loss. N Engl J Med 2006; 355: 1563‐1571. 238. Batsis JA, Clark MM, Grothe K, Lopez‐Jimenez F, Collazo‐Clavell ML, Somers VK, et al. Self‐
efficacy after bariatric surgery for obesity. A population‐based cohort study. Appetite 2009; 52: 637‐645.
239. Freire RH, Borges MC, Alvarez‐Leite JI, Toulson Davisson Correia MI. Food quality, physical
activity, and nutritional follow‐up as determinant of weight regain after Roux‐en‐Y gastric bypass. Nutrition 2012; 28: 53‐58.
68
240. Nijamkin MP, Campa A, Sosa J, Baum M, Himburg S, Johnson P. Comprehensive nutrition and lifestyle education improves weight loss and physical activity in Hispanic Americans following gastric bypass surgery: a randomized controlled trial. J Acad Nutr Diet 2012; 112: 382‐390.
241. Thivel D, Brakonieki K, Duche P, Beatrice M, Yves B, Laferrere B. Surgical weight loss: impact
on energy expenditure. Obes Surg 2013; 23: 255‐266. 242. Egberts K, Brown WA, Brennan L, O'Brien PE. Does exercise improve weight loss after
bariatric surgery? A systematic review. Obes Surg 2012; 22: 335‐341. 243. Cryer PE, Axelrod L, Grossman AB, Heller SR, Montori VM, Seaquist ER, et al. Evaluation and
management of adult hypoglycemic disorders: an Endocrine Society Clinical Practice Guideline. J Clin Endocrinol Metab 2009; 94: 709‐728.
244. Mifflin MD, St Jeor ST, Hill LA, Scott BJ, Daugherty SA, Koh YO. A new predictive equation for
resting energy expenditure in healthy individuals. Am J Clin Nutr 1990; 51: 241‐247. 245. Dobratz JR, Sibley SD, Beckman TR, Valentine BJ, Kellogg TA, Ikramuddin S, et al. Predicting
energy expenditure in extremely obese women. JPEN J Parenter Enteral Nutr 2007; 31: 217‐227.
246. Goldberg GR, Black AE, Jebb SA, Cole TJ, Murgatroyd PR, Coward WA, et al. Critical evaluation
of energy intake data using fundamental principles of energy physiology: 1. Derivation of cut‐off limits to identify under‐recording. Eur J Clin Nutr 1991; 45: 569‐581.
247. Flint A, Raben A, Blundell JE, Astrup A. Reproducibility, power and validity of visual analogue
scales in assessment of appetite sensations in single test meal studies. Int J Obes Relat Metab Disord 2000; 24: 38‐48.
248. Berteus Forslund H, Lindroos AK, Sjostrom L, Lissner L. Meal patterns and obesity in Swedish
women‐a simple instrument describing usual meal types, frequency and temporal distribution. Eur J Clin Nutr 2002; 56: 740‐747.
249. Henning B. Description of Dietary questionnaire version 7 and Food weight associated with
Dietary questionnaire E3. Sahlgrenska Academy, Gothenburg University. 2008. 250. Svedlund J, Sjodin I, Dotevall G. GSRS‐‐a clinical rating scale for gastrointestinal symptoms in
patients with irritable bowel syndrome and peptic ulcer disease. Dig Dis Sci 1988; 33: 129‐134.
251. Kulich KR, Madisch A, Pacini F, Pique JM, Regula J, Van Rensburg CJ, et al. Reliability and
validity of the Gastrointestinal Symptom Rating Scale (GSRS) and Quality of Life in Reflux and Dyspepsia (QOLRAD) questionnaire in dyspepsia: a six‐country study. Health Qual Life Outcomes 2008; 6: 12.
252. Longstreth GF, Bolus R, Naliboff B, Chang L, Kulich KR, Carlsson J, et al. Impact of irritable
bowel syndrome on patients' lives: development and psychometric documentation of a disease‐specific measure for use in clinical trials. Eur J Gastroenterol Hepatol 2005; 17: 411‐420.
253. Kreymann B, Ghatei MA, Burnet P, Williams G, Kanse S, Diani AR, et al. Characterization of
glucagon‐like peptide‐1‐(7‐36)amide in the hypothalamus. Brain Res 1989; 502: 325‐331.

69
254. Nunnally JC BI (ed) Psychometric Theory, 3rd edn.: New York, 1994. 255. Bland JM, Altman DG. Statistical methods for assessing agreement between two methods of
clinical measurement. Lancet 1986; 1: 307‐310. 256. Guyatt GH, Berman LB, Townsend M, Pugsley SO, Chambers LW. A measure of quality of life
for clinical trials in chronic lung disease. Thorax 1987; 42: 773‐778. 257. Warde‐Kamar J, Rogers M, Flancbaum L, Laferrere B. Calorie intake and meal patterns up to 4
years after Roux‐en‐Y gastric bypass surgery. Obes Surg 2004; 14: 1070‐1079. 258. Dias MC, Ribeiro AG, Scabim VM, Faintuch J, Zilberstein B, Gama‐Rodrigues JJ. Dietary intake
of female bariatric patients after anti‐obesity gastroplasty. Clinics (Sao Paulo) 2006; 61: 93‐98.
259. Lindroos AK, Lissner L, Sjostrom L. Weight change in relation to intake of sugar and sweet
foods before and after weight reducing gastric surgery. Int J Obes Relat Metab Disord 1996; 20: 634‐643.
260. Willett W, Stampfer MJ. Total energy intake: implications for epidemiologic analyses. Am J
Epidemiol 1986; 124: 17‐27. 261. Cox DN, Mela DJ. Determination of energy density of freely selected diets: methodological
issues and implications. Int J Obes Relat Metab Disord 2000; 24: 49‐54. 262. Wallengren O, Lundholm K, Bosaeus I. Diet energy density and energy intake in palliative care
cancer patients. Clin Nutr 2005; 24: 266‐273. 263. Johnson L, Wilks DC, Lindroos AK, Jebb SA. Reflections from a systematic review of dietary
energy density and weight gain: is the inclusion of drinks valid? Obes Rev 2009; 10: 681‐692. 264. Ledikwe JH, Blanck HM, Khan LK, Serdula MK, Seymour JD, Tohill BC, et al. Dietary energy
density determined by eight calculation methods in a nationally representative United States population. J Nutr 2005; 135: 273‐278.
265. Barkeling B, Rossner S, Sjoberg A. Methodological studies on single meal food intake
characteristics in normal weight and obese men and women. Int J Obes Relat Metab Disord 1995; 19: 284‐290.
266. Hubel R, Laessle RG, Lehrke S, Jass J. Laboratory measurement of cumulative food intake in
humans: results on reliability. Appetite 2006; 46: 57‐62. 267. Lindroos AK, Lissner L, Mathiassen ME, Karlsson J, Sullivan M, Bengtsson C, et al. Dietary
intake in relation to restrained eating, disinhibition, and hunger in obese and nonobese Swedish women. Obes Res 1997; 5: 175‐182.
268. Burgmer R, Grigutsch K, Zipfel S, Wolf AM, de Zwaan M, Husemann B, et al. The influence of
eating behavior and eating pathology on weight loss after gastric restriction operations. Obes Surg 2005; 15: 684‐691.
70
269. Bond DS, Phelan S, Leahey TM, Hill JO, Wing RR. Weight‐loss maintenance in successful weight losers: surgical vs non‐surgical methods. Int J Obes (Lond) 2009; 33: 173‐180.
270. Bobbioni‐Harsch E, Huber O, Morel P, Chassot G, Lehmann T, Volery M, et al. Factors
influencing energy intake and body weight loss after gastric bypass. Eur J Clin Nutr 2002; 56: 551‐556.
271. Johnson LK, Andersen LF, Hofso D, Aasheim ET, Holven KB, Sandbu R, et al. Dietary changes
in obese patients undergoing gastric bypass or lifestyle intervention: a clinical trial. Br J Nutr Br J Nutr. 2012 Oct 30:1‐8. [Epub ahead of print]: 1‐8.
272. Coughlin K, Bell RM, Bivins BA, Wrobel S, Griffen WO, Jr. Preoperative and postoperative
assessment of nutrient intakes in patients who have undergone gastric bypass surgery. Arch Surg 1983; 118: 813‐816.
273. Tremaroli V, Backhed F. Functional interactions between the gut microbiota and host
metabolism. Nature 2012; 489: 242‐249. 274. Zhang H, DiBaise JK, Zuccolo A, Kudrna D, Braidotti M, Yu Y, et al. Human gut microbiota in
obesity and after gastric bypass. Proc Natl Acad Sci U S A 2009; 106: 2365‐2370. 275. Furet JP, Kong LC, Tap J, Poitou C, Basdevant A, Bouillot JL, et al. Differential adaptation of
human gut microbiota to bariatric surgery‐induced weight loss: links with metabolic and low‐grade inflammation markers. Diabetes 2010; 59: 3049‐3057.
276. Hildebrandt MA, Hoffmann C, Sherrill‐Mix SA, Keilbaugh SA, Hamady M, Chen YY, et al. High‐
fat diet determines the composition of the murine gut microbiome independently of obesity. Gastroenterology 2009; 137: 1716‐1724 e1711‐1712.
277. De Filippo C, Cavalieri D, Di Paola M, Ramazzotti M, Poullet JB, Massart S, et al. Impact of diet
in shaping gut microbiota revealed by a comparative study in children from Europe and rural Africa. Proc Natl Acad Sci U S A 2010; 107: 14691‐14696.
278. Trostler N, Mann A, Zilberbush N, Charuzi II, Avinoach E. Nutrient Intake following Vertical
Banded Gastroplasty or Gastric Bypass. Obes Surg 1995; 5: 403‐410. 279. Kissileff HR, Zimmerli EJ, Torres MI, Devlin MJ, Walsh BT. Effect of eating rate on binge size in
Bulimia Nervosa. Physiol Behav 2008; 93: 481‐485. 280. Kokkinos A, le Roux CW, Alexiadou K, Tentolouris N, Vincent RP, Kyriaki D, et al. Eating slowly
increases the postprandial response of the anorexigenic gut hormones, peptide YY and glucagon‐like peptide‐1. J Clin Endocrinol Metab 2010; 95: 333‐337.
281. Blundell JE, Lawton CL, Hill AJ. Mechanisms of appetite control and their abnormalities in
obese patients. Horm Res 1993; 39 Suppl 3: 72‐76. 282. Bryant EJ, King NA, Falken Y, Hellstrom PM, Juul Holst J, Blundell JE, et al. Relationships
among tonic and episodic aspects of motivation to eat, gut peptides, and weight before and after bariatric surgery. Surg Obes Relat Dis 2012 Oct 12. [Epub ahead of print].
283. Silver HJ, Torquati A, Jensen GL, Richards WO. Weight, dietary and physical activity behaviors
two years after gastric bypass. Obes Surg 2006; 16: 859‐864.
71
284. Saunders R. "Grazing": a high‐risk behavior. Obes Surg 2004; 14: 98‐102. 285. Colles SL, Dixon JB, O'Brien PE. Grazing and loss of control related to eating: two high‐risk
factors following bariatric surgery. Obesity (Silver Spring) 2008; 16: 615‐622. 286. Hejazi RA, Patil H, McCallum RW. Dumping syndrome: establishing criteria for diagnosis and
identifying new etiologies. Dig Dis Sci 2010; 55: 117‐123. 287. Engstrom M, Forsberg A. Wishing for deburdening through a sustainable control after
bariatric surgery. Int J Qual Stud Health Well‐being 2011; 6. 288. Lin HC, Van Citters GW, Zhao XT, Waxman A. Fat intolerance depends on rapid gastric
emptying. Dig Dis Sci 1999; 44: 330‐335. 289. Crapo PA, Scarlett JA, Kolterman OG, Sanders LR, Hofeldt FD, Olefsky JM. The effects of oral
fructose, sucrose, and glucose in subjects with reactive hypoglycemia. Diabetes Care 1982; 5: 512‐517.
290. Berlin I, Grimaldi A, Thervet F, Puech AJ. Hypoglycaemia unawareness. Lancet 1987; 2: 966. 291. Halperin F, Patti ME, Goldfine AB. Glucagon treatment for post‐gastric bypass hypoglycemia.
Obesity (Silver Spring) 2010; 18: 1858‐1860. 292. Barnes MB, Lawson MA, Beverly JL. Rate of fall in blood glucose and recurrent hypoglycemia
affect glucose dynamics and noradrenergic activation in the ventromedial hypothalamus. Am J Physiol Regul Integr Comp Physiol 2011; 301: R1815‐1820.
293. Singhal R, Kitchen M, Bridgwater S, Super P. Dietetic‐led management of patients undergoing
laparoscopic gastric banding: early results. Surg Endosc 2010; 24: 1268‐1273. 294. Seagle HM, Strain GW, Makris A, Reeves RS. Position of the American Dietetic Association:
weight management. J Am Diet Assoc 2009; 109: 330‐346. 295. Ledikwe JH, Blanck HM, Kettel Khan L, Serdula MK, Seymour JD, Tohill BC, et al. Dietary
energy density is associated with energy intake and weight status in US adults. Am J Clin Nutr 2006; 83: 1362‐1368.
296. Rolls BJ, Roe LS, Meengs JS. Salad and satiety: energy density and portion size of a first‐
course salad affect energy intake at lunch. J Am Diet Assoc 2004; 104: 1570‐1576. 297. Mathes CM, Spector AC. Food selection and taste changes in humans after Roux‐en‐Y gastric
bypass surgery: A direct‐measures approach. Physiol Behav 2012. 298. Casazza K, Fontaine KR, Astrup A, Birch LL, Brown AW, Bohan Brown MM, et al. Myths,
presumptions, and facts about obesity. N Engl J Med 2013; 368: 446‐454. 299. Andrade AM, Kresge DL, Teixeira PJ, Baptista F, Melanson KJ. Does eating slowly influence
appetite and energy intake when water intake is controlled? Int J Behav Nutr Phys Act 2012; 9: 135.
72
300. Josbeno DA, Kalarchian M, Sparto PJ, Otto AD, Jakicic JM. Physical activity and physical function in individuals post‐bariatric surgery. Obes Surg 2011; 21: 1243‐1249.
301. le Roux CW, Aylwin SJ, Batterham RL, Borg CM, Coyle F, Prasad V, et al. Gut hormone profiles
following bariatric surgery favor an anorectic state, facilitate weight loss, and improve metabolic parameters. Ann Surg 2006; 243: 108‐114.
302. Spiegel TA, Shrager EE, Stellar E. Responses of lean and obese subjects to preloads,
deprivation, and palatability. Appetite 1989; 13: 45‐69.