Embed Size (px)
Citation preview
Krogscheepers & Watters 1
TRB 2014 Annual Meeting
Word count: 4080 text + 14 figures = 7580 equivalent words including Title and Abstract. 1
2
3
Roundabouts along Rural Arterials in South Africa 4
5
Prepared for: 6 93rd Annual Meeting of Transportation Research Board, 7
Washington D.C., January 12-16, 2014 8 9
Prepared by: 10
11 JC Krogscheepers Pr.Eng, Ph.D. 12
ITS Engineers (Pty) Ltd, 13 Imperial Bank Terraces, 14
Tyger Waterfront, 15 Bellville, Cape Town, 7500 16
Tel: +27 21 914 6211; 17 Email: [email protected] 18
19 M Watters Pr.Eng 20
Western Cape Government, 21 9 Dorp Street, 22
Cape Town, 8000, 23 Tel +27 21 483 2204 24
Email: [email protected] 25 26
27 28 29 30
Corresponding Author: JC Krogscheepers 31 32 33 34
35 Paper No: 14-1425 36
37 38 39 40 41 42
Submission Date: 15 November 2013 43 44
TRB 2014 Annual Meeting Paper revised from original submittal.
Krogscheepers & Watters 2
TRB 2014 Annual Meeting
ABSTRACT 1 The use of roundabouts in both an urban and rural context have been gaining ground over the past twenty 2 years not only in South Africa, but also in many other parts of the world. Apart from the geometric 3 design details and the operational characteristics of roundabouts there is also no clear guidance in terms 4 of the spacing of roundabouts, specifically when it comes to using them along a high order road. Often 5 the spacing requirements for signals along arterials are being used as a guideline to determine the spacing 6 of roundabouts. 7 8 This paper explores the practical use of roundabouts along arterials and specifically along high speed 9 rural arterials with relatively high commuter traffic volumes. This is done for a rural arterial in the 10 Western Cape, South Africa. The focus of the evaluation is specifically done in the context of operational 11 efficiencies, access management and future capacity requirements of the arterial. 12 13 The operational efficiencies of the roundabouts along the corridor, currently and under future higher 14 demand scenarios, was evaluated using micro-simulation analysis where roundabout control is 15 compared with traffic signal control. The comparison of the simulation results clearly highlights the 16 operational advantages of using roundabouts, but is also illustrates possible future capacity constraints 17 for the roundabout scenarios. Based on the simulation results it is evident that roundabouts could play a 18 role in the rural arterial context, not only operationally but also in terms of safety and future capacity 19 expansions. 20
21
INTRODUCTION 22 Over the past decade, roundabouts have been considered increasingly as an important type of 23 intersection control at major intersections. Mostly because of the low average delay to vehicles when 24 considered for the full day and also because of the many safety advantages. As part of the development 25 of an Arterial Management Plan for the R304 that connects the town of Stellenbosch in the Western 26 Cape with the N1 and Malmesbury further to the north, the question was raised how to deal with the 27 major intersections along the route (1). Although the route runs mostly through a rural area, the demand 28 for direct access off the R304 is steadily increasing due to the number of wine farms along the route and 29 the owners that are looking to increase the tourist potential of the properties. Not only is there a demand 30 for direct access to individual properties, but there are a number of current and planned future roads that 31 are and will be intersecting with the R204. Most of the intersections, except one that is currently 32 signalised, are stop controlled on the minor approaches or even stop controlled on all approaches. The 33 R304 is a strategic north-south link between the N7 through Malmesbury via the N1 and Stellenbosch 34 to the N2 in Somerset West. The locality of the route is shown in the following figure. 35
Primary Objectives 36 The objective of this study was firstly to evaluate the operational impacts of roundabouts as the primary 37 intersection control along a rural arterial and to compare that with other types of intersection control, 38 specifically traffic signals. Secondly, the objective was to evaluate the spacing requirements of 39 roundabouts when compared to that of traffic signalised intersections, specifically in the light of existing 40 guidelines which are mostly silent on the spacing requirements of roundabouts (2). The safety and other 41 benefits of roundabouts are widely publicised and are not considered specifically in this study (3,4). 42
Study Roadway 43 The study roadway includes the R304 or Provincial Main Road 174 (MR 174) between the N1 Freeway 44 and the town of Stellenbosch. The study only covered the southern section of the R304 between KM 45 47.0 and KM 60.0, i.e. approximately 13.0 kilometres. There are six major intersections along the study 46 roadway as well as many direct property accesses. For the purposes of this study only the six major 47 intersections were included. The actual distances between the intersections are illustrated in Figure 1 48 and vary from 560 metres to nearly 5 kilometres. 49
TRB 2014 Annual Meeting Paper revised from original submittal.
Krogscheepers & Watters 3
TRB 2014 Annual Meeting
1 Figure 1: Locality Map 2
3
STUDY APPROACH 4 The study investigated the operational efficiencies of traffic signals and roundabouts at the major 5 intersections along this rural arterial. The Paramics micro-simulation model was used to simulate 6 operations during a typical weekday (5). A typical daily demand profile was used as input to the model 7 and a 24-hour period was modelled. The model was validated to ensure that the modelled volumes, 8 queue lengths and average speeds were similar to the existing. The following traffic volume scenarios 9 were evaluated: 10
Short Term Scenario: Existing traffic plus 20% growth (4 -5 year horizon) 11 Medium Term Scenario: Existing traffic plus 40% growth (8- 12 year scenario) 12 Long Term Scenario: Existing traffic plus 60% growth (15 – 20 year scenario) 13
14 The traffic control and actual lane configuration at the intersections were adjusted with the increase in 15 volumes to ensure realistic capacities for the intersections. For the roundabout options, this was only 16 done up to a double lane roundabout with left-turn slip lanes where necessary. 17
18
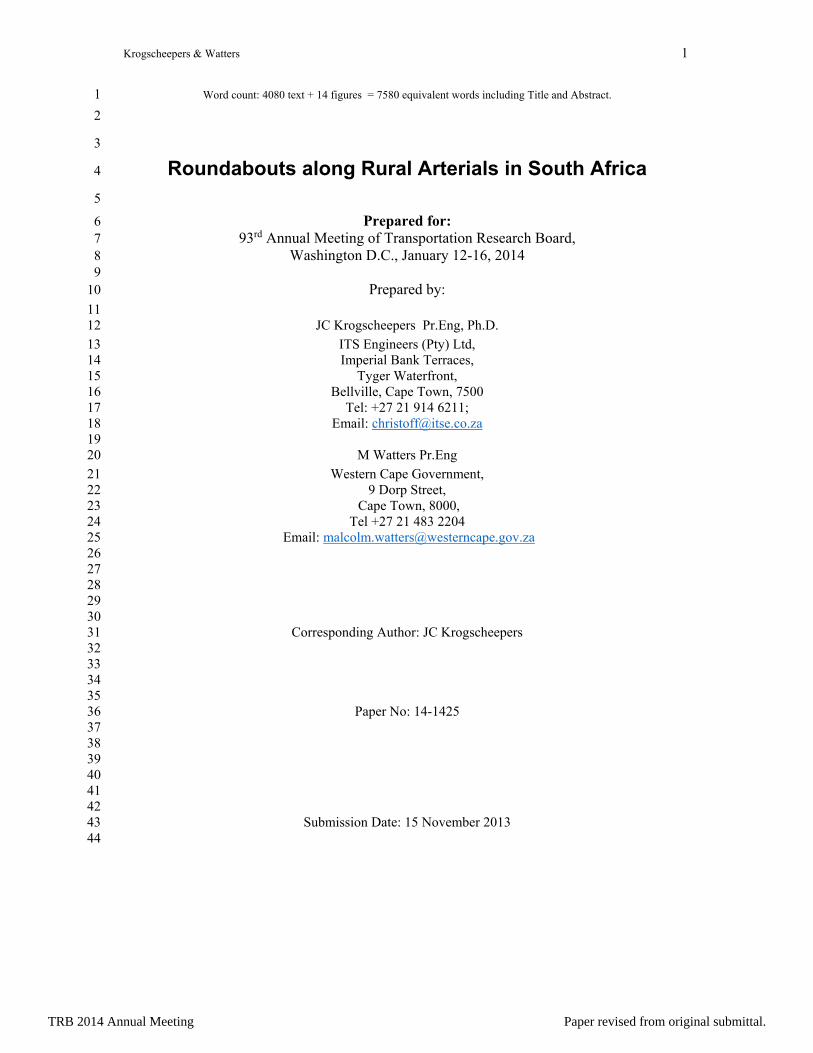
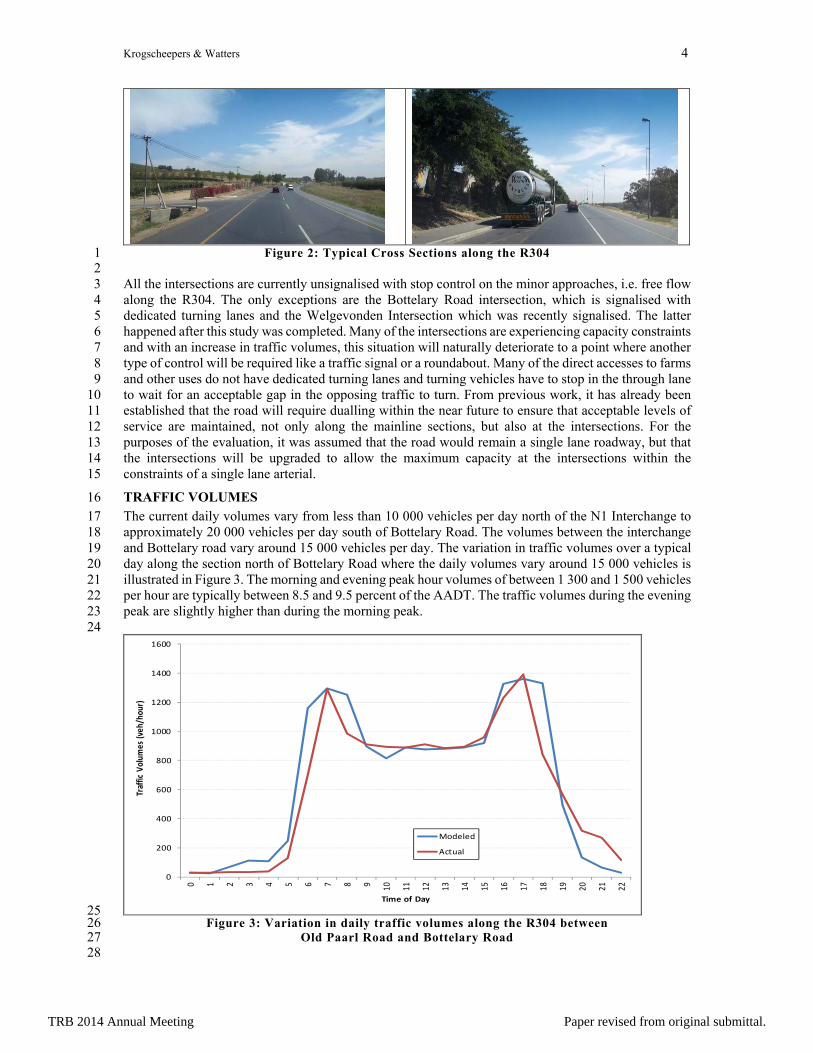
ROAD NETWORK AND INTERSECTION CONTROL 19 The R304 is currently a two-lane two-way roadway for most of its length with turning lanes at some of 20 the intersections. There are many passing opportunities since the topography is mainly flat and many 21 slower motorists allow faster vehicles to pass by moving to the shoulder. The roadway cross-section 22 consist of what is defined as a Class 1 type by the Western Cape Government and which typically consist 23 of two 3.7-metre travel lanes with 2.0 metre shoulders on both directions (Refer to Figure 2). 24
TRB 2014 Annual Meeting Paper revised from original submittal.
Krogscheepers & Watters 4
TRB 2014 Annual Meeting
Figure 2: Typical Cross Sections along the R304 1 2 All the intersections are currently unsignalised with stop control on the minor approaches, i.e. free flow 3 along the R304. The only exceptions are the Bottelary Road intersection, which is signalised with 4 dedicated turning lanes and the Welgevonden Intersection which was recently signalised. The latter 5 happened after this study was completed. Many of the intersections are experiencing capacity constraints 6 and with an increase in traffic volumes, this situation will naturally deteriorate to a point where another 7 type of control will be required like a traffic signal or a roundabout. Many of the direct accesses to farms 8 and other uses do not have dedicated turning lanes and turning vehicles have to stop in the through lane 9 to wait for an acceptable gap in the opposing traffic to turn. From previous work, it has already been 10 established that the road will require dualling within the near future to ensure that acceptable levels of 11 service are maintained, not only along the mainline sections, but also at the intersections. For the 12 purposes of the evaluation, it was assumed that the road would remain a single lane roadway, but that 13 the intersections will be upgraded to allow the maximum capacity at the intersections within the 14 constraints of a single lane arterial. 15
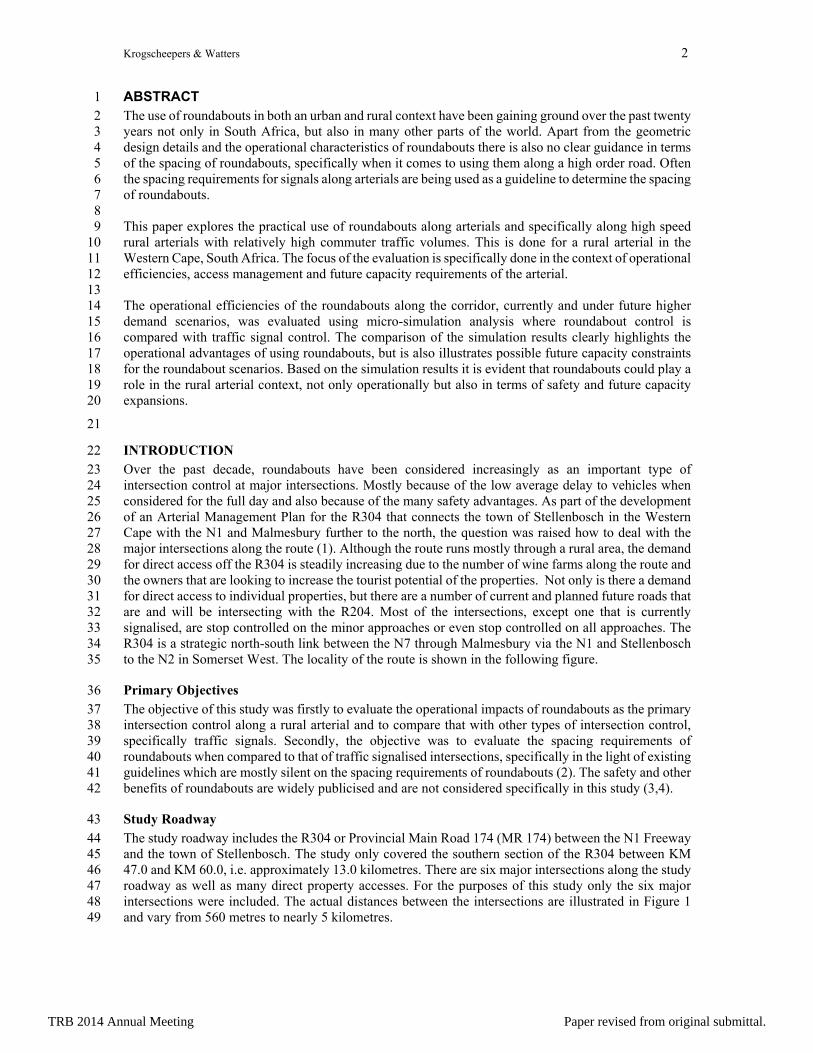
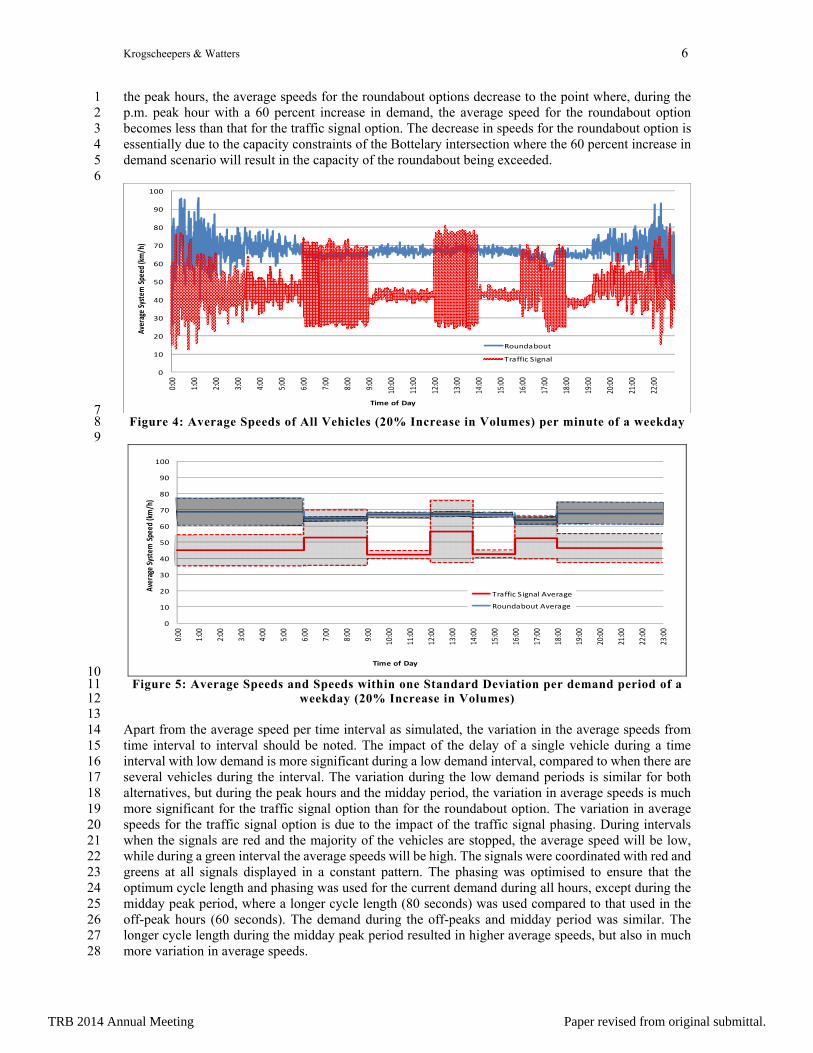
TRAFFIC VOLUMES 16 The current daily volumes vary from less than 10 000 vehicles per day north of the N1 Interchange to 17 approximately 20 000 vehicles per day south of Bottelary Road. The volumes between the interchange 18 and Bottelary road vary around 15 000 vehicles per day. The variation in traffic volumes over a typical 19 day along the section north of Bottelary Road where the daily volumes vary around 15 000 vehicles is 20 illustrated in Figure 3. The morning and evening peak hour volumes of between 1 300 and 1 500 vehicles 21 per hour are typically between 8.5 and 9.5 percent of the AADT. The traffic volumes during the evening 22 peak are slightly higher than during the morning peak. 23 24
25 Figure 3: Variation in daily traffic volumes along the R304 between 26
Old Paarl Road and Bottelary Road 27 28
0
200
400
600
800
1000
1200
1400
1600
0 1 2 3 4 5 6 7 8 9 10 11 12 13 14 15 16 17 18 19 20 21 22
Traffic Volum
es (veh/ho
ur)
Time of Day
Modeled
Actual
TRB 2014 Annual Meeting Paper revised from original submittal.

Krogscheepers & Watters 5
TRB 2014 Annual Meeting
The variation in traffic volumes as modelled over a typical day was increased with the following 1 percentages to replicate future demand scenarios: 2
20% Increase = 3 – 4 percent growth per annum over 4 to 5 year period [Short Term] 3 40% Increase = 3 – 4 percent growth per annum over 9 to 12 year period [Medium Term] 4 60% Increase = 3 – 4 percent growth per annum over 12 to 16 year period [Long Term] 5
o 6
MODELLING 7 The network that was included in the modelling was a collapsed version of the actual network as 8 illustrated in Figure 1. The long distances between the Old Paarl and Bottelary Road intersections as 9 well as between the Bottelary Road and Welgevonden Road intersections were reduced from 4.84 km 10 to 1.76 km and from 3.99 km to 500 metres respectively. This was done to reduce the modelling time 11 and to create a more compact network. The more compact network should be an advantage to the traffic 12 signal control scenario since it supports synchronisation of signal timings. However, once intersections 13 are spaced more than 1.0 km apart, the efficiency of synchronisation disappears since platoons disperse 14 to the extent that arrivals can be considered random. The signal timings of the individual intersections 15 were optimised for the different demand scenarios and also synchronised as far as possible. 16 17 For the purposes of this exercise, the model was built using the recommended default values available 18 for the variables in Paramics. It was then visually checked to ensure that the queues that develop at the 19 control intersections correspond with what is observed in the field. The modelled speeds and volumes 20 were also checked against the actual counted volumes and the observed free flow speeds. There are no 21 locally available calibration parameters for simulating driver behaviour in Paramics, specifically such 22 as gap acceptance at roundabouts. The simulation model results, specifically the queue lengths were 23 compared against estimates provided by the analytical HCM and Sidra methodologies. 24 25 The Paramics model is based on the assigning of vehicular trips between origin and destination zones. 26 The OD-matrices for both alternatives were exactly the same in terms of the volume as well as the 27 variation over the hour and the day. The model was setup to run a short warm-up time before the actual 28 demand files were introduced. However, since the whole day was modelled from early morning when 29 the network is essentially empty to late evening, the impact of the warm-up period on the modelling 30 results was negligible. Each of the scenarios was simulated with at least five different seed numbers and 31 an average of the five runs was used for comparison of the results. 32 33
RESULTS 34 For the purposes of this study the following network performance measures were used: 35
Average speeds of all vehicles in the system 36 Standard deviation of the speeds of all the vehicles in the system 37 Average delay per vehicle in the system 38 Average travel times between defined origins and destinations 39 The time-space movement of selected individual vehicles. 40
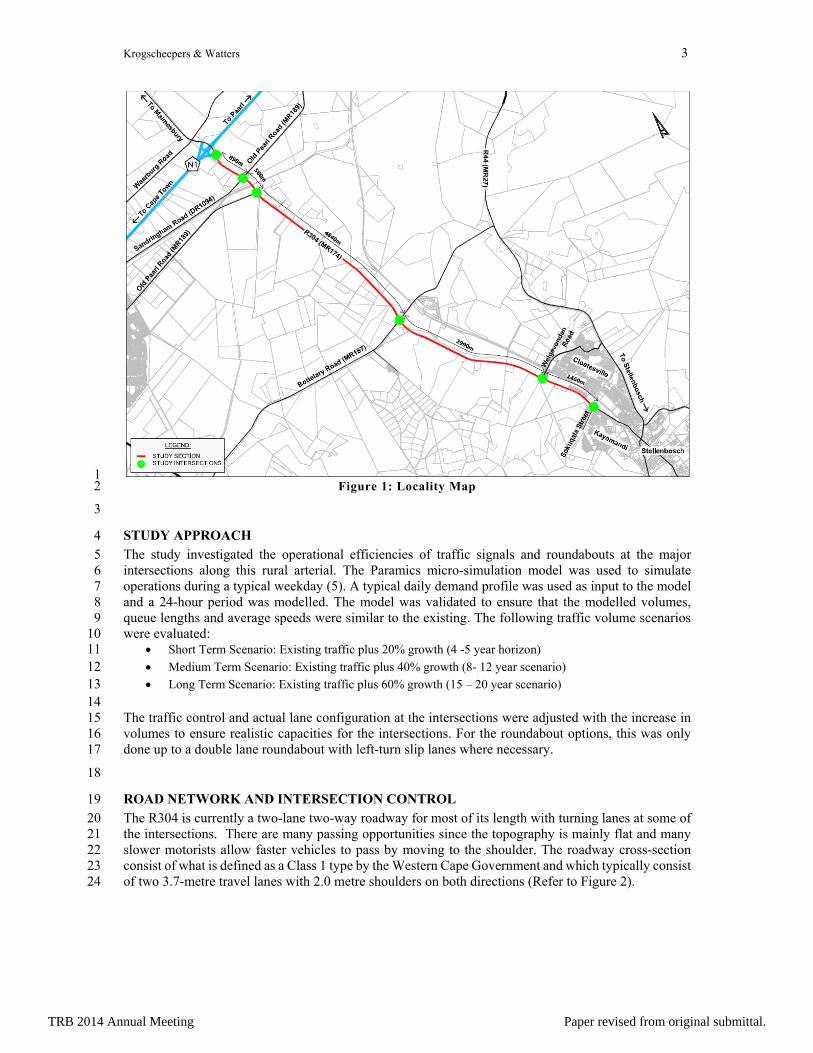
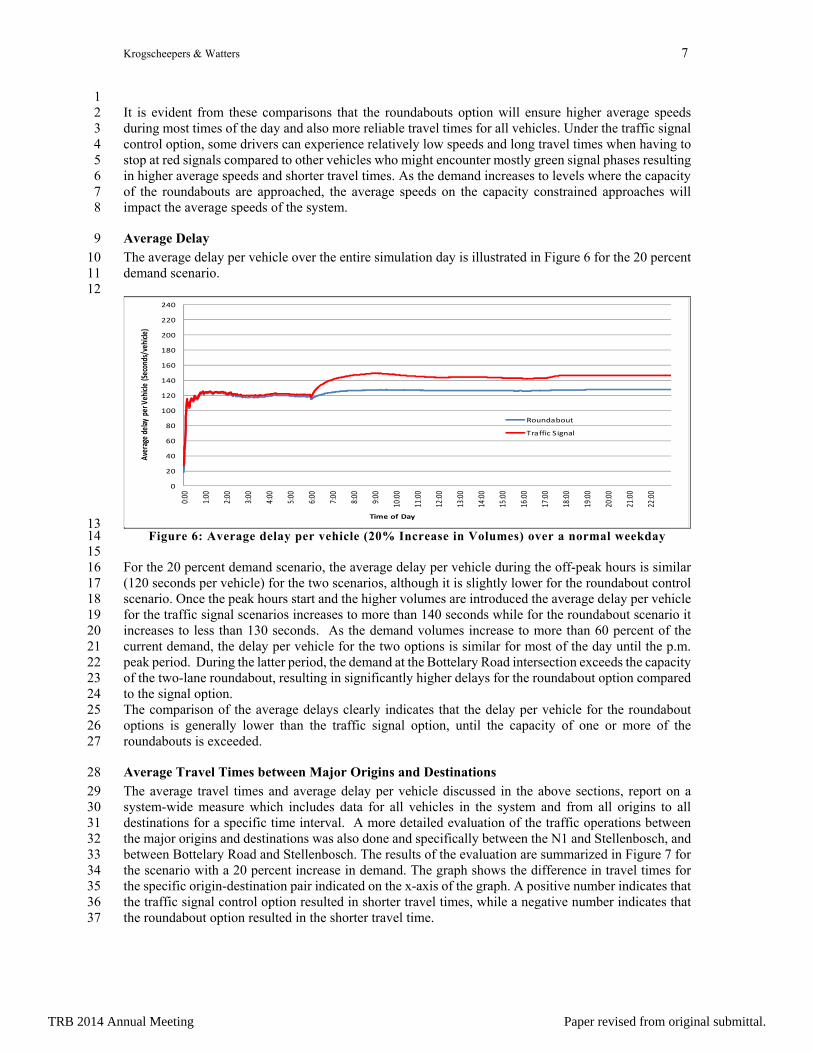
Average Speeds 41 The average speeds for all vehicles in the network and for the two alternatives are illustrated in Figure 42 4 and Figure 5. In Figure 4, the average speed is shown for each minute interval over a normal weekday, 43 while in Figure 5 these speeds were averaged for the specific demand period and in addition to the 44 average speeds, the standard deviation during a demand period is also illustrated. These results are only 45 for the first demand scenario with 20 percent growth. It is evident from both figures that in general, the 46 average system speeds for the roundabout option are higher than those of the signal control alternative. 47 The difference in average speeds is significantly more during the off- and evening periods where it is 48 generally 50 percent higher for the roundabout option. During the peak hours the average speeds for the 49 roundabout option are nearly 30 percent higher. As the demand increases the difference in average 50 speeds during the off-peak hours remain more or less similar to the 20 percent scenario. However, during 51
TRB 2014 Annual Meeting Paper revised from original submittal.
Krogscheepers & Watters 6
TRB 2014 Annual Meeting
the peak hours, the average speeds for the roundabout options decrease to the point where, during the 1 p.m. peak hour with a 60 percent increase in demand, the average speed for the roundabout option 2 becomes less than that for the traffic signal option. The decrease in speeds for the roundabout option is 3 essentially due to the capacity constraints of the Bottelary intersection where the 60 percent increase in 4 demand scenario will result in the capacity of the roundabout being exceeded. 5 6
7 Figure 4: Average Speeds of All Vehicles (20% Increase in Volumes) per minute of a weekday 8
9
10 Figure 5: Average Speeds and Speeds within one Standard Deviation per demand period of a 11
weekday (20% Increase in Volumes) 12 13 Apart from the average speed per time interval as simulated, the variation in the average speeds from 14 time interval to interval should be noted. The impact of the delay of a single vehicle during a time 15 interval with low demand is more significant during a low demand interval, compared to when there are 16 several vehicles during the interval. The variation during the low demand periods is similar for both 17 alternatives, but during the peak hours and the midday period, the variation in average speeds is much 18 more significant for the traffic signal option than for the roundabout option. The variation in average 19 speeds for the traffic signal option is due to the impact of the traffic signal phasing. During intervals 20 when the signals are red and the majority of the vehicles are stopped, the average speed will be low, 21 while during a green interval the average speeds will be high. The signals were coordinated with red and 22 greens at all signals displayed in a constant pattern. The phasing was optimised to ensure that the 23 optimum cycle length and phasing was used for the current demand during all hours, except during the 24 midday peak period, where a longer cycle length (80 seconds) was used compared to that used in the 25 off-peak hours (60 seconds). The demand during the off-peaks and midday period was similar. The 26 longer cycle length during the midday peak period resulted in higher average speeds, but also in much 27 more variation in average speeds. 28
0
10
20
30
40
50
60
70
80
90
100
0:00
1:00
2:00
3:00
4:00
5:00
6:00
7:00
8:00
9:00
10:00
11:00
12:00
13:00
14:00
15:00
16:00
17:00
18:00
19:00
20:00
21:00
22:00
Average System
Spe
ed (km/h)
Time of Day
Roundabout
Traffic Signal
0
10
20
30
40
50
60
70
80
90
100
0:00
1:00
2:00
3:00
4:00
5:00
6:00
7:00
8:00
9:00
10:00
11:00
12:00
13:00
14:00
15:00
16:00
17:00
18:00
19:00
20:00
21:00
22:00
23:00
Average System
Spe
ed (km/h)
Time of Day
Traffic Signal Average
Roundabout Average
TRB 2014 Annual Meeting Paper revised from original submittal.
Krogscheepers & Watters 7
TRB 2014 Annual Meeting
1 It is evident from these comparisons that the roundabouts option will ensure higher average speeds 2 during most times of the day and also more reliable travel times for all vehicles. Under the traffic signal 3 control option, some drivers can experience relatively low speeds and long travel times when having to 4 stop at red signals compared to other vehicles who might encounter mostly green signal phases resulting 5 in higher average speeds and shorter travel times. As the demand increases to levels where the capacity 6 of the roundabouts are approached, the average speeds on the capacity constrained approaches will 7 impact the average speeds of the system. 8
Average Delay 9 The average delay per vehicle over the entire simulation day is illustrated in Figure 6 for the 20 percent 10 demand scenario. 11 12
13 Figure 6: Average delay per vehicle (20% Increase in Volumes) over a normal weekday 14
15 For the 20 percent demand scenario, the average delay per vehicle during the off-peak hours is similar 16 (120 seconds per vehicle) for the two scenarios, although it is slightly lower for the roundabout control 17 scenario. Once the peak hours start and the higher volumes are introduced the average delay per vehicle 18 for the traffic signal scenarios increases to more than 140 seconds while for the roundabout scenario it 19 increases to less than 130 seconds. As the demand volumes increase to more than 60 percent of the 20 current demand, the delay per vehicle for the two options is similar for most of the day until the p.m. 21 peak period. During the latter period, the demand at the Bottelary Road intersection exceeds the capacity 22 of the two-lane roundabout, resulting in significantly higher delays for the roundabout option compared 23 to the signal option. 24 The comparison of the average delays clearly indicates that the delay per vehicle for the roundabout 25 options is generally lower than the traffic signal option, until the capacity of one or more of the 26 roundabouts is exceeded. 27
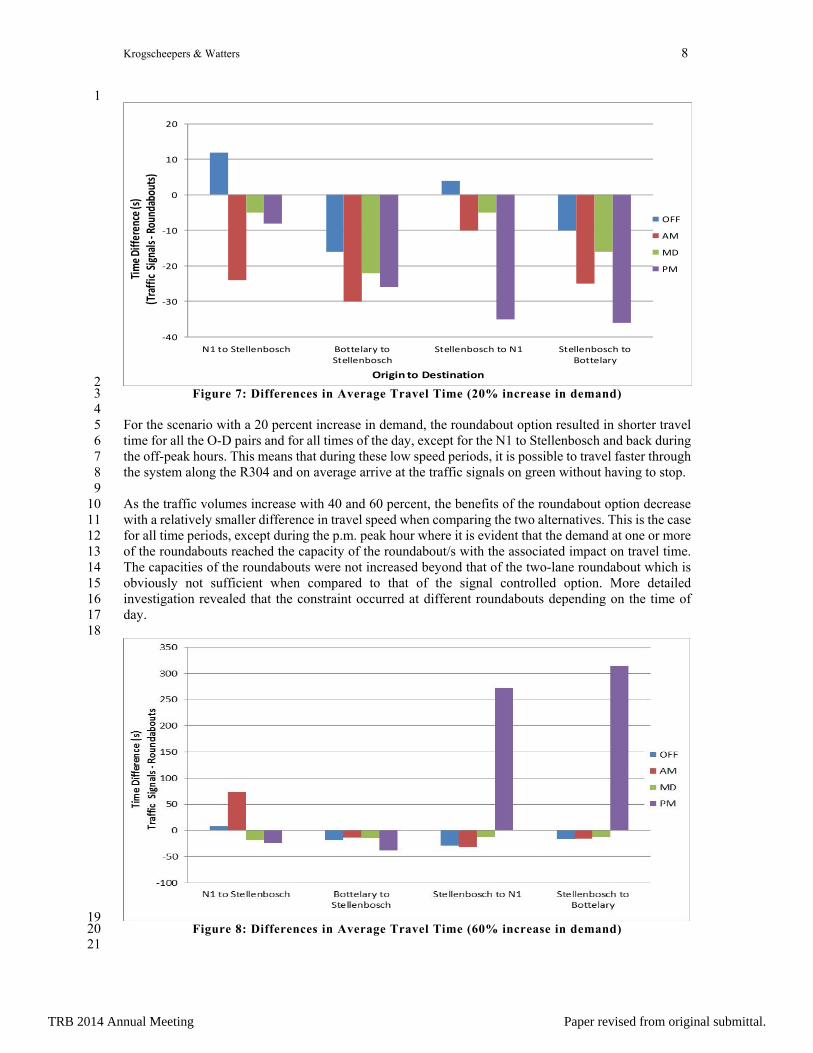
Average Travel Times between Major Origins and Destinations 28 The average travel times and average delay per vehicle discussed in the above sections, report on a 29 system-wide measure which includes data for all vehicles in the system and from all origins to all 30 destinations for a specific time interval. A more detailed evaluation of the traffic operations between 31 the major origins and destinations was also done and specifically between the N1 and Stellenbosch, and 32 between Bottelary Road and Stellenbosch. The results of the evaluation are summarized in Figure 7 for 33 the scenario with a 20 percent increase in demand. The graph shows the difference in travel times for 34 the specific origin-destination pair indicated on the x-axis of the graph. A positive number indicates that 35 the traffic signal control option resulted in shorter travel times, while a negative number indicates that 36 the roundabout option resulted in the shorter travel time. 37
0
20
40
60
80
100
120
140
160
180
200
220
240
0:00
1:00
2:00
3:00
4:00
5:00
6:00
7:00
8:00
9:00
10:00
11:00
12:00
13:00
14:00
15:00
16:00
17:00
18:00
19:00
20:00
21:00
22:00
Average de
lay pe
r Veh
icle (Secon
ds/veh
icle)
Time of Day
Roundabout
Traffic Signal
TRB 2014 Annual Meeting Paper revised from original submittal.
Krogscheepers & Watters 8
TRB 2014 Annual Meeting
1
2 Figure 7: Differences in Average Travel Time (20% increase in demand) 3
4 For the scenario with a 20 percent increase in demand, the roundabout option resulted in shorter travel 5 time for all the O-D pairs and for all times of the day, except for the N1 to Stellenbosch and back during 6 the off-peak hours. This means that during these low speed periods, it is possible to travel faster through 7 the system along the R304 and on average arrive at the traffic signals on green without having to stop. 8 9 As the traffic volumes increase with 40 and 60 percent, the benefits of the roundabout option decrease 10 with a relatively smaller difference in travel speed when comparing the two alternatives. This is the case 11 for all time periods, except during the p.m. peak hour where it is evident that the demand at one or more 12 of the roundabouts reached the capacity of the roundabout/s with the associated impact on travel time. 13 The capacities of the roundabouts were not increased beyond that of the two-lane roundabout which is 14 obviously not sufficient when compared to that of the signal controlled option. More detailed 15 investigation revealed that the constraint occurred at different roundabouts depending on the time of 16 day. 17 18
19 Figure 8: Differences in Average Travel Time (60% increase in demand) 20
21
‐40
‐30
‐20
‐10
0
10
20
N1 to Stellenbosch Bottelary toStellenbosch
Stellenbosch to N1 Stellenbosch toBottelary
Time Differen
ce (s)
(Traffic Signals ‐Ro
undabo
uts)
Origin to Destination
OFF
AM
MD
PM
TRB 2014 Annual Meeting Paper revised from original submittal.
Krogscheepers & Watters 9
TRB 2014 Annual Meeting
From the above figure it is evident that the roundabout scenario is optimal even with a 60 percent 1 increase in demand for all the major origin-and-destination pairs except for the following: 2
o During the a.m. peak period for vehicles travelling from the N1 to Stellenbosch 3 o During the p.m. peak period for vehicles leaving Stellenbosch to both N1 and Bottelary. 4
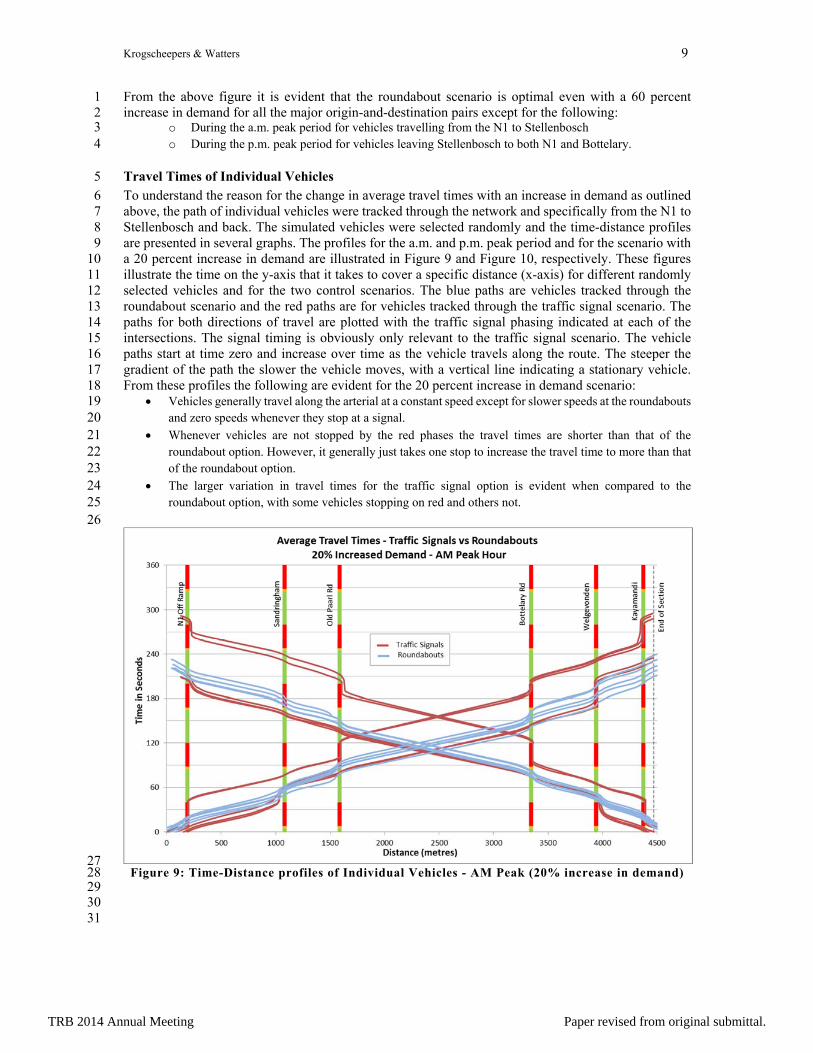
Travel Times of Individual Vehicles 5 To understand the reason for the change in average travel times with an increase in demand as outlined 6 above, the path of individual vehicles were tracked through the network and specifically from the N1 to 7 Stellenbosch and back. The simulated vehicles were selected randomly and the time-distance profiles 8 are presented in several graphs. The profiles for the a.m. and p.m. peak period and for the scenario with 9 a 20 percent increase in demand are illustrated in Figure 9 and Figure 10, respectively. These figures 10 illustrate the time on the y-axis that it takes to cover a specific distance (x-axis) for different randomly 11 selected vehicles and for the two control scenarios. The blue paths are vehicles tracked through the 12 roundabout scenario and the red paths are for vehicles tracked through the traffic signal scenario. The 13 paths for both directions of travel are plotted with the traffic signal phasing indicated at each of the 14 intersections. The signal timing is obviously only relevant to the traffic signal scenario. The vehicle 15 paths start at time zero and increase over time as the vehicle travels along the route. The steeper the 16 gradient of the path the slower the vehicle moves, with a vertical line indicating a stationary vehicle. 17 From these profiles the following are evident for the 20 percent increase in demand scenario: 18
Vehicles generally travel along the arterial at a constant speed except for slower speeds at the roundabouts 19 and zero speeds whenever they stop at a signal. 20
Whenever vehicles are not stopped by the red phases the travel times are shorter than that of the 21 roundabout option. However, it generally just takes one stop to increase the travel time to more than that 22 of the roundabout option. 23
The larger variation in travel times for the traffic signal option is evident when compared to the 24 roundabout option, with some vehicles stopping on red and others not. 25
26
27 Figure 9: Time-Distance profiles of Individual Vehicles - AM Peak (20% increase in demand) 28
29 30 31
TRB 2014 Annual Meeting Paper revised from original submittal.
Krogscheepers & Watters 10
TRB 2014 Annual Meeting
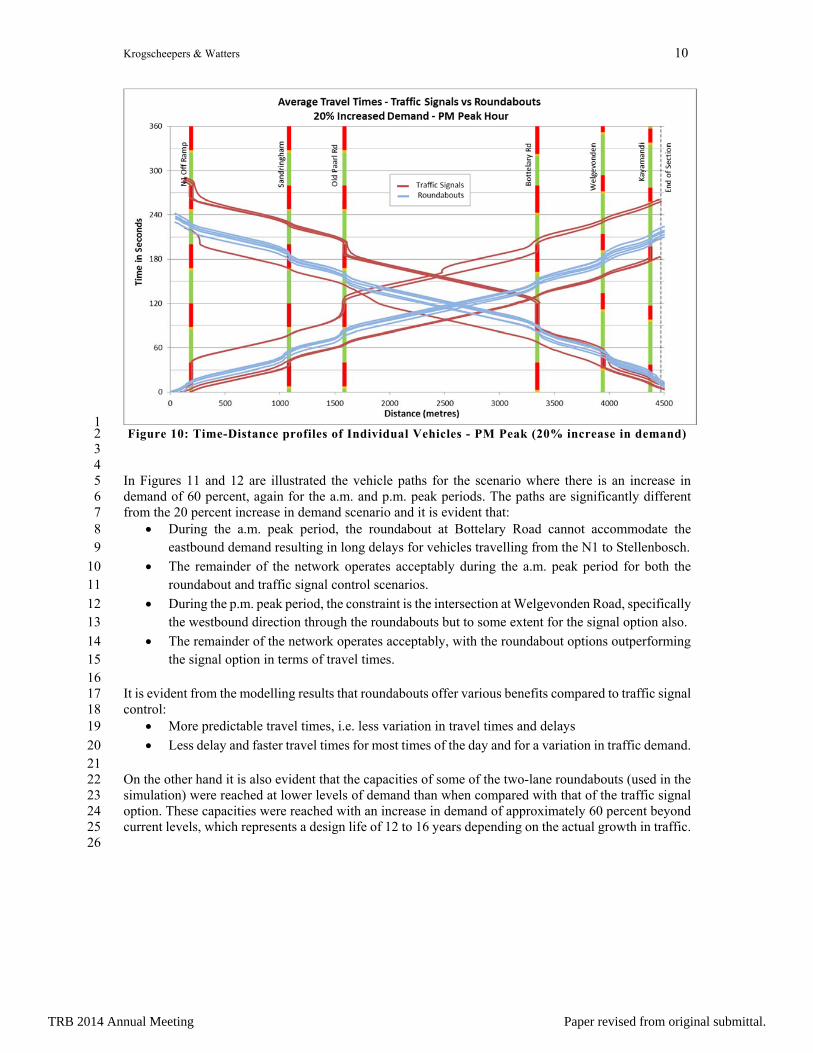
1 Figure 10: Time-Distance profiles of Individual Vehicles - PM Peak (20% increase in demand) 2
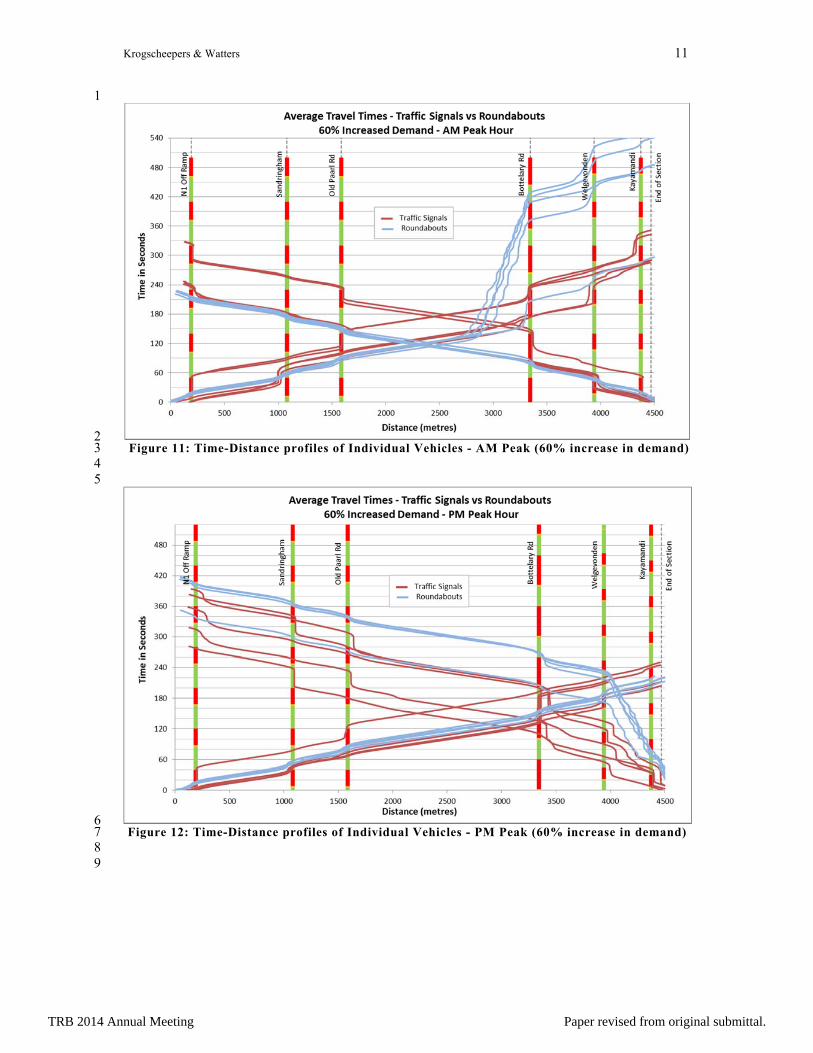
3 4 In Figures 11 and 12 are illustrated the vehicle paths for the scenario where there is an increase in 5 demand of 60 percent, again for the a.m. and p.m. peak periods. The paths are significantly different 6 from the 20 percent increase in demand scenario and it is evident that: 7
During the a.m. peak period, the roundabout at Bottelary Road cannot accommodate the 8 eastbound demand resulting in long delays for vehicles travelling from the N1 to Stellenbosch. 9
The remainder of the network operates acceptably during the a.m. peak period for both the 10 roundabout and traffic signal control scenarios. 11
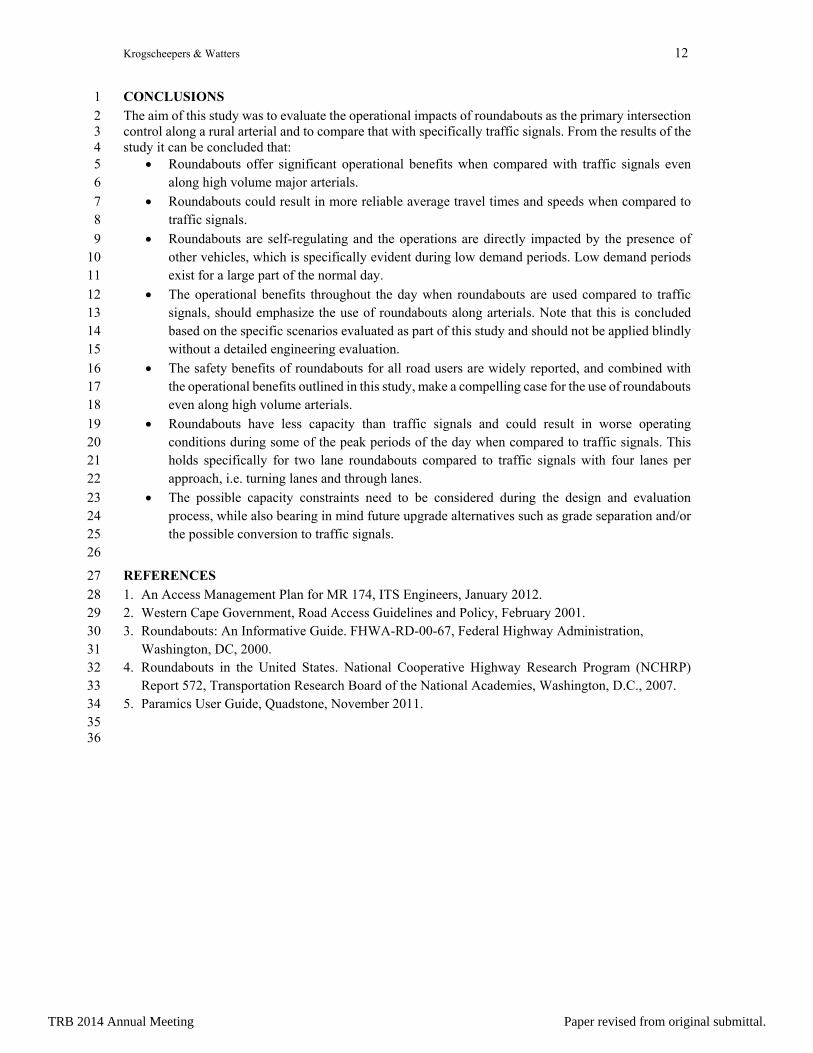
During the p.m. peak period, the constraint is the intersection at Welgevonden Road, specifically 12 the westbound direction through the roundabouts but to some extent for the signal option also. 13
The remainder of the network operates acceptably, with the roundabout options outperforming 14 the signal option in terms of travel times. 15
16 It is evident from the modelling results that roundabouts offer various benefits compared to traffic signal 17 control: 18
More predictable travel times, i.e. less variation in travel times and delays 19
Less delay and faster travel times for most times of the day and for a variation in traffic demand. 20 21 On the other hand it is also evident that the capacities of some of the two-lane roundabouts (used in the 22 simulation) were reached at lower levels of demand than when compared with that of the traffic signal 23 option. These capacities were reached with an increase in demand of approximately 60 percent beyond 24 current levels, which represents a design life of 12 to 16 years depending on the actual growth in traffic. 25
26
TRB 2014 Annual Meeting Paper revised from original submittal.
Krogscheepers & Watters 11
TRB 2014 Annual Meeting
1
2 Figure 11: Time-Distance profiles of Individual Vehicles - AM Peak (60% increase in demand) 3 4 5
6 Figure 12: Time-Distance profiles of Individual Vehicles - PM Peak (60% increase in demand) 7
8 9
TRB 2014 Annual Meeting Paper revised from original submittal.
Krogscheepers & Watters 12
TRB 2014 Annual Meeting
CONCLUSIONS 1 The aim of this study was to evaluate the operational impacts of roundabouts as the primary intersection 2 control along a rural arterial and to compare that with specifically traffic signals. From the results of the 3 study it can be concluded that: 4
Roundabouts offer significant operational benefits when compared with traffic signals even 5 along high volume major arterials. 6
Roundabouts could result in more reliable average travel times and speeds when compared to 7 traffic signals. 8
Roundabouts are self-regulating and the operations are directly impacted by the presence of 9 other vehicles, which is specifically evident during low demand periods. Low demand periods 10 exist for a large part of the normal day. 11
The operational benefits throughout the day when roundabouts are used compared to traffic 12 signals, should emphasize the use of roundabouts along arterials. Note that this is concluded 13 based on the specific scenarios evaluated as part of this study and should not be applied blindly 14 without a detailed engineering evaluation. 15
The safety benefits of roundabouts for all road users are widely reported, and combined with 16 the operational benefits outlined in this study, make a compelling case for the use of roundabouts 17 even along high volume arterials. 18
Roundabouts have less capacity than traffic signals and could result in worse operating 19 conditions during some of the peak periods of the day when compared to traffic signals. This 20 holds specifically for two lane roundabouts compared to traffic signals with four lanes per 21 approach, i.e. turning lanes and through lanes. 22
The possible capacity constraints need to be considered during the design and evaluation 23 process, while also bearing in mind future upgrade alternatives such as grade separation and/or 24 the possible conversion to traffic signals. 25
26
REFERENCES 27 1. An Access Management Plan for MR 174, ITS Engineers, January 2012. 28 2. Western Cape Government, Road Access Guidelines and Policy, February 2001. 29 3. Roundabouts: An Informative Guide. FHWA-RD-00-67, Federal Highway Administration, 30
Washington, DC, 2000. 31 4. Roundabouts in the United States. National Cooperative Highway Research Program (NCHRP) 32
Report 572, Transportation Research Board of the National Academies, Washington, D.C., 2007. 33 5. Paramics User Guide, Quadstone, November 2011. 34 35 36
TRB 2014 Annual Meeting Paper revised from original submittal.