Embed Size (px)
Citation preview
1
Rotherhithe Case Study: Propensity to Cycle Tool This case study has been written to use the Propensity to Cycle Tool (PCT: www.pct.bike) to consider the impact of a bridge in South-East London between Rotherhithe and Canary Wharf, close to the location of the current ferry. A caveat must be noted: the PCT has not been designed to evaluate the impact of providing faster or more direct routes on cycling potential, and so this case study must be considered exploratory. However, this report illustrates the principle using a relatively simple example, for which ‘quiet route’ distance may be used to explore possible increases in cycling potential.
The case study was drafted by Rachel Aldred on behalf of the PCT team.
Contents
About the PCT ........................................................................................................................ 2
The local context .................................................................................................................... 2
The cycling context ................................................................................................................. 2
The bridge proposals .............................................................................................................. 3
Using the PCT to examine cycling potential between Rotherhithe and Canary Wharf ......... 3
Included Origin-Destination pairs .......................................................................................... 4
Cycling potential: (i) 59 OD pairs where the quieter route is via the ferry............................ 6
Cycling potential: (i) 58 OD pairs where the quieter route is not via the ferry ..................... 7
Commuter cycling potential: all 117 OD pairs ..................................................................... 10
References ............................................................................................................................ 13
2
About the PCT The PCT is a Department for Transport-funded tool that uses information about current trip lengths and hilliness to identify trips that might be most easily switched to cycling. Currently, the tool uses travel to work data from the 2011 Census, which has origins and destinations for almost all commuters in England. This data is currently at the level of a Middle layer Super Output Area (MSOA), a unit of population of around 7500 people, with on average 3325 commuters. The PCT provides a range of scenarios to explore cycling potential at area and route levels.
For more on the PCT methods, please see Lovelace et al (in press; a pre-print is here) or Section C of the PCT manual.
Data for the first wave of case studies was downloaded from the Propensity to Cycle Tool (PCT) as of 1st September 2016. Some of the underlying data may change slightly in future updates to PCT. In particular, an update to be applied in October/November 2016 will improve our estimates of route hilliness, and so reduce measurement error in modelling propensity to cycle, although we do not expect this significantly to change the model results.
The local context East of Tower Bridge, Thames crossings become further apart and lack dedicated provision for cycling. There are few bridges: only one of the 34 Thames Bridges is East of Tower Bridge. Bikes are also banned from the Docklands Light Railway during peak hours (except folding bikes). One of the few crossings available to cyclists is the Greenwich Foot Tunnel, which however is problematic for several reasons:
• Until recently, cyclists were meant to dismount at all times in the tunnel, though this was widely disregarded since the removal of lift attendants, particularly at quiet times. Currently a trial period is in place during which cyclists will be asked to dismount only at times with busy pedestrian flow.
• While the lifts now run 24 hours a day, they do sometimes go out of service. In this case cyclists would need to negotiate a spiral staircase with over 100 steps carrying their bike, with the alternative potentially being a detour of up to nine miles.
While the Greenwich Foot Tunnel is problematic (particularly if cycling volumes grow) other nearby options are arguably much worse. The Canary Wharf – Rotherhithe Ferry requires users to pay, and cyclists must dismount and face a time penalty. The Rotherhithe Tunnel, while permitting cycling, is an extremely hostile cycling environment.
The cycling context If London’s cycling ambition is realised, levels of cycling will double by 2023, compared to 2013 levels. Hence we might expect growing levels of cycling across its river crossings, and indeed some of the highest cycling levels at peak are currently seen across London bridges. It is likely that the poor provision for cycle crossings East of Tower Bridge is currently
3
suppressing cycling levels, and will continue to do so without improvements. It is also likely that Greenwich Foot Tunnel will struggle to cope with even part of the projected increases in cycling at peak, and this will negatively impact on pedestrian and cyclist level of service. In addition to the background increases in levels of cycling, East London is likely to see further rises due to growth in population and jobs – London is ‘moving East’.
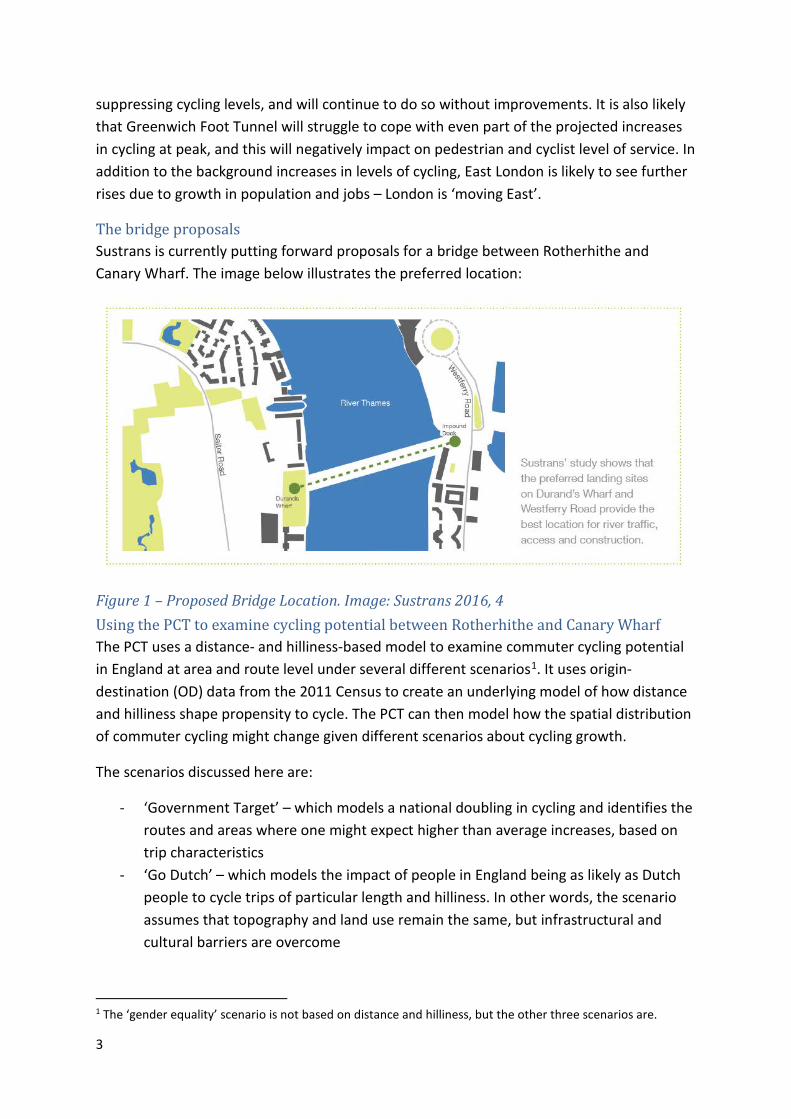
The bridge proposals Sustrans is currently putting forward proposals for a bridge between Rotherhithe and Canary Wharf. The image below illustrates the preferred location:
Figure 1 – Proposed Bridge Location. Image: Sustrans 2016, 4 Using the PCT to examine cycling potential between Rotherhithe and Canary Wharf The PCT uses a distance- and hilliness-based model to examine commuter cycling potential in England at area and route level under several different scenarios1. It uses origin-destination (OD) data from the 2011 Census to create an underlying model of how distance and hilliness shape propensity to cycle. The PCT can then model how the spatial distribution of commuter cycling might change given different scenarios about cycling growth.
The scenarios discussed here are:
- ‘Government Target’ – which models a national doubling in cycling and identifies the routes and areas where one might expect higher than average increases, based on trip characteristics
- ‘Go Dutch’ – which models the impact of people in England being as likely as Dutch people to cycle trips of particular length and hilliness. In other words, the scenario assumes that topography and land use remain the same, but infrastructural and cultural barriers are overcome
1 The ‘gender equality’ scenario is not based on distance and hilliness, but the other three scenarios are.
4
- ‘E-bikes’ – which adds to ‘Go Dutch’ the assumption that people will have access to ebikes for longer and/or hillier commutes, based on Dutch and Swiss data about their use in those countries.
This case study makes use of the fact that the PCT maps origin-destination pairs both to the fastest cycleable route and to ‘quieter’ routes (using the Cyclestreets journey planner). It considers how we might extend use of the PCT to examine contexts where both types of route may currently involve substantial time penalties due to severance.
As mentioned above, this case study should be viewed as exploratory, as the PCT was not designed to look at the impact of specific infrastructural interventions. The following has been done to explore cycling potential:
• Origin-destination (OD) pairs likely to re-route to a new bridge in the Rotherhithe-Canary Wharf area have been selected. This produces 117 OD pairs.
• OD pairs for which the ‘Quieter Route’ is currently routed across the existing ferry are selected. For these, we re-calculate cycling potential, based on ‘Quieter Route’ distance and hilliness (without the time penalty that would be expected were cyclists to use the ferry – it is this time penalty that explains why Cyclestreets did not characterise these as ‘fast’ routes).
• For the other pairs, in most cases currently routed through the Greenwich Foot Tunnel for both quieter and more direct routes, the existing faster route distance and hilliness are retained but it is assumed that these potential cyclists use the new bridge. While this may be seen as optimistic there are like to be more potential cycle commuters that we cannot include (due to our exclusion criteria and the exclusion of mixed-mode commutes).
• Three scenarios are used: Government Target, Go Dutch and e-bikes. Government Target might be seen as approximating likely cycling levels in 2021 compared to our 2011 baseline (doubling over ten years – TfL 2013). Go Dutch and e-bikes represent longer-term potential: if Government Target represents a ballpark figure for the route in question (an underestimate due to the substantial population growth) as it opens, Go Dutch and e-bikes should be seen as ballpark figures for change over the longer term, with implications for capacity needs and longer-term benefits.
Included Origin-Destination pairs First note that the PCT for London as used excludes a relatively high proportion of origin-destination pairs from its consideration of cycle commuting potential, necessary because of the sheer volume of data involved. The ‘Model Output’ page gives detailed information about the 6582 origin-destination pairs that constitute the London flow data, which are a subset of all origin-destination pairs in London.
In London there are 6582 between-zone flows that a) start and end in London, b) have a straight-line (Euclidean) distance of less than 20km and a fast-route distance
5
less than 30km, and c) contain more than 70 commuters (by any mode, counting commuters in both directions). These 6582 between-zone flows are visualised as Straight Lines, Routes (fast and quiet) and the Route Network on the interactive map, and account for 27% of all commuters living in London.
Therefore, OD pairs included here were chosen from within a subset of all London-based commuters. (NB that in London, there will be many additional commutes from outside Greater London: we cannot include these either).
The OD pairs discussed here were chosen from commutes made between the Isle of Dogs and parts of South London. Almost all have an origin or destination in Canary Wharf itself. All have an origin or destination South of the Thames: those with origins or destinations where the crow-fly route would run East of the Greenwich foot tunnel were excluded, on the grounds that these commuters would probably continue to travel through the foot tunnel (or possible via the cable car).
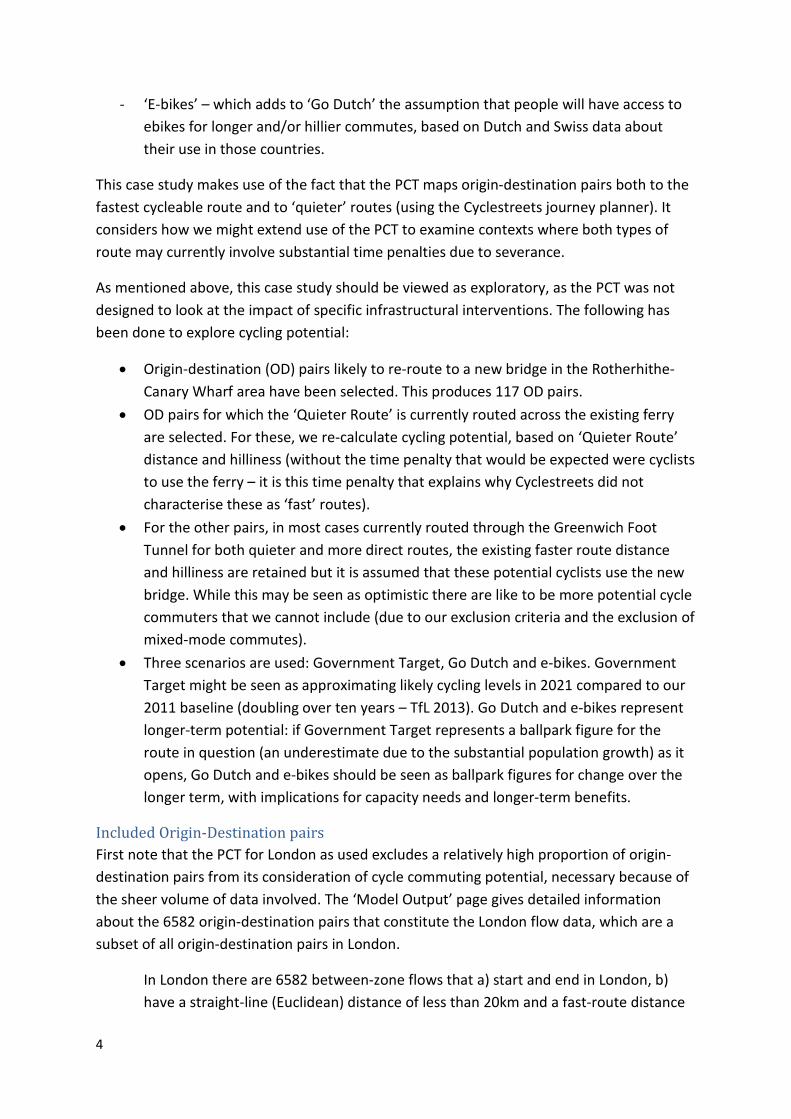
The 117 OD pairs included within the analysis are shown below. The yellow lines (Group 2) represent OD pairs where the ‘quieter route’ recommendation uses the existing ferry, despite the substantial time penalty. The blue lines (Group 1) represent OD pairs where this recommendation is not made: those further East are routed via the Greenwich foot tunnel, and those further West generally on the North side of the river.
Figure 2 – OD (origin-destination) pairs included These OD pairs in total account for 16,956 commute trips.
6
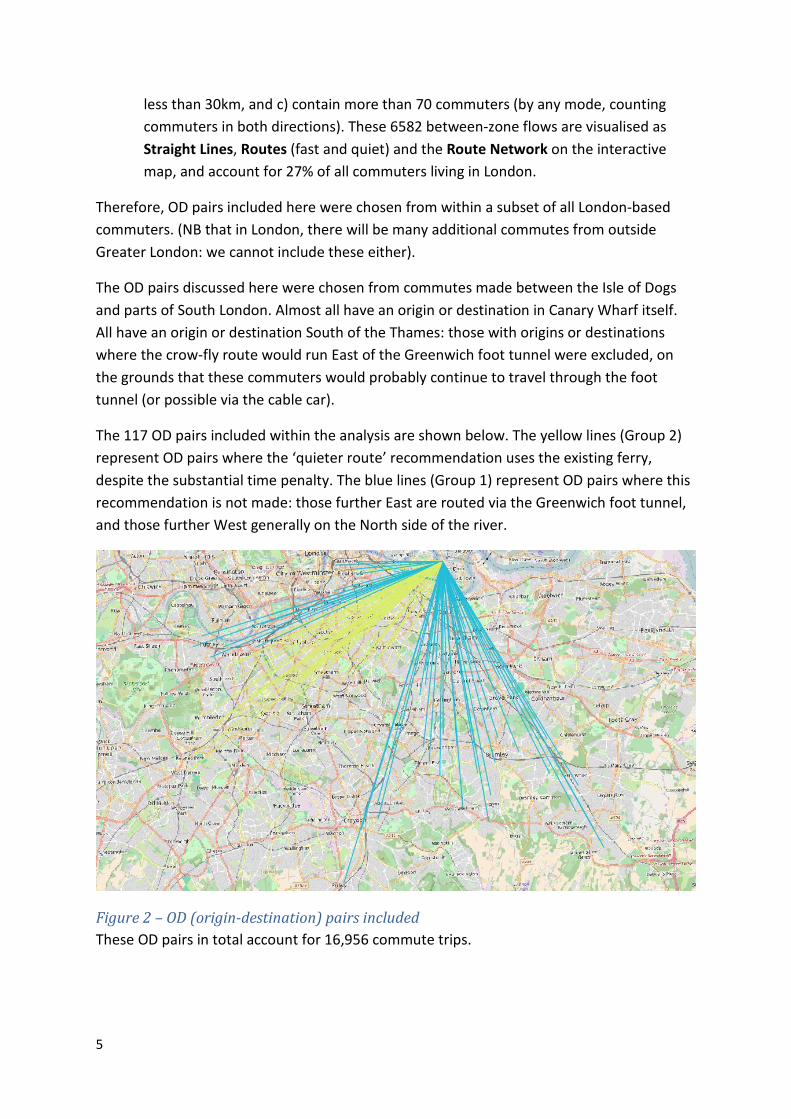
The mode split is shown below – it can be seen that light rail is the dominant main mode, i.e. London Underground or Docklands Light Railway. Bicycle accounts for 5%, slightly more than car and substantially more than either walking or bus.
Figure 3 – mode split, OD pairs included There are substantial barriers to cycling here – most commutes would likely use the Greenwich foot tunnel, with the disadvantages discussed above, given the delays imposed by the use of the ferry. Hence a 5% mode share is perhaps rather impressive and indicative of substantial suppressed demand for cycling, which would mostly come from light rail and hence reduce pressure on London Underground in the context of predicted growth (but contribute less strongly to, for instance, CO2 emission reduction).
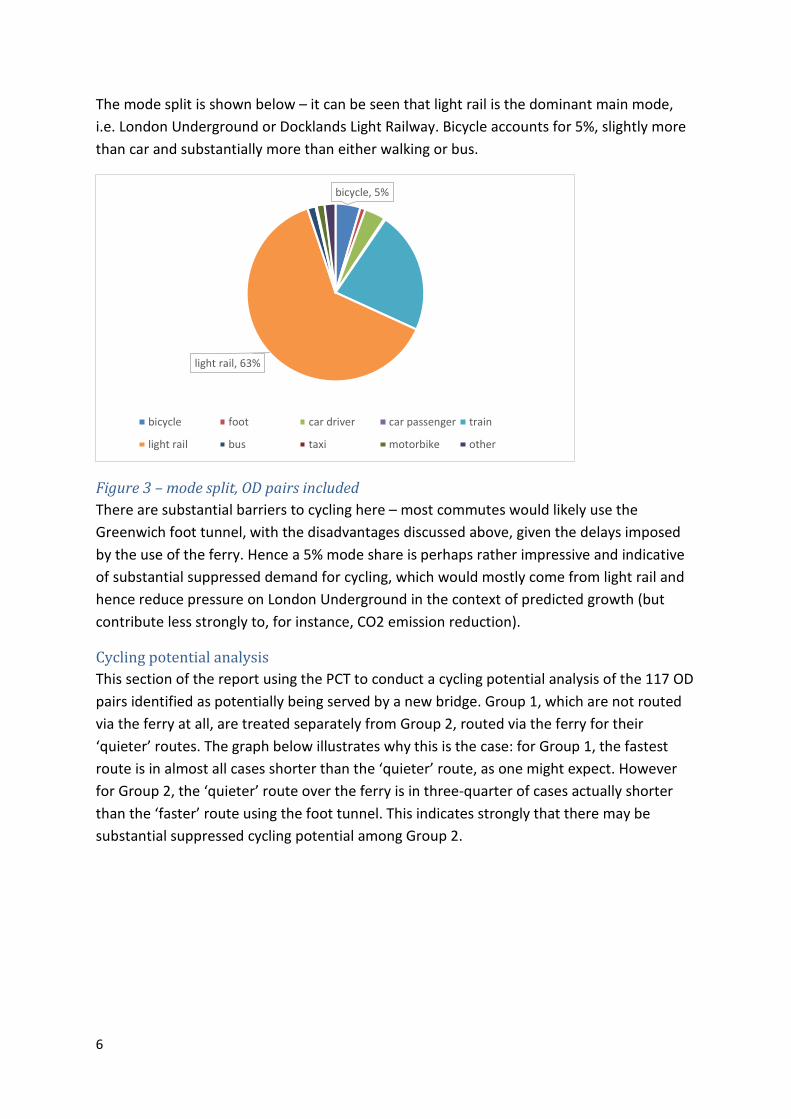
Cycling potential analysis This section of the report using the PCT to conduct a cycling potential analysis of the 117 OD pairs identified as potentially being served by a new bridge. Group 1, which are not routed via the ferry at all, are treated separately from Group 2, routed via the ferry for their ‘quieter’ routes. The graph below illustrates why this is the case: for Group 1, the fastest route is in almost all cases shorter than the ‘quieter’ route, as one might expect. However for Group 2, the ‘quieter’ route over the ferry is in three-quarter of cases actually shorter than the ‘faster’ route using the foot tunnel. This indicates strongly that there may be substantial suppressed cycling potential among Group 2.
bicycle, 5%
light rail, 63%
bicycle foot car driver car passenger train
light rail bus taxi motorbike other
7
Figure 4 – comparing distances for “fastest” and “quiet” routes, two groups
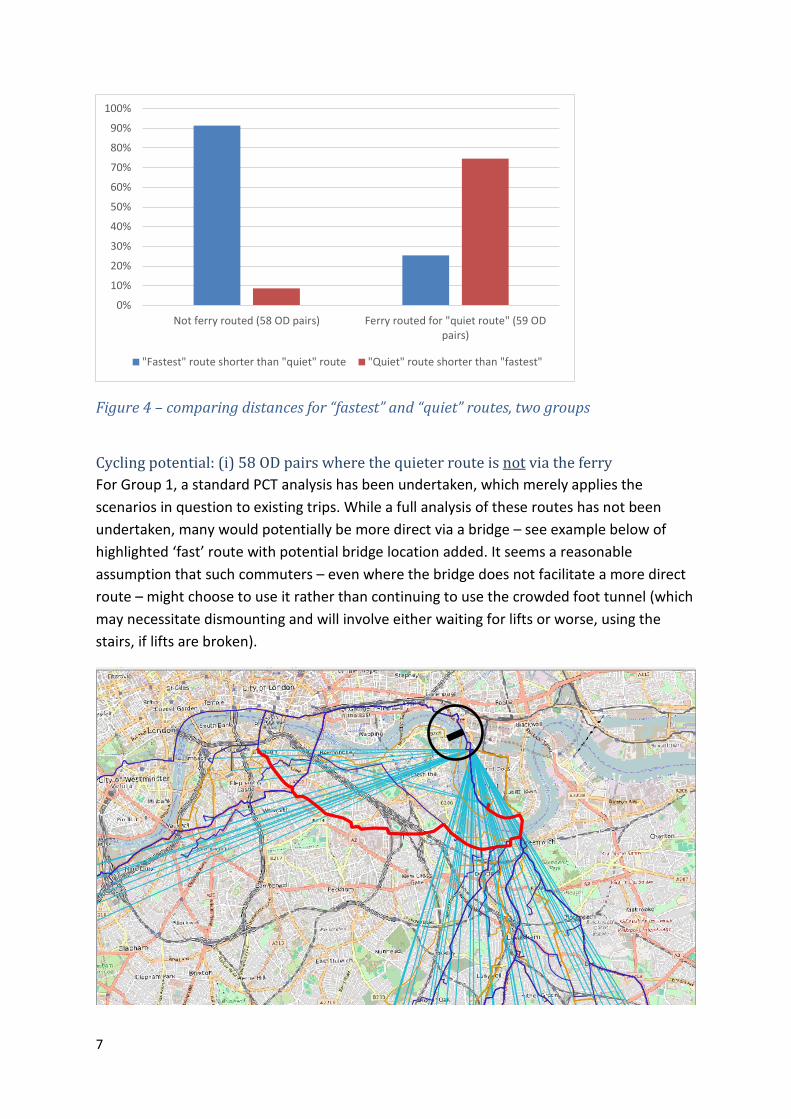
Cycling potential: (i) 58 OD pairs where the quieter route is not via the ferry For Group 1, a standard PCT analysis has been undertaken, which merely applies the scenarios in question to existing trips. While a full analysis of these routes has not been undertaken, many would potentially be more direct via a bridge – see example below of highlighted ‘fast’ route with potential bridge location added. It seems a reasonable assumption that such commuters – even where the bridge does not facilitate a more direct route – might choose to use it rather than continuing to use the crowded foot tunnel (which may necessitate dismounting and will involve either waiting for lifts or worse, using the stairs, if lifts are broken).
0%
10%
20%
30%
40%
50%
60%
70%
80%
90%
100%
Not ferry routed (58 OD pairs) Ferry routed for "quiet route" (59 ODpairs)
"Fastest" route shorter than "quiet" route "Quiet" route shorter than "fastest"
8
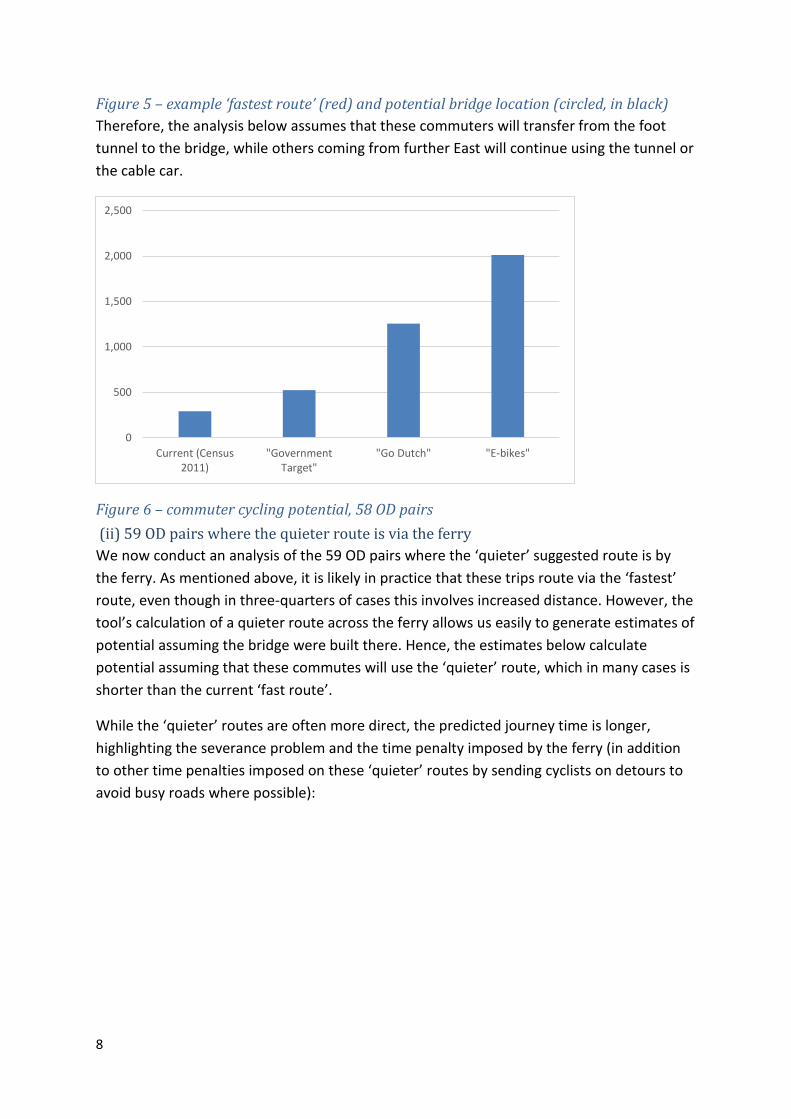
Figure 5 – example ‘fastest route’ (red) and potential bridge location (circled, in black) Therefore, the analysis below assumes that these commuters will transfer from the foot tunnel to the bridge, while others coming from further East will continue using the tunnel or the cable car.
Figure 6 – commuter cycling potential, 58 OD pairs (ii) 59 OD pairs where the quieter route is via the ferry We now conduct an analysis of the 59 OD pairs where the ‘quieter’ suggested route is by the ferry. As mentioned above, it is likely in practice that these trips route via the ‘fastest’ route, even though in three-quarters of cases this involves increased distance. However, the tool’s calculation of a quieter route across the ferry allows us easily to generate estimates of potential assuming the bridge were built there. Hence, the estimates below calculate potential assuming that these commutes will use the ‘quieter’ route, which in many cases is shorter than the current ‘fast route’.
While the ‘quieter’ routes are often more direct, the predicted journey time is longer, highlighting the severance problem and the time penalty imposed by the ferry (in addition to other time penalties imposed on these ‘quieter’ routes by sending cyclists on detours to avoid busy roads where possible):
0
500
1,000
1,500
2,000
2,500
Current (Census2011)
"GovernmentTarget"
"Go Dutch" "E-bikes"
9
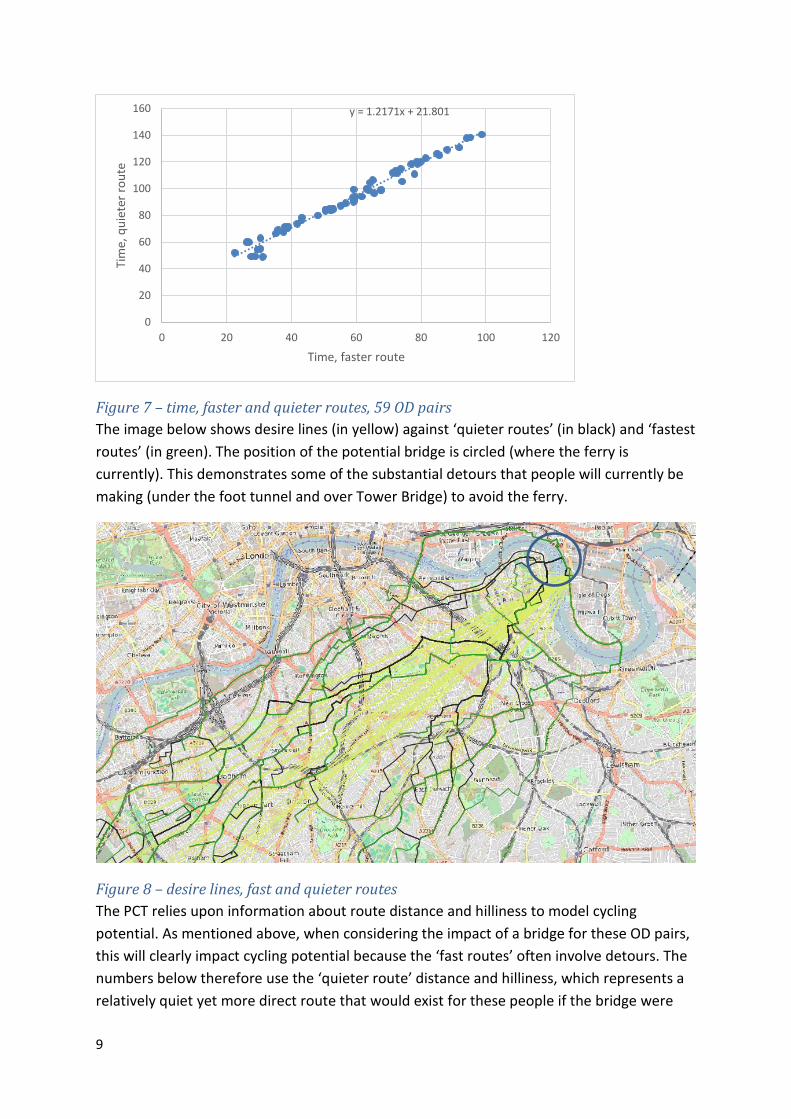
Figure 7 – time, faster and quieter routes, 59 OD pairs The image below shows desire lines (in yellow) against ‘quieter routes’ (in black) and ‘fastest routes’ (in green). The position of the potential bridge is circled (where the ferry is currently). This demonstrates some of the substantial detours that people will currently be making (under the foot tunnel and over Tower Bridge) to avoid the ferry.
Figure 8 – desire lines, fast and quieter routes The PCT relies upon information about route distance and hilliness to model cycling potential. As mentioned above, when considering the impact of a bridge for these OD pairs, this will clearly impact cycling potential because the ‘fast routes’ often involve detours. The numbers below therefore use the ‘quieter route’ distance and hilliness, which represents a relatively quiet yet more direct route that would exist for these people if the bridge were
y = 1.2171x + 21.801
0
20
40
60
80
100
120
140
160
0 20 40 60 80 100 120
Tim
e, q
uiet
er ro
ute
Time, faster route
10
built. (NB it may still not be the ‘fastest route’ as the Cyclestreets algorithm will have sent people on additional detours, where possible, to avoid busy roads.)
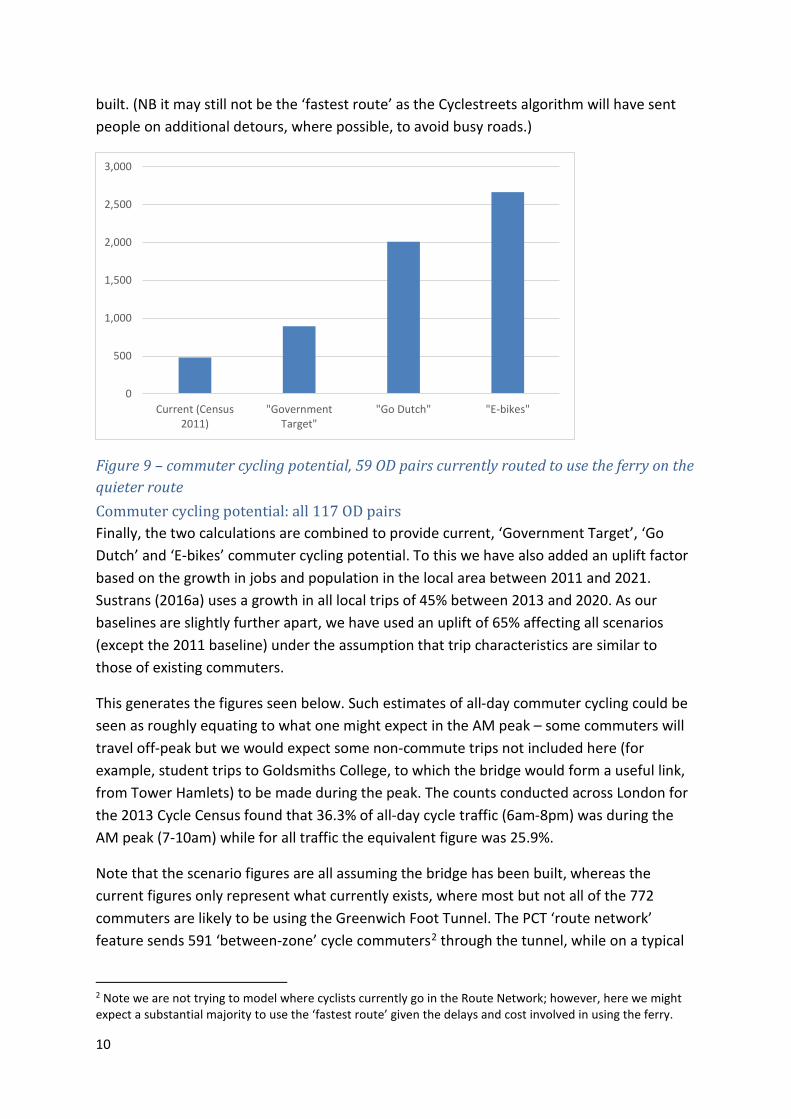
Figure 9 – commuter cycling potential, 59 OD pairs currently routed to use the ferry on the quieter route Commuter cycling potential: all 117 OD pairs Finally, the two calculations are combined to provide current, ‘Government Target’, ‘Go Dutch’ and ‘E-bikes’ commuter cycling potential. To this we have also added an uplift factor based on the growth in jobs and population in the local area between 2011 and 2021. Sustrans (2016a) uses a growth in all local trips of 45% between 2013 and 2020. As our baselines are slightly further apart, we have used an uplift of 65% affecting all scenarios (except the 2011 baseline) under the assumption that trip characteristics are similar to those of existing commuters.
This generates the figures seen below. Such estimates of all-day commuter cycling could be seen as roughly equating to what one might expect in the AM peak – some commuters will travel off-peak but we would expect some non-commute trips not included here (for example, student trips to Goldsmiths College, to which the bridge would form a useful link, from Tower Hamlets) to be made during the peak. The counts conducted across London for the 2013 Cycle Census found that 36.3% of all-day cycle traffic (6am-8pm) was during the AM peak (7-10am) while for all traffic the equivalent figure was 25.9%.
Note that the scenario figures are all assuming the bridge has been built, whereas the current figures only represent what currently exists, where most but not all of the 772 commuters are likely to be using the Greenwich Foot Tunnel. The PCT ‘route network’ feature sends 591 ‘between-zone’ cycle commuters2 through the tunnel, while on a typical
2 Note we are not trying to model where cyclists currently go in the Route Network; however, here we might expect a substantial majority to use the ‘fastest route’ given the delays and cost involved in using the ferry.
0
500
1,000
1,500
2,000
2,500
3,000
Current (Census2011)
"GovernmentTarget"
"Go Dutch" "E-bikes"
11
day in 2013, there were 577 cycled trips through the Greenwich foot tunnel during the AM peak period (Sustrans 2016a).
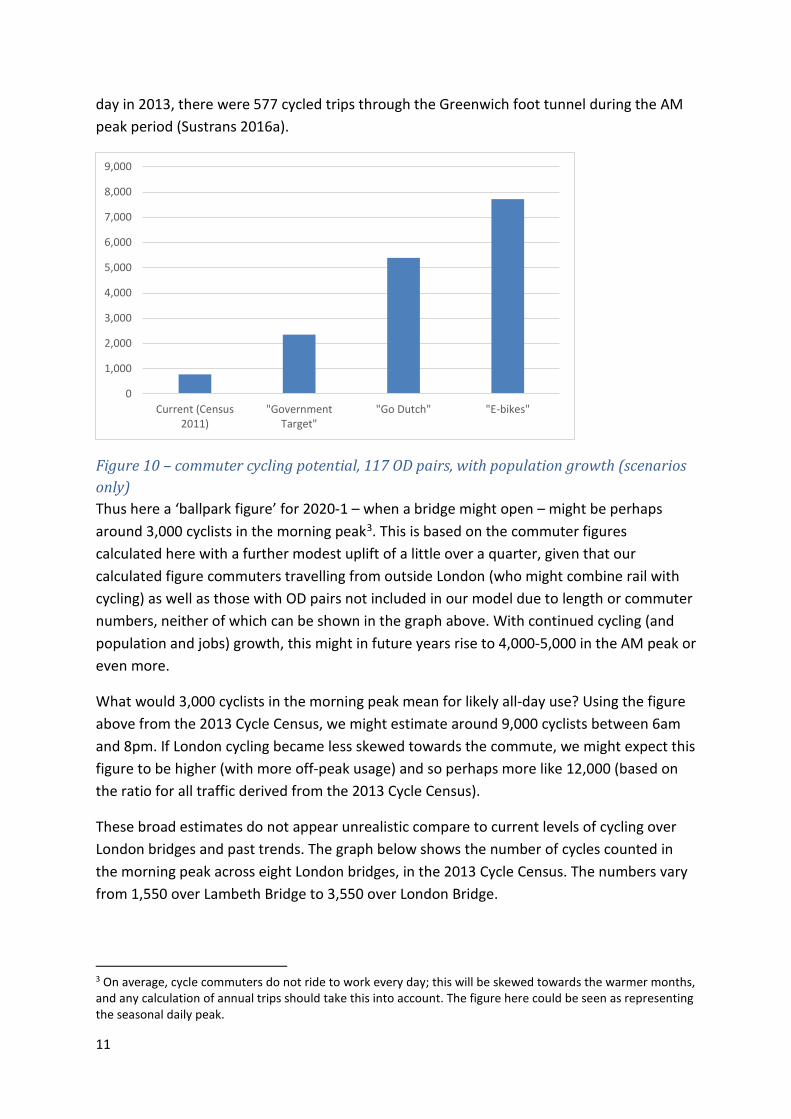
Figure 10 – commuter cycling potential, 117 OD pairs, with population growth (scenarios only) Thus here a ‘ballpark figure’ for 2020-1 – when a bridge might open – might be perhaps around 3,000 cyclists in the morning peak3. This is based on the commuter figures calculated here with a further modest uplift of a little over a quarter, given that our calculated figure commuters travelling from outside London (who might combine rail with cycling) as well as those with OD pairs not included in our model due to length or commuter numbers, neither of which can be shown in the graph above. With continued cycling (and population and jobs) growth, this might in future years rise to 4,000-5,000 in the AM peak or even more.
What would 3,000 cyclists in the morning peak mean for likely all-day use? Using the figure above from the 2013 Cycle Census, we might estimate around 9,000 cyclists between 6am and 8pm. If London cycling became less skewed towards the commute, we might expect this figure to be higher (with more off-peak usage) and so perhaps more like 12,000 (based on the ratio for all traffic derived from the 2013 Cycle Census).
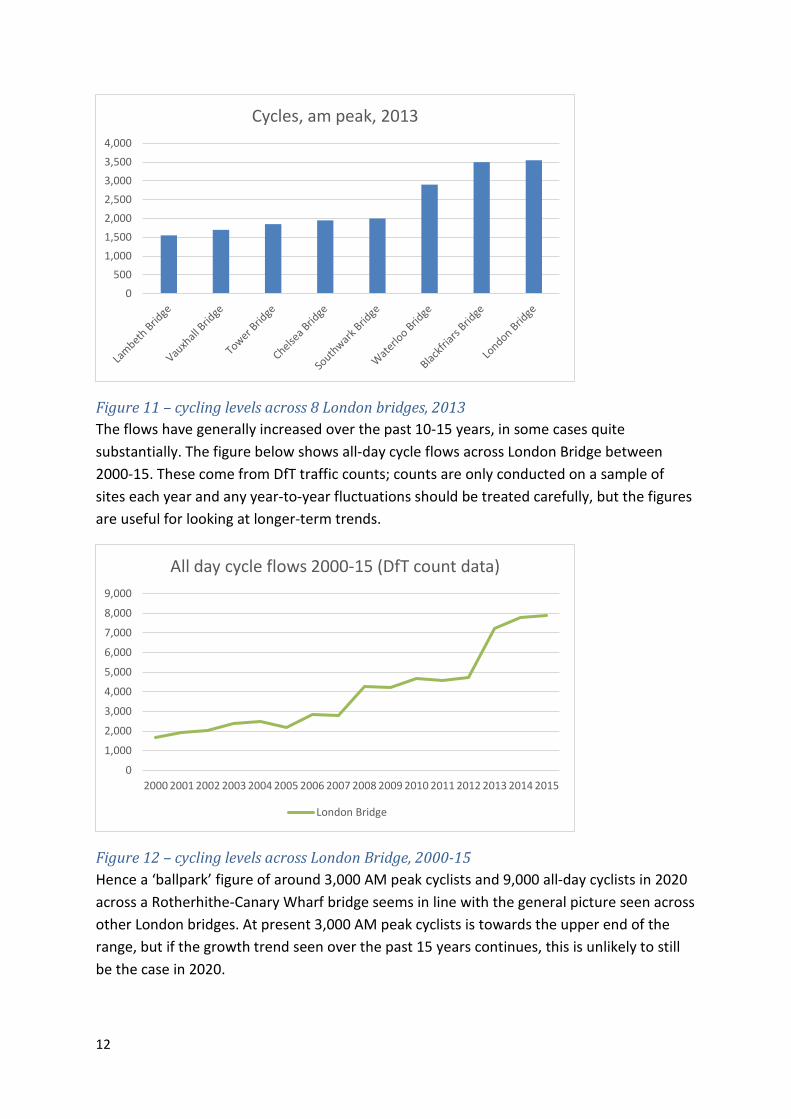
These broad estimates do not appear unrealistic compare to current levels of cycling over London bridges and past trends. The graph below shows the number of cycles counted in the morning peak across eight London bridges, in the 2013 Cycle Census. The numbers vary from 1,550 over Lambeth Bridge to 3,550 over London Bridge.
3 On average, cycle commuters do not ride to work every day; this will be skewed towards the warmer months, and any calculation of annual trips should take this into account. The figure here could be seen as representing the seasonal daily peak.
0
1,000
2,000
3,000
4,000
5,000
6,000
7,000
8,000
9,000
Current (Census2011)
"GovernmentTarget"
"Go Dutch" "E-bikes"
12
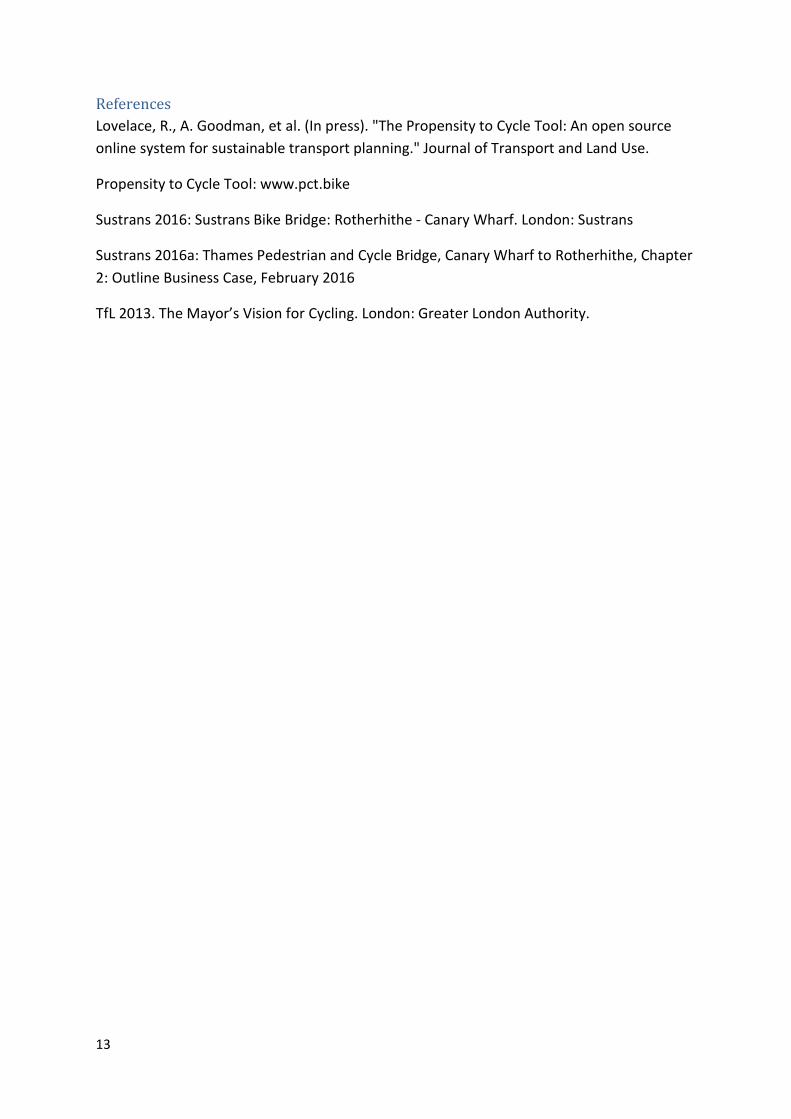
Figure 11 – cycling levels across 8 London bridges, 2013 The flows have generally increased over the past 10-15 years, in some cases quite substantially. The figure below shows all-day cycle flows across London Bridge between 2000-15. These come from DfT traffic counts; counts are only conducted on a sample of sites each year and any year-to-year fluctuations should be treated carefully, but the figures are useful for looking at longer-term trends.
Figure 12 – cycling levels across London Bridge, 2000-15 Hence a ‘ballpark’ figure of around 3,000 AM peak cyclists and 9,000 all-day cyclists in 2020 across a Rotherhithe-Canary Wharf bridge seems in line with the general picture seen across other London bridges. At present 3,000 AM peak cyclists is towards the upper end of the range, but if the growth trend seen over the past 15 years continues, this is unlikely to still be the case in 2020.
0500
1,0001,5002,0002,5003,0003,5004,000
Cycles, am peak, 2013
0
1,000
2,000
3,000
4,000
5,000
6,000
7,000
8,000
9,000
2000 2001 2002 2003 2004 2005 2006 2007 2008 2009 2010 2011 2012 2013 2014 2015
All day cycle flows 2000-15 (DfT count data)
London Bridge
13
References Lovelace, R., A. Goodman, et al. (In press). "The Propensity to Cycle Tool: An open source online system for sustainable transport planning." Journal of Transport and Land Use.
Propensity to Cycle Tool: www.pct.bike
Sustrans 2016: Sustrans Bike Bridge: Rotherhithe - Canary Wharf. London: Sustrans
Sustrans 2016a: Thames Pedestrian and Cycle Bridge, Canary Wharf to Rotherhithe, Chapter 2: Outline Business Case, February 2016
TfL 2013. The Mayor’s Vision for Cycling. London: Greater London Authority.