Embed Size (px)
Citation preview

ROTATING DISC SEWAGE TREATMENT SYSTEM FOR SUBURBAN DEVELOPMENTSAND HIGH-DENSITY RESORTS OF HAWAIII
by
Garry T. GriffithReginald H.F. Young
Michael J. Chun
Technical Report No. 116
May 1978
Phase II Project Completion Reportfor
ROTATING DISC SEWAGE TREATMENT SYSTEM FOR SUBURBAN DEVELOPMENTSAND HIGH DENSITY RESORTS IN HAWAII
OWRT Project No. A-068-HI, Grant Agreement No. 14-34-0001-7025Principal Investigators: Michael J. Chun
Reginald H.F. YoungProject Period: 1 July 1976 to 30 September 1978
The programs and activities described herein were supported in part by fundsprovided by the united States Department of the Interior as authorized underthe Water Resources Act of 1964, Public Law 88-379; and the Water ResourcesResearch Center, University of Hawaii.


iii
ABSTRACT
A large-scale pilot ~otating disc t~eatment system was tested at the
City and County of Honolulu Pacific Palisades MUnicipal Wastewate~ T~eatment
Pacili ty~ t o evaluate its t~eatment effectivenss and capabilities~ and to
p~ovide design and ope~ation c~ite~ia in t~eating domestic waste wate~ in
Hawaiian and t~opical climates. The system included p~imar~ clarification
and sludge sto~age facilities~ and a 0.55 m (1.8 ft) disc diamete~~ 20.9 m2
(225 ft 2 ) fou~-stage ~otating disc t~eatment unit. The test unit was tested
at [ou» hudx-aul.ic loadings of 0.09 to 0.27 m3/day/m 2 (2.25-6.7 gpd/ft 2) .
Pe~iphe~al ~otational disc speed was constant at 0.3 mls (1.0 fps) and waste
wate~ tempe~at~e was 27°C to 28°C d~ing the study.
At hy~aulic loadings of 0.09 to 0.27 m3/day/m 2 (2.25-6.7 gpd/ft 2) of
disc area~ the test unit achieved ~espectively 94 to 82%ove~all ~emoval of
carbonaceous BODs and 96 to 82% ove~all ~emoval of suspended solids when
t~eating deg~itted ~aw domestic waste wate~. This yielded effluent concen
t~ations of 12 to 32 mg/£ BODs and 7 to 21 mg/£ suspended solids. Sludge
p~oduction f~om the disc section was 0.40 to 0.50 mass units sludge p~oduced
pe~ mass unit BODs ~emoved in the disc section.
Low maintenance ~equi~ements~ low powe~ consumption~ and ~esistance to
the effects of hy~aulic s~ges make the ~otating disc p~ocessve~y att~ac
H w fo~ package pl ant Lnetal .lat -ione in Hawaii. In-place equipment cos t f or
~otating disc package systems t~eating sewage volumes of 94.5 m3/day (25~000
gpd) and 378 m31day (100~000 gpd) we~e estimated to be about 10% higher than
fo~ extended aeration and high-rate activated sludge package systems. How
ever~ the total annual cost over a 20-yr period was ~espectively about 14%
and 20% lowe~ fo~ the rotating di sc package systems than the extended ae~a
tion and high~~ate activated sludge package systems.


CONTENTS
ABSTRACT ..
INTRODUCTION .Background. .Process Description . .
PURPOSE AND SCOPE.
METHODOLOGY.....Pilot Unit Description.Study Location.•...Experimental Procedure.Analytical Procedures
TEST RESULTS .Test Unit Modifications ..BODs Removal ....•..•.•..COD and TOC Removal . . . • . .Suspended Solids Removal.Total Kje1dah1 Nitrogen RemovalTotal Nitrogen Removal ..Phos phorus Removal. . • . • • .Sludge Production .Mixed Liquor Characteristics •.Maintenance and Power Requirements.
COMPARISON TO PREVIOUS ROTATING DISC PROCESS EXPERIENCE..
COMPARISON WITH THE ACTIVATED SLUDGE TREATMENT PROCESS .Process Description .In-Place Equipment Cost Comparison.•Annual Cost Comparison..
CONCLUSIONS. . .
RECOMMENDATIONS.
ACKNOWLEDGMENTS.
REFERENCES . . .
v
. iii
123
7
88
13
1516
1717202428303032323636
37
4142
5254
57
58
59
61
iit~
i

vi
APPENDIX . TEST RESULTS.GLOSSARY ...
. . . . . . . . • • 67
73
ILLUSTRATIONSFigures
9
35
35
39
444547
49
50
Percent BODs Remaining vs. Theoretical Detention Time.. • ••Effluent Suspended Solids Concentration vs. Hydraulic Loading.Percent TKN Removal vs. Hydraulic Loading•.TKN Conversion Ratio vs. Hydraulic Loading • . • • •Biomass Generation vs. Hydraulic Loading ..Sludge Production vs. Hydraulic Loading.. . ...BODs Removal Compared to Previous Testing in United Statesand Europe . . . . . . . . . . • . . . . . .. • . .
Schematic Diagram of Rotating Disc Treatment System••.Autotro1 Corporation Bio-Modu1e Shaft Specifications ..Autotro1 Corporation Bio-C1arifier Shaft Specifications.Schematic Diagram of Extended Aeration Activated Sludge SystemSchematic Diagram of High-Rate Activated Sludge System •...
1. Rotating Disc Test Unit. • ....•••••....2. Primary Clarifier, Final Clarifier, and Sludge Storage
Basins of Test Unit. . . . . . • . • . . . • • • . • • . . • . . . 103. Schematic of Pilot Rotating Disc Treatment Section. . • . . . 114. Pacific Palisades Municipal Wastewater Treatment Facility. . 145. Modifications to the Final Clarifier. . . . . • • • • • . 196. Measured Effluent BODs Concentrations vs. Hydraulic Loading. • 217. Percent BODs, COD, and TOC Removal vs. Hydraulic Loading. . • 258. Effluent BODs, COD, and TOC Concentration vs. HydraUlic
Loadi ng. . . . . . . . . . . . . . . . . .' . e • .• . ' • • • • • • • 26272931
31
9.10.11.
12 .13.
14.15.
16.
17.
18.
19 .20.
Plates
1. First-Stage Fi1mentous Biomass. . . • . • . . . . . . . 342. Fourth-Stage Nitrifying Biomass at Hydraulic Loading of
0.12 m3/ day/ m2• • • • • • • • • • • • • • • • • • • • • • • • •• 34

vii
TABLES
15
16
13
18
23
24
28
33
• • • • 37
3843
51
53
55
1. Rotating Disc Unit Specifications......•...•..•.2. Average Waste Water Characteristics of the City and County
of Honolulu Pacific Palisades Wastewater Treatment Facility.3. Sampling and Analysis Program . •.......•.... .•4. Hydraulic Loadings and Detention Times Through the Second
and Fourth Disc Sections . . . . . . . • . . . . . . . . . .BODs, TOC, COD Correlation .....••...•••....Average BODs Concentration According to Hydraulic Loading ..Comparative BODs, COD, and TOC Removal .•...Media Coverage ...•.........••..Average Mixed Liquor Characteristics .Comparison of Wisconsin and Hawaii; Test UnitsSpecifications for Comparative Rotating Disc Treatment SystemsSpecifications for Comparative Actual Sludge Treatment SystemsComparative In-Place Equipment Costs ...Total Annual Cost Comparison .............•...
5.6.
7.8.
9.
10.
ll.
12.
13.
14.

INTRODUCTION
Engineered waste water treatment systems for suburban developments and
high density resorts in Hawai'i are generally of the extended-aeration acti
vated sludge type with effluent disposa~ by means of leaching fields, seepage
pits, or disposal wells. The employment of secondary tTeatment processes,
which provide a dependable effluent quality, is essential to the proper and
effective operation of these disposal modes, as well as to the protection of
the ground and coastal water resources of the state, as provided for in the
Hawaii State Department of Health's Public Health Regulations (1974, chap.
37A; 1973, chap. 38). The present concern with the extended-aeration acti
vated sludge process is that although it is capable of producing a high qual
ity effluent, it is at the same time handicapped by several inadequacies.
First, a considerable amount of operational control is required to pro
vide effective organic removal by the biological population. This operation
al control takes the form of sludge recycling and wasting to maintain an
adequate range of mixed liquor suspended solids concentration. Even with
these controls, the process is susceptible to foaming, bulking, and floating
SOlids, as well as to shock organic loadings and .hydraulic surges which can
significantly reduce the active microbial population and treatment effec
tiveness.
Second, large volume tanks are required for extended-aeration systems
as they are typically designed to provide the waste water with 24-hr of aera
tion. The tanks are generally constructed 3 to 5 m (10-15 ft) in depth to
reduce land requirements. System construction costs reflect the large amounts
of excavation and materials necessary to provide the required treatment capac
ity on the least amount of land area.
The third disadvantage of the extended-aeration system is the high
energy requirement for aeration and mixing. Normal practice is to provide
for both through a single device, such as an air diffuser or a mechanical
aerator, the energy requirements of which can be considerable.
The comparatively high costs of land, energy, construction, and labor
in Hawai'i necessitate the evaluation of alternative treatment processes for
small-scale sewage treatment facilities. A waste water treatment system,
which functions with little operator attention and control, utilizes little
energy and land area, and, most of all, is able to provide stable and effec
tive treatment to the influent waste water, would be extremely attractive.
I~

2
Investigations conducted to date indicate that the rotating disc process
adequately meets these requirements.
Background
Research on the use of rotating discs for treatment of waste waster was
first reported by Doman (1929). However, it was not until the development
of the immersion drip filter by Popel and Hartmann in the mid-1950s, that
much interest was shown in the concept (Pescod and Nair 1972). In 1959, com
mercial use of the process was initiated in Europe, primarily in Germany,
France, and Switzerland.
In 1965, the Allis-Chalmers Manufacturing Company of Milwaukee, Wiscon
sin, initiated studies of the processin the United States, and in 1970 the
Autotrol Corporation acquired proprietary rights to the process. Autotrol
is now considered the major manufacturer and marketer of rotating disc equip
ment in this country.
Rotating disc system applications include individual homes, ships, com
munity subdivisions, trailer parks, motels, schools, . large municipal and
many industrial waste treatment installations. Industries using this system
include the dairy, brewery, pUlp and paper, distillery, beef and poultry
processing, canning, and petroleum industries. In all, there are over 3000
rotating disc installations worldwide (Bio-Shafts, Inc. 1977).
The major studies that have been reported in the United States from
1968 to date, have been by Welch (1968), Antonie and Welch (1969), Joost
(1969), Antonie (1970, 1972, 1974), Torpey (1971), Birks and Hynek (1971),
Pescod and Nair (1972), Antonie and Hynek (1973), Sack and Phillips (1973),
Cochrane, Burn, and Dostal (1973), Antonie, Kluge, and Mielke (1974), Kincan
non, Chittenden, and Stover (1974), McAliley (1974), Quazi (1974), Schladitz
and Lecker (1974), Torpey, Heukelekian, and Kap10vsky (1974), Weng and Molof
(1974), Hao and Hendricks (1975), Stover and Kincannon (1975), Victor (1975),
Winkler and Welch (1974), Lagnese (1976), and DIem and Unz (1976). Despite
the numerous experiments that have been conducted, with the exception of those
reported by Pes cod and Nair (1972) and Victor (1975), most have been carried
out in temperate climates where ambient temperatures often drop below freezing
during winter months. In addition, most of the studies have dealt with in
dustrial or synthetic waste water.
Victor (1975), assuming that the mild Hawaiian climate would enhance

3
removal efficiencies of the biological treatment process, as compared with
the temperate climatic conditions in the continental United States, set out
to demonstrate the efficiency of the rotating disc system in handling domes
tic waste waters in Hawai1i by using a bench-scale unit. That study, along
with other studies, has provided valuable baseline data upon which to devel
op a large-scale pilot unit that can be field tested to obtain the operating
data necessary for evaluation of the rotating disc process in handling domes
tic waste waters in Hawaiian communities.
Process Description
The rotating disc process is a treatment method wliich operates as a
fixed-film biological reactor. A number of closely-spaced circular discs
are mounted on a horizontal shaft and placed in a tank conforming to the
general shape of the discs. The discs are slowly rotated so that at all
times approximately one-half of their surface area is submerged in the waste
water to be treated. As the shaft rotates, organisms present naturally in
the waste water begin to adhere to the disc surfaces and multiply . In about
one week, the attached microbial culture develops into a steady-state thick
ness of 0.2 to 0.4 em (0.08 to 0.16 in.) (Antonie 1972; Victor 1975).
The waste water, coated on and trickling down the biomass-covered ,di scs ,
absorbs atmospheric oxygen when the discs cycle from t he waste water tank to
the air. The attached organisms remove both dissolved oxygen and organic
materials from this layer of waste water. As the discs continue rotation
through the bulk of the waste water in the tank, further removal of dissolved
oxygen and organic materials by absorption is performed by the biomass. Op
erating in this manner, the rotating discs provide a medium for the develop
ment of a fixed biological growth, allow contact of the growth with the
waste water, and serve to aerate the waste water.
Excess biomass is stripped off by the shearing forces exerted as the
discs are rotated through the waste water. This prevents clogging of the
disc surfaces and provides a constant microbial population on the discs.
Mixing provided by the rotating discs keeps the sheared solids in suspension
in the mixed liquor until the flow of treated waste water carries them out
of the disc sections for separation and disposal.
Treatment capacities and performance levels are proportional to the
amount of disc surface supplied on which biomass attach and grow. The amount
I

4
of disc surface area required for a domestic installation is based on the
system design hydraulic loading (m 3/day/m2 or gpd/ft 2 of disc surface area).
Hydraulic loading is the design criterion for domestic waste water because
the rotating disc process very nearly approaches first-order kinetics for the
removal of carbonaceous material and oxidation of ammonia nitrogen (Antonie
1974; Torpey, Heukelekian, and Kaplovsky 1974). For a given hydraulic load
ing, a specific percentage removal of carbonaceous material will occur re
gardless of influent concentration. This relationship applies only to domes
tic waste water, and must be distinguished from treating high-strength indus
trial wastes where the process is not so rate-limited until the higher con
centration of 'organics is reduced towards the range of that found in domestic
waste water. At higher organic concentrations, disc surface area require
ments are based on organic loading (kg BOD/92.9 m2/day or Ib BOD/IOOO ft 2/
day).
The efficiency of the removal process is dependent upon the continuous
contact of the fixed biomass with fresh waste water material and the availa
bility of a sufficient dissolved oxygen supply. These two requirements are
influenced by several process parameters: staging, tank detention time,
disc spacing, disc rotation speed, and depth of disc immersion.
STAGING. The greater the concentration of materials in the waste water,
the greater the driving force for absorption of the material into the biomass
(at the concentration range found in domestic waste water). This "effective"
concentration can be increased over that found in a single disc reaction
tank, by separating the reaction tank into sections or stages containing
groups of discs. As the amount of staging is increased (especially when in
creasing from 1 to 2 stages) the amount of disc surface area to provide an
equivalent level of organic removal is reduced.
Increased savings in surface area produced by increasing the number of
stages is offset by having to increase the number of shafts, bearings, and
drive equipment. Due to economics, Torpey, Heukelekian, and Kaplovsky (1974)
state that the optimum number of stages lies between two and four when
treating wastes with concentrations comparable to normal domestic wastewater.
Staging promotes the natural development of different biological cul
tures in each stage. Bacteria which utilize carbonaceous material are pre
dominant on the disc surfaces in the initial stages where the concentration

5
of carbonaceous material is relatively high. Nitrifying bacteria are found
attached to the disc surfaces in latter stages in which the concentration of
carbonaceous material is decreased to a level where nitrifiers can success
fully compete for space on the disc surafce.
DETENTION TIME. Sufficient detention time must be provided in the disc
section to allow sorption of the materials in the waste water by the fixed
biomass growth. BODs removals of 90% have been reported with a detention
time of 45 min (Antonie, Kluge, and Mielke 1974). However, full-scale sys
tem design in the United States provides disc tank detention periods of about
1.0 hr (Autotrol Corporation 1974). In comparison, a detention time of 1.5
hr is common for European systems (Antonie 1974). Detention time is con
trolled by the tank volume. This in turn is usually regulated by disc sur
face spacing distance.
DISC SPACING. The interior of the disc surfaces must have adequate
flow volumes to permit unrestricted waste water mixing within adjacent disc
surfaces. Waste water mixing. within the disc interior surfaces is necessary
to promote a free exchange of waste water materials with the attached bio
mass. These flow volumes must also be sufficient to remove the excess bio
logical growth from the disc surfaces. Otherwise, plugging due to biomass
bridging will occur and cause flow short-circuiting resulting in ineffective
process surfaces. Flow areas between the periphery of the discs and the tank
surface must be sufficient to provide unrestricted flow to and from the inner
passages.
The removal of carbonaceous matter accomplished by a stage of treatment
is basically a function of disc area and detention time. When the disc spa
cing approaches zero, time exerts an infinite effect and surface area exerts
no effect. When the disc surfaces are spread beyond a certain limit, fur
ther increase in spacing does not influence performance. When spacing is
reduced to a region of interest, less than 0.025 m (1 in.), the influence of
both these parameters gains significance. An optimal relationship between
disc area and disc spacing, or tank volume, has been determined through ex
perimentation. A relationship of 0.005 m3/m2 (0.12 ga1/ft 2) of tank volume
of disc area is generally used by Autotrol (1974) in the design of disc in
stal1ations.
ROTATIONAL VELOCITY. Rotational velocity influences material removal
in two ways. First, the oxygenating capacity is .i ncr eased with increased
velocity. The capacity is markedly increased up to a peripheral velocity of

6
about 0.3 mls (1.0 fps) and thereafter increases slowly due to the physical
limitations of the transfer (Allis-Chalmers 1969; Autotrol 1971; Torpey,
Heukelekian, and Kaplovsky 1974). Removal is also influenced by the turbu
lence created by the rotating discs. Rotation ,at higher velocities allows
dissolved oxygen and other materials in the waste water to penetrate a larger
portion of the attached growth rendering the growth active.
DEPTH OF IMMERSION. The depth to which the disc is submerged in the
waste water has no real effect on material removal, providing the entire sur
face of the disc is wetted with waste water. Disc surface is wasted if full
wetting does not occur. Full-scale systems manufactured by Autotrol Corpora
tion (1974) are designed to operate at a 40% immersion depth.
WASTE WATER CHARACTERISTICS. Process treatment efficiency is also af
fected by the physical and chemical characteristics of the waste water to be
~reated. The major characteristics of interest found in domestic waste water
include: temperature, pH, nutrient levels, settleable SOlids, and flow fluc
tuation.
As with other biological treatment processes, the rotating disc process
is sensitive to waste water temperature. Biological reactions responsible
for the removal of organic matter and ammonia nitrogen from the waste water
were reported by Antonie and Hynek (1973), Autotrol Corporation (1974), and
Bio-Shafts, Inc. (1977) to proceed at a slower rate at temperatures below
10°C to 13°C, causing the treatment efficiency of the process to be propor
tionally less at decreased temperatures. Increased surface area must be in
corporated into the design to compensate for the decreased efficiency.
Waste waters with pH levels outside the range 6.5 to 8.5 produce a stress
on the attached biological population. Chemical addition to correct waste
water pH to within this range is recommended by Antonie (1972) for optimum
performance.
Nutrient deficient wastes also require chemical addition. Nutrient re
quirements are similar to the requirements of activated sludge treatment sys
tems (Antonie 1972).
Removal of large, dense solids is required to eliminate settling of the
material in the disc tankage. Removal of these materials can be achieved by
primary settling or fine screening (Autotrol Corporation 1974).
Process performance is greatly affected by the diurnal flow fluctuations

7
present in domestic waste water systems. Flow equalization must either be
provided, or process equipment must be designed to handle the periods of
higher flow, especially in smaller systems.
NITRIFICATION. As stated in a previous section, nitrifying bacteria be
come predominant in the attached biological growth in the latter stages where
carbonaceous matter in the waste water stream is low. The concentration at
which nitrifier populations become significant has been reported to be about
30 mg/i BOD or 50 mg/i COD (Antonie and Welch 1969). It is in these latter
stages that the oxidation of ammonia first to nitrite, and then to nitrate
nitrogen occurs . Although these biological reactions are consecutive, they
do proceed simultaneously within the same growth. The metabolic rate of the
ni t r i f yi ng biomass is relatively slow when compared to that of carbonaceous
removing biomass, and is not limited, at normal rotational velocities, by the
rate of diffusion of oxygen or ammonia into the slime. As such, the rate is
dependent upon real time rather than on contact time (Torpey, Heukelekian,
and Kaplovsky 1974).
DENITRIFICATION. Further removal of the residual nitrate nitrogen pro
duced from nitrification can be achieved by operating the rotating disc proc
ess under anaerobic conditions. An enclosed tank, equipped with discs which
are completely submerged in the waste water, is required in the process. A
carbon source, such as methanol, is added, promoting the growth of anaerobic
denitrifying bacteria to the surfaces of the discs. The denitrifying bac
teria reduce nitrates in the waste water to nitrites and then to nitrogen
gas which is exhausted to the atmosphere (Antonie 1975).
PURPOSE AND SCOPE
The purpose of this study was to develop criteria for the design and
operation of rotating disc units in treating domestic waste water in Hawaiian
and other tropical climates.
A large-scale pilot rotating disc treatment unit including primary clar
ifier and sludge storage was designed and constructed. The test unit was
operated at the 0.022 m3/s (0.5 mgd) City and County of Honolulu Pacific
Palisades Municipal Wastewater Treatment Facility using from 2.65 to 5.68
m3/day (700-1500 gpd) of degritted waste water from the main plant. Since

8
the main plant serves a residential area containing no industry, the results
obtained under the controlled conditions are believed to be reproducible
when treating any domestic waste water in Hawai'i.
The pilot unit was operated at four s~eady-state flow rates to deter
mine: (1) treatment characteristics on the basis of organic removal (bio
chemical oxygen demand, chemical oxygen demand, and total organic carbon),
solids removal (suspended solids), nutrient removal (nitrogen and phosphorus),
biomass generation (volatile suspended solids), sludge production (total
solids), and digestion (volatile solids removal); (2) energy requirements to
produce a level of treatment; and (3) operator skill requirements. To relate
the treatment capabilities of the unit to practical application in Hawai'i,
effluent quality was monitored in terms of biochemical oxygen demand, sus
pended solids, nitrogen, phosphorus, dissolved oxygen, and pH.
METHODOLOGYPilot Unit Description
The rotating disc treatment unit used for the field study is shown in
Figures 1, 2, and 3. The unit consists of a primary c1arifier,a four-stage
rotating disc treatment component, a final clarifier, and a sludge storage
basin. The overall dimensions of the stainless steel pilot unit are length,
1.83 m (6.0 ft); width, 1.22 m (4.0 ft); and height, 1.98 m (6 .5 ft). The
design hydraulic capacity is 3.785 m3/day (1000 gpd).
The primary clarifier operates as an Imhoff tank system and is housed
inside the sludge storage basin. This configuration allows for continuous
removal of the settled solids from the primary clarifier through gravity
flow. The 0.23-m 3 (62-gal) tank provides a detention time of 1.5 hr at the
design flow. The clarifier effluent discharges into the rotating disc sec
tion through a 0.04-m (1.5 in.) ID hose located 0.15 m (6.0 in.) below the
waste water surface level.
The rotating disc component consists of two 2-stage units, connected in
series, positioned in a parallel configuration as shown in Figure 3. The
waste water flow through the system is in a V-shaped pattern, with the system
effluent discharging into the final clarifier, aligned adjacent to the sludge
storage basin . Each of the four stages in the rotating disc section contains

FOUR- STAGE ROTATINGDISC COMPONENT---.,.
PERISTALTIC
FEED PUMP
FIGURE 1. ROTATING DISC TEST UNIT
INFLUENT
9

10
SIDE VIEW
Note: ft x 0.304 8 = m
I I I I I
--- I I I I II I I I II I I I II I I I II I I I II I I I II I I I II I I I I
--- I I I I I~'I.!r" - I I I ! I. ... J~.
~tT
4.5ft
I5.5ft
4.0 ft
II
III
IIIII
~ I~
~;.Oft- 10• 8711 ~1.5ft-j -j °i(I~ 1. 25 f t -r-- f t 2. 83ft
-r-r---~-;---r----'I""---',. .,.......FINAL
CLARIFIER
3.Z5ft- - JbE
SLUDGE STORAGE
FRONT VIEW ___L
FIGURE 2. PRIMARY CLARIFIER, FINAL CLARIFIER, AND SLUDGESTORAGE BASINS OF TEST UNIT

CHAIN
I\.
1.5 DiamHole
BEARING
1 in. SPACING DISC - SIDEWALL
3/4 in . SPACING DISC - DISC
1/8 in . DISC THICKNESS
44 DISCS
STAGE
2
t
~~t E ( D;am P;pe
1/24 ft
WATER LEVEL
DISC REACTION BASIN NOTE: ft x 0.304 8 = min. xO.025 4 = m
1
~
t3 3
.1 (0) Ii I (0) Ii
r
\ I
~
STAG
STAGE 4
I NFLUENT PORTEFFLUENT PORT Scale 1 in. = 1 ft
FIGURE 3. SCHEMATIC OF PILOT ROTATING DISC TREATMENT SECTION f-"f-"
12
eleven, 0.55 m (1.8 ft) diameter by 0.003 m (0.125 in.) thick, high-density
polyethylene discs. The discs are mounted on 0.02-m (O.75-in.) centers by
use of plastic spacers located on the shaft and at six locations along the
periphery of the discs ., The central stai~less steel shaft extends on either
end of the disc assembly and rests in self-aligning sealed bearings. The
two disc assemblies are placed, with shafts horizontal, into half-formed cy
lindrical stainless steel tanks so that about 40% of the disc diameter is
submerged into the waste water which passes through the tank perpendicular
to the discs. The contour of the half-formed cylindrical tanks containing
the waste water is such that a space of about 0.01 m (0.5 in.) is provided
between the periphery of the discs and the inside surface of the tank. Each
of the two parallel tanks is divided in the center by a plate creating the
two individual stages. A 0.04 m (1.5 in.) 10 hole located at about mid-depth
i n the divider plates, allows the waste water to move through connecting
stages along the rotating disc component. The total waste water volume
available in the the rotating disc section provides about 40 min of contact
time at the design flow.
Power is supplied to the discs by a variable speed l86.5-W (0.25 hp)
DC-motor which is mounted on the frame between the disc section and the pri
mary clarifier. Power is transmitted to a central shaft, mounted between
the two disc tanks, through a belt drive arrangement. The central shaft is
connected to each of the two parallel disc shafts through a gear and chain
drive system. With this arrangement, the two disc shafts may be rotated at
equal or different velocities through use of different size gears.
The fourth stage disc effluent enters the final clarifier through a
0.04 m (1.5 in.) 10 hose located at mid-waste water depth in the disc sec
tion. The rectangular-shaped final clarifier has a capacity of 0.23 m3 (62
gal) and provides 1.5 hr of detention during design flow. The final efflu
ent discharges from the final clarifier through a 0.08 m (3.0 in.) 10 circu
lar weir.
The sludge storage basin is designed to collect and hold the settled
primary and secondary solids through gravity flow. The 0.48 m3 (128 gal)
of basin capacity prov~des about 50 days of sludge storage at the design
flow. The configuration of the basin allows for continuous removal of the
gas produced from anaerobic digestion of the settled sludge, through the
0.65 m2 (7.0 ft 2) of basin surface area in contact with the atmosphere. Re-

13
moval of the settled and digested sludge may be accomplished through the
0.05 m (2.0 in.) ID port located at the bottom of the storage basin.
The test unit specifications are summarized in Table 1.
TABLE 1. ROTATING DISC UNIT SPECIFICATIONS
Primary clarifier, surface areaPrimary clarifier, volumeDisc-tank volume, gross
netDisc diameterDisc veloci tyNumber of stagesNumber of discs per stageTotal effect~ve disc areaFinal clarifier, surface areaFinal clarifier, volumefinal clarifi~r, weir )engthSludge storage basin, volume
Study Location
0.46 m2
0.23 m3
O. 11 m3
0.098 m3
0.55 m
41120.9 m2
0.37 m2
0.23 m3
6.24 m0.48 m3
(5.0 ft 2)
(62 ga 1)(30 gal)(26 ga 1)(1.8 f t )
(10.5 rpm)
(225 ft 2)
(4.0 ft 2)
(62 gal)(0.8 ft) ··
(128 ga 1)
The rotating disc treatment unit was constructed in a steel support
frame and covered with a 1.83 m (6.0 ft) wide by 2.13 m (7.0 ft) long wooden
roof. The disc sections were further protected from wind 'and rain by verti
cal wood panels located on the three outer sides of the disc component. The
treatment unit was located adjacent to the aerated grit chamber, within the
grounds of the City and County of Honolulu Pacific Palisades Municipal Waste
water Treatment Facility, as shown in Figure 4.
The present Pacific Palisades facility is rated at 0.02 m3js (0.5 mgd)
and includes two uncovered trickling filters, primary and secondary clari
fiers, anaerobi .c digester, and sludge drying beds. Plant sludge pumping and
digestion supernatant return are confined to the primary clarifier and di
gester complex only and do not affect the degritted raw waste water employed
as influent in this investigation. Initial installation of the test unit was
begun in March 1977, followed by a 4-mo period (March-June 1977) of operation
required for process debugging and modifications. Steady-state testing began
in late June 1977 and continued for 6 mo. During 1977, the main plant's raw
influent (upstream of the grit chamber), final clarifier effluent , and final
effluent following chlorination, had the average characteristics shown in
Table 2.
The test unit was fed with the degritted raw waste water through a 0.013
I

14
INTAKE
CHLORlNECONTACTCHAMBER PUMP SLUDGE .
HOUSE 1--------:-1
DROTATINGDISCPILOTUNIT
FIGURE 4. . PACIFIC PALISADES MUNICIPAL WASTEWATER TREATMENT FACILITY

15
TABLE 2. AVERAGE CHARACTERISTICS OF RAW INFLUEN~ FINAL CLARI FIER EFFLUENT, AND OUTFALL EFFLUENT OF THE CITY ANDCOUNTY OF HONOLULU PACIFIC PALISADES WASTEWATERTREATMENT FACILITY, HAWAI I, 1977
Parameter
Flow, mgdpH, unitsDO, mg/iTemp• , °cBODs, mg/iSS, mg/iTKN, mg/iTP, mg/iGrea se, mg/i~~
RawInfluent
8.03.2
200190
336.5
47
FinalClarifierEffluent
1.3
442731
Effluent atOutfa 11
0.4927.3
24.3
7.229
SOURCE: City and County of Honolulu (1977).*Chun et al e (1972).
m (0.5 in.) ID garden hose using a variable speed, peristaltic-type pump. A
2-stage screen system, a 0.006m (0.25 in.) mesh screen inside a 0.01 m mesh
screen, was developed for the feed line intake to reduce line and pump clog
ging. The system effluent was returned to the treatment system downstream
of the grit chamber.
Experimental Procedure
The field study investigated the removal characteristics of the treat
ment system under four steady-state hydraulic loadings ranging from 0.09 to
0.27 m3/day/m2 (2.25 to 6.7 gpd/ft 2) . The disc rotational velocity was main
tained at 10.5 rpm and depth of disc submergence was maintained at 40% of
the disc diameter throughout the field investigation . Waste water tempera
tures were also relatively constant, ranging from 27 to 2SoC during the study.
Waste water samples taken during the study were collected on a grab
basis at the following locations: (A) raw waste water influent line, (B)
primary clarifier effluent, (C) second stage effluent mixed liquor, and (D)
fourth stage effluent mixed liquor. Sample collection at locations B, C, and
D was staggered in accordance with the theoretical waste water detention
times at the various hydraulic loading rates in order to provide sample con
tinuity.
The analyses performed are listed in Table 3. Temperature, dissolved

16
oxygen, and pH measurements were conducted in the field. The remainder of
the analyses were performed in the laboratory. Sample transport from the
TABLE 3. SAMPLING AND ANALYSIS PROGRAM
PARAMETER
TemperaturepHDissolved oxygenBiochemical oxygen demand, 5-dayChemical oxygen demandTotal organic carbonTotal suspended sol idsTotal volatile suspended sol idsTotal Kjeldahl nitrogenNitrite nitrogenNitrate nitrogenTotal phosphorus
SAMPLINGPOINTS*
B,CB,C,DB,C,DA,B,C,DA,B,C,DA,B,C,DA,B,C,DA,B,C,DB,C,DB,C,DB,C,DB,C,D
FREQUENCY(per wk)
555II5222222
*A = Raw Influent, B = Primary Clarifier Effluent, C = SecondStage Effluent Mixed Liquor, D = Fourth Stage Effluent MixedLiquor.
field to the laboratory was made promptly following collection, with samples
stored in an ice chest during travel. All analyses performed on the samples
collected from the second and fourth stage effluent mixed liquor, sample lo
cations C and D (except temperature, dissolved oxygen, pH, and mixed liquor
suspended solids), were performed on sample supernatant following 0.75 to
1.0 hr of settling.
Analytical Procedures
Procedures employed in sample preservation were in accordance with the
methods outlined in Methods fo~ Chemical Analysis of Wate~ and Wastes (U.S.
EPA 1974). Procedures employed in sample analyses were in accordance with
the procedures outlined in Standa~d Methods (APHA, AWWA, and WPCF 1975), ex
cept for some modifications in total organic carbon, nitrite and nitrate ni
t~ogen, and total phosphorus.
Total organic carbon (TOC) was determined on a Dorhmann Total Organic
Carbon Analyser (Model DC-50). The unit was calibrated against high range
and low range (180 mg/~ and 40 mg/~, respectively) standards consisting of
an acidified aqueous solution of potassium hydrogen phthalate (KHP CsH s04K).
Sample TOC concentration was determined from a direct digital readout .
Nitrite and nitrate nitrogen analyses were performed on a Technicon

17
Autoanalyzer II equipped with a cadmium reduction column and a strip chart
recorder. The procedure listed in Met hods for Chemical Analysis of Water and
Wastes (U.S. EPA 1974, p. 207) was followed.
Total phosphorus analyses were also performed on a Technicon Autoanaly
zer II. Sample digestion was according to Standard Methods (APHA, AWWA, and
WPCF 1975,sec. 223C lII-Persulfate Digestion Method) and phosphorus deter
mination was performed in accordance with the method stated in Met hods for
Chemical Analysis of Water and Wastes (U.S. EPA 1974, p. 256).
Temperature and dissolved oxygen determinations were made on a YSI Model
57 Oxygen Meter. Meter calibration was performed on a weekly basis. Stan
dard Methods (APHA, AWWA, and WPCF 1975, sec. 2l8B-Azide Modification Method)
was the reference for the calibration.
A Photovol t pH Meter (Model 126A) was used for all pH "det ermi nat i ons .
The meter was calibrated on a weekly basis by use of buffer reference (pH
7.0 and 10.0) solutions.
Chemical reagent solutions used in the analytical determinations per
formed during the study period were performed on an as needed basis, none
earlier than March 1977. Comparison of results from analysis of samples
split between other laboratory personnel was used on two occasions during the
study period, to determine if any procedural errors were being committed.
None were found.
A Weston Watt Meter was used to measure the power required for disc ro
tation in the test unit. Measurement location was at the AC supply, prior
to the AC-DC converter-control unit. Measurements were performed (1) under
a "zero-load" situation to determine the power losses in the converter
control unit and in the drive motor, and (2) under several of the hydraulic
loadings to determine the energy requirements for the various levels of
treatment provided.
TEST RESULTS
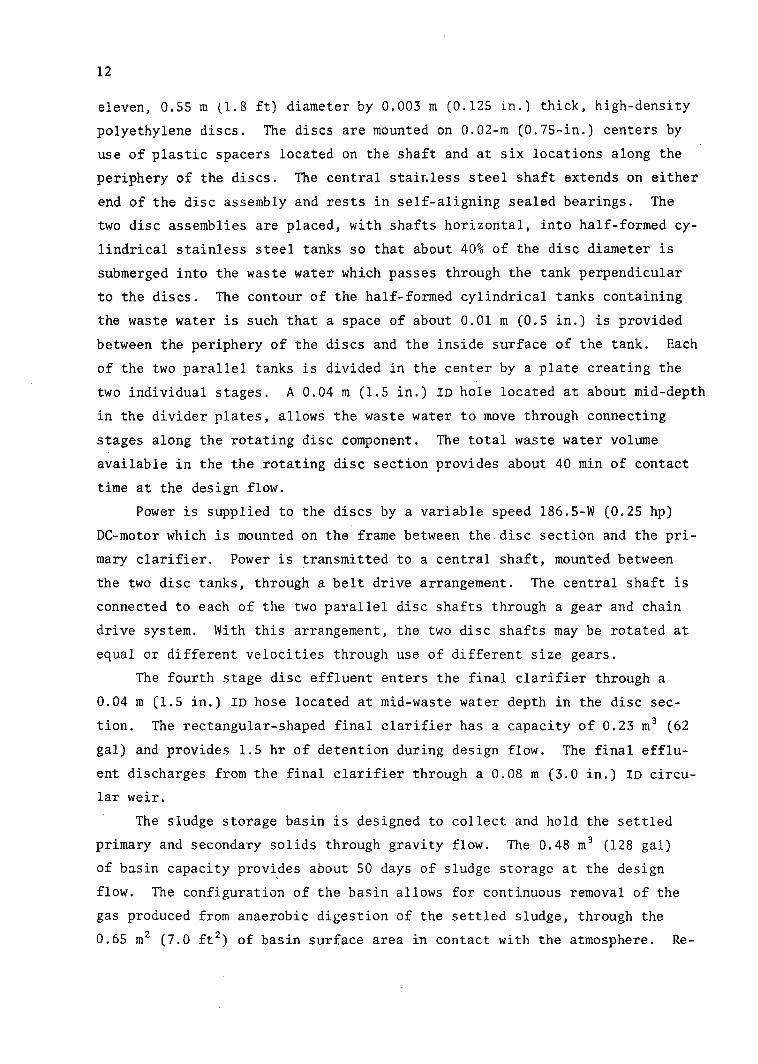
The test unit was operated for a period of at least 3 wk under each of
the four hydraulic loadings listed in Table 4. The resultant waste water
detention times in the disc section are also listed in Table 4. These were
the only process variables investigated during the study period. Disc rota
tional velocity was maintained at 10.5 rpm (0.3 mps or 1.0 fps peripheral
18
velocity) throughout the study. Influent waste water temperatures were rela
tively constant. 27 to 28°C, with ambient temperatures ranging from 16 to 29°C.
TABLE 4. HYDRAULIC LOADINGS AND DETENTION TIMES THROUGHTHE SECOND AND FOURTH DISC SECTIONS
TEST UNIT DETENTION TIME IN DISC SECTI ON
HYDRAULIC LOADING 1st Through 1st Through2d Stage 4th Stage
(m.3 Iday1m2) (tPd/ft2 ) (s) (hr ) (5) (hr)0.91 2.25) 2 340 (0.65) 4 680 0.3)1.22 (3.0) 1 692 (0.47) 3 348 (0.93)1.67 (4. 1) 1 224 (0.34) 2 448 (0.68)2.73 (6.7) 756 (0.21) 1 512 (0.42)
Data collected each day are presented in the Appendix. Arithmetic aver
ages of the data collected under each hydraulic loading are also presented in
the Appendix. With the exception of BODs. the averages were used to describe
the relat ionship between the respective parameters and loading (both hydraul
ic and organic). Hydraulic loading i s measured as the amount of waste water
flow per unit time per unit disc surface area. Organic loading is measured
as the weight of organic material per unit time per unit disc surface area.
Data from both the second- and fourth-stage effluents were used to develop
the correlations between the specific parameters and loading. The hydraulic
or organic loading on a surface area basis, corresponding to the second
stage is twice that which is applied to the four-stage test unit. Where ap
plicable. linear regression analysis by the least squares method has been
performed.
Test Unit ModificationsPrior to the start of the test period. a series of process modifications
were performed to the final clarifier basin to eliminate the "short-circuiting"
of raw waste water into the final clarifier . The modifications continued
until the final clarifier was completely bypassed.
As shown in Figure 2, the final clarifier and sludge storage facility
are hydraulically connected through an O.02-m (8-in.) opening running the
length of the clarifier. With this construction, the solids entering the fi
nal clarifier settle to the clarifier bottom and then continue into the
sludge storage basin due to the extreme slope of the clarifier basin. How
ever. this configuration also permits untreated waste water in the primary
clarifier and sludge storage basin to flow into the final clarifier and out

19
through the effluent weir, completely bypassing the rotating disc section.
The first attempt at stopping the "short circuiting" was by sealing
off the final clarifier from the primary clarifier and sludge storage ba
sins through installation of a rigid stainless steel plate bordered with
high-density neoprene rubber. This configuration proved to be unacceptable
for two reasons. First, daily removal of the plate was required to allow
for further settling of the accumulated solids into the sludge storage ba
sin. Second, complete sealing of the final clarifier from the sludge stor
age basin was never assured. Finally, the final clarifier was completely
bypassed through connection of the clarifier influent and effluent ports by
means of a 0.04 m (1.5 in.) ID PVC pipe. The position of the plate and by
pass pipe as they were during the test period are shown in Figure 5.
///
//
//
/
STAINLESSSTEEL FDlATE
IIIJ..
/ .....
/ ........../ .....
/ .........../ .....
/ ............./ ......
/ "//
/
FIGURE 5. MODIFICATIONS OF THE FINAL CLARIFIER

20
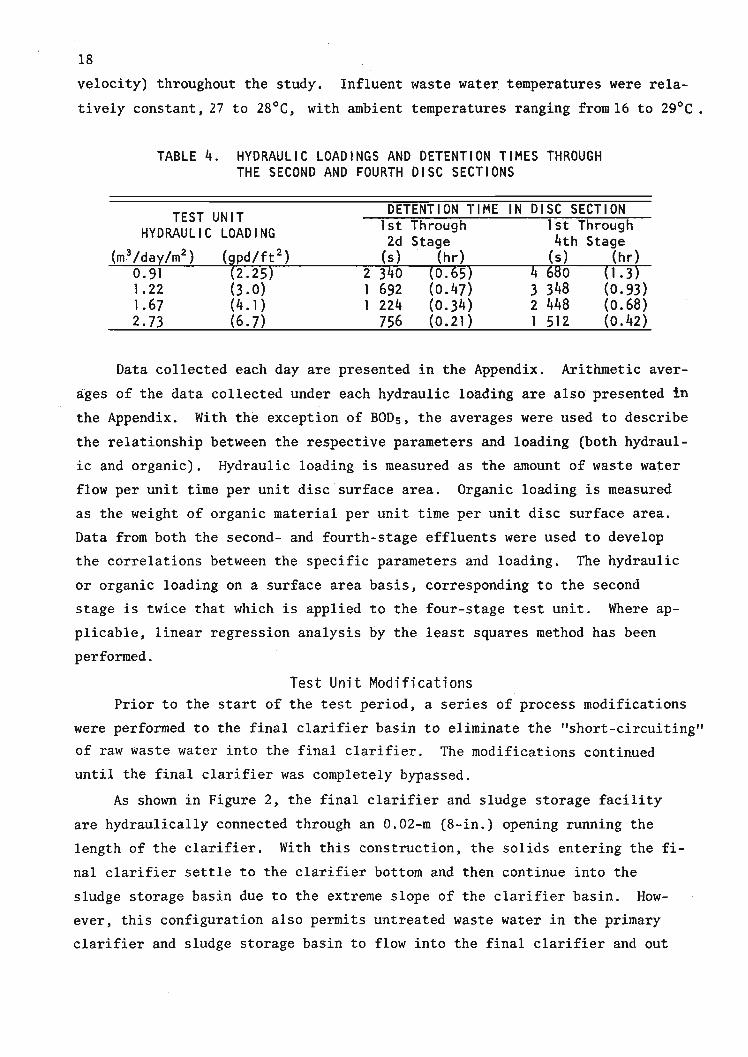
BODs Removal
Effluent BOD concentration, as a function of hydraulic loading is shown
in Figure 6. It was noticed that as the hydraulic loading decreases for
both the second-and fourth-stage effluent, the measured effluent BODs in
creases unexpectedly. This suggests the presence of significant interfer
ence in the BODs analysis, especially as the BODs concentration approaches
25 mg/~. This interference is assumed ·t o be the oxidation ' of ammonia nitro
gen present in the effluent, to nitrite-nitrate nitrogen.
In most waste waters the population of bacteria capable of nitrifica
tion is not large enough to create a signficant oxygen demand over the 5-day
incubation period of the BODs test. However, because nitrifying bacterial
populations develop in the rotating disc process, Antonie (1976) stated that
significant numbers are present in the effluent to produce a measurable oxy
gen demand during the BODs test period. Antonie (1974) determined that in
rotating disc effluents of less than 35 mg/~ BODs, about 50% of the measured
BODs is nitrogenous BOD.
Nitrification in the BOD analysis is effectively suppressed when the
effluent is disinfected with chlorine or ozone (Young 1969). Since effluent
disinfection is an integral part of an operational system, nitrogenous BOD
would have no effect on system performance evaluation nor would the effect
be considered in the system design. Removal of the nitrogenous BOD from the
test unit effluent BODs data is, therefore, thought to be necessary for ef
fective process eva1uation~
A two-step procedure was used to estimate the percentage carbonaceous
BOD present in the BODs concentrations measured for the second-and fourth
stage effluents. First, those BODs values for the second-and fourth-stage
effluent which were considered not to be affected by nitrification, were
correlated with corresponding COD and TOC values. A BODs was considered to
contain only carbonaceous BOD if no nitrite-nitrate nitrogen was detected in
the effluent sample. A correlation coefficient, r, of 0.92 and 0.87 ,vas re
spectively obtained in the BODs to COD and BODs to TOC correlations. The
sample size, n, for the correlation was 26 for the BODs to COD and 28 for
the BODs to TOC correlations.
In the second step, two sets of BODs values were . calculated, one each
from the BODs to COD and the BODs to TOC correlation equations. The corres-
21
70 ....---r--.-----,.------.--.----r--.---r---.--.---.--,----,----.----,.-----,
r
0.98
LINE EQUATION
Y = 4.51X + 0.77
• 2nd-Stage Effluent
o 4th-Stage Effluent
50
10
60
~<,enE 40~
z0
l-e:;(a::: 0l- •zUJuz 300u
•0
20
Note: Line is Fitted to Corrected BODs Values
0.65(16 )
0.57(14 )
0.49( 12)
(gpd/ft 2 )
0.41(10)
0.32(8)
0.24(6)
O. 16(4)
HYDRAULIC LOADING, m3/day/m2
0.08(2)
O'-----'-_--L-_'-----J..._...L-.---'_---'-_-'----'-_-'-_.L---J..._~_'------L.._'
o
FIGURE 6. MEASURED EFFLUENT BODs CONCENTRATION vs.HYDRAULIC LOADING

22
ponding BODs values from the two sets, BODcod and BODt oc' were averaged along
with the corresponding measured BODs value used in the initial correlations,
to produce the "corrected" BODs, BODcor r The BODcor r is defined only as a
measure of the carbonaceous BOD.
Table 5 lists the date (col. 1) and sample location (col. 2) of the mea
sured BODs (col. 3) and the corresponding TOC (col. 4) and COD (col. 5) val
ues used in the correlations. The BODs values calculated from the BODs to
TOC correlation equation (BODt oc)' and BODs to COD correlation equation
(BODcod) are respectively listed in columns 6 and 7, and the "corrected" BODs
values (BOD ,the average of cols. 3, 6, 7) are listed in column 8.corrThe BOD values listed in Table 5 are averaged according to hydrau-corr
lie loading condition and pres~nted along with the corresponding measured
BODs average values, in Table 6. The percentage of carbonaceous BOD in the
measured BODs values is shown to range from 100% at a corrected BODs concen
centration of 26 mg/~ to ~8% at a corrected BOD concentration of 13 mg/~.
This relationship is also shown in Figure 6, by comparing the measured BODs
values to the straight-line representation of the corrected BODs values.
The average corrected BOD values listed in Table 6 are used to describe
the relationship between BODs and loading and other parameters.
Figures 7 and 8 show percentage removal and effluent concentration for
BODs as a function of hydraulic loading. The BODs - loading relationships
(solid lines) in each figure are linear, with respective r values of 0.99
and 0.98. At a hydraulic loading of 0.18 m3/day/m2(4.5 gpd/ft2 ) , 85% BODs
removal was obtained by the disc section. An effluent BODs concentration of
30 mg/~ was obtained at a loading of 0.26 m3/day/m2 (6.5 gpd/ft2 ) , which
represents 85% overall removal when including primary treatment on an aver
age strength domestic was t e wat er .
Percentage BODs remaining i n the second-and fourth-stage effluents as
a function of theoretical detention time is shown in Figure 9. The relation
ship depicts a near constant rate of BODs removal in the rotating disc com
ponent, indicating that the removal of BODs approaches first order with re
spect to influent BODs concentration over the influent concentration range
experienced, 128 mg/~ to 170 mg/~. A definite decrease in BOD removal is
observed below 90% removal, or an effluent concentration of about 12 mg/~
BODs. The extremely high removal experienced during the first 12 min or
less of contact time is thought to be due to solids entrapment by the

23
TABLE 5. BODs, TOC, COD CORRELATION
Sample BOOsf - TOC COO BOOt * BOD d* BOD1977 Location oc co corr
---------------------(mg/i)---------------------(1) (2) (3) (4) (5) (6) (7) (8)
07/22 C 17 27.6 61 22 24 210 16 19.4 41 11 16 14
07/27 C 31 23.3 42 16 16 21D 33t:j: 17.2 35 8 13 11
08/02 C 34 21.2 44 13 17 21D 45'''t 9.9 29 (-) 2'+ 11 11
08/17 C 22 21.2 13 18D 39*:j: 15. 1 5 5
08/18 C 32.1 78 28 31 30D 22. 1 65 15 26 21
08/22 C 28 39.9 89 39 35 34D 49'\f 20.0 62 12 24 18
09/08 C 37 34.0 97 31 39 36D 22 22.6 54 15 21 19
09/29 C 40 34. 1 110 31 44 38D 17 23.0 56 16 22 18
10/06 C 27 29.4 64 24 25 250 17 19.6 43 11 17 15
10/13 C 27 34.7 82 32 33 31D 11 23.5 33 17 12 13
10/26 C 56 62.2 145 69 58 610 29 48.9 96 51 38 39
10/27 C 60 58.6 155 64 63 620 31 38.8 86 37 34 34
11/02 C 69 58.8 160 64 65 66D 29 "36. 6 86 34 34 32
11/05 C 60 55.2 150 59 60 60D 30 35.8 90 33 36 33
11/16 C 23 29.7 39 25 15 21D 13 21.9 24 14 19 15
11/30 C 29 31.1 78 27 31 29D 29*:j: 20.9 48 13 19 16
12/09 C 22 30.5 26 24D 29'''f 16.6 7 7
12/11 C 33.3 75 30 30 3012/15 C 23 34.0 52 31 20 25
D 17 19.9 26 12 10 13*Values averaged to determine BODcorrtExcluded from BODs:COD and BOOs:TOC correlation.
+Exc]uded from BODs average to determine BOD .corr

24
TABLE 6. AVERAGE BOD CONCENTRATION ACCORDING TO HYDRAULIC LOADING
SampleLocation
coCoCnCo
Four-StageHydraul ic Loading
(m 3/day/m2 ) (gpd/ft 2 )
0.092 (2.25)0.092 (2.25)O. 122 (3.0)0.122 (3.0)0.167 (4.1)0.167 (4.1)0.273 (6.7)0.273 (6.7)
Average Average PercentMeasured Corrected Carbona-
BODs BODs ceous BODs------~------(mg/~)-------------
26 24 9234 13 3824 26 10022 13 5933 33 10017 16 9462 62 10030 24 100
attached biomass.
COD and TOC Removal
Figures 7 and 8 also show effluent concentration and precentage removal
for COD and TOC as a function of hydraulic loading. As with the BODs corre
lations, the relationships between COD and TOC and loading are linear, with
r values ranging from 0.96 to 0.98.
At a hydraulic loading of 0.12 m3/day/m2 (3.0 gpd/ft 2) 85% COD removal
was obtained in the disc component. An effluent COD concentration of 75
mg/t was produced at a hydraulic loading of 0.25 m3/day/m2 (6.25 gpd/ft2 ) ,
which represents 85% overall removal when including primary treatment on an
average strength domestic waste water (COD of 500 mg/t).
Removal of TOC by the disc unit was considerably less than the corres
ponding removals of BOD and COD. A maximum removal of 83% was obtained at
the lowest hydraulic loading tested, 0.09 m3/day/m2 (2.25 gpd/ft2 ) . The
relatively low percentage removals through the disc component were a result
of the comparatively low concentrations of TOC (100-115 mg/t) present in the
primary clarifier effluent during the study period. An effluent TOC concen
tration of 30 mg/t was achieved at a hydraulic loading 0.18 m3/day/m2
(4.5 gpd/ft 2 ) , which represents an overall removal of 85% when treating an
average strength domestjc waste water (TOC of 200 mg/t).
The comparative removal of BODs, COD, and TOC in the primary clarifier,
rotating disc unit, and through the entire test unit is presented in Table
7. The comparisons were determined through a series of correlations usinglinear regression analysis.

90 <,-,, "'-'~ "B-
80 ~, ~
'~ "70 "'~
~~. ',-"60
'"",,,-' ',,,,-ex::> ',~0~LLI ,,~a:l- SOz "LLI <,Ua:
,LLI0- - BODs 2nd-Stage Effluent
40 0 BODs 4th-Stage Effluent
- COD 2nd-Stage Effl uent0 COD 4th-Stage Effl uent
• TOC 2nd-Stage Effl uent
30~ TOC 4th-Stage Effluent
20
Symbol Parameter Equation r--0 BODs Y = 2.53X + 96.4 0.99
10 --0 COD Y = 3.23X + 94.3 0.98---~ TOC Y = 3.03X + 89.5 0.96
00 0.08 0.16 0.24 0.33 0.41 0.49 0.57 0.65
(2) (4) (6) (8) (10) (12) (14) (16)
HYDRAULIC LOADING, m3/day/m2 (gpd/ft 2)
FIGURE 7. PERCENT BODs, COD, AND TOC REMOVAL vs.HYDRAULIC LOADING
25

26
100
/0 I.I
80 / , '-
.BODs 2nd-Stage Effluent
Io BODs 4th-Stage Effluent• COD 2nd-Stage Effluent
/o COD 4th-Stage Effl uent6- Toe 2nd-Stage Effl uent& TOe 4th-Stage Effl uent
~ I<, /Cle ·1 /~ 60 • /
z~0
Il-e:( /a:: '/l-
Iz yoLIJU ~z I 00
0u
I- Az /LIJ h::) 40..J /LL.
/ c: /LL.LIJ 0/ ~
A/
/0
/ •/
/ ~/
/.
I /~
20 ~.LS
//
SYMBOL PARAMETER EQUATI ON r
-0 BODs y = 4.51X + 0.8 0.98--0 COD Y '" 10.3X + JO.9 0.97---6- Toe Y '" 3.56X + 10.5 0.98
00 0.08 0.16 0.24 0.32 0.41 0.49 0.57 0.65
HYDRAULI e LOADING, m3/day/m2
FIGURE 8. EFFLUENT BODs, COD, AND Toe CONCENTRATIONSV5. HYDRAULIC LOADING

27
100\\
80 \\\\\
60 \\,,
\\
40 " • 2nd-Stage Effluent, o 4th-Stage Effl uent
c.:lzz~::I:UJ0:::
'" 2000CD
I-zUJU0:::UJa..
10
8
6
7020 30 40 50 60THEORETICAL DETENTION TIME, min
104'---__....L.-__-L-__---L L.-__-'---__-L-__---L__----J
o
FIGURE 9. PERCENT BOD 5 REMA INING vs. THEORET ICALDENTENTION TIME

28
TABLE 7. COMPARATIVE BODs, COD, AND TOC REMOVAL
TREATMENT PROCESS
Primary ClarifierRotating DiscOverall
REMOVALTOC/BOD s
0.260.740. 1.6
(mass unit/mass unit}COD/BODs TOC/CODs
1.7 0.152.4 0.342.0 0.24
Suspended Solids Removal
Suspended solids removal through the primary clarifier ranged from 22
to 54%, with primary effluent suspended solids concentrations ranging from
150 mg/~ to 80 mg/~ when hydraulically loaded at 4.1 to 12.2 m3/day/m i (100
300 gpd/ft 2 ) of clarifier surface area, with detention times of 1 to 3 hr.
The test unit effluent suspended solids concentration as a function of
disc-section hydraulic loading is shown in Figure 10. The correlation is
strongly linear, with a r value of 0.98. An effluent suspended solids con
centration of 20 mg/~ was obtained at a loading of about 0.24 m3/day/m2 (6.0
gpd/ft 2 ) . The 20 mg/~ SS concentration corresponds to an average removal of
from 76% to 87% through the disc section and about a 90% overall removal.
Staging appears to have no effect on suspended solids removal.
Mixed liquor solids present in the disc effluent are comprised of two
types, dense, filamentous solids sloughed from the disc media, and small,
fine solids. The fine solids are found in the influent waste water and are
removed from the mixed liquor by the attached biomass. The amount of fines
present in the mixed liquor decreases with increased level of treatment.
Solid removal through final settling is dependent upon the amount of fines
present in the mixed liquor, as the sloughed solids settle rapidly, from
0.1 to 0 .3 m/s (0.3-1.0 fpm). Based on these observations, the removals re
ported are considered comparable to removal obtainable in a clarifier unit
providing a detention time of about 45 min.
The suspended solids in the disc effluent exhibited other interesting
characteristics. During the initial debugging period of operation, the fi
nal clarifier was operated with the bottom sealed off to prevent short cir
cuiting. Operated in this manner, the mixed liquor suspended solids would
first settle to the clarifier bottom, then after a period of 1 or 2 days,
would rise to form a dense layer of scum on the surface of the clarifier due

29
50~<,01
• 2nd-StageE Effluent~ o 4th-Stage Effluentz
0-I- 40ex:IX:I-Zl.LJUZ0U
II)
Cl30
-J0II)
Cll.LJCl •Zl.LJa..II)
::> 20II)
I-Zl.LJ::>-JI.L.I.L.l.LJ LI NE EQUATI ON r
10 0Y = 3.49X - 1.3 0.98
0.57 0.650.16 0.24 0.33 0.41 0.49HYDRAULIC LOADING, m3/day/m2
0.08OL.---L._..L.-_.L..---L_-'-_-'------I'-.---!-_...L-----I'-.---'-_..L.-_.J-----L--'----J
o
FIGURE 10. EFFLUENT SUSPENDED SOLIDS CONCENTRATIONvs. HYDRAULIC LOADING

nitrogen removal asa function of hydraulic loading is
At a hydraulic loading of 0.18 m3/day/m2 (4.3 gpd/ft2),
was produced, about a 25% Kjeldahl nitrogen decrease was
30
to biological flotation. Suspended solids concentrations in the clarifier
effluent during this operation averaged 19 mg/i at a disc hydraulic loading
of 0.09 m3/day/m2 (2.25 gpd/ft2) and a clarifier loading of 5.3 m3/day/m2
(130 gpd/ft2 ) . This is about twice the concentration obtained from batch
settling of the clarifier influent at the same operating conditions. A ma
jority of the suspended solids in the clarifier effluent were observed to be
large, filamentous solids surfacing behind the effluent baffle. It is
thought that these surfacing solids could be eliminated from the effluent
with the incorporation of an alternative baffle design., Although data are
limited, the use of flotation for mixed liquor solids separation is worth
further investigation.
Total Kjeldahl Nitrogen Removal
Total Kjeldahl
shown in Figure 11.
where a 20 mg/i BOD
achieved.
A maximum removal of 62% was obtained at the 0.092 m3/day/m2 (2.25
gpd/ft2) hydraulic loading, producing an effluent with 14 mg/i TKN. Of this,
an estimated 80% is ammonia nitrogen.
The 15 to 25% TKN removal experienced when BOD concentrations are
greater than 20 to 30 mg/i, is attributed to cell synthesis in the filamen
tous biomass. Average removal of 0.05 mass unit TKN per mass unit BOD re
moved was obtained through cell synthesis. At BOD concentrations below this
range, TKN removal increased as the ammonia nitrogen fraction began to be
removed through nitrification. The increase in nitrification as the hydrau
lic loading and subsequent BOD concentration decreased is graphically shown
in Figure 12. Nitrification is shown to begin in the test unit at a hydrau
lic loading of about 0.26 m3/day/m2 (6.5 gpd/ft2), and follows closely the
calculated straight line.
Total Nitrogen Removal
Total nitrogen removal did not exceed 25%, and the concentration in the
(tes~unit effluent was not less than 28 mg/i under any of the test conditions.
Total nitrogen removal was accomplished primarily through cell synthesis

31
80• 2nd-Stage Effluent
-I o 4th-Stage Effluent«>02: 60UJa::z~........z 40UJua::UJe,
• •20•
0.08 0.16 0.24 0.33 0.41 0.49HYDRAULIC LOADING, m3/day/m2
FIGURE 11. PERCENT TKN REMOVAL V5. HYDRAULIC LOADING
0.57
• 2nd-Stage Effluento 4th-Stage Effluent
r
0.98
LINE EQUATI ON
Y • wO.15X + 0.96
0.8
VlVl«2:<,oUJu;:)
ooa::c,
zUJg 0.6Ill:....
OL.-.--I._-.L._-'-_....I-_...1.-_!--_L....---I._--L._-'-_....I-_..L.-~oU;l.---'_-..J
o 0.04 0.08 0.12 0.16 0.20 0.24 0.28
HYDRAULIC LOADING, m3/day/m 2
FIGURE 12. TKN CONVERSION RATIO V5. HYDRAULIC LOADING
zoUJ
",>~~ 0.4I UJNa::
ozz~........
zz 0.2;:)-
VllVl«z:1:;:)

32
and settling. The removal limits of 25% and 28 mg/~ concentration in the
effluent are imposed by formation of nitrite and nitrate nitrogen from ammo
nia nitrogen by nitrifying organisms.
No correlation was found to exist between hydraulic 'loading and nitro
gen removal.
Phosphorus Removal
Total phosphorus removal was relatively constant ranging from 5 to 15%
throughout the test period. On the average, 0.01 mass unit phosphorus was
removed per mass unit BOD removed. Of this, an average of 90% occurred in
the initial two stages where biological activity was the greatest. Total
phosphorus concentration in the effluent averaged about 7 mg/~ throughout
the study period.
Sludge Production
In the test unit, sludge was produced through (1) the settling of
coarse solids from the raw waste water in the primary clarifier, and (2) the
sloughing of excess biological growth from the rotating discs . The sloughed
biological solids remained suspended in the disc section mixed liquor and
were removed through settling in a separate basin.
The solids removed through settling in the primary clarifier basin ac
cumulated in the sludge storage basin where solids thickening and anaerobic
digestion occurred. The storage basin sludge was analyzed and found to con
tain 70% volatile solids and 2.5% solids (by weight). This amounts to a
volatile solids destruction in the storage basin of about 20% over the 6-mo
study period. With this rate of volatile solids degradation and solids
thickening, the storage facility could possibly need draining only on a ba
sis of once or twice a year when loaded with only primary solids at design
flow.
Sludge produced from the rotating disc process is mainly a function of
the rate of biological growth on the disc media. Observations of the disc
media during operation of the test unit showed the media to be covered by
two distinct types of growth. The initial stage(s) were covered bya dark
gray filamentous growth 0.004 to 0.008 m (0.15-0.30 in.) in length, while
the latter stage(s) under all hydraulic loadings except the 0.27 m3/day/m2
(6.7 gpd/ft 2 ) loading, were covered by a brown growth of about 0.001 m (0.04
in.) in length. The two types of biological growths are shown in Plates 1

33
and 2. The filamentous growth was thought to be responsible for practically
all of the BOD removal experienced in the disc component. The percentage
cover of the two types of growth is listed in Table 8 for the four loadings
tested. The filamentous growth found in the initial stages was much more
dense than the shorter brown biomass. The decreased density is probably due
to slower growth rates and increased predation. Due to its short length.
the brown biomass does not slough from the media and. thus. does not contri
bute to the net generation of biomass or the production of sludge.
TABLE 8. MEDIA COVERAGE
HYDRAULIC(m 3/day/m2 )
LOADING(gpd/ft 2 )
PERCENTAGE DISC COVERCarbonaceous Removing Nitrifying
Biomass Biomass
0.090.12o. 160.27
(2.25)(3.0)(4.1)(6.7)
37.562.575
100
62.537.525a
Net biomass generation by the test unit was estimated by the concentra
tion of volatile suspended solids in the fourth stage effluent. This assumes
that total removal of VSS present in the influent waste water through stage
four has occurred. and that the VSS in the effluent are only filamentous bio
mass. Dividing this by the decrease in BOD concentration through the test
unit yields biomass generation as biomass generation per unit BOD removed.
Biomass generation as pounds biomass generated per day was calculated simi
larly.
Biomass generation was almost constant in the test unit. This is shown
in Figure 13, where biomass generation per unit mass BOD removed is presented
as a function of hydraulic loading. Biomass generation averaged 0.45 mass
unit per mass unit BODs removed .
Sludge production by the disc component was calculated by subtracting
the suspended solids concentration in the mixed liquor supernatant. following
batch settling. from the suspended solids concentration in the mixed liquor
prior to batch settling. This difference represents the amount of solids
which are estimated to have settled in a clarifier. Dividing this by the de
crease in BODs removed.
Sludge production from both the second and fourth stages. as a function
of hydraulic loading is presented in Figure 14. At a hydraulic loading of

34
PLATE 1. FIRST-STAGE FILAMENTOUS BIOMASS
PLATE 2. FOURTH-STAGE NITRIFYING BIOMASS AT HYDRAULICLOADING OF 0.12 m2/day/m2

35
.
o
I
o 0
LINE EQUATION r
Y • 0.005X + 0.43 0.31
o
1. 0r-----,----,.---,-----r---r-----,---'----f
.Z:::l
~ 0.8«~<,ClUJ.-~ 0.6UJzUJt:I
VlVl
~ 0.4o-0CDUJ
.-~-x:~~0.2
0.04 0.08 0.12 0.16 0.20 0.24 0.28
HYDRAULIC LOADING, m3/day/m2
FIGURE 13. BIOMASS GENERATION V5. HYDRAULIC LOADING
Cl 1.0UJ>0x:UJa::
~ 0.80CD
.-Z:::l 0.6Vl •Vl-c 0~ •<,Cl 0 0UJu 0.4 0:::lCl •0a::c,
• 2nd-Stage Effl uento 4th-Stage Eff1 uent
•UJ
g 0.2:::l..JVl
LINE EQUATION rY = -0 .004x + 0.48 0.17
0.08 0.57
36
0.18 mS/day/m2 (4.3 gpd/ft 2) , corresponding to an effluent aOD concentration
of 20 mg/i, 0.40 to 0.50 mass unit of sludge was produced per mass unit BOD
removed. This corresponds very well to Figure 13.
Mixed Liquor Characteristics
The average values for pH, dissolved oxygen concentration, and tempera
' t ur e for the disc influent, and second~and fourth-stage mixed liquor efflu
ent are summarized in Table 9.
Mixed liquor pH increas~d slightly to a range of 7.2 to 7.4 in stages
where oxidation of carbonaceous matter occurred and decreased slightly to a
low of 7.0 in stages where nitrification occurred. Effluent pH varied from
7.0 to 7.3.
The dissolved oxygen concentration increased from near zero in the disc
section influent to a range of 1.2 to 3.8 mg/i in the second-stage effluent.
Stage four effluent dissolved oxygen concentration ranged from 2.8 to 4.2
mg/i. Mixed liquor dissolved oxygen concentration increased with decreased
hydraulic loading.
Disc influent waste water temperature ranged from 27°C to 28°C during
the test period. A 1 to 3QC decrease in temperature occurred through
stages one and two depending on detention time. A similar decrease in tem
perature is expected in stages 'three and four due to evaporation.
Maintenance and Power Requirements
The major maintenance requirement of the treatment system was for the
feed system. Cleaning of solids from the intake screens and conduit, and
replacement of the Tygon tubing section in the peristaltic feed pump due to
wear, was required daily. Monthly greasing of disc shaft support bearings
and oiling of drive motor was also required. Drive motor brushes were re
placed once during the test period. Removal of scum from the sludge storage
basin was pe rformed about twice a month to minimize the nuisance of flies
and fly larvae . This problem could have been corrected by covering the
sludge storage tank with covered exhaust ports included in the tank cover to
allow gas produced from digestion to escap~ .
Power requirements for operation of the test unit include operation of
the feed pump and rotation of the discs. Requirements for disc rotation only
are used in correlation with material removal. All four stages were operated

37
TABLE 9.. AVERAGE MIXED LIQUOR CHARACTERISTICS
Samp leDissolved
Hydraul ic Loading Oxygen Temp . pHLocat ion (m3/day/m2
) (gpd/ft 2) (mg/ R,) COC) (units)
B 0.09 (2.25) 0.0 27 6.8C 3.8 24 7.3D 4. 1 7.0
B 0.12 . (3.0) 0.1 27 6.9C 2.8 26 7.4D 4.2 -.,. 7.3B 0.16 (4.1) O. 1 28 6.7CD 1.8 27 7.2
3.5 7.2B 0.27 (6.7) 0.2 28 7.0C 1.2 27 7.3D 2.8 7.3
at a disc speed of 10.5 rpm by the 186.5 W (0.25 hpJ variable speed DC motor .
The net amount of energy required to rotate the disc media was found to
range between 32.8 W (0.044 hpJ and 44.8 W (0.060 hpJ. At the disc rotation
al speed of 10.5 rpm about 0.30 kg (0.67 lb)BODs were removed per joule
(hp-hr) or 0.08 kg BOOs/J (0.41 kg BOOs/kW-hr) for an 88% BODs removal
through the rotating disc treatment component, yielding an effluent concen
tration of 16 mg/R, BODs. This power consumption converts to 1.13 J/m 3 (1.6
hp-hr/lOOO gal) of waste water treated.
Although the inefficiencies of the drive motor were eliminated from the
power consumption values reported, the revolution rate of the drive motor
was stepped· down through the different pulleys and gears used in the drive
train. The "step-down" is known to reduce the overall efficiency of the
drive train, however, the extent of this reduction is not known.
COMPARISON TO PREVIOUS ROTATING DISC PROCESS EXPERIENCE
Previous pilot testing of rotating disc systems on municipal waste
water in the United States was conducted at the Jones Island Sewage Treat
ment Plant of the Milwaukee Metropolitan Sewage Commission (Autotrol Corpor
ation 1971) and at the Village of Pewaukee, Wisconsin Municipal Wastewater
Treatment Plant (Allis-Chalmers 1969). Both of these tests were conducted
38
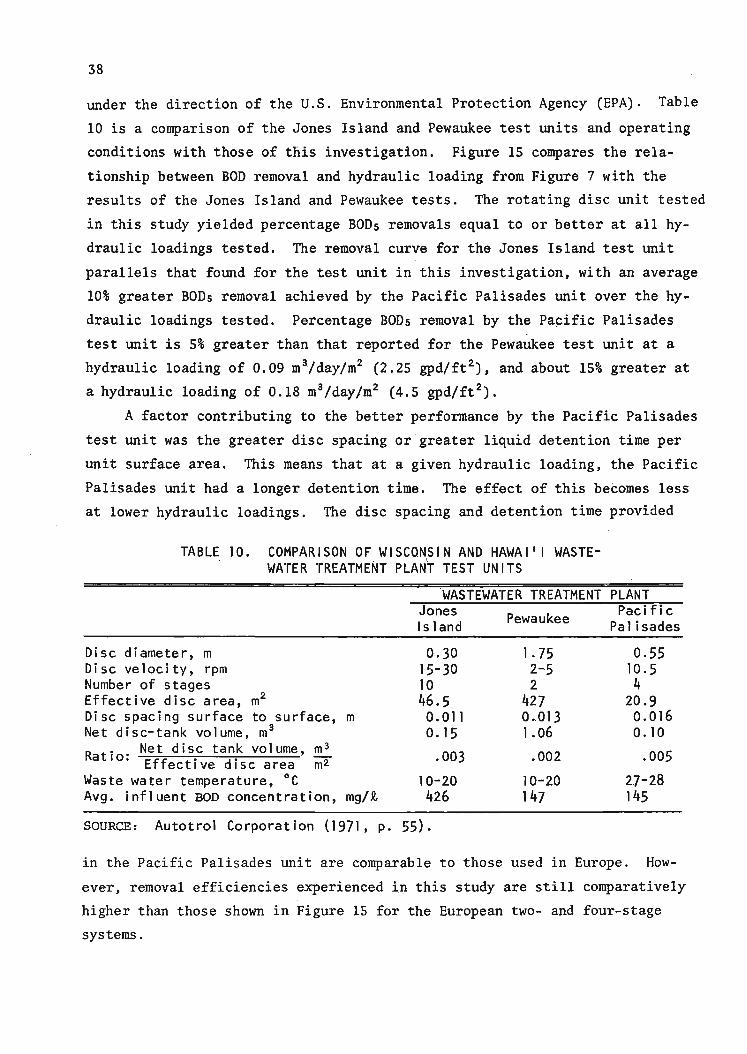
under the direction of the U.S. Environmental Protection Agency (EPA). Table
10 is a comparison of the Jones Island and Pewaukee test units and operating
conditions with those of this investigation. Figure 15 compares the rela
tionship between BOD removal and hydraulic loading from Figure 7 with the
results of the Jones Island and Pewaukee tests. The rotating disc unit tested
in this study yielded percentage BODs removals equal to or better at all hy
draulic loadings tested. The removal curve for the Jones Island test unit
parallels that found for the test unit in this investigation, with an average
10% greater BODs removal achieved by the Pacific Palisades unit over the hy~
draulic loadings tested. Percentage BODs removal by the Pacific Palisades
test unit is 5% greater than that reported for the Pewaukee test unit at a
hydraulic loading of 0.09 m3lday/m2 (2.25 gpd/ft 2), and about 15% greater at
a hydraulic loading of 0.18 m3/day/m2 (4.5 gpd/ft 2) .
A factor contributing to the better performance by the Pacific Palisades
test unit was the greater disc spacing or greater liquid detention time per
unit surface area. This means that at a given hydraulic loading, the Pacific
Palisades unit had a longer detention time. The effect of this becomes less
at lower hydraulic loadings. The disc spacing and detention time provided
TABLE 10. COMPARISON OF WISCONSIN AND HAWAII I WASTE-_ I
WATER TREATMENT PLANT TEST UNITS
WASTEWATER TREATMENT PLANTJones PacificPewaukeeIsland Palisades
Disc diameter, mDisc velocity, rpmNumber of stagesEffective disc area, m2
Disc spacing surface to surface, mNet disc-tank volume, m3
R t · Net disc tank volume, m3
a 10: Eff . d i -2ec t l ve ISC area mWaste water temperature, °cAvg. influent BOD concentration, mg/~
0.3015-301046.50.011o.15
. 003
10-20426
1. 752-52
4270.0131.06
.002
10-20147
0.5510.54
20.90.0160.10
.005
2.7-28145
SOURCE: Autotrol Corporation (1971, p. 55).
in the Pacific Palisades unit are comparable to those used in Europe. How
ever, removal efficiencies experienced in this study are still comparatively
higher than those shown in Figure 15 for the European two- and four-stage
systems .

39
100 .----.----,.....----r----,.....---.,...---.....---.,.----....-----,
90
I/)
g 70CD
Izwua:: 60w0...
50
TREATMENT PLANTS
1 Pewaukee, Wisconsin2 Jones Island, Wisconsin3 Europe (Four-Stage)4 Europe (Two-Stage)5 Pacific Palisades, Hawaii (from Fig. 7)
40 0 0.04 0.08 0.12 0.16 0.20 0.24 0.28 0.33 0.37HYDRAULIC LOADING, m3/day/m2
FIGURE 15. BODs REMOVAL COMPARED TO PREVIOUS TESTING INUNITED STATES AND EUROPE
Increased removal efficiency due to increased waste water temperatures
may also be present, especially when the temperature of the waste water
treated by the Pewaukee and Jones Island test units approached the 10°C tem
perature reported. The removal efficiency of the Pewaukee test unit was re
ported to decrease below that shown in Figure 23 when waste water tempera
tures were less than 10°C. On the other hand, Antonie and Hynek (1973),
Autotrol (1974), and Bio-Shafts (1977) state that BODs removal efficiency is
not significantly improved by waste water temperatures above 13°C. On this
basis, it would seem that the major advantage of the higher waste water tem
peratures in Hawai'i is that it is nearly constant year around. Waste
water temperatures do not drop to levels which affect adversely the perfor
mance of the attached biomass, as is experienced during the winter months in
northern climates. Because of this uniform warm waste water temperature,
rotating disc systems constructed for Hawai'i and other tropical climates
may be accordingly designed. This generally results in providing about half
the amount of disc surface area as required for a comparative installation
located in the northern section of the United States.

40
Additional savings in construction costs can be attributed to the warm
climates of Hawai'i. The savings are due to the elimination of insulation
in the disc section covers. Only a thin fiberglass or wooden cover is neces
say to protect the attached growth from the elements. The BODs removal kine
tics shown in Figure 9 for the Pacific Palisades test unit agree with those
reported by Allis Chalmers (1969) for Jones Island and by Autotrol Corporation
(1971) for Pewaukffe and demonstrate that the rotating disc process is first
order with respect to BODs influent concentration in a range from 128 mg/£
at least up to 426 mg/£ BODs for municipal waste water. This removal rela
tionship means that a specific removal of BODs will occur regardless of in
luent BODs concentrat ion. Because of this, the principal design criterion
for the rotating disc process is hydraulic loading, expressed as flow per
unit time per unit of surface area covered by biological growth.
The comparatively greater treatment efficiencies experienced in this
study at the higher hydraulic loadings are partially due to the greater de
tention times supplied by the relatively larger tank volumes used in this
study. It would seem that additional tank volume included in the design of
small scale systems (for comparable disc media area) would provide liquid
detention times of sufficient duration to produce acceptable treatment even
during periods of peak flow. As shown in Figure 9 a BODs removal of about
80% could be maintained during periods of peak flow if a liquid detention
time of 25 min was maintained in the disc section during peak flow (assuming
20% BODs removal in the primary clarifier). In other larger systems where
minimal flow fluctuation occurs, or equalization is provided, smaller tank
volumes, which provide relatively shorter liquid detention times , could be
used to minimize costs.
Sludge production by the test unit is comparable to production levels
reported by Antonie (1972, 1974) and by Winkler and Welch (1974). The 0.4
to 0.5 mass unit sludge produced per mass unit BODs removed in the disc com
ponent of the Pacific Palisades test unit is within the range of 0.4 to 0.65
mass unit sludge/mass unit BODs removed reported in the literature.
Power consumption by the Pacific Pal isades test unit was considerably
higher than consumption values reported in the literature. For an 87% BODs
removal and an effluent BODs concentration of 20 mg/£, power consumption at
the Pewaukee pilot facility was reported by Antonie, Kluge, and Mielke (1974)
to be 1.18 J/kg (0.2 hp-hr/lb) BODs removed. This is 7.5 times lower than

41
the 8.87 J/kg (1.5 hp-hr/lb) BODs removed required by the Pacific Palisades
test unit. The better efficiency of the Pewaukee test unit may be due to
the larger diameter discs used, and, thus, the slower rotational speed (3.2
rpm compared to 10.5 rpm) required to produce a peripheral velocity of 0.3
m/s (1.0 fp~. Although the inefficiencies of the drive motor were eliminated
from the consumption values reported by both systems, the consumption values
reported for the Pacific Palisades test unit contained the inefficiencies
from the step-downs used in the drive train.
COMPARISON WITH THE ACTIVATED SLUDGE TREATMENT PROCESS
An economic comparison between the rotating disc and activated sludge
treatment processes was performed. The comparison included in-place equip
ment costs and operational energy requirements for two small-scale sewage
treatment systems, which are thought to be characteristic of a suburban de
velopment and a high density resort found in Hawai'i. System A was 94.5-m3/
day (25,OOO-gpd) facility, corresponding to a l25-bedroom resort development,
and System B was a 378-m3/day (lOO,OOO-gpd) facility, corresponding to a
600-bedroom suburban development (State of Hawaii 1973).
The treatment systems were designed to effectively treat domestic sewage
for ultimate disposal by injection well, on land areas adjacent to waters
classified by the Hawaii State Department of Health (1974) as Class 2, Class
B, or near-shore Class A. As such, the Department of Health's PubZic Hea lth
Regulations (1973, chap. 38) require 85% removal of BODs and suspended sol
ids. Average influent waste water concentration values for BODs and suspen
ded solids, and flow patterns of the raw waste water entering both systems
were selected from two sewage treatment plant performance evaluation pro
grams performed by Gray, Rhee and Associates, Inc. (1973, 1978), which were
submitted to the Department of Health. The evaluation programs were per
formed on the 16.7 m3/day (4400 gpd) sewage treatment facility serving the
resort condominium, Pohailani, located on Maui Island, Hawai'i, and on the
407 m3/day (107,600 gpd) sewage treatment facility located at Kulana Village
in 'Ewa Beach on the island of O'ahu, Hawai'i. The Pohailani data were
used as raw waste water data for System A, and the Kulana Village data were
used as raw waste water data for System B.

42
Process Description
ROTATING DISC SYSTEMS . . The rotating disc treatment systems consist of
a primary clarifier, a four-stage rotating disc treatment unit, a final clar
ifier, a chlorine contact chamber, and a primary and secondary sludge storage
basin. A schematic diagram of the system is shown in Figure 16, and the spe
cifications for Systems A and B are listed in Table 11.
The primary clarifiers were designed to operate as Imhoff tank systems,
very similar to the design used in the test unit investigated in this study.
The rectangular-shaped steel clarifier basins were designed to provide a de
tention time of about 2.5 hr at design flow, and a maximum surface loading
of 24.4 m3/day/m2 (600 gpd/ft2 ) as recommended by Metcalf and Eddy, Inc.
(1972) .
Surface area requirements "f or the four-stage rotating disc treatment
systems were based on hydraulic loading. Assuming 25% BODs and 50% suspended
solids removal in the primary clarifier, an 80% BODs and 70% suspended solids
removal was required through the rotating disc section to acheive 85% overall
removal. Final effluent concentration limitations in System A were 50 mg/t
BODs and 39 mg/~ suspended solids (SS), and in System B were 36 mg/~ BODs and
28 mg/t SS. From Figures 7, 8, and 10, the design hydraulic loading was
found to be produced by the 80% BODs removal criterion as found in Figure 7
of the percent BODs, COD, and TOC removal versus hydraulic loading. The
design hydraulic loading for both systems was 0.26 m3/day/m2 (6.5 gpd/ft 2 ) .
Commercially available, fully assembled rotating disc media manufactured
by the Autotro1 Corporation (1974) was selected for the systems based on the
disc media surface area design value determined from Figure 7 and liquid de
tention time as shown in Figure 9. The "Bio-Module Shafts" selected, include
four-stage rotating disc media and a rotating bucket feed mechanism mounted
on a horizontal shaft along with shaft bearings and drive system as shown in
Figure 17.
The rotating disc treatment unit selected for System A was a four-stage
2.0-m (6.6-ft) disc diameter, Bio-Module Shaft, Model 622-104, with an effec
tive disc media area of 734 m2 (7900 ft 2) . At design flow, the unit pro
vides a hydraulic loading of 0.13 m3/day/m2 (3.2 gpd/ft 2 ) . Based on hydrau
lic loading a Bio-Modu1e Shaft with an effective disc surface area of 409 m2
(4,400 ft 2) would have supplied sufficient treatment at design flow . How
ever, based on liquid detention time the system would not have supplied ade-

43
OUTLET ,-,-
CHLORINE CONTACT
CHAMBER
C;,::::
...... SLUDGEFINAL ~~
SCRAPERCLARIFIER ......
PACKAGEr;;;~
SYSTEM ~
~l=
++
CLARIFIER
ADDITIONAL
--H----------1__ _ ..J
r---------------,I
==T:;:~===~
ADDITIONAL
ROTATI NG DISC
ROTATING DISCPACKAGE SYSTEM
SLUDGE"l, 1-------, IRETURN L L--=-J
rC G--l.c ~UI ~ FEED
--------: CHAMBER
INLll
PRIMARY CLARIFIER
SLUDGE STORAGE BASIN I--
FIGURE 16. SCHEMCATIC DIAGRAM OF ROTATING DISC TREATMENT SYSTEM

44
TABLE 11. SPECIFICATIONS FOR COMPARATIVE ROTATING DISC TREATMENT SYSTEMSSystem A 'Syst em B
94.6 (25,000) 378.5 (100,000)
335 240260 190
9.8 (2,600) 39.4 (10,400)4.5 (48) 15.7 (169)
9,000 (2.5) 9,000 (2.5)21.2 (520) 24.0 (590)
40.3 (10,650) 144.8 (38,250)3.7x1.8x 6.8 6.9 x 2.9 x 8.2
(12.0 x 6.0 x 22~3) (22.5 x 9.5 x 27.0)
250 180130 95
30 3088 83
733.9 (7,900) 2,601.2 (28,000)3.6 (948) 12.7 C3,360)
3,276 (0.91) 2,916 (0.81)0.13 (3.2) 0.15 (3.6)
2.0 (6.6) 3.7 (12.0)0.373 (0.5) 2.238 (3.0)
520 (137,500) 567.8 (150,000)
5.6 (1,470) 27.6 (7,300)9.8 (105) 20 (215)
5,040 (1.4) 6,300 (1. 75)9.8 (240) 19.1 (470)
5.9 (1,570) 23.7 (6,250)5,400 (1. 5) 5,400 (1 .5)
AVG. DAILY FLOW, m3/day (gpd)
INFLUENT BODs, mg/t
INFLUENT SS, mg/t
PRIMARY CLARIFIER BASINVolume, mS (gal)Surface area, m2 (ft 2
)Detention time, s (hr)Surf. loading, mS/day/m2
(gpd/ft 2 )
SLUDGE STORAGE BASINVolume, m3 (gal)Storage period, days
PRIMARY CLARIFIER-SLUDGESTORAGE BASINS
Volume, m3 (gal)Dimensions, m
( f t)
ROTATING DISC TREATMENT UNITInfluent BODs, mg/tInfluent SS, mg/tDesign criteria, effluent
BODs, mg/t% BODs removal
Disc effective surfacearea, m2 (ft 2 )
Tank volume, m3 (gal) .Detention time, s (hr)Hydraulic loading, m3/day/m2
(gpd/ft 2 )
Disc diameter, m (ft)Disc drive motor, W (hp)Bucket feed capacity,m3/day
(qpd)
FINAL CLARIFIER BASINVolume, m3 (gal)Surface area, m2 (ft 2
)
Detention time, s (hr)Surf. loading, m3/day/m2
(gpd/ft 2)
CHLORINE CONTACT CHAMBERVolume, m3 (gal)Detention time, s . (hr )
ROTATING DISC-FINAL CLARIFIERCHLORINE CONTACT BASINS
Dimensions, m(ft)
19.8 (5,240)30
4.9x 7.9x2.1(16.0 x 26.0 x 7.0)
70.2 (18,550)30
4.9 x 13.7 x 3.7(16.0 x 45.0 x 12.0)

45
NOTE: TANK CONTOUR MAYBE CIRCULAR ORTRAPEZOIDAL
'I I I!1
I---
'---- i
rB
l
DRIVE t-E-/---~,A-------"SYSTEM
e
~~ - - I- ,.= r- r- '- ~
lC
+FEED - DJ__'___-..J
SOURCE: Autotro1 Corporation (1974).
BIO-MODULE SHAFT InformationBIO-MODULE DIMENSIONS MEDIA SHIPPING OPERATING BUCKET FEED
SHAFT SURFACE WEIGHT WEIGHT MOTOR CAPACITYHodel A II C D E AREA, ft 2 lbsb Ibsc hpd gpde
611-104 10'-8" 14'-4" 6'-8" 6'-6" 4'-9" 28,000 8,300 16,000 3{" ,000
611-154 15'-8" " " " " 48,000 11,200 26,000 3 62,000
611-204 20'-8" " " ".
" 68,000 15,300 37,000 5 93,000
135,000
611-052 5'-8" 7'-4" 3'-4" 3'-7" 3'-3" 4,400a 4,850 5,000 1/4 I8,000612-104 10'-8" " " " " 7,900 5,950 7,000 1/2 16,000
612-154 15'-8" " " " " 13,500 7,300 10,500 3/4 24,000
32,000
ab1n 2 stagesi all others 4 stages.Includes shipping frame.
~Ith attached biomass in dewatered tank.d230; 460 V.3 phase, open drip-proof enclosure .ewlth 1,2, 3, and ~ buckets, respectively.SOURCE: Autotrol Corporation (1974).
FIGURE 17. AUTOTROL CORPORATION BIO-MODULE SHAFT SPECIFICATIONS

46
quate treatment at the expected peak flow of 2.5 times the average daily
flow. The tank volume supplied with the 409 m2 (4400 ft 2) Bio-Module Shaft
would only supply a liquid detention time of about 12 min at the expected
peak flow. As such. the 734 m2 (7900 ft 2 ) shaft system which provides a
liquid detention time of 55 min at average daily flow and 22 min at peak
flow was selected. The smaller 409 m2 (4400 ft 2) Bio-Module Shaft could
have been incorporated into a tank which would have supplied the required
liquid detention time . However, because of the surface to surface spacings
between discs which are used by Autotrol, a tank volume increase could only
be achieved through lncreases in tank width and depth. It would seem that
this type of tank design would increase waste water short circuiting through
the disc treatment section. This design was also not used because of the
unknown removal characteristics of the increased liquid to disc surface area
ratio present in such a design, 0.01 m3/m2 (0.25 gal/ft2 ) of disc surface
area, a value twice the ratio which was investigated in this study.
A 3.7-m (12.0-ft) disc diameter, Bio-Module Shaft, Model 611-104, was
selected for System B.The unit provides an effective disc area of 2600 m2
(28,000 ft 2) resulting in a design hydraulic loading of 0.13 m3/day/m2 (3.2
gpd/ft 2) at design flow. The concrete tank for the shaft provides a liquid
detention time of 49 min at design flow. Similar to System A, the disc sur
face area supplied, 2 600 m2 (28,000 ft 2 ) , was considerably higher than the
amount of surface area required, 1 430 m2 (15,400 ft 2 ) . However, in this
case, the selection in disc media shaft systems was limited because of the
Bio-Module Shaft sizes available. A pump to recirculate final effluent to
the primary clarifier during periods of very low flow was supplied in both
systems.
The final clarifier basins of the two systems were designed to provide
a detention time of about 1.5 hr and a maximum surface loading of 28.5
m3/day/m2 (700 gpd/ft2 ) , as recommended by Autotrol Corporation (1974). The
chlorine contact chambers were designed to provide a hydraulic detention
time of 15 min at peak hourly flow as directed by the Hawaii State Department
of Health (1973).
Final clarification facilities were provided through half-formed circu
lar concrete tanks equipped with a sludge withdrawal system. The sludge with
drawal systems, the "Bio-Clarifier Shaft" shown in Figure 18 is manufactured
by Autotrol Corporation. The Bio-Clarifier Shaft includes a rotating sludge

47
EFFLUENT
w~
SLUDGEDISCHARGE
L I II CHLORINEr-F--H..2 7 CONTACT TANKI II (OPT IONAl)
T
" r !!n.c:: L ,-
=
FINALEFFLUENT
SOURCE: Autotrol Corporation (1974).
SIO-MODULE SHAFT InfonnationBIO- SLUDGE
CLARIFIER CLARIFIER CLARIFIER SCOOPSHAFT DIHENSIONS OVERFLOW VOLUHE CAPACITYHodel F G AREA. ft1 ' ga l . QDda
631-1. 5'-0" 14'-4" 72 2.450 59063.1-2 10'-0" 14'-4" 143 ".•900 1.180632-1 5'-0" 7'-4" 35 490 590632-2 10'-0" 7'-4" 70 980 1.180
-At " rph.Motor: 1/4 hp. 320/460 V.) phase, open drip-proof enclosure.
Other options available.SOURCE I Autotrol Corporation (1974) .
FIGURE 18. AUTOTROl CORPORATION BrO-ClARIFIER SHAFT SPECIFICATIONS

48
scoop mechanism which is mounted on a horizontal shaft with shaft bearings
and drive system. The sludge collected by the rotating scoop either flows by
gravity or is pumped to the sludge storage facility. Chlorination facili
ties were provided through concrete tankage.
Two 2.3-m (7.4-ft) diameter Bio-Clarifier Shafts, Models 632-1 and 632-2
were provided for System A.
Two ~.4-m (14.4-ft) diameter Bio-Clarifier Shafts, Models 631-1 and
631-2 were provided for final clarification of the rotating disc effluent in
System B.
For comparative purposes, the sludge storage basins were designed to
provide 30 days storage at design loading. A larger volume of storage could
have been "pr ovi ded, to reduce sludge transport frequency. As designed, sludge
remova~ from the storage basin is required on a monthly basis. Sludge stor
age volume requirements were based on (1) 50% suspended solids removal in the
primary clarifier, as stated in the Test Results; (2) 0.4 to 0.5 mass units
sludge produced in the final clarifier per mass unit BODs removed in the rota
ting disc unit, as shown in Figure 19; (3) a combined sludge density in the
storage basin of 2.5% solids (by weight), as stated in the Test Results; and
(4) zero destruction of the volatile solids fraction of the combined sludge
in the storage basin over the 3D-day holding period, as stated in the Test
Results. Criteria 3 and 4 are considered conservative values, as Autotrol
Corporation (1974) claims that concentrations of 4to 6% solids (by weight)
are attained when primary and secondary solids from the rotating disc process
are settled together, and Burd(1968) stated that volatile solids destruction
will be 50% over a 40-day storage period in anaerobic digesters operated at
21°C.
ACTIVATED SLUDGE TREATMENT SYSTEMS
Extended Aeration Treatment System. The "Rated Aeration Package Sewage
Plant" manufactured by Chicago Pump, a division of FMC, was selected for Sys
tem A. The extended aeration treatment system consists of an aeration tank,
a final clarifier basin, a chlorine contact chamber, and a sludge holdingtank. A schematic diagram of the system is presented in Figure 19.
The aeration basin of the package system was designed to provide an
aeration time of 24 hr at design flow. The rectangular-shaped steel unit
provides aeration and mixing of the mixed liquor through air diffusers sup
plied by blowers.
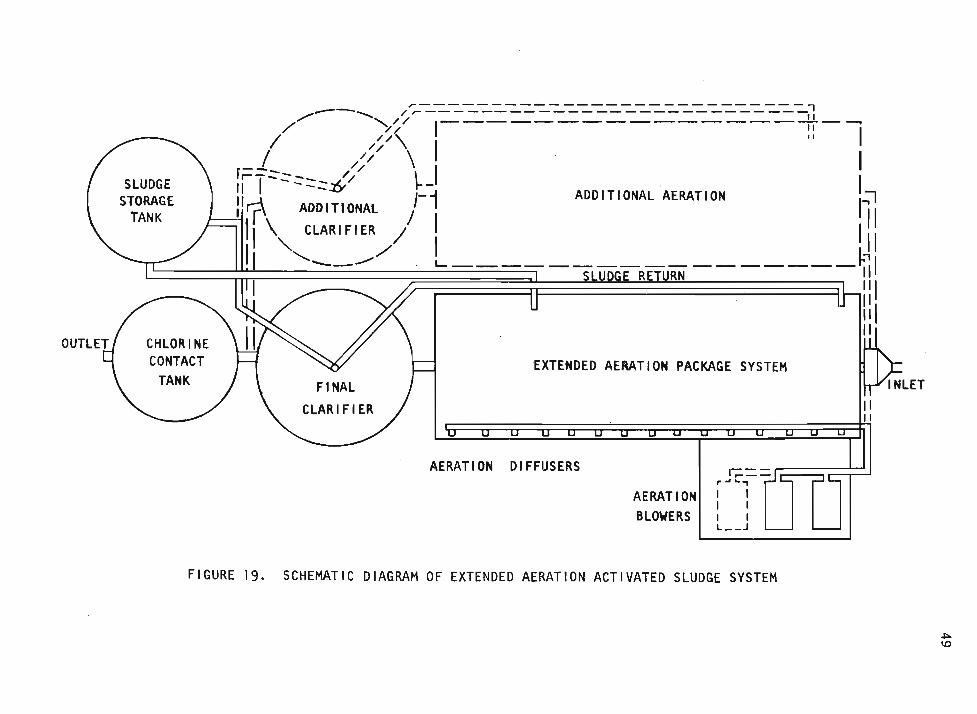
EXTENDED AERATION PACKAGE SYSTEM
--- ' 'II~_-I. II i,. ~ .. ~II
I IL __ J
AERATIONBLOWERS
AERATION DIFFUSERS
/---..... /';--_-::....-:...-:..-:..-=-- - - - - - -- - - --/
~// ----------- ---------" 1-- ----,"// ----- ------I //\ ---------11-
I// I II --.// \ " I
r--- //" r z:::-::::::.:t/ ~.I IIi?, ADDITIONAL /1 ADDITIONAL ·AERAT ION III \, CLARI F1ER / I I~II '-~ / L IIII .-----... // i: SLUDGE RETURN ~II
i II 'hiliI IIIIIII
FIGURE 19. SCHEMATIC DIAGRAM OF EXTENDED AERATION ACTIVATED SLUDGE SYSTEM
.j::o.\0
~!i:l.w~rln-·m.,...'e ? ::;;o:: aeszs ¥
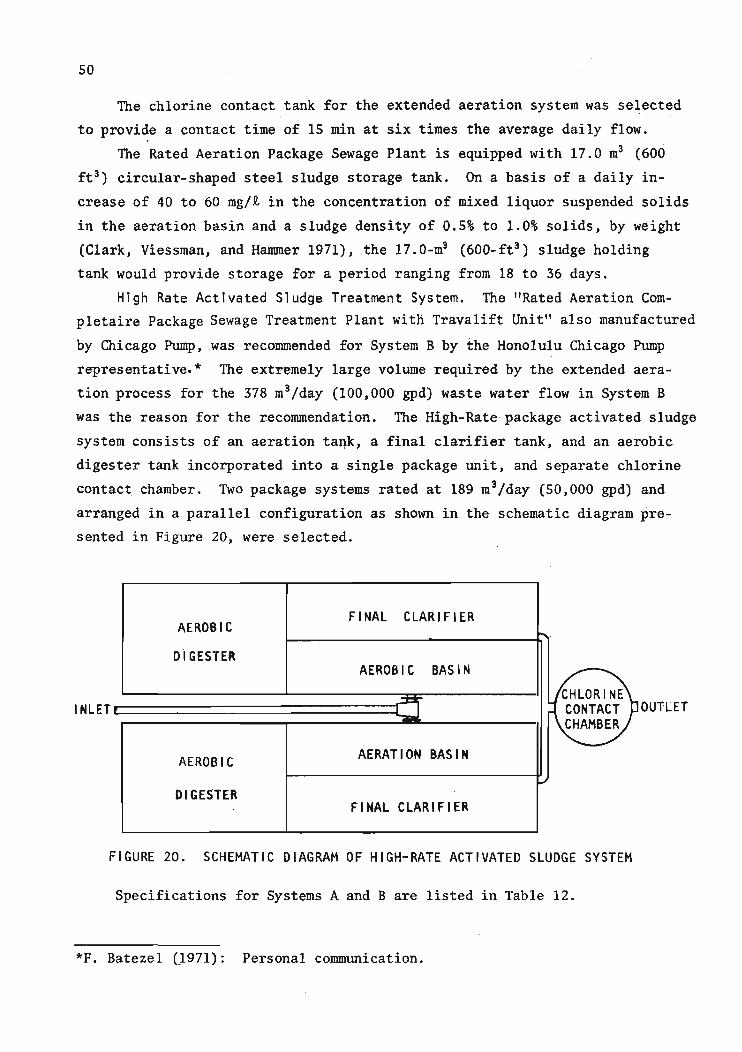
50
The chlorine contact tank for the extended aeration system was selected
to provide a contact time of 15 min at six times the average daily flow.
The Rated Aeration Package Sewage Plant is equipped with 17.0 m3 (600
ft 3 ) circular-shaped steel sludge storage tank. On a basis of a daily in
crease of 40 to 60 mg/1 in the concentration of mixed liquor suspended solids
in the aeration basin and a sludge density of 0.5% to 1.0% solids, by weight
(Clark, Viessman, and Hammer 1971), the 17.0-m3 (600-ft3 ) sludge holding
tank would provide storage for a period ranging from 18 to 36 days.
High Rate Activated Sludge Treatment System. The "Rated Aeration Completaire Package Sewage Treatment Plant with Trava1ift Unit" also manufactured
by Chicago Pump, was recommended for System B by the Honolulu Chicago Pump
representative. * The extremely large volume required by the extended aera
tion process for the 378 m3/day (100,000 gpd) waste water flow in System B
was the reason for the recommendation. The High-Rate package activated sludge
system consists of an aeration ta~k, a final clarifier tank, and an aerobic
digester tank incorporated into a single package unit, and separate chlorine
contact, chamber. Two package systems rated at 189 m3/day (50,000 gpd) and
arranged in a parallel configuration as shown in the schematic diagram pre
sented in Figure 20, were selected.
FINAL CLARIFIERAEROBIC
~ .
DiGESTERAEROBIC BASIN
CHLORINEC CONTACTCHAMBER
AEROBIC AERATION BASIN
~
DIGESTERFINAL CLARIFIER
INLET OUTLET
FIGURE 20. SCHEMATIC DIAGRAM OF HIGH-RATE ACTIVATED SLUDGE SYSTEM
Specifications for Systems A and B are listed in Table 12.
*F. Batezel (;971): Personal communication.

51
TABLE 12. SPECIFICATIONS FOR COMPARATIVE ACTIVATED SLUDGE TREATMENT SYSTEMSSystem A System B
(ft 2)
time, hrm3/day/m2
(gpd/ft 2)
94.5 (25,000)
335260
94.5 (25,000)243.7 (5.0)
(13,000)(220) .
(450)
42.2 (11,150)2.77.5 (10.0)
49.820.43.0
18.5
378 (100,000)
240190
(4,180)(78)
(320)
15.87.24.0
13.0
Avg. Daily Flow, mS/day (gpd)(Design Flow)
Influent BODs, mg/i
Influent SS, mg/i
Aeration BasinVolume, m3 (gal)Design detention time, hrAeration blower, kw (hp)
Fina 1 C1a r if ierVolume, m3 (gal)Surface area, m2
Design detentionS~rface loading,
Chlorine Contact ChamberVolume, m3 (gal)Design detention time, hr
Sludge Storage BasinVolume, m3 (gal)Storage Period, days
Total System Dimensions, m(ft)
5.9 (1,560)1.5
17.0 (4,490)18-36
21.1 x 4.6 x 3.0(70 x 15 x 10)
23.7 (6,250)· 1. 5
70.8 (18,700)>30
15.2 x 7.6 x 3.0l50 x 25 x 10)
EQUIPMENT OMITTED FROM THE COMPARISON. Equipment common to both the ro
tating disc and activated sludge treatment systems include raw sewage lift
station, bar screen, comminutor, flow measuring and recording device, standby
power source, chlorinator and chlorine storage facilities, injection wells,
and fence surrounding the treatment plant. Due to the limited nature of this
comparison study, the equipment listed above have been omitted from the treat
ment facility's in-place equipment cost.
SYSTEM INSTALLATION. System A was installed with the top of the treat
ment tanks and discs flush with the ground surface, as is generally preferred
for aesthetic purposes at high density resorts in Hawai'i. Installed in this
way, a considerable amount of excavation, back-filling, and site dewatering
was required. This is especially true for the primary clarifier-sludge stor
age basins used in the rotating disc system.
System B was installed on the .ground surface, which is common to subur
ban developments in Hawai'i. Only limited excavation was required for place-

52
ment of the concrete support slab of the act~vated sl~dge package plant,
however, consd.derab.l.y more excavati.onwas requfred ;i;or the ' rotating d:L~.c
treatment system as' the top surface o:f the concrete tanks used for the rotat
ing disc contact basin and final clarifier and chlorine contact basins were
installed about 0.30 (1.0 ft) above the ground surface. This resulted in
1.5 m (5.0 ft) to 3.0 (JO.O ft) of excavation. In addition, the primary
clarifier-sludge storage basin was installed with the top surface of the
tank about 3. 0 m C1 O. 0 ft) above the ground surface, with th.e remaining
5.2 m (17.0 ft) below the ground surface.
The primary clarifier-sludge storage tank was constructed of 0.006 m
(0.25 in.) thick, structural grade steel plate and was anchored to a 0.91 m
(3.0 ft) to 1.22 m (4.0 ft) thick concrete pad. The below ground level
walls surrounding the rotating disc section, final clarifier, and chlorine
contact basins in System A were constructed of concrete block, which was
painted with a waterproofing material. The roof over the rotating disc sec
tion in System A was constructed of steel plate while a fiberglass cover
manufactured by Autotrol Corporation was used to cover the disc media in
System B. All other tanks were covered by steel grating.
In-Place Equipment Cost Comparison
The in-place equipemtn costs-for the rotating disc and activated sludge
treatment facilities for Systems A and Bare listed in Table 13. The equip
ment costs listed are quoted prices,* while construction costs were esti
mated for local conditions (Mathews 1978). The in-place costs stated for
the rotating disc equipment compare well to the cost curves presented by
Antonie (1976).
The in-place equipment cost of the rotating disc process is about 7%
higher than that of the extended aeration process for the 0.001-m3/s
(25,000-gpd) facility evaluated in System A, and about 11% higher than the
activated sludge process for the 375-m3/day (100,000-gpd) facility evaluated
in System B. A major factor contributing to the comparatively higher costs
of the rotating disc treatment systems is the installation cost of the pri
mary clarifier-sludge storage basin. The estimated costs for excavation,
backfill, and site dewatering are about 30% of the estimated $60,000 and
$120, 000 total cost of the primary c1arifier....s1udge storage basins in Systems'
*F.Bateze1 (1977) : Personal communication.

53
TABLE 13. COMPARATI VE IN ~LACE EQU IPMENT COSTS
IN-PLACE COST (DOLLARS)System A System B
Rotating Extended Aera- RotatI nq High-RateDisc tion Activated Disc Activated
Sludge Sludge
EquipmentPrimary Clarifier- 40,500 90,000Sludge Storage Basin
Secondary Treatment 16,000 70,000 46,100 175,000System
Final Clarifier- 11,000 27,500Chlorine ContactBasins
ConstructionExcavat ion and 11,000 9,000 14,400 600backf ill
Concrete pad 4,000 4,400
Concrete block 2,500
Dewatering 15,000 5,000 25,000
Sub-Total 96,000 88,000 . 203,000 180,000
Contractor costs 22,000 20,000 45,000 40,000and taxes(21% of Sub~Total)
Total Cost 118,000 108,000 248,000 220,000
A and B, respectively. This is primarily due to the excavation depth re
quired to bury the basins. Because of this excessive cost, the advantage of
the combined primary clarifier-sludge storage basin from a maintenance and
operation cost basis may be lost, especially for the larger system. A
standard rectangular clarifier with separate sludge storage may be more ad
vantageous in System B.
It is noted that primary clarification facilities were not included in
the activated sludge treatment systems. This is not a major conc~rn in Sys
tem A because of the large aeration volume provided in the extended aeration
process, however, it is a concern in System B. The short liquid det~ntion
time (2.7 hr at average flow) supplied by the aeration tank makes the high
rate activated sludge package plant extremely susceptible to hydraulic sur
ges. This fact makes the stability of the process questionable.

54
Annual Cost Comparison
The annual capital costs for the rotating disc and activated sludge
treatment processes are listed in Table 14. The annual capital cost is the
annual cost of the in-place equipment presented in Table 13 amortized over a
period of 20 yr at 6% interest. The annual capital cost of the rotating disc
treatment process is about 8% higher than that of the extended aeration
treatment process in System A, where sewage volume is 94.5 mS/day (25,000
gpd), and about 11% higher than that of the high-rate activated sludge treat
ment process in System B, where sewage volume is 378 m~/day (100,000 gpd).
The operating energy costs for the activated sludge and rotating disc
treatment processes are also presented in Table 14. The costs are determined
exclusively on the basis of the rated horsepower of (1) the aeration blower
supplied in the package extended aeration unit; (2) the blowers (for the
aeration basin and aerobic 'di ges t er ) and the continuous duty drive motor (for
the final clarifier sludge withdrawal system) in the package high-rate acti
vated sludge unit; and (3) the disc and sludge scoop rotational drive motors
supplied in the rotating disc units. The energy requirements for sludge
pumping are not included in the comparison due to the relatively short dura
tion of the pumping and minimum power usage. It 'is noted that the decreased
cost per joule (kW-hr) of electricity for System B is due to the cost gradu
ations in the rate schedule for general service customers of the Hawaiian
Electric Company (1978).
In System A, the operating energy cost for the extended aeration treat
ment process is about five times greater than that for the rotating disc
treatment process. In System B, the operating energy cost for the high-rate
activated sludge process is six times that for the rotating disc treatment
process. This amounts to an annual savings in energy cost of $1,500 for Sys
tem A, and $3,400 for System B. The difference between the operating energy
cost in System B is reduced by one-half if the power consumption required for
aerobic digestion is omitted. However, the cost difference is still about
$1,400/yr. An even greater difference in the operating energy requirements
of the two processes may exist if the actual power consumption of the systems
is used in the comparison instead of the rated watt (horsepower) values, and
if sludge pumping is included in the comparrson. Autotrol (1974) states that
the rated horsepower of the rotational drive motor supplied with the Bio
Module Shaft package unit, is generally 30 to 50% greater than the consumed

TABLE 14. TOTAL ANNUAL COST COMPARISON__System BSystem A
Rotat ingDisc
ExtendedAerationActivated
Sludge
RotatingDisc
High-RateActivated
Sludge
Capital CostTotal in-place equipment costAnnual Capital Costt
117,6JO10,250
108,0009,415
247,70021,600
220,00019,200
1.0 5.0 3.5 21.06,534 32,668 22,850 137,240
(8,760) (43,800) (30,660) (183,960)392 1,960 685 4,120
1.0 1.0 2.0 2.02,200 2,200 4,400 4,400
2,500 5,000 5,500 14,400
2.0 2.0 3.0 .3. 04,400 4,400 6,600 6,600
$19.700 $23.000 $38.800 $48.300
Annual energy costt,Labor cost
Daily labor requirement hr/dayAnnual labor cost @$6.00/hr
Operational CostEnergy cost
Energy requirement, hpAnnual energy consumption kW-hr
(hp-hr)
Maintenance CostAnnual replacement parts and equipment cost§
Labor costDaily labor requirement hr/dayAnnual labor cost @$6.00/hr
TOTAL ANNUAL COST
NOTE: Total Annual Cost figures rounded off.*Amortized at 6% interest over a 20-yr period.tUnit cost: System A, $O.06/kW-hr; System B, $0.03/kW-hr.TFromHawailan Electric General Service Rate Schedule 1978.§Estimated at 8% of capital equipment cost.
U1U1
--'Q~~~~ _,,,",,,,-,,,"",cr,,

56
power. This is to insure proper operation during start up, and for occa
sional load imbalances. On the other hand, the consumed power of the blowers
supplied with the activated sludge package units is essentially the same as
the rated power. Also, considerably more sludge pumping is required in the
activated sludge treatment process for sludge recirculation and wasting.
Labor costs for operation and maintenance are listed in Table 14. Due
to lack of data, the required man-hours for operation and maintenance of the
rotating disc and activated sludge treatment processes are considered to be
the same. In addition, the required skill of the operator and, thus, the
hourly wage of the operator is assumed to be the same for the two processes.
These assumptions are thought to be conservative in favor of the activated
sludge process based on the limited quantity and nature of the operational
and maintenance requirements of the test unit during the study period. This
is especially thought to be true in System B because of the considerable op
erating requirements and needed operator attention characteristic of the
high-rate activated sludge process. Of particular importance is the main
taining of a relatively constant concentration of mixed liquor suspended so
lids in the aeration chamber.The annual cost for replacement parts and equipment is estimated on the
basis of the capital equipment costs of the treatment processes. A value of
8% of the capital equipment cost is used for this comparative study. In both
the 94.5 m3/day (25,000 gpd) and 378 m3/day (100,000 gpd) systems, the cost
of replacement parts and equipment for the activated sludge treatment proces
ses is approximately twice as high as that for the rotating disc processes.
This is due to the relatively fewer moving parts in the rotating disc proces~
The total annual costs for the treatment processes over a 20~yr period
are presented in Table 14. The total annual costs for the rotating disc
treatment process are about 14 to 20% lower than those of the extended aera
tion and high-rate activated sludge treatment processes, respectively. This
amounts to a savings of $66,000 over a 20-yr period for System A, where sew
age volume is 94.5 m3/day (25,000 gpd) and $190,000 over a 20-yr period for
System B, where sewage volume is 378 m3/day (100,000 gpd).
Based on the comparative cost study, it can be concluded that (1) the
rotating disc treatment process is very comparable to the activated sludge
treatment process in regards to in-place equipment cost, (2) is from 5 to 6
times more efficient on an energy basis, and (3) from 14 to 20% less costly

57
on a basis of 20-yr annual cost than the activated sludge treatment process.
In addition to the cost advantage enjoyed by the rotating disc treatment
process, the process itself has greater treatment stability. On an overall
basis, the rotating disc treatment process is superior to the activated
sludge treatment process in treating wastes from high density resorts and
suburban developments of up to 378 m3/day in Hawai'i.
CONCLUSIONS
1. The rotating disc treatment process is an effective means of pro
ducing an effluent quality compatible with domestic waste water treatment
needs in suburban areas in Hawai'i.
2. The simplicity of the process and its mechanical equipment result
in a very low requirement for operational control and maintenance.
3. Low maintenance and operational req~irements, low power consumption,
and compact size make the rotating disc process well suited to -package plant
applications.
4. The rotating disc treatment unit operated in this investigation
achieved overall removal of carbonaceous BODs and suspended solids in excess
of 85%, and produced effluent with concentrations of carbonaceous BODs and
suspended solids of less than 30 mg/t when operated at a hydraulic loading
of less than 0.26 rn 3/day/m2 (6.5 gpd/ft 2) . A theoretical waste water deten
tion time in the disc section of greater than 0.45 hr was provided.
5. COD and TOC removals were respectively about 5% and 10%, less than
carbonaceous BODs removals.
6. Carbonaceous BODs removal by the rotating disc unit was first order
with respect to BODs concentration. Therefore, the primary design criterion
for the rotating disc treatment process is hydraulic loading, as rn 3/day/m2
(gpd/ft 2) of disc media surface area. Liquid detention time is also an im
portant design criterion. Increasing the number of stages from two to four
had very little effect on BODs removal.
7. Nitrogen removal -through cell synthesis was found to be 1 mass unit
nitrogen removed per 20 mass units BODs removed. Likewise, phosphorus re
moval averaged 1 mass unit phosphorus removed per 100 mass units BODs removed.
Effluent nutrient concentrations averaged 31 mg/t total nitrogen and 7 mg/t
total phosphorus throughout the test period.

58
8. Total Kjeldahl nitrogen removal through oxidation of ammonia nitro
gen began in the test unit at a hydraulic loading of about 0.26 mS/day/m2
(6.5 gpd/ft 2) . A maximum total Kjeldahl nitrogen removal of 62% was achieved
at the lowest hydraulic loading of 0.09 mS/day/m2 (2.25 gpd/ft 2 ) .
9. Sludge production from the disc section ranged from 0.40 to 0.50
mass unit solids produced per mass unit BODs removed in the disc section.
10. BODs removal by the test unit compares well to results obtained from
previous pilot studies of rotating disc units in the United States and Europe.
11. In-place equipment costs for rotating disc treatment systems are
about 10% higher than equipment costs for extended aeration and high rate
activated sludge systems treating 94.5 mS/day (25,000 gpd) and 378 mS/day
(100,000 gpd) respectively, of domestic waste water.
12. Operational energy requirements for rotating disc treatment sys
tems are about 5 to 6 times lower than those for extended aeration and high
rate activated sludge systems treating 94.5 mS/day (25,000 gpd) and 378
m3/day (100,000 gpd), respectively, of domestic waste water. This amounts
to a savings of from $1,500 to $3,400/yr.
13. The annual capital costs of the rotating disc treatment process
over a period of 20 yr, are about 14 and 20% lower than those for the ex
tended aeration and high-rate activated sludge treatment processes treating
94.5 m3/day (25,000 gpd) and 378 ,m 3/day (100,000 gpd), respectively, of do
mestic waste water . This amounts to a savings of from $66,000 to $190,000
for the respective 94.S-m 3/day (2S,000-gpd) and 378-m3/day (10,000 gpd) sys
tems.
14. The rotating disc treatment process is superior to the extended
aeration and high-rate activated sludge treatment systems for treating do
mestic waste water flow from high density resorts and suburban developments
of up to 378 m3/day (100,000 gpd).
RECOMMENDATIONS
1. The test unit used in this study should be modified in the follow
ing areas to improve its usefulness as a self-contained treatment unit:
(a) replacement of the final clarifier tank with a rectangular-shaped tank
having a half-formed circular-shaped bottom, (b) installation of a rotating

59
sludge .col l ect i on system in the final clarifier which is capable of convey
ing the biological solids to the sludge storage basin by gravity, and (c)
covering the gas vents in the sludge storage tank to reduce the nuisance
from insects.
2. The test unit used in this study should be operated at several hy
draulic loadings of less than 0.08 m3/day/m2 (2.0 gpd/ft2) so that the re
moval kinetics for ammonia-nitrogen can be better described.
3. Rotating disc media should be covered to· protect the attached bio
mass from being washed from the media by rain and wind.
4. Solids separation and dewatering alternative, such as biological
flotation and sand filtration, should be investigated for the solids pro
duced by the rotating disc treatment system.
5. For purposes of further energy savings, the operation of the third
and fourth stages of a 4-stage test unit at rotational velocities of less
than 0.3 m/s (1 .0 fps) should be investigated.
6. The operation of a test unit with a reaction tank volume to media
surface area ratio of about 0.01 m3/m2 (0.25 gal/ft2) should be conducted
under fluctuating hydraulic loadings to determine removal characteristics
during peak flow conditions.
7. The operation of a test unit treating domestic waste water contain
ing chloride concentrations characteristic of sewerage systems located in
coastal environments should be studied to determine their effect on organic
and ammonia nitrogen decrease efficiency.
8. ·The operation of a rotating disc treatment system located at a high
density resort or suburban development should be studied to determine removal
characteristics under actual conditions.
9. The feasibility of using the rotating disc treatment process for
treating waste waters generated by the various industries in Hawai'i should
be investigated. Of particular interest are the pineapple and tuna canning
industries.
ACKNOWLEDGMENTS
We would like to thank the many people and organizations who assisted
in the conduct of the various phases of this project. We are indebted to
Mr. Andy Oshita, UH Laboratory Technician, for his technical expertise and

60
work inthe construction of the test unit; Mr. Francis Aona, Chief, Division
of Wastewater Management, Department of Public Works, City and County of
Honolulu, for allowing operation of the test unit at the Pacific Palisades
Wastewater Treatment Facility, and for providing the power outlet at the
test site; the operators of the Pacific Palisades Facility, Mr. James Aweau
and Mr. Catalino Monderen for the day-to-day attention and care provided dur
ing the test period; Mr. Earl Ichimura and Mr. David Bills for their assist
ance during the project; and Construction Services Ltd., Gray Rhee and Associates,Inc. and M.C. Nottingham of Hawaii Ltd. for supplying data which
were incorporated into the section, "Comparison with the Activated Sludge
Treatment Process."

61
REFERENCES
Allis-Chalmers Research Division.rotating biological contactor.PB-20l, 701:58.
1969. Municipal sewage treatment with aNational Technical Information Service
American Public Health Association, American Water Works Association, andWater Pollution Control Federation. 1975. StandaPd methods for theexamination of water and wastewater. 14th ed. New York: APHA.
Antonie, R.L., and Welch, F.M. 1969. Preliminary results of a novel biological process for treating dairy wastes, Proc. 24th Purdue Ind. WasteConf., Purdue University 24:115-26.
1970. Response of the bio-disc process to fluctuating wastewaterflows. Proc; 25th Purdue Ind. Waste Conf., Purdue University 25:427-35.
1972. Rotating disc provide flexible biological treatment. Ind.Water Eng. 9(5):79-85.
1974.ment plant.
Discussion : Evaluation of a rotating disc wastewater treatJ. Water PoZZ. Control Fed. 46: 2792-95.
1976. Fixed biological surfaces-wastewater treatment. Cleveland,Ohio: CRC Press.
, and Hynek, R.J. 1973. Operating experience with Bio-Surf Process----,--
treatment of food-processing wastes. Proc. 28th Purdue Ind. Waste Conf.Purdue University 28:849-60.
_____; Kluge, D.L.; and Mielke, J .H. 1974. Evaluation of a rotating discwastewater treatment plant. J. Water PoZZ. Control Fed. 46:498-511.
Autotrol Corporation. 1971. Application of rotating disc process to municipal wastewater treatment. Water Poll. Control Res. Ser. 17050 DAM:74,U.S. Dept. of the Interior.
1974. Bio-Surf process-Package plants for secondary wastewatertreatment.
Bio-Shafts, Inc. 1977. Rotating biological discs.
Birks, C.W., and Hynek, R.J.by the bio-disc process.versity, 26:89-105.
1971. Treatment of cheese processing wastesProe, 26th Purdue Ind. Waste Conf., Purdue Uni-
Burd, R.S. 1968. Study of sludge handling. Water Poll. Control Res. Ser.Pub. No. WP-20-4:326, U.S. Dept. of the Interior.
City and County of Honolulu. 1977. National pollution discharge elimination system reports. Honolulu, Hawaii.

62
Clark, J.W.; Viessman, W.; and Hammer, M.J. 1971. Water supply and pollutioncontrol. 2d ed. Scranton, Penn.: International Textbook~
Chun, M.J.; Young, R.H.F.; and Anderson, G.K. 1972. Wastewater and surfacerunoff quality. Tech. Rep. No. 63, Water Resources Research Center, University of Hawaii.
Cochrane, M.W.; Burn, R.J.; and Dostal, K.A. 1973. Cannery wastewater treatment with rotating biological contactor and extended aeration. Environmental Protection Technology Sere PB 221 333/8:62.
Department of Health, State of Hawaii. Public health regulations.1973. Chapter 38.1974. Chapter 37A. ·
Doman, J. 1929. Results of operation of experimental contact filter withpartially submerged rotating plates. Sew. Works J. 1:555-60.
Gray, Rhee&Associates, Inc. 1973.Village Sewage Treatment Plant.Department of Health.
Performance evaluation program-KulanaReport submitted to the State of Hawaii,
1978. Performance evaluation program-Pohailani Sewage TreatmentPlant. Report submitted to the State of Hawaii, Department of Health.
Hao, 0., and Hendricks, G.F. 1975 . Rotating biological reactors removalnutrients, Part I and Part II. Water &Sew. Works, pt. I 122(10) :48-50;pt. II 122(11):70-73.
Joost, R.H. 1969. Systemation in using the rotating biological surface(RBS) waste treatment process. Froc. 24th Purdue Ind. Waste Conf., Purdue University 24:365-73.
Kincannon, D.F.; Chittenden, J.A.; and Stover, E.L.biological contactor on meat industry wastewater.tion Technology Series.
1974. Use of rotatingEnvironmental Protec-
Labella, S.A.; Thaker, I.H.; and Tehan, J.E. 1972. Treatment of winerywastes by aerated lagoon, activated sludge and rotating biological contactor. Froc. 27th Purdue Ind. Waste Conf., Purdue University 27 :803-16.
Lagnese, J.F. 1976. Upgrading with rotating bio-disc. Water Poll. ControlAssoc. of Pennsylvania Magazine.
McA1iley, J.E. 1974. A pilot plant study of a rotating biological surfacefor secondary treatment of unbleached Kraft Mill waste. TAPPI57(9):106-11.
Metcalf and Eddy, Inc.disposal. New York:
1972. Wastewater engineering-Collection treatmentMcGraw-Hill.
Olem, H., and Unz, R.P. 1976.ting biological contactor.289:70.
Acid mine drainage treatment with the rotaNational Technical Information Service PB-264

63
Pescod, M.B., and Nair, J .V. 1972. Biological disc filtration for tropicalwaste treatment. Water Research J. 6:1509-23 ..
Quazi, A.N. 1974. Rotating disks. J. Water Poll. Control Fed. 46:1070-79.
Sack, W.A., and Phillips, S.A. 1973. Evaluation of the bio-disc treatmentprocess for summer camp application. Environmental Protection TechnologySeries.
Schladitz, C.T., and Lecker, J.T. 1974."Bio-Surf" wastewater treatment plant.ni a Magazine.
Teen challenge training centerWater Poll. Assoc. of Pennsylva-
Stover, E.L., and Kincannon, D.F. 1975. One-step nitrification and carbonremoval. Water &Sew. Works 122(6):66-69.
Torpey, W.N. 1971. Rotating disks with biological growths prepare wastewater for disposal or reuse. J. Water Poll. Control Fed. 46:1674-85.
; Heukelekian, H.; and Kaplovsky, A.J. 1974. Rotating biological---d~~··sk wast ewat er treatment proeess-Pilot plant evaluation. National Tech
nical Information Service PB-232 133:250.
U ~S. Environmental Protection Agency. 1974. Manual of methods for ohemicalanalysis of water and wastes. Environmental Protection Technology Transfer EPA-625:298, Washington, D.C.
Victor, D.H. 1975. "Evaluation of a rotating disc unit for the treatmentof municipal wastewater ." Master's thesis" University of Hawaii.
Welch, F.M. 1968 . Preliminary results of a new approach in the aerobicbiological treatment of highly concentrated wastes. Proc. 23rd PurdueInd. Waste Conf., Purdue University 23:428-37.
Weng, C., and Molof, A.H.rotating disk system.
1974. Nitrification in the biological fixed-filmJ. Water Poll. Control Fed. 46:1674-85.
Winkler, W.W., and Welch, F.M.tive treatment plant design.
1974. Energy conservation dictates innovaPublic Works 8(3):54-58.
Young, J.C. 1969. Chemi~al methods for nitrification control. Proa. 84thPurdue Ind. Waste Conf., Purdue University 24:1090-1102.

65
APPENDIX TEST RESULTS
APPENDIX TABLES
A.1. Average Results from Operation of Rotating Disc TreatmentUnit under Trial No.1, Hydraulic Loading of 0.09 m3fdayfm2 ,
22 July 23 August 1977 . . . . . . . . • . . . . • . . . . . . .. 66A.2. Average Results from Operation of Rotating Disc Treatment
Unit under Trial No.2, Hydraulic Loading of 0.16 m3fdayfm2 ,
24 August to 15 October 1977 . . . • . . . . . . . . . . . . . . . 67A.3. Average Results from Operation of Rotating Disc Treatment
Unit under Trial No.3, Hydraulic Loading of 0.27 m3fdayfm2 ,
16 October to 5 November 1977. . • . . . • . . . . . . • . . . . . 68A.4. Average Results from Operation of Rotating Disc Treatment
Unit under Trial No.4, Hydraulic Loading of 0.12 m3fdayfm2 ,
6 November to 17 December 1977 . . . . . . . . . . . . . . . . . . 69A.5. Daily Profiles of Parameters Measured at the City and County
of Honolulu Pacific Palisades Municiple Wastewater TreatmentFacility during 1977 . . . . . . . . . . . . . . . . . . . . 70

66
APPENDIX TEST RESULTS
APPENDIX TABLE A.l. AVERAGE RESULTS FROM OPERATION OF ROTATI.NG DISC TREAT-MENT UNIT UNDER TRIAL NO. I HYDRAULlC LOADING OF0.09 m3/day/m2 (2,25 gpd/ft~), 22 JULY-23 AUGUST 1977
SAMPLE LOCATIONPrimary ROTATI NG DISC
PARAMETER Raw Clarifier 2d Stage 4th Stage FinalInfluent Effluent Eff luent Effluent Effluent
Temp., °c 27.4 23.9pH, units 6.8 7.3 7.0 6.7DO, mgt£. O. J 3.8 4. 1 0.3BODs, mgt£. 200 145 26 34 55
(% remova 1) 28 87 83 73COD, mgt£. 475 295 62 46 92
(% remova 1) 38 87 90 81TOC, mgt£. 129 115 28 18
(% remova 1) 11 78 86SS, mgt£. 202 149 57 62 19
(% remova 1) 26 72 69 91Total N, mgt£. 37 28 29
(% remova 1) 24 22TKN, mgt£. 33 26 14
(% remova 1) 21 58N02 N, mgt£. 0.0 1.0 4.3NOs N, mgt£. 0.0 1.4 9.4Total P, mgt£. 7. 1 4.8 3.7
(% remova 1) 32 48

TABLE A.2. AVERAGE RESULTS FROM OPERATION OF ROTATING DISC TREATMENT UNITUNDER TRIAL NO. 2, HYDRAULIC LOADING OF 0.16 m3/day/m2 (4.1gpd/ft2) 24 AUGUST TO 15 OCTOBER 1977
' SAMPLE LOCATIONPRIMARY ROTATING DISC
RAW CLARIFIER 2d Stage 4th Stage FINALPARAMETER INFLUENT EFFLUENT Effluent Effluent EFFLUENTTemp., "c 28.1 27.0pH, units 6.7 7.2 7.2DO, mg/R. O. 1 1.8 3.5BODs, mg/.l/, 182 128 33 17
(% remova l) 30 82 91COD, mg/R. 495 260 88 47
(% remova 1) 47 82 91TOC, mg/R. 117 113 36 22
(% remova 1) 3 69 81SS, mg/.l/, 160 125 71 62 11
(% remova 1) 22 56 61 93Total N, mg/R. 41 32 34
(% removal) 22 17TKN, mg/R. 41 32 31
(% removal) 22 24
N02 N, mg/R. 0.0 0.0 2.8N03 N, mg/R. 0.0 0.0 0.4Total P, mg/.l/, 8.0 6.9 6.9
(% remova 1) 14 14
67

68
TABLE A. 3 AVERAGE RESULTS FROM OPERATION OF ROTATING DISC TREATMENT UNITUNDER TRIAL NO .3, HYDRAULIC LOADING OF 0.27 m3/day/m2 (6.7gpd/ft 2) 16 OCTOBER TO 5 NOVEMBER 1977
SAMPLE LOCATIONPRIMARY ROTATI NG 0ISC
RAW CLARIFIER 2d Stage 4th Stage FINALPARAMETER INFLUENT EFFLUENT Effluent Effluent EFFLUENTTemp., °c 27.8 26.9pH, units 7.0 7.3 7.3DO, mg/R. 0.2 1.2 2.8BODs, mg/R. 190 170 62 30
(% remova 1) 11 67 84COD, mg/R. 385 315 150 90
(% removal) 18 61 77TOC, mg/R. 119 114 57 38
(% remova 1) 4 52 68S5, mg/R. 163 98 87 81 21
(% removal) 40 47 50 87Total N, mg/R. 30 29 28
(% remova I) 5 6TKN, mg/R. 30 29 28
(% removal) 5 6N02 N, mg/R. 0.0 0.0 0.0NOs N, mg/R. 0.0 0.0 0.0
Total P, mg/R. 9.3 8.8 8.7(% remova I) 5 6

TABLE A.4 AVERAGE RESULTS FROM OPERATION OF ROTATING DISC TREATMENT UNITUNDER TRIAL No .4, HYDRAULIC LOADING OF 0.12 m3/day/m2 (3.0gpd/ft 2) 6 NOVEMBER TO 17 DECEMBER 1977
SAMPLE LOCATI ONPRIMARY ROTATI NG 0ISC
RAW CLARIFIER 2d Stage 4th Stage FINALPARAMETER INFLUENT EFFLUENT Effluent Effl uent EFFLUENT
Temp ., °c 27.0 25.7pH, units 6.9 7.4 7.3DO, mg/JI, O. 1 2.8 4.2BODs, mg/JI, 230 135 24 22
(% removal) 41 90 90COD, mg/JI, 450 275 61 33
(% remova l) 39 86 93TOC, mg/JI, 117 97 34 20
(% removal) 17 71 83SS, mg/JI, 179 82 84 69 7
(% removal) 54 53 58 96Total N, mg/JI, 38 32 33
(% removal) 16 13TKN, mg/JI, 38 32 27
(% remova 1) 16 29N02 N, mg/JI, 0.0 0.3 4.4N03 N, mg/JI, 0.0 0.0 1.9Total P,mg/JI, 8.5 7.7 7.8
(% remova I) 9 8
69

70
APPENDIX TABLE A.5. DAILY PROFILES OF PARAMETERS MEASURED AT THE CITYAND COUNTY OF HONOLULU PACIFIC PALISADES WASTEWATERTREATMENT FACILITY DURING 1977
PARAMETER 19771-6 2-9 4-7 5-20 6-17 7-27 8-25 9-23 10-19 11-2 12-9
Raw Waste WaterpH, un i ts 8.0 7.3 8.2 8.4 8.4 8.0 7.8 8.0 8.2 8.0 7.7DO, mg/R. 3.8 4. 1 3.0 2.4 3.0 3.0 2.7 3.0 4.4 2.0 3.6,
BODs, mg/R. 147 190 153 198 160 170 205 180 289 195 224
SS, mg/R. 120 144 105 204 195 148 96 100 240 420 335TP, mg/R. 5.9 5.9 7.5 5.9 6.9 5.2 5.5 10.4 4.9 6.2
TKN, mg/R. 31 25 20 66 24 26 35 26 33 37 39Final Clarifier Effluent
DO, mg/R. 1.2 2.6 1.6 0.8 0.9 0.8 1.4 2.2 0.4 2.0 2.8
BODs, mg/R. 63 39 35 38 30 38 37 67 74 37 25SS, mg/R. 24 32 28 18 12 18 14 45 28 55 28TKN, mg/R. 23 32 30 66 20 24 18 28 34 30 31
PI ant Outfa11pH, un i ts 7.1 7. 1 7.4 7.3 7.3 7. 1 7. 1 7.3 7.2 7.6 7.4TP, mg/R. 12.4 6.2 8.2 6.2 6.9 6.5 7.2 5.5 8.5 7.2 4.2Temp., °c 22.5 21.5 24.0 23.5 24.0 24.3 26.0 27.0 25.0 25.0 24.5Total 24 hrFlow (mgd) .494 .499 .494 .324 .500 .524 .515 .527 .507 .503 .516
SOURCE: City and County of Honolulu (1977).

ammonia
BODs
°c
COD
DO
fps
ft
gal
gpd
gpd/ft 2
g/m2/day
hp-hr
hp-hr/lb
10
in.
J
kWh
1b
lb/l000 ft 2/day
m
m/s
m3/day
m3/s
mgd
mg/t
ML
GLOSSARY
ammonia nitrogen, mg/t as nitrogen
biochemical oxygen demand (S-day), mg/t
temperature in degrees Celcius
chemical oxygen demand, mg/t
dissolved oxygen, mg/t
feet per second
feet
gallon
gallons per day
gallons per day per square foot
gram per square meter per day
horsepower-hour
horsepower-hour per pound
inside diameter
inch
joule
kilowatt-hour
pound
pounds per 1000 square feet per day
meter
meter per second
cubic meter per day
cubic meter per second
million gallons per day
milligram per liter
mixed liquor
71

72
GLOSSARY-Continued
MLSS
MLVSS
mps
n
NOz-N
N03-N
r
rpm
5
S5
TKN
TN
TOe
TP
VSS
W
mixed liquor suspended solids, mg/i
mixed liquor volatile suspended solids, mg/i
meter per second
sample size
nitrite nitrogen, mg/i as nitrogen
nitrate nitrogen, mg/i as nitrogen
correlation coefficient
revolutions per minute
second
suspended solids, mg/i
total Kjeldahl nitrogen, mg/i as nitrogen
total nitrogen, mg/i as nitrogen
total organic carbon, mg/i
total phosphorus, mg/i as phosphorus
volatile suspended solids, mg/i
watt