Embed Size (px)
Citation preview

doi:10.1152/jn.01085.2007 99:2408-2419, 2008. First published 6 February 2008;J NeurophysiolEric D. Tytell and Avis H. CohenGenerator for LocomotionEntrainment of the Lamprey Central Pattern Rostral Versus Caudal Differences in Mechanical
You might find this additional info useful...
48 articles, 18 of which can be accessed free at:This article cites /content/99/5/2408.full.html#ref-list-1
9 other HighWire hosted articles, the first 5 are:This article has been cited by
[PDF] [Full Text] [Abstract]
, March 1, 2012; 107 (5): 1356-1365.J NeurophysiolSubhashini Srinivasan, Kimberley Lance and Richard B. Levinemotoneurons
larvalDrosophilaSegmental differences in firing properties and potassium currents in
[PDF] [Full Text] [Abstract], June 1, 2012; 215 (11): 1884-1891.J Exp Biol
Einat Fuchs, Philip Holmes, Izhak David and Amir AyalicockroachProprioceptive feedback reinforces centrally generated stepping patterns in the
[PDF] [Full Text] [Abstract], November 15, 2012; 215 (22): 3944-3954.J Exp Biol
Kazutaka Yanase, Neill A. Herbert and John C. MontgomerySeriola lalandicost of swimming in the yellowtail kingfish,
Disrupted flow sensing impairs hydrodynamic performance and increases the metabolic
[PDF] [Full Text] [Abstract], January 21, 2014; 111 (3): 978-983.PNAS
Tetsuya Iwasaki, Jun Chen and W. Otto FriesenBiological clockwork underlying adaptive rhythmic movements
[PDF] [Full Text] [Abstract], March 15, 2015; 113 (6): 1921-1940.J Neurophysiol
D. Ryczko, J. Knüsel, A. Crespi, S. Lamarque, A. Mathou, A. J. Ijspeert and J. M. CabelguensalamanderFlexibility of the axial central pattern generator network for locomotion in the
including high resolution figures, can be found at:Updated information and services /content/99/5/2408.full.html
can be found at:Journal of Neurophysiologyabout Additional material and information http://www.the-aps.org/publications/jn
This information is current as of April 14, 2015.
American Physiological Society. ISSN: 0022-3077, ESSN: 1522-1598. Visit our website at http://www.the-aps.org/.(monthly) by the American Physiological Society, 9650 Rockville Pike, Bethesda MD 20814-3991. Copyright © 2008 by the
publishes original articles on the function of the nervous system. It is published 12 times a yearJournal of Neurophysiology
on April 14, 2015
Dow
nloaded from on A
pril 14, 2015D
ownloaded from

Rostral Versus Caudal Differences in Mechanical Entrainment of the LampreyCentral Pattern Generator for Locomotion
Eric D. Tytell1 and Avis H. Cohen1,2
1Department of Biology and 2Institute for Systems Research, University of Maryland, College Park, Maryland
Submitted 28 September 2007; accepted in final form 2 February 2008
Tytell ED, Cohen AH. Rostral versus caudal differences in mechan-ical entrainment of the lamprey central pattern generator forlocomotion. J Neurophysiol 99: 2408–2419, 2008. First publishedFebruary 6, 2008; doi:10.1152/jn.01085.2007. In fishes, undulatoryswimming is produced by sets of spinal interneurons constituting acentral pattern generator (CPG). The CPG generates waves of muscleactivity that travel from head to tail, which then bend the body intowave shapes that also travel from head to tail. In many fishes, thewavelengths of the neural and mechanical waves are different, result-ing in a rostral-to-caudal gradient in phase lag between muscleactivity and bending. The neural basis of this phase gradient wasinvestigated in the lamprey spinal cord using an isolated in vitropreparation. Fictive swimming was induced using D-glutamate and theoutput of the CPG was measured using suction electrodes placed onthe ventral roots. The spinal cord was bent sinusoidally at variouspoints along its length. First, the ranges of entrainment were esti-mated. Middle segments were able to entrain to frequencies approx-imately twice as high as those at end segments. Next, phase lagsbetween centers of ventral root bursts and the stimulus were deter-mined. Two halves of the cycle were identified: stretching andshortening of the edge of spinal cord on the same side as the electrode.Stimuli at rostral segments tended to entrain segmental bursting at thebeginning of the stretch phase, almost 50% out of phase with previ-ously measured in vivo electromyography data. Stimuli at caudalsegments, in contrast, entrained segments at the end of stretch and thebeginning of shortening, approximately the same phase as in vivodata.
I N T R O D U C T I O N
In vertebrates, the basic pattern for rhythmic movements likeswimming and walking is generated by a group of spinalinterneurons that form a locomotor central pattern generator(CPG; Cohen and Wallen 1980). The vertebrate locomotorCPG consists of repeated oscillatory subunits, each of whichgenerates bursts that are phase-locked to the other oscillators(Grillner 1985). In the lamprey, for instance, unit oscillatorsrepeat segmentally and maintain a consistent phase offset,producing a traveling wave of neural activity that activates theaxial muscles, producing the undulatory swimming wave(Wallen and Williams 1984).
Although the CPG can generate this rhythm independentlyof sensory input, it is strongly affected by sensory information,particularly proprioceptive inputs. Impulsive stimuli can resetthe CPG rhythm (McClellan and Jang 1993). Rhythmic stimulitend to cause CPG burst frequency to approach the stimulusfrequency, a phenomenon called entrainment (Grillner 1974;Marder and Bucher 2001). Proprioception in the lamprey is
mediated by stretch receptive neurons called edge cells that arelocated on the margins of the spinal cord (Grillner et al. 1984).Edge cells are similar to mammalian spindle organs in theirproperties and their effect on the CPG (Viana Di Prisco et al.1990): they respond to both static stretch and the rate of stretch(Grillner et al. 1982), inhibiting the contralateral CPG unitwhile exciting the ipsilateral one (Viana Di Prisco et al. 1990).Like spindle organs, they receive phasic inhibition from theCPG, which reduces their excitability in phase with the CPGoutput. This inhibition potentially removes some of the influ-ence of the excitation that would be caused by self-imposedbody bending (Vinay et al. 1996), much like the inhibition ofspindle organs during stepping (Gossard 1996). The proprio-ceptive organ is not known in other fishes, except for elasmo-branchs (Bone 1978).
Sensory feedback and entrainment of the locomotor CPG arefunctionally important in fishes and tetrapods to correct forperturbations (McClellan and Jang 1993; Pearson 1995) and totune the locomotory rhythm to the mechanical properties of thebody and environment (Guan et al. 2001; Hatsopoulos andWarren 1996; Iwasaki and Zheng 2006; Williams and DeWeerth2007). More generally, proprioceptive sensory input influencesthe relative timing of body movement and CPG activity andthus the timing of muscle activity relative to body movement.This phase relationship can have profound consequences forenergy use and force output. When muscles are activated asthey are shortening, they produce energy for locomotion buthave relatively low forces (McMahon 1984). In contrast, whenmuscles are active while they are forcibly stretched, theyabsorb energy but produce much higher forces (McMahon1984).
It may be that different segments along the spinal cordrespond differently to sensory inputs. Nonetheless, unit oscil-lators in the CPG have often been assumed to be identical, bothin their intrinsic properties and in their response to sensoryinput. This simplifying assumption has been essential in pro-ducing mathematical models of the CPG (e.g., Cohen et al.1982; Ekeberg and Grillner 1999; Williams 1992), but there issome evidence that it may not be valid. The intrinsic frequen-cies of CPG oscillators appear to differ along the spinal cord,possibly varying randomly (Cohen 1987) or with a gradient(Hagevik and McClellan 1999). Additionally, rostral segmentsentrain over a narrower range of frequencies than caudalsegments (McClellan and Sigvardt 1988; Williams et al. 1989).
Other evidence for the variation in the CPG’s response tostimuli comes mostly from electromyographic studies of freely
Address for reprint requests and other correspondence: E. D. Tytell, De-partment of Biology, Biology/Psychology Building, University of Maryland,College Park, MD 20742 (E-mail: [email protected]).
The costs of publication of this article were defrayed in part by the paymentof page charges. The article must therefore be hereby marked “advertisement”in accordance with 18 U.S.C. Section 1734 solely to indicate this fact.
J Neurophysiol 99: 2408–2419, 2008.First published February 6, 2008; doi:10.1152/jn.01085.2007.
2408 0022-3077/08 $8.00 Copyright © 2008 The American Physiological Society www.jn.org
on April 14, 2015
Dow
nloaded from

swimming fishes (Wardle et al. 1995). For example, in thelamprey, the CPG generates a wave of neural activity with awavelength slightly longer than the body length (Williamset al. 1989). This neural wave activates the axial musculature,generating force to bend the body, but the resulting curvaturehas a wavelength of only about 0.7 body lengths (Williamset al. 1989). Because of the different wavelengths of the neuraland mechanical waves, the phase relationship between themchanges along the length of the body. Close to the head, theCPG activates the muscle on one side of the body just after ithas been maximally stretched, so that it shortens while it isactive (called a “concentric” contraction; McMahon 1984) andproduces energy for locomotion. Close to the tail, however,muscle segments turn on later relative to bending, first short-ening slightly then being forcibly stretched (called an “eccen-tric” contraction), which generates little net work or evenabsorbs energy (Wardle et al. 1995).
Although the presence and physical consequences of thephase shift have been debated extensively, a different butrelated question has received little attention. Is the phasedifference a result of rostral-to-caudal differences in the CPGitself or is it a consequence of body and fluid properties? Someof the lag could be a consequence of the variation in bodyshape along a fish’s length. In the lamprey, the greater thick-ness of the rostral body causes it to be stiffer than the caudalarea, whereas the dorsal and anal fins in the caudal regionscause them to have a higher fluid dynamic drag coefficient.These physical differences could alter the phase relationshipbetween muscle force and body bending. Additionally, thelength and velocity dependence of muscle (McMahon 1984)could have an effect. Because of the higher amplitude near thetail, the caudal muscles must produce faster and larger con-tractions than rostral muscles (Rome et al. 1993). On the otherhand, proprioceptors or the segmental oscillators themselvesmay respond to bending at different phases, encoding the phaseshift neurally.
Therefore in this study we investigate how the lamprey CPGentrains to mechanical stimuli at different locations along thespinal cord. We examine both entrainment ranges and thephase relationship between CPG activity and an imposedsinusoidal bending stimulus. This question was preliminarilyaddressed by Sigvardt and Williams (1989) who found that abending stimulus applied to the rostral end of a isolated spinalcord preparation will entrain the CPG at a different phase offsetthan when the same stimulus is applied to the caudal end(reviewed in Williams et al. 1995). The phase differences theyobserved were similar to those seen in freely swimming ani-mals.
We follow up their work in more detail, examining the phaserelationship between bending and CPG bursting at many pointsalong the isolated lamprey spinal cord. We address two alter-native hypotheses about how the phase gradient could arise.First, such differences could be an artifact of the dissectionprocedure. Because a portion of the spinal cord is cut outduring the dissection, the rostral end of the preparation receivesmore ascending inputs than descending and the caudal endreceives more descending inputs than ascending. Under thishypothesis, even though CPG oscillators and edge cells areequivalent along the length of the spinal cord, the differencesin ascending and descending coupling (Kiemel et al. 2003;McClellan and Hagevik 1999; Williams et al. 1990) cause the
CPG to respond differently to stimulation at the rostral orcaudal ends of the preparation. In this case, any excised sectionof spinal cord should display a gradient, even if all of thesegments are from the tail region of the animal.
Alternatively, some aspect of the edge cells or the CPG itselfmay differ at different anatomical locations (as has beenobserved in Xenopus embryos; Tunstall and Roberts 1994). Ifthe spinal cord does have some sort of anatomical heterogene-ity like this, then sections of the cord from different locationsshould entrain to bending at different phases, regardless of thelength of the section. By examining entrainment in progres-sively shorter sections of the spinal cord, we are able todistinguish between our two mechanistic hypotheses.
Preliminary results of this study have been published inabstract form (Tytell and Cohen 2007).
M E T H O D S
Fictive swimming protocol
Adult lampreys, Ichthyomyzon unicuspis, were obtained from fish-ermen along Lake Michigan (U.S.) and kept in aerated aquaria at 4°C.
The dissection protocol was as follows. Animals were first anes-thetized using buffered MS222 (0.2 g/l) then rapidly decapitated andeviscerated. The skin and muscle were peeled away from the noto-chord. Approximately 50 spinal segments, from the last gill slit to theanus, were exposed. Care was taken to avoid damaging the motornerves, which run along the notochord, when removing the muscletissue. All membranes dorsal to the spinal cord were removed and thepreparation was transferred to a bath of physiological saline (NaCl, 91mM; KCl, 2.1 mM; CaCl2 �2H2O, 222.6 mM; MgCl2 �6H2O, 1.8 mM;glucose, 4.0 mM; NaHCO3, 20.0 mM) at 9°C. Oxygen was occasion-ally bubbled through the saline.
Fictive swimming was induced using D-glutamate at concentrationsranging from 0.35 to 1 mM, adjusting the concentration to achieve astable rhythm. Resulting frequencies ranged from 0.5 to 1.3 Hz andhad no apparent correlation with glutamate concentration. Once anexperiment was started, the glutamate concentration was kept con-stant. CPG output was measured either at the ventral roots inside thespinal cord canal or the motor nerves on the outside of the notochord,using glass suction microelectrodes filled with saline. At least twoelectrodes were used for each preparation. Signals from the electrodeswere amplified and filtered using a differential amplifier (Model 1700,A–M Systems, Carlsborg, WA). The signals were then digitized at 5kHz using a data acquisition card (PCI-6221, National Instruments,Austin, TX) and stored to disk for later analysis.
All animal procedures were approved by the University of Mary-land Institutional Animal Care and Use Committee (approval numberR-R-05-46).
Terminology
To avoid confusion, the terms “rostral” and “caudal” are usedthroughout only to mean the rostral and caudal ends of the prepara-tion, even if all segments in the preparation come from the tail region(i.e., the anatomically caudal end of the body). We will refer toanatomically rostral and caudal segments as coming from the “head”or “tail” region. Finally, when the stimulus is rostral to the recordingsite, it will be called “above” or “higher” than the recording, whereasa stimulus caudal to the recording site will be called “below” or“lower” than the recording.
Bending
The preparation was set up for bending stimulation by pinning partof it securely through the notochord, leaving a portion of the spinal
2409ROSTRAL VERSUS CAUDAL DIFFERENCES IN CPG ENTRAINMENT
J Neurophysiol • VOL 99 • MAY 2008 • www.jn.org
on April 14, 2015
Dow
nloaded from
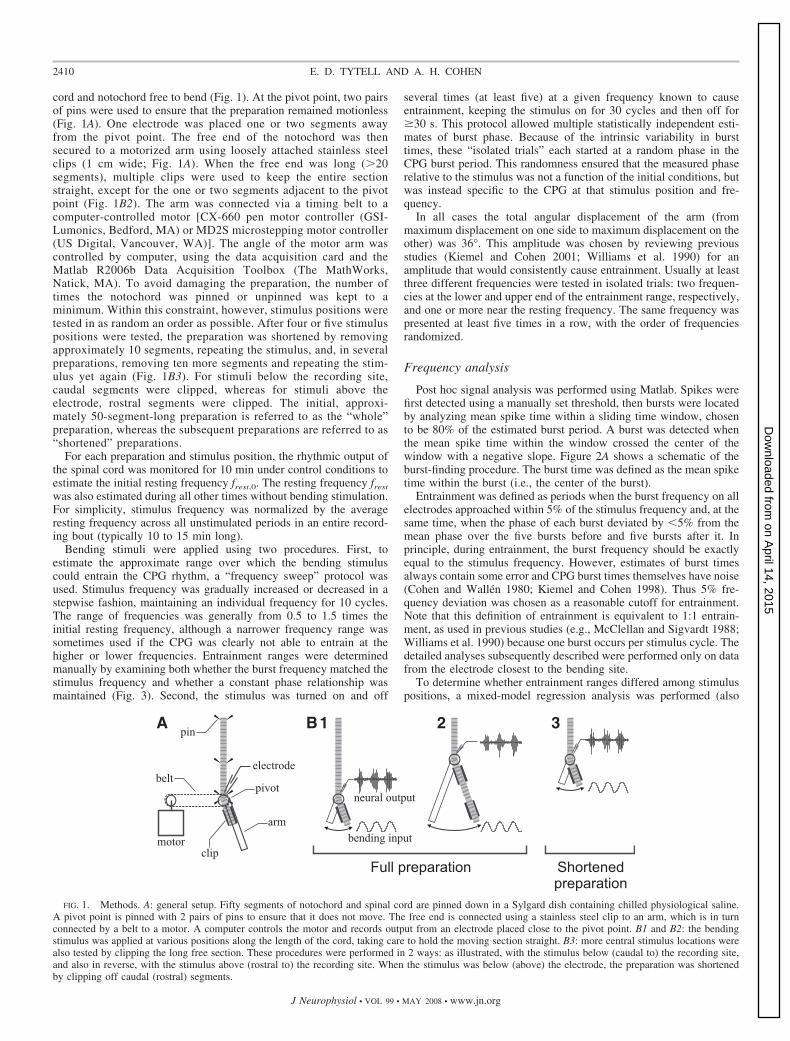
cord and notochord free to bend (Fig. 1). At the pivot point, two pairsof pins were used to ensure that the preparation remained motionless(Fig. 1A). One electrode was placed one or two segments awayfrom the pivot point. The free end of the notochord was thensecured to a motorized arm using loosely attached stainless steelclips (1 cm wide; Fig. 1A). When the free end was long (�20segments), multiple clips were used to keep the entire sectionstraight, except for the one or two segments adjacent to the pivotpoint (Fig. 1B2). The arm was connected via a timing belt to acomputer-controlled motor [CX-660 pen motor controller (GSI-Lumonics, Bedford, MA) or MD2S microstepping motor controller(US Digital, Vancouver, WA)]. The angle of the motor arm wascontrolled by computer, using the data acquisition card and theMatlab R2006b Data Acquisition Toolbox (The MathWorks,Natick, MA). To avoid damaging the preparation, the number oftimes the notochord was pinned or unpinned was kept to aminimum. Within this constraint, however, stimulus positions weretested in as random an order as possible. After four or five stimuluspositions were tested, the preparation was shortened by removingapproximately 10 segments, repeating the stimulus, and, in severalpreparations, removing ten more segments and repeating the stim-ulus yet again (Fig. 1B3). For stimuli below the recording site,caudal segments were clipped, whereas for stimuli above theelectrode, rostral segments were clipped. The initial, approxi-mately 50-segment-long preparation is referred to as the “whole”preparation, whereas the subsequent preparations are referred to as“shortened” preparations.
For each preparation and stimulus position, the rhythmic output ofthe spinal cord was monitored for 10 min under control conditions toestimate the initial resting frequency frest,0. The resting frequency frest
was also estimated during all other times without bending stimulation.For simplicity, stimulus frequency was normalized by the averageresting frequency across all unstimulated periods in an entire record-ing bout (typically 10 to 15 min long).
Bending stimuli were applied using two procedures. First, toestimate the approximate range over which the bending stimuluscould entrain the CPG rhythm, a “frequency sweep” protocol wasused. Stimulus frequency was gradually increased or decreased in astepwise fashion, maintaining an individual frequency for 10 cycles.The range of frequencies was generally from 0.5 to 1.5 times theinitial resting frequency, although a narrower frequency range wassometimes used if the CPG was clearly not able to entrain at thehigher or lower frequencies. Entrainment ranges were determinedmanually by examining both whether the burst frequency matched thestimulus frequency and whether a constant phase relationship wasmaintained (Fig. 3). Second, the stimulus was turned on and off
several times (at least five) at a given frequency known to causeentrainment, keeping the stimulus on for 30 cycles and then off for�30 s. This protocol allowed multiple statistically independent esti-mates of burst phase. Because of the intrinsic variability in bursttimes, these “isolated trials” each started at a random phase in theCPG burst period. This randomness ensured that the measured phaserelative to the stimulus was not a function of the initial conditions, butwas instead specific to the CPG at that stimulus position and fre-quency.
In all cases the total angular displacement of the arm (frommaximum displacement on one side to maximum displacement on theother) was 36°. This amplitude was chosen by reviewing previousstudies (Kiemel and Cohen 2001; Williams et al. 1990) for anamplitude that would consistently cause entrainment. Usually at leastthree different frequencies were tested in isolated trials: two frequen-cies at the lower and upper end of the entrainment range, respectively,and one or more near the resting frequency. The same frequency waspresented at least five times in a row, with the order of frequenciesrandomized.
Frequency analysis
Post hoc signal analysis was performed using Matlab. Spikes werefirst detected using a manually set threshold, then bursts were locatedby analyzing mean spike time within a sliding time window, chosento be 80% of the estimated burst period. A burst was detected whenthe mean spike time within the window crossed the center of thewindow with a negative slope. Figure 2A shows a schematic of theburst-finding procedure. The burst time was defined as the mean spiketime within the burst (i.e., the center of the burst).
Entrainment was defined as periods when the burst frequency on allelectrodes approached within 5% of the stimulus frequency and, at thesame time, when the phase of each burst deviated by �5% from themean phase over the five bursts before and five bursts after it. Inprinciple, during entrainment, the burst frequency should be exactlyequal to the stimulus frequency. However, estimates of burst timesalways contain some error and CPG burst times themselves have noise(Cohen and Wallen 1980; Kiemel and Cohen 1998). Thus 5% fre-quency deviation was chosen as a reasonable cutoff for entrainment.Note that this definition of entrainment is equivalent to 1:1 entrain-ment, as used in previous studies (e.g., McClellan and Sigvardt 1988;Williams et al. 1990) because one burst occurs per stimulus cycle. Thedetailed analyses subsequently described were performed only on datafrom the electrode closest to the bending site.
To determine whether entrainment ranges differed among stimuluspositions, a mixed-model regression analysis was performed (also
pivotbelt
Full preparation Shortenedpreparation
31BA
bending input
neural output
motor
electrode
arm
clip
2pin
FIG. 1. Methods. A: general setup. Fifty segments of notochord and spinal cord are pinned down in a Sylgard dish containing chilled physiological saline.A pivot point is pinned with 2 pairs of pins to ensure that it does not move. The free end is connected using a stainless steel clip to an arm, which is in turnconnected by a belt to a motor. A computer controls the motor and records output from an electrode placed close to the pivot point. B1 and B2: the bendingstimulus was applied at various positions along the length of the cord, taking care to hold the moving section straight. B3: more central stimulus locations werealso tested by clipping the long free section. These procedures were performed in 2 ways: as illustrated, with the stimulus below (caudal to) the recording site,and also in reverse, with the stimulus above (rostral to) the recording site. When the stimulus was below (above) the electrode, the preparation was shortenedby clipping off caudal (rostral) segments.
2410 E. D. TYTELL AND A. H. COHEN
J Neurophysiol • VOL 99 • MAY 2008 • www.jn.org
on April 14, 2015
Dow
nloaded from

called ANCOVA; Milliken and Johnson 2001). Fixed effects in themodel were the stimulus position and position squared. The individualwas included as a random categorical effect. Interaction terms with theindividual effect were included only if the main effects were signif-icant (Milliken and Johnson 2001). Statistics were performed usingMatlab’s anovan function.
Isolated trials were used to determine an approximate entrainmentprobability. Each 30-cycle trial was classified as entrained or not,based on the preceding criteria. Stimulus frequencies were collectedinto 10 bins across each entrainment range, estimated using a fre-quency sweep. The number of isolated trials in each frequency bindivided by the total number of trials in that bin defined an approximateprobability of entrainment.
Phase analysis
The phase at the center of the burst was defined relative to thestimulus, subtracting the time at which the stimulus last reached itsmaximum position on the same side as the electrode and dividing bythe stimulus period. Phase values thus ranged from 0 to 1; values from0 to 0.5 indicate that the center of the burst occurs when the muscleon that side of the body (ipsilateral) would be lengthening, whereasvalues from 0.5 to 1 indicate when the ipsilateral muscle would beshortening. Figure 2B illustrates the definition of phase. It should benoted that bursts typically last about 30% of a cycle (Wallen andWilliams 1984); thus a phase value of 0.5 at the center of the burstmeans that the burst occurs for about 15% of the cycle duringlengthening and about 15% during shortening. Statistics on phasemeasurements were performed using circular algorithms, imple-mented in Matlab, based on those described by Fisher (1995).
At least five isolated trials of bending at the resting burst frequencywere conducted at each position. The median phase (Fisher 1995) ineach trial was estimated, using the median to avoid influence of theearly period of each trial in which the phase converged to its steadyvalue (e.g., Fig. 3B). Then, for each individual and stimulus position,all trials were averaged and compared among stimulus positions andpreparation types (whole vs. shortened). Comparisons were performedusing a nonparametric circular test for a common median amonggroups (Fisher 1995). For all N data points, estimate the median phase�. Then mi is the number of phase values in group i between � � 0.5and �. Also let M � m1 � m2 � . . . � mr, where r is the number ofgroups. The test statistic is
Pr �N2
M�N � M��i�1
r �mi2
ni
�NM
�N � M�� (1)
where ni is the number of values in group i. According to Fisher(1995), Pr is distributed as �r�1
2 . If the groups were significantlydifferent, pairwise comparisons were performed using the same testwith a Bonferroni correction to avoid false positives arising frommultiple comparisons (Zar 1999).
Ts Ts
tb tb
0 0.5 1(=0) 0.5 1Phase:
-0.5
0
0.5
tspike
tekips
A
B
1
1
2
2
FIG. 2. Data analysis. A: schematic of the burst finding method. First,spikes (shown as vertical bars in panel 1) are located according to a manualthreshold. Then, the mean spike time within a sliding window is estimated.Example windows with mean spike times are shown as horizontal bars andcircles, respectively, above the spikes. Mean spike time tspike is definedrelative to the center of each window. Bursts are located when tspike crosseszero with a negative slope (squares in panel 2). B: definition of phase.Trace 1 shows an example ventral root recording; trace 2 shows thestimulus. For each burst in the top trace, the burst time is estimated as themean of the spike times within the burst (circles). Stimulus cycles aredefined as the period Ts from one maximum excursion on the same side asthe recording to the next (vertical lines). For each burst, tb is defined asthe duration between the burst time and the time when the stimulus was lastat its maximum excursion on the same side as the electrode. The phase(bottom axis) is thus equal to tb/Ts and ranges from 0 to 1, where 0 to 0.5indicates that the burst is centered during the time when ipsilateral musclewould be lengthening, whereas 0.5 to 1 (gray region) indicates thatipsilateral muscle would be shortening.
50V
0
0.5
1
esahP
2 sec
-18018
sulumit
S)ged(
elgna
A
B
1
2
FIG. 3. An example of entrainment. Finalentrainment phase is consistent regardless ofthe initial phase relationship between burstsand the stimulus. Both panels show the same5 successive presentations of a bending stim-ulus at 0.79 Hz to a cord with a restingfrequency of 0.73 Hz. A: ventral root record-ings (panel 1) and stimulus angle (panel 2).Bursts are marked with open symbols andthe shortening phase of bending is indicatedwith gray bars. B: phase of the bursts withrespect to bending. Symbols are the same asin A. Phase from 0 to 0.5 indicates lengthen-ing on the side of the electrode, whereas 0.5to 1 indicates shortening.
2411ROSTRAL VERSUS CAUDAL DIFFERENCES IN CPG ENTRAINMENT
J Neurophysiol • VOL 99 • MAY 2008 • www.jn.org
on April 14, 2015
Dow
nloaded from

R E S U L T S
In all, 10 individuals (total length: 25 to 33 cm; mean 28 1 cm) were used throughout this study. For each individual,bending stimuli were tested at four or more positions along thepreparation.
The CPG burst frequency was first measured using anelectrode at a position close to the stimulus (within twosegments) without bending stimuli to determine the initialresting frequency. This frequency was not constant during theexperiment; it tended to increase after bending stimuli. Aftereach round of entrainment, the burst frequency would decayback toward the resting frequency, but would stabilize slightlyabove it, similar to the effect described by Kiemel and Cohen(2001) and McClellan and Sigvardt (1988). The frequencyincrease was sometimes quite long-lasting, gradually returningto the initial resting frequency over the course of many minutes(data not shown). Sham tests were performed in which the bathwas stirred at the bending frequency without actually bendingthe spinal cord; no frequency increase was observed (data notshown). For simplicity, stimulus frequency throughout is nor-malized by the mean resting frequency over the course of about of stimulation.
Figure 3 shows an example of entrainment during an isolatedtrial. Thirty cycles of a stimulus at 1.08frest were applied, thenthe stimulus was turned off for 30 s. This procedure wasrepeated five times (shown as successive rows is Fig. 3A1). Ineach case, burst phase stabilized at about 0.5, although it took14 bursts in the first case. Note that the one trace that took sucha long time to converge in Fig. 3B is an extreme example: burstphase generally converged much more rapidly, usually withinone or two cycles, like the other traces in Fig. 3.
Entrainment ranges
Entrainment as shown in Fig. 3 could be produced over arange of stimulus frequencies. The entrainment range wasdetermined by gradually increasing or decreasing the stimulusfrequency. At each position, such “frequency sweeps” gener-ally produced clear entrainment in the entire spinal cord over arange of bending frequencies (Fig. 4A1). Stimulation at fre-quencies beyond the entrainment range often produced highlyvariable burst frequencies (note the burst frequencies at timesjust before and after entrainment in Fig. 4A1). As stimulusfrequency changed, the phase relationship between bursts and
the bending stimulus changed (Figs. 4A2 and 4B). In thecurrent convention for phase, phase generally increased withincreasing frequency or decreased with decreasing frequency.
Figure 5 shows all measured entrainment ranges plottedagainst the stimulus position. In total, 83 frequency sweepswere performed, 63 with frequency increasing and 20 withfrequency decreasing. Occasionally, the first or last frequencytested in a sweep caused entrainment, which meant that onlyone bound could be determined unambiguously (15 lowerbounds and 12 upper bounds; circles in Fig. 5). Frequencysweeps with increasing or decreasing frequency did not pro-duce different upper or lower bounds (paired t-test; P � 0.30,n � 16; data not shown) and are therefore considered together.In general, upper bounds tended to be highest for stimuluspositions near the middle of the spinal cord, whereas lowerbounds did not show systematic variation with position. To testthis observation, each bound was regressed against stimulusposition and stimulus position squared. The individual wasincluded as a random, categorical effect (Milliken and Johnson2001) to estimate and control for individual variance in thepopulation. Table 1 shows the results of this analysis. Upperbounds had a significant relationship to position and positionsquared, whereas lower bounds had no significant relationshipto position (Fig. 5). The estimated population SD was substan-tially larger for the upper bounds: 0.10frest for the upper boundand 0.048frest for the lower.
These entrainment ranges do not appear to define strictboundaries within which entrainment always occurred, butrather regions of high probability of entrainment. Because twodifferent stimulation protocols were used (frequency sweepsand isolated trials), the isolated trials could be used to probe theproperties of entrainment ranges as determined by frequencysweeps. Figure 6 shows the estimated probability of entrain-ment for isolated trials at specific frequencies. In Fig. 6A,frequency has been normalized by the entrainment range (de-termined by a frequency sweep) for the specific individual andstimulus position, so that 0 and 1 respectively represent thelower and upper bounds of entrainment. In isolated trials,entrainment was possible at normalized frequencies below 0 orabove 1, but it was less likely than entrainment at frequenciesbetween 0 and 1. Additionally, entrainment is more likely atthe upper end of the frequency range than at the lower end. InFig. 6B, frequency has been normalized by the resting fre-quency, showing that entrainment is much less likely below
2 sec
0.6
0.8
1
60 sec
)zH(
ycneuqerF
0
0.5
1
esahP
50 V
BA
1
2
3
4
1 2 3 4
bursts stimulus
1
2
FIG. 4. The spinal cord entrains to arange of bending frequencies, but burstphase relative to the stimulus changes asbending frequency changes. A: burst andstimulus frequency (panel 1) and burst phaserelative to the stimulus (panel 2). Verticaldashed lines indicate the times of corre-sponding numbered traces in B. Stimulusfrequency ranged from 1.75 to 0.75frest,where frest was 0.8 Hz. B: example tracesfrom A. Top traces are ventral root record-ings. Bottom traces are the stimulus angle.Note the changing phase relationship.
2412 E. D. TYTELL AND A. H. COHEN
J Neurophysiol • VOL 99 • MAY 2008 • www.jn.org
on April 14, 2015
Dow
nloaded from

than above the resting frequency (as previously observed;McClellan and Sigvardt 1988; Williams et al. 1990).
Rostral-to-caudal phase differences
At a given frequency and stimulus position, the burst phaseduring entrainment returned to the same approximate value.For an example, see Fig. 3B. To determine whether differentportions of the spinal cord responded at different phases to abending stimulus, the burst phase was estimated during bend-ing close to the resting frequency. For each individual andposition, at least five separate trials containing 30 cycles ofbending were performed. The angular median burst phase ineach trial was estimated. Each trial was assumed to be statis-tically independent of the others. Figure 7A shows exampleventral root recordings during rostral and caudal entrainment
from two different individuals (Fig. 7, A1 and A2 from oneindividual; Fig. 7, A3 and A4 from another). Figure 7B1 showsmean phase for whole preparations (n � 47), whereas Fig. 7B2shows the means for shortened preparations (n � 15).Throughout the figure, closed symbols indicate whole prepa-rations, whereas open symbols represent shortened prepara-tions. Squares indicate that the stimulus was below (caudal to)the recording site, whereas circles indicate a stimulus above(rostral to) the recording.
Stimuli near the head resulted in different burst phases thanthose near the tail. For each individual animal, there was adiscrete transition between the two phase values at somesegment near the middle of the preparation. Because thistransition point differed among preparations, the phase valuesat middle segments show a mixture of both phases (Fig. 7B). In
).qerftserx(
ycneuqerF
Stimulus position (segments)
upper
lowerincreasing
decreasing
single
1.78
0504030201
0.8
1
1.2
1.4
1.6
0.61
FIG. 5. Maximum entrainment frequency is higher at middle segments relative to the rostral or caudal end. Entrainment ranges were determined by graduallyincreasing or decreasing bending frequency and noting when burst frequency matched the bending frequency. Lower and upper bounds are shown with closedand open symbols, respectively, and vertical lines connect the bounds from the same test. Tests with increasing or decreasing frequency are indicated with upor down triangles, respectively. Sometimes only a lower or upper bound could be determined in a test; these are shown with closed and open circles, respectively.Thick solid and dashed lines show the significant terms from the regression of lower and upper bounds against position. Thin lines around the regression linesindicate the estimated population SD. One outlier is shown truncated. Data are from whole and shortened preparations.
TABLE 1. Results of regression analysis
Source Type SS df1 MS F df2 P
A. Lower bound
position Fixed 0.0017 1 0.0017 0.27 59 0.608position2 Fixed 0.0006 1 0.0006 0.10 59 0.750individual Random 0.1981 9 0.0220 3.50 59 0.002error 0.3714 59 0.0062
B. Upper bound
position Fixed 0.1609 1 0.1609 11.77 10.98 0.006position2 Fixed 0.1554 1 0.1554 13.72 12.38 0.003individual Random 0.1085 9 0.0121 1.38 38 0.231position � individual Random 0.1309 9 0.0145 1.67 38 0.131position2 � individual Random 0.1076 9 0.0120 1.37 38 0.235error 0.3314 38 0.0087
Statistics for the terms in the regression analysis for both lower and upper entrainment bounds (Fig. 5) are shown: SS, sum of squares; df1, degrees of freedomfor the term itself; MS, mean squares; F, F statistic; df2, denominator degrees of freedom for the F test; P, probability. Significant effects are shown in bold.
2413ROSTRAL VERSUS CAUDAL DIFFERENCES IN CPG ENTRAINMENT
J Neurophysiol • VOL 99 • MAY 2008 • www.jn.org
on April 14, 2015
Dow
nloaded from

Fig. 7C, a histogram of data across all positions demonstratesthat phase is bimodal.
These results are summarized in Fig. 7D, which shows themedian and angular deviation of burst phase, grouped into fivebins according to the position of the stimulus. Phases weresignificantly different among positions (�4
2 � 13.1; P � 0.011).Pairwise comparisons indicated that the most rostral phase (bin1) was significantly different from the two most caudal (bins 4and 5), but that bins 2 and 3 were not significantly differentfrom any of the others. The head and tail phases differed by0.31, on average.
In contrast, whole and shortened preparations tended toproduce the same phase values. Figure 7B2 shows the phasesfrom the shortened preparations (open symbols), comparedwith those from whole preparations (gray symbols). The me-dian phases for the shortened preparations are summarizedwith open symbols in Fig. 7, C and D. Data from whole andshortened preparations were compared within each bin. Nogroups were significantly different (P values of 0.80, 0.41, and0.15 for bins 2, 3, and 4, respectively).
Finally, the position of the stimulus relative to the electrodedid not appear to affect the estimated burst phase. In Fig. 7A,squares (circles) indicate a stimulus above (below) the record-ing site. Too few data were available for a rigorous statistical
test, but visual inspection suggests that the squares and circlesfollow the same general pattern.
The data shown in Fig. 7 are widely scattered. This scattermay in part reflect changes in the preparation over the courseof the experiment. For example, suppose that the restingfrequency was 0.8 Hz at the beginning of an experiment.However, after each trial of stimulation at 0.8 Hz, the restingfrequency typically increased, so that whereas the first trialmight have been at 1.0frest, the fifth trial was at 0.95frest. Someof the scatter in Fig. 7 may be due to this difficulty in bendingthe spinal cord precisely at its resting frequency. Thus theapparent variability of the phase values from central segmentsreflects the bimodality of phases, not differences in stimulationfrequency.
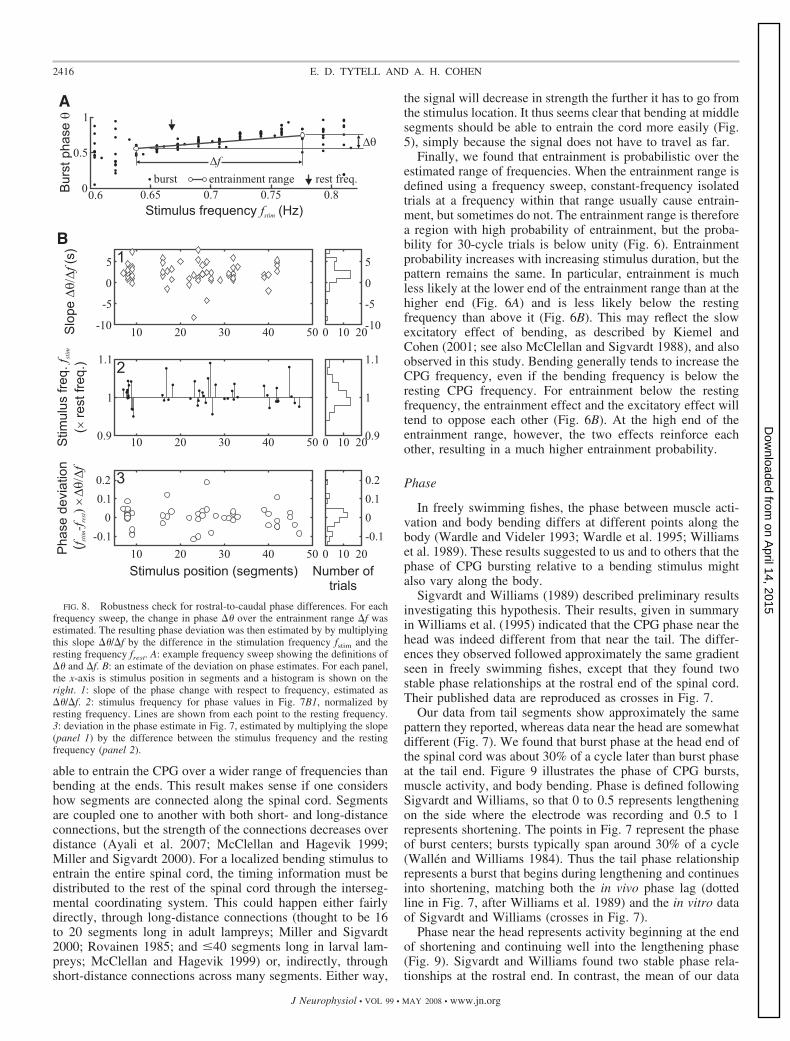
To determine the robustness of the pattern shown in Fig. 7,we examined the effect of changes in stimulus frequency on thephase of entrainment. One reason the phases in Fig. 7 havesome scatter is because the stimulus frequency was not pre-cisely at the resting frequency. Because of the excitatory effectof bending, the resting frequency tended to increase over time,even within a single recording bout. It was therefore notfeasible to bend the cord exactly at the resting frequency. Toassess the effect of this methodological limitation, we esti-mated the slope of the phase change with respect to stimulusfrequency (Fig. 8, A and B1) and multiplied that by thedifference between the stimulus frequency and the rest fre-quency (Fig. 8B2) to estimate a deviation in phase (Fig. 8B3).The stimulus frequency used to produce Fig. 7B was 1.02 0.05frest (mean SD) and did not differ among stimuluspositions [ANOVA; F(4,59) � 1.44; P � 0.23; Fig. 8B2]. Theresulting deviation was centered around zero (Fig. 8B3) and95% of measurements had deviations within 0.13 of zero.The largest deviation was �0.27. All of the deviations wereless than the phase difference between the head and the tailregions of the cord, which was 0.31. Therefore the patternshown in Fig. 7 appears to be robust.
D I S C U S S I O N
This study examines how bending stimuli can entrain thelamprey central pattern generator (CPG) and whetherthe entrainment response differs depending on the position ofthe stimulus along the spinal cord. We found two main differ-ences along the spinal cord. First, bending near the center of aspinal cord preparation can entrain the CPG over almost twicethe range of stimulus frequencies than bending at the ends (Fig.5). Second, the phase relationship between CPG bursts and thebending stimulus is about 30% of a cycle different for bendingat the head versus the tail end (Fig. 7). In the following text, wefirst discuss the entrainment range results, then we examine ourphase results and their relationship to our two hypotheses.
Entrainment ranges
To the authors’ knowledge, this is the first study to examineentrainment ranges as a function of stimulus position over alarge portion of the spinal cord. Previous studies have exam-ined entrainment ranges during bending at the rostral or caudalends (McClellan and Sigvardt 1988; Williams et al. 1990).These studies both found that a rostral stimulus could entrainthe spinal cord only above the resting frequency, whereas a
-0.2 0 0.2 0.4 0.6 0.8 1 1.20
0.5
1
Stimulus frequency (fraction of entrainment range)
ytilibaborptnemniartn
Eytilibaborptne
mniartnE
0.7 0.8 0.9 1 1.1 1.2 1.3 1.4 1.50
0.5
1
Stimulus frequency (x rest)
26 41 75 58 64 74 46 71 38 53 34 33 353
entrained
not entrained
17 62 213 449 145 60 35 10
entrained
not entrained
A
B
FIG. 6. The probability of entrainment varies over the entrainment range. Inboth plots, open bars show the probability of entrainment, estimated as thefraction of isolated trials that entrained for 30 stimulus cycles at a particularstimulus frequency. Gray bars show trials that were entrained at the end of 30cycles, but not at the beginning, and thus might have entrained if the stimuluswas applied for longer. Total number of trials in each bin is indicated along thetop of the plot. A: fraction of trials at frequency binned over the entrainmentrange for a particular individual and stimulus position. B: fraction of trials atfrequency binned relative to the resting burst frequency.
2414 E. D. TYTELL AND A. H. COHEN
J Neurophysiol • VOL 99 • MAY 2008 • www.jn.org
on April 14, 2015
Dow
nloaded from

caudal stimulus could entrain both above and below the restingfrequency. Our results do not show this asymmetry in entrain-ment ranges: we found no significant differences in the lowerentrainment bound at any position along the spinal cord (Fig. 5and Table 1). However, it is likely that the differences betweenour data and previous results reflect only methodological dif-ferences. In particular, our frequency sweep protocol is effec-tive for rapidly determining approximate entrainment ranges,but is somewhat limited in its ability to detect subtle differ-ences. Thus it showed the nearly twofold difference between
entrainment at middle segments compared with that at rostralor caudal segments (Fig. 5), but did not detect smaller differ-ences between rostral and caudal entrainment. Our experimentswere designed mainly to examine phase at the resting burstfrequency; more focused testing at the edges of the entrainmentranges would probably have shown differences in rostral andcaudal segments.
However, despite the limitations of the frequency sweepprotocol, our data clearly show that middle segments aredifferent from the head and tail ends: bending at the center is
A
1
2
3
4
R
C
R
C
5 10 15 20 25 30 35 40 45 500
0
0
0.25
0.25
0.5
0.50.5
0.75
0.75
1
1
1
e sahptsrubnae
Mesahptsrub
naeM
Stimulus location (segments)
3
4
1
2
5 10 15 20 25 30 35 40 45 50
B 1
2
C
D 2 3 4 5
0
0.250.75
0.5
10
0.25
0.5
0.75
5
FIG. 7. Entrainment phase differs along the spinal cord. A: example bursts during bending at the resting frequency. A1, A2: rostral and caudal entrainment,respectively, for one individual. Rest frequency differs slightly between traces, but is about 0.57 Hz. A3, A4: rostral and caudal entrainment for another individual(rest frequency �0.88 Hz). Scale bars are all equal to 1 s. A5: stimulus trace. Gray regions represent phase values from 0 to 0.5, equivalent to shortening onthe side of the recording. B: mean entrainment phase at the resting frequency. The stimulus position relative to the electrode is shown with squares (circles) whenthe stimulus was below (above) the recording site. Error bars indicate angular SD. Previous in vitro measurements from Sigvardt and Williams (1989) and invivo electromyographic (EMG) phase relationships from Williams et al. (1989) are shown with crosses and a dashed line, respectively. Vertical lines separatethe bins for stimulus position used for the plots in D. B1: whole preparations (�50 segments) shown with filled symbols. Numbered points correspond to thetraces shown in A. B2: shortened preparations shown with open symbols. Length of the preparations can be determined from the symbol. Squares (circles) indicatethat the original 50-segment preparation was cut about 10 segments above (below) the stimulus location. Segment numbering is the same as in panel 1. Tofacilitate comparison, the data from panel 1 are reproduced in gray in the background of panel 2. C: histogram of data from B. As before, closed (open) symbolsrepresent whole (shortened) preparations, whereas squares (circles) indicate that the stimulus was below (above) the recording site. Phase is represented clockwisefrom top. Bin size is 0.05. Note the bimodal distribution. D: clock plots of phase data with angular medians and deviations for whole and shortened preparations,grouped into 5 regions according to stimulus position. Phase is shown as an angle measured clockwise from top (numbers shown on first clock). Filled (open)arrows represent the median phase for whole (shortened) preparations with a gray region (arc) to represent the deviation.
2415ROSTRAL VERSUS CAUDAL DIFFERENCES IN CPG ENTRAINMENT
J Neurophysiol • VOL 99 • MAY 2008 • www.jn.org
on April 14, 2015
Dow
nloaded from
able to entrain the CPG over a wider range of frequencies thanbending at the ends. This result makes sense if one considershow segments are connected along the spinal cord. Segmentsare coupled one to another with both short- and long-distanceconnections, but the strength of the connections decreases overdistance (Ayali et al. 2007; McClellan and Hagevik 1999;Miller and Sigvardt 2000). For a localized bending stimulus toentrain the entire spinal cord, the timing information must bedistributed to the rest of the spinal cord through the interseg-mental coordinating system. This could happen either fairlydirectly, through long-distance connections (thought to be 16to 20 segments long in adult lampreys; Miller and Sigvardt2000; Rovainen 1985; and �40 segments long in larval lam-preys; McClellan and Hagevik 1999) or, indirectly, throughshort-distance connections across many segments. Either way,
the signal will decrease in strength the further it has to go fromthe stimulus location. It thus seems clear that bending at middlesegments should be able to entrain the cord more easily (Fig.5), simply because the signal does not have to travel as far.
Finally, we found that entrainment is probabilistic over theestimated range of frequencies. When the entrainment range isdefined using a frequency sweep, constant-frequency isolatedtrials at a frequency within that range usually cause entrain-ment, but sometimes do not. The entrainment range is thereforea region with high probability of entrainment, but the proba-bility for 30-cycle trials is below unity (Fig. 6). Entrainmentprobability increases with increasing stimulus duration, but thepattern remains the same. In particular, entrainment is muchless likely at the lower end of the entrainment range than at thehigher end (Fig. 6A) and is less likely below the restingfrequency than above it (Fig. 6B). This may reflect the slowexcitatory effect of bending, as described by Kiemel andCohen (2001; see also McClellan and Sigvardt 1988), and alsoobserved in this study. Bending generally tends to increase theCPG frequency, even if the bending frequency is below theresting CPG frequency. For entrainment below the restingfrequency, the entrainment effect and the excitatory effect willtend to oppose each other (Fig. 6B). At the high end of theentrainment range, however, the two effects reinforce eachother, resulting in a much higher entrainment probability.
Phase
In freely swimming fishes, the phase between muscle acti-vation and body bending differs at different points along thebody (Wardle and Videler 1993; Wardle et al. 1995; Williamset al. 1989). These results suggested to us and to others that thephase of CPG bursting relative to a bending stimulus mightalso vary along the body.
Sigvardt and Williams (1989) described preliminary resultsinvestigating this hypothesis. Their results, given in summaryin Williams et al. (1995) indicated that the CPG phase near thehead was indeed different from that near the tail. The differ-ences they observed followed approximately the same gradientseen in freely swimming fishes, except that they found twostable phase relationships at the rostral end of the spinal cord.Their published data are reproduced as crosses in Fig. 7.
Our data from tail segments show approximately the samepattern they reported, whereas data near the head are somewhatdifferent (Fig. 7). We found that burst phase at the head end ofthe spinal cord was about 30% of a cycle later than burst phaseat the tail end. Figure 9 illustrates the phase of CPG bursts,muscle activity, and body bending. Phase is defined followingSigvardt and Williams, so that 0 to 0.5 represents lengtheningon the side where the electrode was recording and 0.5 to 1represents shortening. The points in Fig. 7 represent the phaseof burst centers; bursts typically span around 30% of a cycle(Wallen and Williams 1984). Thus the tail phase relationshiprepresents a burst that begins during lengthening and continuesinto shortening, matching both the in vivo phase lag (dottedline in Fig. 7, after Williams et al. 1989) and the in vitro dataof Sigvardt and Williams (crosses in Fig. 7).
Phase near the head represents activity beginning at the endof shortening and continuing well into the lengthening phase(Fig. 9). Sigvardt and Williams found two stable phase rela-tionships at the rostral end. In contrast, the mean of our data
0.6 0.65 0.7 0.75 0.80
0.5
1
esahptsruB
A
B
burst entrainment range
Stimulus frequency (Hz)fstim
Stimulus position (segments)
rest freq.f
1)s(epol
Sf
-10
-5
0
5
-10
-5
0
5
.qerfsulu
mi tS
).qerftser(
fmits
2
0.9
1
1.1
0.9
1
1.1
10 20 30 40 50 0 10 20
3
noitaivedesah
P (f
f-f
tsermits
)
-0.100.10.2
-0.100.10.2
Number oftrials
10 20 30 40 50 0 10 20
10 20 30 40 50 0 10 20
FIG. 8. Robustness check for rostral-to-caudal phase differences. For eachfrequency sweep, the change in phase � over the entrainment range f wasestimated. The resulting phase deviation was then estimated by by multiplyingthis slope �/f by the difference in the stimulation frequency fstim and theresting frequency frest. A: example frequency sweep showing the definitions of� and f. B: an estimate of the deviation on phase estimates. For each panel,the x-axis is stimulus position in segments and a histogram is shown on theright. 1: slope of the phase change with respect to frequency, estimated as�/f. 2: stimulus frequency for phase values in Fig. 7B1, normalized byresting frequency. Lines are shown from each point to the resting frequency.3: deviation in the phase estimate in Fig. 7, estimated by multiplying the slope(panel 1) by the difference between the stimulus frequency and the restingfrequency (panel 2).
2416 E. D. TYTELL AND A. H. COHEN
J Neurophysiol • VOL 99 • MAY 2008 • www.jn.org
on April 14, 2015
Dow
nloaded from

matches just one of their points, the one that is furthest fromthe in vivo phase lag. We found no consistent rostral entrain-ment at a phase close to their second point or the in vivo phaselag. Our measurements, though, have a rather broad range(head deviation is almost twice the tail deviation; Fig. 7B). Itmay be that what Sigvardt and Williams observed was not twoseparate equilibrium phase values, but one broad and fairly flatequilibrium region.
Is the rostral-to-caudal phase gradient a real effect? Becausephase is proportional to stimulus frequency (Fig. 8), a system-atic bias toward higher frequencies for stimuli at the head couldtherefore produce a spurious correlation between stimulusposition and burst phase. Several lines of evidence suggest thisis not true and that the correlation is a real effect. First, therewas no systematic bias in stimulus frequency at certain posi-tions. Stimulus frequencies used to produce Fig. 7 did notdiffer among positions (P � 0.25; Fig. 8B2) and we random-ized the order in which we tested different stimulus positions,so that there would not be a bias as the preparation changedover time. Even if there was a systematic bias, however, itwould be unlikely to produce as large an effect as the one weobserved. The error on the phase measurements that wasattributable to misalignments between stimulus frequency andresting frequency was �0.13 in 95% of cases, but the phasedifference from the head to the tail end of the spinal cord wastypically around 0.3 cycle. Thus the differences shown in Fig.7 are robust.
What could cause the observed difference in entrainmentphase along the spinal cord? We proposed two hypotheses. Thefirst hypothesis suggests that the gradient is a side effect ofthe preparation method. By cutting out the spinal cord in thedissection, we altered the balance of ascending and descendinginputs at the rostral and caudal ends of the preparation, regard-less of whether the excised segments came from the anatomi-
cally head or tail end of the animal. Under this hypothesis, wewould expect phase to change if we cut the preparation andmade it shorter. Alternatively, under the second hypothesis,anatomically rostral segments may respond differently thananatomically caudal segments to bending stimuli. Cutting thepreparation would therefore not alter phase relationships.
Our data support the second hypothesis, not the first. Short-ening the preparation did not alter the entrainment phase(compare Fig. 7B1 to Fig. 6B2 and closed to open arrows inFig. 7D). Data from Sigvardt and Williams (1989) (reproducedas crosses in Fig. 7) also support the hypothesis that rostral andcaudal segments differ in some way. They used both a rostralstimulus and a caudal stimulus on an approximately 50-seg-ment preparation, then cut the preparation in half and appliedrostral and caudal stimuli to each of the new ends (T. L.Williams, personal communication). Anatomically caudal seg-ments entrained at a phase of about 0.5, like tail segments, not0.2 like head segments, even when those segments were at therostral end of the preparation.
Although our data strongly indicate that the rostral end of thelamprey spinal cord differs from the caudal end, they do notindicate what these anatomical differences may be. Manyresearchers have found variation in both the physiology andmorphology of CPG interneurons (see, e.g., Buchanan 1982;Buchanan and Cohen 1982; Parker 2003; Rovainen 1974,1982) as well as the edge cells themselves (Grillner et al. 1982;Viana Di Prisco et al. 1990). However, little is known whetherthese properties vary along the spinal cord and, if so, how theyvary. Our results could be explained by differences in edge cellresponse properties along the spinal cord or by different edgecell connections. Due to their position on the lateral margin ofthe spinal cord, edge cells are difficult to record from. Thusafter Viana Di Prisco et al. (1990) established the basic pattern,very few paired recordings have been conducted to determine
time (cycles)0 1
(noitisop
)L
0.50
0.5
1
1.250.25 57.052.0-
0.25
0.75
phase
0 1(=0)0.50.25 0.75 0.50.25
BA
concave leftcon
cave right
left v.r.
left EMG
L
R
L
R
C
11
2
2
flowflow
tailvel.tailvel.1
2
FIG. 9. Summary of current results and comparison with previous studies. A: diagram showing the timing of the left side ventral root bursts from the currentstudy (green boxes) and left side electromyography data from swimming lampreys (red bars; data from Williams et al. 1989). In each box, the center black lineand the error bars represent the mean timing and angular deviation of entrainment at the resting frequency (equivalent to data in Fig. 7D). Green boxes showthe mean timing of central pattern generator bursts, assuming a burst duration of 30% of a cycle. The progression of the body wave is shown underneath in yellowand blue, using a body wavelength of 0.72L (Williams et al. 1989). Blue and yellow indicate left side lengthening and shortening, respectively. Phase values areshown with diagonal lines: thick solid lines are zero phase (fully concave to the left side), thick dashed lines are 50% phase (fully concave to the right side),and thin solid and dashed lines are 25 and 75% phase, respectively. B: schematic of body curvature (black curves), muscle activity (red lines), and ventral rootbursts (green bars), plotted against phase. Two positions (1, caudal; 2, rostral) from A are represented. Numbers indicate timing of schematics in C. Amplitudeestimates from Wardle et al. (1995). C: schematic of tail motion and EMG activity shown in (B1). In panel 1, muscle has just become active (red bar) and theleft side is shortening (blue bar), moving water (“flow”) with the tail to the right (“tail vel.”). In panel 2, the left side is beginning to lengthen and the tail ismoving in the opposite direction, to the left. The water, however, continues to move to the right, producing a high pressure region on the tail. The muscle staysactive to resist the pressure from the water.
2417ROSTRAL VERSUS CAUDAL DIFFERENCES IN CPG ENTRAINMENT
J Neurophysiol • VOL 99 • MAY 2008 • www.jn.org
on April 14, 2015
Dow
nloaded from

further details of edge cell connectivity. Also, inter- or intra-segmental connectivity differences may influence entrainmentphase. For example, lateral interneurons are not present in thecaudal regions of the spinal cord (Rovainen et al. 1973).Finally, rostral versus caudal differences in interneuron ormotor neuron physiology (such as crossed caudal interneurons,which are known to vary substantially in their physiology;Buchanan 1982) could potentially produce the pattern weobserved. Such gradients have not been investigated in thelamprey, but in Xenopus embryos, Tunstall and Roberts (1994)observed a gradient in synaptic drive to motoneurons and inseveral properties of motoneuron spiking.
Future studies at a cellular level will be needed to establishbetween the mechanism that results in the observed differencesbetween rostral and caudal segments. Because our data show afairly discrete transition (Fig. 7), it seems reasonable to spec-ulate that there may be two separate rostral and caudal popu-lations of cells, either edge cells or CPG interneurons, that havedifferent response properties. Connectivity could also shift in afairly discrete way along the spinal cord. These differenceshave implications for modeling of the lamprey CPG becausesegments are generally considered to be identical (e.g., inCohen et al. 1982; Ekeberg and Grillner 1999; Williams 1992).Our results suggest that this assumption may not be valid.
Whatever the underlying mechanism, the estimated phaselag between stimuli and bursts near the head is different fromthat near the tail, but it also is about 20% of a cycle later thanis observed during free swimming (Figs. 7 and 9). One possibleexplanation for the discrepancy is that the protocol used in thisstudy was to bend the spinal cord at a single point, restrictingthe bending to one or two segments. During free swimming,however, the entire body bends. The effects of bending atmultiple points may not be equivalent to adding up the effectsof bending at each point individually. In particular, since thebody wave is continuous, it cannot have abrupt changes inphase. The body mechanics during normal swimming maytherefore serve to smooth out the phase gradient shown in Fig.9 and force it toward the values observed in vivo.
If body mechanics serve to smooth out the phase relation-ships observed in this study, do our observations then have anyfunctional consequences? In fact, the broad equilibrium phaseat the head end of the spinal cord may represent a functionaldifference between the head and tail. At the tail end, the burstphases are narrowly distributed at the appropriate phase foreffective transmission of forces to the fluid (Fig. 9, B and C).The dominant fluid force at the tail will be the accelerationreaction: the fluid, like anything with mass, resists accelerationand deceleration. When the tail begins to slow down as itreaches its maximum excursion (Fig. 9C1), the fluid will resistthe deceleration. Tail muscles must therefore turn on as theyare lengthening, to stiffen the tail and counteract the acceler-ation reaction (Fig. 9C2) (Blight 1977); otherwise, the tailwould flop over to one side. Thus the phase of tail muscleactivity helps to determine the angle of the tail in the flow,which is quite important for effective force production (Light-hill 1971). Not only that, force is probably rather sensitive tosmall changes in phase, if they affect the tail angle. Engineer-ing studies have shown that flapping propulsors like fish tailscan produce rather different fluid flows, depending on thephase relationship between their angle and the side-to-sidemotion (Akhtar and Mittal 2005; Gopalkrishnan et al. 1994;
Hover et al. 2004). At the head end, by contrast, relatively littleforce is produced during steady swimming (Kern and Kou-moutsakos 2006), so the phase of muscle activity may not be soimportant for force production. However, both turns and ac-celerations are initiated by changes in rostral kinematics (Fag-erstedt and Ullen 2001; Tytell 2004). Thus the animal will needmore flexibility in the motor program closer to its head. Thebroad rostral phase distribution may be a sign of this flexibility.
A C K N O W L E D G M E N T S
We thank A. Ayali, T. Williams, P. Holmes, T. Kiemel, K. Hoffman, andJ. Buchanan. S. Gelman, L. Tucker, and K. Nepote helped maintain theanimals. R. Wood provided much useful advice on the machining of the bathand bending apparatus. Three anonymous reviewers helped to substantiallyimprove the manuscript.
G R A N T S
This work was supported by a Ruth L. Kirschstein National ResearchService Award/National Institute of Neurological Disorders and Stroke(NINDS) Grant F32 NS-054367 to E. D. Tytell and Collaborative Research inComputational Neuroscience/NINDS Grant R01 NS-05427102 to A. H. Cohen.
R E F E R E N C E S
Akhtar I, Mittal R. A biologically inspired computational study of flow pasttandem flapping foils. AIAA J 2005-4760: 1–12, 2005.
Ayali A, Fuchs E, Ben-Jacob E, Cohen A. The function of intersegmentalconnections in determining temporal characteristics of the spinal cordrhythmic output. Neuroscience 147: 236–246, 2007.
Blight AR. The muscular control of vertebrate swimming movements. BiolRev 52: 181–218, 1977.
Bone Q. Locomotor muscle. In: Fish Physiology, edited by Hoar WS, RandallDJ. New York: Academic Press, 1978, p. 361–424.
Buchanan JT. Identification of interneurons with contralateral, caudal axonsin the lamprey spinal cord: synaptic interactions and morphology. J Neuro-physiol 47: 961–975, 1982.
Buchanan JT, Cohen AH. Activities of identified interneurons, moto-neu-rons, and muscle-fibers during fictive swimming in the lamprey and effectsof reticulospinal and dorsal cell stimulation. J Neurophysiol 47: 948–960,1982.
Cohen AH. Effects of oscillator frequency on phase-locking in the lampreycentral pattern generator. J Neurosci Methods 21: 113–125, 1987.
Cohen AH, Holmes PJ, Rand RH. The nature of the coupling betweensegmental oscillators of the lamprey spinal generator for locomotion—amathematical model. J Math Biol 13: 345–369, 1982.
Cohen AH, Wallen P. The neuronal correlate of locomotion in fish. “Fictiveswimming” induced in an in vitro preparation of the lamprey spinal cord.Exp Brain Res 41: 11–18, 1980.
Ekeberg O, Grillner S. Simulations of neuromuscular control in lampreyswimming. Philos Trans R Soc Lond B Biol Sci 354: 895–902, 1999.
Fagerstedt P, Ullen F. Lateral turns in the lamprey. I. Patterns of motoneuronactivity. J Neurophysiol 86: 2246–2256, 2001.
Fisher NI. Statistical Analysis of Circular Data. Cambridge, UK: CambridgeUniv. Press, 1995.
Gopalkrishnan R, Triantafyllou MS, Triantafyllou GS, Barrett D. Activevorticity control in a shear flow using a flapping foil. J Fluid Mech 274:1–21, 1994.
Gossard JP. Control of transmission in muscle group IA afferents duringfictive locomotion in the cat. J Neurophysiol 76: 4104–4112, 1996.
Grillner S. On the generation of locomotion in the spinal dogfish. Exp BrainRes 20: 459–470, 1974.
Grillner S. Central pattern generators for locomotion, with special reference tovertebrates. Ann Rev Neurosci 8: 233–261, 1985.
Grillner S, McClellan A, Sigvardt K. Mechanosensitive neurons in thespinal-cord of the lamprey. Brain Res 235: 169–173, 1982.
Grillner S, Williams T, Lagerback P-A. The edge cell, a possible intraspinalmechanoreceptor. Science 223: 500–503, 1984.
Guan L, Kiemel T, Cohen AH. Impact of movement and movement-relatedfeedback on the lamprey central pattern generator for locomotion. J Exp Biol204: 2361–2370, 2001.
2418 E. D. TYTELL AND A. H. COHEN
J Neurophysiol • VOL 99 • MAY 2008 • www.jn.org
on April 14, 2015
Dow
nloaded from

Hagevik A, McClellan AD. Coordination of locomotor activity in the lam-prey: role of descending drive to oscillators along the spinal cord. Exp BrainRes 128: 481–490, 1999.
Hatsopoulos NG, Warren WHJ. Resonance tuning in rhythmic arm move-ments. J Motor Behav 28: 3–14, 1996.
Hover FS, Haugsdal O, Triantafyllou MS. Effect of angle of attack profilesin flapping foil propulsion. J Fluids Struct 19: 37–47, 2004.
Iwasaki T, Zheng M. Sensory feedback mechanism underlying entrainment ofcentral pattern generator to mechanical resonance. Biol Cybern 94: 245–261,2006.
Kern S, Koumoutsakos P. Simulations of optimized anguilliform swimming.J Exp Biol 209: 4841–4857, 2006.
Kiemel T, Cohen AH. Estimation of coupling strength in regenerated lampreyspinal cords based on a stochastic phase model. J Comput Neurosci 5:267–284, 1998.
Kiemel T, Cohen AH. Bending the lamprey spinal cord causes a slowly-decaying increase in the frequency of fictive swimming. Brain Res 900:57–64, 2001.
Kiemel T, Gormley KM, Guan L, Williams TL, Cohen AH. Estimating thestrength and direction of functional coupling in the lamprey spinal cord.J Comput Neurosci 15: 233–245, 2003.
Lighthill J. Large-amplitude elongated-body theory of fish locomotion. ProcR Soc Lond B Biol Sci 179: 125–138, 1971.
Marder E, Bucher D. Central pattern generators and the control of rhythmicmovements. Curr Biol 11: R986–R996, 2001.
McClellan AD, Hagevik A. Coordination of spinal locomotor activity in thelamprey: long-distance coupling of spinal oscillators. Exp Brain Res 126:93–108, 1999.
McClellan AD, Jang WC. Mechanosensory inputs to the central patterngenerators for locomotion in the lamprey spinal cord: resetting, entrainment,and computer modeling. J Neurophysiol 70: 2442–2454, 1993.
McClellan AD, Sigvardt K. Features of entrainment of spinal pattern gener-ators for locomotor activity in the lamprey. J Neurosci 8: 133–145, 1988.
McMahon TA. Muscles, Reflexes, and Locomotion. Princeton, NJ: PrincetonUniv. Press, 1984.
Miller WL, Sigvardt KA. Extent and role of multisegmental coupling in thelamprey spinal locomotor pattern generator. J Neurophysiol 83: 465–476,2000.
Milliken GA, Johnson DE. Analysis of Messy Data. 3. Analysis of Covari-ance. Boca Raton, FL: CRC Press, 2001.
Parker D. Variable properties in a single class of excitatory spinal synapse.J Neurosci 23: 3154–3163, 2003.
Pearson KG. Proprioceptive regulation of locomotion. Curr Opin Neurobiol5: 786–791, 1995.
Rome LC, Swank D, Corda D. How fish power swimming. Science 261:340–343, 1993.
Rovainen CM. Synaptic interactions of identified nerve cells in the spinal cordof the sea lamprey. J Comp Neurol 154: 189–206, 1974.
Rovainen CM. Neurophysiology. In: The Biology of Lampreys, edited byHardisty MW, Potter IC. London: Academic Press, 1982, p. 1–136.
Rovainen CM. Effects of groups of propriospinal interneurons on fictiveswimming in the isolated spinal cord of the lamprey. J Neurophysiol 54:959–977, 1985.
Rovainen CM, Johnson PA, Roach EA, Mankovsky JA. Projections ofindividual axons in lamprey spinal cord determined by tracings throughserial sections. J Comp Neurol 149: 193–201, 1973.
Sigvardt K, Williams TL. Phase coupling during entrainment of fictivelocomotion in the lamprey spinal cord. Soc Neurosci Abstr 14: 258, 1989.
Tunstall MJ, Roberts A. A longitudinal gradient of synaptic drive in thespinal cord of Xenopus embryos and its role in co-ordination of swimming.J Physiol 474: 393–405, 1994.
Tytell ED. Kinematics and hydrodynamics of linear acceleration in eels,Anguilla rostrata. Proc R Soc Lond B Biol Sci 271: 2535–2541, 2004.
Tytell ED, Cohen AH. Phase lags between muscle activity and movement inthe lamprey: contribution of the central pattern generator. Program No.78.14. 2007 Abstract and Itinerary Planner. Washington, DC: Society forNeuroscience, 2007. Online.
Viana Di Prisco G, Wallen P, Grillner S. Synaptic effects of intraspinalstretch-receptor neurons mediating movement-related feedback during lo-comotion. Brain Res 530: 161–166, 1990.
Vinay L, Barthe JY, Grillner S. Central modulation of stretch receptorneurons during fictive locomotion in lamprey. J Neurophysiol 76: 1224–1235, 1996.
Wallen P, Williams TL. Fictive locomotion in the lamprey spinal cord in vitrocompared with swimming in the intact and spinal animal. J Physiol 347:225–239, 1984.
Wardle CS, Videler JJ. The timing of the electromyogram in the lateralmyotomes of mackerel and saithe at different swimming speeds. J Fish Biol42: 347–359, 1993.
Wardle CS, Videler JJ, Altringham JD. Tuning in to fish swimming waves:body form, swimming mode and muscle function. J Exp Biol 198: 1629–1636, 1995.
Williams CA, DeWeerth SP. A comparison of resonance tuning with positiveversus negative sensory feedback. Biol Cybern 96: 603–614, 2007.
Williams T, Grillner S, Smoljaninov VV, Wallen P, Kashin S, Rossignol S.Locomotion in lamprey and trout: the relative timing of activation andmovement. J Exp Biol 143: 559–566, 1989.
Williams TL. Phase coupling by synaptic spread in chains of coupled neuronaloscillators. Science 258: 662–665, 1992.
Williams TL, Bowtell G, Carling J, Sigvardt K, Curtin NA. Interactionsbetween muscle activation, body curvature and the water in the swimminglamprey. In: Biological Fluid Dynamics, edited by Ellington CP, Pedley TJ.Cambridge, UK: Company of Biologists, 1995, p. 49–59.
Williams TL, Sigvardt KA, Kopell N, Ermentrout GB, Remler MP.Forcing of coupled nonlinear oscillators: studies of intersegmental coordi-nation in the lamprey locomotor central pattern generator. J Neurophysiol64: 862–871, 1990.
Zar JH. Biostatistical Analysis. Upper Saddle River, NJ: Prentice Hall, 1999.
2419ROSTRAL VERSUS CAUDAL DIFFERENCES IN CPG ENTRAINMENT
J Neurophysiol • VOL 99 • MAY 2008 • www.jn.org
on April 14, 2015
Dow
nloaded from