Embed Size (px)
Citation preview

,!
H I L G A R D A Journal of Agricultural Science Published by the Caliform'a Agricultural E:rperimr:nt Station
I
VOL. 12 :MAROH, 1939
WATER OONDUOTION FROM SHALLOW WATER TABLES'"
ROSS E. :MOORE~
INTRODUOTION
A
No.6
THE PFIENOlrESON of the flow of liquids through porons medhmls without the applicatioll of external force and without complete filling of the pores of the soliel with liquid, has IOllg been recognized and studied. It was en.l'Iy recognized thnt the forces it{"olved arc those of adhesion and cohesion, the same as those responsible for the nction of liquids in capillary tubes. The term "capillarity" (6, 17) I has thus COIlle to apply to the flow of liquids through porons mediums.
l\fanyanalY:ies (28-31) have been made for the purpose of evaluating the capillary forces acting ill three~phase systems, such as is the ease in moist soil, consisting of solid, liquid, and gas) by assuming spherical solid purticles of uniform size and sequence of packing arrangement. While this nssmnption has prcsented concepts of value in comprehending the mechanism involved in capillary flow, the size und confignration of the solid anc1liquid phases are very complex in even the most idealized sys~ terns, und become indeterminate when applied to natural bodies such as soil.
The capillary potential concept, introduced by Bucldngham (6) in 1907, ussumed a capillary force field generated by the attraction of moist soil for water. He defined a capillary potential, the gradient of which is equnl in magnitude to the capillary force. The introduction of the potential function gave rise to the study of soil-moisture as a dynamic system; but this method received no added impetus until 1922, when Gardner (9) and others showed that the capillary potential of Buckingham mny be
1 Recei .... ed for publicntion June 8, 1938. ~ Abridged from n. thesis submitted in partial .fulfillment of the requirements for
the degree of doctor of pliilosophy. n Instructor in Soil Technology and Junior Soil Technologist in the Experiment
Station. 'Itnlic figures in parentheses refer to ULiternture Cited" nt end of this pnper.
[ 383 1

HHgarl1ia [VOL. 12, No.6'
considered us" a pressure potential ~lue ~o the differential_press1;lres on either side of the liqui(1-gns interface in the menisci of the water films. They further showed it to be directly measurable, oyer a certain range of potential, by measuring the negative hydrostatic pressures within the water £1ms of soil moisture. The instrument used for these 9-irect measurements wns called n capillary potentiometer, but is now eaUed a tensiometcr (19) I Hnd cunshits of n porons absorbing element, all adaptation of the IJiviligstoll Auto Irrigatol', to which a manometer is attached. WhelL the cnpillary potentiometer was filled with water uncl the porous absorbing' clcment wus embedded in the moist soil whose capillary potentiul was to be measurcd, wuter trunsfer took place between the porous element and the soil until, at equilibriuIll, the pressure of the water inside the potentiometer wus equal to the pressure in the snil-moisture £lms, This pressure WLlS read directly on the manometer.
In the application of the dynumic concept to soil moisture studies, the velocity of flow or water through the soil is considered to be proportional to the totnl water-moving force. A conductivity factor, variously called capillary conductivity, capillary trnnsmission constant, couductivity, and permeability, has been used to express this proportionality (3,7,8, 10J 16). 'rhe tel'Ill Hpermeability" is adopted in this paper.
Many data on the permeability of soils in saturated flow or, with the pore space~ entirely filled with wnter, nre uvuilable in paper~ of the U. S. Geological Survey, the American Geophysical Uliion, filul in engineering papcrs, Slichter (2·1) made theoretical calculations for the flow of underground watcr under pressure, in which it WIIS nssumed that the vclocity of flow was proportiollul to the preSS11re g'l'lldient. 'rhcre It!'c rclnth'ely few published data on soil permeability in unsaturated flow, however. Such dutn as have been reported were derived from experiIneutalresults on relntiYely small quantities of soil through ,yhich flow was induced by urtificiully maintaiuing uitierential pressures ill the l110isture films on either' side of the smnple. Richards (17,18,20) hus published datu. on three soils, including capillary potential us a function of wllter content, pcrmeability us a function of water content und capillary potential, and permeability of a peat soil as u function of capillary potential.
'rhe evuluation of the movement of water' through lUlsaturated soil is important in many practical problems, snch as: the (1rainage of lund, of road subgrudes, and of all structural foundations and puyements laid on the ground j the contribution of It water table to the water supply of plnnts j the loss of water from a soil surface by evaporation j and the upward translocation and concenh'ation of soluble salts in the soil.
March, 1939] Moore: Water Conc111ction from ShallolU Watcr TllllIes 385
This paper reports pressure potential and saturated and unsaturated permeability datu, using six California soils. The rate of water flow 1'e~ui1'cd :0 11~aintaill shallow water tables in cylindrical soil eolumns B Inches lU dIameter, was measured in graduated supply burettes. Unsaturated flo,Y was induced naturally j the water rose from the water table to the stu'face of the soil columns br capillarity, and was evaporated fro~ the sm·face. TensiometeI's were spaced at regular intervals on the yerbc~l axis of the soil columns, and the pressure potential values were read dll'ectly all these instruments. When the rate of water uptake and the pressure potentials throughout n soil column became steady thnt column. was said to be at steady state. Its moisture distribution w~~ tllen (~eternllne~l by sampling, and its saturated and unsaturated permenbilitIes at varlOUS pressure potentials were determined from the velocity of flow and the total potential gradient. .
PROOEDURE
~he moisture studies reported herein were carried out ill a room in a hgllt frame building of tho University of California at Berkelev. The ro.om was 8 x 16 feet, and 12 feet high, "'HIt a reinforced concret~e floor Imd on tl~e ground, The wnl1s were of tongue-und-grooye pine sheathing on 2 x 4: lneh studs spaced at 2-foot centers, the naked studs beinO' on the room side. After beginning this experiment the walls and eemnfl" were lined with celotex lyuUboard which Was nail~d to the studs. I:>
The room was heatec! by two batteries of electrical hentinO' elements one battery placec1 at either enc! of the room alJOut 4 feet fr;m the en(l walls .an~l 6 feet from the floor. Hent distribution wns effected by foul' electrIC fans, so placec! us to give maximum nil' turbulence as well as general air circulation to all purts of the room,
.'rhe heating elements had two circuits, one continuous and aIle inte~'nnttent. 'rbe intermittent circuit was opened anel closed by a thermal regulator through a reI ny, 'remperature nt the thermal regulator was set at 30° C, and controlled to about ± 0.02°. Temperature along the sides of the room and Bear the fioor could not be held to this narrow range due to heat loss tlll'ough the I'ather poor'ly insulated walls. The soil columns, which were set in a l'OW close to a walI, normally held to a !emperature ran~e of 0.02° C, e:\':cept (!tu'ing periods of abnormal change ln the atmospherle temperature outside the room.
Six soils were used, ranging in texture from slmd to clay (table 1). All except one, the Oakley sund, were of the Yolo series. 'l'be nir·chy soils were prepared for filling the cnns by breaking them down to pass a a-mm sereen.

386 Hilnardia [VOL. 12, No, 6
The soil cnus were of galvanized iron, cylindrical, 8 inches in diameter and 3 to 4 feet high (fig. 1), and were fitted with a wire·screen diaphragm soldered 2 inches above their bases to provide support f01: the soil columns. A water inlet tUbe,.%, inch in diameter, was soldered 1 moh above the bottom of each can. Each can was pnnched with %.i:,ch holes in foul' vertical rows, oue row at each quarter point on the can's circ~mference. The vertical distance between holes in the row and tIle elevatIon of each row, were arrnnged to give a hole for each inch of can height. Before a can was filled ,,1th soil the holes were closed with patches of
TABLE 1
~rECIIANICAL ANALYSIS AND MOISTURE EQUIVALENTS DE' TilE SOILS USED
OuldllY Yolo Yolo fin!;! Yolo Yolo Yolo Sopnrotcs I!llnd BUild allndl'lonm dlll'lollm light c1lll' clul'
Fine grnvlll.. ............... 0,2 2.11 0.1 0.1
Conrail Hnnd ..•............. D.O 16.4 0.3 0.5 0.1 0.2
-r;redhnn :lund .•••..•••.•••. lli.3 25.8 0.5 0.11 0.4 0.3
Fllle~lll1d .............. · .. · 45.1 41.8 lS.1I 5.3 7.2 3.0
Very Iin!)~llnd .............. 2004 0.0 31.0 21.0 16.1 S.1
TotnlslLnd ....•.......•..•. 110.11 02.11 5[1.8 27.1i 23.S 11,6
Totul Hilt (by difference) .... 3.' 3.3 31.5 46.0 45.0 4n.5
Totnlclnl' ........... 5.0 3.B 17.7 2n.5 31.2 41.0
Clnl'<2 micron ............. '.D 3.2 12.8 17.2 23.2 33.1
Clny<l micron ............. '.0 2.0 D.' J3.5 17.4 20,5
i\foistllrll cquivnlllllt. ....... '.3 3.5 IB.l 22.5 25,D 2n.3
celluloid cemented to the outside. When the wetting front in the soil column reaclled a hole, the celluloid patch was removed, the soil sampled for moisture coutent, and the hole reclosecl with n rubber stopper.
The procednre ill filling the can with soil wus similar to the tt'emie method for placing concrete uuder water (36). A strong' fiber tube, 4 inches ill outside cliameter, nuc14 feet long, originally made for the packinn' and shipment of glnss tubing, was used as a tI·emie.
The tremie tube, surmounted by a funnel, ·was placed upright in the soil can. One.man kept the funnel and tr'emie full of soil and a second man operated the treIllie, partly supported its weight, kept it "ertical, and moved it with a rotary motion so tl~at the tube described n circle, the (liameter or which was equal to the diameter of the soil can. The bottom of t11e tube, resting lightly on the soil, pnssecl over the entire area of the soil column at each revolution, and t.hus maintained a level and regular surface. Approximately eight revolntions of the tremie were reqn~'ed per inch of depth of soil eolllmnlaid down.
The entire system, cau, tremie, and soil, was weighed at interY~l.s 0.£ approximatelY 4 inches in the soil-column height. For the height of SOlI
Mnrch,1039] Moorc: Watcr Conduction from SlwllolU Watcr Tablcs 387
at each 4-inch stage tllC mean of eight to ten measurements was taken j these measurements were made from the top of the can with a meter stick which was dropped vertically onto the soil through a distance of ap-
Fig. I.-Soil cuns with tensiometers installed. .A, Cnn with lllel'emy tensiometers, showing the method of nttnching the
llLUlltIlilcter plinelulld the inHhlllutieu of the hmsiolllCtcrs, The instrument nt the top of the pllliel .lli n yibrutur. 'rhc lowest tensiometer hns been relllo,ed from the soil to show the CIIIl (flbsorbing element).
11, Cun with wnter teltsiol1leters instuJled. Eight tensiometers with ·wflter nUlUcuueters flre lIl0tllltec1 all the left panel. The teusiometers enter t.he soil col· nom bnck of the panel. '1'wo open water manometers used for posith'e poteutinls only nrc lllollnterl on the smull puuel at the right.
0, Assemhly of the tensiometer with It mercury manometer. 'rIds assembly wns used for testing tensiometer cups amI is the snme us tho tensiometers installed in the soil columns except that the stopeoclc, 3, wus replaced by n. screk clamp. Details urc fiS follows: 1J A three-wn.y stopcock senled to n mule standar(l taper ground gluss conner-tion. '1'he two rubber tubing lilies Bupply "ncuUlU nnd water Itt atmospheric pressure. 8, Femnle standard tuper ground ginas connection. 3, TWO-Wily stopcock. 4, Porolls tired·cluy tensiometer cup. 5, Screw clump. 6, Capillury stuff of mercm)' mUllometer.
proximately 1 inch. The net weight of soil in the CRn was later corrected for air-dry water content.
Too few weighings were made on an individual soil column to allow a statistical calculation of variation in apparent density for a single column. A mean apparent density was calculated for each coluinn, and

3BB' Hilgardia [VOL, 12, No, 6
the densities for each stage of filling' were expressed as percentages of that mean. These percentages were collected for all the soil columns, annlyzed statisticnlly, nucl a single standard deyiation was calculated and eA"}Jl'cssed "as per cent variation from the menn apparent density, This single value was assumed to represent tlte standard deyiation in apparent density for aU the soil columns (tuble 2). .
Wnter at constant pressure was sllpplie(l to the base of the columns by water supply units (fig. 2), curried upward through the soil by capil-
TABLE 2 CRA.n.ACTERISTICS OF' TffE SOIL COLUl\1NS
Percent Stund- Stnud- wllter
Lllilgth c,~ ~rCllII nrd IIrd do- "' or I!oil I!ection, Welling Drying tlm'ill- vintion Percent autum-
Soil type nml CUll numbcr COIUIIIII, Slluo.ro timo, timc, nppnr- tlon of melU) porc tion hy Cllt
centi- centi- dill'S dny!! deliliity of D.P- D.ppllr- spncl! weight. mcters meters J~~:n~· eo' OVCII-
density dn' blwiH
------------------------Onkley sund. 3 .••..... 117 314 312 II lA8 0.042 0.00-1 4:1.3 211.2
Yolo liD.nd. 13 ........... 54 322 lOS , 1.411 .042 .005 43.0 28.S
Yo'o .""""dy { 1 o' 117 31' 2811 72 1.25 .OJ!! .004 51.0 :m.1I loo.m .......... 17 . 8! 322 " 7 1.:14 .035 .00-1 52.5 42.3
20 .• B! 323 O! o' 1.25 .03,1 .00' 52.1 41.11
Yolo dny 1011111 {l!o" S! 321 DB H 1.34 .0:lS .004 4!1.11 :1lI.2
III ..... 54 322 25 3 1.28 .0JIl .1104 51.0 30.S .
r o' , 117 31' '10 " 1.32 .1137 .004 411.5 37.1i
YlIllllight ClllY .. I;::. B! 320 25 1.211 .0311 .1104 50.5 :m.l 20 .. , o' S! 323 "
, 1.27 .0311 .004 51.3 4004
Yolu dlLl' ..... {lfi. 8! 322 BII 1:1 1.28 .!l3ft .004 51.0 :19.8
10 .... ',1 312 37 o' 1.22 0.034 0.004 53.2 43.5
llll'ity, all{ll'emovec1 from the !mil surfacc by evaporation. 'rIte rule at which water WHH tflkcn up by the soil wn~ measllred in thc graduated supply burettes of the watcr supply units, and tlie upwHrd advance of the wetted front 1,\'as observed through tlle celluloid-covered holes in the
sides of the cans. 'fensiometers (19), cOllshltillg of porous firctI clay absorbing elements
conuected to 'Vacuum gauges of the lllullometer type, were placed in the soil columns one above the otller at intervals of 10 centimeters (fig. 1). A transfer of water takes place between the soil and the absorbing element until, at equilibrium, the pressure of the water iu the absc\;:bing element is eqnal to that ill the moistme films of the soil. This presshre is calculated from the height of mercury or other manometer liquid used
in the vacuum gauge.
Mnrch, 1030] Mo()re: WaleI' COIull1clion /l'Om Shallow WaleI' Tablc8 aBO

400 l VOL. l<!J .No.6
4. t = 48 hours to t = 67 hours. A • .:).T / at = ~ 0.032° 0 per hour. D. Slight decrease in pressure potentials. c. Great increase in rate of water uptake.
5. t = 67 hours to t = 76 hours. A • .:).T/at=+ 0.23° o per hour. D. Increase in pressure potentials of 2 gm-em/gm at 81 em above
the base of the soil columnJ and increasing progressively to more than 10 gm-cm/gm at the water table. Water flowed downward tlD:ough the soil and out of the cnu via the supply line. Greater potentials would have been registered if water had not been lost from the systcm.
c. '1.'he rate of water uptake became negative. '1.'he negative absol'p-. tiOll rates shown all the graph do 110t represent the total amount of water dl'llinccl Qnt of the soil column. An undetermined amollnt of wnter was lost through the vent tube in the constnntlevel supply reservoir.
6. t = 76 hours to t = 95 hours. A. rrcmpcl'utnre changing very slowly and approaching 28.20 C. n. Pressure potentials rapidly decreasing toward establishment of
of a steady-state gradient appruximately equiValent to that at t=O.
c. Rate of water uptake approaching the rate at the steady stnte.
previous I
It is evident thnt temperatlu'e yarintions may vitiate the accuracy of many types of soil-moisture studies. lillllctuutions in soil moisture contents and water tables ill field studies lllUY be erroneously attributed to causes other than temperature unless the variations in temperature and their attendant effects are lOlOWll (25-27). The quantitative evaluation of the various effects that tcmperature 'Variations may have on the soil moisture system would constitute a major problem.
Pressitre Potential and Jlloistw'e Dist,.,l",tioJt at Steady State.~Pressure potential and moishu'e content data in soil columns at steady state are tabulated in table 3, nueI are represented graphically in figures 9-13. The moisture samples were approximately 10-gram core samples taken with a thin-walled, polished, aluminum tube :y" inch in diameter which was thrust horizontally into the soil column through holes in the side of the soil can. The soil sample ,YUS quickly transierFed to a weighing bottle by pushing the core out of the sampling tube with a tight-fitting plunger. A soil column was sampled, taking 16 sampIesJ in about 3 minutes.
•
MarchJ 1939] Moore: Water Oonduction from ShalloUJ Water Tables
401
The tube m.ethod of sampling was satisfactory for moisture contents up .to npprmamately 85 to 90 per cent of saturation but be"ond thi mOIsture ranO'e vel' ~ ., t' ul ' J S • 0 J eun IC res ts were secured. Great Iimi't t' Imposed tll 'bI a IOns were
on e POSSI e methods for taking samples by the design of the
TABLE 3·
MOISTURE CON'l'ENT AN~ PRESSURE POTENTULj EXPERIMENTAL VALUES FOR
"!OLO LIGHT CLATJ CA..~ :1\0. 2t
1~~~~~WT"_ti_"_·=-__ ~~·I _____ ~ __ D~'Y~i"~g~ ____ ~ __ El~\'ntion nbov~ wnter mble I Moisture eon~ Pressure
'"' J.5 ........................ . 8.7 •........................
13.0 .............. , .. . 10.0" .... . 24.2 .. .. 211.0 .• , .... . 34.1. ..... .. aO.I .. . 44.2, ....... . 40.4 ..•...•• , ..•...... , ..... . 5~.0 ..................... , .. . 50.0 ........................ . 04.0 ............. , .......... . 011.0 ........................ . 74.11 .••....•...•... , ....... .. 70.7 ............. , .......... . 84.S ...... , •..••............. DD.D .................. , ..... . 05.1 .••.••.•• , .•. , .•.....•...
100.1. ...................... ..
105.1. •. , ... , ........... .
• Plo!ted ill figUf/l II.
tent, P.. potential, (oyefl-dry bl15is) ~
11er r!fnl 33,8 30.0 34.1 35.8 30.3 33.8 30.0 2B.7 2B.!! 28.0 !!1l.B 211.4 25.1 24.D 23.8 2J'< 22.3 21.2 10.S
{i~:4 14.7
UIII-cm/umt - 3.7
- 15.1
- 211.5
- 30. Ii
- 50.2
- 75.S
- 00.4
-13~.D
-108.8
-351l.5 -5GO.0
Moisture r!on_ Pressure tcnt, Pili potentiul,
(ovell-dry bllSis) oi perc~lIl Um-cm/um
- 11.0 3LD2
- 23,0 33.1i3
- 3~.3 30.1i8
- 44.1 2S.nO
- 02.8 2i.55
- 8Ui 20,40
-104.7 2UO
-1:15.0 23.15
-!l00.0 21,31
-377 .6 18.54 -010,0
t OWlIIg to .tho limitutions oC splleo ill Hlis u cr t b i • prllli!luro potelltmlll and lIIoialura is given Cor Oll~ fjgn ~l~ u nr f?llnmelltni dntu 011 the ((jlltributiOIl oC • t Gm-cm/gm and ;;m/glll ure uscci throughout this 11111 011 ~, •
'1 hl'llc 'Imlul'll muy be multiplied by 080 to obtuin dYlics ~~I~e~r:,ulllta of work nnd of force rl'!lpectiveiy.
soil cansJ and the necessity for a miuimmn disturbance f th '1 d It . t' fl' a e SOl an
a el a 1011 0 t Ie cross seclIon of the column. The tube m th '. , for all sampliurl' e OCl l\US useCl
o·
The P,,=f(H) cmves (figs. 9-13) were plotted ~'om th . m tIl t f. . H e experl-
en ,a .c a a lorn t1~e lower mOlstu~'e contents up to 85 to 90 pel' cent of ~:~UlatlOnl U1~d prOJected from thIS point to saturation. Experimental
ues for mOIsture contents were disregarded in the wet portion of the c~rve .. '1'he zone of saturation was assumed to e:\.'ielld from the base of t Ie SOlI throllgh the region of positive pressure potentials
J and to the

402 HilUa.rclia [VOL. 12, No.6'
Moisture CO""""! (fIy),per cent /0 cO 50
80 o
~Moi.sturel epuij/o/ent ~ '" ~ 1\ .... \; 50
~ 1;
~ ~
\l ~
0
"" -'" "" b~~ ,
~~ '\' c' ,", ~ Leye",/ "\
I-~ rlvettin.? .;: :. ....... I- --- r drgill.? ' ...... i' .... __ -0_-
0---0 111' Nettlnff ' -- ------ -- 1\ I- ,--j' P" d(!linS' _._ 0-._
, -, , --~---..,. -100 -,EOO -600 o
Pressvre po/en/lof (11'), sm-cmljrm Fig. D.-Curves of PIO=f(H) und if! =F(H) f~r n. c?lumn of Qult.ley sund ut
steudy-stut~ wetting und nfter druiuuge. :POl' couvelllellCC tn representatIOn, P,li und 1f nre plotted us abacisslls, I
Moisture content (~I;)I per cent 50 /0 cO 10
/00
~ "'-~ \l '" ~ ~ 50 " ~ ~
1\ ~
-- -f--"':::::-.0 ----'"
~ .. ~
'~, -IvIOls/urO' "'lU;", /ellt
'-. '." ~"" -~~
.... ~ ...... 0
'~ .... Leyelld '~ ~ <>--<0 rwe//;IlY'
--- Ii' o'r!lillff '" c
0- __ 0 PIV we/tIny "" , ~\ " • - - -. ~~ drginjT " c ' .. '0 , I ,c , ~
o -600 -100 -cOO o , Pressure polentl"/ (11'), ym-cml,ym
Fig,10.-Curves of P 1IJ =f(H) und.p = F(R) for n column o! Yolo fine~n!ldy loum at steady-state wetting and after drainage. For convenience III represent~lOn, Pili und 0/ ure plotted us ubseissas,
Moore: Water Oond'u-otion from Shallow Water Tables 403
/0 k/ois/vre cOllient! (Pw), ,o(:r cent
20 30 40
100 ~-- Moisture er;u/yolellt
~ ''\..
"'- " ~ '\\
1\ , .... "" ~ so '!l" ...,
~ ~ feyena' ~
, ~ rM9/11ip' ...
" ,
~ -- r d(!lliJy '" 0--_--0 Pit' lYettlny ........ , '0,
~ ---~ ,ow d(!llily ., "tJ,
\ '\> \ c \
0 c \
-5tJO -9'00 -200 o , Pressure po/"n/lo/ (r), ym-cm.(ym
FIg: 11.-C~lI'\t;a of Pm • f (ll) ,anit 0/ = F (ll) f~r Cl column of Yolo light clay nt stoady-state wettlllg !tnu ufter <1ramage, For coU\'eIl1Clleo in repl'eflclltutioll P . und 0/ ure plotted IlS Ubsc16sna. J IV
~ "'-~ ~ \ ~ ~ !;! ~ .. ~
.900
SO
Nfol"lvre cOll/enl (/]Y), per cell' 10 EO
• " Leyella'
0---<> YII/eftiny ~rdrgli7y
c---c PlY weillilff .--- ;q" a'qlily,
-'0, ...
30
c .... --'0
I I I I I I I I I
~c~~~o-L--L--l--~-_ILao--L--l--L--l--oL--l--~-l--LJ,~/oo
Presswe polell/IO/ (17), ym-cm/.?m Flg,12,-Curv;s of Pw=f(H) and 1f = F(N) for a column of Yolo sund at
atcudy·stute wettmg !lnd ufter drainage. For cOllvenicnce in representution P and 0/ nre plotted us ubsclssas, ' III

404 Hiloordia. [VOL. 12, No. o·
. ... otelltinl The moisture content of the soil at elevatIon of zeto pressure p. '1' saturatIOn was ea c . 1 ulateelfl'om the Ullpnl'ent density of the 501 J aSsumlng a real density of 2.61.
Moisture content 111.,), per ce.?t za JO. la m za '"
. ,a , ~~. Ma r"e so.oJ:. \'
Yolo lin:? 50::& 1\ ;', loa.. a.. loom .. , ...... ~' .... ~?'''''' , , , a
\ " " '1
, , ,
1\ I I 1\
I
I I
I , I
Ii. '~ I a
"T "~ lola cloy IMm 1 \ , Yola dey laam .... , ..... , '~ "'"'1 ' , '. . <;:; , ~ ....... '\.. , ,
\ \"\ ' , "
,~ ~.. ", - , ,
\ '. ". f\) N ' I
J ) a
\ .... I:~ 1?," cloy 1(:Jlo 1::f'U c;bjl s., t _________ ,~' '. . " " ' ... , .
\ I,. " '0 ............ ...... -
K.:) , . , ,
1\ I
I I
Ii I , ,
a
IH.lkr d;;J Yo/" d~g s., "T
'~ ~--;-~~:--~ " ", ". '-" \ .', JO'-lCjTend \ ",
1\ \ '\ .... , .. -F"lI'ettll1y --., \ .. ~, -trdlJ/lfI? 1\
, \ I ,
[\,.' , .... --.q,. lI't'ttiry- , i" I I 0---' P", dryil7j' ,
./00 a ,/00 "aa -a . a -zoo
Pressure potentiol/Y). ym-cml.fm
- F(ll) for columns of SOillLt Stl!lIl1y-StlltC Fig. 13.-Curves of,rw = ~(H) [utd Y' - 'n 'eprcsclltution I' IIJ nnd 1/1 ute lllottcd wetting und ufter dl'lUuuge.li (It' eon"emence 1 r J
IUJ ubscissns_
ANALYSIS OF THE PRThIARY EXPERIMENTAL DATA
. I d IV t . Conte lit of Soils, at ':J.1hB Relation between Pressm-e Pote'nt-w am . a Cl isture cou-29° G.-The relation between pressure poteutml, .!f11 an~ mo. (fi(]"~ t t P in each soil column is represented graphIcally In CUI v~s o.
1':.18) ,o~f '" = f (P,,). 'l'hese curvcs were clevelopeel for the sOlis at a
.
"
r
l\lllreh,1930] J[oore: Water COlldnctiol£ frolll ShallolV Weltor TableR
405
steady state during the wetting process, and after drainage, from the primary moisture content and pressure potential data as expressed in Cnrves of P" = f (N) and '" = F (N).
Differences in vapor pressure and pressure potentials for the same medium at the same moisture content, the magnitude of which depends
/.0 Re/"'/Ive wetness
,I
o
~ ~ \l
~ r<' • • • • •
(ea; ~ , ~ .;:j l-ll;
~ ~ !b ~ -100
~ ~ «: I
Lo/eno' 0--..0 /J~!!Ii7y
, I . f)rY1i?Y'
o /0 cO
MOl,.ture content (,P",J, ,Per cent Fig.l'.l.-Cul'\·o of if'=f(P w ) for Oakley Bund wetting and drying.
7.05
.3'0
upon whether the medium is wetting 01' drying, have often been reported. This phenomenon has been referred to hysteresis effects (11,12,21), and has been reported in a wide variety of media (32) in which capillarity is active in tbe distribution anel retention of liqnids. Hysteresis has been attribnted by the early workers to the alteration of the contact angle between solid anclliquid due to adsorbed air on the solid, Adam (1) at. tributes the alteration of the contact angle to the frictional resistance

406 )t!tgarC11u L VUlJ • .l."'I..L.~U. U
between liquid and solid. Smith (29,30) and hls associates working with an "ideal soil" attribute maximum, minimum, and intermediate capillary rise to the cyclic alteration in pore cross section incident to, any type of packing of spheres. Hysteresis is generally reported for wetting and
o
-
I-
i-
0
I- 0
I- 0
0 0
I-0
l-
I-
i-0
() -.sa
li'e/otif/e wetness /.0 /.// /.66 c.CI I
0 0
0
0
I
0
0 o 0
0 0
0 • 0 • g •
, eo MOisture
o ... 0x-0,.. 0"
~,
o o. 0.' 1(0 ••
~~ ..... Ol<"~'"
. . •
• o ... ~"" • 0 • • • •
Leffeno o Con tVo.1 WeltlPg-0 Con 41>. I Otyliy . Con tVo. /7 w6'ltliy • Con 41>. /7 dty'1fr x Can MJ. cO wdt'1fr
I , , .30 40
content (1'",), per cent
,
/
Fig. 15.-0uryo of 'if =f(Pw ) for Yolo fino snndy lonm wetting and drying.
drying c1ays, and for colloidal separa.tes of clays dried or· wetted in evacuated desiccators over osmotic solutions.
In the procedure followed in this experiment, drainage of the soil columns was accompanied by flow of water from th~ tensiometer eUI\to the soil, and by settlement and attenclnnt increase m apparent density of the soil. .A. lag in pressure equilibrium between the tensiometer cup
Mnrch, 1939] lIloore: Watcr Oonduction from Shallow Watcr TableR 407
~lld. the soil would haye indicated an apparent hysteresis, but opposite 1n SIgn to,t.h,at,?bserved. At a given moist.ure content and increased apparent density, the negative radius of curvature would increase and the vapor pressnr~ and the preSSlu'e potential should increase. Settlement
li'elotlve wetness
O'-~---'--___ /.T·O~ __ ~ ______ ~~,.,~-. ••
o
o 0
o 0
Ley-end Con tVo. c wetting-
o Con MJ. C dFJIIi7g' x Con tVo. 18 ,S'eltl1fr
Con tfIo. cO wettl1fr o Con tVo. cO drglny
-600~~-L~--L-~-L~~~~-L~ __ L-L-~ cO .so 10 Moisture content (,ow), per cent
FIg. l{t-CUt'Vfl of 1/J = f(P w ) for Yolo light clny wetting nnd drying.
of the soil columu, then, would I'esult in hysteresis, but opposite ill sign to the hysteresis observed.
The differences between the 'vetting and drying preSSllre potential Curves extend almost to saturation, the runge of the negative radii of curvature as calculated from the preSSlu'e potentials and surface tension be~g fl'O~ 14 to 50 microns. Within this range of moisture content, the sohel partIeles must be entirely bathed with water, and probably no
! i , , r
408
~ ~ ~
N ~ :.; .;:; il " l{. 1: ~ 0.;
Hitgarifia [Vot" 12, No. 0
Re/tlcl"e wetpess ~ ___ .-__ -4/.0~_-,--____ =/.i<S"F'"I·o Uo.S
-/00
to/emf ----- Con ;11;. IS Jyeltlil,y ............. Con tVo./S drglilsr o---·~ Cop &./6 weltlit?
~ L~ __ ~~~-1~~ __ L-~ __ ~~~~ __ -L __ ~ __ L-~~~~ <>: ·cUO • AU cO. .0. T'
~ ~ " ~
,,-' ~ :.; .;:; ;; ...
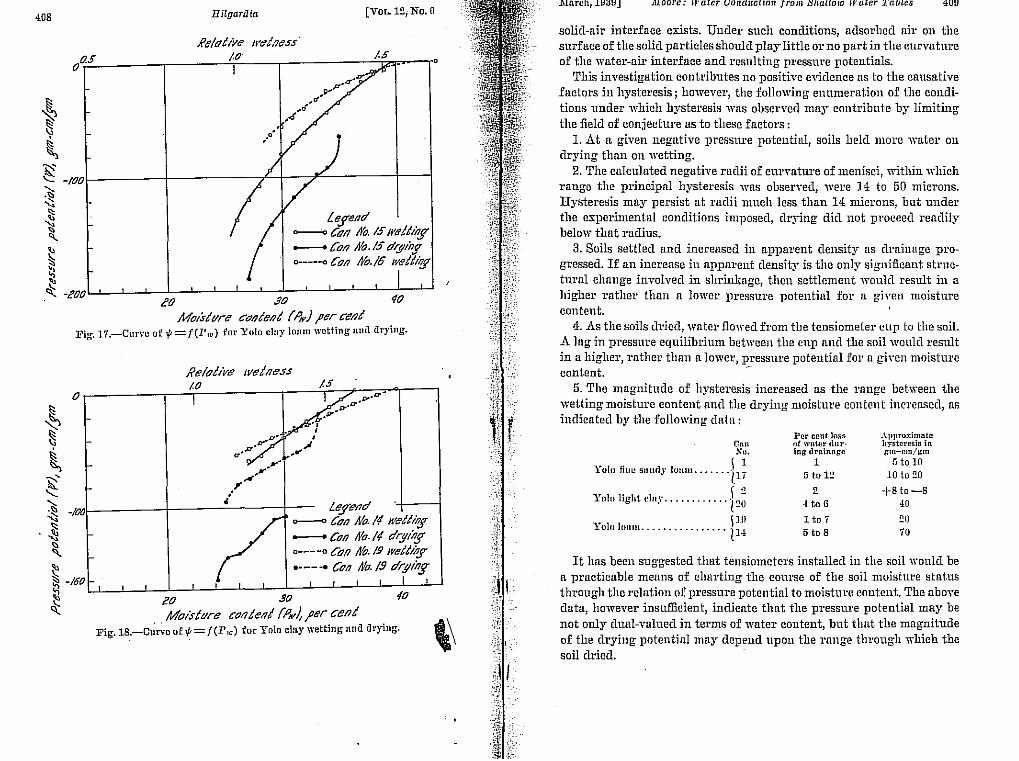
MOIsture concept (,q,,) I,,!r cent Fig.l7.-Curve of 1/1 =1(1'111) for Yolo cluy lOflm wetting mul drying.
f(e/otive we/pess
a r ________ -, ___ /.~·o~--------_r----/.l·s~~~~~--__,
~~,~------~------~-----t--- Lo/end 0---<> COil #0. If weltlit? ----- COil tVQ· N arylfig' 0----0 Cop &.19 wetcliy •• __ •• COli tVQ.I!J drpily
~ 1: ~.$0~ __ L--L-1 __ ~-L~ __ ~~ __ L-J-~--L-:;~-" :j cO. .30 fO
~ Moisture cOIltent (P",J, j'er cent Fig.18.-0~rvc ofy,= rep,,) for Yolo clay wetting lind drying. \\
Mnrch,1939] Moore: Water Coniluction {rom Shal101v Water Tables 400
solid-air interfnce exists. Under such cOllclitions, adsorbed air on the surface of the solid particles should play little orno part in the curvatme of the water-air interrace and resulting pressure potentials.
This investigation contributes no positive evidence as to the causative factors in hysteresis j however, the following enumeration of the conditions under which hysteresis ,yas observed may contribute by limiting the field of conjecture as to these factors:
1. At a given negative preSSlU'e potential, soils belel more water on drying than on wetting.
2. The calculated negative radii of curvature of menisci, ,nthiu which range the principal hysteresis was observed, were 14 to 50 microns. Hysteresis may persist at radii much less than 14 microns, but under the expcrimental conditions imposed, drying did not proceed reaclily below that radius.
3. Soils settled and increased in apparent density as drainage progressed. If an increase in apparent density is the only significant structural change involved in shriulrage, then settlement would result in a higher rather than a lower pressure potential for a given moisture content.
4. As the soils dried, water flowed from tlIe tensiometer cup to the soil. Alng in pressure equilibrium between the eup and the soil would result in a higher, rather than a lower, pressure potential for a gh'en moisture content. --
5. The magnitude of hysteresis increased as the range between the wetting moisture content and the drying moisture content increased, as indicated by the following data:
Gnll No.
Yuill Hue Slimly lualll ...... . ·h~ \ .,
Yolo light cIIl Y ••••••.••••• 1 ~~ \1.11
yO!O!IlIlIll ...••......•••.• p4
Pl!r Cl!llt loss of wntcr !luring !lrnlnngc
1 5toE!
2 ·1 to G
1 to 7 5 to 8
A]lllru:dllllltl! hystcr~sls in glll-I:III/gl11
5 to 10 10 to 20
+810-8 40
20 70
It has been suggested that tensiometel's installed in the soil would be a practicable menns of charting the course of tlIe soil moisture status through the relation of pressure potential to moishU'e content. The above data, however insufficient, indicate that the pressure potential may be not only dual-valued in terms of water content, but that the magnitude of the drying potential may depend upon the range through "lIich the soil dried.

412 liiluardJa l VOL • .1':, .NO, (j
takes place through moisture films, we would expect capillary permeability to increase with increasing effective cross section of moisture films, and hence with increasing moisture in the soil. In this study the moisture content has been expressed as a function of pressure potential, "', which is directly related to the vapor pressurc of the soil moisture, and is au
TABLE 5-
'VETTINCi AND DRl."1!'>G POTENTlALS AND PEltMEAntLl'l'Y AS FUNC
TIONS OF MOISTURE CONTENT; YOLO LmllT CLAY, CAN No. 2.
Welting Drying P.
of J(tXI0~ P. .;
18 ......................... -502 0.012 10 ......................... -440 0.022 111.2 -476 20 ......................... -:lfiO 0.041 20.2 -355 21 ....... , ..... " .......... -275 0.064 21.2 -280 22 ......... ............... -224 0.001 22.2 -20S 2:1 •••••••• , ................ -172 0.133 :!:I.2 -102 24 .••...• ,., .... ,"', ....•• -140 0.215 24.2 -1211 25 .............. " -IDS 0.39S 25.2 -Ill 20 ......................... - '" 0.705 211.2 - " 27 ...... . . . . . . . . . , . . . . . . . . - " 0.88 !!7,2 - " 211.,., .... , •..•.. ,"", .... - " 0.07 2B.!! - 60 20 •• , .......... , ........ , .. - " 1.011 211.2 - " :10 ......................... - 50 1.21 30.2 - 41 :11 .•• , ..•.•............ , ... - 44 1.48 31.2 - 3D 32 ............... ,., ....... - " 1.01 32.2 - '1 33 ................... , .... , - " 2.511 :13.2 - " 34 ........................ - 27 3.30 :14.2 - " :Iii ........................ , - 22 4.40 a·!..!) - 10 30 ......................... - 1fi 0.15 37 ..•... , ....•.•..•.• , B.OO :17.5 •.•.•........•......... 0 12.3
• Owing to the limitetions of apece in this peper, t.lliJulllrcxpcrimentol dom on tho diHtribntion of prl::lllnre potentiels umimoisture in giycn for 0110 I!oil column rmly. t PcrnlCllbility, K, wns culcuhllllu from t.bo vlllocity of flow, V, expfcsseu ill ccntliliotllTII pur I!'ccond und lIlI'! pressure potelltinl Kruuiellt, 'J.p, cxjlrC!!!led in Krnmll lJOr grnm. Tho velues for l' were t.oken from tllbl04, and the vuluC!I fur v.p were Lllken us thc slope of tho eurve uf ~=F(ll) in fiKllru 11.
/
especinlly useful function of the soil moisturc density becnuse it is also Ull index of its confignration. Accordingly, ullsattu-atec1 permeability will be investigated as n function of '" (table 5 an(1 figs. 19, 20).
Permeability is maximum at) 01' near) a pressure potential of zero for all the soils covered by this experiment. The permeability remains constant from zero pressure potential down to pressure potentials of -10 to - 40. Saturation persists for some distance above the plane of zet;opressure potential, but this elistance could not be determined by the, method used for taking moisture samples. This height was probably from 1 to 3 centimeters above the plane of zero-pressure potentinl, and
~Inl'(!hJ 1939]
"00
...
"S
. -
r "0
r -
t-
o .300
11loore: Water OondllCtion from Shallow Water Tables
--I I
Le,srend i <>---<> OOA/e!! sond , o--_~ 1'0/0 fine sond!! loom I , -.. 1'010 I&N ch!! . I ----. 1'010 clo!!
i. ., Il
f f ,~
/1 " II
ii : i f
/ ! / I~ I
~ i
.' _"tll I ~ ..-Jy ~ .... ~"
- ......... ~ -cOO -/00
Pressure po/en/fbi (pr), 'ym-cm/.srm
4la
,
Filf· .19.-Permeability as It function of pressure otentiaJ K _ . menbllity a'tpresscd ns n percentage of the permeabPJ'ty t J -fet{!) WIth perzero. lIn n pressllre potentinl of
Was entirelY,too small to account for the high permeability extendinO" 20 to 30 centimeters above the piezometric surface 0
I Permeability of the Yolo clay was less iu the rau;e of positive pressure t ':'" that. a.t pres.s,;,"e po.tentials .of zei·o to -40 gm-cm/gm. Under certam condltIons dIfferentlal swelling of soil colloids effected by wettinO' at
o
•

414 Hilgaraia
[Vor •. 12, No. 0
,
s ,.-
;- 0
I ..
0
Lo/end I 0---<> Oakley sand J/ ~_D Yolo Iiile sondy loom
------ Yalo, I&N cloy !~ .---... y"lo cloy ! I , b 0
) I - ! , • ;- ,
v·~ ~/
z
~/ /
(
~~ ,/' I
I
r
-
I I I 1 '1. I
I I I 0 -zoo 0
-100 -6'00 ;'ressvre /,0lenl1ol (JI1,,?'m. cmifm
. .. times IOU us (l function of the pressure Fig. 20.-The lognritlun of tho pernlcnbility . __ .I... ..in which V Is
, (KXlOU)=fC,p), plotted for four Bolls. K- V,I,I potentml, log . er grnm oxpressed in cubic centitneters per second, nnd V'I' m grams P .
. . tilt in a greater permeability above different pres~ure potenhals ~a~~e~b ran~e of positive pressme. Yolo tbe piezometrle snr~aee than t ~ III u : th~ over.aU volume of the soil .1 clay swells o~ wettlllg, but no ch ns~,~e~rr the solid particle with its nb- , was deteeted III the enns. In sn lid tiele as far as the permeability sorbed water may act as a larger so par J
Murch, 1939] Moore: Water Oonduction from Shllllow Water Tables 415
of the swollen soil is concerned. This would result in a greater effective yolume.of solid and lesser effective volume of pore space per unit volume of soil, and likewise, a lower total effective pore area and fewer continuous pores pel' unit of cross-sectional area of the soil column. If the soil eoUoids swell in proportion to the pressure potential at whieb they are wetted, the total pore spuce effecth·e in the conduction of ",vater in the soH COIUllUlS wonld decrense as this potential increased. lienee the pel' cent of effective l)01'e space in the runge of positive potentials ,,"auld be less thau in the rllnge of neguth·e potentials, and permeability may be greater for SODle distance above the piezometric surface than that obtai;Ded below this surface.
Tlw Effect of Texturc 011 Soil Pel'lHcabllitv.-'rhe effect of texture on the Illanner with which permeability changes with pressure potential is sltmnl in figures 19 und 20. For the soils studied, saturated permeability increascs with increasing' coarseness of texture. In the rungc of capillary flow, the rate of chauge of permeability with prcssure potential, i3 ILia.", increases with increasing' coarseness of texture, sueh as to produce the l'eyc~rsal of permeabillties shown ill figure 20. 'fIle soils a~'l'nngec1 in permeability series ure, nt suturution:
sand>fine sandy loam>light elnr>cluy
uudat¢=-IOO
sund<fille sandy loam<light eluy<elay.
Zero Capillary PCl'lIw({uility.-The evaluation of the Soilllloisture coutent, 01' the pressure potential ill the soil at which cnpillary conductivity becomes zero, is of importance in the study of. soil-moisture problems, such as: the distribution of ,rater in the soil, the translocation of soluble suIts, the maximum height of capillary rise, etc. Richards (18) states thnt the wuter in soils 1s no 1011ge1' present in a continuous liquid pha:-:;e, and Cllpillul'yflow ceases nt the point where capillnry conc1uctiyity becomes zero. At field capacity or at the normal moisture capacity the capilllU'yperDleability of soils must be zero 01' approximately zero illl(l auy wuter tr~l11s10catjon must take place ill the yapor phase (13,22,33 .. 34).
In this paper zero capillary permeability is discussed under the two criteria: the pressure potential of the wettiug' front, and the pressure potential at which a Kia ¢ = O. .
'rhe advunce or the wetting' front was observed in the soil columns through celluloid-covered holes in the soil CUllS. Core moisture samples were taken at the wetting front with a 1A -mch cork borer, eare being taken to inelude no dry soil. The center of the core was about o/,o·inch