Embed Size (px)
DESCRIPTION
Colorimeter Experiment
Citation preview
Making a Colorimeter to Determine
Blue Dye Concentration
Arun Pidugu
10th Grade
Methacton High School
Problem Question: Can a simple, electronic
device functioning as a colorimeter be used to
determine the unknown concentration of blue dye
in sports drinks and also study the rate of a
chemical reaction involving blue dye.
Background Information
• A colorimeter is a device that measures the absorbance of light by a colored
solution.
• It has many applications, such analyzing of water quality or finding the hemoglobin
content in blood.
• A colorimeter can be used to find the concentration of blue dye in sports drinks
because according to Beer-Lambert’s Law, the concentration of a substance in a
solution is proportional to the absorbance of light by the solution.
• FD&C Blue 1, which is used in this study, is a dye commonly found in foods and
drinks.
• Dyes can cause allergic reactions in individuals who suffer from allergies or asthma
and they are also harmful when consumed in high concentrations.
• Due to the fact that many people consume sports drinks which are colored with
dyes, I have decided to build a electronic device that functions as a colorimeter to
determine the unknown concentration of blue dye in sports drinks.
Background Information
• A dye-sensitized solar cell is a type of solar cell that is based on a semiconductor
formed between a photo-sensitized anode and a liquid electrolyte
• It belongs to a group of solar cells known as thin-film photovoltaic cells, which
means that they are constructed by depositing one or more layers of light-absorbing
materials on a substrate
• Because they are cheaper, lighter, and easier to manufacture than regular silicon-
based solar cells, they are considered to be a viable new energy-source, especially
in regards to developing countries
• The dye-sensitized solar cells created in this experiment
Background Information
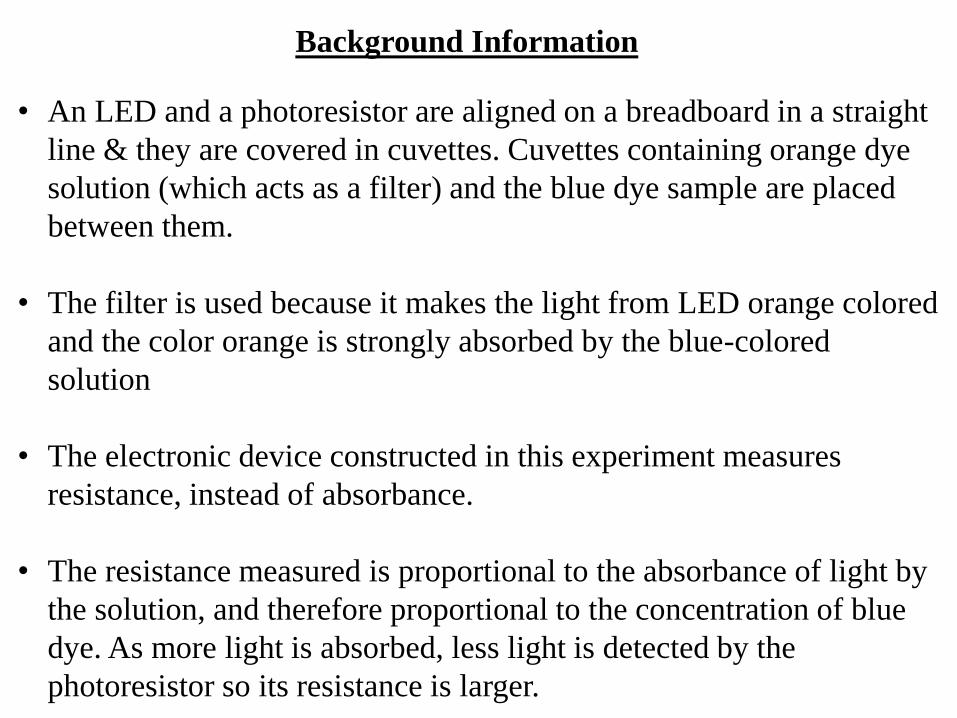
• An LED and a photoresistor are aligned on a breadboard in a straight
line & they are covered in cuvettes. Cuvettes containing orange dye
solution (which acts as a filter) and the blue dye sample are placed
between them.
• The filter is used because it makes the light from LED orange colored
and the color orange is strongly absorbed by the blue-colored
solution
• The electronic device constructed in this experiment measures
resistance, instead of absorbance.
• The resistance measured is proportional to the absorbance of light by
the solution, and therefore proportional to the concentration of blue
dye. As more light is absorbed, less light is detected by the
photoresistor so its resistance is larger.
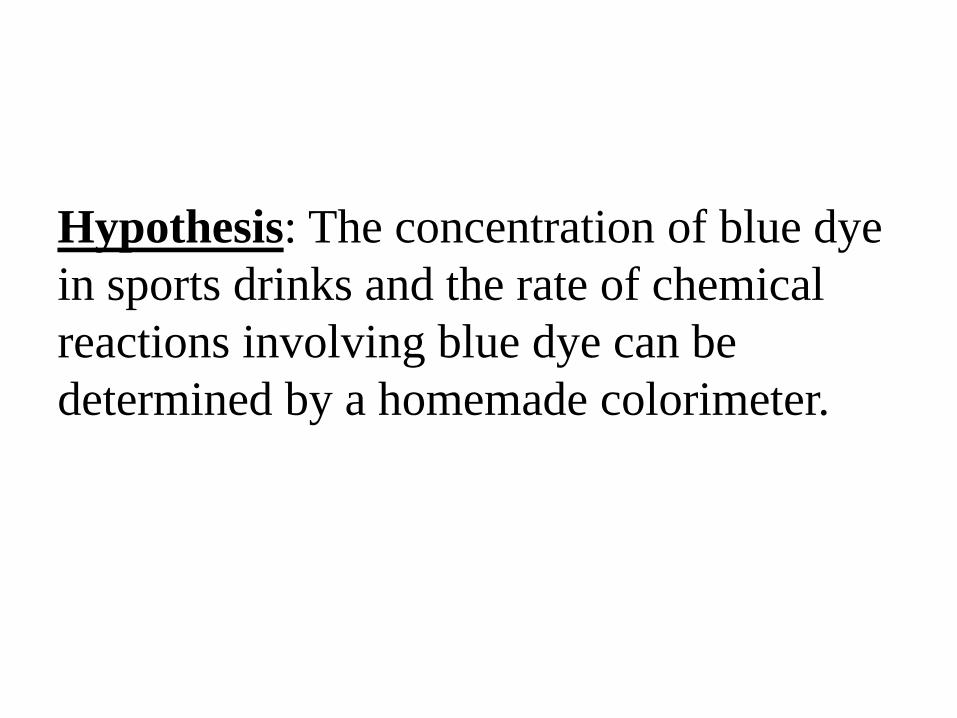
Hypothesis: The concentration of blue dye
in sports drinks and the rate of chemical
reactions involving blue dye can be
determined by a homemade colorimeter.
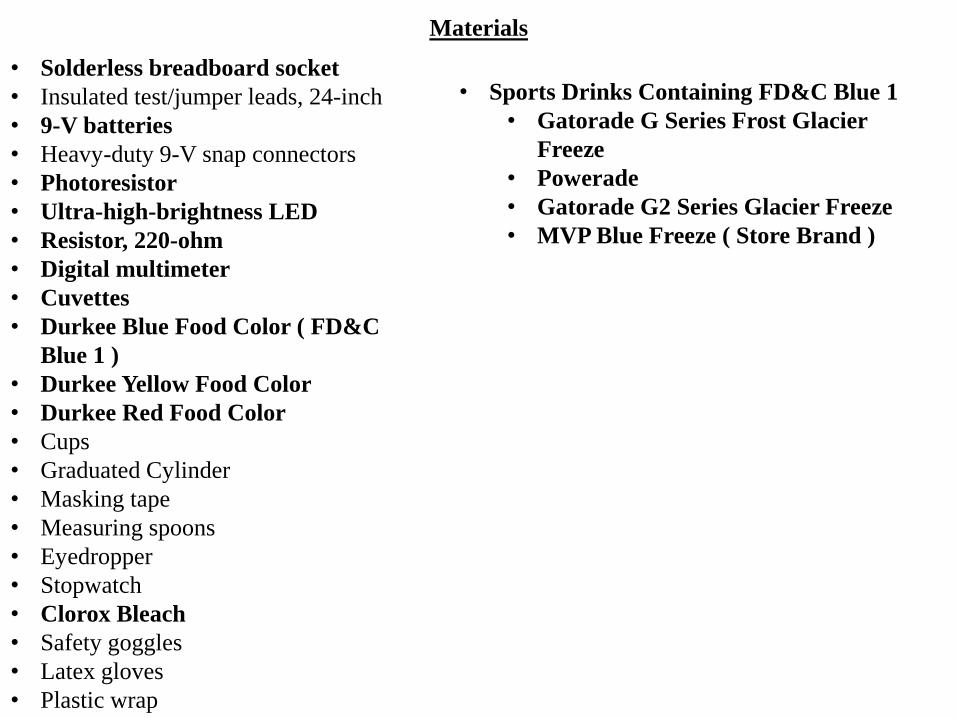
Materials
• Solderless breadboard socket
• Insulated test/jumper leads, 24-inch
• 9-V batteries
• Heavy-duty 9-V snap connectors
• Photoresistor
• Ultra-high-brightness LED
• Resistor, 220-ohm
• Digital multimeter
• Cuvettes
• Durkee Blue Food Color ( FD&C
Blue 1 )
• Durkee Yellow Food Color
• Durkee Red Food Color
• Cups
• Graduated Cylinder
• Masking tape
• Measuring spoons
• Eyedropper
• Stopwatch
• Clorox Bleach
• Safety goggles
• Latex gloves
• Plastic wrap
• Sports Drinks Containing FD&C Blue 1
• Gatorade G Series Frost Glacier
Freeze
• Powerade
• Gatorade G2 Series Glacier Freeze
• MVP Blue Freeze ( Store Brand )
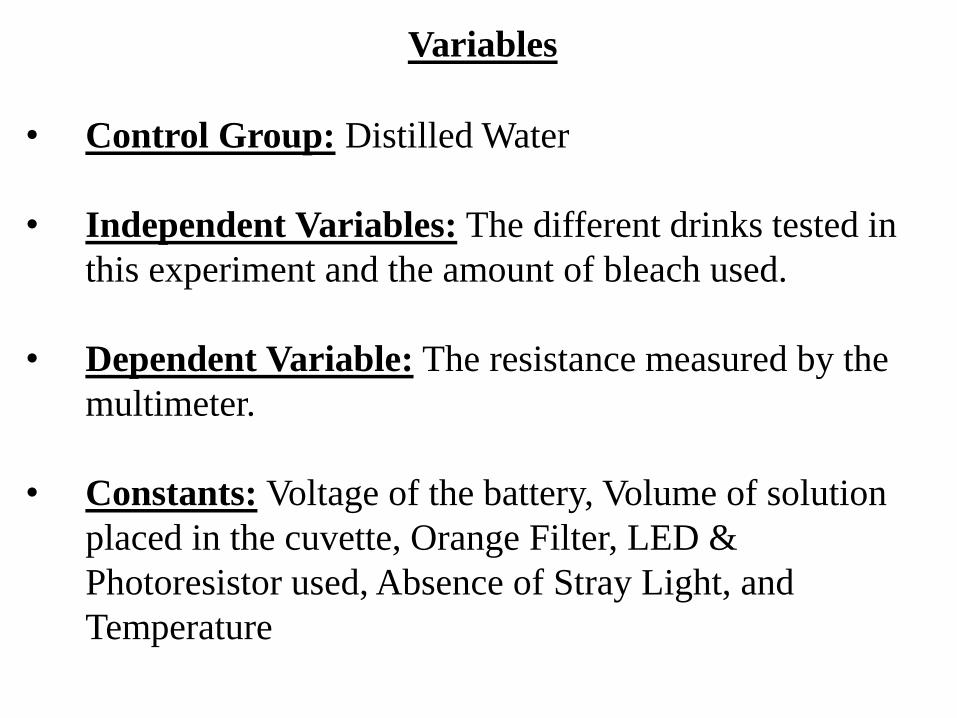
Variables
• Control Group: Distilled Water
• Independent Variables: The different drinks tested in
this experiment and the amount of bleach used.
• Dependent Variable: The resistance measured by the
multimeter.
• Constants: Voltage of the battery, Volume of solution
placed in the cuvette, Orange Filter, LED &
Photoresistor used, Absence of Stray Light, and
Temperature
Procedure
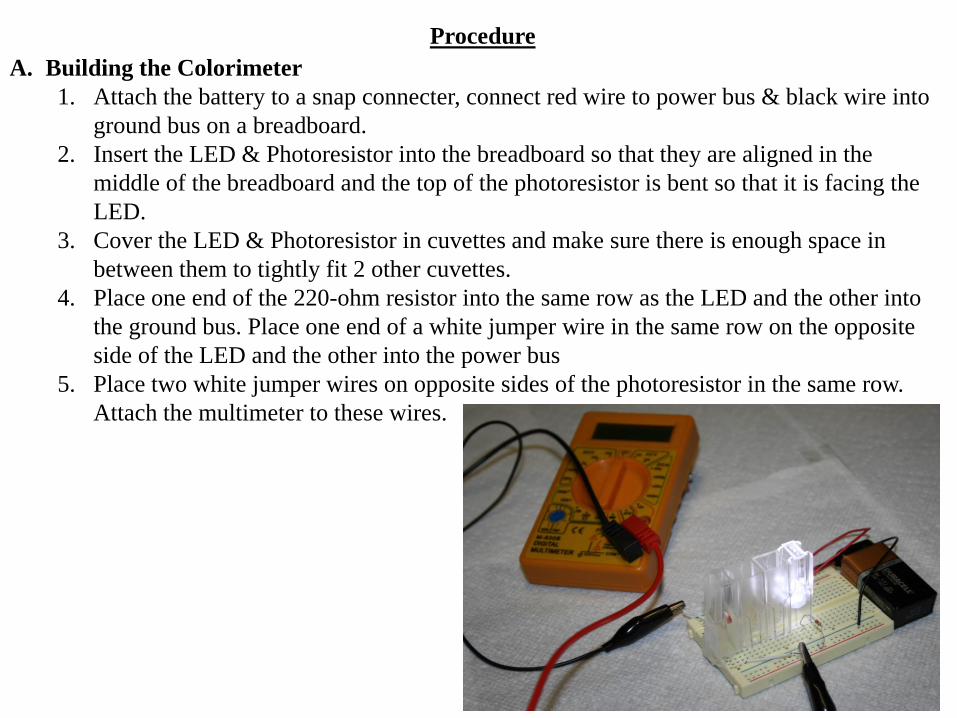
A. Building the Colorimeter
1. Attach the battery to a snap connecter, connect red wire to power bus & black wire into
ground bus on a breadboard.
2. Insert the LED & Photoresistor into the breadboard so that they are aligned in the
middle of the breadboard and the top of the photoresistor is bent so that it is facing the
LED.
3. Cover the LED & Photoresistor in cuvettes and make sure there is enough space in
between them to tightly fit 2 other cuvettes.
4. Place one end of the 220-ohm resistor into the same row as the LED and the other into
the ground bus. Place one end of a white jumper wire in the same row on the opposite
side of the LED and the other into the power bus
5. Place two white jumper wires on opposite sides of the photoresistor in the same row.
Attach the multimeter to these wires.
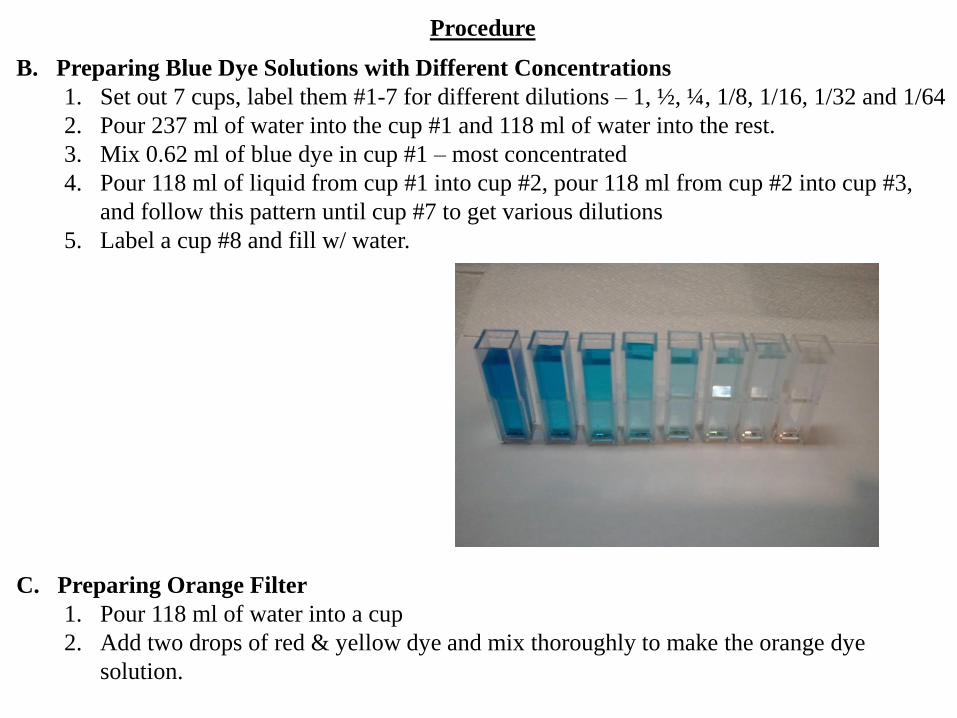
B. Preparing Blue Dye Solutions with Different Concentrations
1. Set out 7 cups, label them #1-7 for different dilutions – 1, ½, ¼, 1/8, 1/16, 1/32 and 1/64
2. Pour 237 ml of water into the cup #1 and 118 ml of water into the rest.
3. Mix 0.62 ml of blue dye in cup #1 – most concentrated
4. Pour 118 ml of liquid from cup #1 into cup #2, pour 118 ml from cup #2 into cup #3,
and follow this pattern until cup #7 to get various dilutions
5. Label a cup #8 and fill w/ water.
C. Preparing Orange Filter
1. Pour 118 ml of water into a cup
2. Add two drops of red & yellow dye and mix thoroughly to make the orange dye
solution.
Procedure
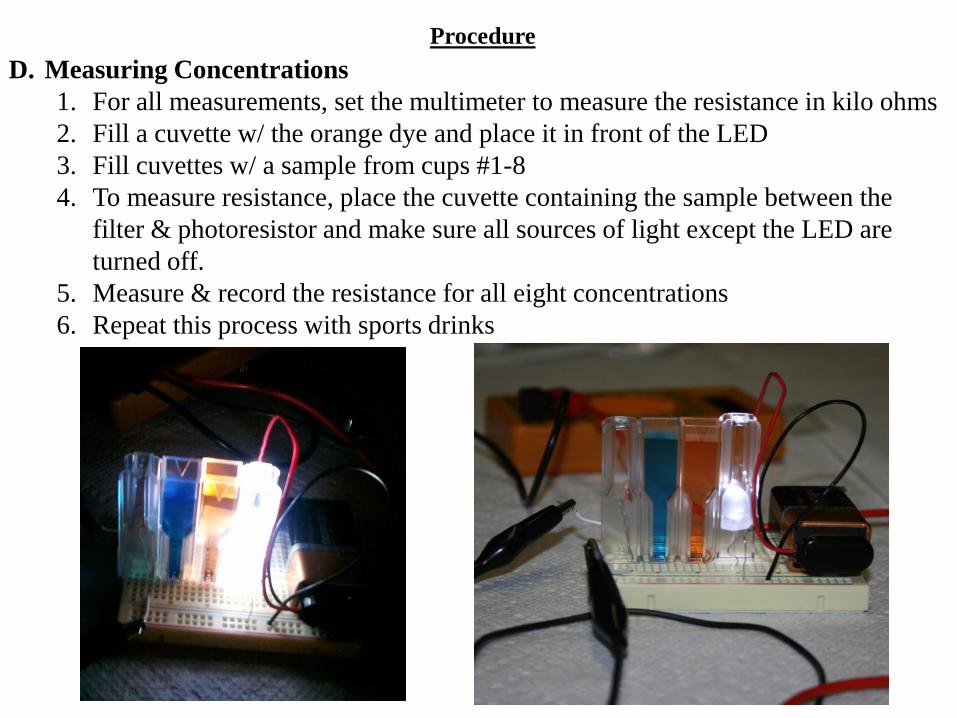
D. Measuring Concentrations
1. For all measurements, set the multimeter to measure the resistance in kilo ohms
2. Fill a cuvette w/ the orange dye and place it in front of the LED
3. Fill cuvettes w/ a sample from cups #1-8
4. To measure resistance, place the cuvette containing the sample between the
filter & photoresistor and make sure all sources of light except the LED are
turned off.
5. Measure & record the resistance for all eight concentrations
6. Repeat this process with sports drinks
Procedure
Procedure
E. Studying Chemical Kinetics to Observe the Rate of Color Loss
1. Fill 3 cuvettes w/ water and for each, measure the resistance then put one
drop of bleach into the water, mix, and record resistance again.
2. Use the most concentrated blue dye solution in this study
3. For each sample, measure the initial resistance then put one drop of bleach
into the solution, mix, and record resistance every minute for 5 minutes, then
every two minutes until the resistance stops changing, indicating the color
loss is complete.
4. Repeat this process w/ two & four drops of bleach
F. Calculations
1. Using Excel, graph the resistance values measured for the known
concentrations of blue dye w/ concentration on the x-axis and resistance on
the y-axis.
2. Use the trend line feature and graph the trend line which has the R2 value that
is closest to 1. The R2 value represents how well a line fits a set of points and
the closer it is to 1, the better the line fits the set of points.
3. The equation of the trend line will be used to find unknown blue dye
concentrations.
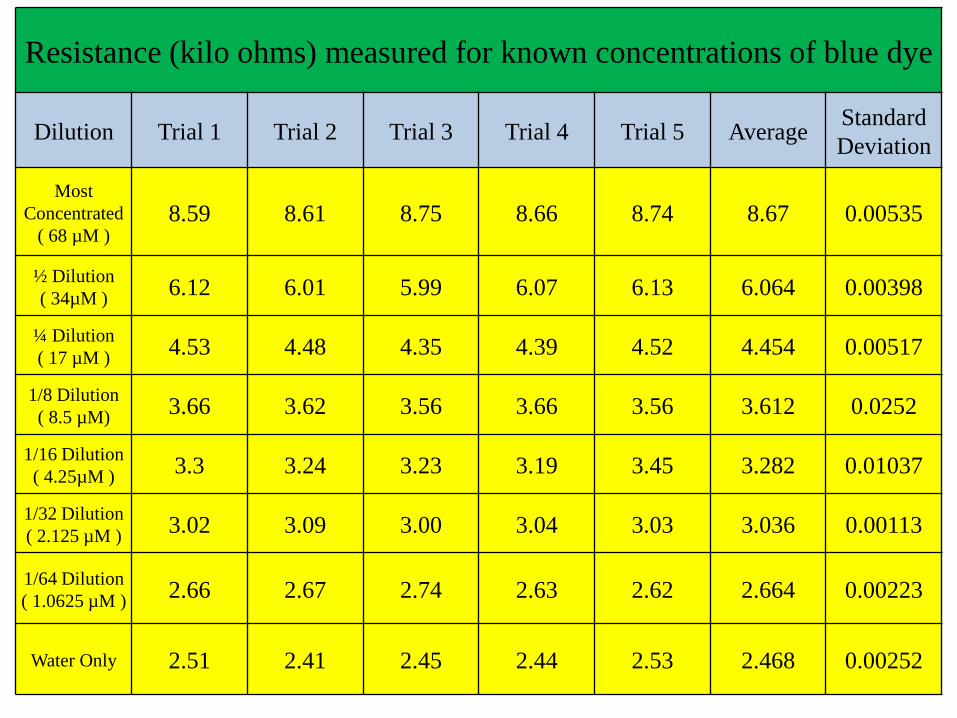
Resistance (kilo ohms) measured for known concentrations of blue dye
Dilution Trial 1 Trial 2 Trial 3 Trial 4 Trial 5 Average Standard
Deviation
Most
Concentrated
( 68 µM ) 8.59 8.61 8.75 8.66 8.74 8.67 0.00535
½ Dilution
( 34µM ) 6.12 6.01 5.99 6.07 6.13 6.064 0.00398
¼ Dilution
( 17 µM ) 4.53 4.48 4.35 4.39 4.52 4.454 0.00517
1/8 Dilution
( 8.5 µM) 3.66 3.62 3.56 3.66 3.56 3.612 0.0252
1/16 Dilution
( 4.25µM ) 3.3 3.24 3.23 3.19 3.45 3.282 0.01037
1/32 Dilution
( 2.125 µM ) 3.02 3.09 3.00 3.04 3.03 3.036 0.00113
1/64 Dilution
( 1.0625 µM ) 2.66 2.67 2.74 2.63 2.62 2.664 0.00223
Water Only 2.51 2.41 2.45 2.44 2.53 2.468 0.00252
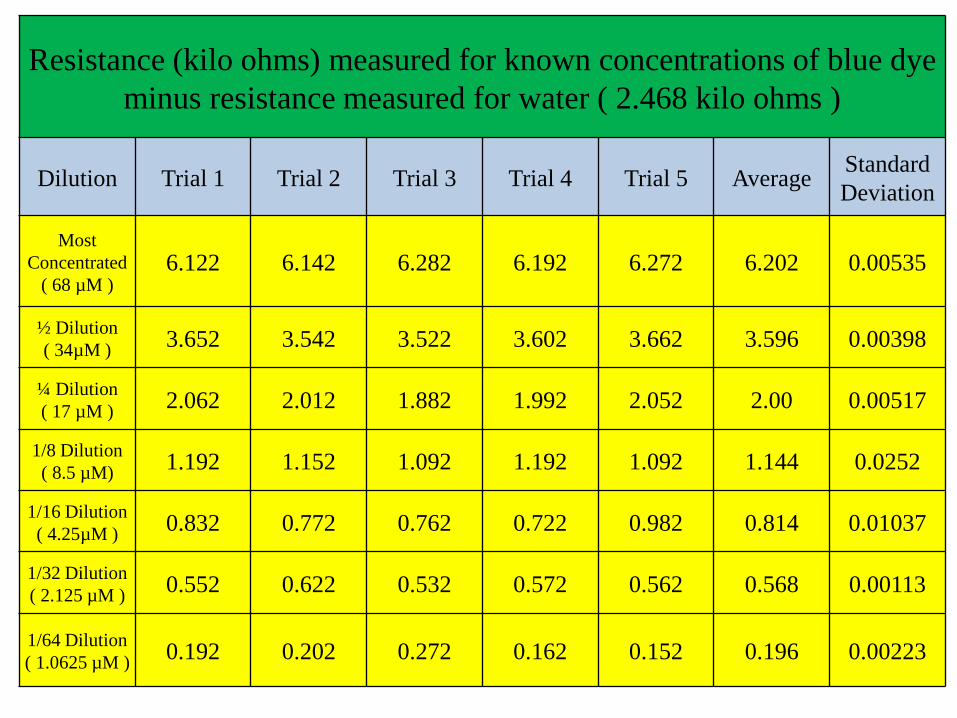
Resistance (kilo ohms) measured for known concentrations of blue dye
minus resistance measured for water ( 2.468 kilo ohms )
Dilution Trial 1 Trial 2 Trial 3 Trial 4 Trial 5 Average Standard
Deviation
Most
Concentrated
( 68 µM ) 6.122 6.142 6.282 6.192 6.272 6.202 0.00535
½ Dilution
( 34µM ) 3.652 3.542 3.522 3.602 3.662 3.596 0.00398
¼ Dilution
( 17 µM ) 2.062 2.012 1.882 1.992 2.052 2.00 0.00517
1/8 Dilution
( 8.5 µM) 1.192 1.152 1.092 1.192 1.092 1.144 0.0252
1/16 Dilution
( 4.25µM ) 0.832 0.772 0.762 0.722 0.982 0.814 0.01037
1/32 Dilution
( 2.125 µM ) 0.552 0.622 0.532 0.572 0.562 0.568 0.00113
1/64 Dilution
( 1.0625 µM ) 0.192 0.202 0.272 0.162 0.152 0.196 0.00223
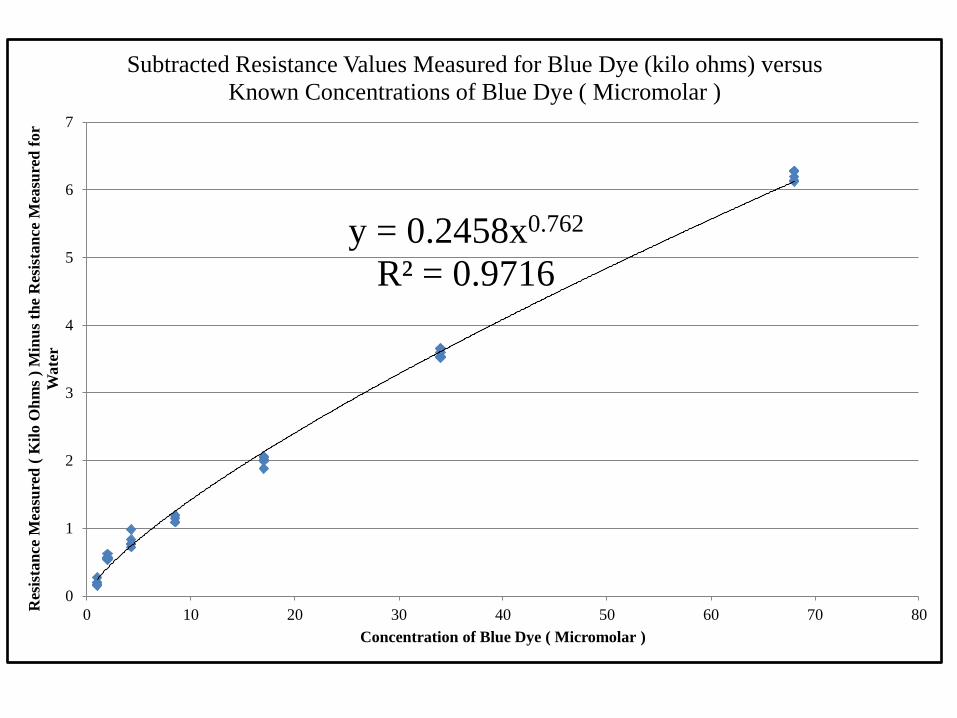
y = 0.2458x0.762
R² = 0.9716
0
1
2
3
4
5
6
7
0 10 20 30 40 50 60 70 80
Res
ista
nce
Mea
sure
d (
Kil
o O
hm
s )
Min
us
the
Res
ista
nce
Mea
sure
d f
or
Wate
r
Concentration of Blue Dye ( Micromolar )
Subtracted Resistance Values Measured for Blue Dye (kilo ohms) versus
Known Concentrations of Blue Dye ( Micromolar )
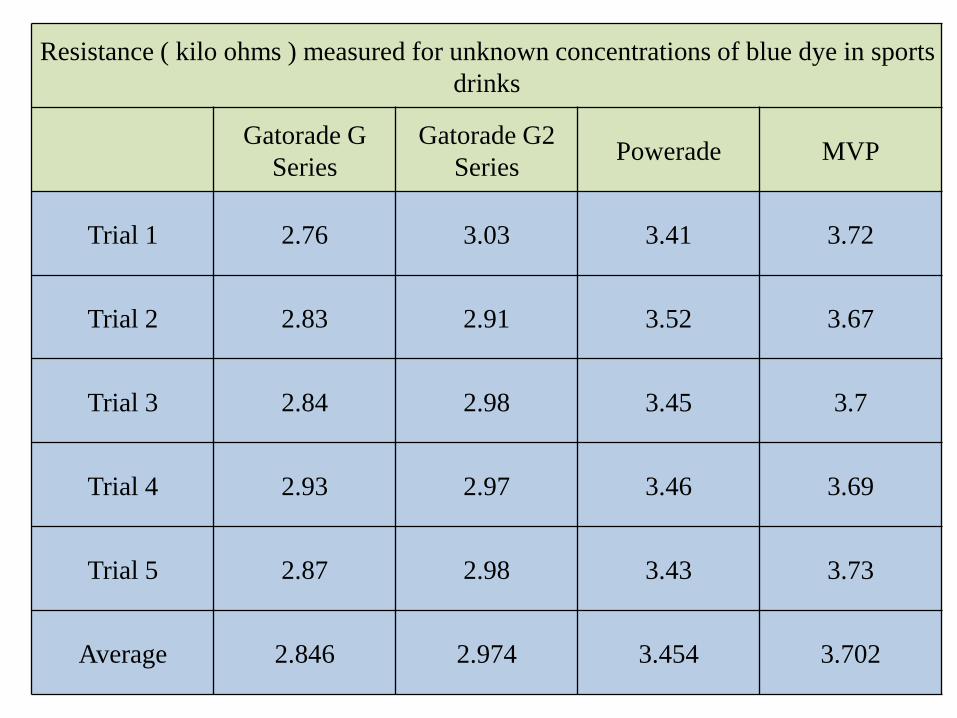
Resistance ( kilo ohms ) measured for unknown concentrations of blue dye in sports
drinks
Gatorade G
Series
Gatorade G2
Series Powerade MVP
Trial 1 2.76 3.03 3.41 3.72
Trial 2 2.83 2.91 3.52 3.67
Trial 3 2.84 2.98 3.45 3.7
Trial 4 2.93 2.97 3.46 3.69
Trial 5 2.87 2.98 3.43 3.73
Average 2.846 2.974 3.454 3.702
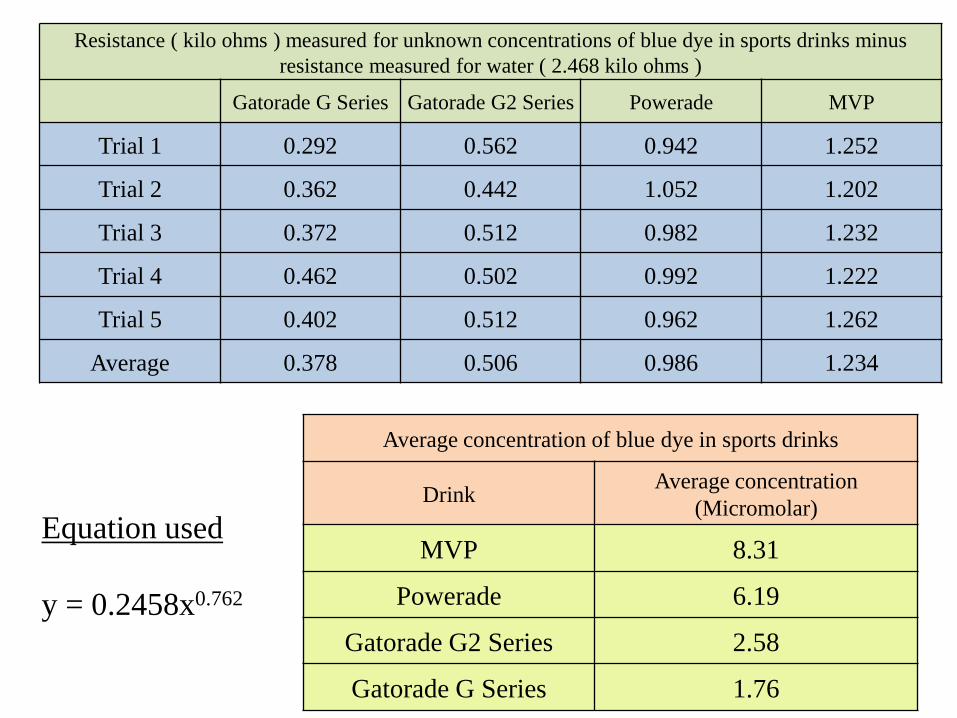
Resistance ( kilo ohms ) measured for unknown concentrations of blue dye in sports drinks minus
resistance measured for water ( 2.468 kilo ohms )
Gatorade G Series Gatorade G2 Series Powerade MVP
Trial 1 0.292 0.562 0.942 1.252
Trial 2 0.362 0.442 1.052 1.202
Trial 3 0.372 0.512 0.982 1.232
Trial 4 0.462 0.502 0.992 1.222
Trial 5 0.402 0.512 0.962 1.262
Average 0.378 0.506 0.986 1.234
Average concentration of blue dye in sports drinks
Drink Average concentration
(Micromolar)
MVP 8.31
Powerade 6.19
Gatorade G2 Series 2.58
Gatorade G Series 1.76
Equation used
y = 0.2458x0.762
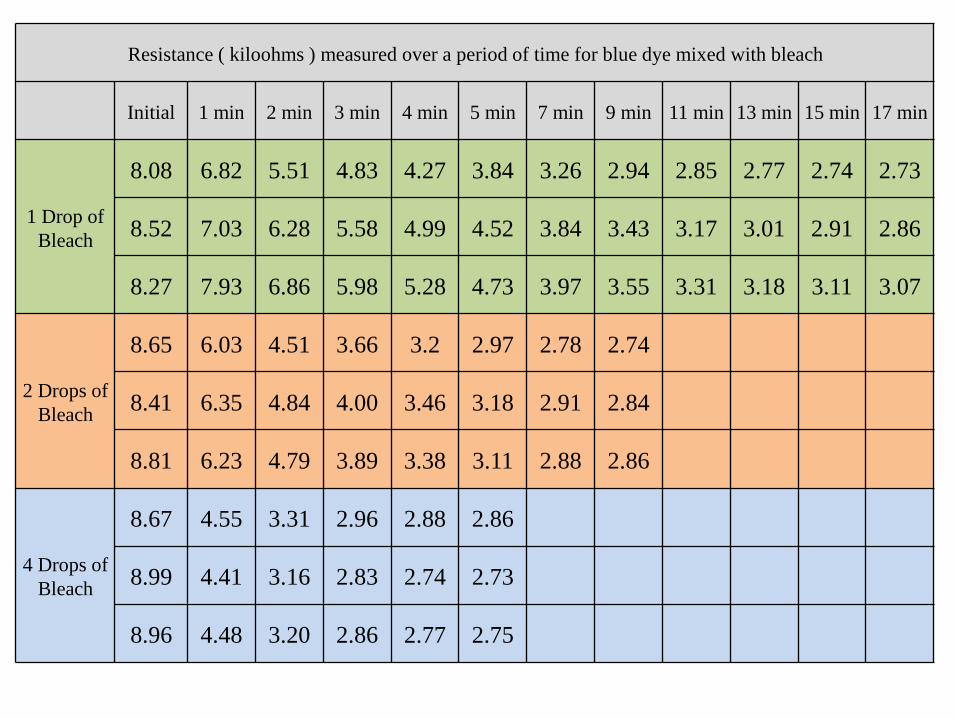
Resistance ( kiloohms ) measured over a period of time for blue dye mixed with bleach
Initial 1 min 2 min 3 min 4 min 5 min 7 min 9 min 11 min 13 min 15 min 17 min
1 Drop of
Bleach
8.08 6.82 5.51 4.83 4.27 3.84 3.26 2.94 2.85 2.77 2.74 2.73
8.52 7.03 6.28 5.58 4.99 4.52 3.84 3.43 3.17 3.01 2.91 2.86
8.27 7.93 6.86 5.98 5.28 4.73 3.97 3.55 3.31 3.18 3.11 3.07
2 Drops of
Bleach
8.65 6.03 4.51 3.66 3.2 2.97 2.78 2.74
8.41 6.35 4.84 4.00 3.46 3.18 2.91 2.84
8.81 6.23 4.79 3.89 3.38 3.11 2.88 2.86
4 Drops of
Bleach
8.67 4.55 3.31 2.96 2.88 2.86
8.99 4.41 3.16 2.83 2.74 2.73
8.96 4.48 3.20 2.86 2.77 2.75
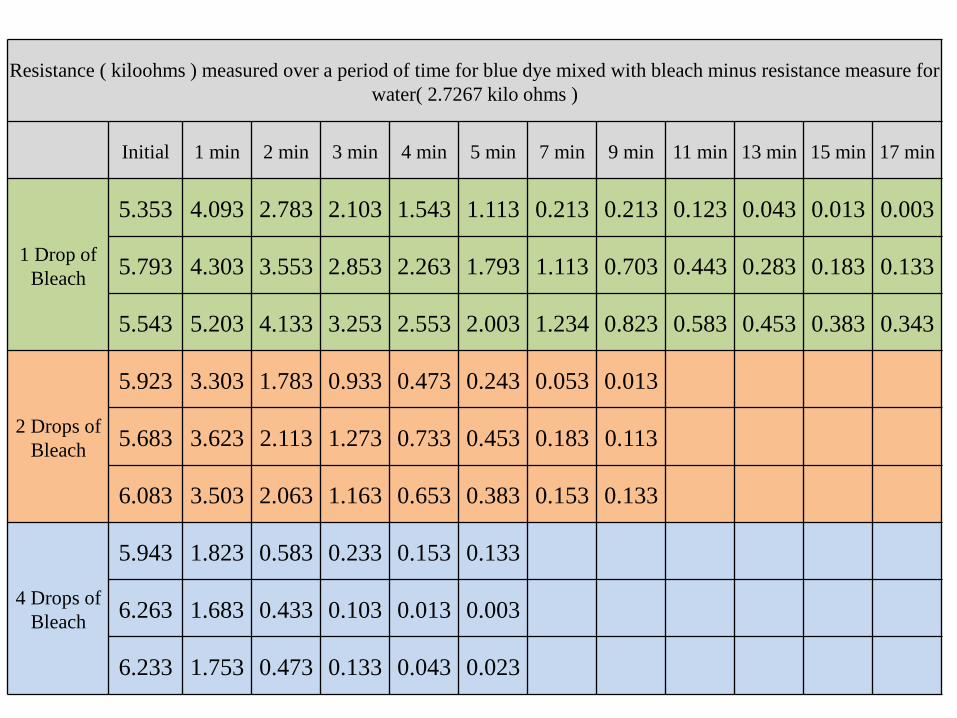
Resistance ( kiloohms ) measured over a period of time for blue dye mixed with bleach minus resistance measure for
water( 2.7267 kilo ohms )
Initial 1 min 2 min 3 min 4 min 5 min 7 min 9 min 11 min 13 min 15 min 17 min
1 Drop of
Bleach
5.353 4.093 2.783 2.103 1.543 1.113 0.213 0.213 0.123 0.043 0.013 0.003
5.793 4.303 3.553 2.853 2.263 1.793 1.113 0.703 0.443 0.283 0.183 0.133
5.543 5.203 4.133 3.253 2.553 2.003 1.234 0.823 0.583 0.453 0.383 0.343
2 Drops of
Bleach
5.923 3.303 1.783 0.933 0.473 0.243 0.053 0.013
5.683 3.623 2.113 1.273 0.733 0.453 0.183 0.113
6.083 3.503 2.063 1.163 0.653 0.383 0.153 0.133
4 Drops of
Bleach
5.943 1.823 0.583 0.233 0.153 0.133
6.263 1.683 0.433 0.103 0.013 0.003
6.233 1.753 0.473 0.133 0.043 0.023
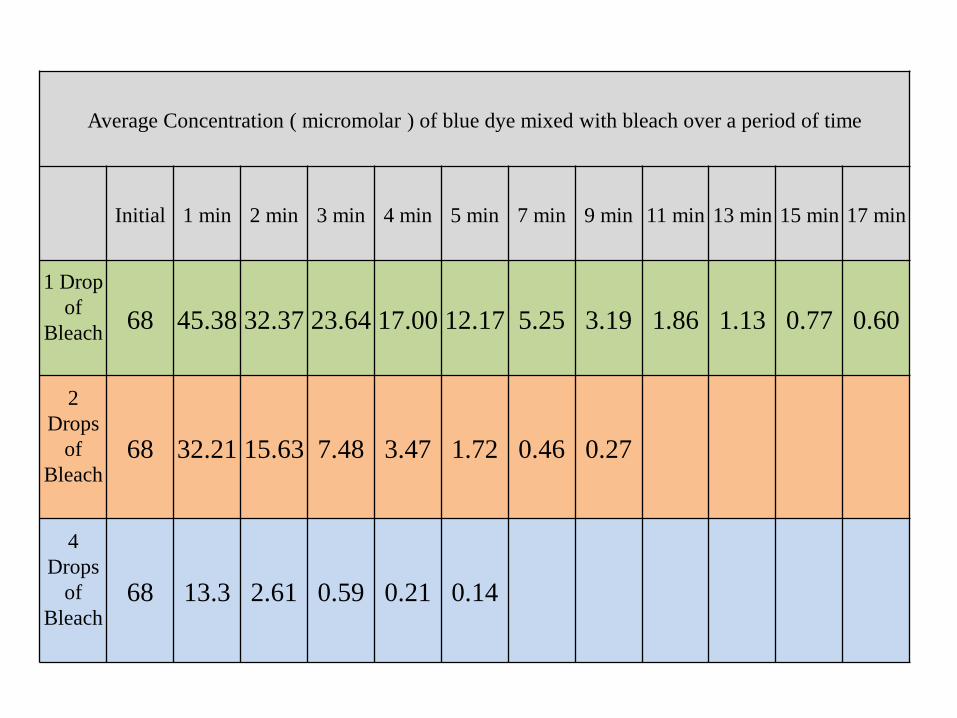
Average Concentration ( micromolar ) of blue dye mixed with bleach over a period of time
Initial 1 min 2 min 3 min 4 min 5 min 7 min 9 min 11 min 13 min 15 min 17 min
1 Drop
of
Bleach
68 45.38 32.37 23.64 17.00 12.17 5.25 3.19 1.86 1.13 0.77 0.60
2
Drops
of
Bleach
68 32.21 15.63 7.48 3.47 1.72 0.46 0.27
4
Drops
of
Bleach
68 13.3 2.61 0.59 0.21 0.14
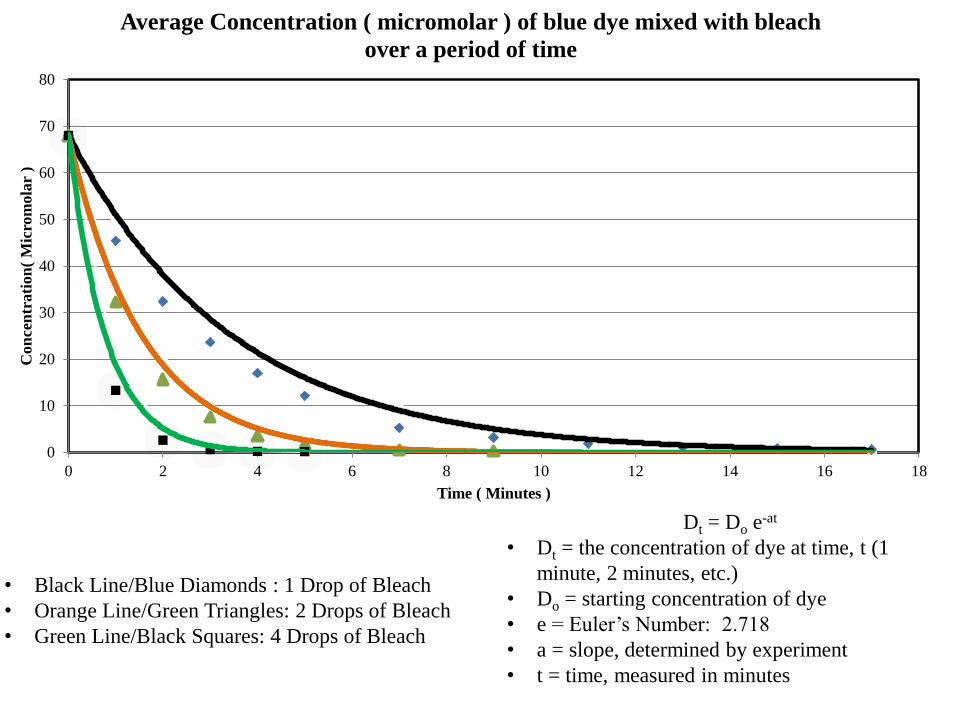
Dt = Do e-at
• Dt = the concentration of dye at time, t (1
minute, 2 minutes, etc.)
• Do = starting concentration of dye
• e = Euler’s Number: 2.718
• a = slope, determined by experiment
• t = time, measured in minutes
0
10
20
30
40
50
60
70
80
0 2 4 6 8 10 12 14 16 18
Con
cen
trati
on
( M
icro
mola
r )
Time ( Minutes )
Average Concentration ( micromolar ) of blue dye mixed with bleach
over a period of time
• Black Line/Blue Diamonds : 1 Drop of Bleach
• Orange Line/Green Triangles: 2 Drops of Bleach
• Green Line/Black Squares: 4 Drops of Bleach
Conclusion
• The resistance measured in this experiment was directly
proportional to the blue dye concentration proving that this
colorimeter works in accordance with the Beer Lambert law.
• The calculated concentrations of blue dye mixed w/ bleach over
time, correctly modeled the exponential decay equation, further
proving that the homemade colorimeter is reliable.
• From the results, it can be seen that the store brand MVP sports
drinks had the highest blue dye concentration, 8.31µM
• The results confirm the hypothesis, which stated that the
homemade colorimeter can be successfully used in determining
the unknown concentrations of blue dye.
Possible Errors
• The photoresistor might have been slightly moved over the course of this
experiment, which would have caused the values measured by the
multimeter to have differed slightly
• The voltage of the battery could have decreased over time, causing a
change in the intensity of the light and therefore could have slightly altered
the resistance measured by the multimeter. To counter this the battery was
changed halfway through the experiment
Future Ideas
• A lab colorimeter could be used to determine the concentration of blue
dye in sports drinks and to see how the results compare with the results
of this experiment.
• To analyze the concentration of other dyes using different colored
filters, such as analyzing the concentration of red dye in sports drinks
using a blue-green filter.
Real World Applications
• Using the colorimeter to help in determining the concentration of
blue dye in sports drinks can be useful to find out if the
concentration is high enough to be potentially harmful.
• Individuals who are allergic to dyes can use this homemade
colorimeter to determine the unknown concentrations of the dyes in
various food products. Depending on their sensitivity level to the
dye, they can avoid products with high dye concentrations.
• The homemade colorimeter can also be used to accomplish useful
tasks such as testing water quality by helping screen for impurities
such as iron or zinc.