Embed Size (px)
Citation preview

Accepted Manuscript
Rosemary distillation residues reduce lipid oxidation, increasealpha-tocopherol content and improve fatty acid profile of lambmeat
Y. Yagoubi, M. Joy, G. Ripoll, M. Mahouachi, J.R. Bertolín, N.Atti
PII: S0309-1740(17)30162-6DOI: doi:10.1016/j.meatsci.2017.10.007Reference: MESC 7383
To appear in: Meat Science
Received date: 7 February 2017Revised date: 20 September 2017Accepted date: 10 October 2017
Please cite this article as: Y. Yagoubi, M. Joy, G. Ripoll, M. Mahouachi, J.R. Bertolín,N. Atti , Rosemary distillation residues reduce lipid oxidation, increase alpha-tocopherolcontent and improve fatty acid profile of lamb meat. The address for the correspondingauthor was captured as affiliation for all authors. Please check if appropriate. Mesc(2017),doi:10.1016/j.meatsci.2017.10.007
This is a PDF file of an unedited manuscript that has been accepted for publication. Asa service to our customers we are providing this early version of the manuscript. Themanuscript will undergo copyediting, typesetting, and review of the resulting proof beforeit is published in its final form. Please note that during the production process errors maybe discovered which could affect the content, and all legal disclaimers that apply to thejournal pertain.

ACC
EPTE
D M
ANU
SCR
IPT
Rosemary distillation residues reduce lipid oxidation, increase alpha-
tocopherol content and improve fatty acid profile of lamb meat
Y. Yagoubi1, 2, M. Joy3, G. Ripoll3, M. Mahouachi4, J. R. Bertolín3, N. Atti1,*
1University of Carthage, INRA-Tunisia, Laboratoire de Productions Animales et Fourragères,
rue Hédi Karray, 2049 Ariana, Tunisia
2University of Carthage, INAT, 43 Avenue Charles Nicole, Tunis, Tunisia
3Centro de Investigación y Tecnología Agroalimentaria de Aragón (CITA).Instituto
Agroalimentario de Aragón – IA2 (CITA-Universidad de Zaragoza).Avda. Montañana, 930,
50059, Zaragoza, Spain
4 University of Jendouba, ESAK, Le Kef, Tunisia
*Corresponding author: Naziha ATTI
E-mail address: [email protected]; [email protected]
ACCEPTED MANUSCRIPT

ACC
EPTE
D M
ANU
SCR
IPT
Abstract
The experiment studied the effects of rosemary distillation residues (RR) intake on lamb
meat quality, oxidative stability and fatty acid (FA) profile. Barbarine lambs of Control group
were fed 600 g of hay, which was substituted by 600 g of pellets containing 60 and 87% of RR
for RR60 and RR87 groups; all animals received 600 g of concentrate. Meat protein and fat
content was similar for 3 treatments. Lipid oxidation was strongly reduced with RR diets. Both
RR diets resulted in a higher α- tocopherol content in muscle. The metmyoglobin and
deoxymyoglobin percentages were similar for all groups; however oxymyoglobin was higher
for RR groups. The saturated (SFA) and unsaturated FAs (UFA) were unaffected by the diets.
However, the PUFA, n-6 and n-3 were higher for RR groups. In conclusion, rosemary residues
resulted in higher vitamin E content, so it enhanced the oxidative status and improved the fatty
acid profile of lamb meat.
Keywords: Rosemary residues, Oxidative stability, Vitamin E, Fatty acids, Lambs
1. Introduction
Lamb meat is widely appreciated by consumers in the West Asia North Africa area. In
this region as well as in the rest of globe, the consumers are becoming more health-conscious
and tend to search nutritious foods with health-promoting functions. They have an increasing
tendency to select foods with high levels of polyunsaturated (PUFA), mainly n−3 PUFA,
antioxidants and minerals (Ponnampalam et al., 2010). Meat quality is mainly affected by the
animal feeding system (Hajji et al., 2016). Indeed, nutritional treatments can be used to develop
animal growth and manipulate the fatty acid (FA) content to improve the nutritional value of
lamb or cattle’s meat (Joy, Ripoll, Molino, Dervishi, & Alvarez-Rodriguez, 2012;
Ponnampalam, Burnett, Norng, Hopkins, Plozza, & Jacobs, 2016). The color and flavor of fresh
ACCEPTED MANUSCRIPT

ACC
EPTE
D M
ANU
SCR
IPT
meat are the first factors taken into consideration by consumers. The oxidation of muscle
components such as lipids and myoglobin during storage is the most important cause of meat
deterioration that leads to changes in color, odor, flavor and texture (Buckley, Morrissey, &
Gray, 1995). Synthetic antioxidants were extensively used to delay meat deterioration but
consumers are looking more for safety and healthy meat products naturally produced (Troy &
Kerry, 2010). Specific production systems could improve meat qualitative traits (Atti, Rouissi,
& Mahouachi, 2005) and the antioxidant status (Nieto, & Ros, 2012). Also, using vitamin E (α-
tocopherol) or foods rich in natural antioxidant leads to a reduction in meat oxidation (Buckley
et al., 1995; Ripoll, Joy, & Muñoz, 2011). The secondary metabolites of some plants present a
strong power as natural antioxidants. In fact, their incorporation directly to animal tissues by
feeding is more efficient than the post mortem antioxidant treatment to meat (Kerry, Buckley,
Morrisey, O’Sullivan, & Lynch, 1999).
The saturated fatty acids (SFA) are usually related to cardiovascular diseases (Pariza,
Park, & Cook, 2001). It is well known that meat is the main source of SFA in the human diet,
but consumers are looking for meat with high unsaturated FA proportion. However, the
unsaturated FA are more susceptible to lipid oxidation than SFA (Wood & Enser, 1997).
In regard to potential antioxidant activity of natural foods, much attention has been
directed to essential oils (EO) of medicinal and aromatic plants. These plants had great amounts
of secondary metabolites such as phenolic compounds and flavonoids. The Rosemary, garlic
and Artemisia’s EO or distillated leaves were used in animal nutrition as additives to extend the
shelf life and increase the acceptability of meat during storage (Nieto & Ros, 2012; Smeti, Atti,
Mahouachi, & Muñoz, 2013). Rosemary is widespread in the Mediterranean area. After its
distillation to produce EO, a great quantity of residues is produced. Given the availability of
this by-product in Tunisia (5460 Tm/ year; APIA, 2003), its use as alternative food for small
ruminants is very interesting seen that this region suffers from the unavailability of forage
ACCEPTED MANUSCRIPT
ACC
EPTE
D M
ANU
SCR
IPT
caused by severe drought and the volatilizing prices of concentrate which worsened the
situation. However, none of the cited studies looked into the possibility of total replacing of
conventional forage by the distillation residues of medicinal and aromatic plants.
Therefore, the aim of this study was to determine the effects of substitution of oat hay
with rosemary distillation residues (RR) on the color stability, myoglobin content, lipid
oxidation, vitamin E and fatty acid profile of lamb meat.
2. Material and Methods
The trial was carried out at the National Institute of Agricultural Research of Tunisia
(INRAT) from September to December 2015. All procedures employed in this study (transport
and slaughtering) meet ethical guidelines and adhere to Tunisian legal require ments (The
Livestock Law No. 2005-95 of 18 October 2005, Chapter II; Section 1 and Section 2 relative to
the slaughter of animals).
2.1. Animals and diets
Twenty one fat-tailed Barbarine male lambs10 months’ old (body weight (BW): 23.7 +
4.4 kg) were used in the experiment. Lambs were treated against internal and external parasites
and then housed in individual pens. Then, lambs were randomly allocated on the basis of BW
to one of three basal diets. Treatments were the control group(C) receiving 600g of oat
hay/animal/day and two RR groups where RR pellets were totally substituted to oat hay. The
group RR60 was fed 600 g/day of pellets containing 60% of RR, 32 % of wheat bran and 8 %
of soybean meal, and the group RR87 received600 g/day of pellets containing 87% of RR and
13 % of wheat bran. Lambs of three groups received each 600 g/day of concentrate. The DM
chemical composition of RR was 7.5% of protein, 0.54% of fat and 53.8% of polyphenol. The
ACCEPTED MANUSCRIPT

ACC
EPTE
D M
ANU
SCR
IPT
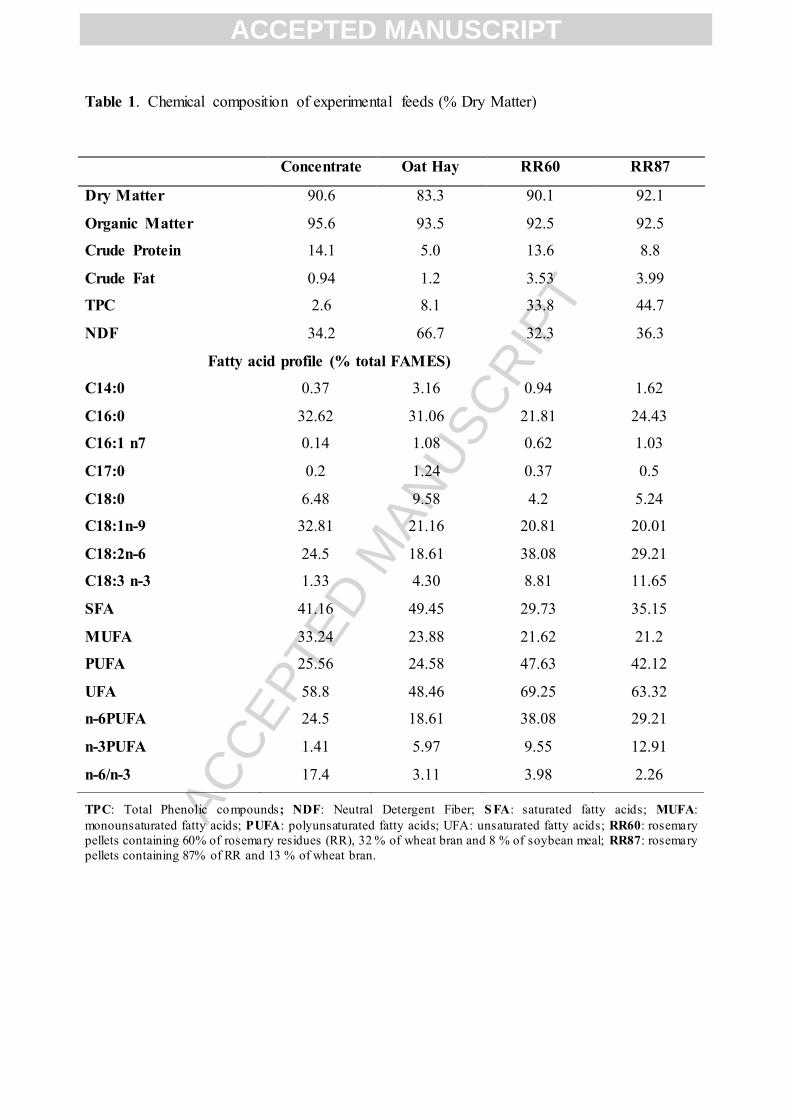
chemical composition and the FA profile of experimental diets are shown in the Table 1.The
first 2 weeks were considered the pre-experimental period where the RR progressively replaced
the hay. The feeding trial lasted 77 days in which experimental diets were offered twice a day
at 9h and 14 h. All lambs had free access to water. Animals were weighed weekly before the
distribution of the feeds.
2.2. Slaughter procedures and meat sampling
At the end of the feeding trial, all lambs were slaughtered in the abattoir of the INRAT.
The day before slaughtering, lambs were fasted for 12 hours with only free access to water.
Animals were weighed before slaughter. At slaughter, lambs were 13 months’ old and weighed
32.8, 36.2 and 35.9 kg for C, RR60 and RR87, respectively (P=0.39). All carcasses were
chilled at 4°C for24 hours. Then, Longissimus thoracis and lumborum (LTL) muscle of each
carcass were removed, and sampled. The LTL muscle from the 4th to the 6th lumbar vertebrae
was sliced and packed to determinate α-tocopherol and intramuscular fat contents. From 6th to
13th thoracic vertebrae was sliced into four 2.5-cm samples, and randomly assigned to 4 times
of display (0, 3, 6 or 9 d), placed in trays and wrapped with oxygen-permeable PVC film, and
kept in darkness at 4 ºC until instrumental color measurement. The 0 d samples were bloomed
for 1 h before being measured. Immediately after the color and pH measurements, the samples
were vacuum-packed and frozen (-20ºC) until lipid oxidation analysis.
2.3. Meat pH and chemical composition
The pH was measured at day 0, 3, 6 and 9 with a penetrating electrode connected to a
portable pH-meter after calibration with two buffers (7.00 and 4.01) to obtain the pH kinetic.
Another LTL sample were lyophilized to obtain dry matter (DM), grounded (1 mm screen) and
ACCEPTED MANUSCRIPT

ACC
EPTE
D M
ANU
SCR
IPT
conserved for chemical composition analyses. All results are expressed as DM basis. Ash was
determined by combustion at 600°C for 8hours. Nitrogen (N) was determined by the DUMAS
procedure of direct combustion (AOAC, 1999) and then the proteins were calculated as N x
6.25. Meat intramuscular fat was extracted with petroleum ether and analyzed according to the
method reported in AOCS (2004) Official Method Am 5-04.
2.4. Meat color and myoglobin measurements
Meat instrumental color was measured in the samples randomly taken at day 0, 3, 6 and 9
with a Minolta CM-2006d spectrophotometer (Konica Minolta Holding, Inc, Osaka, Japan).
The lightness (L*), redness (a*) and yellowness (b*) were directly measured (CIE, 1986), while
Hue angle (H*) and Chroma (C*) were calculated as H*= tan-1(b*/a*) x57.29, expressed in
degrees, and C*= (a*2+b*2)2.Metmyoglobin, oxymyoglobin and deoxymyoglobin relative
contents were calculated according to the method proposed by Krzywicki (1979).
2.5. Lipid oxidation (TBARS) analysis
After thaw meat samples of 10 g were mixed with 20 ml of 10% trichloroacetic acid
using a Micra D8 homogenizer (Labolan, Spain). The samples were centrifuged at 1500 g for
30 min at 4° C; the supernatants were filtered through a paper (Filterlab, Barcelona, Spain).
Two milliliters of the filtrate was vortexed with 2 ml of thiobarbituric acid (20 mM); the tubes
were homogenized and incubated at 97 °C for 20 min in water. The absorbance at 532 nm was
measured with a Helios Beta spectrophotometer (Thermo Electron Corporation, Spain). A
standard calibration curve was created with increasing concentrations (from0 to 100 μl) of
1,1,3,3, tetra methoxypropane (99%), the precursor of malondialehyde (MDA), 5 ml of
thiobarbituric acid and 5 ml of water. The final conversion of 1,1,3,3, tetra methoxypropane to
ACCEPTED MANUSCRIPT

ACC
EPTE
D M
ANU
SCR
IPT
MDA was accomplished by multiplying the number of μM of 1,1,3,3, tetra methoxypropane
equivalent per gram of sample by the molecular weight of MDA. TBARS values are expressed
as milligrams of MDA per kilogram of muscle.
2.6. Vitamin E analysis
Vitamin E analysis was performed according to the method described by Chauveau-
Duriot, Doreau, Nozière, & Graulet. (2010). The determination of tocopherols was performed
by the methods in 12822 (2014) in Foodstuffs for the determination of vitamin E by high
performance liquid chromatography. Briefly, 1 g of lyophilized meat was put in glass tube of
25 ml. Then, 15 ml of KOH 11% (Ethanol: H2O 50:50 v/v) and 0.2 g of ascorbic acid
(antioxidant) were added. The tubes were closed by parafilm, then saponified overnight in
water bath at 25°C protected from light. 5 ml of hexane-ethyl acetate (9:1 v/v) and 25 µg/ml of
BHT (antioxidant) were added. The mixture was shaken with a vortex for 30 seconds then with
the orbital shaker (Heidolph MultiReax). The upper layer was taken after 10 min and was
transferred into glass tube of 10 ml. The mixture was evaporated with a rotary evaporator under
vacuum (Christ RVC2-25) for 40 min at 40°C,then re-suspend in 1 ml of mobile phase (ACN:
CH3OH:CH2Cl2 75:15:10 v/v/v). Finally, the mixture was shaken with vortex (30 seconds) and
with orbital shaker and was filtered with a filter PTFE of 0.22µm in vial of 2 ml of
chromatography. An UPLC Acquity UPLC Class equipped with detector of absorbance (PDA
eλ Detector) and fluorescence (Waters 2475 Multi λ Fluorescence Detector) was used. A
column Acquity UPLC HSS T3 column 1.8 µm, 2.1 mm x 150 mm was used. Tocopherols
were detected at 295 nm and cholesterol at 220 nm.
ACCEPTED MANUSCRIPT

ACC
EPTE
D M
ANU
SCR
IPT
2.7. Fatty acid profile
The fatty acids from the intramuscular fat were extracted according to the method
described by Lee, Tweed, Kim, & Scollan (2012). Muscle samples (0.4-0.8 g) lyophilized and
minced were mixed with 1 ml of the internal standard (C23:0) and 2 ml of heptanes. Then, 4 ml
of NaOH/CH3OH 0.5M was added. The mixture was homogenized with vortex and heated for
20 min at 50°C, followed by cooling for 6-7 min. Then 4 ml of acetyl chloride / CH3OH
(1/10v/v) was added. The mixture was shacked and reheated for 60 min at 50°C. After cooling
at ambient temperature, 2 ml of water milli-Q was added. Then the mixture was shacked,
homogenized and centrifuged for 5 min, 3500 rpm at 10°C. The upper layer (heptanes) was
taken and transferred to tube of 5 ml and then the dehydration was performed with anhydrous
Na2SO4. The mixture was shaken with vortex for 30 seconds and then centrifuged for 5 min,
1000 rpm at 10°C. 1 ml of the supernatant was carefully transferred into a screw cap glass vial
for gas chromatography with precaution for not taking part of the Na2SO4.Fatty acid samples
were analyzed with a Gas Chromatography Bruker 436 Scion software Empower (GC). A 100
m x 0.25 mm D.I x 0.20 µm film thickness, capillary column (BR-2560 Bruker) was used for
the separation of fatty acids. The temperature was 70°C for 1 min then 5°C /min for 2 min to
225°C maintained for 17 min with a total time of 80 min. The injector and detector
temperatures were maintained at 260°C and 250°C, respectively. The fatty acids identification
wasbased on retention times as compared with those of the standard FAMEs mixture of the two
commercial fatty acids: GLC-463 and GLC-538.The desirable fatty acids were calculated
according to Huerta-Leidenz, Cross, Lunt, Pelton, Savell, & Smith (1991) as DFA=
MUFA+PUFA+C18:0.The saturation index (SI) was calculated according to Ulbricht &
Southgate (1991) as SI= (C14:0+C16:0+C18:0) /∑ MUFA+ PUFA.
ACCEPTED MANUSCRIPT

ACC
EPTE
D M
ANU
SCR
IPT
2.8. Statistical Analysis
A one way ANOVA was used to test the effect of dietary treatments on meat chemical
composition, vitamin E content and fatty acid profile using GLM (General Linear Model
procedure of S.A.S. Institute, 2004). The differences between groups were compared by the
Duncan‘s Multiple Range Test (DMRT).Data of meat pH, color, lipid oxidation and myoglobin
oxidation during 9 days of storage were analyzed using the MIXED procedure for repeated
measures based on Kenward-Roger’s adjusted degrees of freedom solution. The analyses were
performed with diet (D) as between-subject fixed effect, storage time (T) as a within-subject
effect and animal as random effect. In all analyses, the Akaike Information Criterion (AIC)
closest to zero was used to choose the matrix of the error structure. The final selected matrix
was the heterogeneous first-order autoregressive. Least square means were estimated and pair-
wise comparisons of the means were obtained with the probability of difference (PDIFF) option
of the LSMEANS procedure24. For all of the tests the level of significance was 0.05.
3. Results and discussion
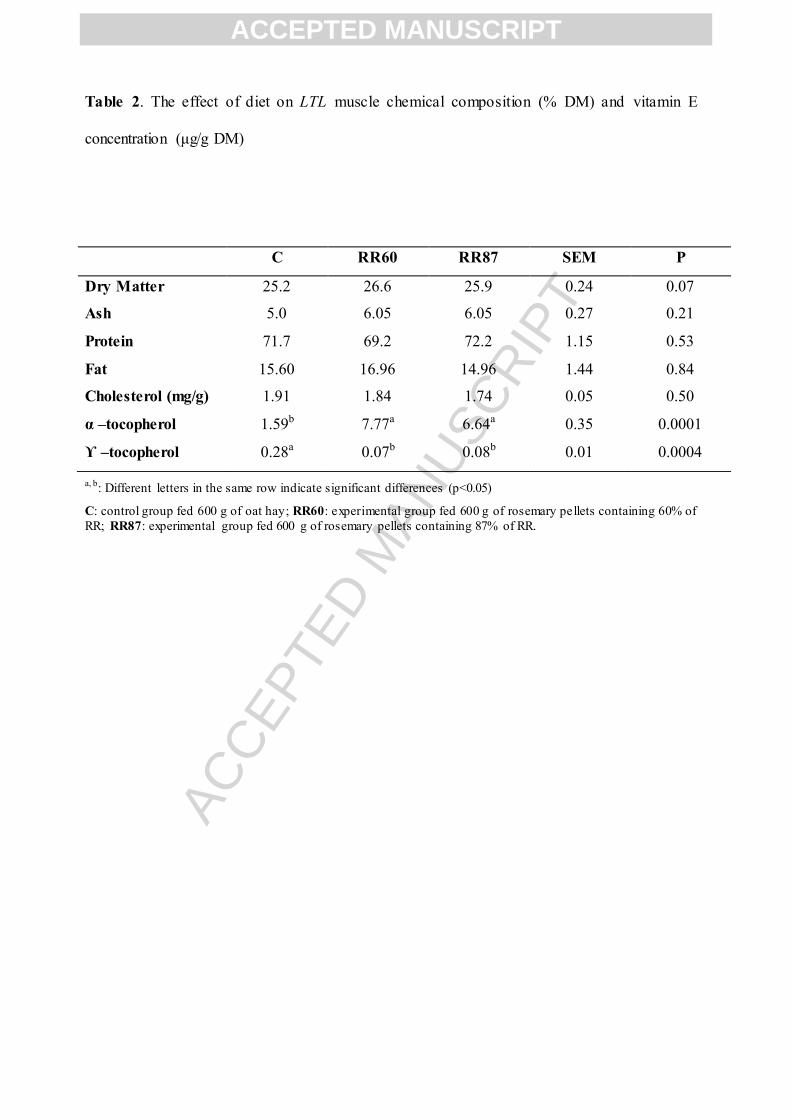
3.1. Meat chemical composition
The meat chemical composition was not affected by the diet. (Table 2). The ash, protein
and fat contents were similar among groups. The similarity in meat chemical components could
result from the similar feeding value and comparable energy levels among the diets (Atti &
Mahouachi, 2009; Smeti et al., 2013).The mean intramuscular fat content (15.8 %of DM) in the
present study is lower than some results reported for the same breed (Atti & Mahouachi, 2009;
Hajji et al., 2016), while the meat protein proportion of all groups was comparable to results
found by Hajji et al. (2016) for Barbarine lambs.
ACCEPTED MANUSCRIPT

ACC
EPTE
D M
ANU
SCR
IPT
3.2. Muscle α-tocopherol
The meat α- tocopherol concentration was significantly (P<0.001) affected by the RR
intake (Table 2). It was 4 times higher forRR87 and RR60 than C group, while the last had the
highest γ-tocopherol content (P<0.05). The α-tocopherol is the principal component of the
vitamin E, despite the presence of other tocopherols in vitamin E activity (Stinnett, 1983). The
great α-tocopherol content in meat due to the rosemary was previously reported in broilers meat
when supplemented with rosemary leaves given its richness in tocopherols (Loetscher, Kreuzer,
& Messikommer, 2013). This high vitamin E concentration in meat can be the result of the high
amount of polyphenol compounds present in RR (44.7 and 33.8% for RR87 and RR60,
respectively) that contribute to α- tocopherol deposition into the muscle. Meat from grazing
animals is rich in antioxidants in form of D- α- tocopherol and flavonoides (Hopkins, Lamb,
Kerr, Van de Ven, & Ponnampalam, 2013). However, the vitamin E concentration in the
current study for both groups fed rosemary by-products (> 6 µg/g) was greater than values (3-4
µg/g) obtained under grazing conditions (Ponnampalam, Burnett, Norng, Warmer, & Jacobs,
2012; Hopkins et al.,2013) despite the richness of the pasture on natural antioxidants such as
vitamin A and E, flavonoides and carotenoids.
3.3. Meat pH and color
No significant variation in pH was noted among diets (P>0.05) or throughout the storage
time (P>0.05). However, the interaction was significant (P= 0.02; Table 3). The pH values were
within the normal range (5.5 to 5.8) for lamb meat (Majdoub-Mathlouthi, Saïd, Say, & Kraiem,
2013). The normal values of meat pH indicate an effective acidification of meat for all groups.
During the 9 days of measurement, the pH was similar to that presented by Nieto, Diaz, Banon,
& Garrido (2010), when thyme leaves were included in the ewes’ diet. During the display
ACCEPTED MANUSCRIPT

ACC
EPTE
D M
ANU
SCR
IPT
period, there is no reduction in pH in any treatment and the absence of variation was due to the
depletion of glycogen reserves in the muscle before the storage period (Lawrie & Ledward,
2006).
The diet affected meat yellowness (b*), chroma (C*) and hue angle (H*) (P<0.01), but
did not affect lightness (L*) and redness (a*) (P>0.05) (Table 3). The lack of diet effect on pH
could explain the unaffected lightness. In fact, meat from all treatments presented lightness
values that are in the range of average acceptability but beyond of 44 which is considered the
value of meat acceptability by 95% of consumers (Khliji, Van de Ven, Lamb, Lanza, &
Hopkins, 2010).
RR-based diets maintained the same redness during the storage. This can be a result of
the increasing antioxidant status (vitamin E) in muscle tissues that reduces myoglobin oxidation
post-slaughter (Higgins, Kerry, Buckley, & Morrisey, 1998). The present result confirmed the
results of Ponnampalam et al. (2012) who found that redness is jointly related to the level of
antioxidant, such as vitamin E, in the muscle tissues. Indeed, it has been proposed that this
could lead to reduce oxidation of pigments and thus improve the colour stability of meat during
storage irrespective to the higher level of PUFA in muscle (Ponnampalam et al., 2012).
Moreover, it was reported the beneficial effects of the use of some natural antioxidant on
retarding meat color loss by extending the red color (a*) and delaying metmyoglobin formation
(Camo, Beltran, & Roncales, 2008).
The higher yellowness (b*) value was recorded for both groups receiving RR than C.
This supremacy could be related to the richness of rosemary by-product in carotenes
responsible of yellowness index. In the current study, Control had significantly lower b*, C*
and H* than RR treatments. So, these high values in meat of experimental groups indicated the
high pigment quantity. Compared to meat of C group, RR diets showed protection of
myoglobin against oxidation which delayed meat discoloration (Camo et al., 2008). The values
ACCEPTED MANUSCRIPT

ACC
EPTE
D M
ANU
SCR
IPT
of C* recorded during storage confirmed previous results which showed that C* decreased as
storage progressed resulting in pigment oxidation for lamb’s meat as found Nieto et al. (2010)
when thyme leaves were incorporated in pregnant ewe’s diet (Nieto et al., 2010).
3.4. Myoglobin oxidation
The results of meat myoglobin (metmyoglobin (MMb), deoxymyoglobin (DMb) and
oxymyoglobin (OMb)) oxidation are shown in Table 3. The OMb was affected by diet while
the DMb, MMb percentages were not affected. The storage time had significantly affected the
myoglobin evolution and the interaction effect (D x T) was significant except for DMB. It was
shown that the oxidation of myoglobin to metmyoglobin can be delayed by the dietary
supplementation of antioxidant compounds or by pasture feeding (Luciano, Monahan, Vasta,
Pennisi, Bella & Priolo, 2009).
In the current study, the similarity in the MMb value can be due to the inclusion of RR
in diets, whereas, across 9 days of storage, the MMb increased. The MMb followed the typical
evolution through time. It increased in the first period of time to decrease at the end of the
storage time, as previously reported by Ripoll, Gonzalez-Calvo, Molino, Calvo, &Joy
(2013).The oxidation of myoglobin during time is generally related to a decrease of the redness
and saturation (C*) and an increase of the hue angle (Khliji et al., 2010).
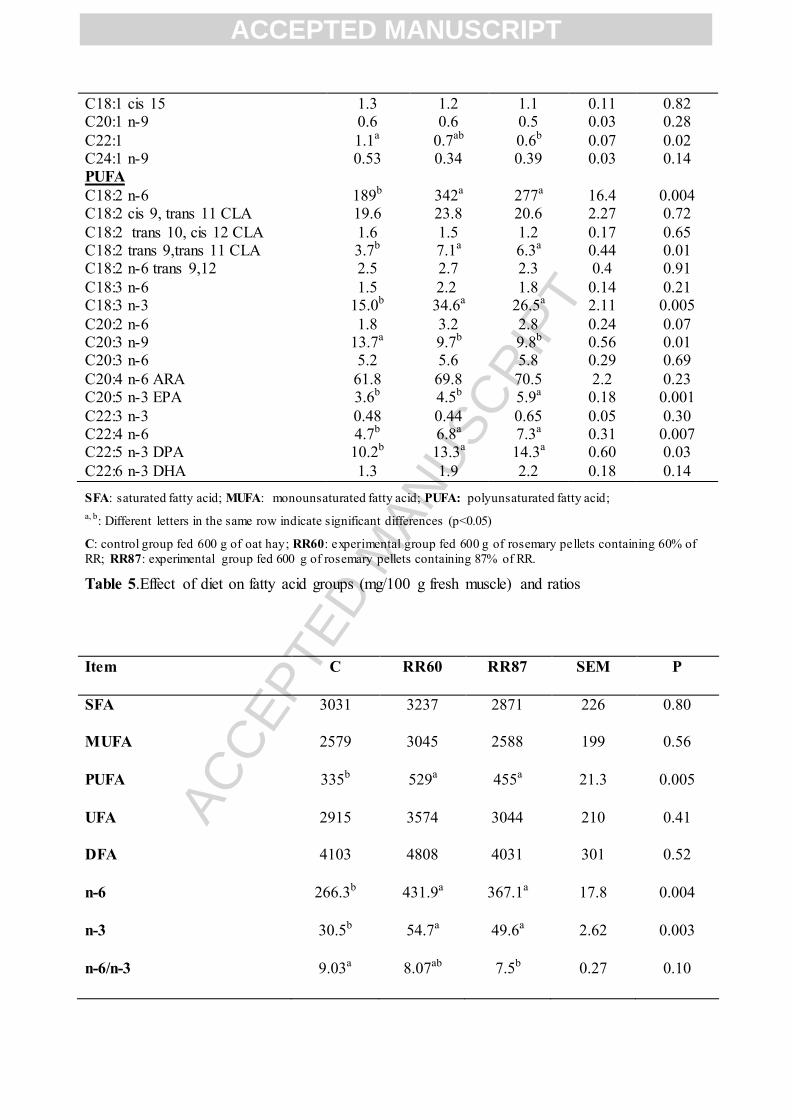
3.5. Meat fatty acid profile
The individual fatty acids and groups are shown in Tables 4 and 5, respectively. In
concordance with the literature, the palmitic (C16:0), stearic (C18:0) and oleic (C18:1) acids
comprised the largest proportions of FA. The oleic acid was the most abundant for the
unsaturated FA and for the total detected fatty acids. This prevalence is in line with the
commonly accepted values for intramuscular FA of thin- tailed (Joy et al., 2012; Hopkins et al.,
ACCEPTED MANUSCRIPT

ACC
EPTE
D M
ANU
SCR
IPT
2014) and fat-tailed sheep (Atti & Mahouachi, 2009; Yousefi, Kohram, Shahneh, Nik-khah, &
Campbell, 2012; Majdoub-Mathmouthi et al., 2013).
In the present study, the most abundant SFA (Table 4) were Palmitic (C16:0) and stearic
(C18:0) in agreement with results of Atti et al. (2005) and Hajji et al. (2016). In fact, All the
SFA were unaffected by the diet (P>0.05) except to C24:0 which was higher for C group. The
Oleic acid (C18:1n-9c) was the major FA of MUFA group (Table4) as previously reported for
lamb’s meat (Hopkins et al., 2014; Mekki et al., 2016). The meat MUFA and C18:1n-9c were
similar for all diets; this is the consequence of similar diet intake of MUFA and particularly
C18:1n-9.The linoleic acid (C18:2n-6) was the most abundant PUFA (Table 4) for all
treatments, but it was significantly higher for both groups fed RR than Control (P<0.05). These
values are higher than those found by Ponnampalam, Mann & Sinclair (2006) in Australian
beef fed long term grain ration. The C20:4n-6ARA was identical among treatments, however,
the C18:3n-3 was increased with RR-based diets (Table 4). Indeed, the linoleic and linolenic
acids were higher for both RR treatments (P<0.05) since the feedstuff presented higher contents
of these FA.
The nutritional quality of meat and fat can be evaluated in terms of SFA, MUFA,
PUFA, n-6, n-3 PUFA and their ratio (n-6/n-3) as well as the saturation index (Peiretti, Mussa,
Prola, & Meineri, 2007). The SFA, MUFA and UFA were comparable between groups (Table
5). However, total PUFA increased with RR intake compared to control group. This result
confirmed previous studies which suggest that secondary metabolites’ plants have the potential
to increase the unsaturated FA content in animal products (Lourenço, Cardozo, Calsamiglia, &
Fievez, 2008). Indeed, the high PUFA, n-6 and n-3 PUFA levels in meat resulted from feeding
animals with rosemary by-products explaining the polyphenol compound in leaves which
maintain the unsaturated FA level in cell membranes (Nieto & Ros 2012). In the other hand,
this higher PUFA deposited in meat from RR groups can be also attributed to the higher intake
ACCEPTED MANUSCRIPT

ACC
EPTE
D M
ANU
SCR
IPT
of these FA (Table 1) given that the deposition of some fatty acids in the muscle depends not
only on intake of the different FA but also on the extent of the ruminal biohyrogenation of the
ingested PUFA. In fact, a possible effect of RR on the ruminal biohyrogenation of PUFA could
be justified since rosemary contained phenolic compounds, including condensed tannins as
found Gravador et al. (2015) when lambs were fed carob pulp partially substituted to barley in
concentrate.
The PUFA: SFA ratio (Table 5) have a tendency to be higher (0.16) than the control
(0.11). However, both values remained lower than the recommended value (0.45) for red meat
in human nutrition (Department of health, 1994). In addition, these weaker values corroborate
the values varying between 0.11 and 0.15 recorded for beef and lamb in the literature (Wood &
Enser, 1997; Mandell, Gullett, Buchanan-Smith, & Campbell, 1997; Atti et al. 2005). The RR
diets consumption did not affect the DHA (C22:6 n-3) concentration but increased the EPA
(C20:5 n-3) level and the total n-3 PUFA. These dietary treatments significantly decreased the
PUFA n-6/n-3 ratio (8.1 and 7.5 vs. 9.1 for C). These results lead to an enhancement in the
nutritional value of meat. The concentration of EPA+ DHA obtained in the current study(5 to
8mg/100 g meat) was lower than those observed with other types of feeds in previous studies.
In fact, it was reported that the EPA+DHA concentration was around 10 mg/100g when
concentrate with dry pasture constituted a large part in animal diets and much higher (above 30
mg/100 g muscle) when animals grazed green pasture (Ponnampalam et al., 2014a).The highest
values (superior to 100 mg/100 g meat) were observed for lambs fed algae (Hopkins et al.,
2014).
The CLA isomers (Table4) particularly 18:2cis-9, trans-11 and 18:2 trans-10, cis-12
were similar among groups, but higher CLA isomer 18:2trans-9, trans-11 was recorded for RR
based diets. The meat of ruminant is among the richest natural source of CLA, in particular the
cis-9, trans11 isomer which arises from microbial biohyrogenation of dietary linoleic acid in
ACCEPTED MANUSCRIPT

ACC
EPTE
D M
ANU
SCR
IPT
the rumen (Ha, Storkson, & Pariza, 1990). The inclusion of rosemary residues did not alter the
total CLA concentration (P>0.05). However, it resulted in a decrease (P<0.05) in the saturation
index (SI) (0.83 for RR vs. 0.95 for C). Similar results were found when the thyme by-products
were included in pregnant and lactating ewes’ diet (Nieto et al., 2010). This index represented
an approach to evaluate the nutritional quality of meat and fat (Peiretti et al., 2007). The fat
with high SI value is presumed to be disadvantageous to the human health (Ulbricht &
Southgate, 1991). In the current study, the proportion of DFA that includes all UFA
(MUFA+PUFA) and stearic acid (C18:0) was unaffected by the experimental diets.
3.6. Lipid oxidation (TBARS)
The lipid oxidation (TBARS) evolution is reported in Figure 1. It was strongly affected
(P=0.001) by the diet, the time of display (P= 0.001) and their interaction (P=0.001).From the
3rd day of display, the TBARS value increased regardless the diet. Both groups receiving RR
showed similar TBARS values that did not exceed 1.5 mg of MDA/ kg meat across 9 days,
while the higher value (3.13 mg of MDA/ kg meat) was recorded for C group. The values from
RR diets are slightly superior to the acceptability threshold of 1mg MDA/kg of meat (Ripoll et
al., 2011), however they were below the threshold of 2mg of MDA/kg for the sensory detection
of rancid or abnormal flavors enough to make meat unacceptable to consumers (Campo, Nute,
Hughes, Enser, Wood, & Richardson, 2006). It has been reported a positive relationship
between PUFA (n-6, n-3 or both) and lipid oxidation in muscle when vitamin E is below 2.95
mg/kg muscle that lead to a negative aroma. However, when vitamin E was above 2.95 mg/kg
muscle, the increased PUFA, n-3 and n-6 fatty acids did not influence the lipid oxidation
(Ponnampalam, Norng, Brunett, Dunshea, Jacobs, & Hopkins, 2014b). These findings
supported the results of the current study, where the increased meat PUFA, n-3 and n-6 fatty
acids for RR diets did not influence the lipid oxidation given the high vitamin E content of this
ACCEPTED MANUSCRIPT

ACC
EPTE
D M
ANU
SCR
IPT
meat. Rather oxidative damages in meat have been observed for C group (3.13 mg of MDA/ kg
meat). As well, this result can be attributed to the richness of rosemary in potential antioxidant
considering the higher phenolic compounds (Gravador et al., 2015). Their transformation in
high vitamin E concentration confers to RR meat this superior resistance to oxidative
deterioration and prevents the essential PUFA from oxidation (Ponnampalam et al., 2012 and
2014b). Increasing antioxidant status, such as vitamin E in muscle tissue of meat has been
suggested as an approach to reduce the lipid and myoglobin oxidation of meat post slaughter
(Arnold, Arp, Scheller, Williams, & Schaefer, 1993). The critical α- tocopherol value of 3.0
µg/g was suggested as target (Faustman, Cassens, Schaeffer, Buege, & Scheller, 1989) to have
a significant impact on the reduction of pigment and lipid oxidation. However, Ripoll et al.
(2013) found that values of 0.74µg/g delayed the lipid oxidation of meat, and values of
1.47µg/g delayed both lipid oxidation and metmyoglobin formation. Thereafter, the insufficient
concentration of vitamin E in control group (1.59 mg/kg DM) to prevent fatty acid oxidation
explained the elevated TBARS value as found by Ponnampalam et al. (2014b).Gonzalez-Calvo,
Ripoll, Molino, Calvo, & Joy (2015) conclude that a muscle ??-tocopherol concentration
between 0.61 and 0.90mg/ kg fresh meat is guaranteed to conserve lamb meat at the optimal
conditions for 7 days of oxygen exposure. Then, the diet can contribute to the variation of
components in muscle tissue (Ponnampalam et al., 2014b). The incorporation of rosemary in
lamb diet resulted in a transfer of antioxidants to cell membranes and tissues; the antioxidant
compounds transferred from diet to meat protect tissues against oxidation more than adding
antioxidant post-mortem (Kerry et al., 1999).The significant correlation between the phenolic
content and the antioxidant properties of some plants as rosemary in vitro were reported
(Ponnampalam et al., 2014b).Besides, the antioxidant effect through feeding with rosemary by-
products or sage was investigated and the effect on the delay of lipid oxidation was shown
(Botsoglou, Govaris, Giannenas, Botsoglou, & Papageorgiou, 2007). So, given the meat
ACCEPTED MANUSCRIPT

ACC
EPTE
D M
ANU
SCR
IPT
vitamin E concentration for RR diets was above 4.15 mg/kg muscle as reported Ponnampalam
et al. (2014b), the oxidation was reduced to 1.51 mg MDA/ kg muscle irrespective of PUFA
concentrations.
Conclusion
This study showed that rosemary residues permit to avoid the lipid oxidation of meat
over storage given the increased vitamin E level in muscle irrespective to the PUFA content in
lamb muscle. The high vitamin E content in muscle prevents the essential PUFA from
oxidation and thus reduces pigment oxidation. Furthermore, rosemary residues maintained the
SFA content in the meat and significantly increased the n-3 and n-6 PUFA in muscle. Then,
rosemary residues can be a feasible strategy to elevate muscle vitamin E concentration which
leads to improve color stability and reduce the level of lipid oxidation in meat stored for long
term storage.
Acknowledgements
The authors are grateful to the staff of Animal Production Laboratory in CITA
(Zaragoza, Spain) for collaboration in this study.We wish to acknowledge also the ESAK staff
for their collaboration and Zina Taghouti, technician in Animal Production laboratory in
INRAT for her help in meat analyses.
References
AOAC (1999). Association of Official Analytical Chemists. Official Methods of Analysis,
15thed.AOAC, Arlington, VA, USA.
ACCEPTED MANUSCRIPT

ACC
EPTE
D M
ANU
SCR
IPT
AOCS (2004). American oil chemists’ society. Official Methods and recommended Practices,
AOCS.
APIA (2003). Aperçu sur le secteur des Plantes Aromatiques et Médicinales “P.A.M”. Agro-
services, 122 pp.
Arnold, R.N., Arp, S.C., Scheller, K.K., Williams, S.N., & Schaefer, D. M. (1993). Tissue
equilibration and subcellular distribution of Vitamin E relative to myoglobin and lipid
oxidation in displayed beef. Journal of Animal Science, 71, 105-118.
Atti, N., & Mahouachi, M. (2009).Effects of feeding system and nitrogen source on lamb
growth, meat characteristics and fatty acid composition. Meat Science, 81, 344-348.
Atti, N., Rouissi, H., & Mahouachi, M. (2005). Effects of restricted feeding and refeeding of
Barbarine lambs: Carcass composition and fatty acid composition. Animal Science, 81,
313-318.
Botsoglou, N.A., Govaris, A., Giannenas, I., Botsoglou, E., & Papageorgiou, G.(2007). The
incorporation of dehydrated rosemary leaves in the rations of turkeys and their impact on
the oxidative stability of the produced raw and cooked meat. International Journal of
Food Science and Nutrition.58, 312-320.
Buckley, D.J., Morrissey, P.A., & Gray, J. I. (1995). Influence of dietary vitamin E on the
oxidative stability and quality of pig meat. Journal of Animal Science, 73, 3122-3131.
Camo, J., Beltran, J.A., &Roncales, P. (2008). Extension of the display life of lamb with an
antioxidant active packaging. Meat Science.80, 1086-1091.
Campo, M.M., Nute, G.R., Hughes, S.I., Enser, M., Wood, J.D., & Richardson, R.I. (2006).
Flavour perception of oxidation in beef. Meat Science, 72, 303-311.
Chauveau-Duriot, B., Doreau, M., Nozière, P., &Graulet, B. (2010). Simultaneous
quantification of carotenoids, retinol and tocopherols in forages, bovine plasma and milk:
ACCEPTED MANUSCRIPT
ACC
EPTE
D M
ANU
SCR
IPT
validation of a novel UPLC method. Analytical and Bioanalytical Chemistry, 397, 777-
790.
Department of Health (1994). Nutritional aspects of cardiovascular disease, Report on Health
and social Subject N° 46. London, United Kingdom: Her Majesty’s Stationary Office.
Faustman, C., Cassens, R.G., Schaeffer, D.M., Buege, D.R., &Scheller, K.K. (1989). Vitamin E
supplementation of Holstein steer diets improves sirloin steak color. Journal of Food
Science, 54, 485-486.
Gonzalez-Calvo, L., Ripoll, G., Molino, F., Calvo, J. H., &Joy, M. (2015). The relationship
between muscle alpha-tocopherol concentration and meat oxidation in light lambs fed
vitamin E supplements prior to slaughter. Journal of the Science of Food and Agriculture,
95,103-110.
Gravador, R.S., Luciano, G., Jongberg, S., Bognanno, M., Scerra, M., Anderson, M.L., Lund,
M.N., &Priolo, A. (2015).Fatty acids and oxidative stability of meat from lambs fed
carob-containing diets. Food chemistry, 182, 27-34.
Ha, Y.L., Storkson, J., &Pariza, M.W. (1990). Inhibition of benzo (a) pyrene- induced mouse
forestomach neoplasia by conjugated dienoic derivatives of linoleic acid. Cancer
Research, 50, 1097-1101.
Hajji, H., Joy, M., Ripoll, G., Smeti, S., Mekki, I., MoliniGahete, F., Mahouachi, M., & Atti, N.
(2016).Meat physicochemical properties, fatty acid profile, lipid oxidation and sensory
characteristics from three North African lamb breeds as influenced by concentrate or
pasture finishing diets. Journal of Food Composition and Analysis, 48, 102-110.
Higgins, F.M., Kerry, J.P., Buckley, D. J., &Morrisey, P.A. (1998).Effect of dietary alpha-
tocopherylacetate supplementation on a-tocopherol distribution in raw turkey muscles
and its effect on the storage stability of cooked turkey meat. Meat science, 37, 373-383.
ACCEPTED MANUSCRIPT

ACC
EPTE
D M
ANU
SCR
IPT
Hopkins, D.L., Clayton, E.H., Lamb, T.A., van de Ven, R.J., Refshauge, G., Kerr, M.J., Bailes
K., Lewandowski P.,& Ponnampalam, E.N. (2014).The impact of supplementing lambs
with algae on growth, meat traits and oxidative status. Meat Science, 98, 135–141.
Hopkins, D.L., Lamb, T.A., Kerr, M.J., van de Ven, R.J.,& Ponnampalam, E.N.
(2013).Examination of the effect of ageing and temperature at rigor on colour stability of
lamb meat. Meat science, 95, 311-316.
Huerta-Leidenz, N.O., Cross, H.R., Lunt, D.K., Pelton, L.S., Savell, J.W., & Smith, S.B.
(1991). Growth, carcass traits and fatty acid profiles of ad ipose tissues from steers fed
whole cotton seed. Journal of Animal Science, 69, 3665-3672.
Joy, M., Ripoll, G., Molino, F., Dervishi, E., & Alvarez-Rodriguez, J. (2012).Influence of the
type of forage supplied to ewes in pre- and post-partum periods on the meat fatty acids of
suckling lambs. Meat Science, 90, 775-782
Kerry, J.P., Buckley, D.J., Morrisey, P.A., O’Sullivan, K., & Lynch, P.B. (1999). Endogenous
and exogenous a-tocopherol supplementation: effects on lipid stability (TBARS) and
warmed-over flavor (WOF) in porcine M. longissimus dorsi roasts held in aerobic and
vacuum packs. Food Research International, 31, 211-216.
Khliji, S., Van de Ven, R., Lamb, T.A., Lanza, M., & Hopkins, D.L. (2010). Relationship
between consumer ranking of lamb colour and objective measures of colour. Meat
Science, 85, 224-229.
Krzywicki, K. (1979). Assessment of relative content of myoglobin, oxymyoglobin and
metmyoglobin at the surface of beef. Meat Science, 3, 1- 9.
Lai, S.M., Gray, J.I., Smith, D.M., Booren, A.M., Crackel, R.L., & Buckley, D.J.
(1991).Effects of oleoresin rosemary, tertiory butyl-hydroquinone and sodium
tripolyphosphate on the development of oxidative rancidity in restricted chicken nuggets.
Journal of Food Science, 56, 616-620.
ACCEPTED MANUSCRIPT
ACC
EPTE
D M
ANU
SCR
IPT
Lawrie, R.A., & Ledward, D.A. (2006). Lawrie’s Meat Science, 7th edition. Wood head
Publishing Limited, Abington Hall, Abingtion, Cambridge CB1 6AH, England, 442 pp.
Lee, M.R., Tweed, J.K., Kim, E.J., & Scollan, N.D. (2012).Beef, chicken and lamb fatty acid
analysis-a simplified direct bimethylation procedure using freeze-dried material. Meat
Science, 92, 863-866.
Loetscher, Y., Kreuzer, M., & Messikommer, R.E. (2013). Oxidative stability of the meat of
broilers supplemented with rosemary leaves, rosehip fruits, chokeberry pomace and entire
nettle and effects on performance and meat quality. Poultry Science, 92, 2938-2948.
Lourenço, M., Cardozo, P.W., Calsamiglia, S., & Fievez, V. (2008). Effects of saponins,
quercetin, eugenol, and cinnamaldehyde on fatty acid biohydrogenation of forage
polyunsaturated fatty acids in dual- flow continuous culture fermenters. Journal of Animal
Science, 86, 3045-3053.
Luciano, G., Monahan, F.J., Vasta, V., Pennisi, P., Bella, M., & Priolo, A. (2009).Lipid and
colour stability of meat from lambs fed fresh herbage or concentrate. Meat Science, 82,
193-199.
Majdoub-Mathlouthi, L., Saïd, B., Say, A., &Kraiem, K. (2013). Effect of concentrate level and
slaughter body weight on growth performances carcass traits and meat quality of
Barbarine lambs fed oat hay based diet. Meat Science, 93, 557–563.
Mandell, I.B., Gullett, E.A., Buchanan-Smith, J.G., & Campbell, C.P. (1997). Effects of diet
and slaughter endpoint on carcass composition and beef quality in Charolais cross steers
fed alfalfa silage and (or) high concentrate diets. Canadian Journal of Animal Science,
77, 403-414.
Mekki, I., Camin, F., Perini, M., Smeti, S., Hajji, H., Mahouachi, M., Piasentier, E., & Atti, N.
(2016).Differentiating the geographical origin of Tunisian indigenous lamb using stable
isotope ratio and fatty acid content.Journal of Food Composition and Analysis, 53, 40-48.
ACCEPTED MANUSCRIPT

ACC
EPTE
D M
ANU
SCR
IPT
Nieto, G., & Ros, G. (2012). Modification of fatty acid composition in meat through diet: effect
on lipid peroxidation and relationship to nutritional quality: Intech 12, 240-258.
Nieto, G., Diaz, P., Banon, S., &Garrido, M.D. (2010). Effect on lamb meat quality of
including thyme (Thymus Zygis ssp. gracilis) leaves in ewes’ diet.Meat Science, 85, 82-
88.
Pariza, M.W., Park, Y., & Cook, M.E. (2001). The biologically active isomers of conjugated
linoleic acid. Progress in Lipid Research, 40, 283-298.
Parodi, P.W. (1999).Conjugated linoleic acid and other anticarcinogenic agents of bovine milk
fat.Journal of Dairy Science, 82, 1339-1349.
Peiretti, P.G., Mussa, P.P., Prola, L., &Meineri, G. (2007). Use of different levels of false flax
(Camelina sativa L.) seed in diets for fattening rabbits.Livestock Science, 107,192-198.
Ponnampalam, E. N., Burnett, V. F., Norng, S., Hopkins, D. L., Plozza T., & Jacobs, J.L.
(2016). Muscle antioxidant (vitamin E) and major fatty acid groups, lipid oxidation and
retail colour of meat from lambs fed a roughage based diet with flaxseed or algae. Meat
Science, 111, 154-160.
Ponnampalam, E.N., Burnett, V.F., Norng, S., Warmer, R. D., & Jacobs, J.L. (2012). Vitamin E
and fatty acid content of lamb meat from perennial or annual pasture systems with
supplements. Animal Production Science, 52, 255-262
Ponnampalam, E.N., Butler, K.L., Pearce, K.M., Mortimer, S.I., Pethick, D.W., Ball, A.J., &
Hopkins, D.L. (2014a). Sources of variation of health claimable long chain omega-3
fattyacids in meat from Australian lamb slaughtered at similar weights. MeatScience,
96, 1095-1103.
Ponnampalam, E.N., Mann, N.J., & Sinclair, A.J. (2006).Effect of feeding system on omega-3
fatty acids, conjugated linoleic acid and trans fatty acids in Australian beef cuts: potential
impact on human health. Asia Pacific Journal of Clinical Nutrition, 15, 21–29.
ACCEPTED MANUSCRIPT

ACC
EPTE
D M
ANU
SCR
IPT
Ponnampalam, E.N., Norng, S., Brunett, V.F., Dunshea, F.R., Jacobs, J.L., & Hopkins, D.L.
(2014b). The synergism of biochemical components controlling lipid oxidation in lamb
muscle. Lipids, 49, 757-766.
Ponnampalam, E. N.,Warner, R. D., Kitessa, S., McDonagh, M. B., Pethick, D.W., Allen, D., &
Hopkins, D. L.(2010). Influence of finishing systems and sampling site on fatty acid
composition and retail shelf-life of lamb. Animal Production Science, 50, 775–781.
Ripoll, G., Gonzalez-Calvo, L., Molino, F., Calvo, J. H., &Joy, M. (2013). Effects of finishing
period length with vitamin E supplementation and alfalfa grazing on carcass color and the
evolution of meat color and the lipid oxidation of light lambs. Meat Science, 93, 906-913.
Ripoll, G., Joy, M., & Muñoz, F. (2011). Use of dietary vitamin E and selenium (Se) to
increase the shelf life of modified atmosphere packaged light lamb meat. Meat Science,
87, 88-93.
Smeti, S., Atti, N., Mahouachi, M., & Muñoz, F. (2013).Use of dietary rosemary (Rosmarinus
officinalis L.) essential oils to increase the shelf life of Barbarine light lamb meat. Small
Ruminant Research, 113, 340-345.
Stinnett, J.D.(1983). Nutrition and the immune response. Boca Raton, FL: CRC Press.
Troy, D.J., & Kerry, J.P. (2010). Consumer perception and the role of science in meat industry.
Meat science, 86, 214-226.
Ulbricht, T.L., &Southgate, D.A.T. (1991). Coronary heart disease: seven dietary factors. The
Lancet, 338, 985-992.
Wood, J.D., & Enser, M. (1997).Factors influencing fatty acids in meat and the role of
antioxidants in improving meat quality. British Journal of Nutrition, 78, 49- 60.
Yousefi, A.R., Kohram, H., Shahneh, A.Z., Nik-khah, A., &Campbell, A.W. (2012).
Comparison of the meat quality and fatty acid composition of traditional fat-tailed (Chall)
and tailed (Zel) Iranian sheep breeds. Meat Science, 92, 417–442.
ACCEPTED MANUSCRIPT

ACC
EPTE
D M
ANU
SCR
IPT
a, b: different letters within a diet differ significantly (P < 0.05). x, y: different letters within a storage time differ significantly (P < 0.05).
Figure 1. Meat lipid oxidation (TBARS)
C: control group fed 600 g of oat hay and 600 g of concentrate; RR60: experimental group fed 600 g of rosemary
pellets containing 60% of RR, 32 % of wheat bran and 8 % of soybean meal; RR87: experimental group fed 600 g
of rosemary pellets containing 87% of RR and 13 % of wheat bran.
ax
ax
by
by
ax ax
ax ax
ax axy ay
ay
0.0
0.5
1.0
1.5
2.0
2.5
3.0
3.5
0 3 6 9
mg
MD
A/k
g m
eat
Days of storage
C RR60 RR87
ACCEPTED MANUSCRIPT
ACC
EPTE
D M
ANU
SCR
IPT
Table 1. Chemical composition of experimental feeds (% Dry Matter)
TPC: Total Phenolic compounds; NDF: Neutral Detergent Fiber; S FA: saturated fatty acids; MUFA: monounsaturated fatty acids; PUFA: polyunsaturated fatty acids; UFA: unsaturated fatty acids; RR60: rosemary pellets containing 60% of rosemary residues (RR), 32 % of wheat bran and 8 % of soybean meal; RR87: rosemary pellets containing 87% of RR and 13 % of wheat bran.
Concentrate Oat Hay RR60 RR87
Dry Matter 90.6 83.3 90.1 92.1
Organic Matter 95.6 93.5 92.5 92.5
Crude Protein 14.1 5.0 13.6 8.8
Crude Fat 0.94 1.2 3.53 3.99
TPC 2.6 8.1 33.8 44.7
NDF 34.2 66.7 32.3 36.3
Fatty acid profile (% total FAMES)
C14:0 0.37 3.16 0.94 1.62
C16:0 32.62 31.06 21.81 24.43
C16:1 n7 0.14 1.08 0.62 1.03
C17:0 0.2 1.24 0.37 0.5
C18:0 6.48 9.58 4.2 5.24
C18:1n-9 32.81 21.16 20.81 20.01
C18:2n-6 24.5 18.61 38.08 29.21
C18:3 n-3 1.33 4.30 8.81 11.65
SFA 41.16 49.45 29.73 35.15
MUFA 33.24 23.88 21.62 21.2
PUFA 25.56 24.58 47.63 42.12
UFA 58.8 48.46 69.25 63.32
n-6PUFA 24.5 18.61 38.08 29.21
n-3PUFA 1.41 5.97 9.55 12.91
n-6/n-3 17.4 3.11 3.98 2.26
ACCEPTED MANUSCRIPT
ACC
EPTE
D M
ANU
SCR
IPT
Table 2. The effect of diet on LTL muscle chemical composition (% DM) and vitamin E
concentration (μg/g DM)
C RR60 RR87 SEM P
Dry Matter 25.2 26.6 25.9 0.24 0.07
Ash 5.0 6.05 6.05 0.27 0.21
Protein 71.7 69.2 72.2 1.15 0.53
Fat 15.60 16.96 14.96 1.44 0.84
Cholesterol (mg/g) 1.91 1.84 1.74 0.05 0.50
α –tocopherol 1.59b 7.77a 6.64a 0.35 0.0001
ϒ –tocopherol 0.28a 0.07b 0.08b 0.01 0.0004
a, b: Different letters in the same row indicate significant differences (p<0.05)
C: control group fed 600 g of oat hay; RR60: experimental group fed 600 g of rosemary pellets containing 60% of RR; RR87: experimental group fed 600 g of rosemary pellets containing 87% of RR.
ACCEPTED MANUSCRIPT

ACC
EPTE
D M
ANU
SCR
IPT
Table 3. Effect of diet (D) and storage time (T) on pH, color parameters and haeminic
pigments
Diet (D) Storage time (T) P
C RR60 RR87
0 3 6 9 SE
M
D T D x T
pH 5.40 5.55 5.41 5.45 5.45 5.50 5.50 0.01 0.12 0.08 0.02
2
L* 36.47 34.13 33.51 32.43y 36.8
9x
34.77x
y
34.73xy
0.98 0.10 0.00
1
0.23
6
a* 8.63 8.40 9.05 9.25 8.41 8.46 8.67 0.37 0.47 0.21 0.02
4
b* 11.86b
14.32a 15.38a
17.12x 12.9
0y
12.62y 12.77y 0.55 0.00
1
0.00
1
0.85
C* 14.85b
16.73a 17.94a
19.61x 15.6
2y
15.28y 15.51y 0.49 0.00
1
0.00
1
0.90
H* 52.24b
58.62a 59.37a
61.40x 54.8
5y
55.35y 55.37y 1.46 0.00
5
0.01
3
0.42
8
MM
b
11.45 10.53 11.94 3.78z 13.2
8xy
16.98x 11.18y 1.56 0.81 0.00
1
0.00
1
DMb 76.66 69.05 66.62 60.01y 71.3
1x
73.71x 78.07x 2.90 0.06 0.00
1
0.42
OM
b
11.89b
20.41a
b
21.43a
36.19x 15.4
0y
9.30y 10.75y 2.10 0.01 0.00
1
0.00
1
MMb: Metmyoglobin; DMb: Deoxymyoglobin; OMb: Oxymyoglobin
(a, b) different superscripts means differences between Diet
(x, y, z) different superscripts means differences between days of storage;
C: control group fed 600 g of oat hay; RR60: experimental group fed 600 g of rosemary pellets containing 60% of RR; RR87: experimental group fed 600 g of rosemary pellets containing 87% of RR.
ACCEPTED MANUSCRIPT

ACC
EPTE
D M
ANU
SCR
IPT
Table 4.Effect of diet on fatty acid profile (mg/100 g fresh muscle)
Item C RR60 RR87 SEM P SFA C10:0 8.9 9.1 10.5 0.82 0.70 C12:0 6.2 5.6 5.1 0.99 0.89 C13:0 1.1 0.9 1.4 0.12 0.36 C14:0 130 138 135 14.3 0.96 C15:0 19.6 27.1 30.7 2.9 0.32 C16:0 1491 1583 1469 10.5 0.89 C17:0 65 123 122 12.1 0.10 C18:0 1189 1235 987 97 0.55 C20:0 5.5 6.3 4.9 0.7 0.74 C22:0 1.8 1.9 1.7 0.2 0.92 C24:0 0.56 0.29 0.37 0.04 0.09 MUFA C14:1 cis9 2.5 2.1 2.6 0.33 0.85 C15:1 38 38 42 1.3 0.31 C16:1 trans9 18.6 13.8 9.6 1.9 0.17 C17:1 cis 10 43 62 70 4.9 0.09 C18:1 trans 11 47.5b 184a 106b 12 0.001 C18:1cis9 2352 2662 2286 178 0.66 C18:1 trans 15 0.93 0.66 0.77 0.09 0.52 C18:1 cis 11 2.81 4.90 2.95 0.57 0.28 C18:1 cis 12 0.89 0.59 1.06 0.08 0.08 C18:1 cis 13 1.8 3 2.4 0.37 0.44 C18:1 trans 16 2.3 1.7 0.6 0.61 0.52
ACCEPTED MANUSCRIPT
ACC
EPTE
D M
ANU
SCR
IPT
C18:1 cis 15 1.3 1.2 1.1 0.11 0.82 C20:1 n-9 0.6 0.6 0.5 0.03 0.28 C22:1 1.1a 0.7ab 0.6b 0.07 0.02 C24:1 n-9 0.53 0.34 0.39 0.03 0.14 PUFA C18:2 n-6 189b 342a 277a 16.4 0.004 C18:2 cis 9, trans 11 CLA 19.6 23.8 20.6 2.27 0.72 C18:2 trans 10, cis 12 CLA 1.6 1.5 1.2 0.17 0.65 C18:2 trans 9,trans 11 CLA 3.7b 7.1a 6.3a 0.44 0.01 C18:2 n-6 trans 9,12 2.5 2.7 2.3 0.4 0.91 C18:3 n-6 1.5 2.2 1.8 0.14 0.21 C18:3 n-3 15.0b 34.6a 26.5a 2.11 0.005 C20:2 n-6 1.8 3.2 2.8 0.24 0.07 C20:3 n-9 13.7a 9.7b 9.8b 0.56 0.01 C20:3 n-6 5.2 5.6 5.8 0.29 0.69 C20:4 n-6 ARA 61.8 69.8 70.5 2.2 0.23 C20:5 n-3 EPA 3.6b 4.5b 5.9a 0.18 0.001 C22:3 n-3 0.48 0.44 0.65 0.05 0.30 C22:4 n-6 4.7b 6.8a 7.3a 0.31 0.007 C22:5 n-3 DPA 10.2b 13.3a 14.3a 0.60 0.03 C22:6 n-3 DHA 1.3 1.9 2.2 0.18 0.14 SFA: saturated fatty acid; MUFA: monounsaturated fatty acid; PUFA: polyunsaturated fatty acid; a, b: Different letters in the same row indicate significant differences (p<0.05)
C: control group fed 600 g of oat hay; RR60: experimental group fed 600 g of rosemary pellets containing 60% of RR; RR87: experimental group fed 600 g of rosemary pellets containing 87% of RR.
Table 5.Effect of diet on fatty acid groups (mg/100 g fresh muscle) and ratios
Item C RR60 RR87 SEM P
SFA 3031 3237 2871 226 0.80
MUFA 2579 3045 2588 199 0.56
PUFA 335b 529a 455a 21.3 0.005
UFA 2915 3574 3044 210 0.41
DFA 4103 4808 4031 301 0.52
n-6 266.3b 431.9a 367.1a 17.8 0.004
n-3 30.5b 54.7a 49.6a 2.62 0.003
n-6/n-3 9.03a 8.07ab 7.5b 0.27 0.10
ACCEPTED MANUSCRIPT

ACC
EPTE
D M
ANU
SCR
IPT
PUFA/SFA 0.110 0.163 0.158 0.013 0.10
MUFA/SFA 0.85 0.95 0.89 0.01 0.09
UFA/SFA 0.98b 1.12a 1.05ab 0.01 0.03
CLA 24.9 32.4 28.1 2.7 0.53
SI 0.95a 0.81b 0.86b 0.01 0.01
SFA: saturated fatty acid; MUFA: monounsaturated fatty acid; PUFA: polyunsaturated fatty acid; UFA: unsaturated fatty acid; CLA: conjugated linoleic acids; SI: saturation index; DFA: desirable fatty acids a, b: Different letters in the same row indicate significant differences (p<0.05)
C: control group fed 600 g of oat hay; RR60: experimental group fed 600 g of rosemary pellets containing 60% of RR; RR87: experimental group fed 600 g of rosemary pellets containing 87% of RR.
ACCEPTED MANUSCRIPT

ACC
EPTE
D M
ANU
SCR
IPT
Highlights
Meat n−6/n−3 ratio of lambs fed rosemary distillation residues was lower than hay one
The meat produced with rosemary distillation residues has a high vitamine E content
The rosemary distillation residues permit higher Oxymyoglobin.
The oxidative stability was higher for lambs fed rosemary distillation residues
ACCEPTED MANUSCRIPT