Embed Size (px)
Citation preview

1
Prof. Dr. Rosário Macário
Prof. Dr. Eddy Van de Voorde
What future for Airports ? Rosário Macário and Eddy van de Voorde*
* We thank Rui Couchinho, Franziska Kupfer, Hilde Meersman, and Evy Onghena, Vasco Reis for data and discussions.
2
Prof. Dr. Rosário Macário
Prof. Dr. Eddy Van de Voorde
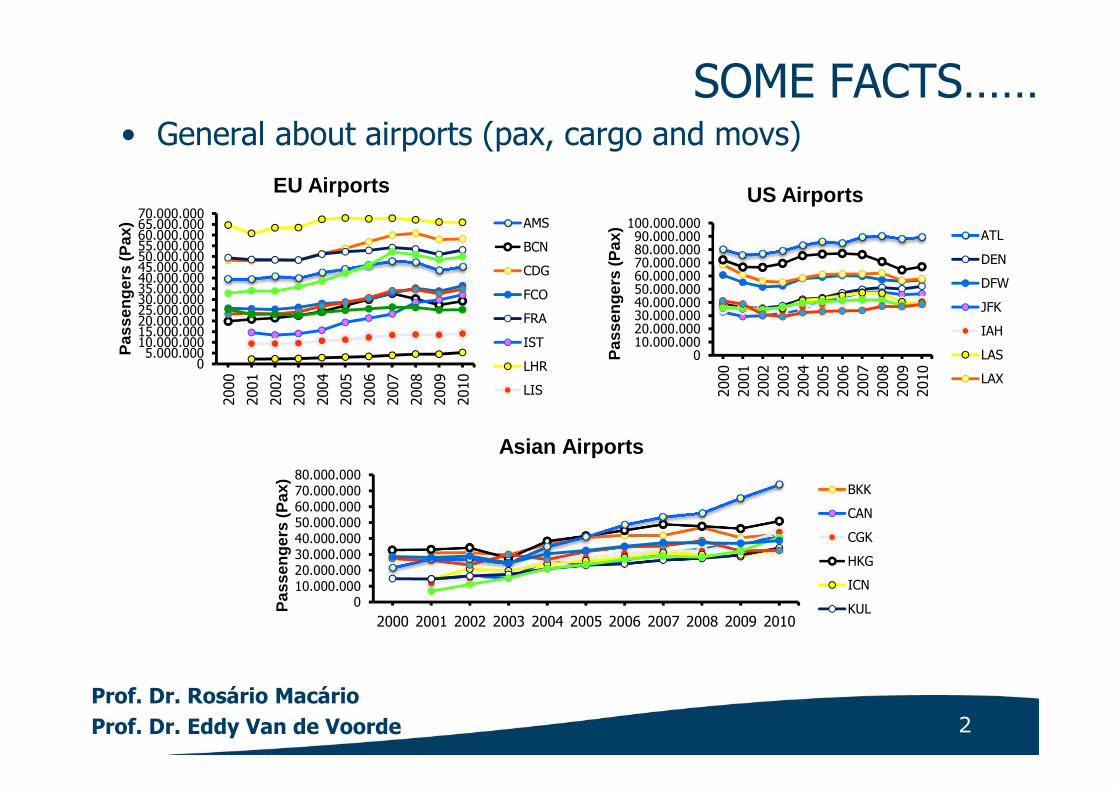
SOME FACTS……• General about airports (pax, cargo and movs)
05.000.000
10.000.00015.000.00020.000.00025.000.00030.000.00035.000.00040.000.00045.000.00050.000.00055.000.00060.000.00065.000.00070.000.000
2000
2001
2002
2003
2004
2005
2006
2007
2008
2009
2010
Pas
sen
ger
s (P
ax)
EU Airports
AMS
BCN
CDG
FCO
FRA
IST
LHR
LIS
010.000.00020.000.00030.000.00040.000.00050.000.00060.000.00070.000.00080.000.00090.000.000
100.000.000
2000
2001
2002
2003
2004
2005
2006
2007
2008
2009
2010
Pas
sen
ger
s (P
ax)
US Airports
ATL
DEN
DFW
JFK
IAH
LAS
LAX
010.000.00020.000.00030.000.00040.000.00050.000.00060.000.00070.000.00080.000.000
2000 2001 2002 2003 2004 2005 2006 2007 2008 2009 2010
Pas
sen
ger
s (P
ax)
Asian Airports
BKK
CAN
CGK
HKG
ICN
KUL
3
Prof. Dr. Rosário Macário
Prof. Dr. Eddy Van de Voorde
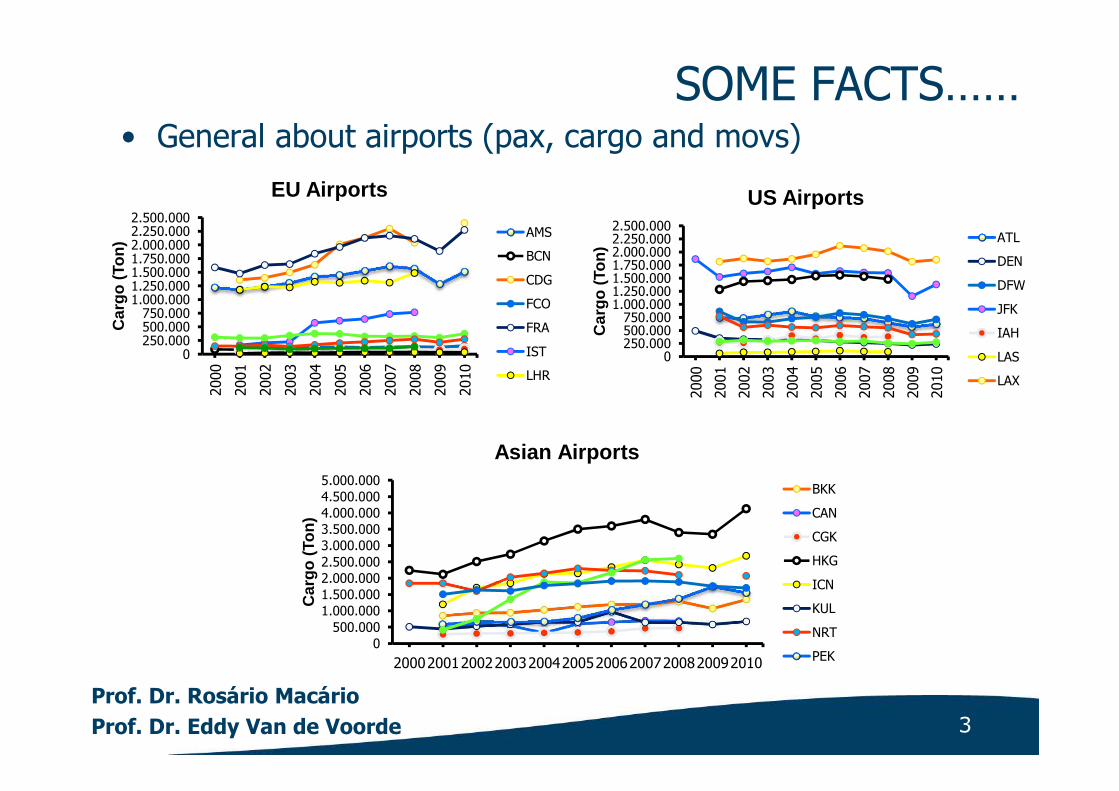
SOME FACTS……• General about airports (pax, cargo and movs)
0250.000500.000750.000
1.000.0001.250.0001.500.0001.750.0002.000.0002.250.0002.500.000
2000
2001
2002
2003
2004
2005
2006
2007
2008
2009
2010
Car
go
(To
n)
EU Airports
AMS
BCN
CDG
FCO
FRA
IST
LHR
0250.000500.000750.000
1.000.0001.250.0001.500.0001.750.0002.000.0002.250.0002.500.000
2000
2001
2002
2003
2004
2005
2006
2007
2008
2009
2010
Car
go
(To
n)
US Airports
ATL
DEN
DFW
JFK
IAH
LAS
LAX
0500.000
1.000.0001.500.0002.000.0002.500.0003.000.0003.500.0004.000.0004.500.0005.000.000
20002001200220032004200520062007200820092010
Car
go
(To
n)
Asian Airports
BKK
CAN
CGK
HKG
ICN
KUL
NRT
PEK

4
Prof. Dr. Rosário Macário
Prof. Dr. Eddy Van de Voorde
SOME FACTS……• General about airports (pax, cargo and movs)
050.000
100.000150.000200.000250.000300.000350.000400.000450.000500.000550.000600.000
Air
craf
t M
ov.
EU Airports
AMS
BCN
CDG
FCO
FRA
IST
LHR
LIS0
100.000200.000300.000400.000500.000600.000700.000800.000900.000
1.000.000
2000
2001
2002
2003
2004
2005
2006
2007
2008
2009
2010
Air
craf
t M
ov.
US Airports
ATL
DEN
DFW
JFK
IAH
LAS
LAX
ORD
0
100.000
200.000
300.000
400.000
500.000
600.000
Air
craf
t M
ov.
Asian Airports
BKK
CAN
CGK
HKG
ICN
KUL
NRT

5
Prof. Dr. Rosário Macário
Prof. Dr. Eddy Van de Voorde
ANNOUNCEMENTS AT THE SAME MOMENT…
• Brussels Airport:
- cash flow increase of 28% (April-June 2011)
- due to tariff increases
- due to growth of Brussels Airlines
• Brussels Airlines: expected loss of about 80 mln €
• Ryanair increases profit expectations for 2011 to 440 mln €
• Some actors also gain from other non-aeronautical sources, and this can be very significant
6
Prof. Dr. Rosário Macário
Prof. Dr. Eddy Van de Voorde
Some facts…. (ctd)
• The big three European airlines do have problems
• Some small to medium-sized airlines are in big trouble (Olympic, Austrian,…)
• Some low cost airlines (e.g. Ryanair) are still successful, but after important measures (e.g. re-scheduling and/or decreasing supply)
• If some low cost airlines can find a good match between demand and structure of supply, why can’t the others?
7
Prof. Dr. Rosário Macário
Prof. Dr. Eddy Van de Voorde
CONTENT
1. Introduction
2. Brief recap of evolution in last 20 yrs
3. Facts and figures
4. Causal evidences: driving factors
5. Possible ways to go: airlines and airports
6. Conclusions

8
Prof. Dr. Rosário Macário
Prof. Dr. Eddy Van de Voorde
WHERE IS THAT BRIGHT FUTURE?
• US domestic airline industry: deregulated in 1978
• The European Union followed with its own deregulation (three packages)
• Elimination of most economic restrictions on new entry and pricing
• Expectations after deregulation: a healthy air transport industry
• Reality is less bright: who looses money in the air transport chain, who gains?

9
Prof. Dr. Rosário Macário
Prof. Dr. Eddy Van de Voorde
THE PLAYING FIELD
• The air transport chain: many actors, withmutual relationships
• Hypothesis
- most airlines do have problems, due tolower yields and higher costs
- airports are successful, due to severalincome flows
- service providers: mixed picture
10
Prof. Dr. Rosário Macário
Prof. Dr. Eddy Van de Voorde
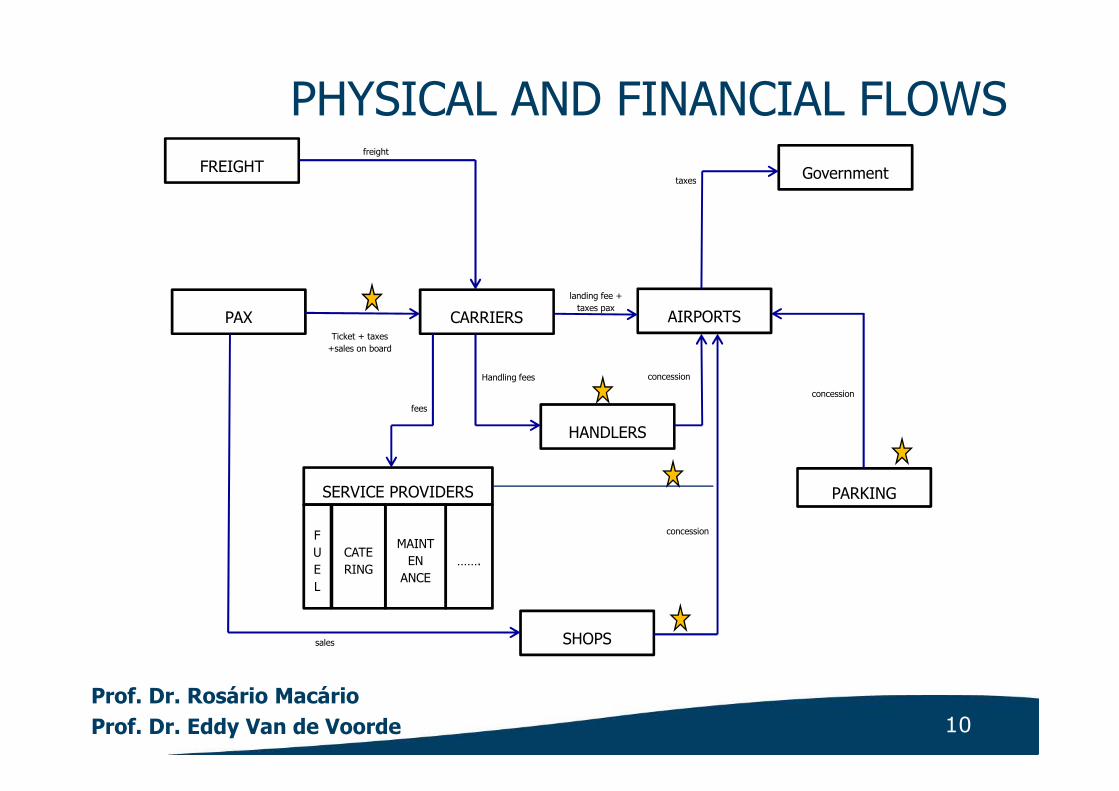
PHYSICAL AND FINANCIAL FLOWS
AIRPORTS
Government
SERVICE PROVIDERS
F
U
E
L
PARKING
CARRIERSPAX
HANDLERS
SHOPS
FREIGHT
CATE
RING
MAINT
EN
ANCE
…….
freight
Ticket + taxes
+sales on board
fees
sales
Handling fees
landing fee +
taxes pax
taxes
concession
concession
concession
11
Prof. Dr. Rosário Macário
Prof. Dr. Eddy Van de Voorde
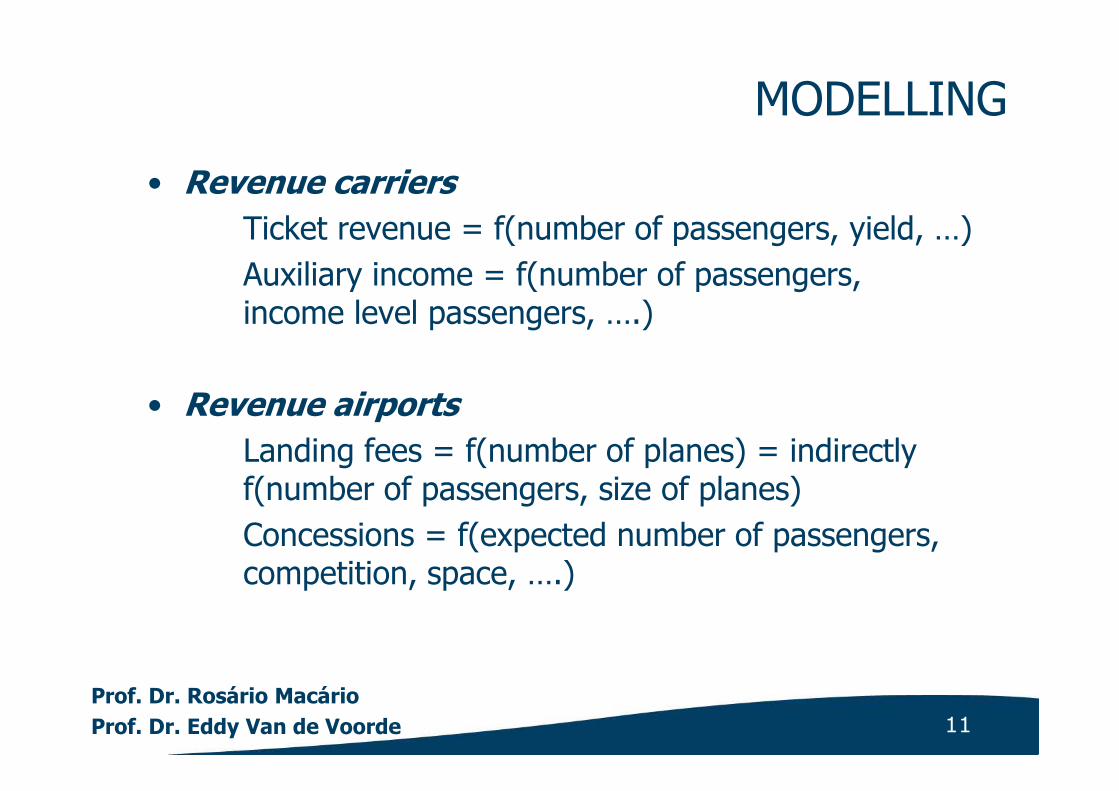
MODELLING
• Revenue carriers
Ticket revenue = f(number of passengers, yield, …)
Auxiliary income = f(number of passengers, income level passengers, ….)
• Revenue airports
Landing fees = f(number of planes) = indirectly f(number of passengers, size of planes)
Concessions = f(expected number of passengers, competition, space, ….)

12
Prof. Dr. Rosário Macário
Prof. Dr. Eddy Van de Voorde
MODELLING (ctd)
• Revenue service providers
Revenues = f(number of planes, number of passengers, price level, ….)
Crucial common variable: number of passengers (being generator of cash flow)
Incentive: increase that number of passengers
• A similar reasoning applies to Air Cargo
13
Prof. Dr. Rosário Macário
Prof. Dr. Eddy Van de Voorde
CONTENT
1. Introduction
2. Brief recap of evolution in last 20 yrs
3. Additional facts and figures
4. Causal evidences: driving factors
5. Possible ways to go
6. Conclusions

14
Prof. Dr. Rosário Macário
Prof. Dr. Eddy Van de Voorde

15
Prof. Dr. Rosário Macário
Prof. Dr. Eddy Van de Voorde
COMPANY REPORT BRUSSELS AIRLINES
Profile 12/31/2010
1,000 €)
12/31/2009 (1,000 €) 12/31/2008 (1,000 €) 12/31/2007 (1,000 €) 12/31/2006 (1,000 €)
Turnover 693,752 629,540 783,429 755,464 620,768
Net added value 149,505 99,133 171,211 145,419 147,037
P/L for the periode
after taxes (+/-)
5,249 -39,812 -6,800 25,624 4,839
Cash flow 15,802 -28,925 7,250 40,711 27,655
Total assets 371,661 325,580 419,489 448,963 448,865
Source: bel-first (update 159 – June 2011)
16
Prof. Dr. Rosário Macário
Prof. Dr. Eddy Van de Voorde
17
Prof. Dr. Rosário Macário
Prof. Dr. Eddy Van de Voorde
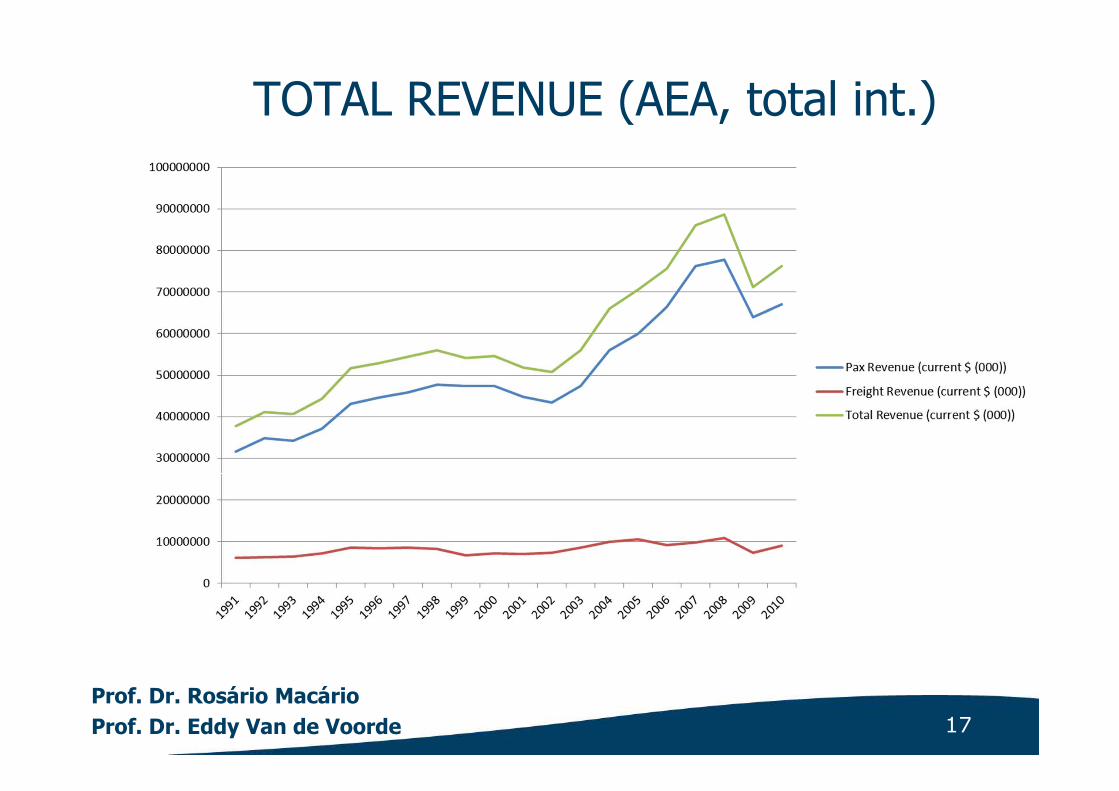
TOTAL REVENUE (AEA, total int.)
18
Prof. Dr. Rosário Macário
Prof. Dr. Eddy Van de Voorde
CONTENT
1. Introduction
2. Brief recap of evolution in last 20 yrs
3. Facts and figures
4. Causal evidences: driving factors
5. Possible ways to go
6. Conclusions
19
Prof. Dr. Rosário Macário
Prof. Dr. Eddy Van de Voorde
DEFINITIONS
• Passenger yield: the average amount of passenger revenue received per Revenue Passenger Kilometre (RPK)
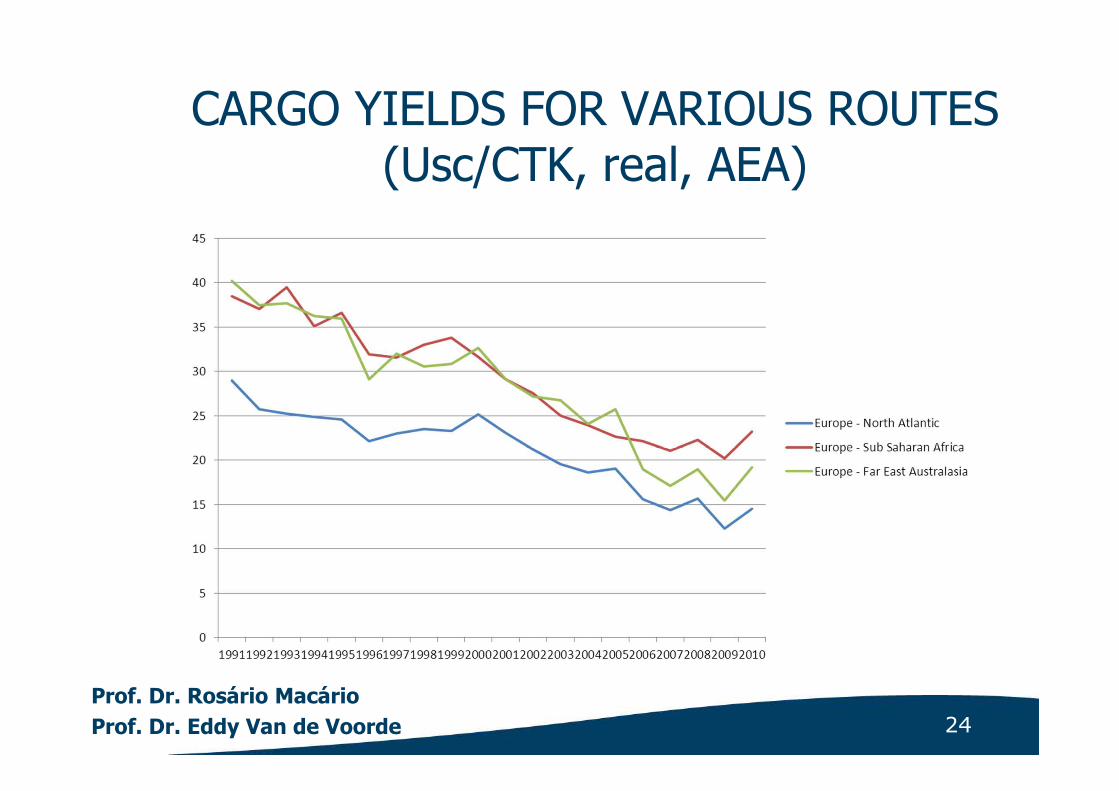
• Cargo yield: The average amount of cargo (freight and mail) revenue received per Cargo Tonne Kilometre (CTK)

20
Prof. Dr. Rosário Macário
Prof. Dr. Eddy Van de Voorde
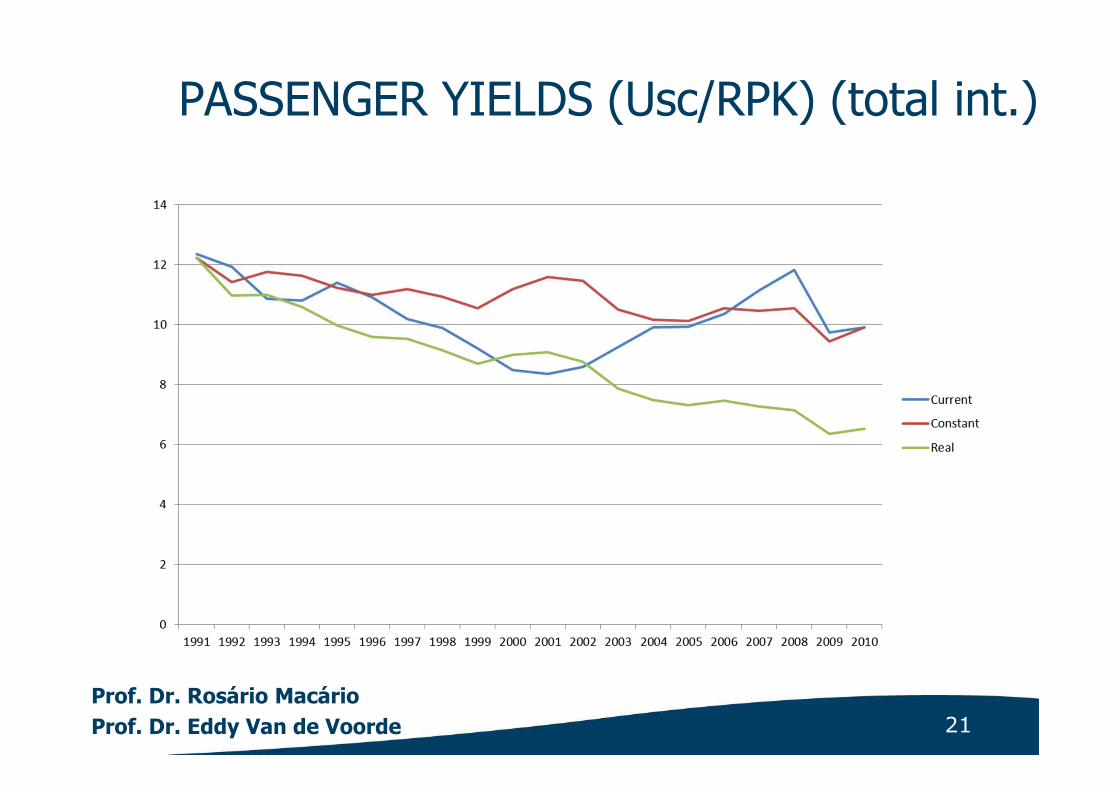
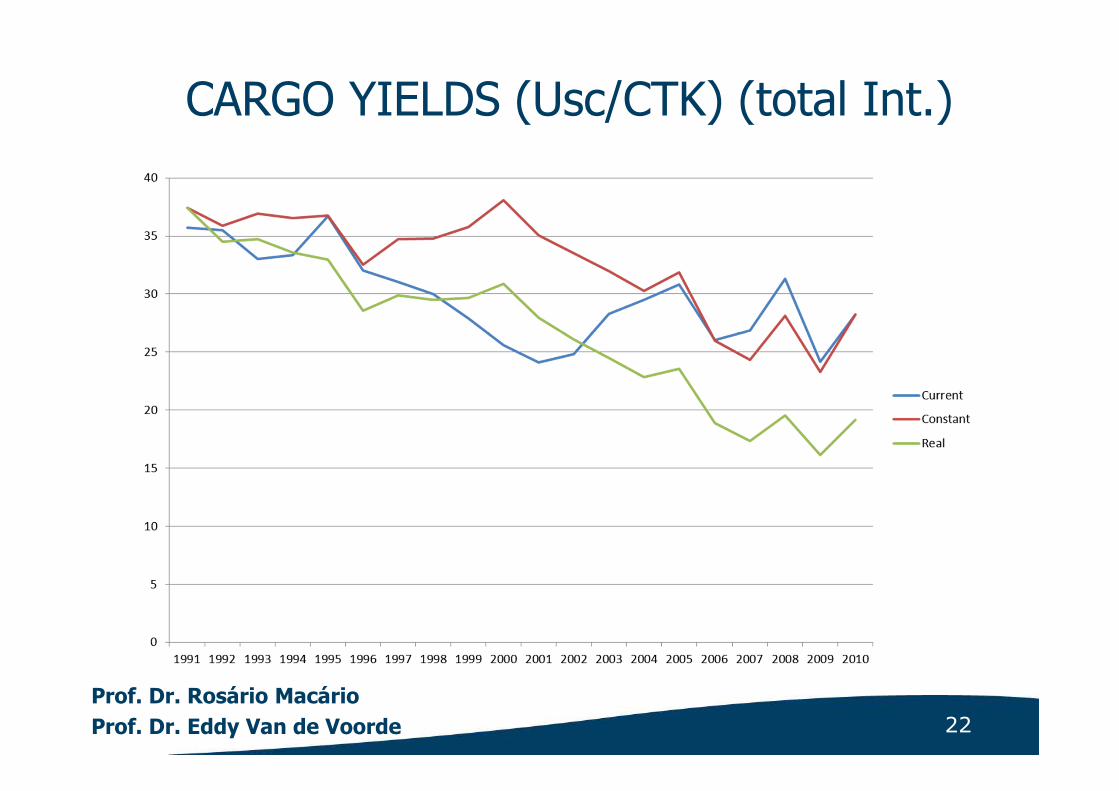
DEFINITIONS
• Current yield: yield without any exchange rate or inflation adjustments
• Constant yield: yield adjusted for exchange rate fluctuations versus the US dollar
• Real yield: yield adjusted for exchange rate fluctuations and inflation (deflator: OECD Consumer Price Indices)
21
Prof. Dr. Rosário Macário
Prof. Dr. Eddy Van de Voorde
PASSENGER YIELDS (Usc/RPK) (total int.)
22
Prof. Dr. Rosário Macário
Prof. Dr. Eddy Van de Voorde
CARGO YIELDS (Usc/CTK) (total Int.)

23
Prof. Dr. Rosário Macário
Prof. Dr. Eddy Van de Voorde
PASSENGER YIELDS FOR VARIOUS ROUTES (Usc/RPK, real, AEA)
24
Prof. Dr. Rosário Macário
Prof. Dr. Eddy Van de Voorde
CARGO YIELDS FOR VARIOUS ROUTES (Usc/CTK, real, AEA)

25
Prof. Dr. Rosário Macário
Prof. Dr. Eddy Van de Voorde
AIRLINE COSTS (total operational cost AA, 2010)
26
Prof. Dr. Rosário Macário
Prof. Dr. Eddy Van de Voorde
POTENTIAL CAUSES
• “No conventional long-run equilibrium explanation for an industry that perpetually loses money” (Borinstein, 2011)
• Four potential theories:
1. Exogeneous cost drivers: taxes and fuel
2. Exogeneous demand shocks
3. Entry and expansion of low-cost carriers
4. A series of unfortunate events
27
Prof. Dr. Rosário Macário
Prof. Dr. Eddy Van de Voorde

28
Prof. Dr. Rosário Macário
Prof. Dr. Eddy Van de Voorde
AIRPORTS
• Analysis of income flows of airports
• Analysis of financial control of airports (eg Brussels airport has been sold by Macquarie to an Canadian pension fund)
• Questions that need urgent answer ?
- What is the best airport pricing strategy, single till or dual till?
- Is capital ownership relevant ?
- Is ownership-structure-performance the new paradigm ?

29
Prof. Dr. Rosário Macário
Prof. Dr. Eddy Van de Voorde
COMPANY REPORT BRUSSELS AIRPORT HOLDING
Profile 12/31/2009 (1,000 €) 12/31/2008 (1,000 €)
Turnover n.a n.a.
Net added value -161 -48
P/L for the periode after
taxes (+/-)
16,261 11,467
Cash flow n.a. n.a.
Total assets 2,551,310 2,568,139
Return on capital employed
(%)
4.44 4.15
Source: bel-first (update 159 – June 2011)
30
Prof. Dr. Rosário Macário
Prof. Dr. Eddy Van de Voorde
SERVICE PROVIDERS: GROUND HANDLING
• Increasing share for independents, less for airports and airlines self-handling
• Independents: relatively small club (Swissport, BBA Aviation, Aviapartner, Menzies, Servisair…)
• Eclectic ownership mix (e.g. 3i in Aviapartner)
• Independent sector has a very wide range of scales, models and profitability

31
Prof. Dr. Rosário Macário
Prof. Dr. Eddy Van de Voorde
CONTENT
1. Introduction
2. Brief recap of evolution in last 20 yrs
3. Facts and figures
4. Causal evidences: driving factors
5. Possible ways to go: airlines and airports
6. Conclusions
32
Prof. Dr. Rosário Macário
Prof. Dr. Eddy Van de Voorde
POTENTIAL STRATEGIES
• What do we learn out of the analysis?
- some actors are making profits, other actors are losing money
• If we have a zero-sum game: no incentive to co-operate
• The air transport business is NO zero-sum game
- Incentive to make the pie a bigger one
- Can we find a partnership-performance relation ?

33
Prof. Dr. Rosário Macário
Prof. Dr. Eddy Van de Voorde
POTENTIAL STRATEGIES (ctd)The case of the airports
• Aim is profit maximization
• Realized by maximizing revenues and/or minimizing costs
• Revenue side:
- increase the number of passengers?
- increase landing tariffs? (cf. elasticity)
- increase the other sources of revenue
• Message: don’t kill your best client (cf. the system character of the business)
34
Prof. Dr. Rosário Macário
Prof. Dr. Eddy Van de Voorde
POTENTIAL STRATEGIES (ctd)The case of the airlines• Aim is profit maximization• Cost side:
- minimize input factor costs, including landing charges
• Revenue side: - increase the number of passengers?- increase yield? (cf. elasticity)
• Message: strengthen your negotiation position in your home or hub airport � Is “cabotage competition” paying ? (restructuring
and creaming off others markets, e.g. legacy going for low cost)

35
Prof. Dr. Rosário Macário
Prof. Dr. Eddy Van de Voorde
POTENTIAL STRATEGIES (ctd)
The case of the service providers (e.g. shops)Aim is profit maximization• Cost side:
- minimize concession payments (besides other input factor payments)
• Revenue side: - increase the number of passengers?- optimize product price level? (cf. tax free shops, and elasticity)
• Message: hope for more and richer passengers, your clients

36
Prof. Dr. Rosário Macário
Prof. Dr. Eddy Van de Voorde
POTENTIAL STRATEGIES (ctd)
The solution could be CO-OPERATION
• Airports: taking share in capital of home carriers (e.g. re-capitalization program)
• As part of Single till – Dual till discussion
• No mergers; no discrimination of non-participating actors, e.g. other airlines
• Are alliances airline-airports effective, or just a fancy trend ?
• Partnerships can work: e.g. Vancouver
The message: the chain approach increases the pie, and the pieces of cake of each actor!

37
Prof. Dr. Rosário Macário
Prof. Dr. Eddy Van de Voorde
CONTENT
1. Introduction
2. Brief recap of evolution in last 20 yrs
3. Facts and figures
4. Causal evidences: driving factors
5. Possible ways to go
6. Conclusions
38
Prof. Dr. Rosário Macário
Prof. Dr. Eddy Van de Voorde
CONCLUSION
• The air transport sector is like an economic laboratory where new evolution and trends tend to come to light
• Think in terms of policy packages, allowing to offset the negative impacts of one instrument with the positive impact of other instruments
• Allow 'out of the box' movements in the relation between actors
• Design policies considering the whole chain, not only the main actors, 3rd and 4th parties do play a role creaming-off profits

39
Prof. Dr. Rosário Macário
Prof. Dr. Eddy Van de Voorde
CONCLUSION (ctd)
What will be the effect of the new (announced) policy of the European Commission?
• Liberalisation of ground handling services: at least three instead of two!
• More flexible use of landing and take-off slots (i.e. European framework to sell/buy slots, and airlines should use higher percentage of slots)
• More transparency concerning airport noise limits
Do not forget: a system will be influenced!

40
Prof. Dr. Rosário Macário
Prof. Dr. Eddy Van de Voorde
CONCLUSION (ctd)
AIRPORTS
Government
SERVICE PROVIDERS
F
U
E
L
PARKING
CARRIERSPAX
HANDLERS
SHOPS
FREIGHT
CATE
RING
MAINT
EN
ANCE
…….
freight
Ticket + taxes
+sales on board
fees
sales
Handling fees
landing fee +
taxes pax
taxes
concession
concession
concession
Two obvious partners:
Airports and Airlines
41
Prof. Dr. Rosário Macário
Prof. Dr. Eddy Van de Voorde
THANK YOU