Embed Size (px)
Citation preview
Rosa H. Compagnucci
Variability in the Hydrological System of the Subtropical Cordillera
of the Andes and the Central-West of
Argentina
* UBA – FCEyN – Dto. Ciencias de la Atmósfera y los Océanos* Consejo Nacional de Investigaciones Científicas y Técnicas (CONICET)
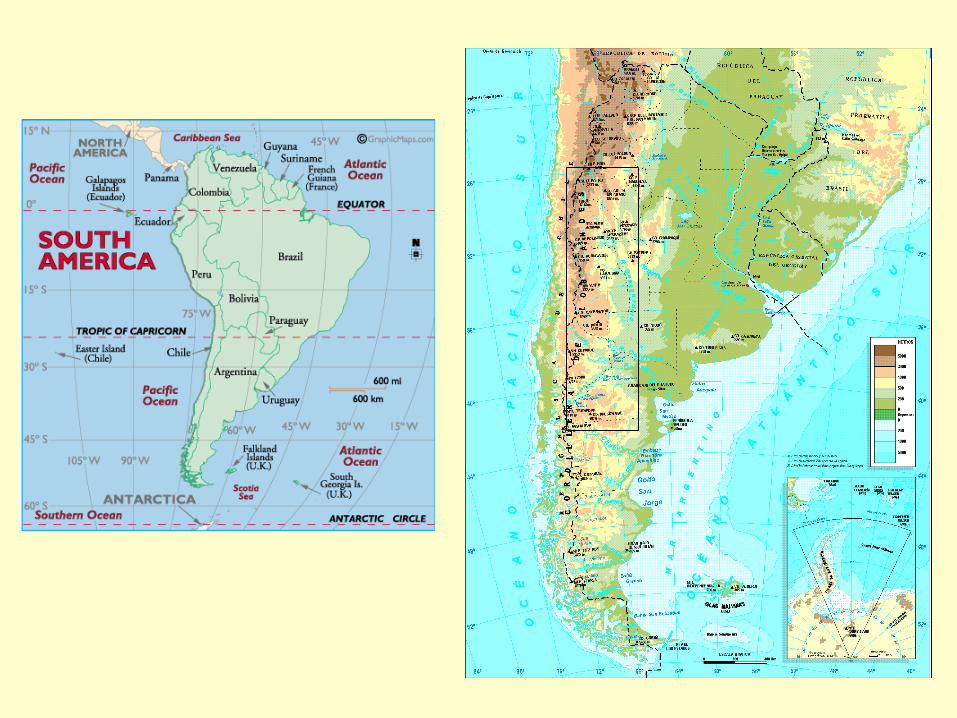
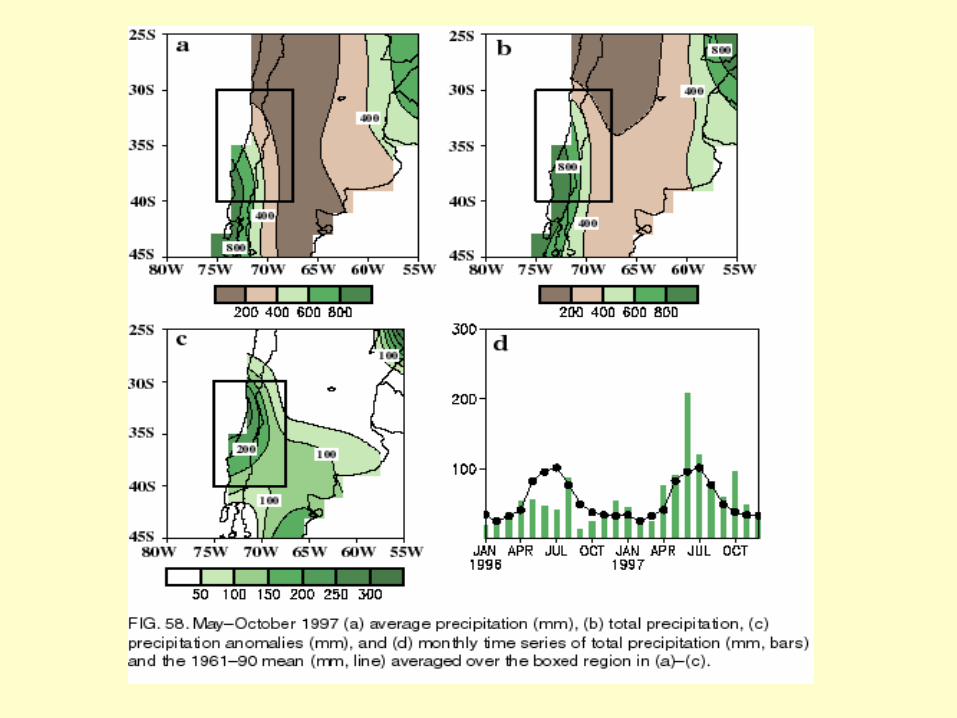
Winter precipitation (April to September)
• .
Correlations between annual streamflow and annual pp at Santiago, ChileArea with coherence in winter precipitation
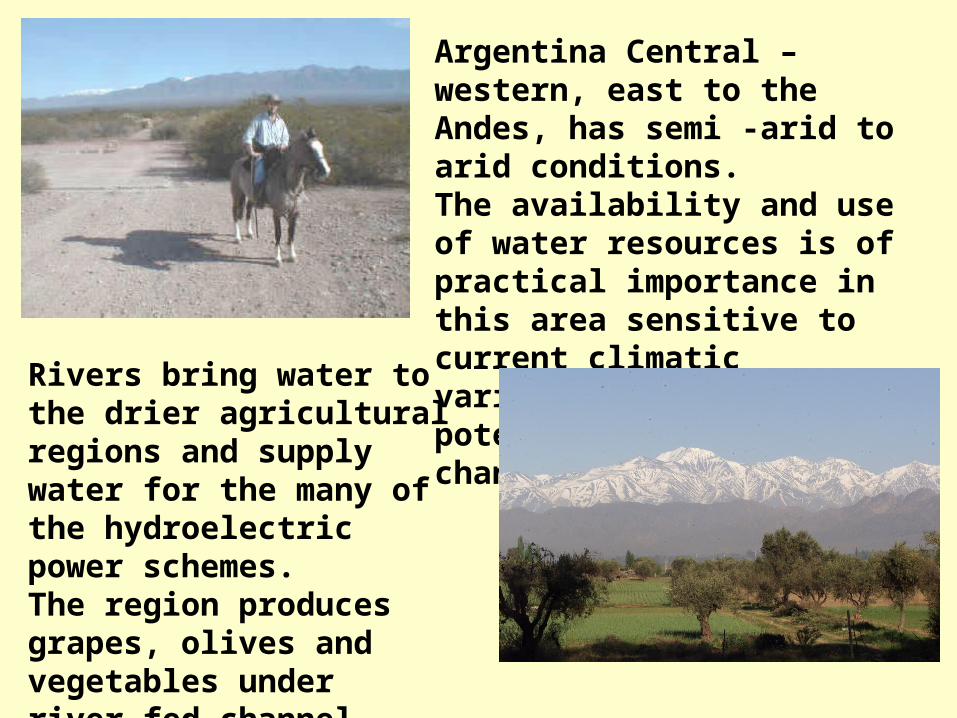
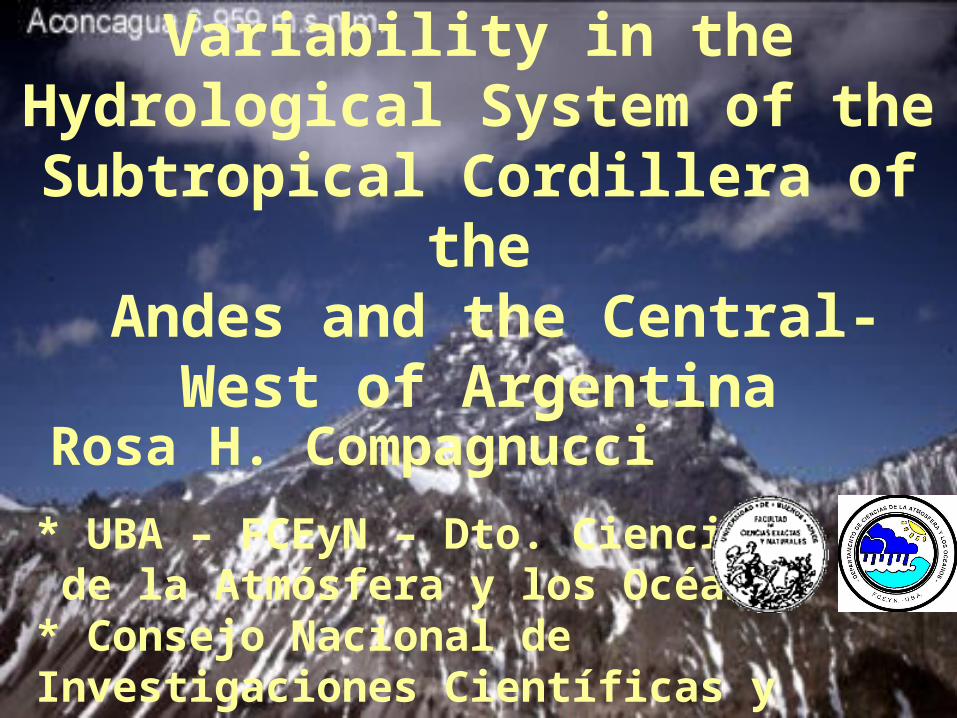
Argentina Central –western, east to the Andes, has semi -arid to arid conditions. The availability and use of water resources is of practical importance in this area sensitive to current climatic variability and potentially climatic change.
Rivers bring water to the drier agricultural regions and supply water for the many of the hydroelectric power schemes.The region produces grapes, olives and vegetables under river-fed channel-irrigation.
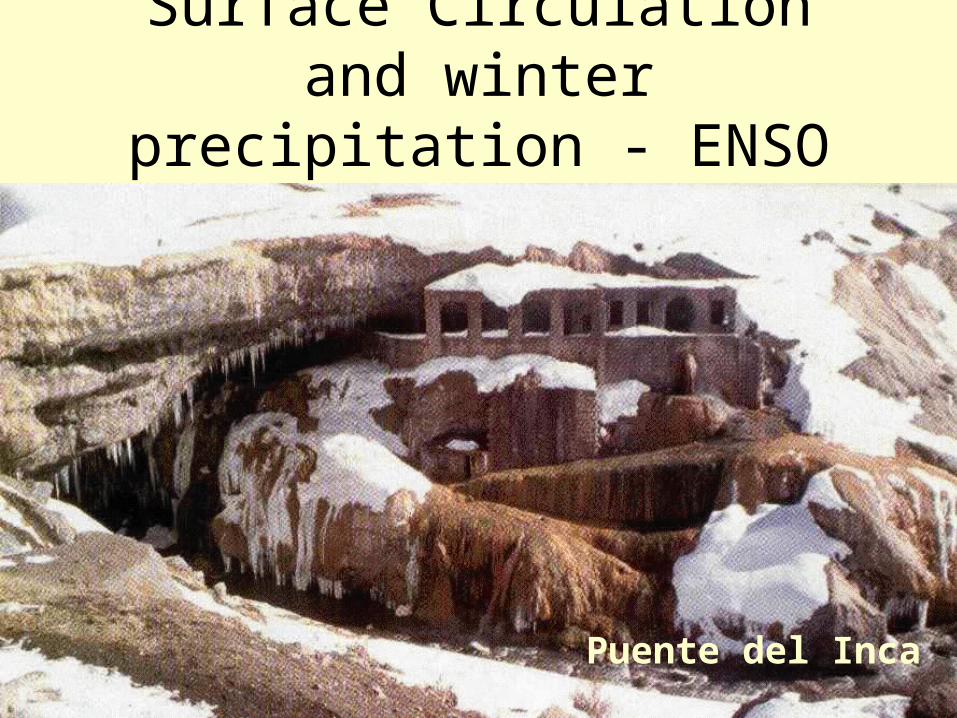
Surface Circulation and winter precipitation - ENSO cycle
Puente del Inca
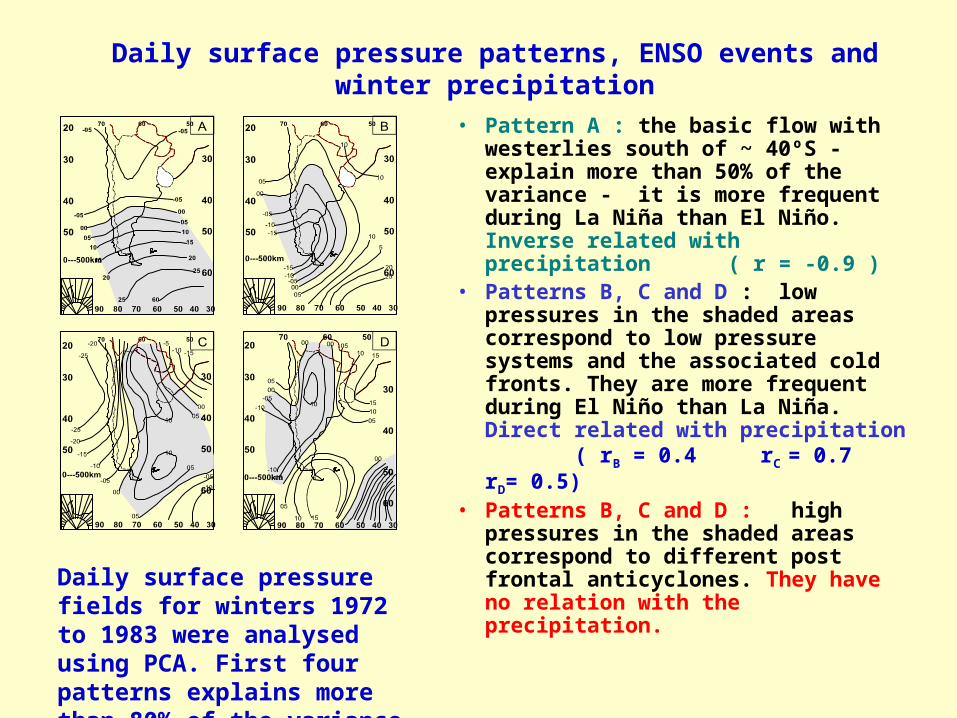
Daily surface pressure patterns, ENSO events and winter precipitation
• Pattern A : the basic flow with westerlies south of ~ 40ºS - explain more than 50% of the variance - it is more frequent during La Niña than El Niño. Inverse related with precipitation ( r = -0.9 )
• Patterns B, C and D : low pressures in the shaded areas correspond to low pressure systems and the associated cold fronts. They are more frequent during El Niño than La Niña. Direct related with precipitation ( rB = 0.4 rC = 0.7 rD= 0.5)
• Patterns B, C and D : high pressures in the shaded areas correspond to different post frontal anticyclones. They have no relation with the precipitation.
Daily surface pressure fields for winters 1972 to 1983 were analysed using PCA. First four patterns explains more than 80% of the variance.
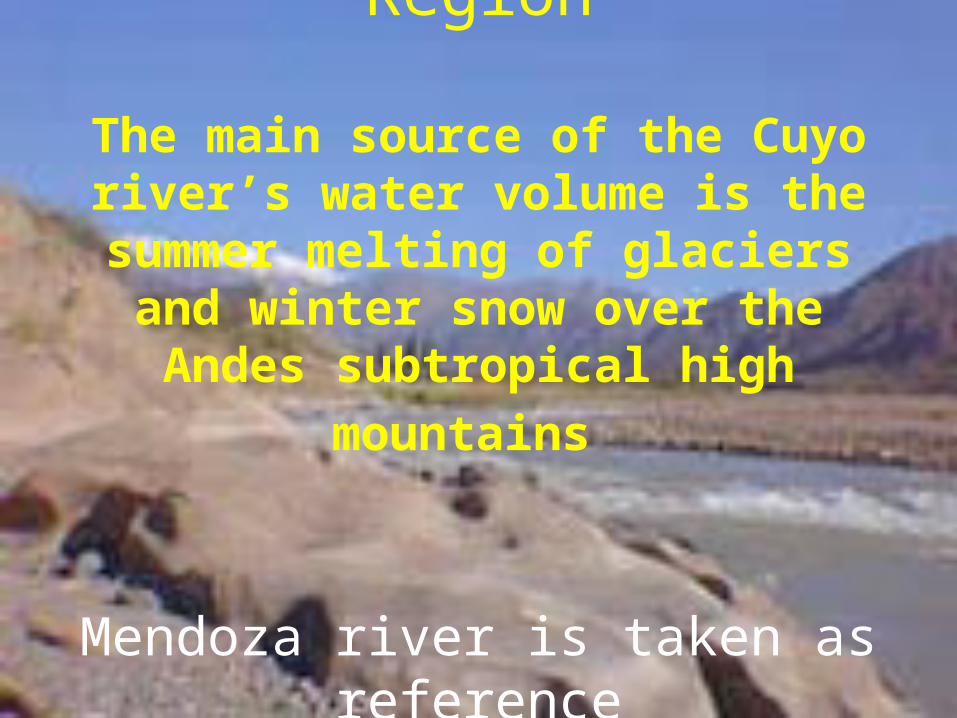
Streamflow in the Cuyo Region
The main source of the Cuyo river’s water volume is the summer melting of
glaciers and winter snow over the Andes
subtropical high mountains
Mendoza river is taken as reference
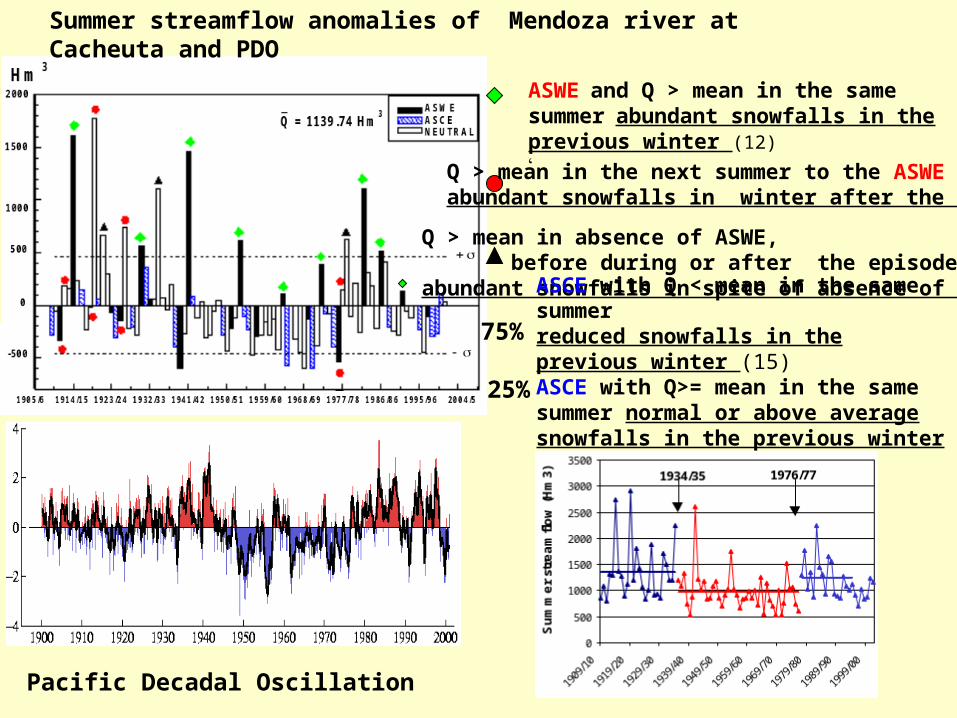
Summer streamflow anomalies of Mendoza river at Cacheuta and PDO
ASWE and Q > mean in the same summer abundant snowfalls in the previous winter (12)‘
Q > mean in the next summer to the ASWE (4 )abundant snowfalls in winter after the ASWE
Q > mean in absence of ASWE, before during or after the episode (3)abundant snowfalls in spite of absence of ASWE
ASCE with Q < mean in the same summerreduced snowfalls in the previous winter (15) ASCE with Q>= mean in the same summer normal or above average snowfalls in the previous winter (5)
75%
Pacific Decadal Oscillation
25%
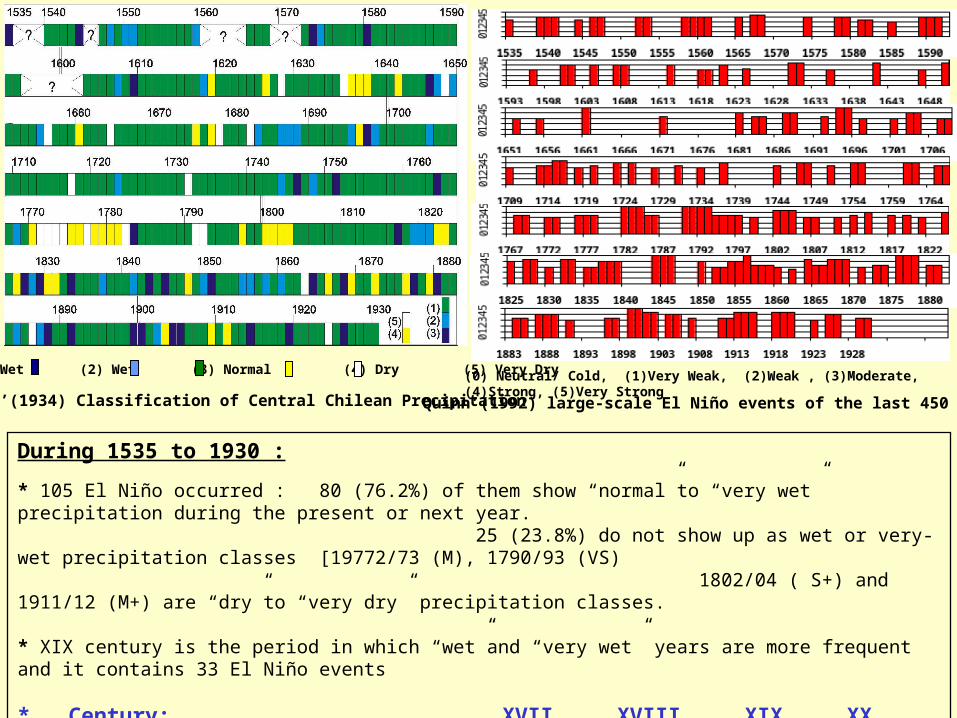
(1) Very Wet (2) Wet (3) Normal (4) Dry (5) Very Dry
Taulis’(1934) Classification of Central Chilean Precipitation
(0) Neutral/ Cold, (1)Very Weak, (2)Weak , (3)Moderate, (4)Strong, (5)Very Strong
Quinn’(1992) large-scale El Niño events of the last 450 years
During 1535 to 1930 :
* 105 El Niño occurred : 80 (76.2%) of them show “normal”to “very wet” precipitation during the present or next year. 25 (23.8%) do not show up as wet or very-wet precipitation classes [19772/73 (M), 1790/93 (VS) 1802/04 ( S+) and 1911/12 (M+) are “dry”to “very dry” precipitation classes.
* XIX century is the period in which “wet”and “very wet” years are more frequent and it contains 33 El Niño events
* Century: XVII XVIII XIX XX Frequency of El Niño : 22 27 33 24 (up to 1997/98 event)
The 19th century is regarded as part of the Little Ice Age
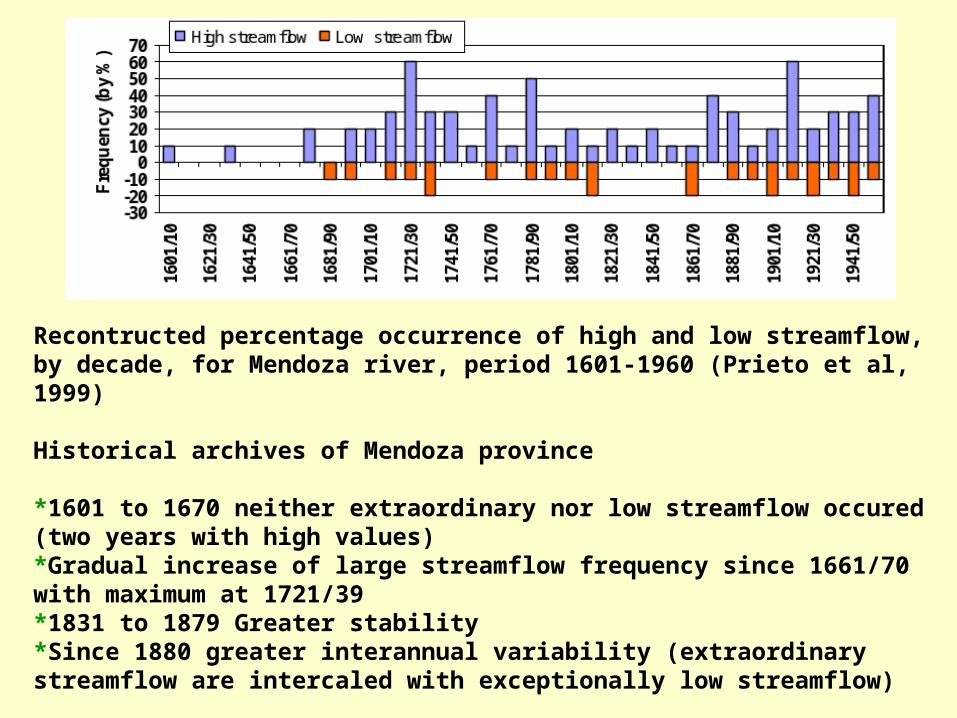
Recontructed percentage occurrence of high and low streamflow, by decade, for Mendoza river, period 1601-1960 (Prieto et al, 1999)
Historical archives of Mendoza province
*1601 to 1670 neither extraordinary nor low streamflow occured (two years with high values)*Gradual increase of large streamflow frequency since 1661/70 with maximum at 1721/39*1831 to 1879 Greater stability *Since 1880 greater interannual variability (extraordinary streamflow are intercaled with exceptionally low streamflow)
CONCLUSIONS:*High variability in the Hydrological System (precipitation and streamflow) in the Subtropical Andes*Meltwater (glaciers and snow ) dominates the hydrologic cycle.*Streamflows show: * During XX century negative trend in the maxima would be due to glaciers receding. Although, around 1982 few glaciers started to advance again (Llorens R. and Leiva J.C., 2000) **Decadal fluctuation conexted to Pacifec Decadal Oscillation **Two jumps in the average streamflow: 1934/35 and 1976/77 **Interannual variability conexted with ENSO events: Streamflow below normal during the cold phase “ La Niña” and normal or above normal during the warm phase “ El Niño”.*The last 450 years show similar relation between streamflow and ENSO. During the coldest decades of the Little Ice Age -second half of the XIX century- occured extraordinary streamflow.
*Are after 1993 a comeback to the conditions previous to 1976?
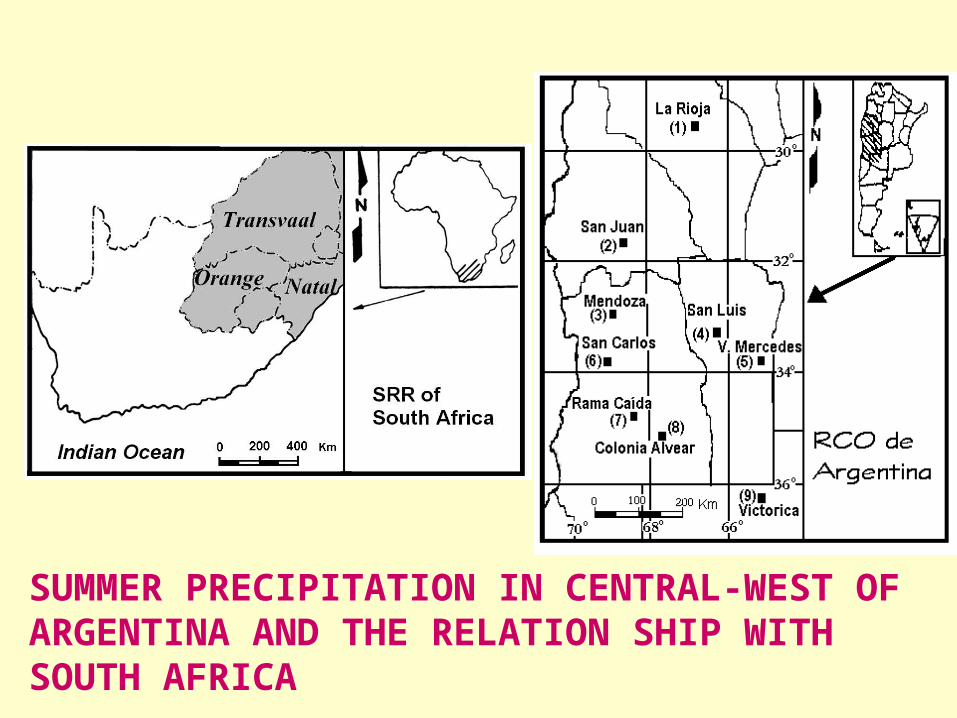
SUMMER PRECIPITATION IN CENTRAL-WEST OF ARGENTINA AND THE RELATION SHIP WITH SOUTH AFRICA
-60-40-20
020406080
1001910 1920 1930 1940 1950 1960 1970 1980 1990
% A
.N.R
.
-60
-40
-20
0
20
40
60
80
100
1910 1920 1930 1940 1950 1960 1970 1980 1990
% A
.N.R
.
-60
-40
-20
0
20
40
60
80
1001910 1920 1930 1940 1950 1960 1970 1980 1990
% A
.N.R
.
-60
-40
-20
0
20
40
60
80
100
1910 1920 1930 1940 1950 1960 1970 1980 1990
% A
.N.R
.
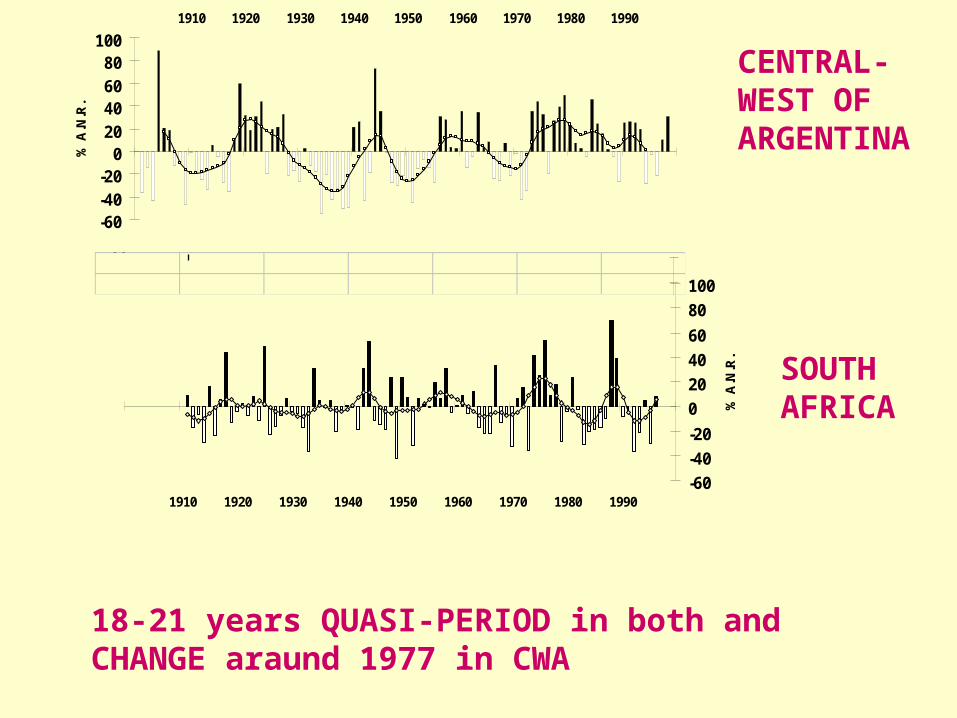
CENTRAL-WEST OF ARGENTINA
SOUTHAFRICA
18-21 years QUASI-PERIOD in both and CHANGE araund 1977 in CWA
(3) Mendoza
-3-2-10123
S.D
. A.
(1) La Rioja
-3
-1
1
3
1901 1911 1921 1931 1941 1951 1961 1971 1981 1991
S.D
.A.
(2) San Juan
-3-2-10123
S.D
.A.
-3-2-10123
S.D
.A.
(4) San Luis
-3-2-10123
S.D
.A.
-3-2-10123
S.D
.A.
-3-2-10123
S.D
.A.
-3-2-10123
S.D
.A.
-3-2
-10
12
3
1901 1911 1921 1931 1941 1951 1961 1971 1981 1991S
.D. A
.
(5) Villa Mercedes
(6) San Carlos
(7) Rama Caída
(8) Colonia Alvear
(9)Victorica
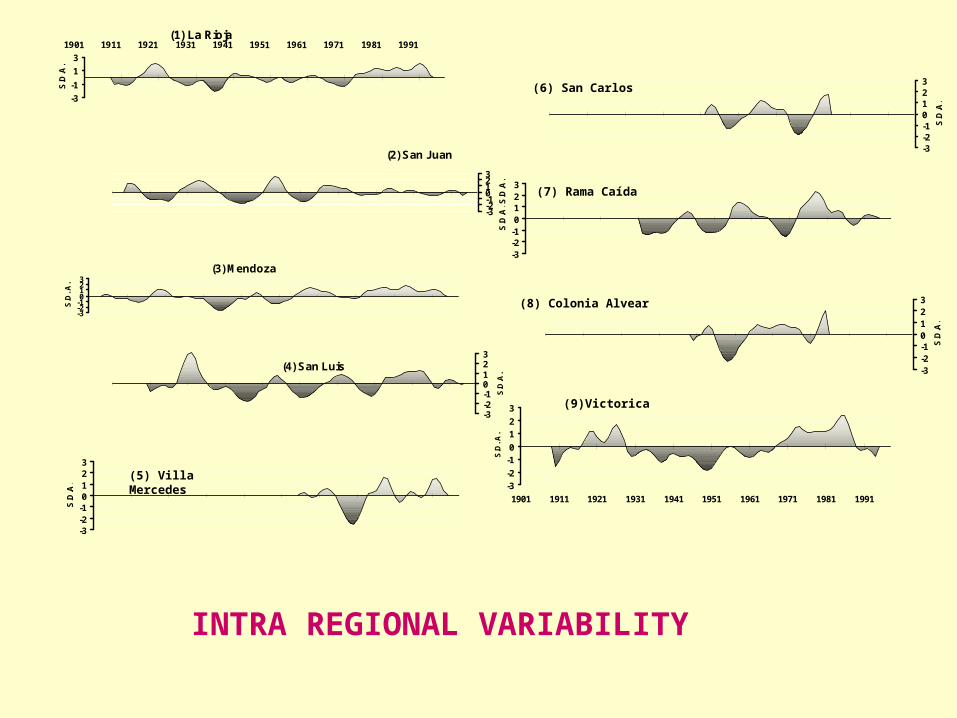
INTRA REGIONAL VARIABILITY
-40
-30
-20
-10
0
10
20
30
40
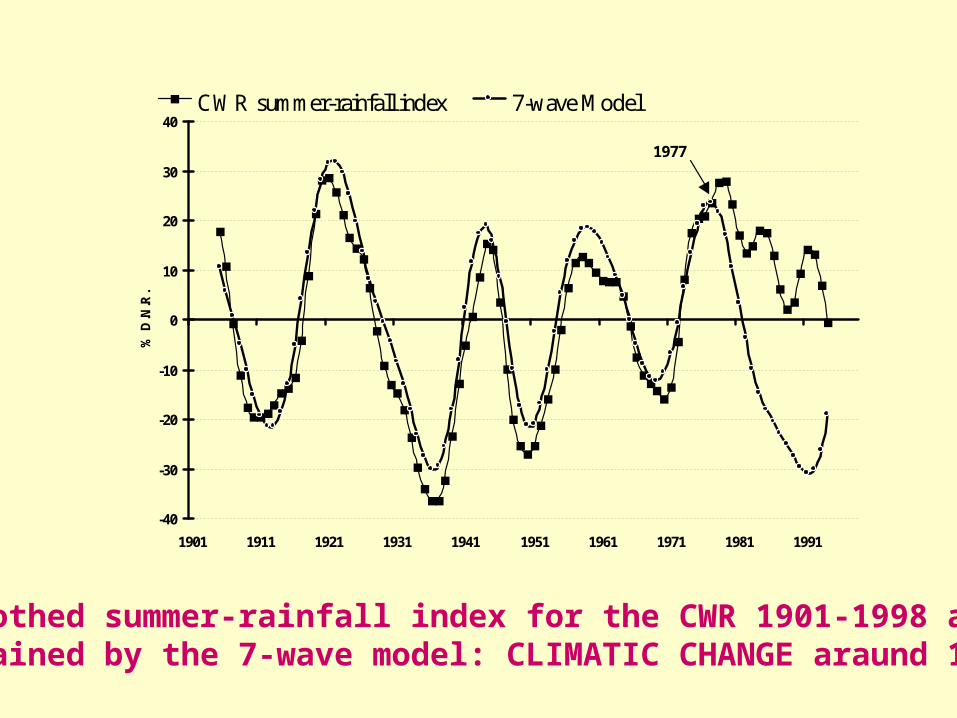
1901 1911 1921 1931 1941 1951 1961 1971 1981 1991
% D
.N.R
.
CWR summer-rainfall index 7-wave Model
1977
Smoothed summer-rainfall index for the CWR 1901-1998 and Obtained by the 7-wave model: CLIMATIC CHANGE araund 1977