Embed Size (px)
Citation preview
ROR Subcommittee #03-4Critical Skills / Retirement
Bubble
October 21, 2005 Version 2
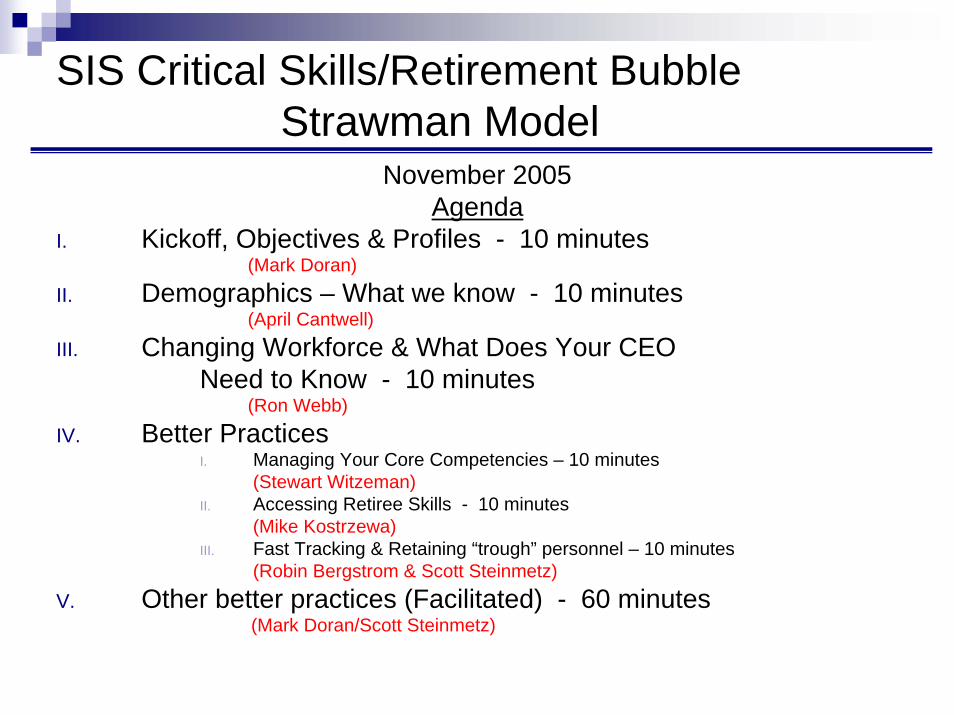
SIS Critical Skills/Retirement BubbleStrawman Model
November 2005 Agenda
I. Kickoff, Objectives & Profiles - 10 minutes (Mark Doran)
II. Demographics – What we know - 10 minutes(April Cantwell)
III. Changing Workforce & What Does Your CEO Need to Know - 10 minutes
(Ron Webb)IV. Better Practices
I. Managing Your Core Competencies – 10 minutes(Stewart Witzeman)
II. Accessing Retiree Skills - 10 minutes(Mike Kostrzewa)
III. Fast Tracking & Retaining “trough” personnel – 10 minutes(Robin Bergstrom & Scott Steinmetz)
V. Other better practices (Facilitated) - 60 minutes(Mark Doran/Scott Steinmetz)
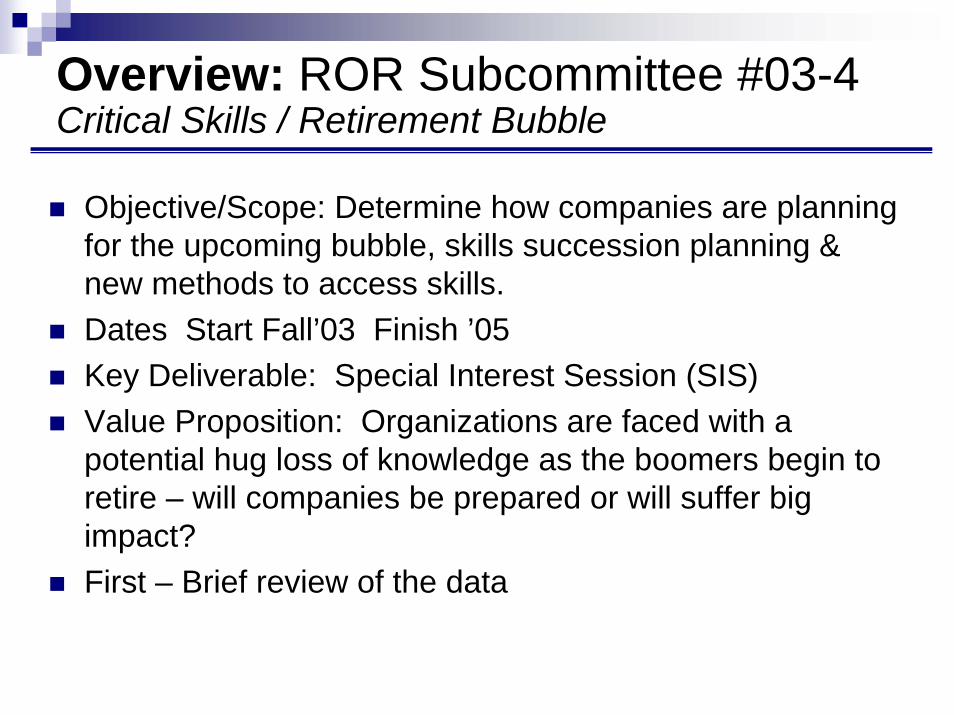
Overview: ROR Subcommittee #03-4Critical Skills / Retirement Bubble
Objective/Scope: Determine how companies are planning for the upcoming bubble, skills succession planning & new methods to access skills.Dates Start Fall’03 Finish ’05Key Deliverable: Special Interest Session (SIS)Value Proposition: Organizations are faced with a potential hug loss of knowledge as the boomers begin to retire – will companies be prepared or will suffer big impact?First – Brief review of the data
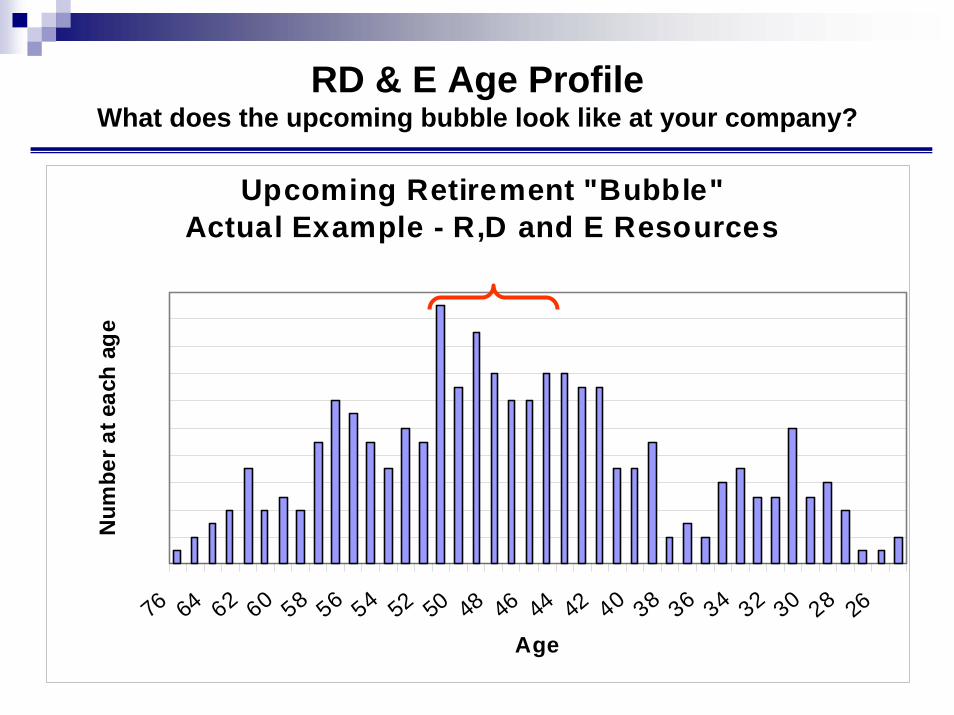
RD & E Age ProfileWhat does the upcoming bubble look like at your company?
Upcoming Retirement "Bubble"Actual Example - R,D and E Resources
76 64 62 60 58 56 54 52 50 48 46 44 42 40 38 36 34 32 30 28 26
Age
Num
ber a
t eac
h ag
e
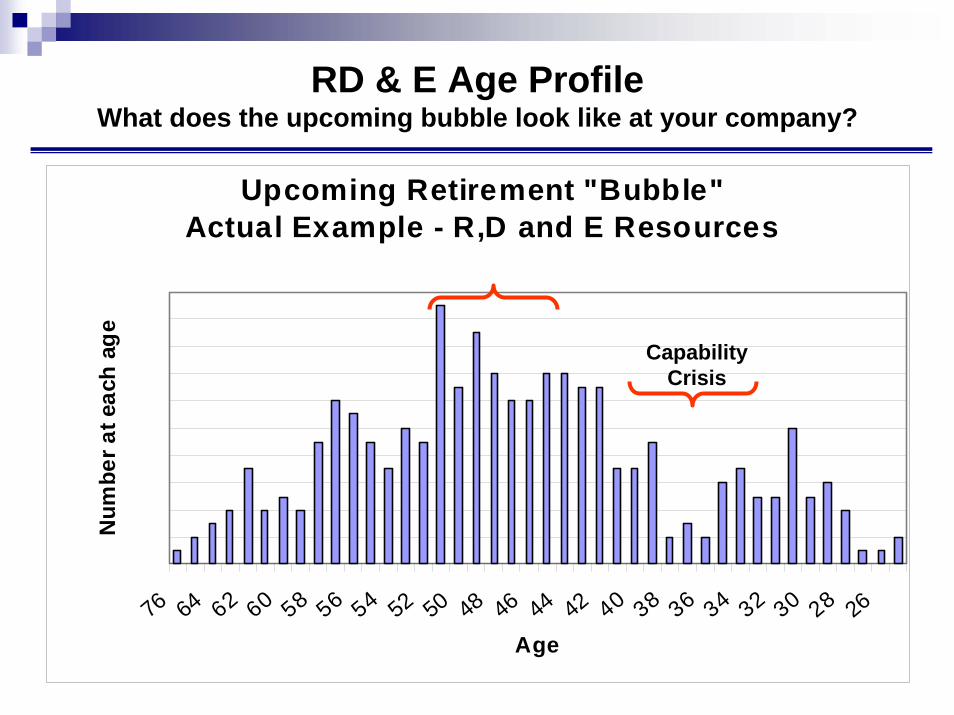
RD & E Age ProfileWhat does the upcoming bubble look like at your company?
Upcoming Retirement "Bubble"Actual Example - R,D and E Resources
76 64 62 60 58 56 54 52 50 48 46 44 42 40 38 36 34 32 30 28 26
Age
Num
ber a
t eac
h ag
e
Capability Crisis

Demographics
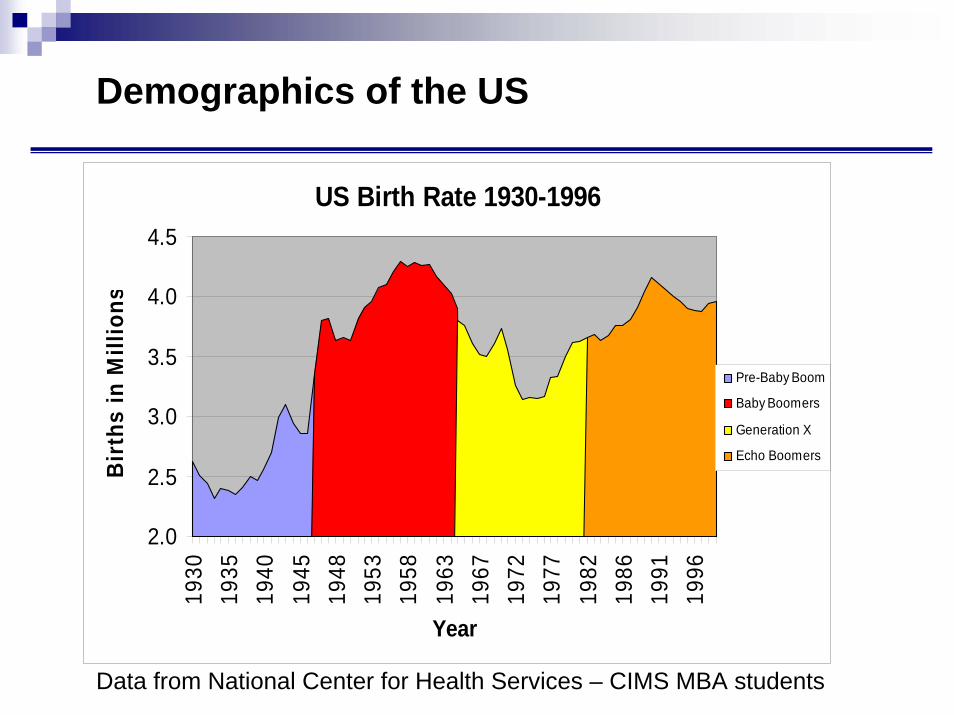
US Birth Rate 1930-1996
2.0
2.5
3.0
3.5
4.0
4.5
1930
1935
1940
1945
1948
1953
1958
1963
1967
1972
1977
1982
1986
1991
1996
Year
Bir
ths
in M
illio
ns
Pre-Baby Boom
Baby Boomers
Generation X
Echo Boomers
Data from National Center for Health Services – CIMS MBA students
Demographics of the US
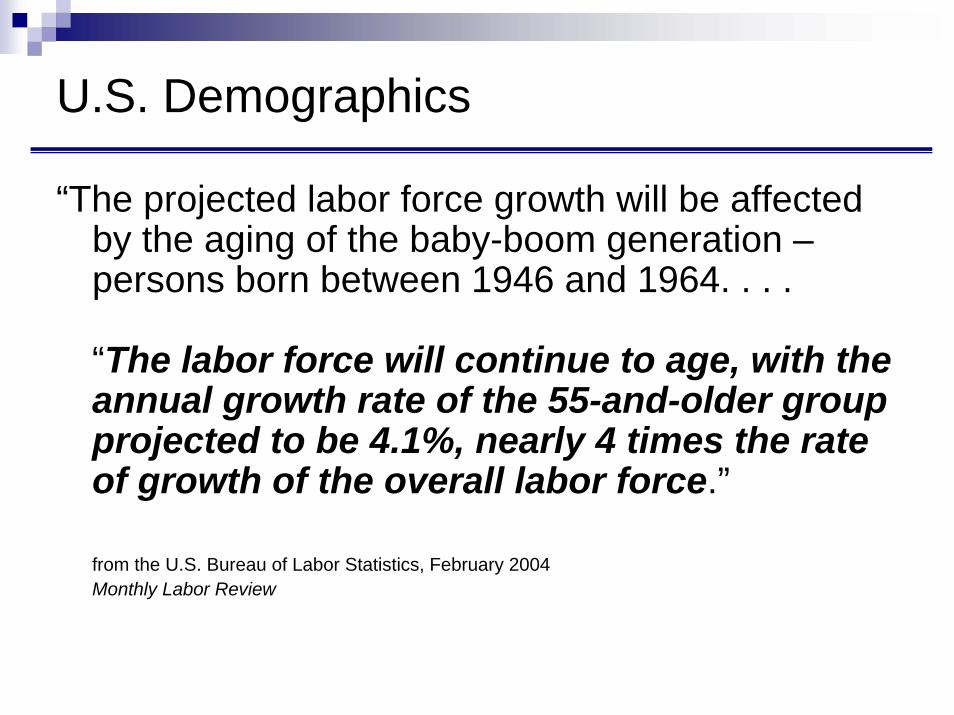
U.S. Demographics
“The projected labor force growth will be affected by the aging of the baby-boom generation –persons born between 1946 and 1964. . . .
“The labor force will continue to age, with the annual growth rate of the 55-and-older group projected to be 4.1%, nearly 4 times the rate of growth of the overall labor force.”
from the U.S. Bureau of Labor Statistics, February 2004Monthly Labor Review
Worldwide Birth Rates
Across the globe, the birth rate has been declining since the late 1960’s.
This trend is expected to continue at least through the year 2050.
Aging World Population
The world population is aging.
The Capability Crisis the US is facing will be faced by other nations as well.
The graph on the next slide depicts aging trends (population age 65 and older) by world region.
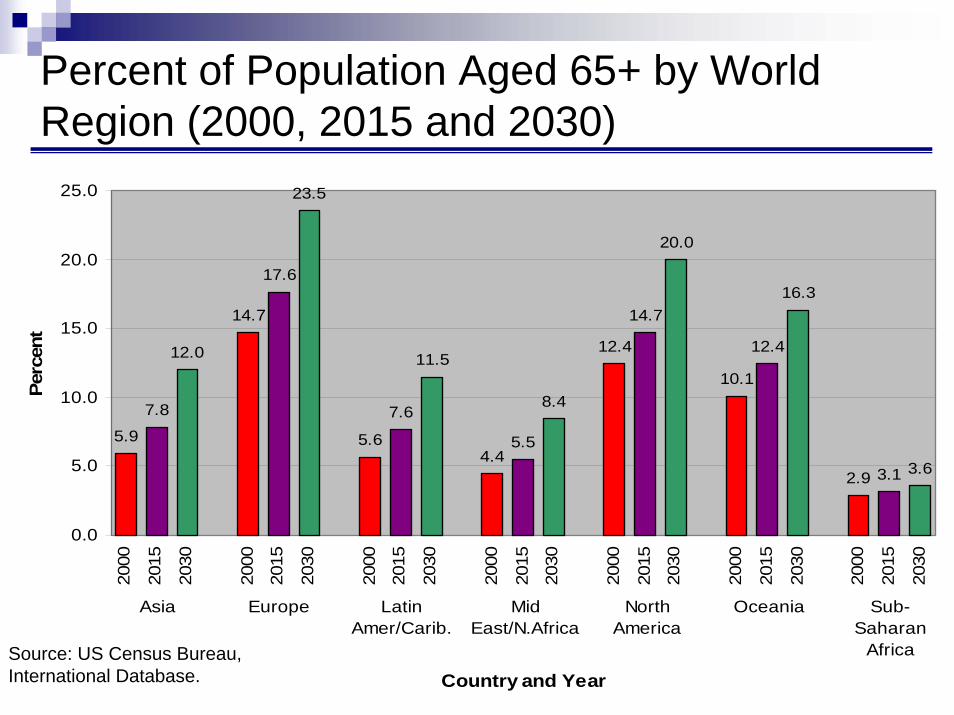
5.9
7.8
12.0
14.7
17.6
23.5
5.6
7.6
11.5
4.45.5
8.4
12.4
14.7
20.0
10.1
12.4
16.3
2.9 3.1 3.6
0.0
5.0
10.0
15.0
20.0
25.0
2000
2015
2030
2000
2015
2030
2000
2015
2030
2000
2015
2030
2000
2015
2030
2000
2015
2030
2000
2015
2030
Asia Europe LatinAmer/Carib.
MidEast/N.Africa
NorthAmerica
Oceania Sub-Saharan
Africa
Country and Year
Perc
ent
Source: US Census Bureau, International Database.
Percent of Population Aged 65+ by World Region (2000, 2015 and 2030)
Impacts of Aging Population on Labor Force Participation
In 6 countries examined, actual and projected data for the years 1950 – 2050 present a consistent trend of declining labor force participation.
Of these countries, the crisis in the US is actually the least severe.
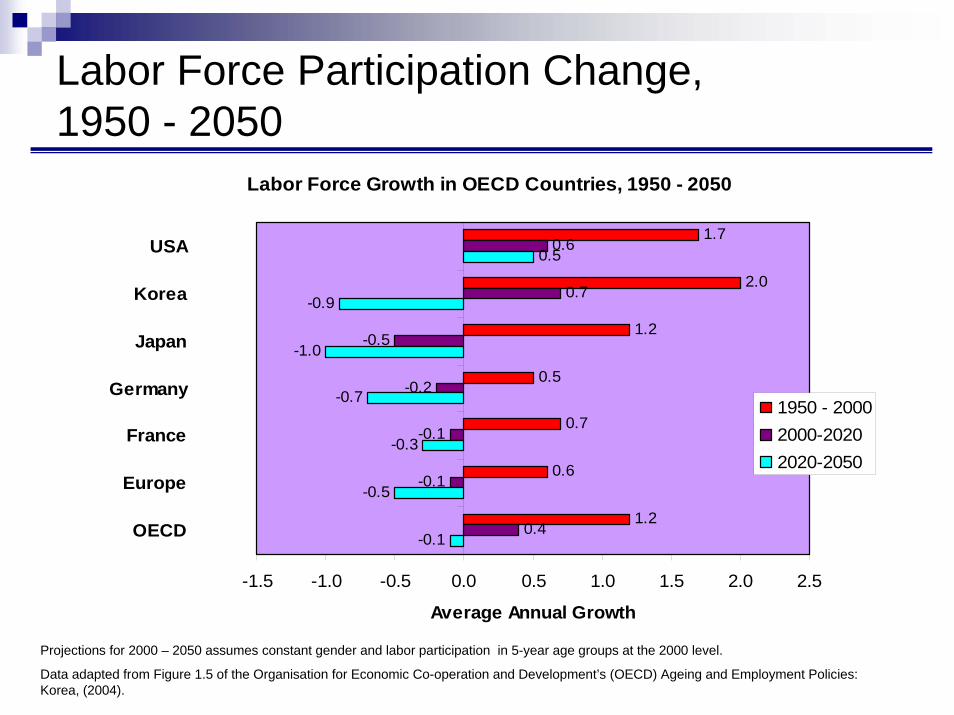
Labor Force Participation Change, 1950 - 2050
Labor Force Growth in OECD Countries, 1950 - 2050
1.7
2.0
1.2
0.5
0.7
0.6
1.2
0.6
0.7
-0.5
-0.2
-0.1
-0.1
0.4
0.5
-0.9
-1.0
-0.7
-0.3
-0.5
-0.1
-1.5 -1.0 -0.5 0.0 0.5 1.0 1.5 2.0 2.5
USA
Korea
Japan
Germany
France
Europe
OECD
Average Annual Growth
1950 - 20002000-20202020-2050
Projections for 2000 – 2050 assumes constant gender and labor participation in 5-year age groups at the 2000 level.
Data adapted from Figure 1.5 of the Organisation for Economic Co-operation and Development’s (OECD) Ageing and Employment Policies: Korea, (2004).
Immigration DataIndustrial managers in the US should not think they will be able to hire technically trained immigrants from other countries. It won’t work out that way.
The trend is toward decreasing or stable rates of immigration and migration rates, especially among highly skilled workers.
In the countries studied, the immigration of highly skilled workers is offset by near-equal emigration.
The countries currently benefiting most from immigration of highly skilled workers are the US, Australia Canada, France and Germany. Achieving even more favorable ratios in these countries is unlikely.

Changing Workforce
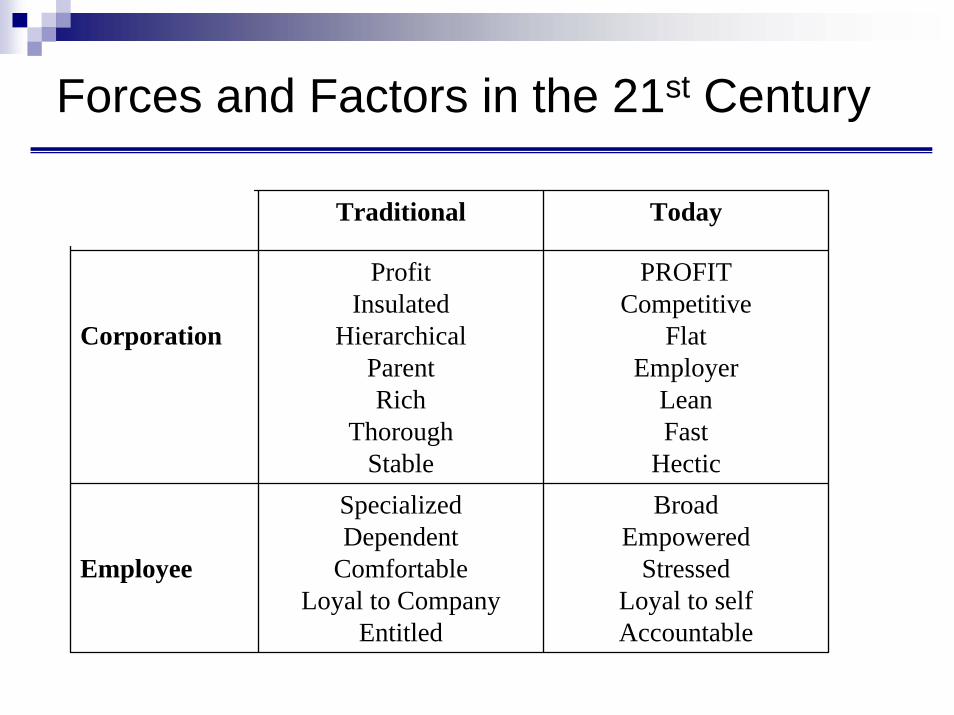
Forces and Factors in the 21st Century
Traditional Today
Corporation
ProfitInsulated
HierarchicalParentRich
ThoroughStable
PROFITCompetitive
FlatEmployer
LeanFast
Hectic
Employee
SpecializedDependent
ComfortableLoyal to Company
Entitled
BroadEmpowered
StressedLoyal to selfAccountable
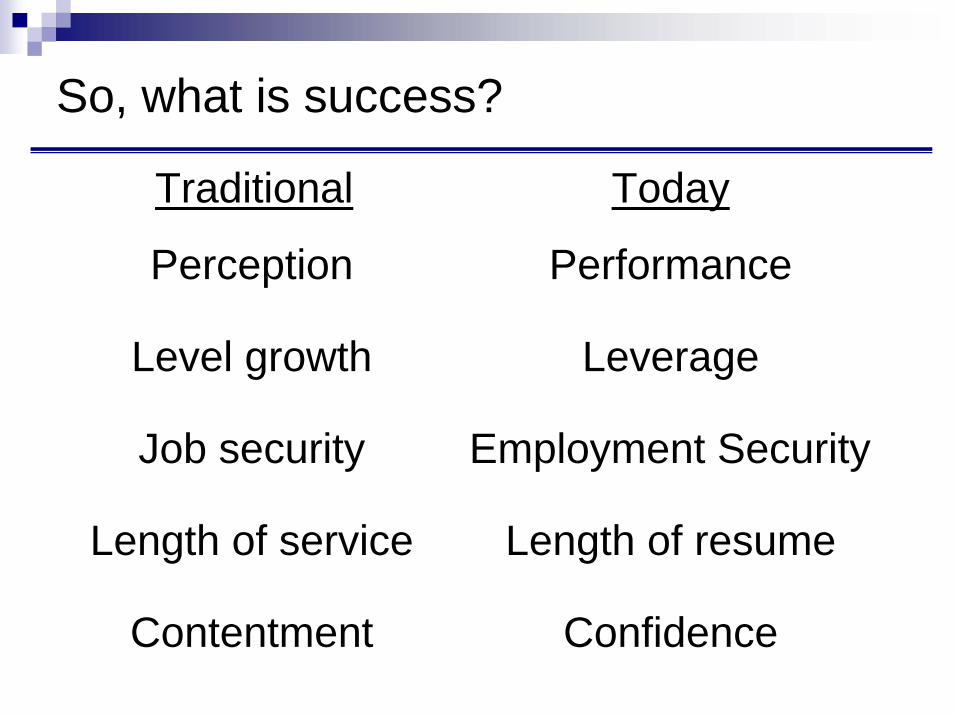
So, what is success?
Traditional Today
Perception Performance
Level growth Leverage
Job security Employment Security
Length of service Length of resume
Contentment Confidence

What does yourCEO need to know?
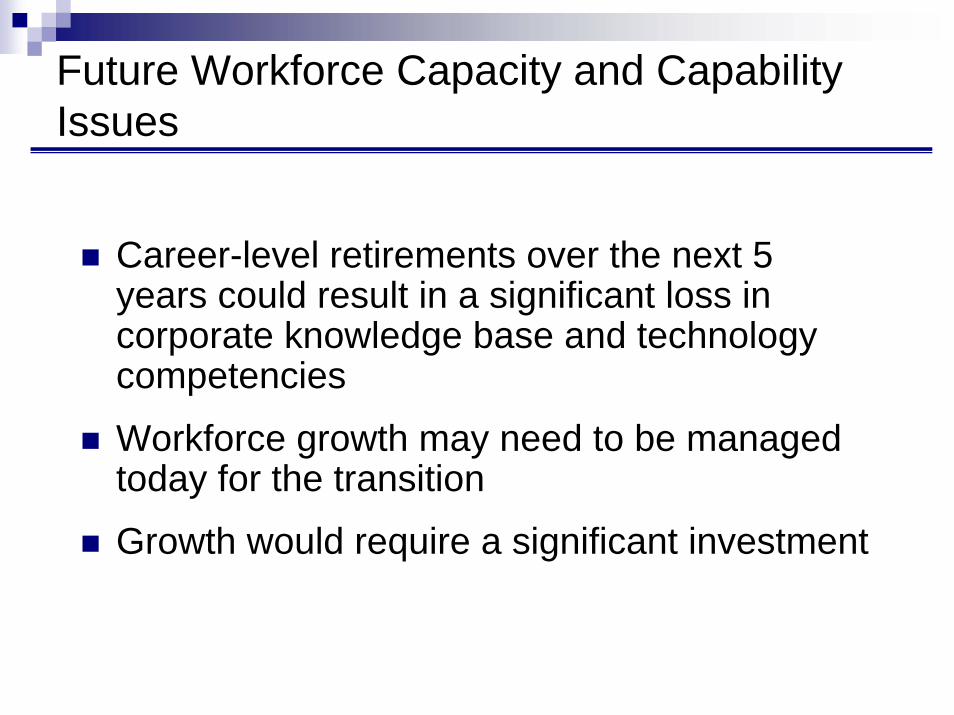
Future Workforce Capacity and Capability Issues
Career-level retirements over the next 5 years could result in a significant loss in corporate knowledge base and technology competencies
Workforce growth may need to be managed today for the transition
Growth would require a significant investment
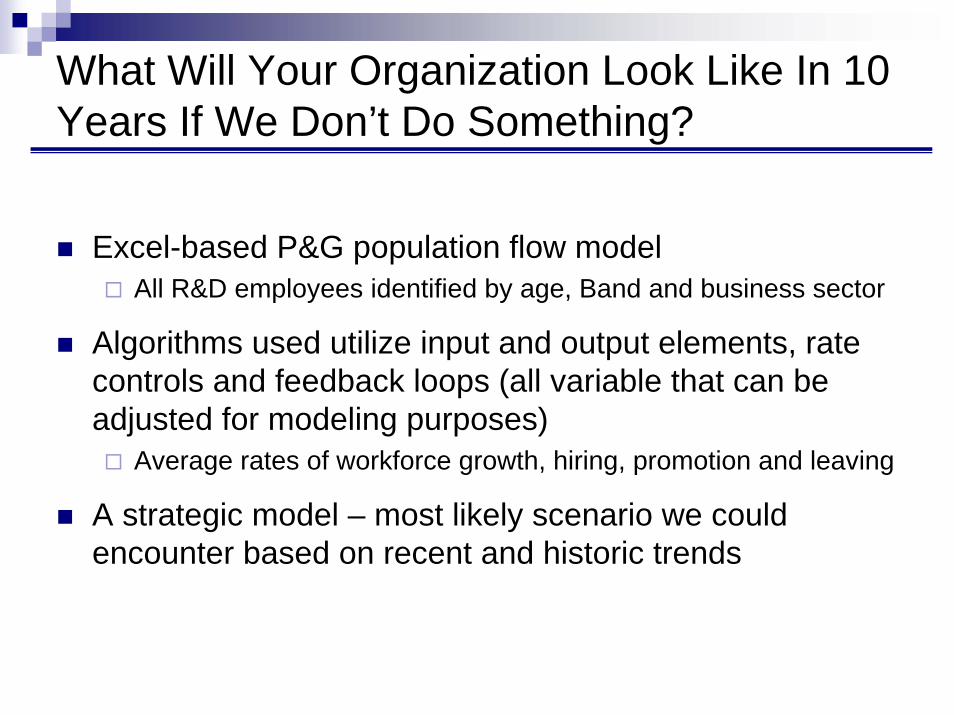
What Will Your Organization Look Like In 10 Years If We Don’t Do Something?
Excel-based P&G population flow modelAll R&D employees identified by age, Band and business sector
Algorithms used utilize input and output elements, rate controls and feedback loops (all variable that can be adjusted for modeling purposes)
Average rates of workforce growth, hiring, promotion and leaving
A strategic model – most likely scenario we could encounter based on recent and historic trends
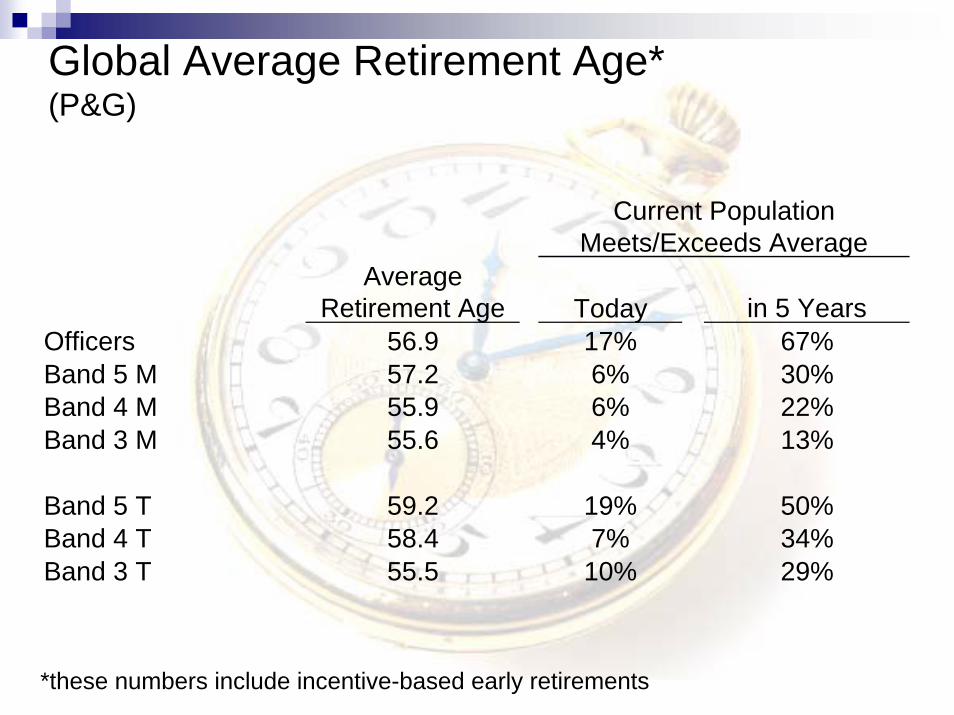
Global Average Retirement Age*(P&G)
Average Retirement Age Today in 5 Years
Officers 56.9 17% 67%Band 5 M 57.2 6% 30%Band 4 M 55.9 6% 22%Band 3 M 55.6 4% 13%
Band 5 T 59.2 19% 50%Band 4 T 58.4 7% 34%Band 3 T 55.5 10% 29%
Current Population Meets/Exceeds Average
*these numbers include incentive-based early retirements
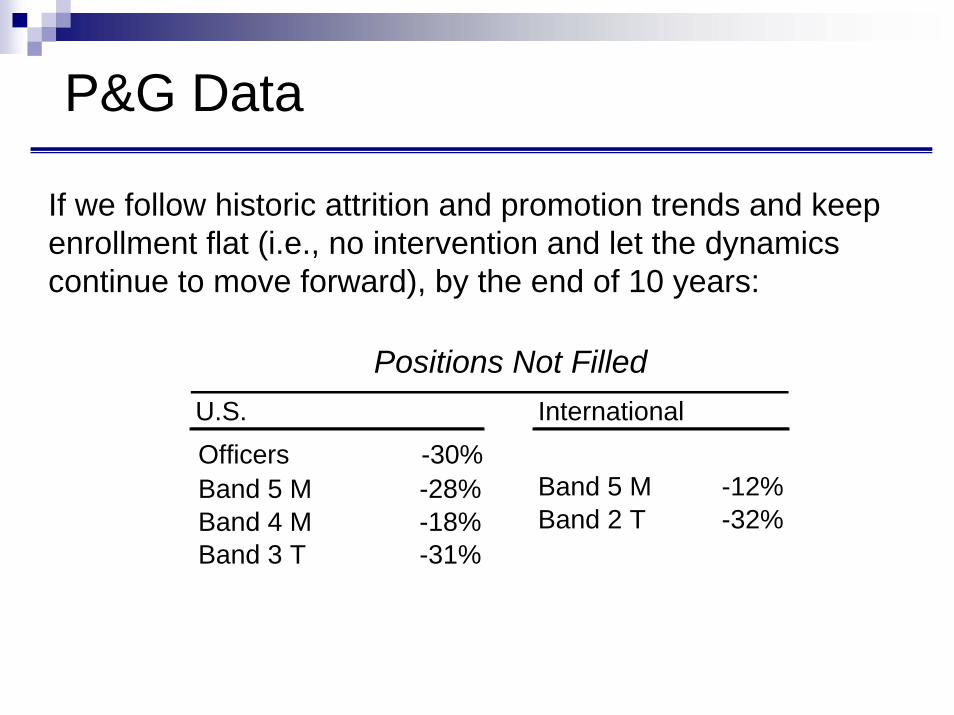
If we follow historic attrition and promotion trends and keep enrollment flat (i.e., no intervention and let the dynamics continue to move forward), by the end of 10 years:
P&G Data
U.S. International
Band 5 M -12%Band 5 M -28%Band 2 T -32%Band 4 M -18%
Band 3 T -31%
Positions Not Filled
Officers -30%
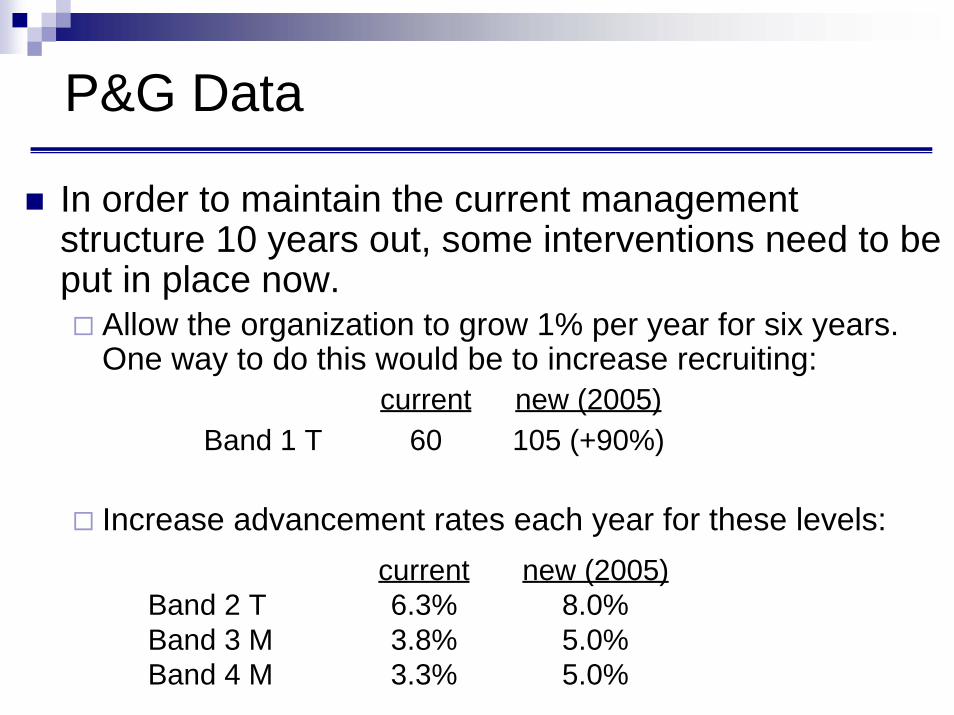
In order to maintain the current management structure 10 years out, some interventions need to be put in place now.
Allow the organization to grow 1% per year for six years. One way to do this would be to increase recruiting:
Increase advancement rates each year for these levels:
current new (2005)Band 1 T 60 105 (+90%)
current new (2005)Band 2 T 6.3% 8.0%Band 3 M 3.8% 5.0%Band 4 M 3.3% 5.0%
P&G Data
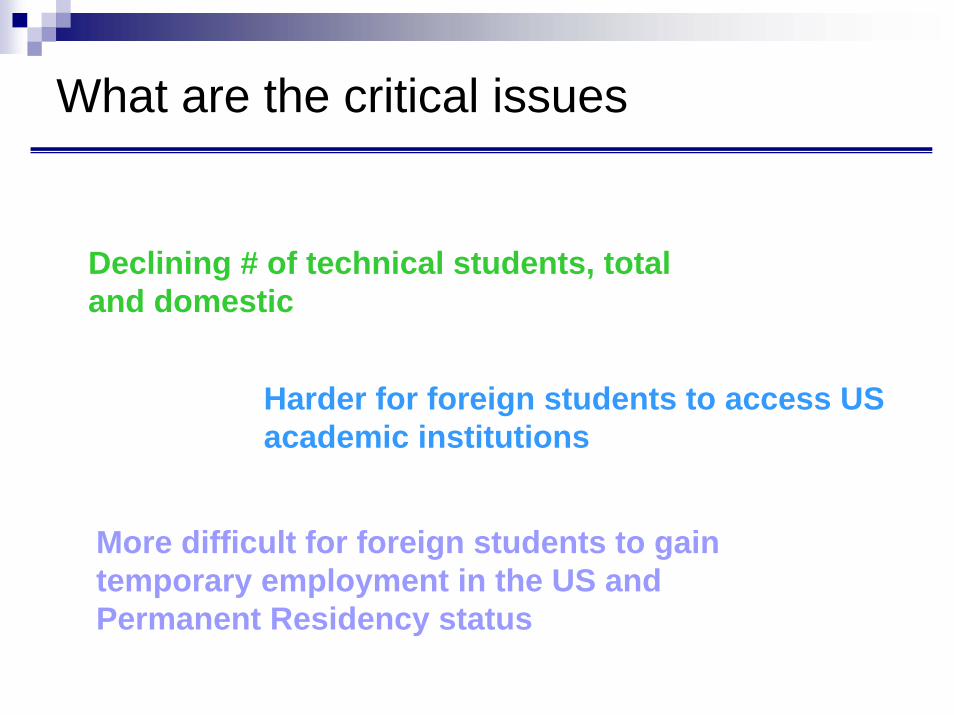
What are the critical issues
Declining # of technical students, total and domestic
Harder for foreign students to access US academic institutions
More difficult for foreign students to gain temporary employment in the US and Permanent Residency status
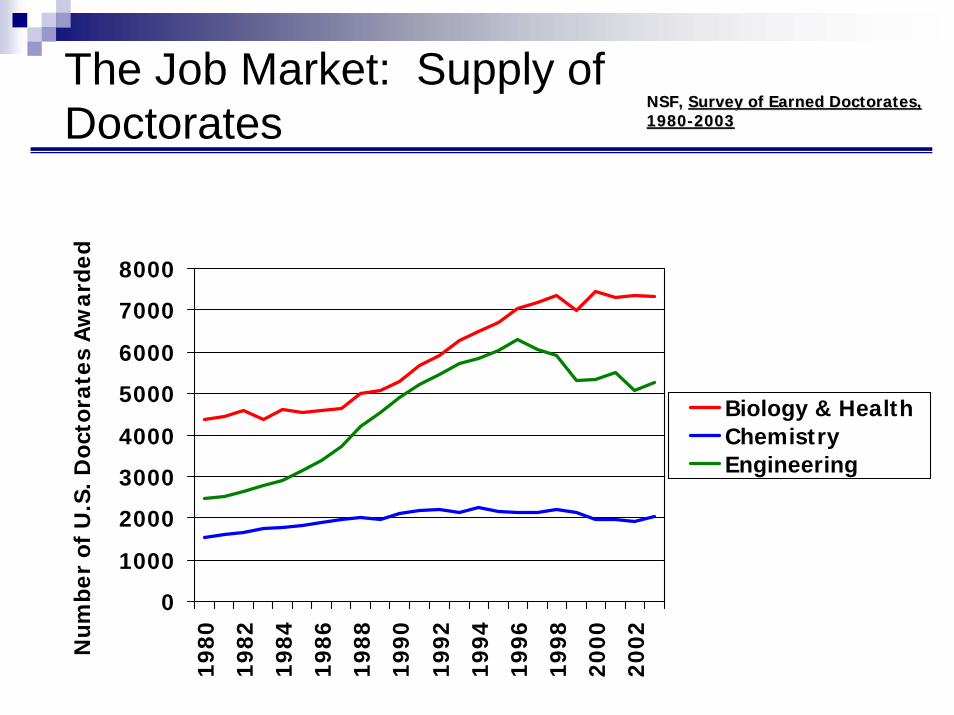
The Job Market: Supply of Doctorates
0
1000
2000
3000
4000
5000
6000
7000
8000
1980
1982
1984
1986
1988
1990
1992
1994
1996
1998
2000
2002Num
ber
of U
.S. D
octo
rate
s A
war
ded
Biology & HealthChemistryEngineering
NSF, NSF, Survey of Earned Doctorates,Survey of Earned Doctorates,19801980--20032003
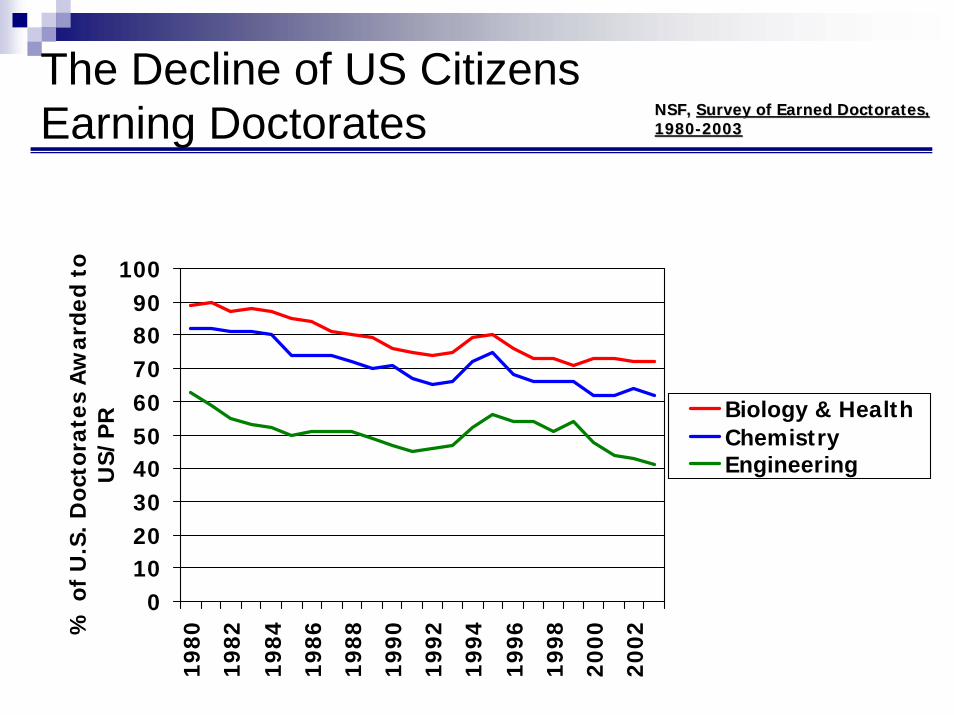
The Decline of US Citizens Earning Doctorates
0102030405060708090
100
1980
1982
1984
1986
1988
1990
1992
1994
1996
1998
2000
2002%
of
U.S
. Doc
tora
tes
Aw
arde
d to
U
S/P
R Biology & HealthChemistryEngineering
NSF, NSF, Survey of Earned Doctorates,Survey of Earned Doctorates,19801980--20032003
What are the critical issues
Lost networks and lost skills go with retiree
Long learning curve for technical and management positions

Summary Point
You should not wait to address this issue!

Better Practices
Managing Your Core Competencies
Dr. Dante RutstromEastman Chemical Company
Presented by: Stewart Witzeman
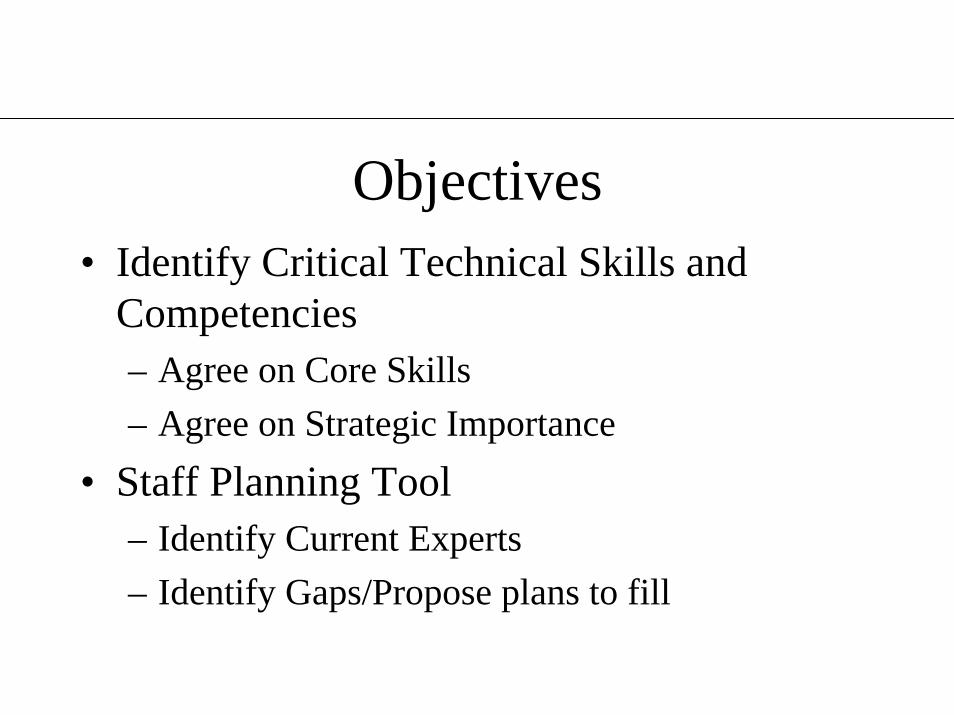
Objectives• Identify Critical Technical Skills and
Competencies– Agree on Core Skills– Agree on Strategic Importance
• Staff Planning Tool– Identify Current Experts– Identify Gaps/Propose plans to fill
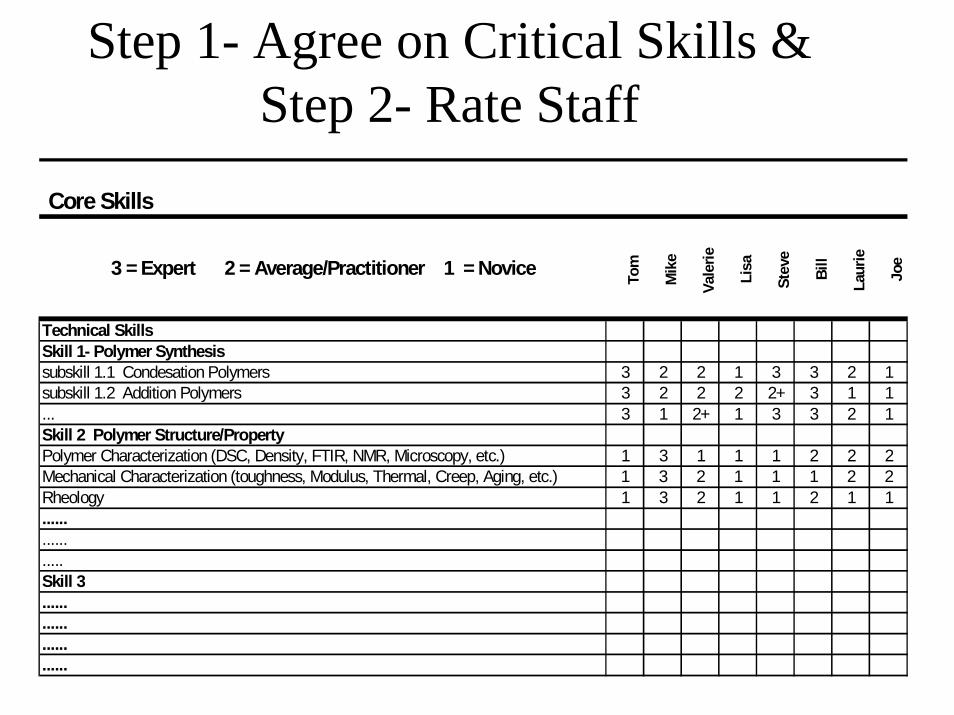
Step 1- Agree on Critical Skills & Step 2- Rate Staff
Core Skills
3 = Expert 2 = Average/Practitioner 1 = Novice Tom
Mik
e
Vale
rie
Lisa
Stev
e
Bill
Laur
ie
Joe
Technical SkillsSkill 1- Polymer Synthesissubskill 1.1 Condesation Polymers 3 2 2 1 3 3 2 1subskill 1.2 Addition Polymers 3 2 2 2 2+ 3 1 1... 3 1 2+ 1 3 3 2 1Skill 2 Polymer Structure/PropertyPolymer Characterization (DSC, Density, FTIR, NMR, Microscopy, etc.) 1 3 1 1 1 2 2 2Mechanical Characterization (toughness, Modulus, Thermal, Creep, Aging, etc.) 1 3 2 1 1 1 2 2Rheology 1 3 2 1 1 2 1 1.................Skill 3........................
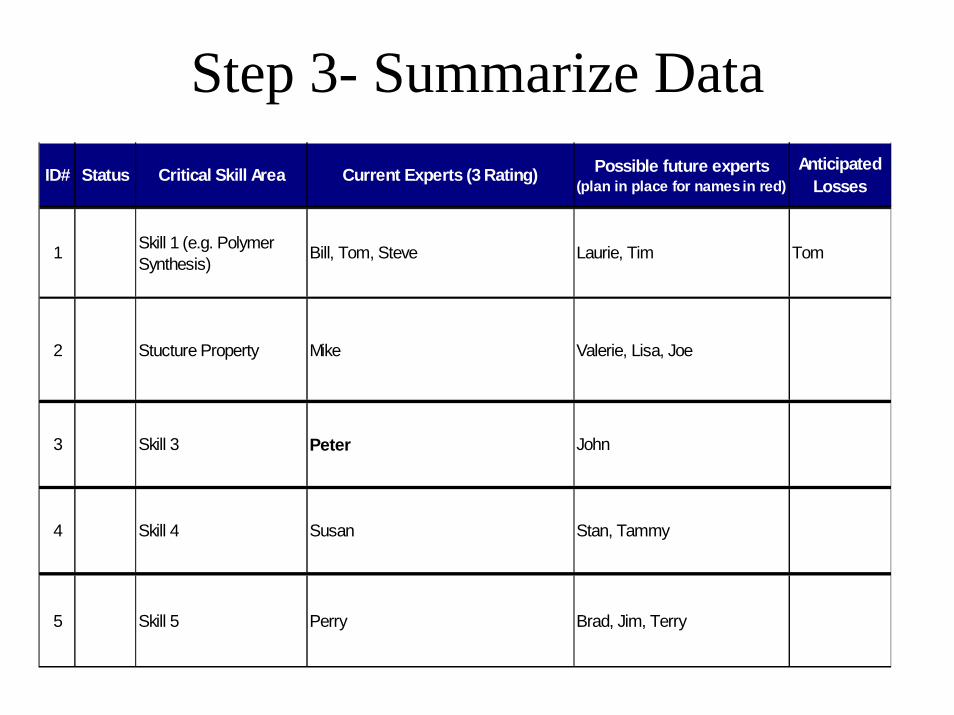
Step 3- Summarize DataID# Status Critical Skill Area Current Experts (3 Rating) Possible future experts
(plan in place for names in red)Anticipated
Losses
1 Skill 1 (e.g. Polymer Synthesis)
Bill, Tom, Steve Laurie, Tim Tom
2 Stucture Property Mike Valerie, Lisa, Joe
3 Skill 3 Peter John
4 Skill 4 Susan Stan, Tammy
5 Skill 5 Perry Brad, Jim, Terry
S ta tu s C o m p e te n c y S tra te g i c I m p o rta n c e
C a p a b i l i ty A sse ssm e n t
S k i l l 1 (e . g . P o ly m e r S y n th e s is ) 5 7 . 0 0W a tc h P o ly m e r S t ru c t u re / P ro p e rt y 4 4 . 0 0
C r it ic a l S k i l l 3 6 3 . 0 0S k i l l 4 5 6 . 3 0S k i l l 5 4 5 . 0 0S k i l l 6 7 5 . 7 07 6 . 5 6 . 5 08 5 . 6 2 . 8 0
C r it ic a l 9 7 2 . 8 01 0 4 5 . 6 01 1 5 4 . 9 01 2 6 3 . 5 0
C r it ic a l 1 3 6 4 . 0 01 4 4 2 . 2 01 5 5 . 5 4 . 0 0
W a tc h 1 6 6 . 5 4 . 0 0W a tc h 1 7 3 2 . 0 0
1 8 6 4 . 0 0W a tc h 1 9 4 . 9 5 . 0 0
2 0 6 . 8 7 . 0 02 1 6 . 3 7 . 0 02 2 7 6 . 5 02 3 6 5 . 9 0
C r it ic a l 2 4 5 4 . 0 0
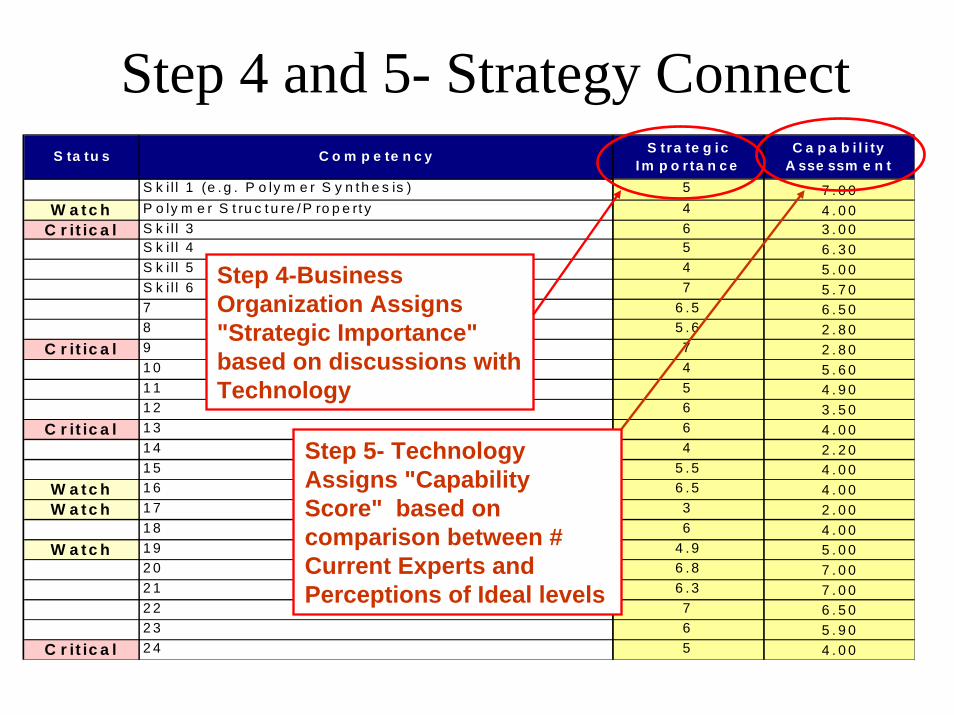
Step 4 and 5- Strategy Connect
Step 4-Business Organization Assigns "Strategic Importance" based on discussions with Technology
Step 5- Technology Assigns "Capability Score" based on comparison between # Current Experts and Perceptions of Ideal levels
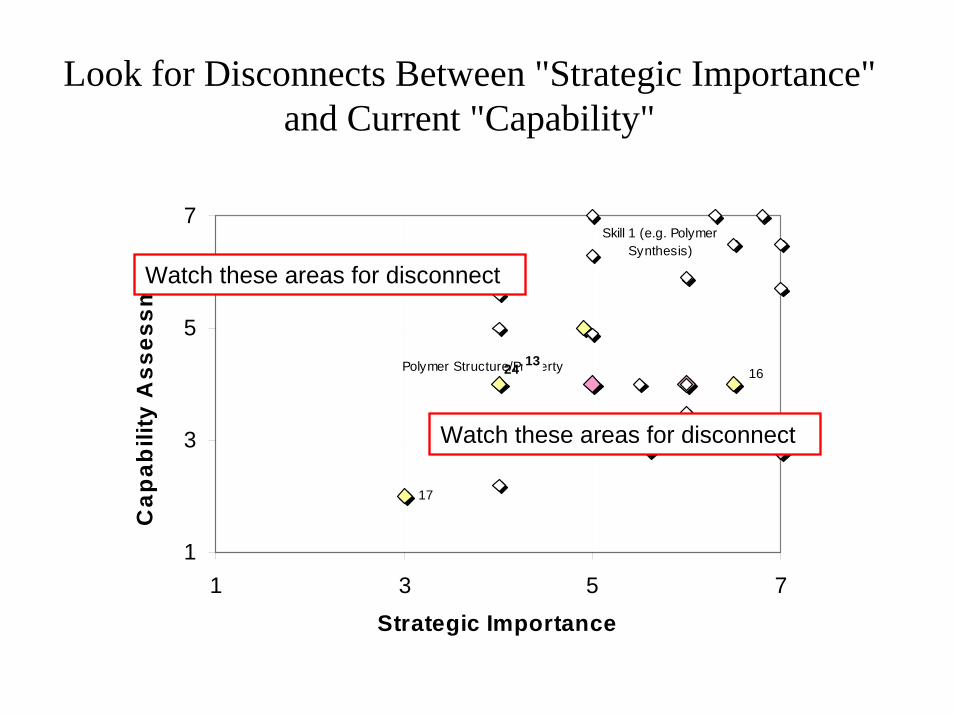
Look for Disconnects Between "Strategic Importance" and Current "Capability"
17
Skill 1 (e.g. Polymer Synthesis)
Polymer Structure/Property
9
131624
1
3
5
7
1 3 5 7
Strategic Importance
Cap
abili
ty A
sses
smeWatch these areas for disconnect
Watch these areas for disconnect
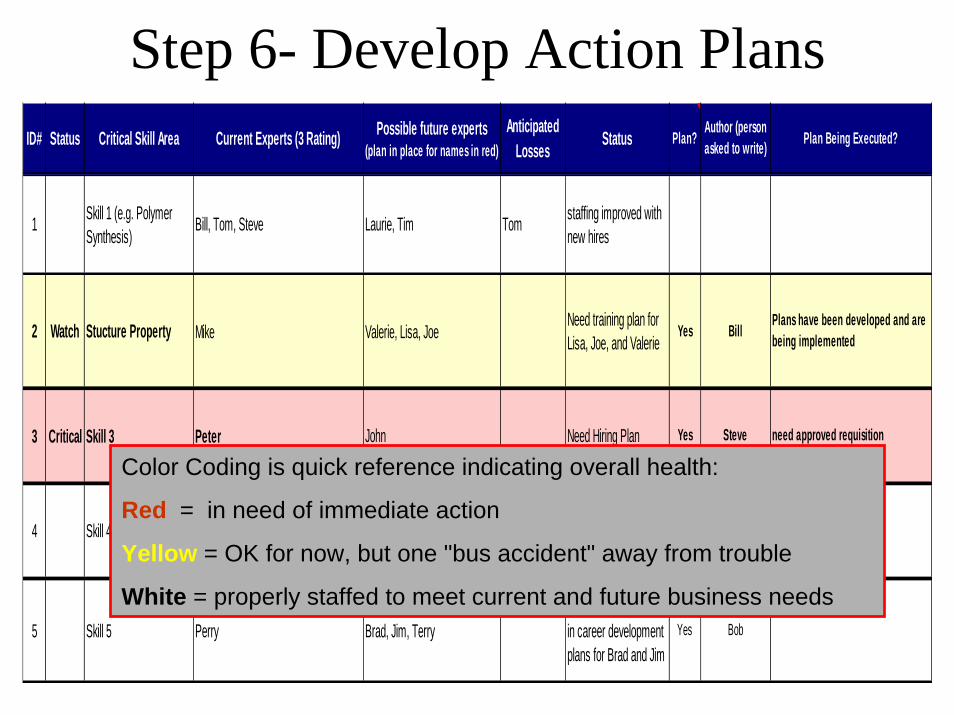
Step 6- Develop Action PlansID# Status Critical Skill Area Current Experts (3 Rating) Possible future experts
(plan in place for names in red)Anticipated
Losses Status Plan? Author (person asked to write) Plan Being Executed?
1 Skill 1 (e.g. Polymer Synthesis)
Bill, Tom, Steve Laurie, Tim Tom staffing improved with new hires
2 Watch Stucture Property Mike Valerie, Lisa, JoeNeed training plan for Lisa, Joe, and Valerie
Yes Bill Plans have been developed and are being implemented
3 Critical Skill 3 Peter John Need Hiring Plan Yes Steve need approved requisition
4 Skill 4 Susan Stan, Tammy
5 Skill 5 Perry Brad, Jim, TerryInclude training plans in career development plans for Brad and Jim
Yes Bob
Color Coding is quick reference indicating overall health:
Red = in need of immediate action
Yellow = OK for now, but one "bus accident" away from trouble
White = properly staffed to meet current and future business needs
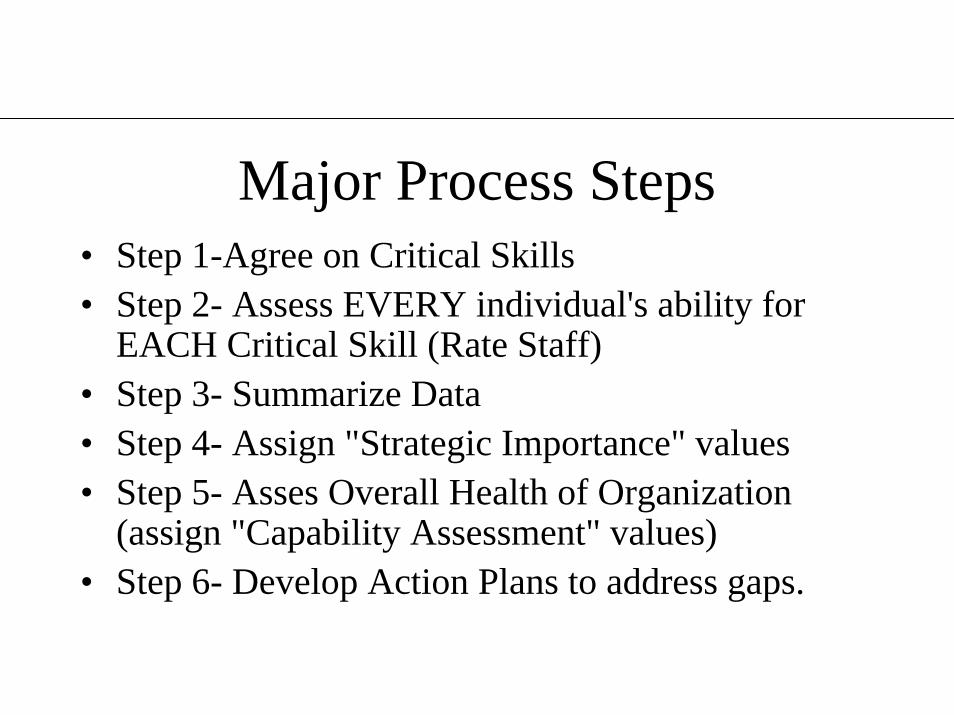
Major Process Steps• Step 1-Agree on Critical Skills • Step 2- Assess EVERY individual's ability for
EACH Critical Skill (Rate Staff)• Step 3- Summarize Data• Step 4- Assign "Strategic Importance" values • Step 5- Asses Overall Health of Organization
(assign "Capability Assessment" values)• Step 6- Develop Action Plans to address gaps.
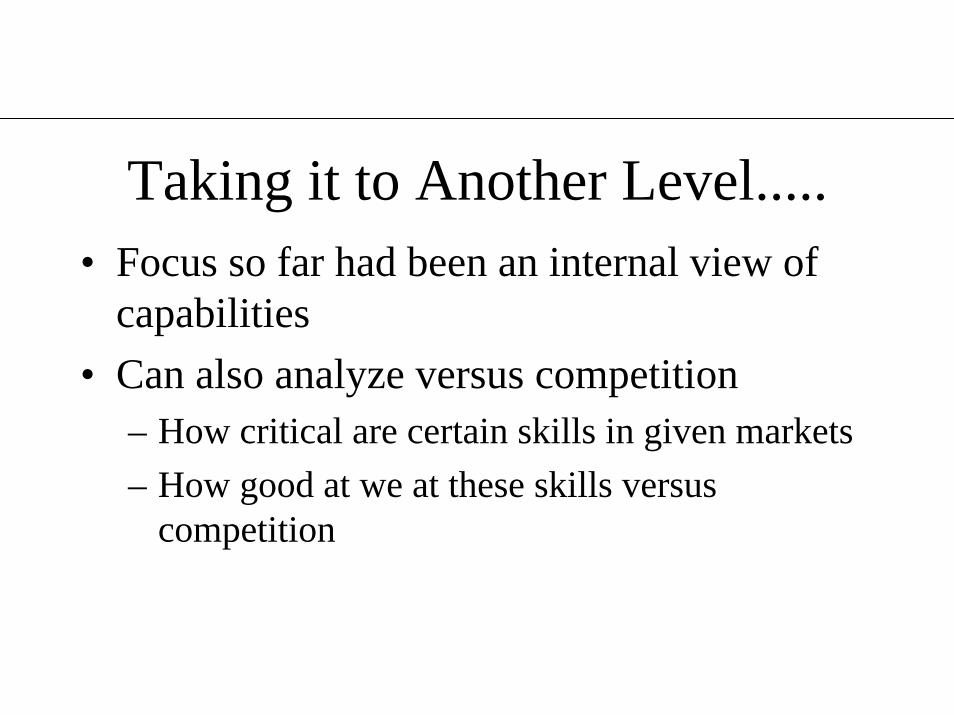
Taking it to Another Level.....• Focus so far had been an internal view of
capabilities• Can also analyze versus competition
– How critical are certain skills in given markets– How good at we at these skills versus
competition
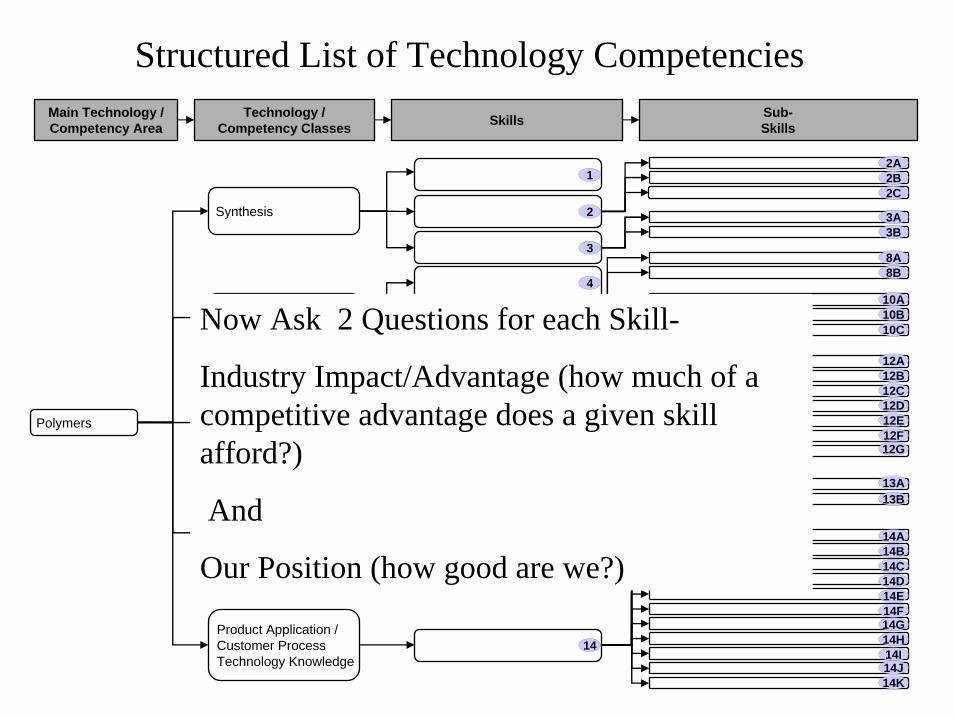
Structured List of Technology Competencies
)
Product Application / Customer Process Technology Knowledge
Manufacture
Formulating
Analysis
Synthesis
Polymers
Sub-Skills
Technology / Competency Classes SkillsMain Technology /
Competency Area
2A2B2C
3A3B
1
2
3
4
5
6
7
8
9
10
11
12
13
14
14C
14A14B
14F
14D14E
14I
14G14H
14J14K
13A13B
8A8B
12C
12A12B
12F
12D12E
12G
10A10B10CNow Ask 2 Questions for each Skill-
Industry Impact/Advantage (how much of a competitive advantage does a given skill afford?)
And
Our Position (how good are we?)
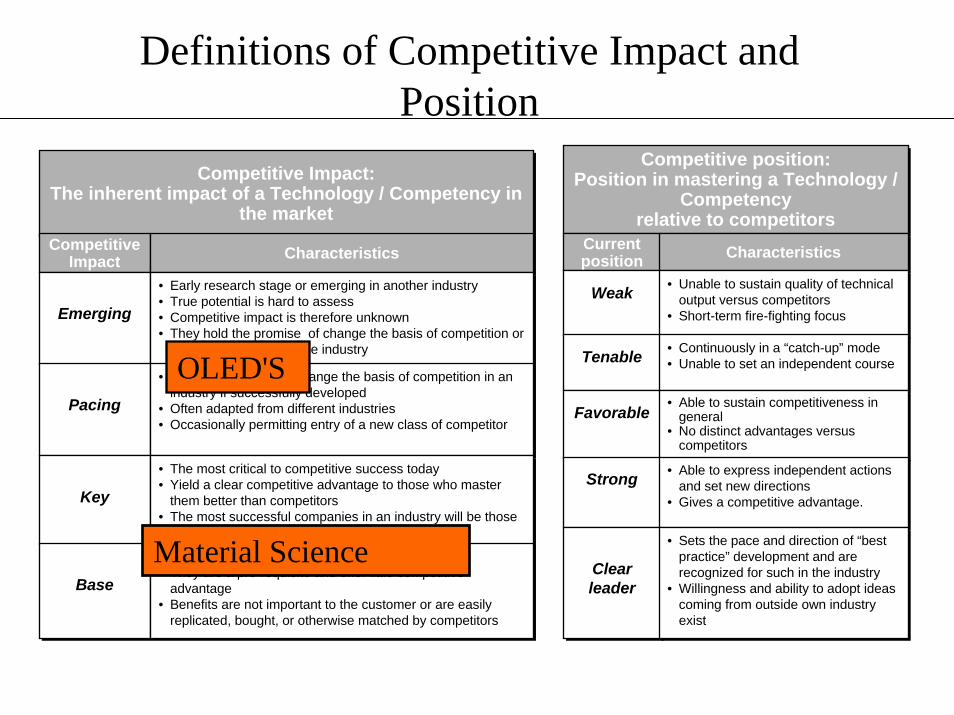
Definitions of Competitive Impact and Position
Competitive position: Position in mastering a Technology /
Competencyrelative to competitors
Competitive position: Position in mastering a Technology /
Competencyrelative to competitors
Competitive Impact: The inherent impact of a Technology / Competency in
the market
Competitive Impact: The inherent impact of a Technology / Competency in
the marketCurrentpositionCurrentposition CharacteristicsCharacteristics
WeakWeak • Unable to sustain quality of technical output versus competitors
• Short-term fire-fighting focus
• Unable to sustain quality of technical output versus competitors
• Short-term fire-fighting focus
Competitive Impact
Competitive Impact CharacteristicsCharacteristics
TenableTenable • Continuously in a “catch-up” mode• Unable to set an independent course• Continuously in a “catch-up” mode• Unable to set an independent course
FavorableFavorable • Able to sustain competitiveness in general
• No distinct advantages versus competitors
• Able to sustain competitiveness in general
• No distinct advantages versus competitors
StrongStrong • Able to express independent actions and set new directions
• Gives a competitive advantage.
• Able to express independent actions and set new directions
• Gives a competitive advantage.
ClearleaderClearleader
• Sets the pace and direction of “best practice” development and are recognized for such in the industry
• Willingness and ability to adopt ideas coming from outside own industry exist
• Sets the pace and direction of “best practice” development and are recognized for such in the industry
• Willingness and ability to adopt ideas coming from outside own industry exist
EmergingEmerging• Early research stage or emerging in another industry• True potential is hard to assess • Competitive impact is therefore unknown• They hold the promise of change the basis of competition or
radically transforming the industry
• Early research stage or emerging in another industry• True potential is hard to assess • Competitive impact is therefore unknown• They hold the promise of change the basis of competition or
radically transforming the industry
PacingPacing • Often adapted from different industries • Occasionally permitting entry of a new class of competitor
• Have the potential to change the basis of competition in an industry if successfully developed
• Have the potential to change the basis of competition in an industry if successfully developed
• Often adapted from different industries • Occasionally permitting entry of a new class of competitor
KeyKey• The most critical to competitive success today• Yield a clear competitive advantage to those who master
them better than competitors• The most successful companies in an industry will be those
most proficient in them
• The most critical to competitive success today• Yield a clear competitive advantage to those who master
them better than competitors• The most successful companies in an industry will be those
most proficient in them
BaseBase advantage• Benefits are not important to the customer or are easily
replicated, bought, or otherwise matched by competitors
• Widespread and shared throughout the industry• They are a pre-requisite and offer little competitive • Widespread and shared throughout the industry• They are a pre-requisite and offer little competitive
advantage• Benefits are not important to the customer or are easily
replicated, bought, or otherwise matched by competitors
OLED'S
Material Science
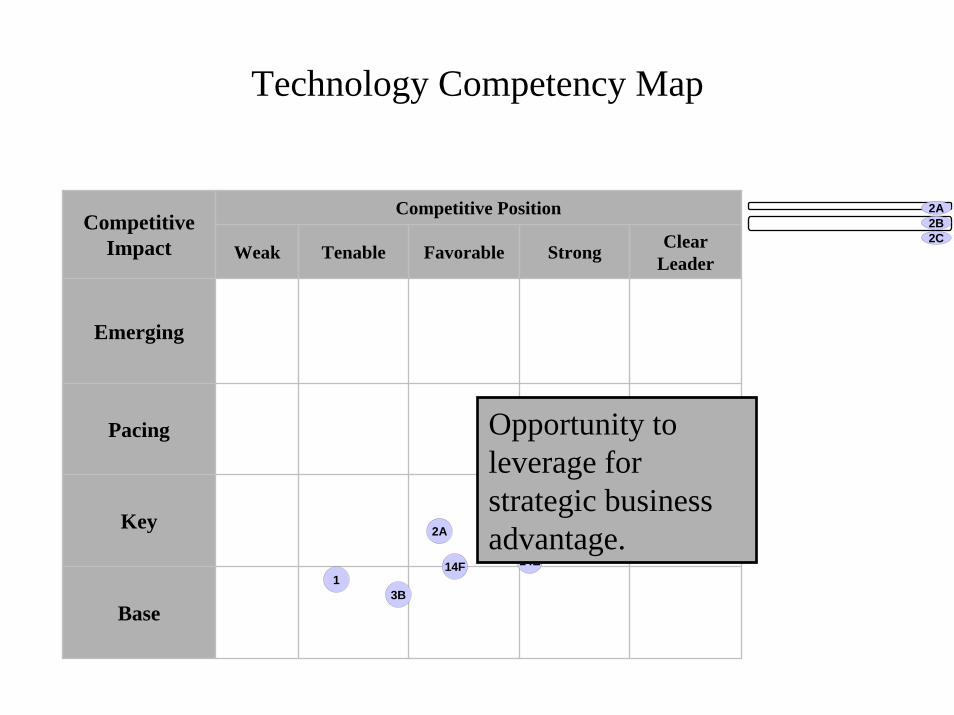
Technology Competency Map
Competitive PositionCompetitive
Impact Weak
Emerging
Pacing
Tenable Favorable Strong Clear Leader
Key
Base
11
3B
3A2A
14E14F1
2A2B2C
Opportunity to leverage for strategic business advantage.
Accessing Retiree Skills
Mike KostrzewaExecutive Vice [email protected] N. Meridian Street, Suite 802Indianapolis, IN 46204317.226.9301
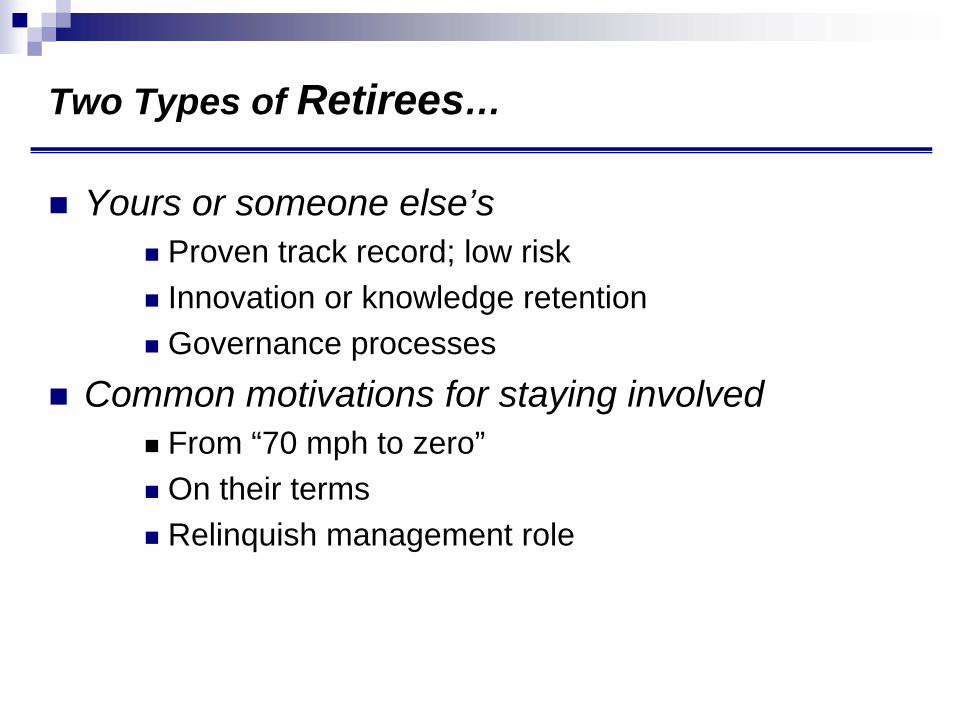
Two Types of Retirees…
Yours or someone else’sProven track record; low riskInnovation or knowledge retentionGovernance processes
Common motivations for staying involvedFrom “70 mph to zero”On their termsRelinquish management role
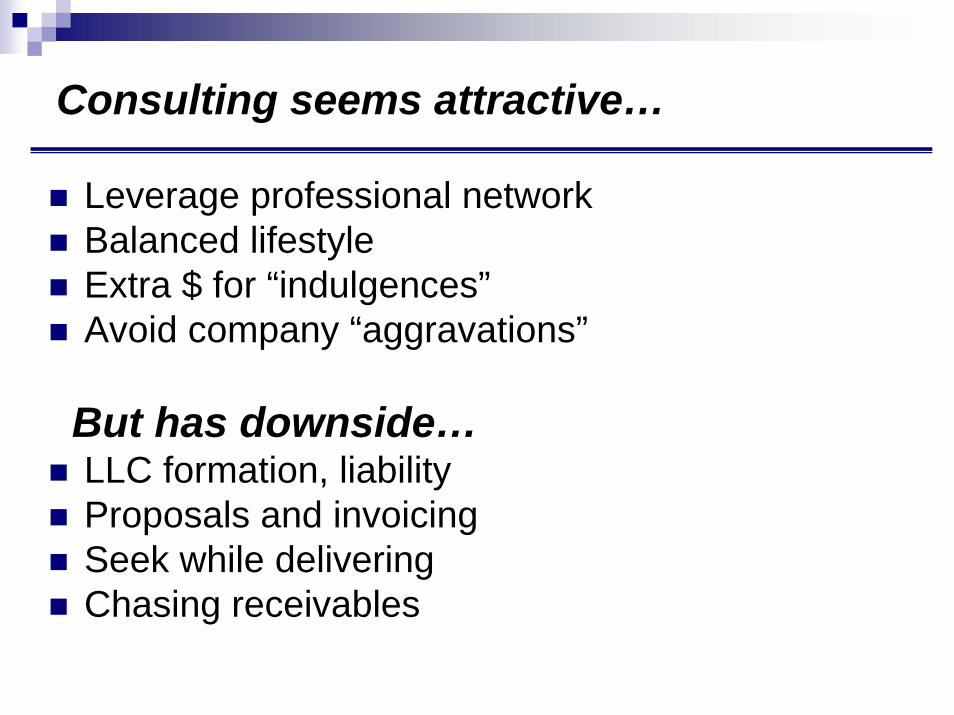
Consulting seems attractive…
Leverage professional network Balanced lifestyleExtra $ for “indulgences”Avoid company “aggravations”
But has downside…LLC formation, liability Proposals and invoicing Seek while deliveringChasing receivables
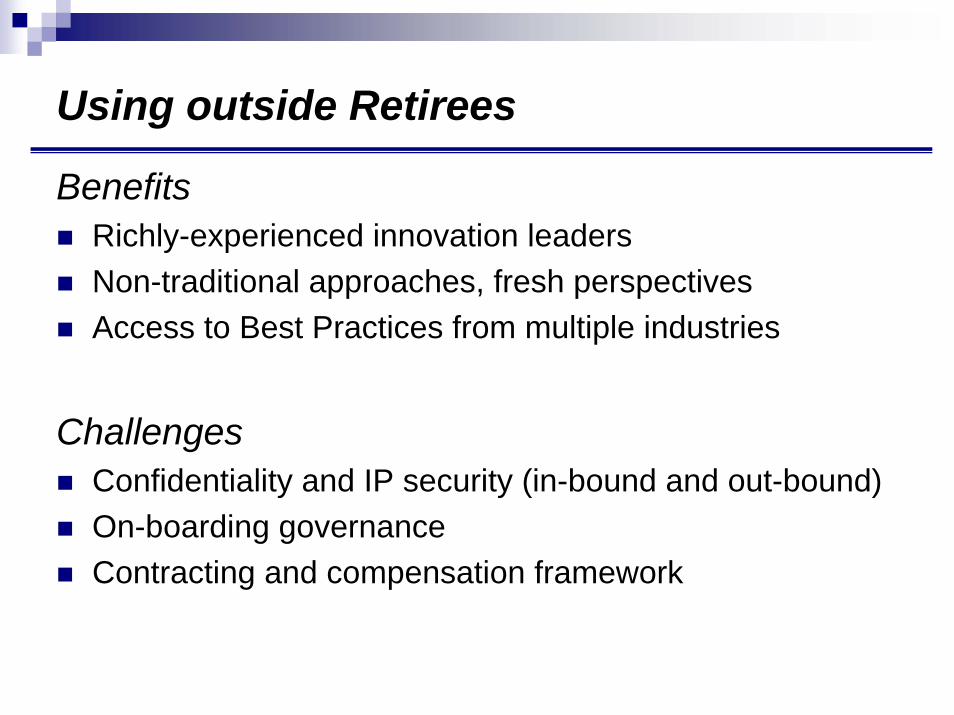
Using outside Retirees
BenefitsRichly-experienced innovation leadersNon-traditional approaches, fresh perspectivesAccess to Best Practices from multiple industries
ChallengesConfidentiality and IP security (in-bound and out-bound)On-boarding governanceContracting and compensation framework
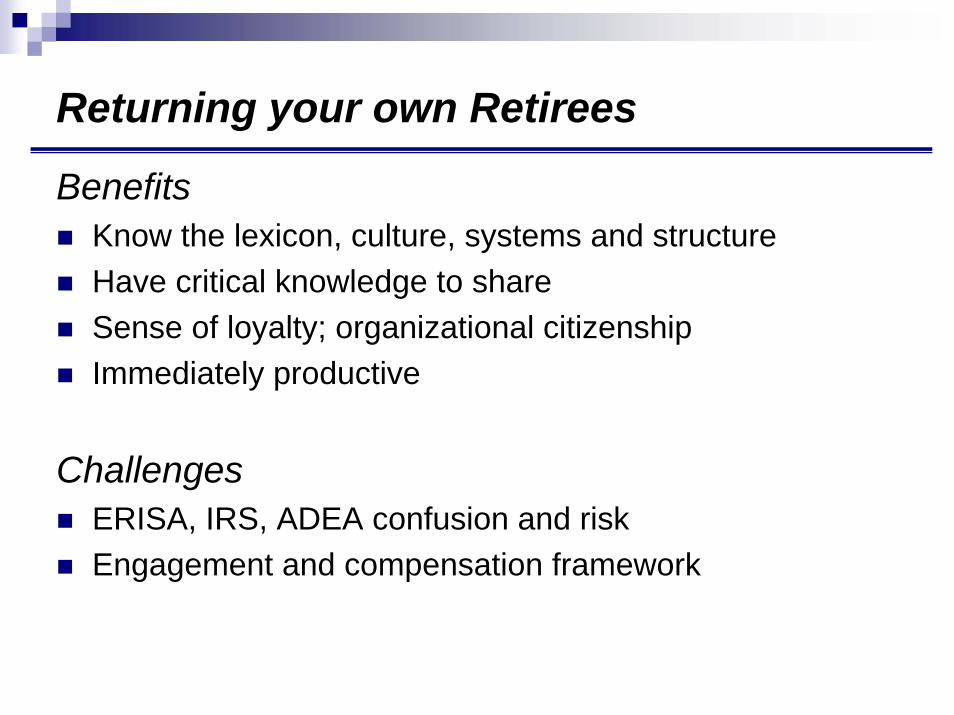
Returning your own Retirees
BenefitsKnow the lexicon, culture, systems and structureHave critical knowledge to shareSense of loyalty; organizational citizenshipImmediately productive
ChallengesERISA, IRS, ADEA confusion and riskEngagement and compensation framework
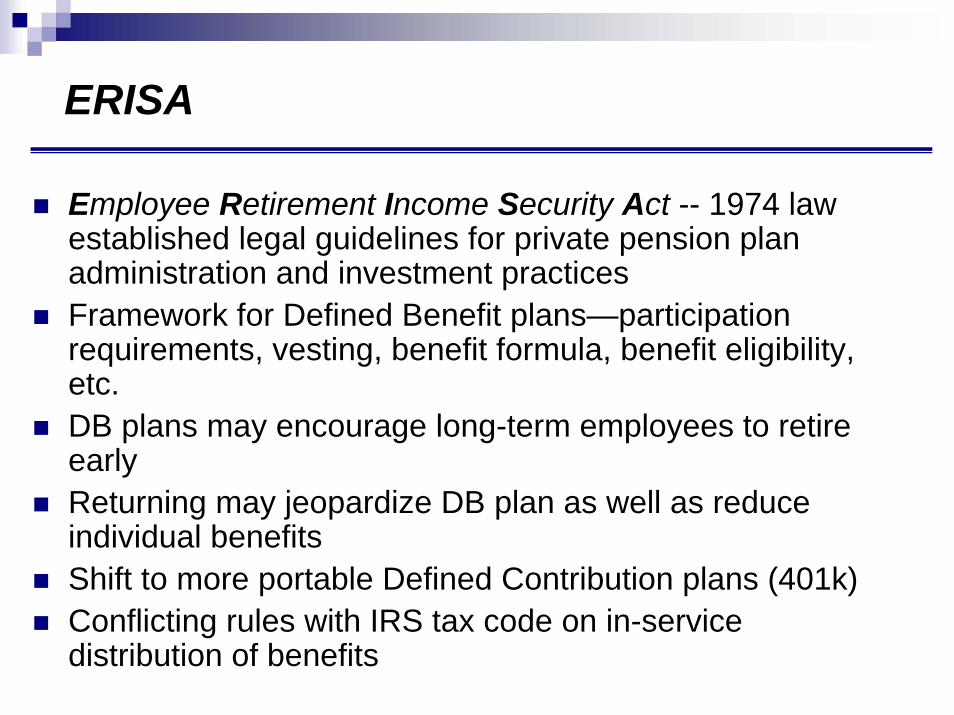
ERISA
Employee Retirement Income Security Act -- 1974 law established legal guidelines for private pension plan administration and investment practices Framework for Defined Benefit plans—participation requirements, vesting, benefit formula, benefit eligibility, etc.DB plans may encourage long-term employees to retire early Returning may jeopardize DB plan as well as reduce individual benefits Shift to more portable Defined Contribution plans (401k)Conflicting rules with IRS tax code on in-service distribution of benefits
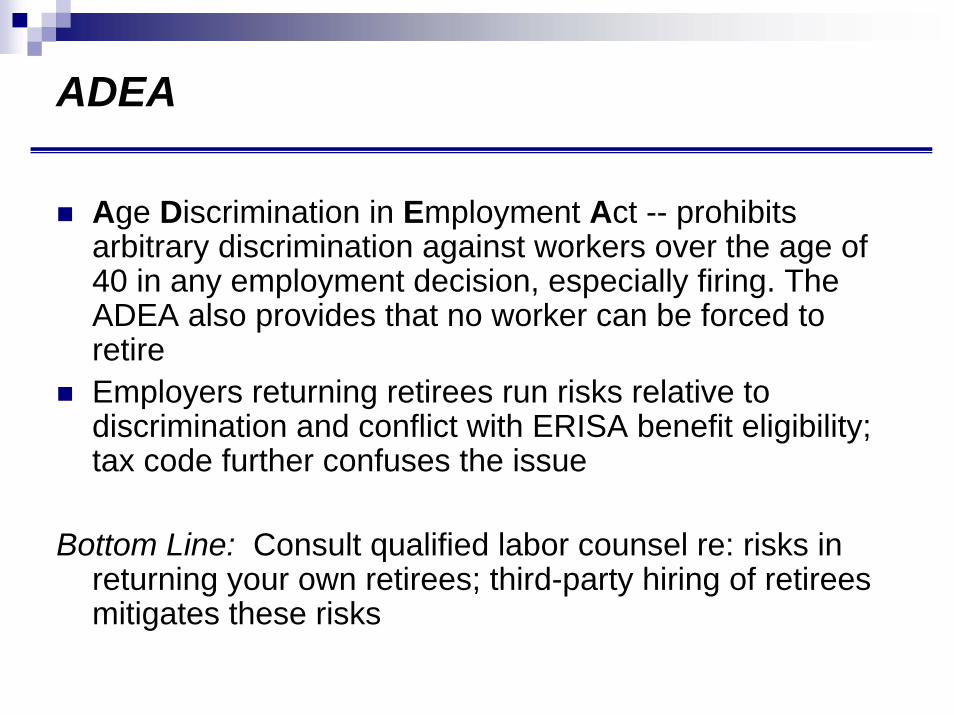
ADEA
Age Discrimination in Employment Act -- prohibits arbitrary discrimination against workers over the age of 40 in any employment decision, especially firing. The ADEA also provides that no worker can be forced to retireEmployers returning retirees run risks relative to discrimination and conflict with ERISA benefit eligibility; tax code further confuses the issue
Bottom Line: Consult qualified labor counsel re: risks in returning your own retirees; third-party hiring of retirees mitigates these risks
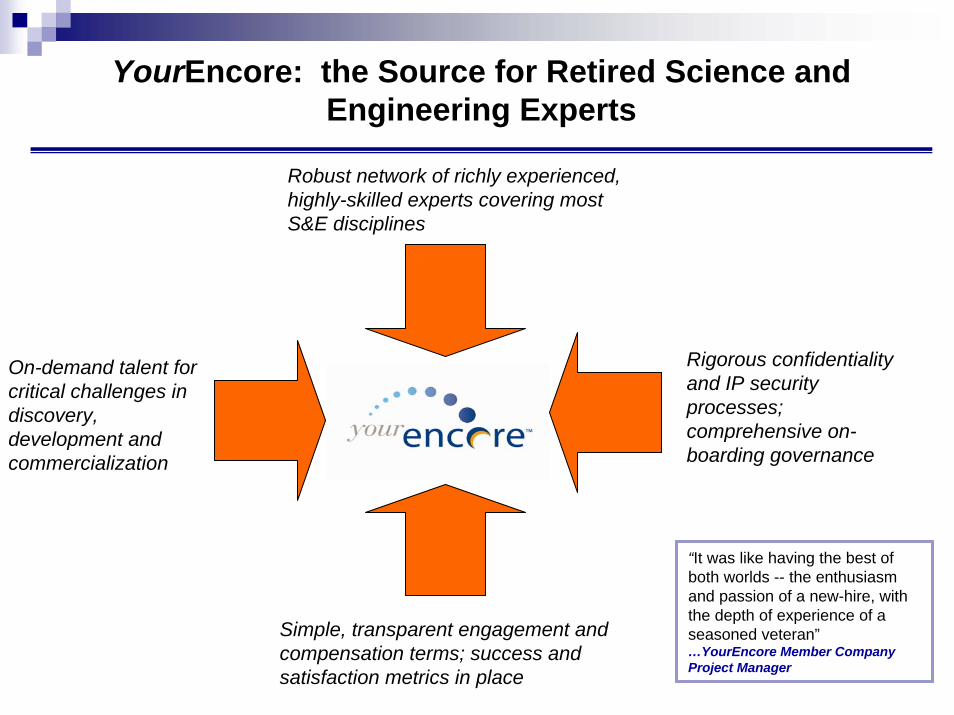
YourEncore: the Source for Retired Science and Engineering Experts
Robust network of richly experienced, highly-skilled experts covering most S&E disciplines
Rigorous confidentiality and IP security processes; comprehensive on-boarding governance
On-demand talent for critical challenges in discovery, development and commercialization
Simple, transparent engagement and compensation terms; success and satisfaction metrics in place
“It was like having the best of both worlds -- the enthusiasm and passion of a new-hire, with the depth of experience of a seasoned veteran”…YourEncore Member Company Project Manager
Fast Tracking & Retaining “trough’ personnel
Objective Today
Pursuing the silver bullet solutions
What does your business look like?
Understand the hidden costs of “lost knowledge”
Learn about better practices.
Analyze Your Business
Look at your workforce.What knowledge/skills must be retained?
Do your currently have a competitive advantage?
Knowledge that is vulnerable?
Could knowledge go to the competitor?
Resourced from “Lost Knowledge: Confronting The Threat Of An Aging Workforce” by David Delong
Analyze Your Business
Do you support knowledge retention?
“Do your employees believe the company is being managed in a way that considers their interest as well as those of the shareholders?”
Taken from “Lost Knowledge: Confronting The Threat Of An Aging Workforce” by David Delong
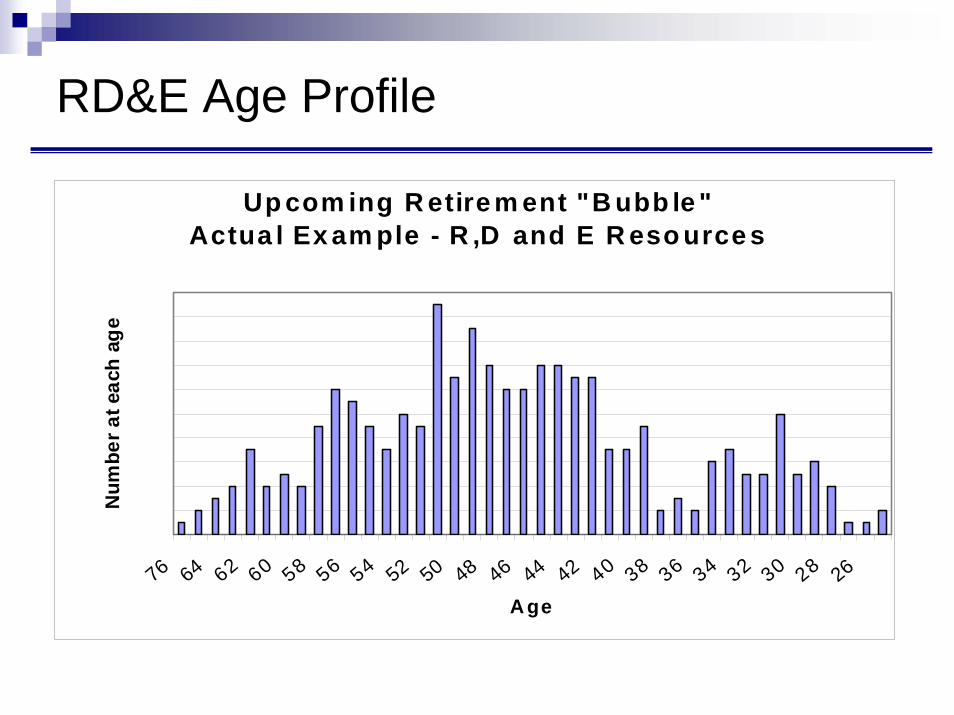
RD&E Age Profile
Up com ing R etire m ent "B ubb le "Actua l Ex am ple - R ,D and E R eso urce s
76 64 62 60 58 56 54 52 50 48 46 44 42 40 38 36 34 32 30 28 26
A ge
Num
ber a
t eac
h ag
e
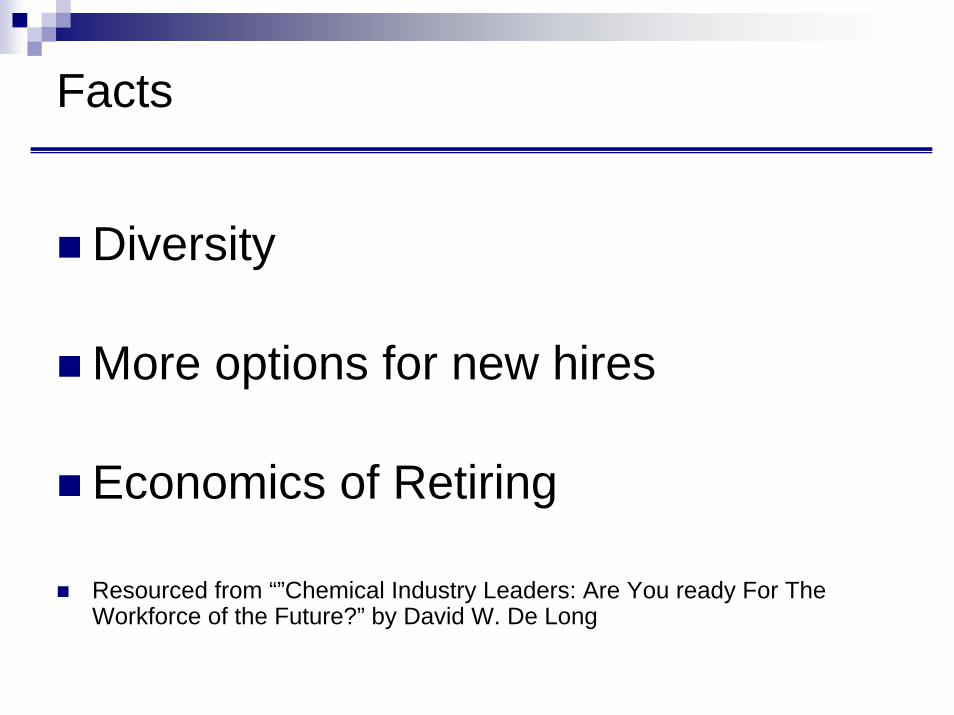
Facts
Diversity
More options for new hires
Economics of Retiring
Resourced from “”Chemical Industry Leaders: Are You ready For The Workforce of the Future?” by David W. De Long
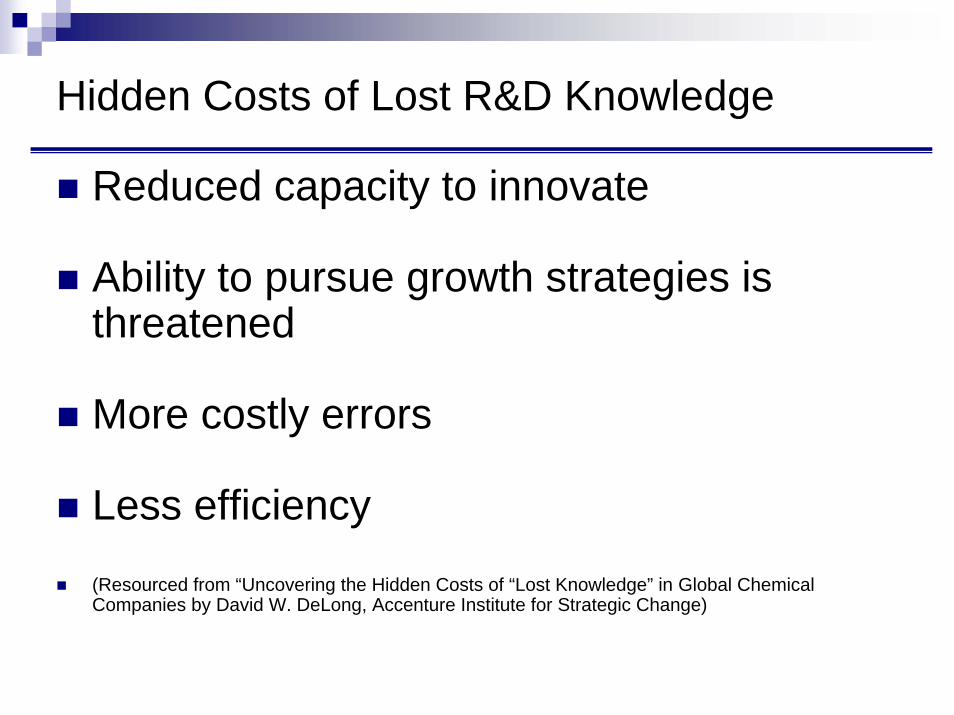
Hidden Costs of Lost R&D Knowledge
Reduced capacity to innovate
Ability to pursue growth strategies is threatened
More costly errors
Less efficiency
(Resourced from “Uncovering the Hidden Costs of “Lost Knowledge” in Global Chemical Companies by David W. DeLong, Accenture Institute for Strategic Change)
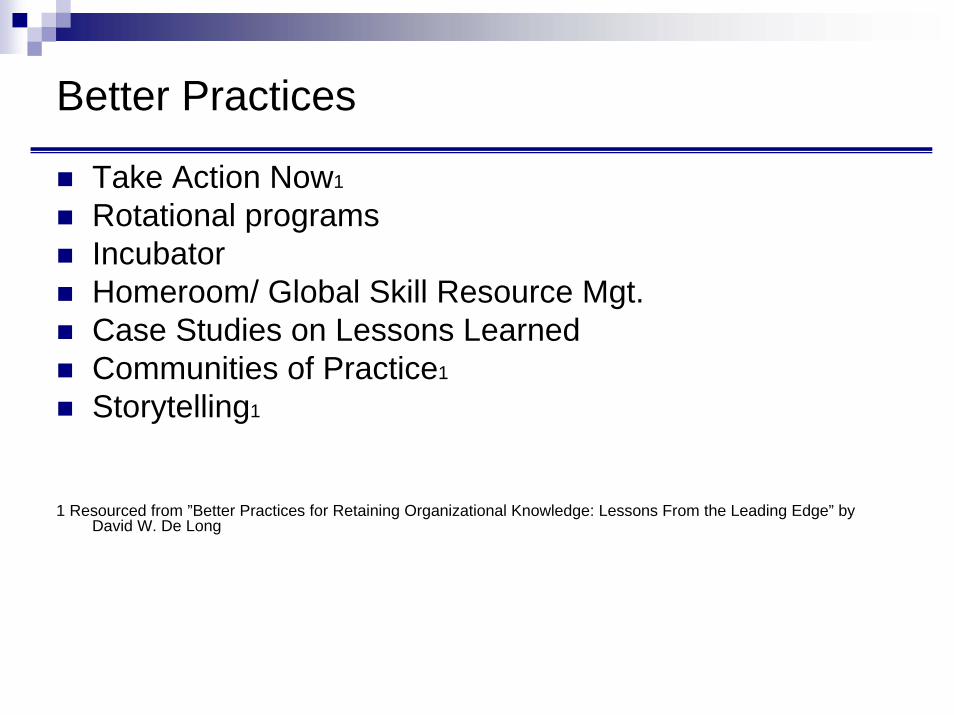
Better Practices
Take Action Now1
Rotational programsIncubator Homeroom/ Global Skill Resource Mgt.Case Studies on Lessons LearnedCommunities of Practice1
Storytelling1
1 Resourced from ”Better Practices for Retaining Organizational Knowledge: Lessons From the Leading Edge” by David W. De Long
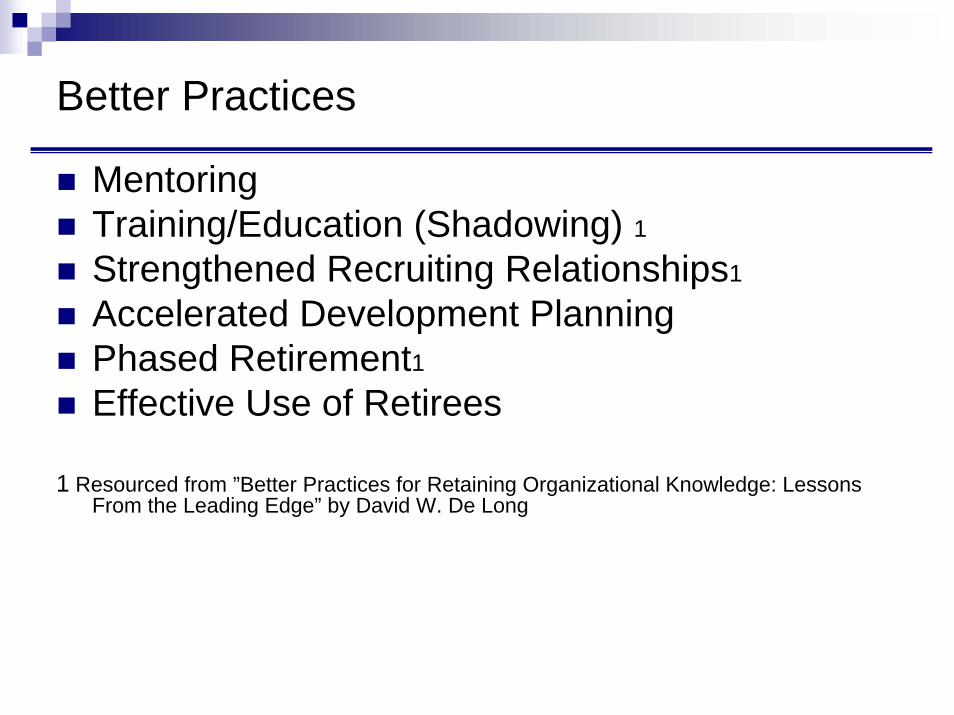
Better Practices
MentoringTraining/Education (Shadowing) 1Strengthened Recruiting Relationships1
Accelerated Development PlanningPhased Retirement1Effective Use of Retirees
1 Resourced from ”Better Practices for Retaining Organizational Knowledge: LessonsFrom the Leading Edge” by David W. De Long
Retention StrategiesUnderstand your organizations current skill and knowledge base.
Develop succession planning for your key employees
Retain Employees1 LHH Strategic Framework
Understand what motivates your top performers. Do you have development plans in place for these people?2
Challenging workLevel of responsibilityCareer AdvancementSalary / wagesJob security
1 Taken from Lee Hecht Harrison2 Resourced from Employee Resource Council 2005Job Attribute Importance Survey Results
Retention Strategies
How do we encourage highly skilled older employees to stay?1
Pension plan regulationsRespect from younger workforce
Resourced from “Lost Knowledge: Confronting The Threat Of An Aging Workforce”by David Delong
Final thought
Top Performer asked why he was leaving organization during the exit interview.
Response was....
“No one asked me to stay.”
Taken from Employee Resource Council

Questions ?
Facilitated Better Practices Development
What are other “Better Practices”?Break into tables of 5 - bring back and present to entire group:
Two “Better Practices”: that have not been covered.
Final Deliverable: Share “Better Practices”with those who attend SIS.
![· strawman:classes_with_trait_composition [ES Wiki] [[strawman: classes_with_trait_composition]] ES Wiki Trace: » strawman » completion_reform » proxy_drop_receiver](https://img.pdfslide.us/doc/110x75/5f5adf2cd54bbc484256e8da/strawmanclasseswithtraitcomposition-es-wiki-strawman-classeswithtraitcomposition.jpg)