Embed Size (px)
Citation preview
doi:10.2489/jswc.68.s.349
Root:shoot ratios and belowground biomass distribution for Pacific Northwest dryland crops J.D. Williams, O.K. McCool, C.L. Reardon, C.L. Douglas, Jr., S.L. Albrecht, and R.W. Rickman
Abstract: Roots, cereal crowns, and stems growing beneath the soil surface provide important resistance to soil erosion. Understanding the amount and distribution of this material in the soil profile could provide insight into resistance to soil erosion by water and improve the performance of soil erosion models, such as the revised universal soil loss equation (RUSLE) and the water erosion prediction project (WEPP). Erosion models use built-in or e>..'ternal crop growth models to populate crop yield and live aboveground and associated belowground biomass databases. We e>..-atnined two data sets from the dryland small grain production region in the Pacific Northwest of the United States to determine root:shoot ratios, the vertical distribution of root and attached belowground biomass, and incorporated residue from previously grown crops. Data were collected in 1993, 1994, 1995, and 2000 from short-term no-till and conventional tillage e.'\."}Jeriments conducted near Pendleton, Oregon, and Pullman, Washington, and in 1999 and 2000 from long-term experiments representative of farming practices near Pendleton, Oregon. T he crops sampled in the short-term data set included soft white winter and spring wheat (Tritiamt aestivum L.;WW and SW, respectively), spring peas (Pisrmr sativum L.; SP), and "vinter canola (Bmssica napus L.;WC) . Crops sampled in the long-term study included WW, SW, and SP. D ata were collected at harvest in both data sets and during three phenologic stages in each of the crops in the short-term data set. Soil samples were collected to a depth of 60 em (23.6 in) in the short-term and 30 em (11.9 in) in the long-term experiments. In both sets of measurements, we found greater than 70% of root mass is in the top 10 em (3.9 in) of the soil profile "vith the e.'Cception ofSP, which had 70% of root mass in the top 15 em (5.9 in) of the soil profile.WC produced significantly more biomass near the soil surface than WW, SW, or SP. Root-to-shoot biomass ratios in mature wheat ranged from 0. 13 to 0.17 in the top 30 em (11.9 in) of the soil profile, substantially lower than values suggested for use in WEPP (0.25). In the long-term e>..'Periments, soil of the conventionally tilled continuous winter wheat (CWW) plots contained significantly greater biomass than soil of conventionally tilled winter wheat/ fallow (CR ) and no-till "vinter wheat/fallow (NT) treatments. There was no significant difference bet\veen CWW and conventionally tilled winter wheat/spring pea (WP); however, CWW returned more residue to the soil than WP because SP produced less residue and these residues were incorporated with a field cultivator rather than a moldboard plow. More accurate representation of root development, particularly in winter crops, could improve RUSLE and WEPP perfonnance in the Pacific Northwest where winter conditions have proven difficult to model.
Key words: canola- incorporated residue-peas- root mass- root-shoot ratio-wheat
A Mediterranean climate of wet, cool winters and dry, hot summers has proven to be optimal conditions for dryland small grain production on the Columbia Plateau in the Pacific Northwest, United States (PNW). Annual precipitation constrains cropping practices across the region, "vith crops
JOURNAL OF SOIL AND WATER CONSERVATION
grown biemually in the drier areas of central Washington and northern Oregon and atmually in the wetter areas in soutl1eastern Wasllington and adjacent Idal1o. Tins biem1ial production system is typically conducted with winter wheat (Triticum aestivrmL L.) (WW) planted in tl1e fall and harvested the follow-
ing July tlrrough August, followed by 12 or more months of fallow. Historically, farnung practices coupled "vith "vinter weatl1er events led to excessive soil erosion in this region. Seedbed preparation and weed control created thoroughly tilled, structureless, bare soil conditions that frequently combined with fall rains and cold temperatures to freeze the soil into an impermeable mass. Winter warm periods can thaw the surface soil, leaving a weak thawed layer over the impermeable subsurface layer. Subsequent rainfall or snowmelt can lead to substantial rill erosion (McCool et al. 1982). Despite the low intensity rainfall predonunant in this region, mean soil loss bet\Veen 1939 and 1977 in the Palouse River subbasin was estimated at 20.6 Mg ha 1 y 1
(9 .2 t ac-1 yr-1) (Ebbert and Roe 1998; USDA
1978). At a site near Dufur, Oregon, about 161 km (100 mi) west of Pendleton, Oregon, Zuzel et al. (1982) reported soil loss as great as 31 Mg ha-1 (13.8 tn ac-1
) in a five-week winter period from fields in WW follo.,ving summer fallow.
Moldboard plowing and multiple secondary tillage practices destroy soil aggregates mechanically through the disruption of root systems and filamentous fungi which entwine and stabilize macroaggregates (Jastrow et al. 2007; Miller and Jastrow 2000) . Aggressive inversion tillage practices, by burying crop residue, dead roots, and cereal crowns, leave soil bare and vulnerable to both wind and water erosion (Williams et al. 2000) and rill development (McCool et al. 1987). Renard and Simanton (1990) considered erosion control primarily the result of residue and roots in the top 10 em (3. 9 in) of soil. Indeed, field studies have shown erosion of Walla Walla and Palouse silt loam soils is inversely related to the root and residue mass returned to the soil as a result of the tillage practices and crop rotation (Williams 2008; Williams et al. 2009). Sinlilarly, if small grain residues are removed from the field after harvest, multiple tillage operations before
John D. Williams is a research hydrologist with the USDA Agricultural Research Service in Pendleton, Oregon. Don K. McCool is a retired agricultural engineer and collaborator with the USDA Agricultural Research Service in Pullman, Washington. Catherine L Reardon is a micro· biologist with the USDA Agricultural Research Service in Pendleton, Oregon. Clyde l. Douglas, Jr., Stephan L Albrecht, and Ron W. Rickman are retired soil scientists, formerly with the USDA Agricultural Research Service, Pendleton, Oregon.
SEPT/OCT 2013- VOL. 68, NO. 5 I 349
seeding will dislodge shallow roots and cereal crowns and increase vulnerability to erosion (McCool et al. 2008). More recently, however, wide-spread adoption of conservation tillage practices and more benign weather patterns have resulted in a substantial reduction in soil loss rates (M cCool and Roe 2005; McCool et al. 2006).
T he goal of conservation tillage 1S to leave more crop residue at the soil surface and the soil less disturbed than conventional tillage. Residue at the surface (espec1ally plant stems) and bdowground plant matenal (roots, cereal crowns, plant residues, and microbial components) contribute to the soil structure necessary to resist soil erosion by snowmelt runoff, ramdrop m1pact, and concentrated flow. The shear strength provided by the physical binding and gluing (by root exudates) of soil particles into stable soil aggregates plays a substantial role in preventing erosion.
In erosion models used in decision support systems for conservation planning, it is important that crop components and management effects be properly represented. For exau1ple, if belowground to aboveground (root:shoot) biomass ratios are over- or underestimated, roots will not play their proper role in estimating soil erosion. This could be a critical shortcoming, especially in WW where root development during the fall 1s important for binding soil aggregates before the onset of wimer storms and in the subsequent year ifWW residues are removed after harvest. Furthermore, the accumulation of dead root biomass from year to year '"-ill not be correct, leading to an accumulation of errors in continuous, multiyear model runs. Unfortunately, little data are available on the actual amount and dtstribuhon of belowground plant pam in the PNW, or elsewhere in the U nited States.
Our obJecuves were to evaluate (1) root:shoot ratios and belowground hve b1omass distribution at specified development stages for selected crops in the PNW and (2) belowground b10mass distribution in selected crops under chfferent tillage systems in the PNW To gain a robust v1ew of root:shoot ratios and distribution of root mass and other live belowground plant components, we collected samples from 2- to 3-year short- term ex-periments; for distribution of live and dead root mass and incorporated residue, we collected data for short periods from established long-term
350 I SEPT/OCT 2013-VOL. 68, NO.5
(14- to 71-year) experiments. This information should be useful in crop growth model and database validation for erosion models, such as versions of the revised universal soil loss equation (RUSLE) (Renard et al . 1997), RUSLE2 (USDA ARS 2008), and the water erosion prediction project (WEPP) (USDA ARS 1995), and :ud 111 vahdating decompoSition and carbon sequestratiOn models.
Materials and Methods Stud1• Site.s. Samples were collected from research sltes at the USDA Columbta Plateau Conservation Research Center (USDA CPCRC) :u1d tl1e Oregon State University Col~unbia Basin Agricultural R esearch Center (OSU CBARC), 14 km (8.7 nu) nortl1east of Pendleton, Oregon, and at the Palouse Conservation Field Station, 3 knl (1. 9 mi) north of Pullm:u1, Washington. Soil at Pendleton is a Walla Walla silt loam (coarse-silty, nl.L"ed, mesic Typic Haploxeroll) (Johnson and Makinson 1988); the soil at P ullman is a Palouse silt loam (fine-silty, nl.L"ed, mesic Pachic Ultic Haploxeroll) (Donaldson 1980). The Walla Walla series consists of deep, well-drained soil formed in loess on rolliug uplands with 10% to 17% clay and less than 15% sand that is coarser th:u1 vety fine sand (Johnson and Makinson 1988). The Palouse series consists of deep, well-drained, neutral soil witl1 20% to 35% day and less ilian 15% sand that is coarser th:u1 very fine sand, formed in loess on rolling uplands (Donaldson 1980). Volcanic ash in the surface of both of these soils results in relatively low bulk density values from 1.1 to 1.3 Mg m-3 (Krynine 1937; Don 'JI!ysocki, personal communication, October 26, 2012).
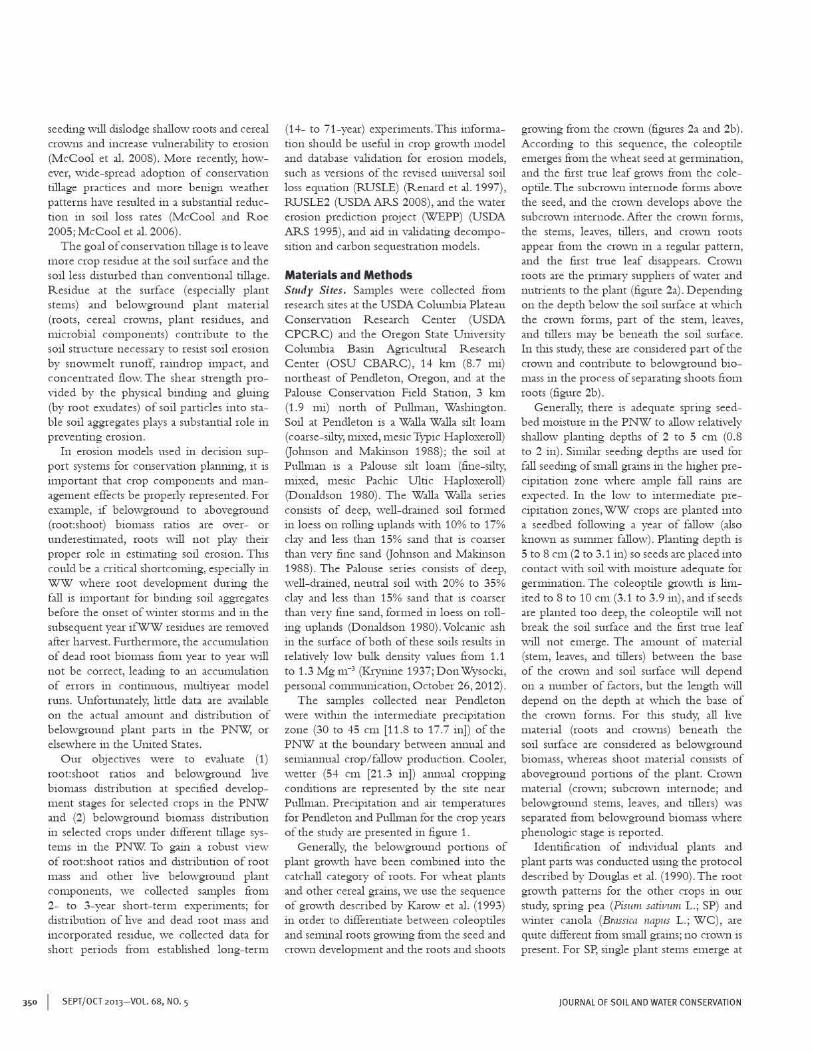
The samples collected near Pendleton were withm the mtennedtate: prec1p1tation zone (30 to 45 em [11.8 to 17.7 in]) of the PNW at the boundary bet\veen annual and semiannual crop/fallow production. Cooler, wetter (54 em (21.3 m]) :uumal croppmg conditions are represented by the site near Pullman. Precipitation and air temperatures for Pendleton and Pulhnan for the crop years of the study are presented m figure 1.
Generally, the belowground porttons of plant growtl1 have been combined into the catchall categoty of roots. For wheat pl:u1ts and otl1er cereal grains, we use the sequence of growth described by Karow et al. (1993) in order to differentiate between coleoptiles and seminal roots growing from the seed :u1d crown development and the roots and shoots
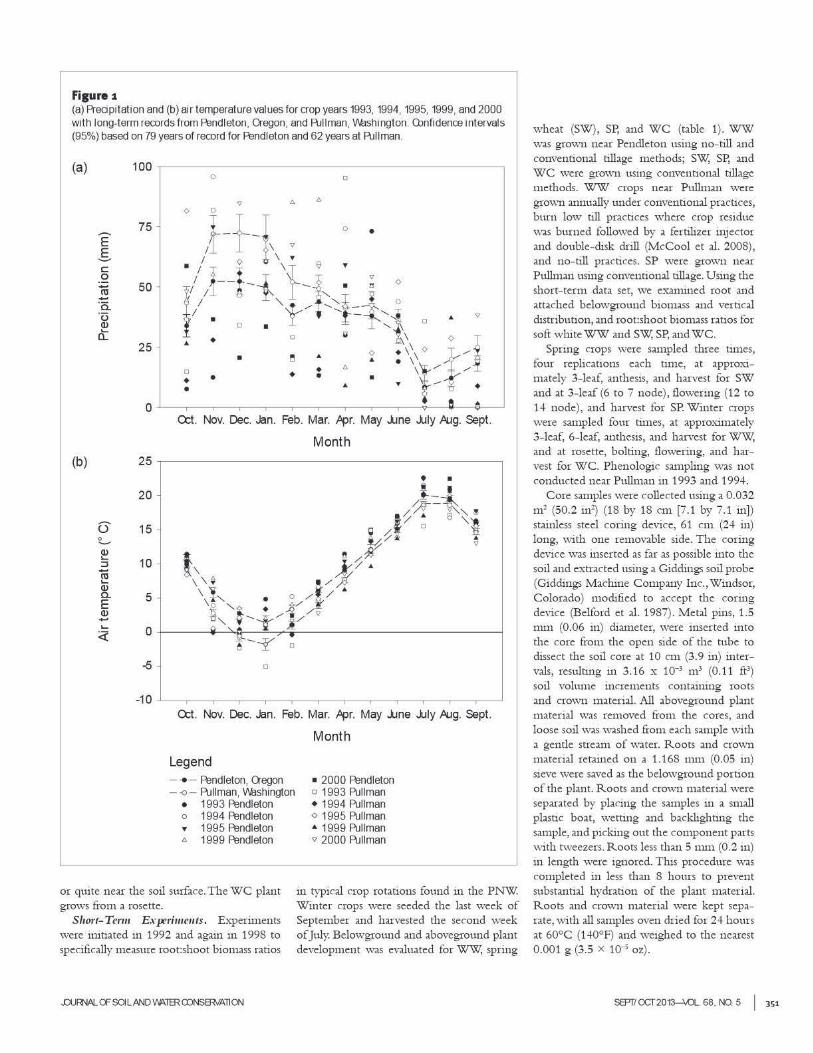
growing from the crown (figures 2a and 2b). According to this sequence, the coleoptile emerges from the wheat seed at germination, and the first true leaf grows from the coleoptile. The subcrown internode forms above the seed, and the crown develops above the subcrown internode. After the crown forms, the stems, leaves, tillers, and crown roots appear from the crown 111 a regular pattern, and the first true leaf disappears. Crown roots are the primary suppliers of water and nutrtents to the plant (figure 2a). Depending on the depth below the so1l surface at which the crown forms, part of the stem, leaves, and tillers may be beneath the soil surface. In tlus study, tl1ese are considered part of tl1e crown and contribute to belowground btomass in the process of separating shoots from roots (figure 2b).
Generally, there is adequate spring seedbed moisture in the PNW to allow relatively shallow planting depths of 2 to 5 em (0.8 to 2 in). Similar seeding depths are used for fall seeding of small grains in the higher precipitation zone w here :unple fall rains are e:>..-pected. In the low to intermediate precipitation zones, WW crops are planted into a seedbed following a year of fallow (also known as sununer fallow). Planting depili is 5 to 8 em (2 to 3.1 in) so seeds are placed into contact with soil ·with moisture adequate for germination. The coleoptile growth is limited to 8 to 10 em (3.1 to 3.9 in), and if seeds are planted too deep, the coleoptile will not break the soil surface and the first true leaf will not emerge. The amount of material (stem, leaves, and tillers) be tween ilie base of the crown and soil smface will depend on a number of factors, but the length will depend on the depth at wh1ch the base of the crown forms. For tlus study, all bve material (roots and crowns) beneath the soil surface are considered as belowground b10mass, whereas shoot material conststs of aboveground portions of the plant. Crown matenal (crown; subcrown mternode; and belowground stems, leaves, and tillers) was separated from belowgro~u1d biomass where phenologtc stage 1s reported.
Identification of mdtvidual plants and plant parts was conducted using ilie protocol described by D ouglas et al. (1990).T he root growtl1 patterns for the other crops in our study, spring pea (Pisum stUivrmt L.; SP) :u1d winter canola (Brassica nap11s L.; WC), are quite different from small grains; no crown is present. For SP, single pl:u1t stems emerge at
JOURNAL OF SOIL AND WATER CONSERVATION
Fisure1 (a) Predpitation and (b) air temperature values for crop years 1993, 1994, 1995, 1999, and 2000 with long-term records from Pendleton, Oregon, and F\JIIman, \1\e.shington. O:lnfidence intervals (95%) based on 79 years of record for Pendleton and 62 years at F\JIIman.
(a) 100 ~----------------------------------------~ 0 0
(b) 25 .--------------------------------------.
~ :::::J (1j .... Q) a. E Q) ...... .... <(
-5 - 0
O::t. Nov. Dec. Jan. Feb. Mar. ,Apr. May .line J.Jiy .Aug. Sept.
Legend - • - Pendleton, Qegon --o- Pullman, \1\e.shington
• 1993 Pendleton o 1994 Pendleton .. 1995 Pendleton .:. 1999 Pendleton
or quite near the soil snrface. The WC plant grows from a rosette.
Short- Tertii E:>:perimeuts. EJo..-periments were initiated in 1992 and again in 1998 to specifically measure root:shoot biomass ratios
.OU~ OF SOl LAND '/'lATER roNSffiv'AllOO
Month
• 2000 Pendleton o 1993 Pullman • 1994 Pullman o 1995 Pullman • 1999 Pullman , 2000 Pullman
in typical crop rotations found in the PNW Winter crops were seeded the last week of September and harvested the second week of]uly. Belowgronnd and abovegrotmd plant development was evalnated for WW, spring
wheat (SW), SP, and WC (table 1). WW was grown near Pendleton using no-till and conventional tillage methods; SW, SP, and we were grown using conventional tillage methods. WW crops near Pullman were grown annually under conventional practices, burn low till practices where crop residue was burned followed by a f~rtihz~r inJ~Ctor and doubl~-d1sk dnll (McCool et al. 2008), and no- till practic~s. SP w~r~ gro\v"l1 near Pullman using conv~ntional tillag~. Using th~ short-term data set, w~ ~x.unin~d root and attached bdowground b10mass and v~rtical distnbutlon, and root:shoot biomass ratios for soft white WW and SW, SP, and WC.
Spring crops were sampled three times, four rephcations each time, at approXlmately 3-leaf, anthesis, and harvest for SW and at 3-leaf (6 to 7 node), flowering (12 to 14 node), and harvest for SP. Winter crops were sampled four times, at approll.imately 3-leat~ 6-leaf, anthesis, and harvest for WW, and at rosette, bolting, flowering, and harvest for we. Phenologic sampling \-Vas not conducted near Pullman in 1993 and 1994.
Core samples were collected using a 0. 032 mz (50.2 inz) (18 by 18 em (7.1 by 7.1 in]) stainless steel coring device, 61 em (24 in) long, ,;yjth one removable side. The coring device was inserted as far as possible into the soil and extracted nsing a Giddings soil pro be (Giddings Machine Company Inc., Windsor, Colorado) modified to accept the coring device (Belford et al. 1987). Metal pius, 1.5 mm (0.06 in) diameter, were inserted into the core from the open side of the tnbe to dissect the soil core at 10 em (3.9 in) intervals, resulting in 3.16 x 10·3 m3 (0.11 ftl) soil volm11e incr~ments containing roots and cro\v"ll rnat~rial. All abov~ground plant matenal was remov~d from th~ cores, and loose sou was washed from each sample with a g~ntl~ stream of warer. Roots and crown matenal retam~d on a 1.168 nun (0.05 m) s1eve were saved as the belowgronnd portion of tl1e plant. Roots and crown matenal were separated by placing the samples w a small plastic boat, wetting and backlighting the sample, a.nd p1cklng out the component parts with tweezers. Roots less than 5 mm (0.2 m) in length were ignored. This procedure "vas completed in less than 8 hours to prevent substantial hydration of the plant material. Roots and crown material were kept separate, mth all samples oven dried for 24 hours at 60°C (140°F) and weighed to the nearest 0.001 g (3.5 x 10..; oz).
SEPTIOCT20'13-XO.. 68. NO. 5 I 351
Fisure :z Belowground development of (a) crown and root material in a wheat plant Qown growth consists of (b) the crown, crown roots, and subcrown mternode to the scutellum. The length of the subaown internode depends on the depth of seed placement when planted. Below the seed are the seminal roots.
(a)
Seed
(b)
Ash contents were not measured to deternune sou contanunauon \:vith the assumption that soil particles remaining on the root and crown matenal would not subst;ultlally influence our results. J;utten et al. (2002) suggest tim techmque can lead to subst;u1tial errors, especially when comparisons are made among differing soil or pl;u1t types. Thus, we reconm1end caution when making such comparisons \:vith tllis data.
Lo11g-Term &;perimeiiL~ . USDA CPCRC and OSU CBARC have a number of ongoing, long-term e:Kperiments with nmltiple management treatments and goals (Rasmussen et al. 1994). To evaluate the effect oflong-term tillage systems on residue and root distribution with depth at harvest,
352 I SEPT/OCT 2013- VOL. 68, NO.5
Soil surface
I 2 to 8 em
_l_
aboveground b10mass (gr;un and restdue) from current crop and total b10mass samples from soil cores were taken from four of these e~:periments m crop years 1999 and 2000: convent1onally tilled wmter wheat/ fallow (CR), convenuonally tilled conunuous wmter wheat (CWW), no- till winter wheat/ fallow (NT), and conventionally tilled winter wheat/ sprmg pea (WP) (table 2).
Core s;unples were collected using tl1e same equipment as used m the short- term eA-periments. The procedure differed in that belowground s;unples were divided at 2.54 em (1 in) intervals to 31 em (12 in) depth, and total belowgrouud biomass (incorporated crop residue plus roots and crown
material) was determined for each 2.54 em ( 1 in) increment.
Sam pie Collectiou <111d Ali,,/ysis. Differences in biomass between depths atld s;unpling years were ev-aluated at p = 0.05, using the sign test if there were greater than 12 pairs of observations and using Wilcoxon stgned rank test if there were less th;u1 12 p;urs of observanons (Steele and Torne 1960).
Results and Discussion Short-Term E:.·perimeut Crop Production. In tills sem.iand reg10n, vartability m the ttming and amotult of ;umual precipitation 1s ell.-pected, \'lith a corresponding fluctuation in crop yields (Sclllllinger 2011). Fill crops are especially dependent on late summer md fall precipitation for germination and st;u1d vigor. Despite relatively dry falls in 1993 atld 1994 at both Pendleton md Pullmm (figure 1), the rmge of values tor crop residue md grain yields reported in table 3 compare well with values reported by the USDA National Agricultural Statistics Service (USDA NASS 2012).
Short-Term E.'l: perimeut P henology .md Belowgrouud Growth. Seeding depths for the plots at Pendleton atld Ptillman are listed iu table 4, along with the crown depths for WW and SW. Seeding depth for WW at Pendleton ranged from 2.6 to 5.2 em (1 to 2 in), atld crown depth from 2 to 2.5 em (0.8 to 1 in). Pulhnan WW seeding depth rmged from 2.2 to 3.4 em (0.9 to 1.3 in), md crown depth was 1.7 to 2.9 em (0.7 to 1.1 in). Pendleton SW seeding depth was 4 em (1.6 in), and crown depth vvas 2.4 em (0.9 in). While seeding depth can vary with a number of factors, such as ;unount and type of tillage a11d drill pressure, crown depth was Jess variable in these studies. Seeding depth for SP was 5.1 em (2 m) at Pendleton and 4.1 em (1.6 m) at Pullman. Although SP have no cro\:vt1, the belowground stem material above the seed and the root system can be subst;umal.
Total b10mass m the upper 0 to 10 em (0 to 3. 9 in) layer in the sotl declmed after an theSIS in WW and vvas unchanged for SW. In both cases, root growth continued as crown mass decreased (table 5). C;unpbell et al. (1977) reported smular results for loss of mass in SW roots between anthesis and matunty but did not differentiate between crowns and roots. The loss of crown mass as the plmts senesce is possibly the result of subst;u1tial soil drying due to the nearly total lack of precipitation from early June through September in this region. Contrary to early reports that cereal
JOURNAL OF SOIL AND WATER CONSERVATION
Tables Location, crop, crop variety, seeding date and other selected mformation for plant samples collected in the short-term study near Rendleton, Oregon, and Pullman, Wlshmgton.
Location Qop Variety Seeding date Harvest Management notes
Rendleton
WN Stephens Sept. 30, 1992 1993 NO-till, after WN
WN Stephens Sept. 30, 1993 1994 NO-till, after fallow
SN Renewawa Mar. 31 , 1993 1993 Conventional, after WN
SN Renewawa Mar. 23,1994 1994 Conventional, after WN w::, }~fabella Alg. 31 , 1992 1993 Conventional, after fallow w::, }~fabella Sept 15, 1993 1994 Conventional, after fallow
SP Dual Jlpr. 14, 1993 1993 Conventional, after WN
SP Dual Mar. 31 , 1994 1994 Conventional, after WN WN Stephens O:t. 20, 1998 1999 Conventional, continuous WN
WN Stephens O::t 15, 1998 1999 NO-till, continuous WN
WN Stephens O:t. 20, 1999 2000 Conventional, after fallow
SN Renewawa Mar. 31 , 2000 2000 NO-till, after WN
Pullman
WN Madsen O:t. 16, 1992 1993 NO-till, after WN WN Madsen O:t. 10, 1993 1994 NO-till, after WN
SP Columbia B-160 May 19, 1993 1993 Conventional, after WN
SP Columbia B-160 May3, 1994 1994 Conventional, after WN
WN Madsen O:t. 15, 1994 1995 Burn, low till, after WN WN Madsen O:t. 15, 1994 1995 Conventional, after WN
Notes: WN = winter wheat. SN = spring wheat. w::, =winter canola. SP = spring pea No-till = seed and ferti lize in one equipment pass. Conventional, after WN= plow after harvest, cultivate, and seed. Conventional, after fallow= plow in fall, cultivate in spring, rod weed two to four times during summer. Bum. low till = burn, cultivate (fertilizer injector), and seed in fall after WN harvest.
Table 2 Experiment name, rotation, tillage, and duration of experiment for long-term plots sampled near Rendleton, Oregon
Experiment name Rotation Seedbed tillage Experiment duration (y)
rn WN/F MBP, FC, RN 71 ONN Annual crop WN MBP, FC, RN 71 NT WN/CF None 14 1M> WN FC,RN
SP MBP, FC 39 Notes: rn =crop residue. ONN = continuous winter wheat. NT= no.! ill. WP = winter wheaU spring pea. WN= winter wheat. F =summer fallow, tilled. CF =summer fallow, chemical. SP= spring pea MBP= moldboard plow. FC= reid cultivate. RN= rod weed.
roots do not grow dunng seed ripening (Russell 1961), our data show that cereal root mass increased until harvest, as did the root systems in the WC (table 5). Belowground WC b10mass, conSIStmg entirely of rootS, mcreased slightly between flowermg and maturity, whereas belowground SP biomass decreased between 12 to 14 node and maturity; most of tl1e loss was in root mass while belowground stem increased slightly.
Crown mass of WW and SW at harvest accounted for 32% and 45%, respectively, of the biomass in the upper 10 em (3 .9 in) layer
.OU~ OF SOl LAND 'I'>ATER roNSffiv'AllOO
of the soil, w1th ilie balance composed of senunal roots. In SP, stem matenal between the seed and soil surface accounted for 38% of the biomass.Belowground biomass ofWC consisted of roots w1thout stem or crown matenal. Our e;-.:penmental data showed that the cereal crowns were within 2.5 em (1 in) of the soil surface. At this depth, crowns and attached belowground stem material from a harvested crop can be important in protecting the soil from erosion, especially when no-till seeding practices are used and the
crowns are anchored to the soil by the crown root system.
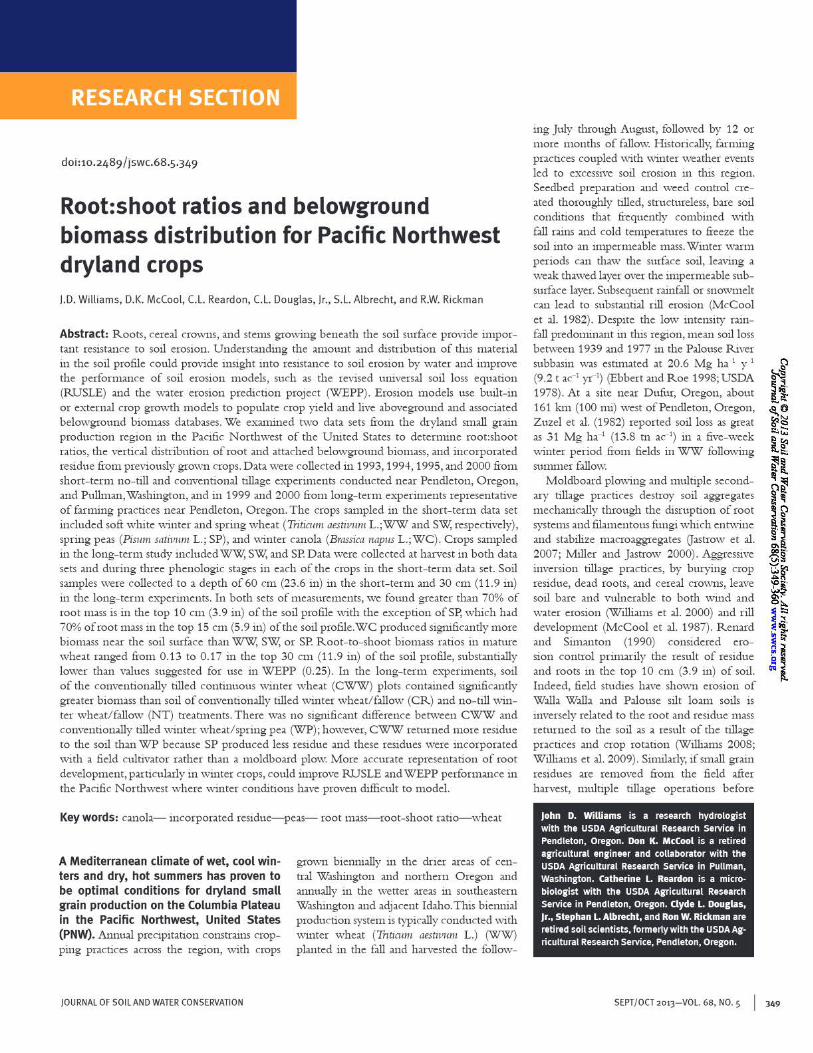
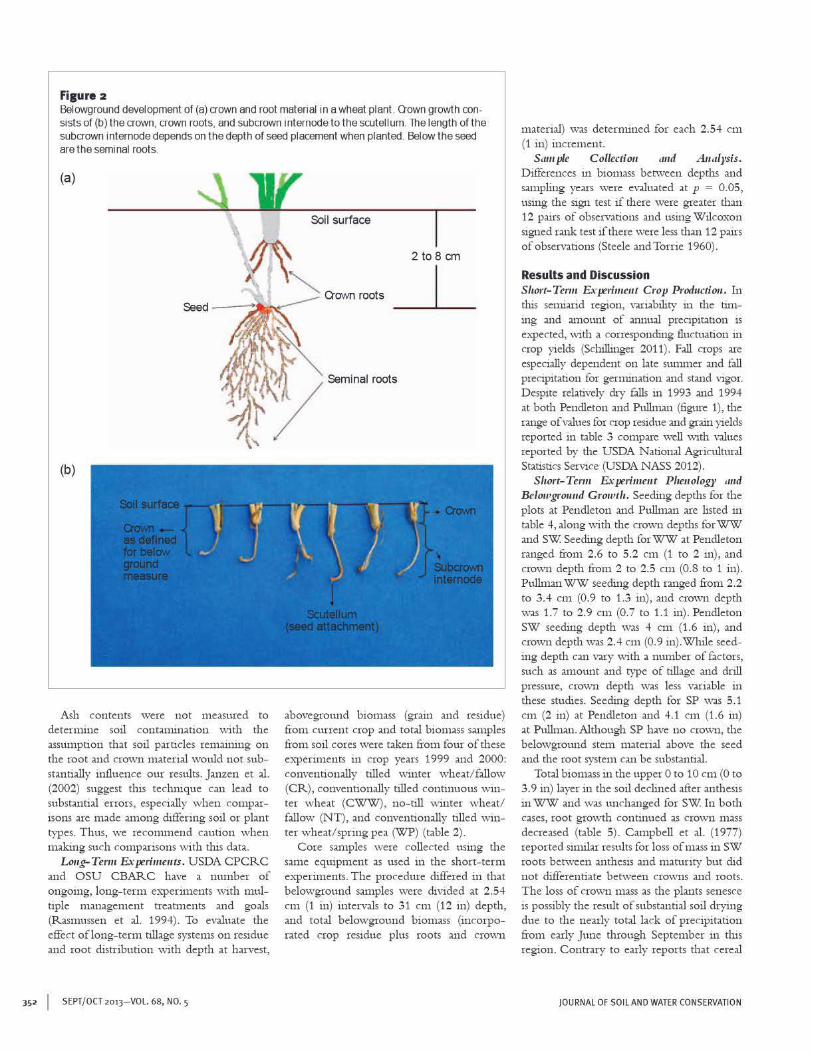
Sl10rt- Term E:J\: perimeu t Root Mttss Distrilmtion with Depth. A complete set of incremental 10 em (3. 9 in) data from 0 to 40 em (0 to 15.7 in) was only collected near Pendleton. The higher clay content soil near Pullman proved too hard to sample consistently to depili at harvest after the soil had dried and hardened. we had significantly more and SP had sigruficantly Jess biOmass 111 the 0 to 10 em (0 to 3. 9 m) s01! depth than the other crops (table 6). At harvest, 70% of ww, sw, and we biomass u1 samples collected to 61 em (24 in) was at depilis shallower tl1an 10 em (3.9 m) (table 7 and figure 3). In SP, 70% of roots were at depths shallower than 18 em (7.1 in), and roots and belowground stems shallower than 15 em (5.9 rn) of the soil surface (figure 3). Root mass distribution an1ong all treatments ofWW and SW were statistically indistinguishable at any depth. we had greater belowground biomass (tables 5 and 6) and the greatest aboveground residue mass (table 3) of all crops at all stages and depths through harvest. we biomass percentage in the upper 10 em is highest of all crops (table 7) .
SEPTicx::T20'13-XO.. 68. NO. 5 I 353
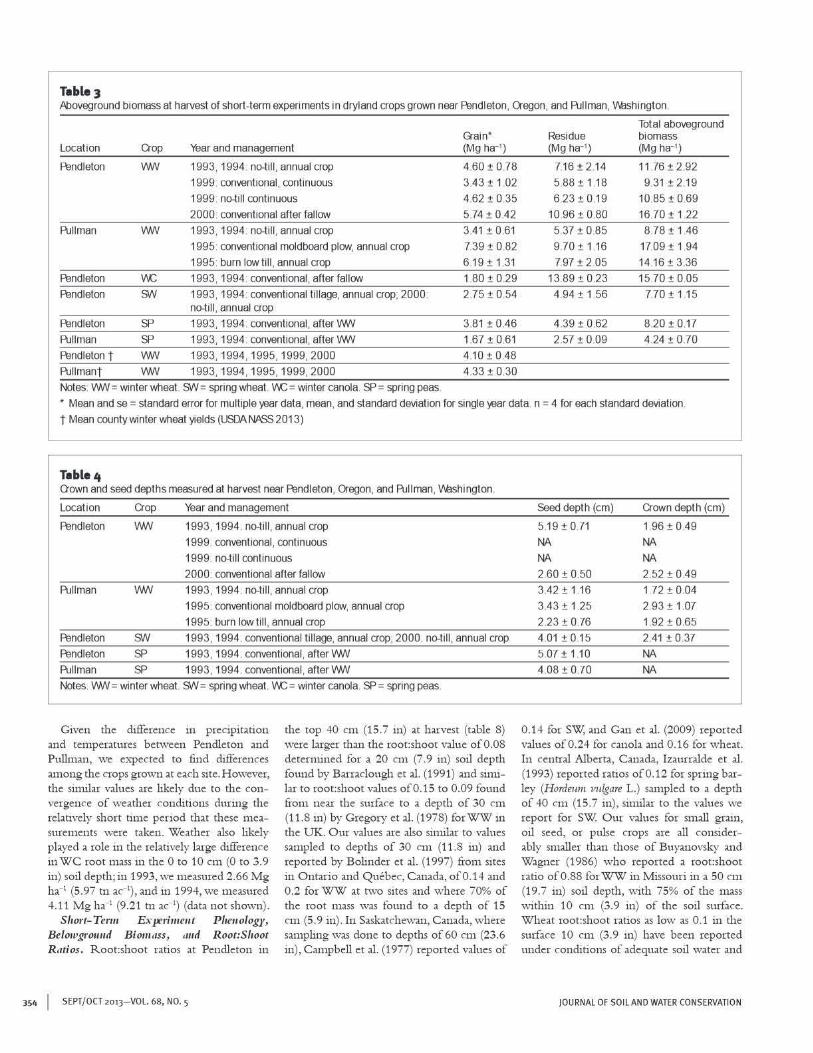
Table 3 ,Aboveground biomass at harvest of short-term expenments m dryland crops grown near F1lndleton. Qegon. and Pullman, \1\klshington.
Total aboveground G-ain* Residue biomass
Location Crop Year and management (Mg ha-•) (Mg ha-•) (Mg ha-•)
F1lndleton VWV 1993, 1994: no-till, annual crop 4.60 :t 0.78 7.16 :t 2.14 11.76 :t 2.92
1999: conventional, continuous 3.43 :t 1.02 5.88 :t 1.18 9.31 :t 2.19
1999: no-till continuous 4.62 :t 0.35 6.23 :t 0.19 10.85 :t 0.69
2000: conventional after fallow 5 74 :t 0 42 10 96 :t 0.80 16 70 :t 1.22
Pullman vwv 1993, 1994: no-till, annual crop 3.41 :t 0.61 5.37 :t 0.85 8.78 :t 1.46
1995: conventional moldboard plow, annual crop 7.39 :t 0.82 9.70 :t 1.16 17.09 :t 1 .94
1995: burn low till, annual crop 6 19 ± 1 31 7 97 :t 2.05 14 16 ± 336
F1lndleton w:.; 1993, 1994: conventional, after fallow 1 80 :t 0.29 13.89 :t 0.23 15 70 :t 0.05
F1lndleton SN 1993, 1994: conventional tillage, annual crop; 2000: 2.75 :t 0.54 4.94 :t 1.56 7.70 ± 1.15 no-till, annual crop
F1lndleton SP 1993, 1994. conventional, after VWV 3.81 :t 0.46 4.39 :t 0.62 8.20 :t 0.17 Pullman SP 1993, 1994. conventional, after VWV 1.67 :t 0.61 2.57 :t 0.09 4 24 :t 0.70
F1lndleton t vwv 1993,1994, 1995, 1999,2000 4.10 :t 0.48
Pullmant vwv 1993,1994, 1995, 1999,2000 4.33 :t 0.30
Notes. VWV = winter wheal. SN= spring wheat. w:.; : winter canola. SP= spring peas.
• Mean and se = standard error for multiple year data. rnean, and standard deviation for single year data. n = 4 for each standard deviation
t Mean county winter wheat yields (USDA NASS 2 013)
Teblelf O'own and seed depths measured at harvest near F1lndleton, Qegon, and Pullman, \1\klshington.
LocatiOn Crop Year and management
~ndleton VWV 1993, 1994. no-till, annual crop
1999. conventional, continuous
1999. no-till continuous
2000. conventional after fallow
Pullman vwv 1993, 1994. no-till, annual crop
1995. conventional moldboard plow, annual crop
1995. burn low till, annual crop
~ndleton 1993, 1994. conventional tillage, annual crop, 2000. no-till, annual crop
~ndleton SP 1993, 1994. conventional, after VWV
Pullman SP 1993, 1994. conventional, after VWV
Notes. VWV = winter wheat. SN = spring wheat. w:.; = winter canola. SP = spring peas.
Given the difference in precipitation and temperatures between Pendleton and Pullman, we eli."Pected to find differences among the crops grown at each site. However, the similar values are likely due to the convergence of weather conditions during the relatively short time period that these measurements were taken. Weather also likely played a role m the relatively large difference in we root mass U1 the 0 to 10 em (0 to 3. 9 in) soil depth; in 1993, we measured 2.66 Mg ha-1 (5.97 tn ac-1) , and in 1994, we measured 4.11 Mgha-1 (9.21 tnac-1
) (datanotshown). Slwrt-Term E:~.·perimeut Plu':llology,
BelorvgroJ1111f Biorr111ss, ,,d Root:Siroot R11tios. Root:shoot ratios at Pendleton in
354 I SEPT/OCT 2013-VOL. 68, NO.5
the top 40 em (15.7 in) at harvest (table 8) were larger than the root:shoot value of0.08 deternuned for a 20 em (7.9 m) soil depth found by Barraclough et al. (1991) and sumlar to root:shoot values of0.15 to 0.09 found from near the surface to a depth of 30 em (11.8 in) by Gregory et al. (1978) forWW in the UK. Our values are also similar to values sampled to depths of 30 em (11 .8 m) and reported by Bolinder et al. (1997) from sites in Ontario and Quebec, Canada, of0.14 and 0.2 for WW at two sites and where 70% of the root mass was found to a depth of 15 em (5.9 in). In Saskatchewan, Canada, where san1pling was done to depths of 60 em (23.6 in), Campbell et al. (1977) reported values of
Seed depth (em) Crown depth (em)
5.19 :t 0.71 1.96 :t 0.49
NA NA NA NA 2.60 :t 0.50 2.52 :t 0.49
3.42 :t 1.16 1.72 :t 0.04
3.43 :t 1.25 2.93 :t 1.07
2.23 :t 0.76 1.92 :t 0.65
4.01 :t 0.15 2.41 :t 0.37
5.07 ± 1.10 NA 4.08 :t 0.70 NA
0.1+ for SW, and Gan eta!. (2009) reported values of0.24 for canola and 0.16 for wheat. In central Alberta, Canada, Izallrralde er al. (1993) reported ratios of 0.12 for sprrng barley (Horder.1111 vulgare L.) sampled to a depth of 40 em (15.7 in), similar to the values we report for SW Our values for small grain, oil seed, or pulse crops are all considerably smaller than those of Buyanovsky and Wagner (1986) who reported a root:shoot ratio of0.88 forWW in Missouri in a 50 em (19.7 in) soil depth, with 75% of the mass within 10 em (3. 9 in) of the soil sw-£'lce. Wheat root:shoot ratios as low as 0.1 in the sudace 10 em (3. 9 in) have been reported under conditions of adequate soil water and
JOURNAL OF SOIL AND WATER CONSERVATION
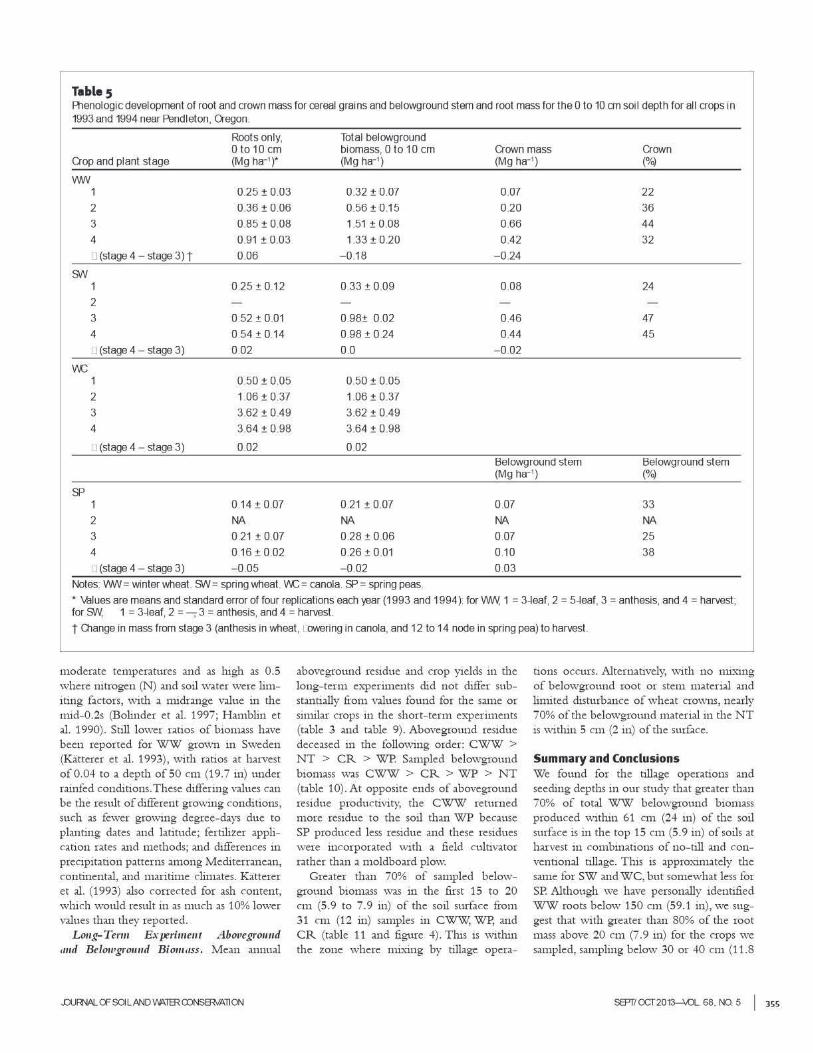
Table 5 Alenologic development of root and crown mass for cereal grains and belowground stem and root mass for the 0 to 10 em soil depth for all crops In 1993 and 1994 near Pendleton, Qegon.
Roots only, Total belowground 0 to 10 em biomass, 0 to 10 em Crown mass Crown
Crop and plant stage (Mg ha-' )* (Mg ha-') (Mg ha-•) (%)
WN 1 0.25 ± 0.03 0.32 ± O.Q7 0 07 22
2 0.36 ± 0.06 0.56 ± 0.15 0.20 36
3 0.85 ± 0.08 1.51 ± 0.08 0.66 44
4 0.91 ± 0.03 1.33 ± 0.20 0.42 32
D (stage 4 - stage 3) t 0.06 - 0.18 - 0.24
SN 1 0.25 ± 0.12 0.33 ± 0.09 0.08 24
2
3 0.52 ± 0.01 0.98± 0.02 0.46 47
4 0.54 ± 0.14 0.98 ± 0.24 0.44 45
D (stage 4 - stage 3) 0.02 0.0 - 0.02
w:.; 1 0.50 ± 0.05 0.50 ± 0.05
2 1.06 ± 0.37 1 06 ± 0.37
3 3.62 ± 0.49 3.62 ± 0.49 4 3.64 ± 0.98 3.64 ± 0.98
D (stage 4 - stage 3) 0.02 0 02 Belowground stem Belowground stem (Mg ha-•) (o/~
SP 1 0.14 ± 0.07 0.21 ± 0.07 O.Q7 33
2 NA NA NA NA 3 0.21 ± 0.07 0.28 ± 0.06 O.Q7 25 4 0.16 ± 0.02 0.26 ± 0.01 0.10 38 D (stage 4 - stage 3) - 0.05 - 0 02 0.03
Notes: WN = Winter wheat. SN = spring wheat. w:.; = canol a. SP = spring peas • \fcllues are means and standard error of four replications each year (1993 and 1994 ): for VWV. 1 = 3-leaf, 2 = 5-leaf, 3 = anthesis. and 4 = harvest; for SVV. 1 = 3-leaf, 2 =, 3 = anthesis, and 4 = harvest. t Olange in mass from stage 3 (anthesis in wheat, Cbwering in canola. and 12 to 14 node in spring pea) to harvest.
moderate temperatures and as high as 0. 5 where nitrogen (N ) and soil \'V-ater were limIting factors, with a nudrange value m the rrud-0.2s (Bolinder et a!. 1997; Harnbhn et al. 1990). Still lower ratiOS of b1omass have been reported for WW grown in Sweden (Katterer et a!. 1993), w1th ranos ar harvest of0.04 to a depth ofSO em (19.7 m) under ramfed condiuons.These diffenng values can be the result of different growing condit10ns, such as fewer growing degree-days due to plantmg dates and lautude; fertilizer apphcation rates and methods; and differences m precipitation patterns among Mediterranean, continental, and maritime climates. Katterer et a!. (1993) also corrected for ash content, which would result in as much as 10% lower values than they reported.
L oug-Terw E>.:perimeut Abovegrouud mrd B elowgr01111d B iouwss. Mean annual
.OU~ OF SOl LAND 'I'ATER roNSffiv'AllOO
aboveground residue and crop yields in the long- term e~:periments did not differ substantially from values found for the sarne or similar crops 111 the short- term eli."Penments (table 3 and table 9). Aboveground res1due deceased in the following order: CWW > NT > CR > WP. Sampled bdowground b10mass was CWW > CR > WP > NT (table 10). At opposite ends of aboveground residue productivity, the CWW returned more residue to the soil than WP because SP produced less res1due and these res1dues were incorporated with a field culuvator rather than a moldboard plow.
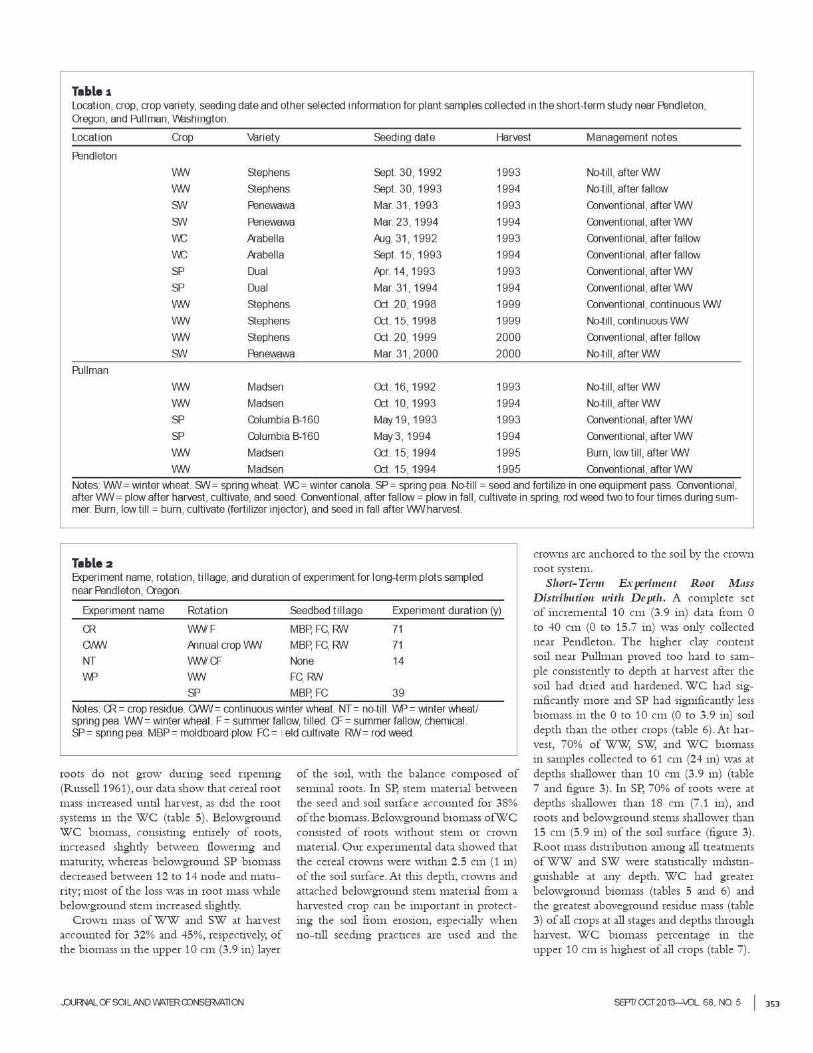
Greater than 70% of sampled belowground biomass was in the first 15 to 20 em (5.9 to 7.9 in) of the soil smface from 31 em (12 in) samples in CWW, WP, and CR (table 11 and figure 4). This is within the zone where mi..."ciug by tillage opera-
tions occurs. Alternatively, with no mi..."ocing of belowground root or stem nuterial and linuted disturbance of wheat crowns, nearly 70% of the belowgrow1d materialm the NT is \vi thin 5 em (2 in) of the surface.
Summary and Conclusions We found for the tillage operatlons and seedmg depths in our study that greater than 70% of total WW belowground biomass produced within 61 em (24 in) of the soil surface 1s m the top 15 em (5.9 m) of soils at harvest in combinations of no- nll and conventional tillage. Tlus is approximately the same tor SW and WC, but somewhat less for SP. Although we have personally identified WW roots below 150 em (59.1 in), we suggest that vvith greater than 80% of the root mass above 20 em (7.9 in) for the crops we sampled, sampling below 30 or 40 em (11.8
SEPTicx::T20'13-XO.. 68. NO. 5 I 355
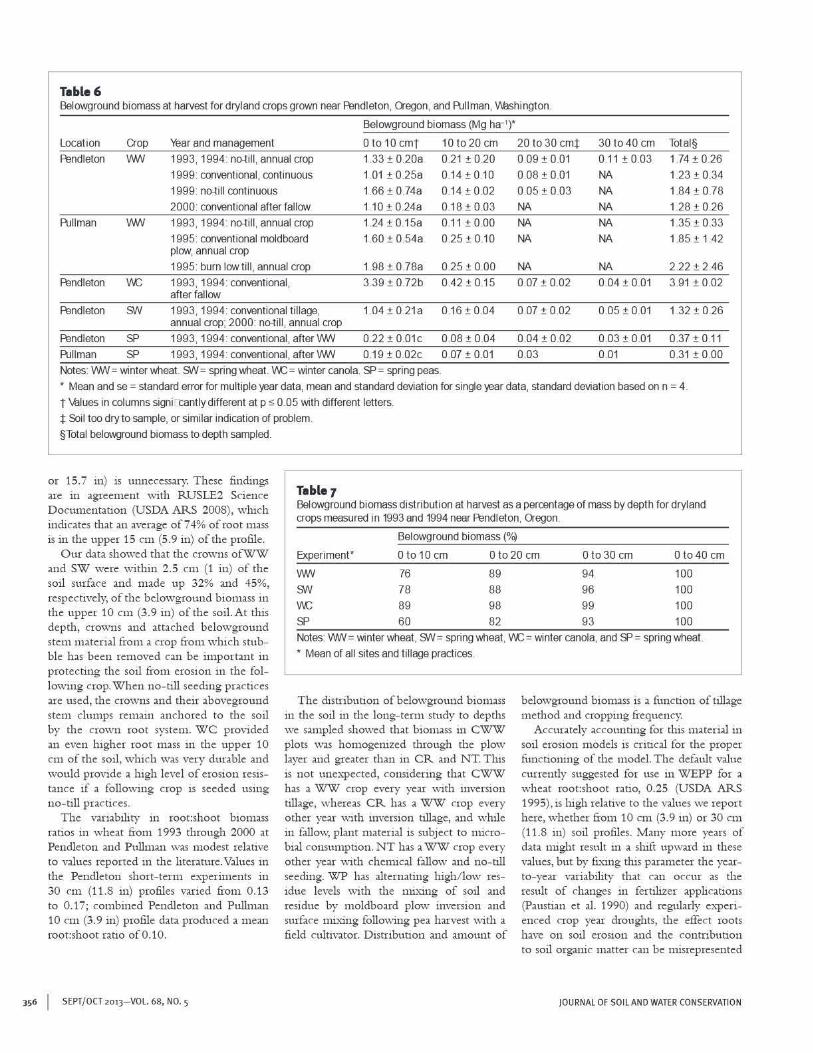
Table 6 Belowground biomass at harvest for dryland crops grown near Pendleton, Qegon, and R.JIIman, \1\ashington.
Belowground biomass (Mg ha-1}"
Location Crop Year and management 0 to 10 cmr 10 to 20 em 20 to30 cm:j: 30 to40 em Total§
Pendleton VWoJ 1993, 1994: na-till, annual crop 1.33 ± 0.20a 0.21 ± 0.20 0.09 ± 0.01 0.11±003 1.74 ± 0.26 1999 conventional, continuous 1.01 ± 0.25a 0.14 ± 0.10 0.08 ± 0.01 NA 1.23 ± 0.34 1999 no-til l continuous 1.66 ± 0.74a 0.14 ± 0.02 0.05 ± 0.03 NA 1.84 ± 0.78 2000 conventional after fallow 1.10± 0.24a 0.18 ± 0.03 NA NA 1.28 ± 0.26
R.JIIman VWoJ 1993, 1994: na-till, annual crop 1.24 ± 0.15a 0.11±0.00 NA NA 1.35 ± 0.33 1995 conventional moldboard 1.60 ± 0.54a 0.25 ± 0.10 NA NA 1.85 ± 1.42 plow, annual crop 1995 burn low till, annual crop 1.98 ± 0.78a 0.25 ± 0.00 NA NA 2.22 ± 2.46
Pendleton ~ 1993, 1994: conventional, 3.39 ± 0.72b 0.42 ± 0.15 0.07 ± 0.02 0.04 ± 0.01 3.91 ± 0.02 after fallow
Pendleton SN 1993, 1994: conventional tillage, 1.04±0.21a 0.16 ± 0.04 0.07 ± 0.02 0.05 ± 0.01 1.32 ± 0.26 annual crop; 2000 no-till, annual crop
Pendleton SP 1993, 1994: conventional, after VWoJ 0.22 ± 0.01c 0.08 ± 0.04 0.04 ± 0.02 0.03 ± 0.01 0.37 ± 0.11 R.JIIman SP 1993, 1994: conventional, after VWoJ 0.19 ± 0.02c 0.07 ± 0.01 0.03 0.01 0.31 ± 0.00 Notes: VWoJ = winter wheat. SN = spring Wheat. ~=winter canola. SP = spring peas. • Mean and se =standard error for multiple year data, mean and standard deviation for single year data, standard deviation based on n = 4.
r Vcllues in columns signi"cantly different at p ~ 0.05 with different letters. :j: Soi l too dry to sample, or similar indication of problem. §Total belowground biomass to depth sampled.
or 15.7 in) is \llmec.essa.ry. These findings are in agreement with RUSLE2 Science Documentation (USDA ARS 2008), which indicates that an average of74% of root mass is in the upper 15 em (5.9 in) of the profile.
Our data showed that the crowns ofWW and SW were within 2.5 em (1 in) of the soil surface a.nd made up 32% and 45%, respectively, of the belowground biomass in the upper 10 em (3.9 in) of the soil.At this depth, crowns and attached belowground stem material ti:om a crop from which stubble has been removed ca.n be important in protecting the soil from erosion in the following crop. When no- till seeding practices are used, the crowm and the1r aboveground stem clumps remam anchored to the so1l by the crown root system. we provided an even higher root mass 111 the upper 10 em of the soil, whtch was very durable and would provide a lugh level of erosion reSIStance 1f a followmg crop 1s seeded usmg no- till practices.
The variability in root:shoot biomass ratlos m wheat from 1993 through 2000 at Pendleton and Pullman was modest relauve to val~tes reported in the literature. Values in the Pendleton short-term ell.-periments in 30 em {11.8 in) profiles varied from 0.13 to 0.17; combined Pendleton and Pullman 10 em (3.9 in) profile data produced a mea.n root:shootratio of0.10.
356 I SEPT/OCT 2013-VOL. 68, NO.5
Table 7 Belowground biomass distribution at harvest as a percentage of mass by depth for dryland crops measured in 1993 and 1994 near Pendleton. Oregon.
Belowground biomass(%)
Experiment• 0 to 10 em 0 to 20 em 0 to 30 em 0 to 40 ern
VWoJ 76 89 94 100 SN 78 88 96 100 ~ 89 98 99 100 SP 60 82 93 100 Notes VWoJ= winter wheat. SN= spring Wheat. ~= winter canola. and SP= spring wheat. • Mean of all sites and tillage practices
The distnbub.on ofbelowground biomass 111 the soil in the long- term study to depths we sampled showed that b1omass in CWW plots was homogenized through the plow layer and greater than 111 CR and NT. This IS not une:x-pected, coilSldering that CWW has a WW crop every year wtth inversion tillage, whereas CR has a WW crop every other year with inversion tillage, and while 111 fallow, plant matenal1s subject to nucrobial consumption. NT has a WW crop every other year with chemical fallow and no- till seeding. WP has alternating high/low residue levels with the mixing of soil and residue by moldboard plow inversion and surface mixing following pea harvest with a field cultivator. Distribution and amount of
be!owground b1omass is ;~ function of tlllage method and croppmg frequency.
Accurately accounting for this macenal in soil erosion models is critical for the proper functioning of the model. The default value currently suggested for use m WEPP for a wheat root:shoot ratio, 0.25 (USDA ARS 1995), 1s high relative to dte values we report here, whether from 10 em (3.9 in) or 30 em (11.8 m) soil profiles. Many more years of data nught res~tlt m a sillft upward m dtese values, but by fi..'i:ing this parameter the yearto-year variability that can occur as the result of changes in fertilizer applications (Paustian et al. 1990) and regularly ell.-perienced crop year droughts, d1e effect roots have on soil erosion and the contribution to soil organic matter can be misrepresented
JOURNAL OF SOIL AND WATER CONSERVATION
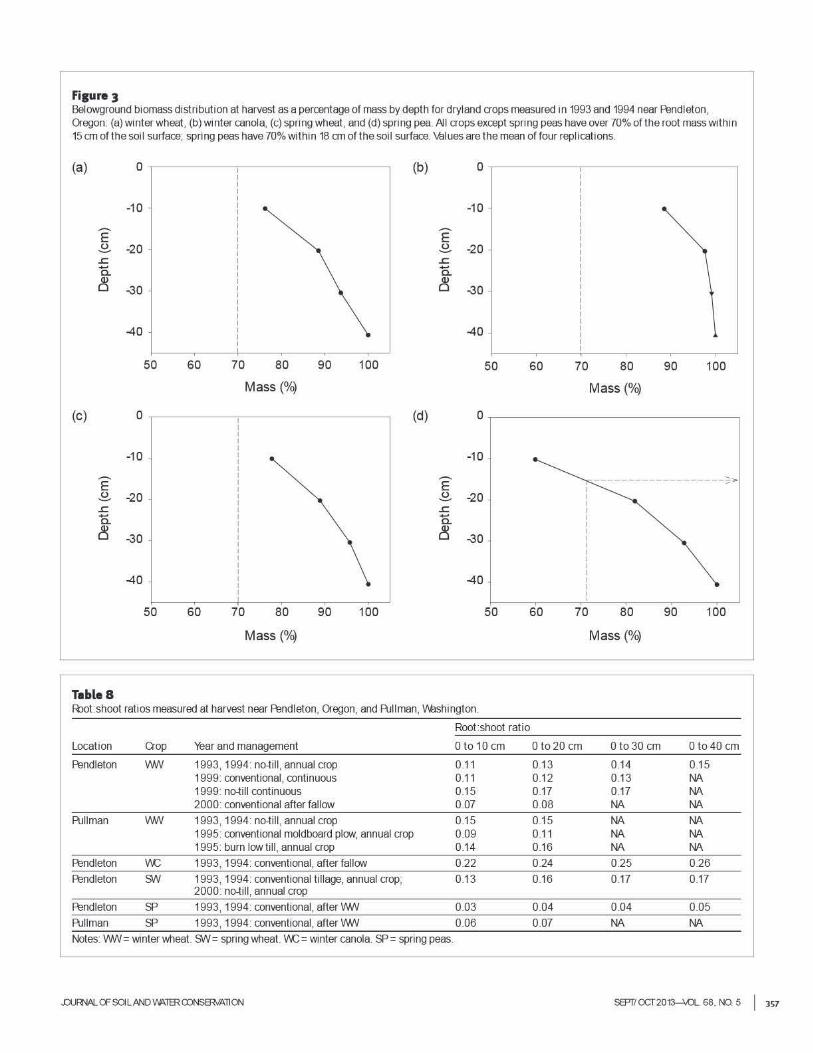
Fisure 3 Belowground biomass distribution at harvest as a percentage of mass by depth for dryland aops measured in 1993 and 1994 near Pendleton, Oregon. (a) winter wheat, (b) winter canol a, (c) spring wheat, and (d) spring pea. Al l crops except spring peas have over 70% ofthe root mass within 15 em of the soil surface, spring peas have 70% Within 18 em of the soli surface. Vdlues are the mean of four replications.
(a) (b) 0 .-----------.-------------------.
-10
-20
-30 -
-40 -
50 60 70 80 90 100 50 60 70 80 90 100
Mass(%) Mass(%)
(c) (d)
-E .£_ .L: a. ~
50 60 70 80 90 100 50 60 70 80 90 100
Mass(%) Mass(%)
TableS R:>ot:shoot ratios measured at harvest near Pendleton, Oregon, and F\JIIman, Wlshington
Root shoot ratio
Location Crop Year and management 0 to 10 em 0 to20 em 0 to 30 em 0 to 40 em
Pendleton vwv 1993, 1994: no-till, annual crop 0.11 0.13 0.14 0.15 1999: conventional, continuous 0.11 0.12 0.13 NA 1999: no-till continuous 0.15 0.17 0.17 NA 2000: conventional after fallow O.o7 0.08 NA NA
Pullman vwv 1993, 1994 no-till, annual crop 0.15 0.15 NA NA 1995: conventional moldboard plow, annual crop 0.09 0.11 NA NA 1995: burn low till, annual crop 0.14 0.16 NA NA
Pendleton w::, 1993, 1994: conventional, after fallow 0.22 0.24 0.25 0.26 Pendleton SN 1993, 1994: conventional tillage, annual aop; 0.13 0.16 0.17 0.17
2000: no-till , annual crop Pendleton SP 1993, 1994: conventional, after VWV 0.03 O.Q4 0.04 0.05 Pullman SP 1993, 1994: conventional, after VWV 0.06 0.07 NA NA Notes: VWV = winter wheat. SN = spring wheat. w::, = winter canol a. SP = spring peas.
.OU~ OF SOl LAND 'I'ATER roNSffiv'AllOO SEPTicx::T20'13-XO.. 68. NO. 5 I 357
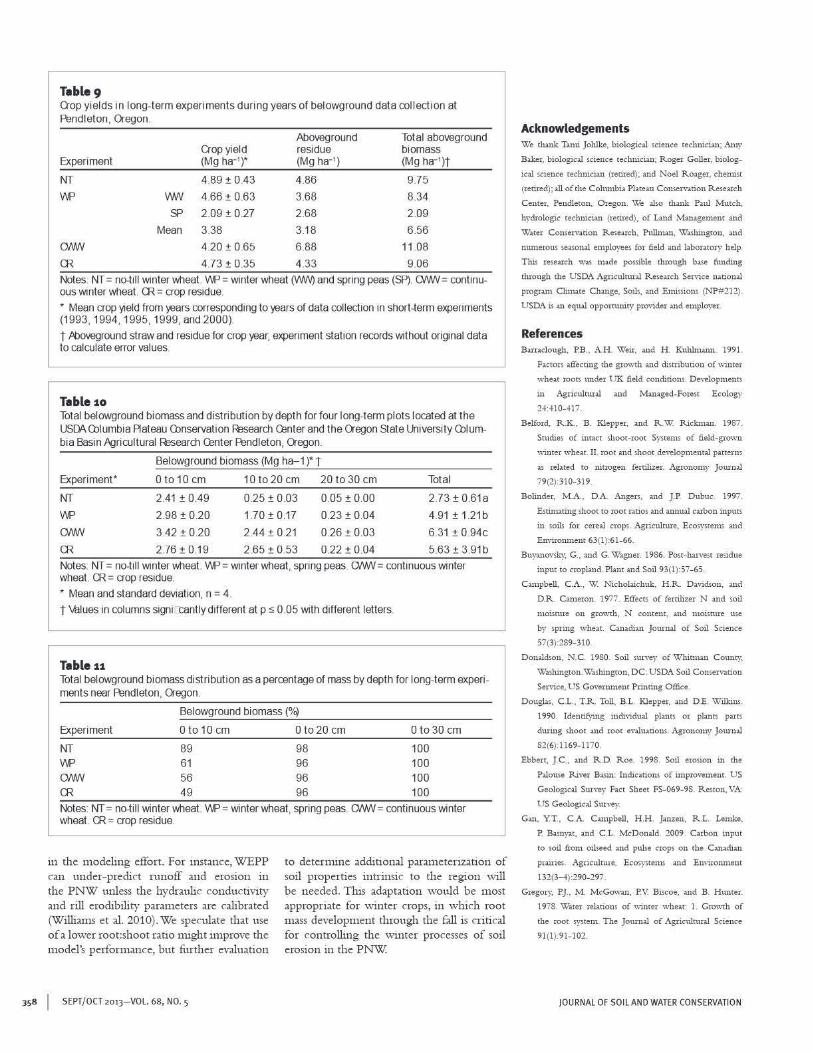
Table 9 Qop yields in long-term experiments during years of belowground data col lection at Pendleton. Oregon.
Experiment
NT
wt>
ONN
0<
vwv SP
Mean
Crop yield (Mg ha-' )*
4.89 ± 0.43
4.66 ± 0.63
2.09 ± 0.27
3.38
4.20 ± 0.65
4 73 ± 0.35
Aboveground Total aboveground residue biomass (Mg ha-') (Mg ha-')t
4.86 9.75
3.68 8.34
2.68 2.09
3.18 6.56
6.88 11 .08
4.33 906 Notes; NT = no-till Winter wheat. wt> = winter wheat 0fNV) and spring peas (SP). ONN= continuous winter wheat. 0< = crop residue.
• Mean crop yield from years corresponding to years of data collection in short-term experiments 0993,1994, 1 995 , 1999, and2000~
t Pboveground straw and residue for crop year, experiment station records without original data to calculate error values.
Table so Total belowground biomass and distribution by depth for four long-term plots located at the USOA.Cblumbia Plateau Cbnservation Researdl Center and the Oregon State University Cblumbia Basin ~rirultural Research Center Pendleton, Oregon.
Belowground bi amass (M g ha-1}" T Experiment• 0 to 10 em 10 to 20 em 20 to30 em Total
NT 2.41 ± 0.49 0.25 ± 0.03 0.05 ± 0.00 2.73 ± 0.61a
wt> 2.98 ± 0.20 1.70 ± 0.17 0.23 ± 0.04 4.91 ± 1.21b
ONN 3.42 ± 0.20 2.44 ± 0.21 0.26 ± 0.03 6.31 ± 0.94c
0< 2.76 ± 0.19 2.65 ± 0 53 0.22 ± 0.04 5.63 ± 3.91 b Notes; NT= no-till Winter wheal. wt> = wmter wheat. spring peas ONN = continuous wmter wheal. 0< = crop residue.
• Mean and standard deviation, n = 4 t Values 1n columns signLcantly different at p s 0 05 with different letters.
Table u Total belowground biomass distribution as a percentage of mass by depth for long-term experiments near Pendleton, O'egon.
Belowground biomass(%)
Experiment 0 to 10 em 0 to 20 em 0 to 30 em
NT wt> ONN 0<
89 61 56 49
98 96 96 96
100 100 100 100
Notes: NT= no-till winter wheat. wt> = winter wheat. spring peas. ONN =continuous winter wheat. 0< = crop residue.
Acknowledgements We thank Tanu Johlke. biologtcal sc1euce tecluuciau; Aluy
Baker. biologic.a1 science cechuician; Roger Goller. biolog
ical science teclmician (retired)~ and Noel Roager. chenllst
(retired); all of the Coh.nnbia Platea.u Conservation Research
Ceurer, Pendleton, Oregon. We olso thank Paul Mutch,
hydrologic tedmiciau (retired). of Laud Management and
Wa.[e.r Conservation Rese..arch, Pullnun, Waslungton, and
numerous season:al employee:s for tield :and h.borarory help.
Thts research ,_-., made possible through base funding
through the USDA Agneulrural Research Sen~ce national
program Climate Change, S01ls, and Emissiotu (NP#212).
USDA ts an equol oppornuury provider and employer
References B.rraclough, P.B .. A.H Werr. •nd H . Kuhlnmm. ! 991
Factors .tfecting the SW"~h and dmriburion of "oinrer
wheat roots 1mder l.JK field condltioru. Developments
Ill Agnculnuol >nd Mmaged-Forest Ecology
24:HO-H7.
Belford, R .K. B. Klepper, and R .W. Rickman. 1987.
SmdJes of intact shoor-root Systems of field-growu
\\<inter wheat. II. rooc and shoot developmental pacterru
as reb.ted ro nitrogen fertilizer. Agronon1y Jotunal
79(2):310-319.
Bolinder. M .A.. D.A Augers. and J.P. Dubuc. 1997.
Estimating shoot to root ratios and annual carbon inputs
in soils for cereal crops. Agriculmre., Ecosystems and
Euvll:oruueut 63(1):61-66.
Buyanovsky, G., and G. Wagner. 1986. Post-harvest residue
input to cropland. Plaut and Soil 93(1):57-65.
Campbell, C.A., W. Nicholaichuk, H R. D"~clsou, and
D.R . Cameron. 1977. Effects of fertilizer N and soil
mol.Srure on growth. N content. and moisrure us.e
by spring wheat. Cauadi3.lt Journal of Soil Science
57(3):289-310.
Donaldson, N .C. 1980. Soil survey of Whionan Coumy,
Washington.'X'ashiugton, DC: USDA Soil Conservation
Sen1ce, US Government Pnnting Office.
Douglu, C.L., T.R . Toll, B.L Klepp<r, and D.E . Wilkins.
1990. ldem:it).U.g iudi\oidual plants or plan£< pam
dnnng shoot and rooc evalu.aoon.s. Agronomy Journal
82(6):1169-1170.
Ebbert, J.C., and R .D. Roe 1998. Soil erouon in the
Palouse .River Basm· Incbcaoons of improvement. US
Geolog~cal Survey Fact Sheet FS-069-98. Reston. VA:
US Geologico! Survey.
Gan. Y.T .. C.A. Campbell, H.H . J•nzen. R .L. Lemke.
P. Bamyat, and C.L McDonald 2009 Carbon input
to soil from oilseed and pulse crops on the Cm•chm
in the modeling effort. For mstance, WEPP can under-predict runoff and erosion in the PNW unless the hydraulic conductivity and rill erodibility parameters are calibrated (Williams eta!. 2010). We speculate that use of a lower root:shoot ratio might improve the model's performance, but fitrther evaluation
to determine additional parameterization of prmm Agnculrure. Ecosystems and E1mronmenr
soil properties intrinsic to the region will 132(3-4):290-297.
be needed. This adaptation would be most Gregory, P.).. M. McGowan, P.V. Biscoe, and B. H1mter.
appropriate for winter crops, in which root 1978. Water relations of '"~mer wheat: 1. Growth of
mass development throttgh the fall is critical the root system. The Journal of Agricultural Science
for controlling the winter processes of soil 91(1):91-102.
erosion in the PNW
358 I SEPT/OCT 2013- VOL. 68, NO.5 (OURNAL OF SOIL AND WATER CONSERVATION
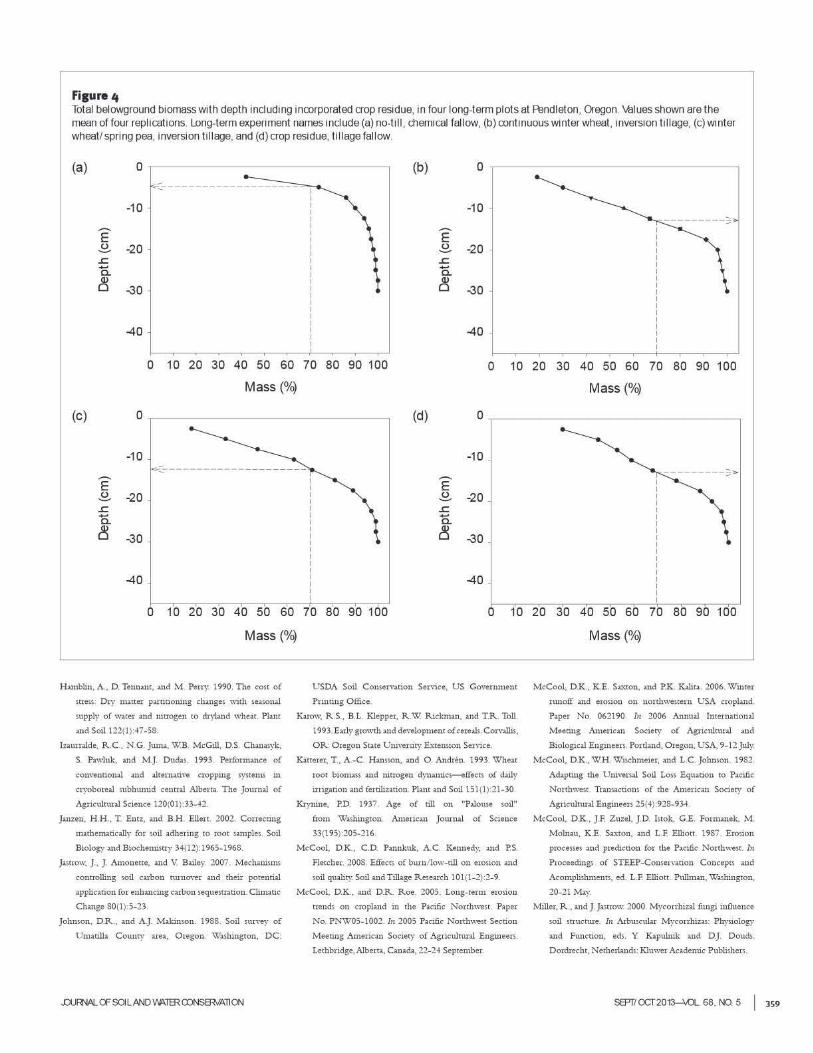
Fisure 4 Total belowground biomass with depth including Incorporated crop residue, in four long-term plots at Pendleton, Oregon Vc:llues shown are the mean of four rep I icallons. Long-term experi men I names include (a) no-ti II, chemical fallow, (b) continuous winter wheal, inversion 11 II age, (c) winter wheat/spring pea, inversion tillage, and (d) crop residue, tillage fallow.
(a) 0 (b) 0
-10 -10
E' E' 0 .._.. -20 _£. -20
.s::. .s::. -a. -a. ~ -30
Ql 0 -30
-40 -40
0 10 20 30 40 50 60 70 80 90 100 0 10 20 30 40 50 60 70 80 90 100
Mass(%) Mass(%)
(c) 0 (d) 0
-10 -10 ~---------------------
E' -E _£. -20 _£. -20 .s::. .s::. a. a. ~ -30 ~ -30
-40 -40
0 10 20 30 40 50 60 70 80 90 100 0 10 20 30 40 50 60 70 80 90 100
Mass(%)
Hamblin, A., D. Tennanc, and M. Perry 1990. The cosc of
-scrgs: Dry m:me.r partitioning ch3nges \\,_th season.al
supply of warer and niuogen ro dryl:md \Vhe:u. Platu
and Sou 122(1):47-58.
lzaurnlde, R .C ., N .G. Juma, W.B. McGill, D.S. Chanasyk,
S Pawluk, and M.J. Dudas 1993 Performance of
conventional md .Uterna.ti\'e c:roppmg system.i Ul
cryoboreal subhuuud central Alberta. The Journal of
Agncultural Science 120(01):33-42.
Jmzen, H.H .. T Encz. •nd B.H. Ellert. 2002. Correcnng
nutbematically for soil adhermg to root samples. Soil
Biology and Biochenustry 34(12):1965-1968.
J•mow, J., J. Amonette, a.nd V B:uley. 2007. Mechanisms
controlling soil carbon nunover and their potential
<tpplication for enhancing carbon sequestration. Clim<tcic
Change 80(1):5-23.
Johnson, D.R., and A.J. Makinson. 1988. Soil survey of
Umatilla County area, Oregon. \Vashington, DC:
.OU~ OF SOl LAND 'I'ATER roNSffiv'AllOO
USDA Soil C.otl.~erv:m.on Se.n"lCI!, US Governn1.em
Pnnting Office.
Karow, R .S., B.L. Klepper, R .W. Rickman, and T.R , Toll,
1993.Early grow<h and dev~lopmenr of cereals. Cor\'alhs,
OR: Oregon State U 1u\·ersiry E..xtension Sen1.ce.
IU'tcerer, T .• A -C . Hansson, and 0 Andren 1993. Wheat
root biomass and nitrogen dynamics-effects of drly
anganon and fertilization. Plant and Sou 151(1):21-30.
Krynine, P.O. 1937, Age of rill on "Palo>tse sou"
from Washington Amenc•n Journal of Science
33(195):205-216
McCool, O.K., C .D. Pannknk, A.C . Ke1medy, and P.S.
Fletcher. 200$. Effects of burn/ low-till on erosion •nd
;oil quality. Soil and Tillage Research 101(1-2):2-9.
McCool, O.K .. and D.R. Roe. 2005. Long-term erosion
trends on cropland in the Pacific Norchv.rest. Paper
No. PNWOS-100:?.. 111 2005 PaCific NorthweS< Section
Meeting American Society of Agricultural Engineers.
Le<hbridge,Alberta, Canada, 22-24 September.
Mass(%)
McCool, O.K., K.E. Saxron. and P.K. Kaliu. 2006 Wmcer
nmotr za.nd e.ros.1on on norrhwe.stun USA cropb.nd,
Paper No. 062190. 111 2006 Annual International
Meeong American Sooecy of Agriculrural and
B1ological Engmeers. Pordand, Oregon, USA, 9-12 July.
McCool, O.K., WH Wischmeier, and L.C . Johnson ! 982.
Adapnng tbe Universal Soil Loss Equation to Pacific
Northwest. Transacnons of the Amenc411 Society of
Agncultural Engmeers 25(4):928-934
McCool, O.K., J.F. Zuzel, J.D. lstok, G.E. Formanek, M
Moln•u. K.E. Su~on, and L.F Elliott. 1987 Ewsion
processes and precbcnon for the Pacific Northwest. In
Proceeding; of STEEP-ConservatiOn Concepts and
Aeomplishmen", ed. L.F. Elliott. Pullman, Washington,
20-21 May.
Miller, R., and]. Jastrow. 2000. Mycorrhizal fungi influence
soil suncnue. In Arbmcular Mycorrhizas: PhySlology
and Ftmetion, eds. Y. Kapulnik md D.J. Douds.
Dordrecht. Netherlands: Kln\\'er Academic Publishers.
SEPTicx::T2013-XO.. 68, NO. 5 I 359
Paustian, K., 0. Andren. M. Clarholm, 1\.C. Hansson, G.
Johansson, ]. Lagerlof, T. Lmdberg, R. Peccemon, and
B. Sohlenius. 1990. Carbon and nirrogen budgets of
four agro-ecosyscems with a.mmal and perenuial crops,
with and without N fertilization. Journal of Applied
Ecology 27(1):60-84.
R asmussen, P.E., H.P. Collins, and R .W. Smiley. 199-1.
Long-cerm man:ag~!me1u e«eccs on soil producchit)'
:and crop y1eld in senu-arid regJoru oC tastern Oregon.
Iu Stanon Bullenn 675. Co,':l!lis, OR: Agricultural
E:xpt~.nn1ent Stanon, Oregon $race Universit}'·
Renud, K.G , G.R . Foster, G.A. Weesie<, O.K. McCool,
and D.C. Yoder. 1997. Pre<hccmg Soil EroS>on b)•Warer:
A Gmde to Comervaoon Plannmg wnh the Revised
Universal Soil Loss Equ•rion (RUSLE) \Vaslungton.
DC: US Government Prmting Office. USDA.
Ronud. K.G .. and J.R. Simmton. 1990. Applicaoon
of RUSLE to rangelands. In ASCE Conference,
Watershed Pbmung •nd Anal )"is Ul Action. Committee
on Watershed M.nagen1ent/ lrrigarion & Drain~ge
Dhi sion. Dtuango, Colorado. 9-11 Jul}:
Russell, E.W. 1961. Crop Condinoru and Plant Growth.
New York: Jolm \Viley and Soru Ltd.
Schillinger, W.F. 2011. Rainfall impacts winter wheat
seedling emergence from deep planting depths.
Agronomy Journal 103(3):730-734.
Steele, R.G.D., and J.H. Terrie. 1960. Principles and
Procedw·es of Statistics. New York: McGraw HilL
USDA. 1978. Palouse cooperative river basin smdy. USDA
Soil Conservation Seni.ce, USDA Forest Service, and
U SDA Economics, Statistics, and Cooperative Sen-rices
Report 797-658.Washington DC: GoYenunent
Printing Office.
USDA ARS (Agriculrnr:ll Research Semce). 1995.
WEPP Model Documemation.USDA-\Vater Erosion
Prediction Project, Hillslope Pro6.1e and Watershed
Model Documentation, NSERL Report #10,
Julv 1995. http:/ /"~""'.ars.usda.go\'/Research/docs.
hon?doctd=18073.
USDA ARS. 2008. Draft Science Documenuoon, Revised
Uni\'trs.:U Soil Loss Equation, v~rsion 2 . hcrp:/ / ww., .. v
ars.usda.gov/ sp2UserFlles/ Pl.ce/ 6-IOSOS10/ RUSLE/
RUSLE2_Sc,ence_Doc.pdf.
USDA NASS (Nacional Agriculrural Stansocs Service). 2012.
Qmck Stars http:/ I quickscats nass.usda.gov/.
WillLlllU, J.D. 2008. Soil erosion from dryland wmter
wheAc-[;illow m ~ long~term res1due and nutrient
nunagement e:-..-periment m north-c;entra1 Oregon.
Journal of Soil and W•ter Conservation 63(2):53-59,
d0l:I0.2489/ jswc.63.2.53.
Wilh•ms, J D., S. Dtm. D.S Robertson. J.Q. Wu, E.S.
Brooks, D.C. Flanagan , and D.K. McCool. 2010.
WEPP sinuilations of dryland cropping systems in
small drainages of nonheastern Oregon. Journal of Soil
and Water Conservation 65(1):22-33, dol:!0.2-189/
jswc.65. 1.22.
)60 I SEPT/ OCT 2013-VOL. 68, NO.5
Williams, J.D., H.T. Gollany, M.C. Siemens, S.B. Wuest, and
D.S. Long. 2009. Comp:uison of rw10ff, soil eroS>on, aud
wmcer wheat yields frou1 no-till and im·ersiou cil.h.ge
production systems in nonheasceru Oregon. Journal of
Soil and Wacer Conservation 64(1):H-52, doi:10.2~89/
JSWc.6 4.1.H.
Williams, J.D. , D.E . Wilkins, C.L. Douglas, and R.W.
Ricknun 2000. Mow-plow crop residue management
mtluence on soil eronon 1n nonh-cencr:a) Oregon. SoU
and Tillage Reseuch 55(1-2):71-78
Zuzel, J.F., R .R . Allmar:u, and R .N. Greenwalt, 1982.
Runoff and Wll trosion on frozt"n soils in nort.htascern
Oregon. j ourna1 oC S011 :and Wa[tr Conservation
37(6):351-354
JOURNAL OF SOIL AND WATER CONSERVATION