Embed Size (px)
Citation preview

ROOT for beginners
First DayDiscovering the
graphical environment

Welcome to ROOT !Today's menu:
We present a guided tour ofbasic use of ROOT in order toplot spectra and make prettypictures ! For further information, you
should consult the "User'sGuide" at http://root.cern.ch
Handling ROOT filesPlotting 1-D spectraHandling canvases
Decorating a figureFitting a 1-D spectrum
Operations on 2-D spectraSaving figures

Handling ROOT files

TBrowser – the ROOT navigator• You just need to know one command in order to
start the ROOT file/spectra browser :root [0] new TBrowser
Or you could do:TBrowser totoorTBrowser *tata = new TBrowser
Explanations tomorrow (Day 2)!
http://caeinfo.in2p3.fr/root/Formation/en/Day1/hsimple.root

Open a ROOT file withTBrowser
• In the File menu of TBrowser, select"Open…"
• Select a file in the dialogue box whichappears:
1. Select thefile

Open a ROOT file withTBrowser
2. Click"Open"
• In the File menu of TBrowser, select"Open…"
• Select a file in the dialogue box whichappears:

Looking at ROOT file contents
• The file has been added to the list of open ROOTfiles - to see it, you have to display the list
1. Double clickon ROOTFiles

Looking at ROOT file contents
• Next click on the file to see its contents:
2. Click the file

Looking at ROOT file contents
• You see (if you choose the right options) alist of spectra with their titles
3. Choose option"detailed list"

Looking at ROOT file contents
• Icons represent the different types of spectra:– profile, 1-D histogram, 2-D histogram, N-tuple…

Plotting spectra
First of all, 1-D spectra

Plotting a spectrum
• To plot a 1-D histogram, nothing could besimpler: double-click it!
1. Double-clickhistogram "hpx"

Discovering the canvas(TCanvas)
• A new window appears - the canvas

The canvas objects• This canvas contains many objects which
we can manipulate:
Spectrumtitle
Statisticsbox withname ofhistogram
Displayframe
"Y" axis
"X" axis
The histogram
Canvas
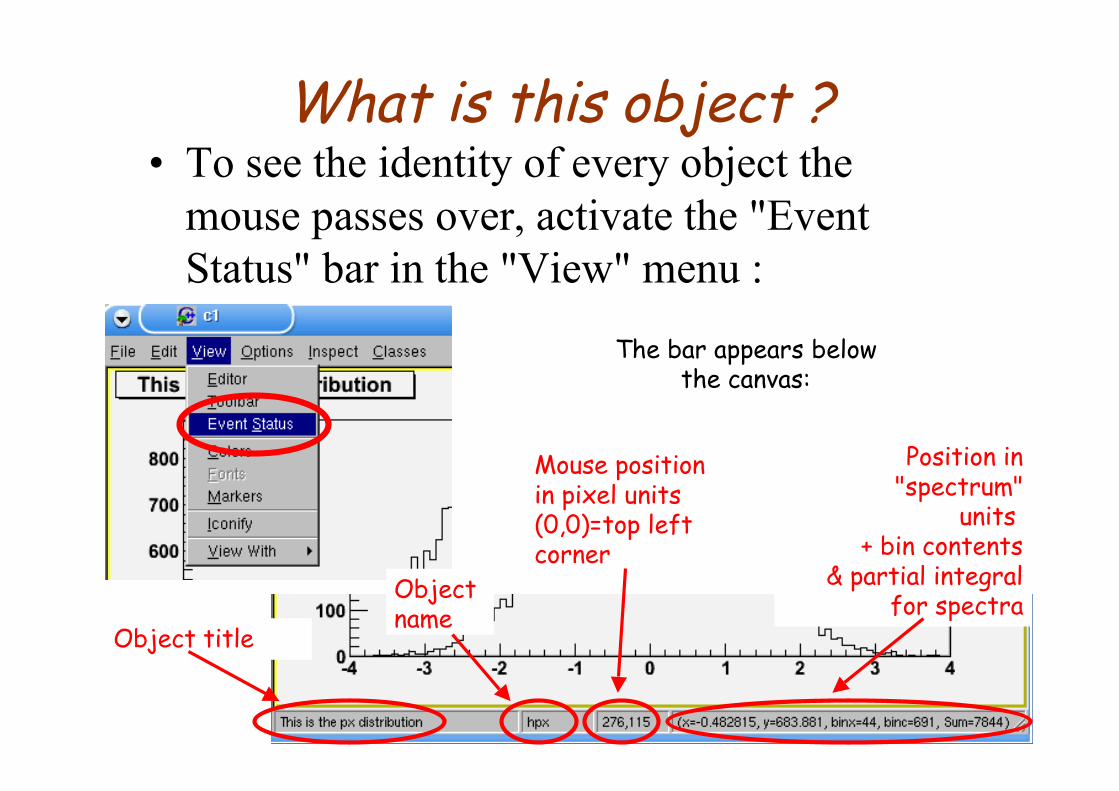
What is this object ?• To see the identity of every object the
mouse passes over, activate the "EventStatus" bar in the "View" menu :
The bar appears belowthe canvas:
Object title
Objectname
Mouse positionin pixel units(0,0)=top leftcorner
Position in"spectrum"
units+ bin contents
& partial integralfor spectra
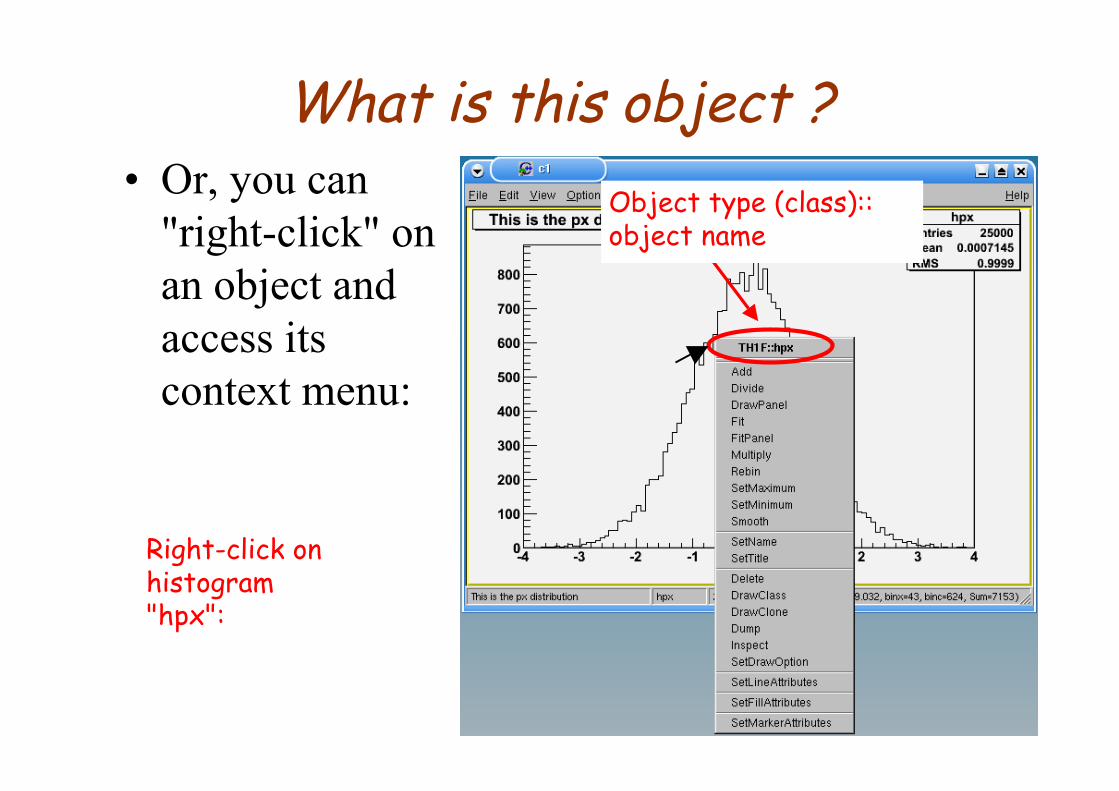
What is this object ?• Or, you can
"right-click" onan object andaccess itscontext menu:
Right-click onhistogram"hpx":
Object type (class)::object name
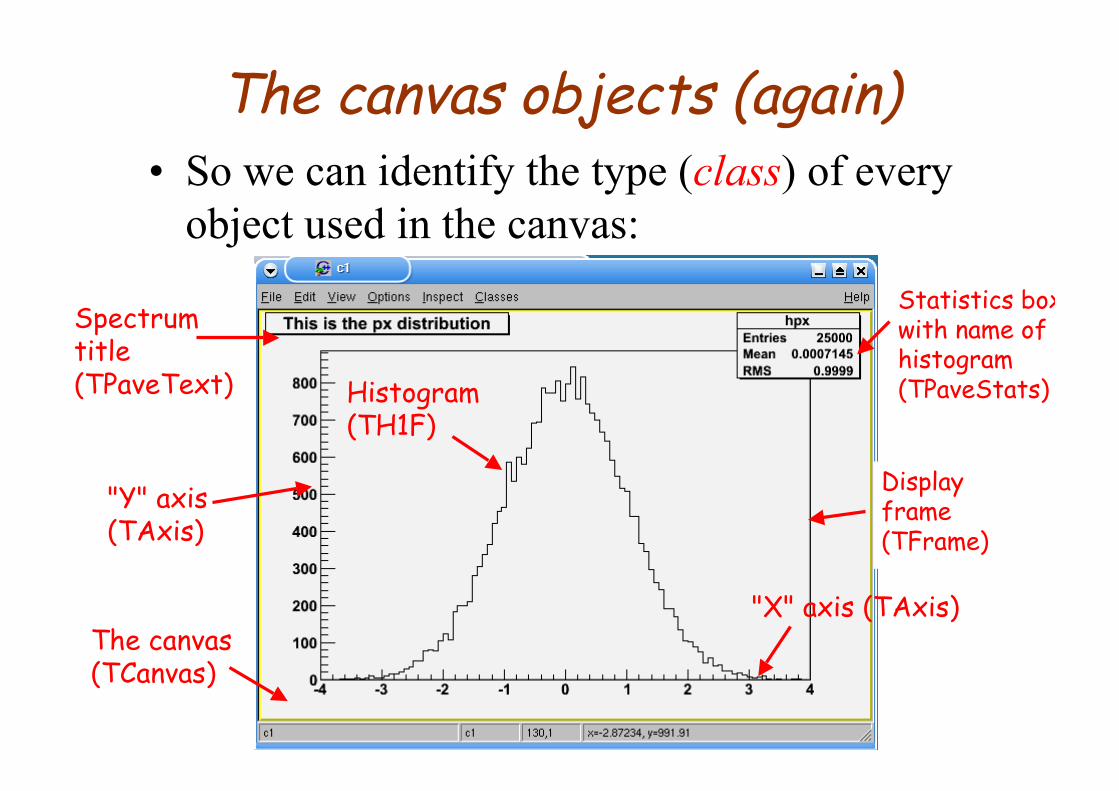
The canvas objects (again)• So we can identify the type (class) of every
object used in the canvas:
Spectrumtitle(TPaveText)
Statistics boxwith name ofhistogram(TPaveStats)
Displayframe(TFrame)
"Y" axis(TAxis)
"X" axis (TAxis)
Histogram(TH1F)
The canvas(TCanvas)

Manipulating objects• Use the mouse to move and resize objects…
With the left buttonof the mouse you canreposition andredimension allobjects in the canvas
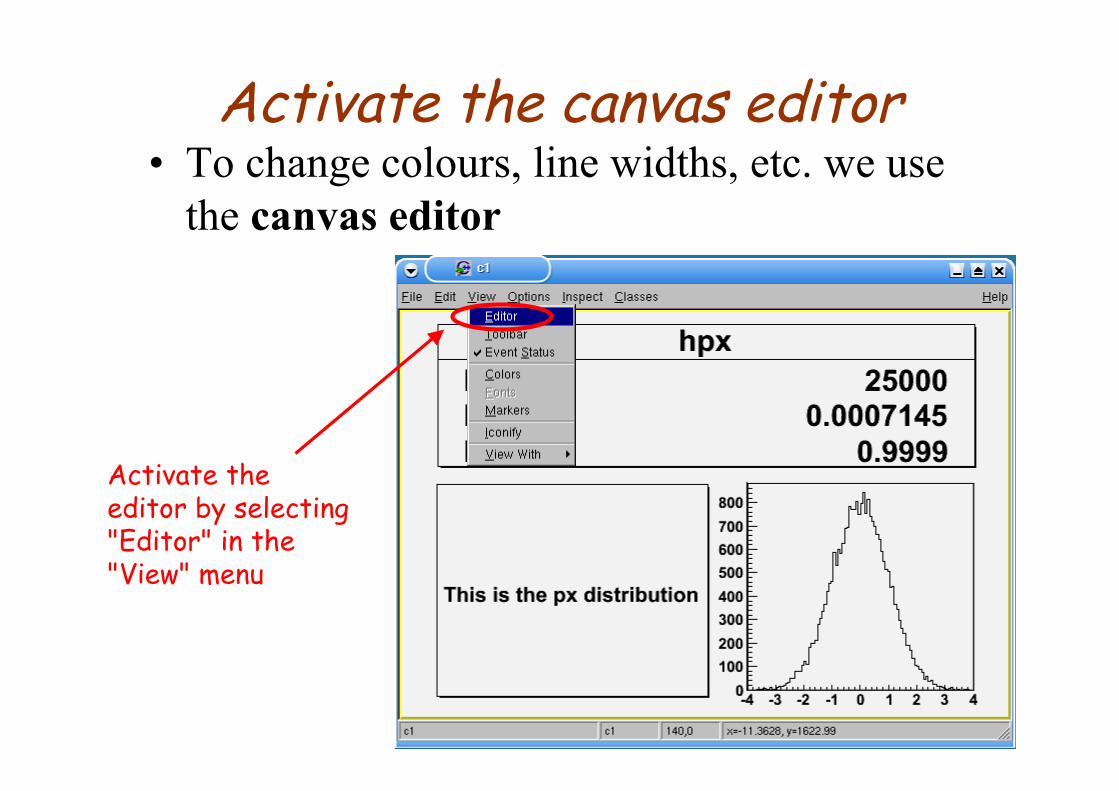
Activate the canvas editor• To change colours, line widths, etc. we use
the canvas editor
Activate theeditor by selecting"Editor" in the"View" menu

Canvas editor• The editor appears to the left of the canvas• It displays/modifies the characteristics of the last
object selected with the mouse (careful!)Name & type (class)of last-clickedobject
E.g. Tick here tomake all spectrascales on this canvaslogarithmic

Canvas editor
Like this !
• The editor appears to the left of the canvas• It displays/modifies the characteristics of the last
object selected with the mouse (careful!)

Changing the look of a spectrum
1. Check you haveselected the rightobject
• or "the art of clicking in the right place at the right time"…

Changing the look of a spectrum
2. Click the line-colour box tothe palette
• or "the art of clicking in the right place at the right time"…

Changing the look of a spectrum
3. Choose a fillstyle…
• or "the art of clicking in the right place at the right time"…

Changing the look of a spectrum
4. …and a colour inorder to activate it
• or "the art of clicking in the right place at the right time"…
Changing the look of a spectrum
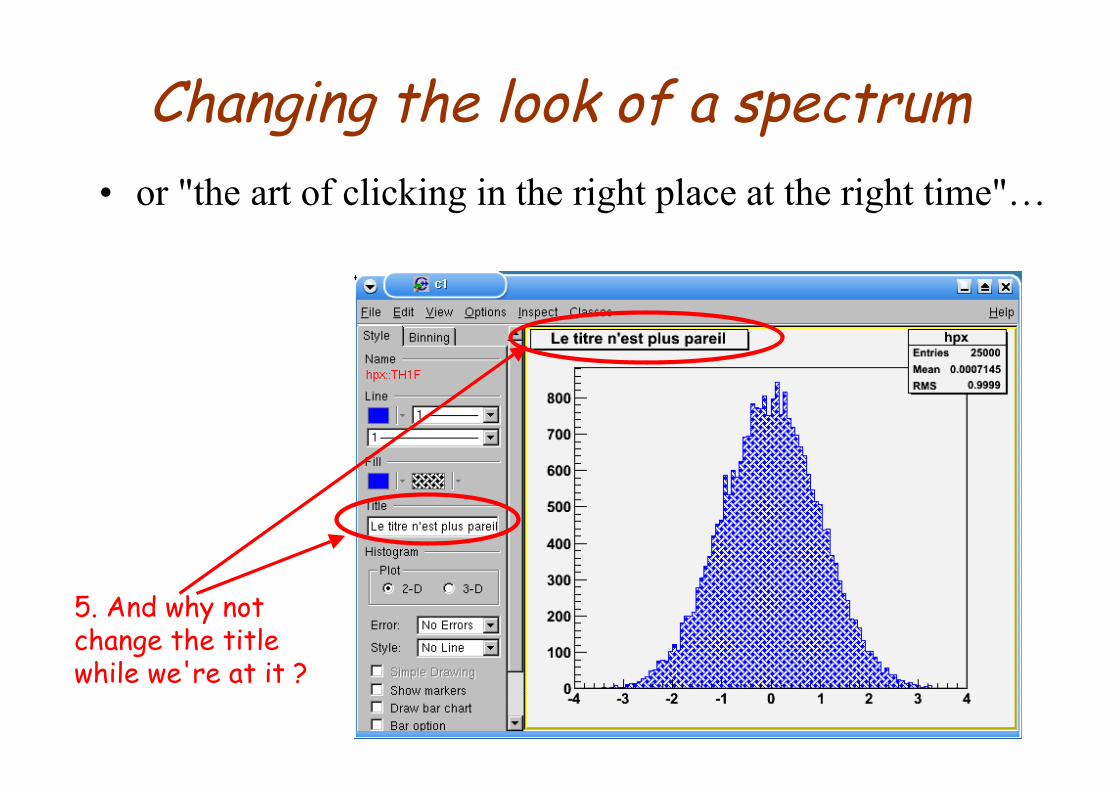
5. And why notchange the titlewhile we're at it ?
• or "the art of clicking in the right place at the right time"…

Changing the look of a spectrum
…as well as therange of displayedaxis values
On the second tabyou can change thebinning…
• or "the art of clicking in the right place at the right time"…

Handling the canvas*
*without smudging the artwork

Canvas manipulation• If you want a new canvas:
Using an existingone…
Using the browser…WARNING !Double-click on aspectrum and it will bedrawn on the activecanvas, replacing anyprevious content

Canvas manipulation• To wipe the canvas clean:
Wipe only the active(sub-)pad…
Wipe the WHOLEcanvas (careful!)

Manipulating the canvas• To refresh the canvas display:
Sometimes, the resultof a modification is notvisible straight away.
To force an update of allthe objects on the canvas,option "Refresh" can help*
*(and reduce stress levelsand anxiety…)

Manipulating the canvas• Some useful options:
In the "Options" menu ofthe canvas we also controlwhether or not to show :
statistics boxes
histogram title
fit parameters

Manipulating the canvas• Dividing the canvas to display several
spectra at once:
Open the context menu ofthe canvas (right-click onthe canvas)
Select "Divide"

Manipulating the canvas
Number of columns
Number of rows
Margins between pads
Pad colour
Fill in the form,e.g. to have 2x2 pads:
And click "OK"
• Dividing the canvas to display severalspectra at once:
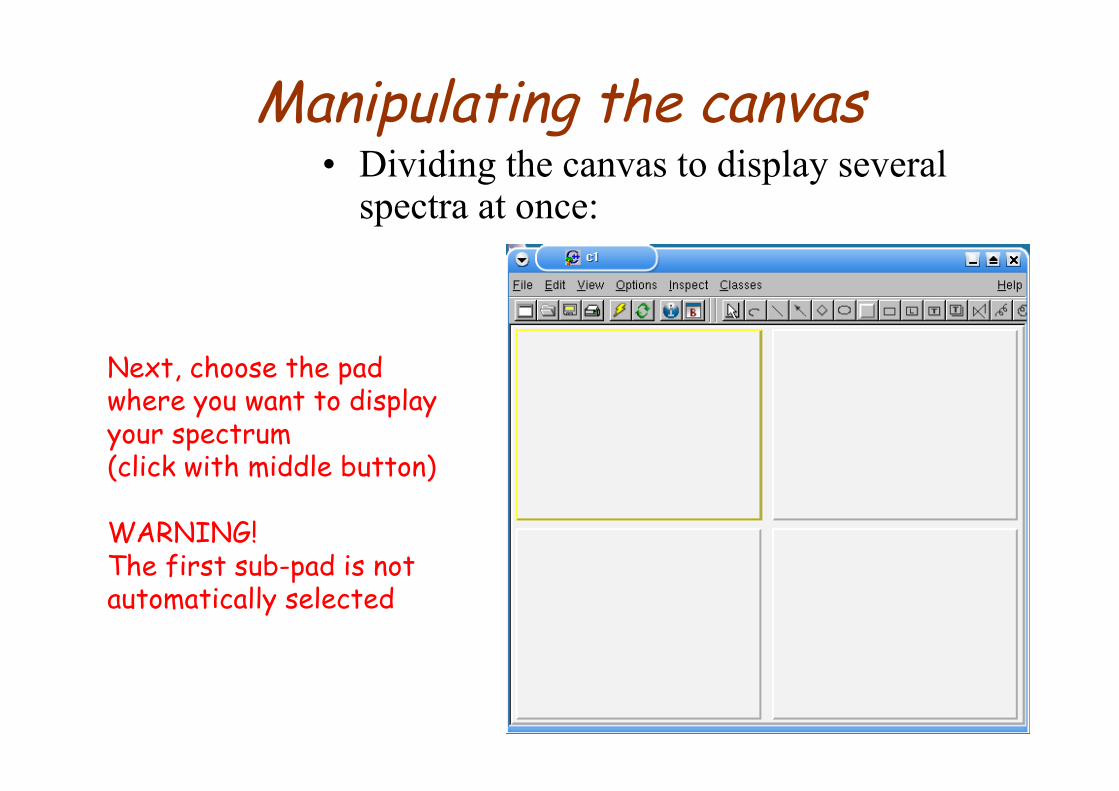
Next, choose the padwhere you want to displayyour spectrum(click with middle button)
WARNING!The first sub-pad is notautomatically selected
Manipulating the canvas• Dividing the canvas to display several
spectra at once:

Exercise

Decorating a figure
Making pretty pictures

Adding objects to the canvas
• Open the toolbar
Select "Toolbar" in the"View" menu

Adding objects to the canvas
• Open the toolbar
With the buttons we candraw all sorts ofgraphical objects on thecanvas…

Adding objects to the canvas
• Open the toolbar
…arc/circle, line,arrow, diamond, ellipse,rectangle, …

Adding object to the canvas
• Open the toolbar
…polyline, "curly line","curly arc", …

Adding objects to the canvas
• Open the toolbar
…marker, closed contour(graphical cut selection- Day 4!)

Add a pad to the canvas
• Spectra within spectra within…
Why add a pad ?
=> Easy way to have an'insert' showing e.g. azoom
Pad = mini-canvas insidea canvas (or a pad… etc.etc.)

Adding a pad
• Spectra within spectra within…
Draw the pad, thenclick on it with themiddle button to makeit active(yellow border)*
*(true for all pads/canvases)

Adding a pad
• Spectra within spectra within…
Then the next spectrumwe display will be drawnin the active (yellow)pad*
*(this is always true,even with severalwindows)

Adding text• To make the figure self-explanatory, add a
legend…
Several choices areavailable for addingtext, do you want justtext ('L' button)* ortext in a box ?
*(it's 'L' for 'LaTeX')

Adding text• …using LaTeX (well, almost)
Example of a'TPaveLabel'
Raw text entered:-4#leq p_{x}#leq 4
To change font, size,colour of text, use thecanvas editor

Exercise
Tip:it's the 2-Dspectrum'hpxpy' drawnwith option"lego" (use the'Options' drop-down menu inthe browser)

Fitting a 1-D spectrum

Fits
• Simple fitting can easily be done using thegraphical interface
Draw spectrum'hpx' and open itscontext menu
Select "FitPanel"

Fits
Choose a function:
polN = Nth order polynomial
user = user-defined function(Day 3)
• Simple fitting can easily be done using thegraphical interface

Fits
Change the range of the fit
• Simple fitting can easily be done using thegraphical interface

Fits
Click 'Fit' and the fitwill be performed, theresult appears in theactive pad/canvas(unless you choose option"N")
To see the fitparameters :menu "Options","Fit Parameters"
• Simple fitting can easily be done using thegraphical interface

Exercise

Working with 2-D spectra

Displaying 2-D spectra
• Several options are available for displaying2-D histograms:
Divide a new canvas in 4.In the browser,double-click the spectrum"hpxpy" of file"hsimple.root"
By default, a "scatter-plot"is drawn
Not very nice (butsometimes useful)…

Displaying 2-D spectra
The "Option" drop-down menu of thebrowser can be used to choose adisplay option: "box", "lego", "colz" *
*Actually, there aremore of them -"surf", "lego2","arrow"…
• Several options are available for displaying2-D histograms:

An instructive little workedexample
• Let's use our 2x2 canvas & the browser todisplay the 2-D histo "hpxpy" with 4different plotting options:
Can you do it using whatyou have learned so far ?

An instructive little workedexample
• Can't get the same spectrum to appear in 2pads at the same time ?
Look at the spectrum list inthe browser.
Does something seem alittle strange ?
Why does 'hpxpy' appeartwice in the list ? *
(Maybe it's not the only one)*You might need toupdate the browser:"View"->"Refresh"

An instructive little workedexample
Names ending in ";1" or ";N"(N>=1) * are the objects inthe file (on disk)
They cannot be modified(we opened the file in "ReadOnly" mode).
*the 'N' is a versionor 'cycle' number
• Can't get the same spectrum to appear in 2pads at the same time ?

An instructive little workedexample
Names without ";" are memory-resident copies of the spectra:these we can modify.
A new copy is made every timeyou double-click a disk-residentobject.
The previous copy is destroyed !
• Can't get the same spectrum to appear in 2pads at the same time ?

An instructive little workedexample
• Disk-resident vs. memory-resident objects
So to get the right result,you have to make sure to alwaysclick on 'hpxpy' (copy inmemory) and not 'hpxpy;1'(disk-resident).
To remove thestatistics box, usethe 'Options' menu

An instructive little workedexample
• Tip: nice colours if you can get them…
With option 'col'/'colz', thedefault colours are not veryattractive.
This will make a greatimprovement:root [0] gStyle->SetPalette(1)
Then update the canvas(menu "Options"->"Refresh")or click on the histogram.

Operations on 2-D spectra• It's easy to generate projections or profile
histograms* from 2-D spectra
*i.e. plot the mean ands.d. of one of the twovariables versus the other

Right-click to open thecontext menu
Then select e.g. ProjectionX
• It's easy to generate projections or profilehistograms from 2-D spectra
Operations on 2-D spectra

You can give a name forthe new projection.
By default (if you leave"_px") the name will be"hpxpy_px".
• It's easy to generate projections or profilehistograms from 2-D spectra
Operations on 2-D spectra

You can limit the rangeof bins included in theprojection.
By default, as here, allbins are included.
• It's easy to generate projections or profilehistograms from 2-D spectra
Operations on 2-D spectra

Options:"d" - plot in active canvas/pad"e" - calculate errors"[cut]" - use named graphicalcut to select bins (Day 4!)
• It's easy to generate projections or profilehistograms from 2-D spectra
Operations on 2-D spectra

By default, the projectionis not displayed, but shouldbe present in the browser(after a "Refresh")
• It's easy to generate projections or profilehistograms from 2-D spectra
Operations on 2-D spectra

Exercise

Saving your figures
It'd be a pity to lose everything…

Saving a masterpiece• Before saving, we'll remove the yellow border of the
active canvas - otherwise it'll be in the figure
In the canvas' contextmenu selectSetBorderModechange the value:"0" = no border

Saving a masterpiece
• Open the menu "File", sub-menu "Save"
You can save an image ofyour figure in many popularformats (PS, PDF, GIF, JPG)with the name c1.xxx bydefault*
*With "Save As…" you can even choose the name you want
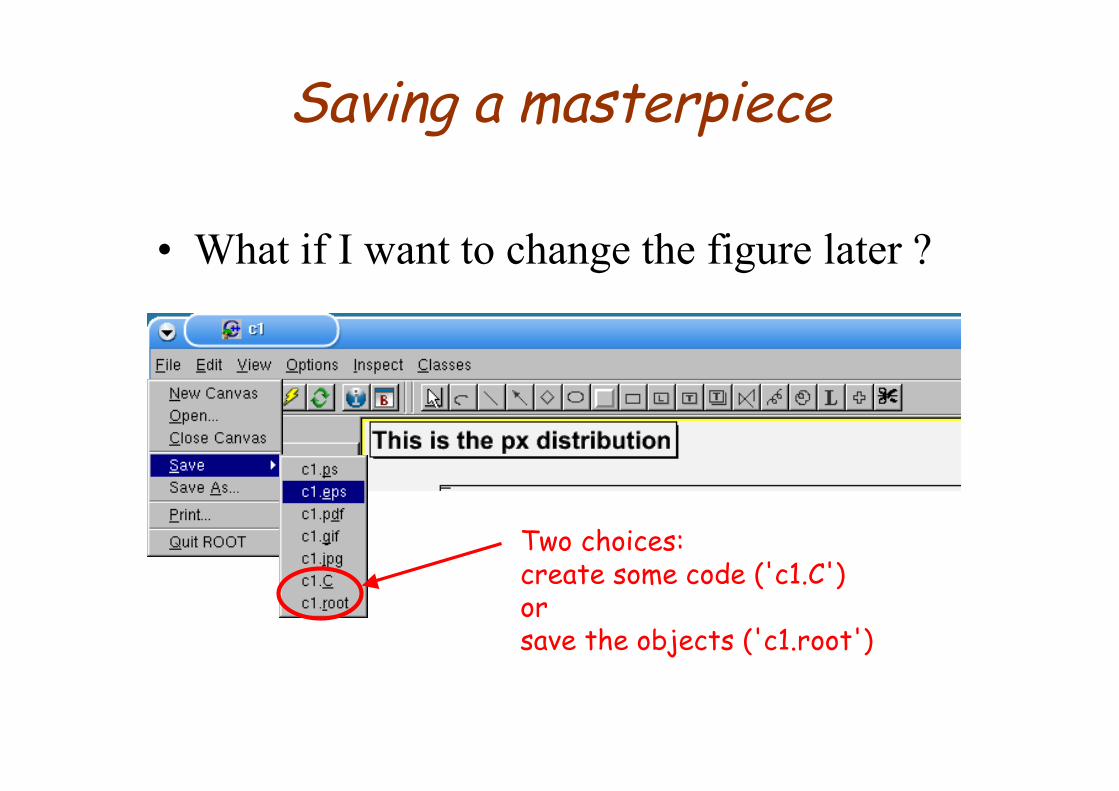
Saving a masterpiece
• What if I want to change the figure later ?
Two choices:create some code ('c1.C')orsave the objects ('c1.root')

Save the objects ???• By choosing ".root" in menu "Save", a file
'c1.root' is created.• In order to display the image later, you need to
open this file, e.g. with the browser:
It seems the file only containsone object, c1.But double-click it and…

Save the objects ???
…the figure is displayed.
In fact, a canvas is a sort of list ofobjects to display on the screen.The command "Draw" just adds anobject to this list…
• By choosing ".root" in menu "Save", a file'c1.root' is created.
• In order to display the image later, you need toopen this file, e.g. with the browser:

Create some code ?• By choosing "c1.C" in the menu, a file is
created which contains all the (C++)instructions necessary to recreate our figure
You can look atthe result in anytext editor…

Create some code ?• Tomorrow we will see how to use this kind
of code to create analysis scripts, etc.
Now this won'thurt a bit…


![Research Article Comparison of the Antifungal Efficacy of ...downloads.hindawi.com/archive/2014/575748.pdfroot canal irrigants and medications to disinfect dentin [ ]. Despite the](https://img.pdfslide.us/doc/110x75/5f18593247a7ab036b42e2d7/research-article-comparison-of-the-antifungal-efficacy-of-root-canal-irrigants.jpg)