Embed Size (px)
Citation preview
Proceedings of the International Symposium on Room Acoustics, ISRA 2010
29-31 August 2010, Melbourne, Australia
ISRA 2010 1
Room Acoustics Investigations in Hamer Hall at the Arts Centre, Melbourne
Timothy E. Gulsrud (1), Peter Exton (2), Arthur van der Harten (3), and Larry Kirkegaard (3)
(1) Kirkegaard Associates, Boulder, Colorado USA (2) Marshall Day Acoustics, Melbourne, Australia
(3) Kirkegaard Associates, Chicago, Illinois USA
PACS: 43.55.Gx
ABSTRACT
This 2,380 seat performance venue within Melbourne’s Arts Centre is scheduled for upgrades to its interiors and
acoustics as part of the Southbank Cultural Precinct Redevelopment. Kirkegaard Associates and Marshall Day
Acoustics have made collaborative room acoustics investigations in the hall to advice on the acoustic improvements.
This paper outlines the listening and measurement investigations in the hall and reports some of the significant results
found during the investigations. Comparisons between measurements made with a small directional loudspeaker sup-
plemented with a subwoofer to a standard dodecahedral loudspeaker are presented. Occupied reverberation times
measured in the hall, which to our knowledge have not been previously published, are also presented. Variation of
measured Early Decay Time is described. The reflected sound from side wall diffusion elements has been analysed
and is discussed with reference to boundary element method (BEM) model results.
INTRODUCTION
Hamer Hall is a 2,380 seat performance venue within Mel-
bourne’s Arts Centre. The hall opened in 1982 and the origi-
nal acoustic design was by Bolt Beranek and Newman [1].
The hall was in fact part of a trio of halls designed by BBN
around the same time period: Hamer Hall in Melbourne, Da-
vies Symphony Hall in San Francisco, and Roy Thompson
Hall in Toronto. The latter two halls have undergone acoustic
renovations, and now Hamer Hall is also scheduled for
acoustic improvements as part of the Southbank Cultural
Precinct Redevelopment [2].
In 2009 Kirkegaard Associates and Marshall Day Acoustics
were commissioned to advice on the acoustic design of the
redevelopment, and we have made joint room acoustic inves-
tigations in the hall. A series of measurements were made in
Hamer Hall to benchmark the existing conditions and provide
calibration of computer models incorporating proposed modi-
fications.
The hall has an interior volume of approximately 27,000m3
and seating spread across three levels: Stalls, Circle, and
Balcony. The width of the room at the Stalls level is ap-
proximately 35m and the room has deep balcony overhangs
at the Stalls and Circle seating levels. An adjustable absorp-
tion system varies the reverberation time in the hall. Plans
and sections of the hall are published in [1], and photographs
of the hall interior are shown in Figures 1 and 2.
Our preliminary investigations and discussions with musi-
cians and Arts Centre staff revealed that poor stage commu-
nication, weak and un-enveloping sound especially at the
Stalls and Circle level, variation in sound quality at different
seats, and harshness at high dynamic levels are the principal
room acoustics problems in the hall. Accordingly, our inves-
tigations were centred on these issues.
In this paper we outline some unique methods employed for
the investigations made in the hall, and report on key find-
ings, including values for occupied reverberation times in the
hall which to our knowledge have not been previously re-
ported. The design solutions for the issues outlined above are
not presented in this paper since the design for the redevel-
opment project is currently in process.
(source: Author, 2009)
Figure 1. Interior photograph of Hamer Hall viewed from the
stage.
29-31 August 2010, Melbourne, Australia Proceedings of the International Symposium on Room Acoustics, ISRA 2010
2 ISRA 2010
(source: Author, 2009)
Figure 2. Interior photograph of Hamer Hall viewed from
the Circle level seating.
ROOM ACOUSTICS INVESTIGATIONS
Measurement sound sources
Because of concerns about the limited frequency range and
strong lobing of dodecahedral loudspeakers above 1kHz [3,
4], we experimented with a small, moderately directional
loudspeaker (Meyer Sound MM-4XP) to study directional
impulse responses in the hall. The MM-4XP loudspeaker has
an operating frequency range between 120Hz and 18kHz, and
an 80 degree conical dispersion pattern between 3kHz and
14kHz [5]. These acoustical characteristics, along with its
small size, make it a useful loudspeaker for investigating
spatial qualities of a room, since it can easily be aimed in
different directions to highlight particular sound reflection
paths. For some of the measurements the MM-4XP was sup-
plemented with a Meyer Sound UMS-1P subwoofer in order
to extend its low frequency response.
The acoustic investigations in Hamer Hall provided an oppor-
tunity to make measurements with both the MM-4XP and a
dodecahedral loudspeaker (B&K 4292) in order to compare
the two loudspeaker systems. Figure 2 shows a photograph of
the two loudspeaker systems placed side-by-side on the
Hamer Hall stage during a measurement session.
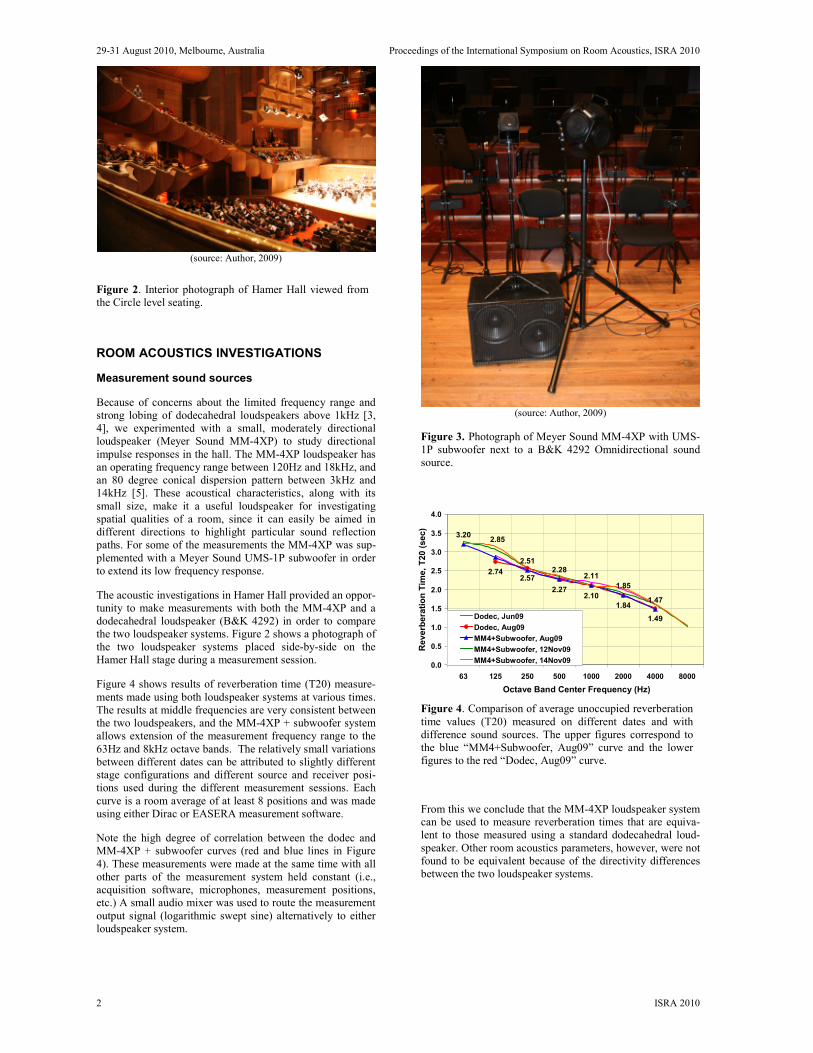
Figure 4 shows results of reverberation time (T20) measure-
ments made using both loudspeaker systems at various times.
The results at middle frequencies are very consistent between
the two loudspeakers, and the MM-4XP + subwoofer system
allows extension of the measurement frequency range to the
63Hz and 8kHz octave bands. The relatively small variations
between different dates can be attributed to slightly different
stage configurations and different source and receiver posi-
tions used during the different measurement sessions. Each
curve is a room average of at least 8 positions and was made
using either Dirac or EASERA measurement software.
Note the high degree of correlation between the dodec and
MM-4XP + subwoofer curves (red and blue lines in Figure
4). These measurements were made at the same time with all
other parts of the measurement system held constant (i.e.,
acquisition software, microphones, measurement positions,
etc.) A small audio mixer was used to route the measurement
output signal (logarithmic swept sine) alternatively to either
loudspeaker system.
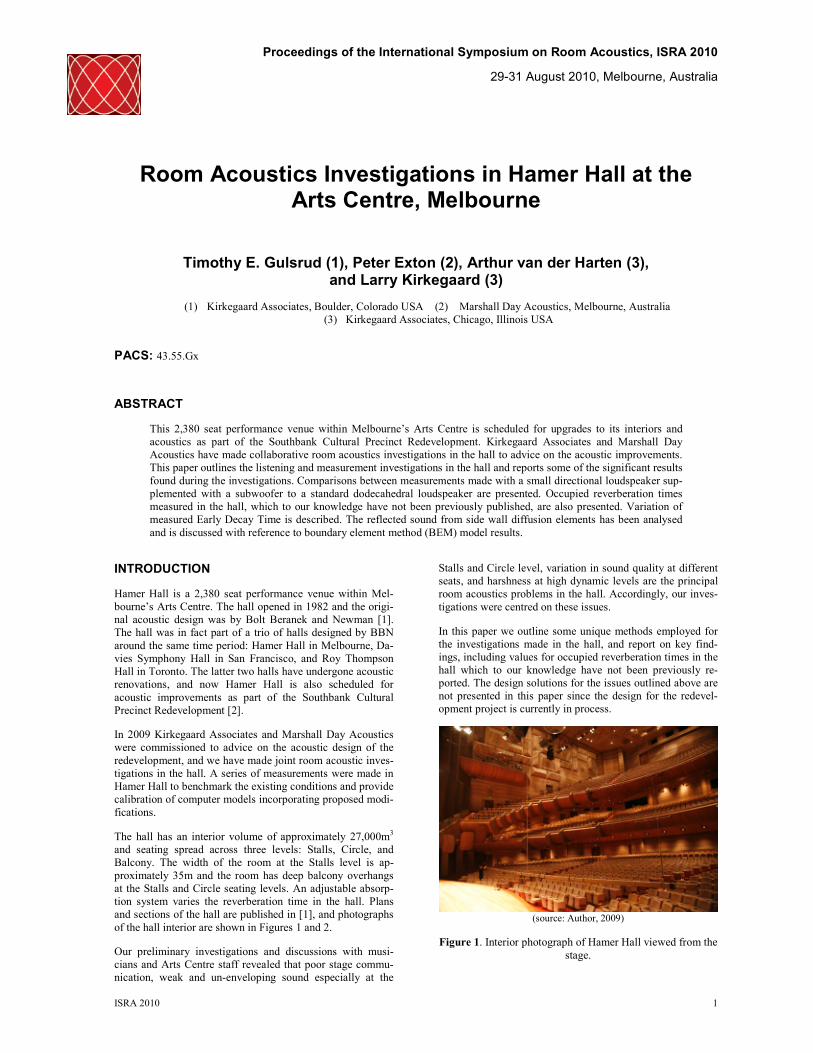
(source: Author, 2009)
Figure 3. Photograph of Meyer Sound MM-4XP with UMS-
1P subwoofer next to a B&K 4292 Omnidirectional sound
source.
2.742.57
2.272.10
1.84
1.49
3.20
2.512.28
2.11
1.85
1.47
2.85
0.0
0.5
1.0
1.5
2.0
2.5
3.0
3.5
4.0
63 125 250 500 1000 2000 4000 8000
Octave Band Center Frequency (Hz)
Reverberation Time, T20 (sec)
Dodec, Jun09
Dodec, Aug09
MM4+Subwoofer, Aug09
MM4+Subwoofer, 12Nov09
MM4+Subwoofer, 14Nov09
Figure 4. Comparison of average unoccupied reverberation
time values (T20) measured on different dates and with
difference sound sources. The upper figures correspond to
the blue “MM4+Subwoofer, Aug09” curve and the lower
figures to the red “Dodec, Aug09” curve.
From this we conclude that the MM-4XP loudspeaker system can be used to measure reverberation times that are equiva-
lent to those measured using a standard dodecahedral loud-
speaker. Other room acoustics parameters, however, were not
found to be equivalent because of the directivity differences
between the two loudspeaker systems.
29-31 August 2010, Melbourne, Australia Proceedings of the International Symposium on Room Acoustics, ISRA 2010
ISRA 2010 3
Occupied reverberation time measurements
Since a seated audience is known to have an important influ-
ence on room acoustics, and because relatively little data for
occupied halls has been published, we made room acoustics
measurements during 3 performances in November 2009.
Occupied room acoustics measurements are often avoided
because typical measurement procedures require the (quiet!)
cooperation of an audience, and they can intrude on the con-
cert experience for some patrons. In order to minimise these
concerns, we developed a strategy to allow the measurement
procedure to be as efficient as possible.
8 omnidirectional microphones were placed in seating loca-
tions distributed around the hall, and 4 microphones placed
on the stage near musicians, for a total of 12 receiver posi-
tions. Multichannel measurement software EASERA was
used in conjunction with an RME Fireface 400 computer
interface in order to measure impulse responses simultane-
ously at each microphone position. 2 different source posi-
tions were used, typically a MM-4XP placed downstage near
a concertmaster position and a second MM-4XP with sub-
woofer placed farther upstage near woodwinds or percussion.
After the orchestra was seated, but before the conductor en-
tered the platform, an announcer described the acoustic tests
that were about to occur, and a sample test signal (logarith-
mic sine sweep) was played for the audience. After this, the
audience was asked to remain silent for two sets of 3 sweeps separated by a pause. The first set of sweeps was sent to the
first source position, and the next set sent to the second
source position. Each set of sweeps was averaged in
EASERA, resulting in a set of 24 impulse responses for the
occupied condition of the hall. The entire measurement proc-
ess (not including the introduction speech) took less than 30
seconds, and was viewed sympathetically by most audience
members.
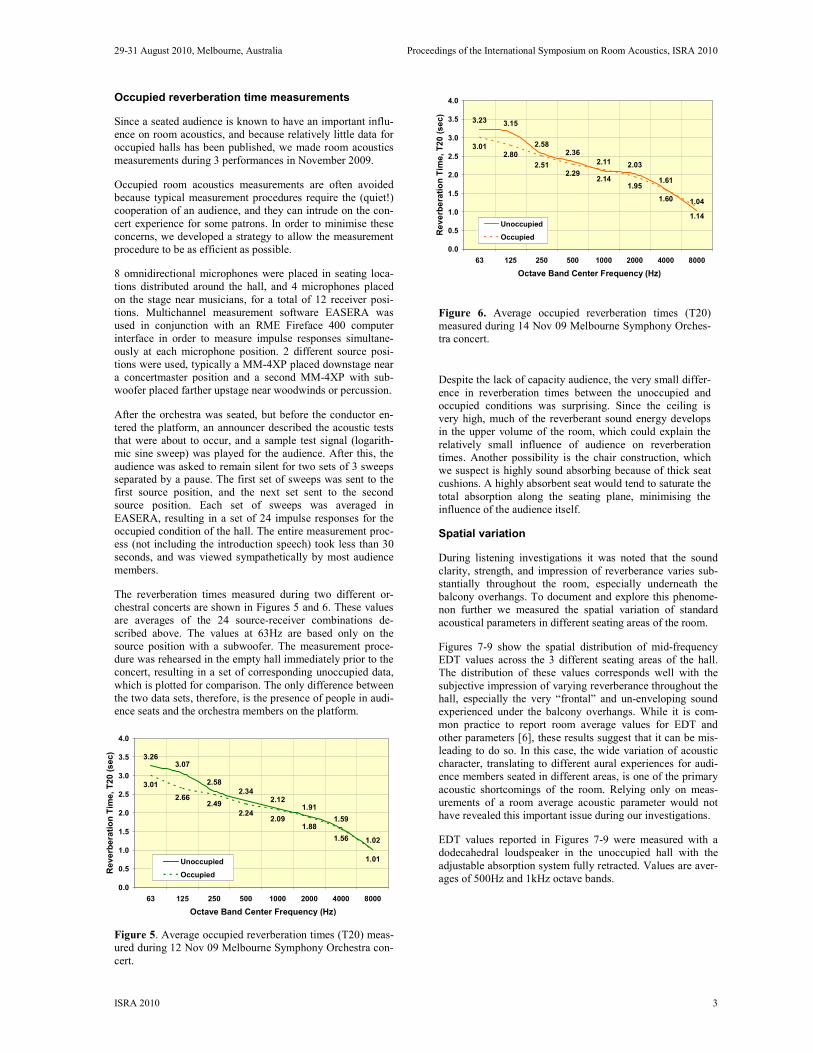
The reverberation times measured during two different or-
chestral concerts are shown in Figures 5 and 6. These values
are averages of the 24 source-receiver combinations de-
scribed above. The values at 63Hz are based only on the
source position with a subwoofer. The measurement proce-
dure was rehearsed in the empty hall immediately prior to the
concert, resulting in a set of corresponding unoccupied data,
which is plotted for comparison. The only difference between
the two data sets, therefore, is the presence of people in audi-
ence seats and the orchestra members on the platform.
3.263.07
2.58
2.342.12
1.91
1.59
1.02
3.01
2.662.49
2.242.09
1.88
1.56
1.01
0.0
0.5
1.0
1.5
2.0
2.5
3.0
3.5
4.0
63 125 250 500 1000 2000 4000 8000
Octave Band Center Frequency (Hz)
Reverberation Time, T20 (sec)
Unoccupied
Occupied
Figure 5. Average occupied reverberation times (T20) meas-
ured during 12 Nov 09 Melbourne Symphony Orchestra con-
cert.
3.23 3.15
2.582.36
2.11 2.03
1.61
1.04
3.012.80
2.512.29
2.141.95
1.60
1.14
0.0
0.5
1.0
1.5
2.0
2.5
3.0
3.5
4.0
63 125 250 500 1000 2000 4000 8000
Octave Band Center Frequency (Hz)
Reverberation Time, T20 (sec)
Unoccupied
Occupied
Figure 6. Average occupied reverberation times (T20)
measured during 14 Nov 09 Melbourne Symphony Orches-
tra concert.
Despite the lack of capacity audience, the very small differ-
ence in reverberation times between the unoccupied and
occupied conditions was surprising. Since the ceiling is
very high, much of the reverberant sound energy develops
in the upper volume of the room, which could explain the
relatively small influence of audience on reverberation
times. Another possibility is the chair construction, which
we suspect is highly sound absorbing because of thick seat
cushions. A highly absorbent seat would tend to saturate the
total absorption along the seating plane, minimising the
influence of the audience itself.
Spatial variation
During listening investigations it was noted that the sound
clarity, strength, and impression of reverberance varies sub-
stantially throughout the room, especially underneath the
balcony overhangs. To document and explore this phenome-
non further we measured the spatial variation of standard
acoustical parameters in different seating areas of the room.
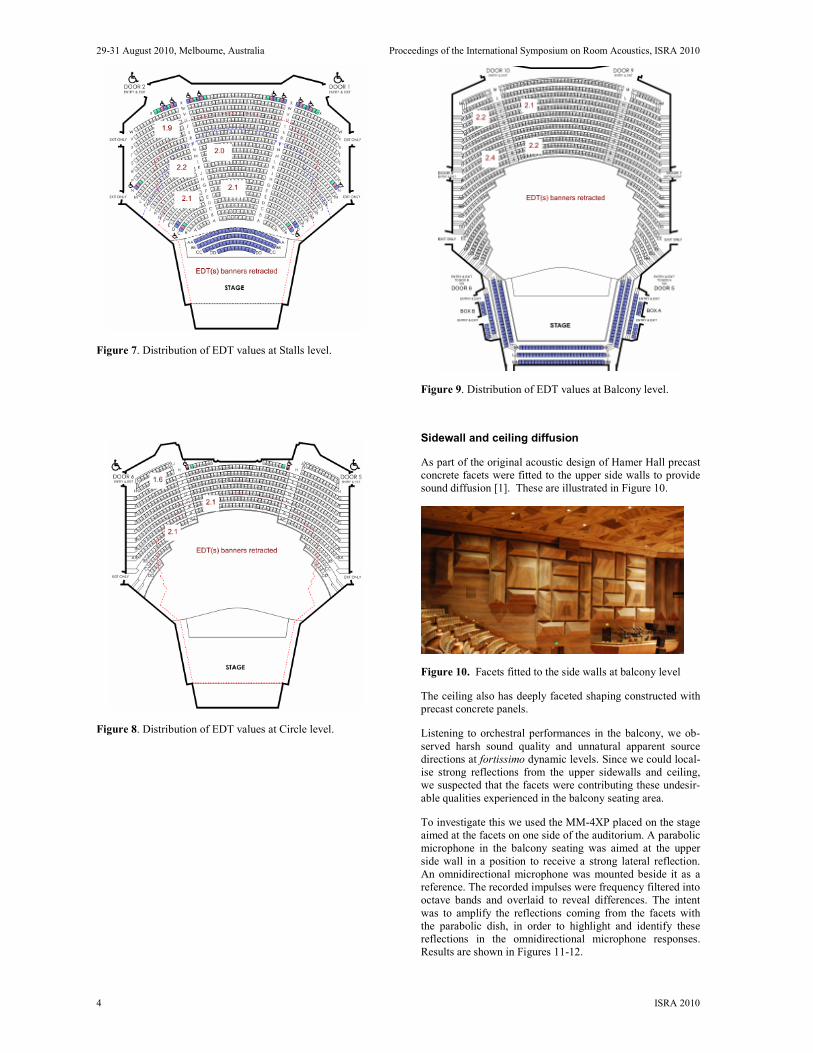
Figures 7-9 show the spatial distribution of mid-frequency
EDT values across the 3 different seating areas of the hall.
The distribution of these values corresponds well with the
subjective impression of varying reverberance throughout the
hall, especially the very “frontal” and un-enveloping sound
experienced under the balcony overhangs. While it is com-
mon practice to report room average values for EDT and
other parameters [6], these results suggest that it can be mis-
leading to do so. In this case, the wide variation of acoustic
character, translating to different aural experiences for audi-
ence members seated in different areas, is one of the primary
acoustic shortcomings of the room. Relying only on meas-
urements of a room average acoustic parameter would not
have revealed this important issue during our investigations.
EDT values reported in Figures 7-9 were measured with a
dodecahedral loudspeaker in the unoccupied hall with the
adjustable absorption system fully retracted. Values are aver-
ages of 500Hz and 1kHz octave bands.
29-31 August 2010, Melbourne, Australia Proceedings of the International Symposium on Room Acoustics, ISRA 2010
4 ISRA 2010
Figure 7. Distribution of EDT values at Stalls level.
Figure 8. Distribution of EDT values at Circle level.
Figure 9. Distribution of EDT values at Balcony level.
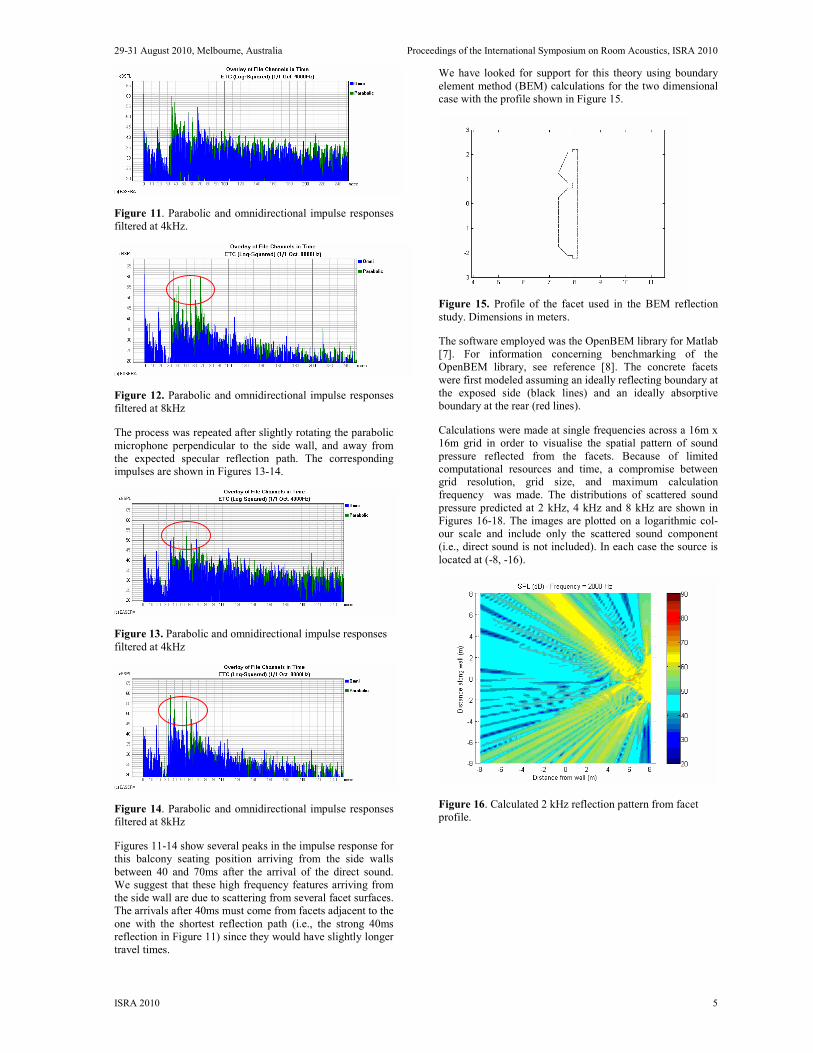
Sidewall and ceiling diffusion
As part of the original acoustic design of Hamer Hall precast
concrete facets were fitted to the upper side walls to provide
sound diffusion [1]. These are illustrated in Figure 10.
Figure 10. Facets fitted to the side walls at balcony level
The ceiling also has deeply faceted shaping constructed with
precast concrete panels.
Listening to orchestral performances in the balcony, we ob-
served harsh sound quality and unnatural apparent source
directions at fortissimo dynamic levels. Since we could local-
ise strong reflections from the upper sidewalls and ceiling,
we suspected that the facets were contributing these undesir-
able qualities experienced in the balcony seating area.
To investigate this we used the MM-4XP placed on the stage
aimed at the facets on one side of the auditorium. A parabolic
microphone in the balcony seating was aimed at the upper
side wall in a position to receive a strong lateral reflection.
An omnidirectional microphone was mounted beside it as a
reference. The recorded impulses were frequency filtered into
octave bands and overlaid to reveal differences. The intent
was to amplify the reflections coming from the facets with
the parabolic dish, in order to highlight and identify these
reflections in the omnidirectional microphone responses.
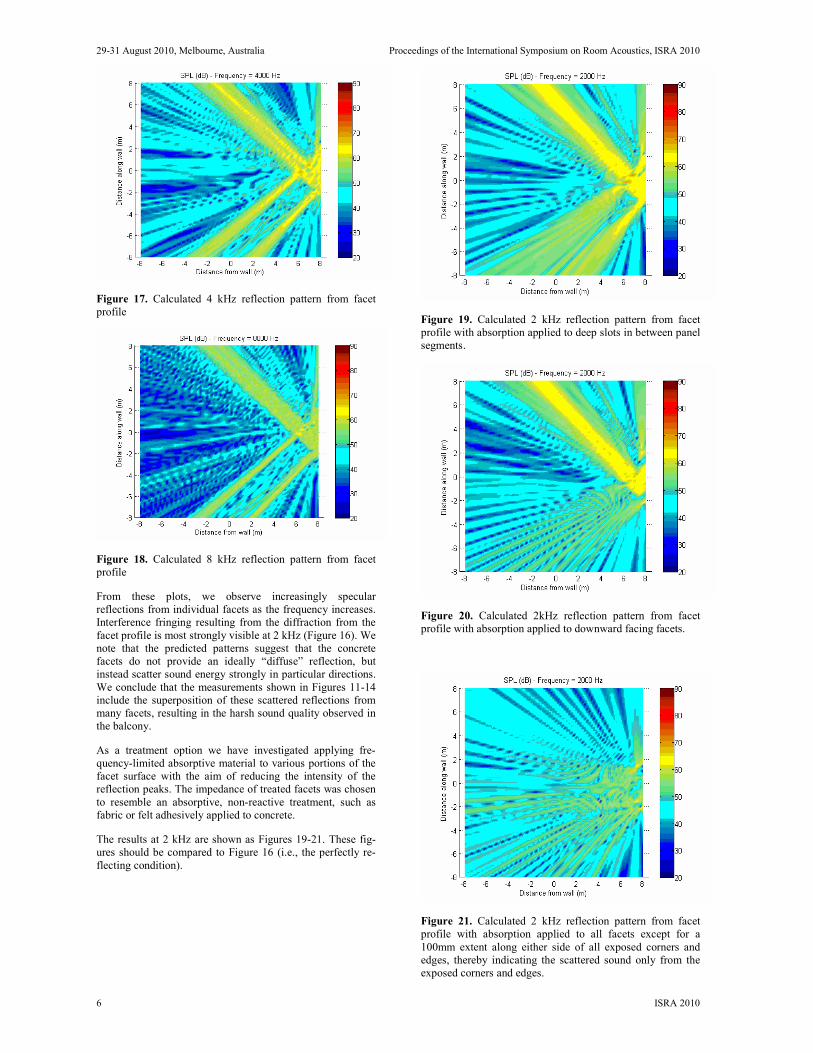
Results are shown in Figures 11-12.
29-31 August 2010, Melbourne, Australia Proceedings of the International Symposium on Room Acoustics, ISRA 2010
ISRA 2010 5
Figure 11. Parabolic and omnidirectional impulse responses
filtered at 4kHz.
Figure 12. Parabolic and omnidirectional impulse responses
filtered at 8kHz
The process was repeated after slightly rotating the parabolic
microphone perpendicular to the side wall, and away from
the expected specular reflection path. The corresponding
impulses are shown in Figures 13-14.
Figure 13. Parabolic and omnidirectional impulse responses
filtered at 4kHz
Figure 14. Parabolic and omnidirectional impulse responses
filtered at 8kHz
Figures 11-14 show several peaks in the impulse response for
this balcony seating position arriving from the side walls
between 40 and 70ms after the arrival of the direct sound.
We suggest that these high frequency features arriving from
the side wall are due to scattering from several facet surfaces.
The arrivals after 40ms must come from facets adjacent to the
one with the shortest reflection path (i.e., the strong 40ms
reflection in Figure 11) since they would have slightly longer
travel times.
We have looked for support for this theory using boundary
element method (BEM) calculations for the two dimensional
case with the profile shown in Figure 15.
Figure 15. Profile of the facet used in the BEM reflection
study. Dimensions in meters.
The software employed was the OpenBEM library for Matlab
[7]. For information concerning benchmarking of the
OpenBEM library, see reference [8]. The concrete facets
were first modeled assuming an ideally reflecting boundary at
the exposed side (black lines) and an ideally absorptive
boundary at the rear (red lines).
Calculations were made at single frequencies across a 16m x
16m grid in order to visualise the spatial pattern of sound
pressure reflected from the facets. Because of limited
computational resources and time, a compromise between grid resolution, grid size, and maximum calculation
frequency was made. The distributions of scattered sound
pressure predicted at 2 kHz, 4 kHz and 8 kHz are shown in
Figures 16-18. The images are plotted on a logarithmic col-
our scale and include only the scattered sound component
(i.e., direct sound is not included). In each case the source is
located at (-8, -16).
Figure 16. Calculated 2 kHz reflection pattern from facet
profile.
29-31 August 2010, Melbourne, Australia Proceedings of the International Symposium on Room Acoustics, ISRA 2010
6 ISRA 2010
Figure 17. Calculated 4 kHz reflection pattern from facet
profile
Figure 18. Calculated 8 kHz reflection pattern from facet
profile
From these plots, we observe increasingly specular
reflections from individual facets as the frequency increases.
Interference fringing resulting from the diffraction from the
facet profile is most strongly visible at 2 kHz (Figure 16). We
note that the predicted patterns suggest that the concrete
facets do not provide an ideally “diffuse” reflection, but
instead scatter sound energy strongly in particular directions.
We conclude that the measurements shown in Figures 11-14
include the superposition of these scattered reflections from
many facets, resulting in the harsh sound quality observed in
the balcony.
As a treatment option we have investigated applying fre-
quency-limited absorptive material to various portions of the
facet surface with the aim of reducing the intensity of the
reflection peaks. The impedance of treated facets was chosen
to resemble an absorptive, non-reactive treatment, such as
fabric or felt adhesively applied to concrete.
The results at 2 kHz are shown as Figures 19-21. These fig-
ures should be compared to Figure 16 (i.e., the perfectly re-
flecting condition).
Figure 19. Calculated 2 kHz reflection pattern from facet
profile with absorption applied to deep slots in between panel
segments.
Figure 20. Calculated 2kHz reflection pattern from facet
profile with absorption applied to downward facing facets.
Figure 21. Calculated 2 kHz reflection pattern from facet
profile with absorption applied to all facets except for a
100mm extent along either side of all exposed corners and
edges, thereby indicating the scattered sound only from the
exposed corners and edges.
29-31 August 2010, Melbourne, Australia Proceedings of the International Symposium on Room Acoustics, ISRA 2010
ISRA 2010 7
The application of high frequency absorption to the facet
surface significantly reduces the intensity of the reflected
sound for treated panel facets.
CONCLUSIONS
Collaborative room acoustics investigations have been made
in Hamer Hall at The Arts Centre, Melbourne. We used a
small loudspeaker for making directional high frequency
measurements, and found that reverberation times measured
with this sound source were compatible with those measured
with a dodecahedral loudspeaker.
We made room acoustics measurements in the occupied hall
and found very little change in reverberation times with audi-
ence and orchestra members in place. The occupied meas-
urement procedure was described in detail in order to encour-
age further studies of occupied halls.
After noticing marked differences in sound quality at differ-
ent seating positions during listening evaluation, we meas-
ured the spatial variation of acoustic parameters and found
the variation of EDT to correlate very well with the listening
experiences.
Finally, we measured high frequency reflections from the
upper side wall facets and have described a mechanism for
the tonal harshness caused by the facets. A treatment for the
correction of the tone quality of the reflections has been pro-
posed.
ACKNOWLEDGEMENTS
The authors acknowledge The Arts Centre, Melbourne, The
Melbourne Symphony Orchestra, Meyer Sound, and col-
leagues at Kirkegaard Associates and Marshall Day Acous-
tics who contributed to and made this work possible.
REFERENCES
1 P. Lord and D. Templeton, The Architecture of
Sound, (Architectural Press Limited, London,
1986) pp. 220-226
2 “Hamer Hall Redevelopment – Project Overview,”
http://www.arts.vic.gov.au/content/Public/About_U
s/Major_Projects_and_Initiatives/Southbank_Cultu
ral_Precinct_Redevelopment/Hamer_Hall_Redevel
opment_-_Project_Overview.aspx
3 T. Leishman, S. Rollins, and H. Smith, “An ex-
perimental evaluation of regular polyhedron loud-
speakers as omnidirectional sources of sound” J.
Acoust. Soc. Am. 120, 1411-1422 (2006).
4 L. Kirkegaard, “In search of a new paradigm – our
‘parameters’ tend to bias the ways we listen and
constrain the ways we think about concert hall
acoustics,” Proceedings of Internoise 2010, Lisbon,
Portugal.
5 MM-4XP Product Datasheet, Meyer Sound,
http://www.meyersound.com/pdf/products/industria
l_series/mm-4xp_ds.pdf
6 L. Beranek, Concert Halls and Opera Houses: Mu-
sic, Acoustics, and Architecture,” 2nd ed. (Springer-
Verlag, 2006) pp. 585-613.
7 P.M. Juhl and V.C. Henriquez, “OpenBEM: Open
Source Matlab Codes for the Boundary Element
Method” http://www.openbem.dk/
8 A.R. Molares and M.A. Sobreira-Seoane, “Bench-
marking for acoustic simulation software” Eu-
ronoise ‘08. 3601-3606 (2008).