Embed Size (px)
Citation preview
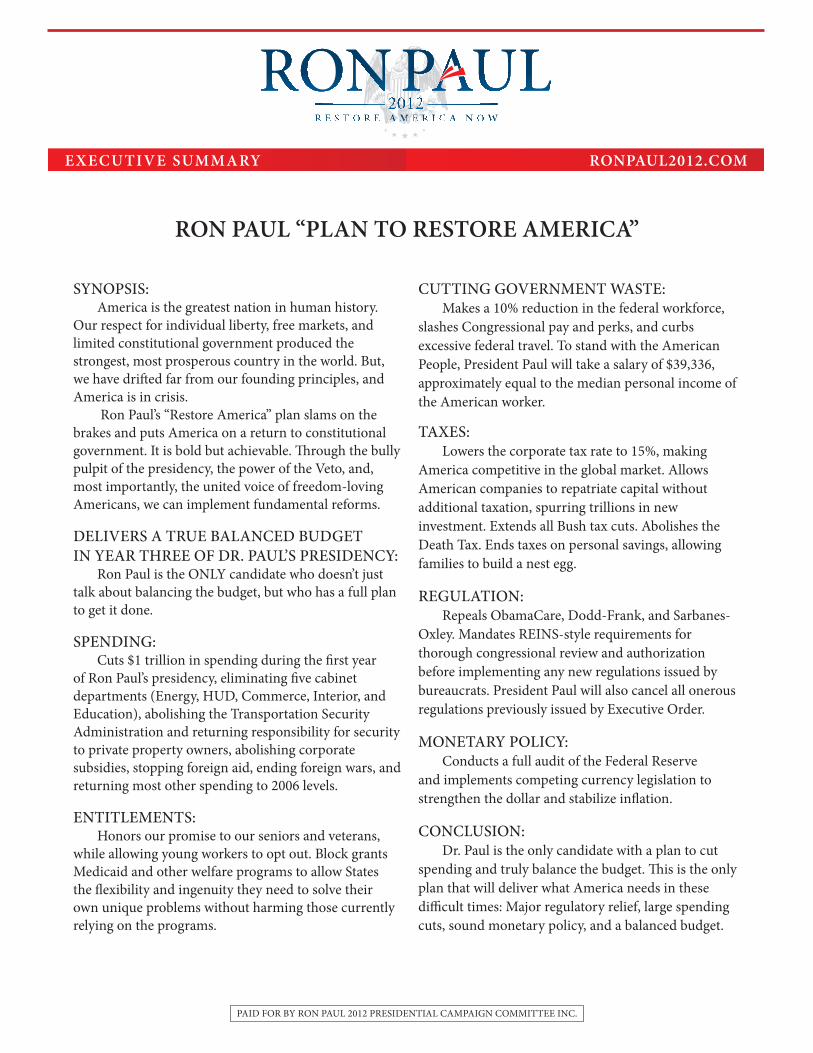
RON PAUL “PLAN TO RESTORE AMERICA”
EXECUTIVE SUMMARY RONPAUL2012.COM
SYNOPSIS: America is the greatest nation in human history.
Our respect for individual liberty, free markets, and limited constitutional government produced the strongest, most prosperous country in the world. But, we have drifted far from our founding principles, and America is in crisis.
Ron Paul’s “Restore America” plan slams on the brakes and puts America on a return to constitutional government. It is bold but achievable. Through the bully pulpit of the presidency, the power of the Veto, and, most importantly, the united voice of freedom-loving Americans, we can implement fundamental reforms.
DELIVERS A TRUE BALANCED BUDGET IN YEAR THREE OF DR. PAUL’S PRESIDENCY:
Ron Paul is the ONLY candidate who doesn’t just talk about balancing the budget, but who has a full plan to get it done.
SPENDING: Cuts $1 trillion in spending during the first year
of Ron Paul’s presidency, eliminating five cabinet departments (Energy, HUD, Commerce, Interior, and Education), abolishing the Transportation Security Administration and returning responsibility for security to private property owners, abolishing corporate subsidies, stopping foreign aid, ending foreign wars, and returning most other spending to 2006 levels.
ENTITLEMENTS: Honors our promise to our seniors and veterans,
while allowing young workers to opt out. Block grants Medicaid and other welfare programs to allow States the flexibility and ingenuity they need to solve their own unique problems without harming those currently relying on the programs.
CUTTING GOVERNMENT WASTE: Makes a 10% reduction in the federal workforce,
slashes Congressional pay and perks, and curbs excessive federal travel. To stand with the American People, President Paul will take a salary of $39,336, approximately equal to the median personal income of the American worker.
TAXES: Lowers the corporate tax rate to 15%, making
America competitive in the global market. Allows American companies to repatriate capital without additional taxation, spurring trillions in new investment. Extends all Bush tax cuts. Abolishes the Death Tax. Ends taxes on personal savings, allowing families to build a nest egg.
REGULATION: Repeals ObamaCare, Dodd-Frank, and Sarbanes-
Oxley. Mandates REINS-style requirements for thorough congressional review and authorization before implementing any new regulations issued by bureaucrats. President Paul will also cancel all onerous regulations previously issued by Executive Order.
MONETARY POLICY: Conducts a full audit of the Federal Reserve
and implements competing currency legislation to strengthen the dollar and stabilize inflation.
CONCLUSION: Dr. Paul is the only candidate with a plan to cut
spending and truly balance the budget. This is the only plan that will deliver what America needs in these difficult times: Major regulatory relief, large spending cuts, sound monetary policy, and a balanced budget.
PAID FOR BY RON PAUL 2012 PRESIDENTIAL CAMPAIGN COMMITTEE INC.
Plan to Restore America
2
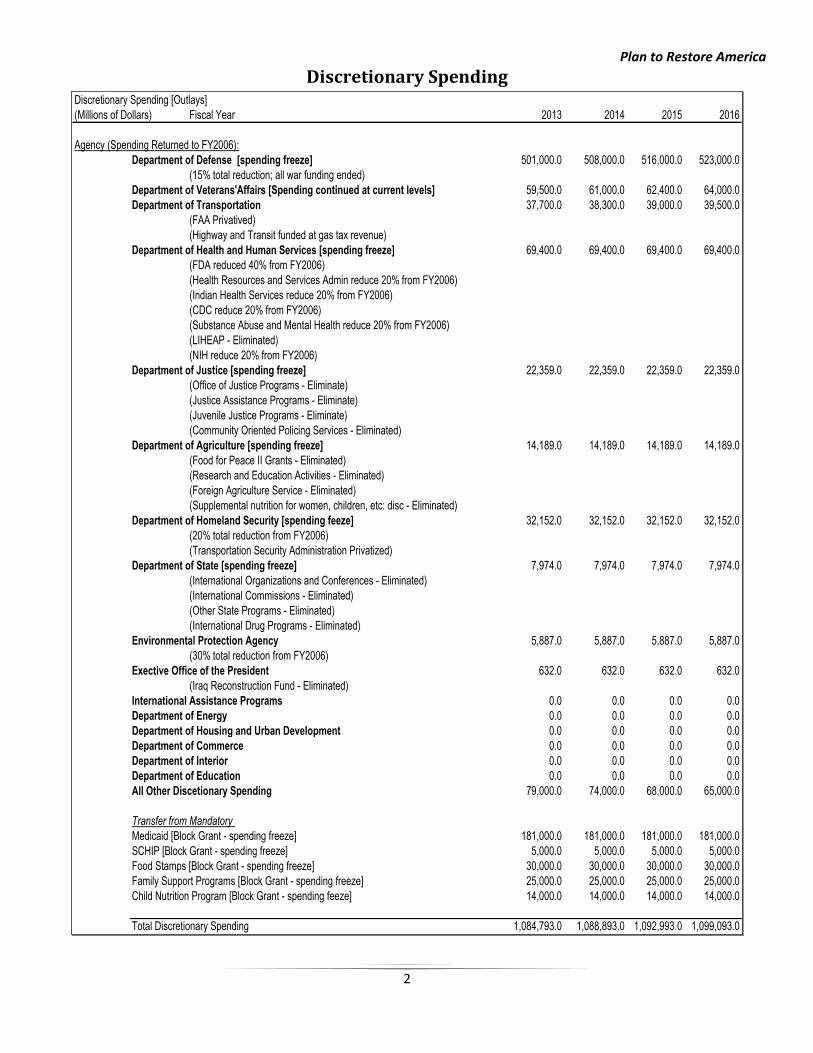
Discretionary SpendingDiscretionary Spending [Outlays]
(Millions of Dollars) Fiscal Year 2013 2014 2015 2016
Agency (Spending Returned to FY2006):
Department of Defense [spending freeze] 501,000.0 508,000.0 516,000.0 523,000.0
(15% total reduction; all war funding ended)
Department of Veterans'Affairs [Spending continued at current levels] 59,500.0 61,000.0 62,400.0 64,000.0
Department of Transportation 37,700.0 38,300.0 39,000.0 39,500.0
(FAA Privatived)
(Highway and Transit funded at gas tax revenue)
Department of Health and Human Services [spending freeze] 69,400.0 69,400.0 69,400.0 69,400.0
(FDA reduced 40% from FY2006)
(Health Resources and Services Admin reduce 20% from FY2006)
(Indian Health Services reduce 20% from FY2006)
(CDC reduce 20% from FY2006)
(Substance Abuse and Mental Health reduce 20% from FY2006)
(LIHEAP - Eliminated)
(NIH reduce 20% from FY2006)
Department of Justice [spending freeze] 22,359.0 22,359.0 22,359.0 22,359.0
(Office of Justice Programs - Eliminate)
(Justice Assistance Programs - Eliminate)
(Juvenile Justice Programs - Eliminate)
(Community Oriented Policing Services - Eliminated)
Department of Agriculture [spending freeze] 14,189.0 14,189.0 14,189.0 14,189.0
(Food for Peace II Grants - Eliminated)
(Research and Education Activities - Eliminated)
(Foreign Agriculture Service - Eliminated)
(Supplemental nutrition for women, children, etc: disc - Eliminated)
Department of Homeland Security [spending feeze] 32,152.0 32,152.0 32,152.0 32,152.0
(20% total reduction from FY2006)
(Transportation Security Administration Privatized)
Department of State [spending freeze] 7,974.0 7,974.0 7,974.0 7,974.0
(International Organizations and Conferences - Eliminated)
(International Commissions - Eliminated)
(Other State Programs - Eliminated)
(International Drug Programs - Eliminated)
Environmental Protection Agency 5,887.0 5,887.0 5,887.0 5,887.0
(30% total reduction from FY2006)
Exective Office of the President 632.0 632.0 632.0 632.0
(Iraq Reconstruction Fund - Eliminated)
International Assistance Programs 0.0 0.0 0.0 0.0
Department of Energy 0.0 0.0 0.0 0.0
Department of Housing and Urban Development 0.0 0.0 0.0 0.0
Department of Commerce 0.0 0.0 0.0 0.0
Department of Interior 0.0 0.0 0.0 0.0
Department of Education 0.0 0.0 0.0 0.0
All Other Discetionary Spending 79,000.0 74,000.0 68,000.0 65,000.0
Transfer from Mandatory
Medicaid [Block Grant - spending freeze] 181,000.0 181,000.0 181,000.0 181,000.0
SCHIP [Block Grant - spending freeze] 5,000.0 5,000.0 5,000.0 5,000.0
Food Stamps [Block Grant - spending freeze] 30,000.0 30,000.0 30,000.0 30,000.0
Family Support Programs [Block Grant - spending freeze] 25,000.0 25,000.0 25,000.0 25,000.0
Child Nutrition Program [Block Grant - spending feeze] 14,000.0 14,000.0 14,000.0 14,000.0
Total Discretionary Spending 1,084,793.0 1,088,893.0 1,092,993.0 1,099,093.0
Plan to Restore America
3
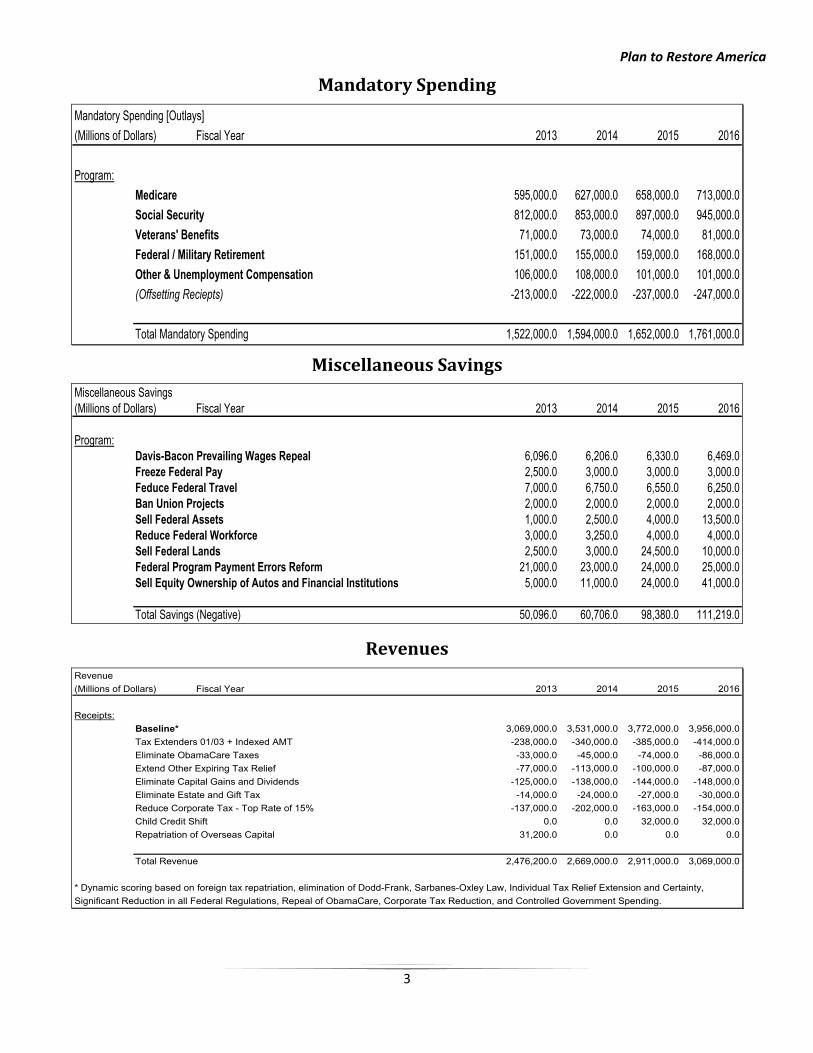
Mandatory Spending
Mandatory Spending [Outlays]
(Millions of Dollars) Fiscal Year 2013 2014 2015 2016
Program:
Medicare 595,000.0 627,000.0 658,000.0 713,000.0
Social Security 812,000.0 853,000.0 897,000.0 945,000.0
Veterans' Benefits 71,000.0 73,000.0 74,000.0 81,000.0
Federal / Military Retirement 151,000.0 155,000.0 159,000.0 168,000.0
Other & Unemployment Compensation 106,000.0 108,000.0 101,000.0 101,000.0
(Offsetting Reciepts) -213,000.0 -222,000.0 -237,000.0 -247,000.0
Total Mandatory Spending 1,522,000.0 1,594,000.0 1,652,000.0 1,761,000.0
Miscellaneous Savings
Miscellaneous Savings
(Millions of Dollars) Fiscal Year 2013 2014 2015 2016
Program:
Davis-Bacon Prevailing Wages Repeal 6,096.0 6,206.0 6,330.0 6,469.0
Freeze Federal Pay 2,500.0 3,000.0 3,000.0 3,000.0
Feduce Federal Travel 7,000.0 6,750.0 6,550.0 6,250.0
Ban Union Projects 2,000.0 2,000.0 2,000.0 2,000.0
Sell Federal Assets 1,000.0 2,500.0 4,000.0 13,500.0
Reduce Federal Workforce 3,000.0 3,250.0 4,000.0 4,000.0
Sell Federal Lands 2,500.0 3,000.0 24,500.0 10,000.0
Federal Program Payment Errors Reform 21,000.0 23,000.0 24,000.0 25,000.0
Sell Equity Ownership of Autos and Financial Institutions 5,000.0 11,000.0 24,000.0 41,000.0
Total Savings (Negative) 50,096.0 60,706.0 98,380.0 111,219.0
Revenues
Revenue
(Millions of Dollars) Fiscal Year 2013 2014 2015 2016
Receipts:
Baseline* 3,069,000.0 3,531,000.0 3,772,000.0 3,956,000.0
Tax Extenders 01/03 + Indexed AMT -238,000.0 -340,000.0 -385,000.0 -414,000.0
Eliminate ObamaCare Taxes -33,000.0 -45,000.0 -74,000.0 -86,000.0
Extend Other Expiring Tax Relief -77,000.0 -113,000.0 -100,000.0 -87,000.0
Eliminate Capital Gains and Dividends -125,000.0 -138,000.0 -144,000.0 -148,000.0
Eliminate Estate and Gift Tax -14,000.0 -24,000.0 -27,000.0 -30,000.0
Reduce Corporate Tax - Top Rate of 15% -137,000.0 -202,000.0 -163,000.0 -154,000.0
Child Credit Shift 0.0 0.0 32,000.0 32,000.0
Repatriation of Overseas Capital 31,200.0 0.0 0.0 0.0
Total Revenue 2,476,200.0 2,669,000.0 2,911,000.0 3,069,000.0
* Dynamic scoring based on foreign tax repatriation, elimination of Dodd-Frank, Sarbanes-Oxley Law, Individual Tax Relief Extension and Certainty,
Significant Reduction in all Federal Regulations, Repeal of ObamaCare, Corporate Tax Reduction, and Controlled Government Spending.
Plan to Restore America
4
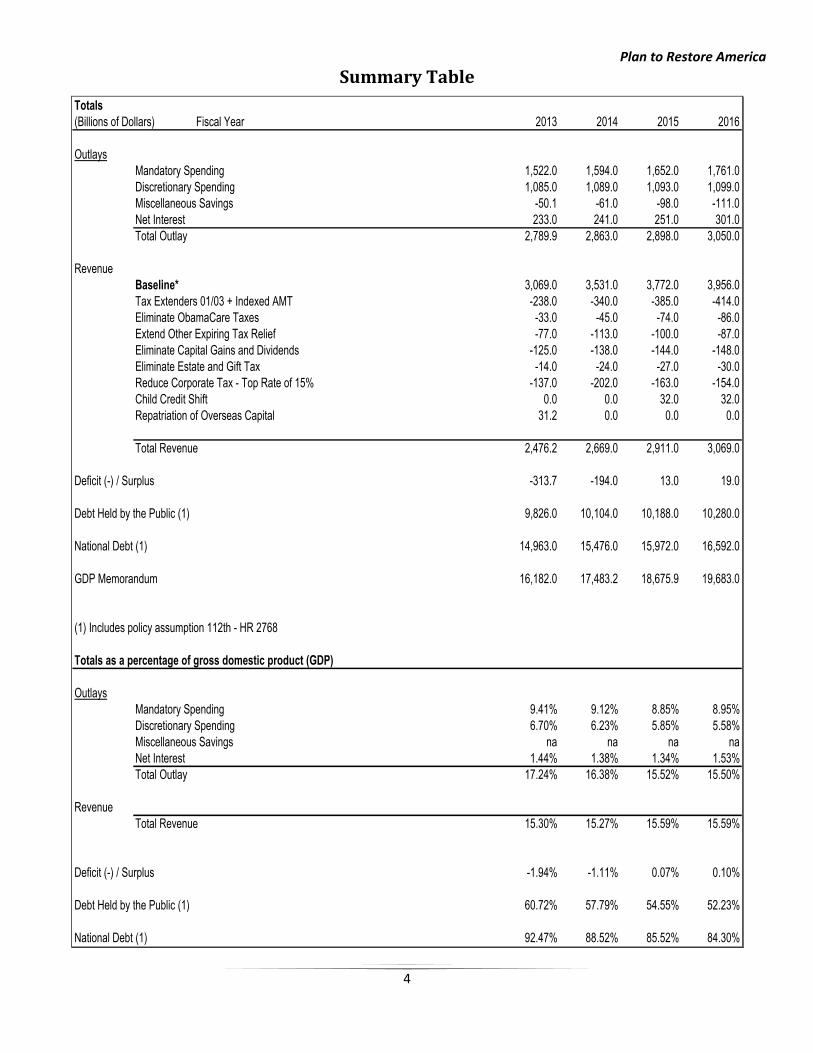
Summary Table
Totals
(Billions of Dollars) Fiscal Year 2013 2014 2015 2016
Outlays
Mandatory Spending 1,522.0 1,594.0 1,652.0 1,761.0
Discretionary Spending 1,085.0 1,089.0 1,093.0 1,099.0
Miscellaneous Savings -50.1 -61.0 -98.0 -111.0
Net Interest 233.0 241.0 251.0 301.0
Total Outlay 2,789.9 2,863.0 2,898.0 3,050.0
Revenue
Baseline* 3,069.0 3,531.0 3,772.0 3,956.0
Tax Extenders 01/03 + Indexed AMT -238.0 -340.0 -385.0 -414.0
Eliminate ObamaCare Taxes -33.0 -45.0 -74.0 -86.0
Extend Other Expiring Tax Relief -77.0 -113.0 -100.0 -87.0
Eliminate Capital Gains and Dividends -125.0 -138.0 -144.0 -148.0
Eliminate Estate and Gift Tax -14.0 -24.0 -27.0 -30.0
Reduce Corporate Tax - Top Rate of 15% -137.0 -202.0 -163.0 -154.0
Child Credit Shift 0.0 0.0 32.0 32.0
Repatriation of Overseas Capital 31.2 0.0 0.0 0.0
Total Revenue 2,476.2 2,669.0 2,911.0 3,069.0
Deficit (-) / Surplus -313.7 -194.0 13.0 19.0
Debt Held by the Public (1) 9,826.0 10,104.0 10,188.0 10,280.0
National Debt (1) 14,963.0 15,476.0 15,972.0 16,592.0
GDP Memorandum 16,182.0 17,483.2 18,675.9 19,683.0
(1) Includes policy assumption 112th - HR 2768
Totals as a percentage of gross domestic product (GDP)
Outlays
Mandatory Spending 9.41% 9.12% 8.85% 8.95%
Discretionary Spending 6.70% 6.23% 5.85% 5.58%
Miscellaneous Savings na na na na
Net Interest 1.44% 1.38% 1.34% 1.53%
Total Outlay 17.24% 16.38% 15.52% 15.50%
Revenue
Total Revenue 15.30% 15.27% 15.59% 15.59%
Deficit (-) / Surplus -1.94% -1.11% 0.07% 0.10%
Debt Held by the Public (1) 60.72% 57.79% 54.55% 52.23%
National Debt (1) 92.47% 88.52% 85.52% 84.30%
Plan to Restore America
5
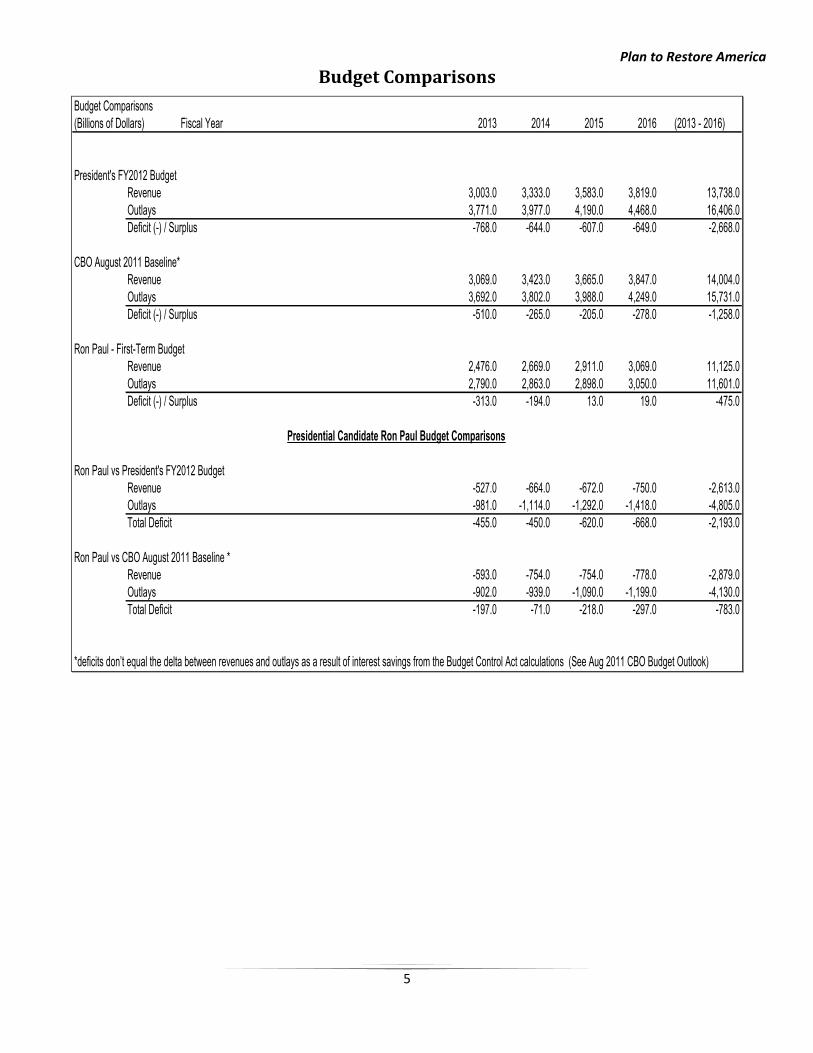
Budget Comparisons
Budget Comparisons
(Billions of Dollars) Fiscal Year 2013 2014 2015 2016 (2013 - 2016)
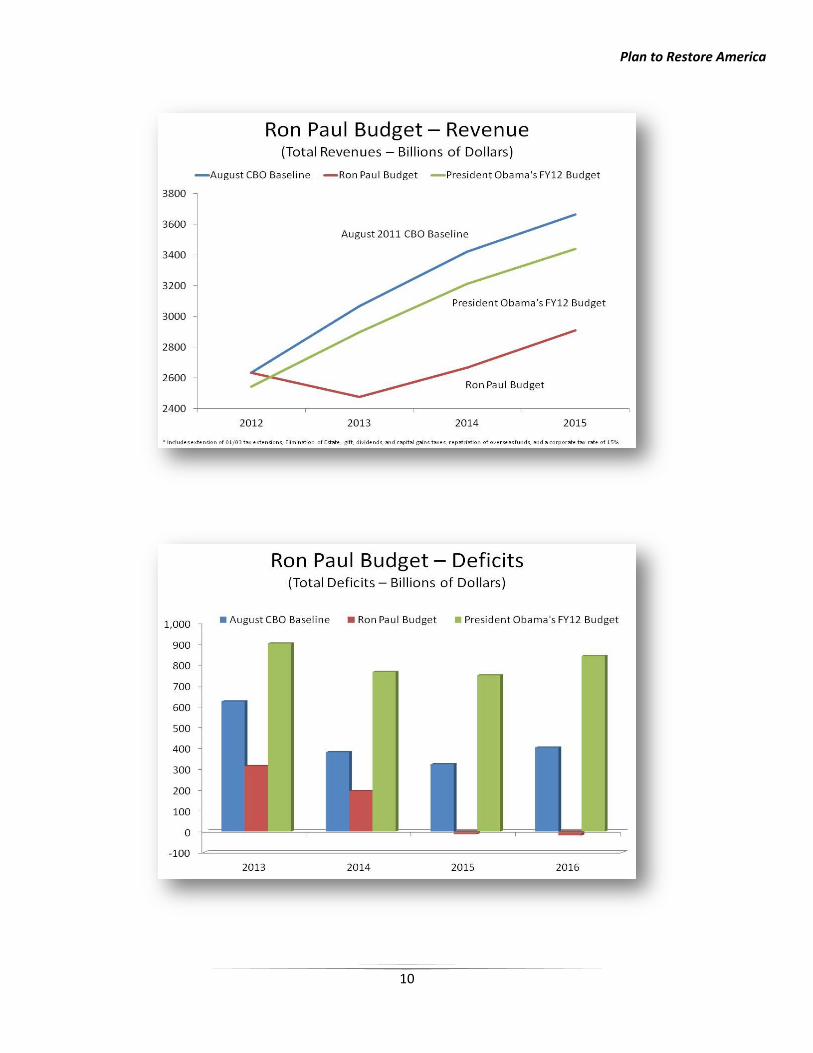
President's FY2012 Budget
Revenue 3,003.0 3,333.0 3,583.0 3,819.0 13,738.0
Outlays 3,771.0 3,977.0 4,190.0 4,468.0 16,406.0
Deficit (-) / Surplus -768.0 -644.0 -607.0 -649.0 -2,668.0
CBO August 2011 Baseline*
Revenue 3,069.0 3,423.0 3,665.0 3,847.0 14,004.0
Outlays 3,692.0 3,802.0 3,988.0 4,249.0 15,731.0
Deficit (-) / Surplus -510.0 -265.0 -205.0 -278.0 -1,258.0
Ron Paul - First-Term Budget
Revenue 2,476.0 2,669.0 2,911.0 3,069.0 11,125.0
Outlays 2,790.0 2,863.0 2,898.0 3,050.0 11,601.0
Deficit (-) / Surplus -313.0 -194.0 13.0 19.0 -475.0
Presidential Candidate Ron Paul Budget Comparisons
Ron Paul vs President's FY2012 Budget
Revenue -527.0 -664.0 -672.0 -750.0 -2,613.0
Outlays -981.0 -1,114.0 -1,292.0 -1,418.0 -4,805.0
Total Deficit -455.0 -450.0 -620.0 -668.0 -2,193.0
Ron Paul vs CBO August 2011 Baseline *
Revenue -593.0 -754.0 -754.0 -778.0 -2,879.0
Outlays -902.0 -939.0 -1,090.0 -1,199.0 -4,130.0
Total Deficit -197.0 -71.0 -218.0 -297.0 -783.0
*deficits don’t equal the delta between revenues and outlays as a result of interest savings from the Budget Control Act calculations (See Aug 2011 CBO Budget Outlook)
Plan to Restore America
6
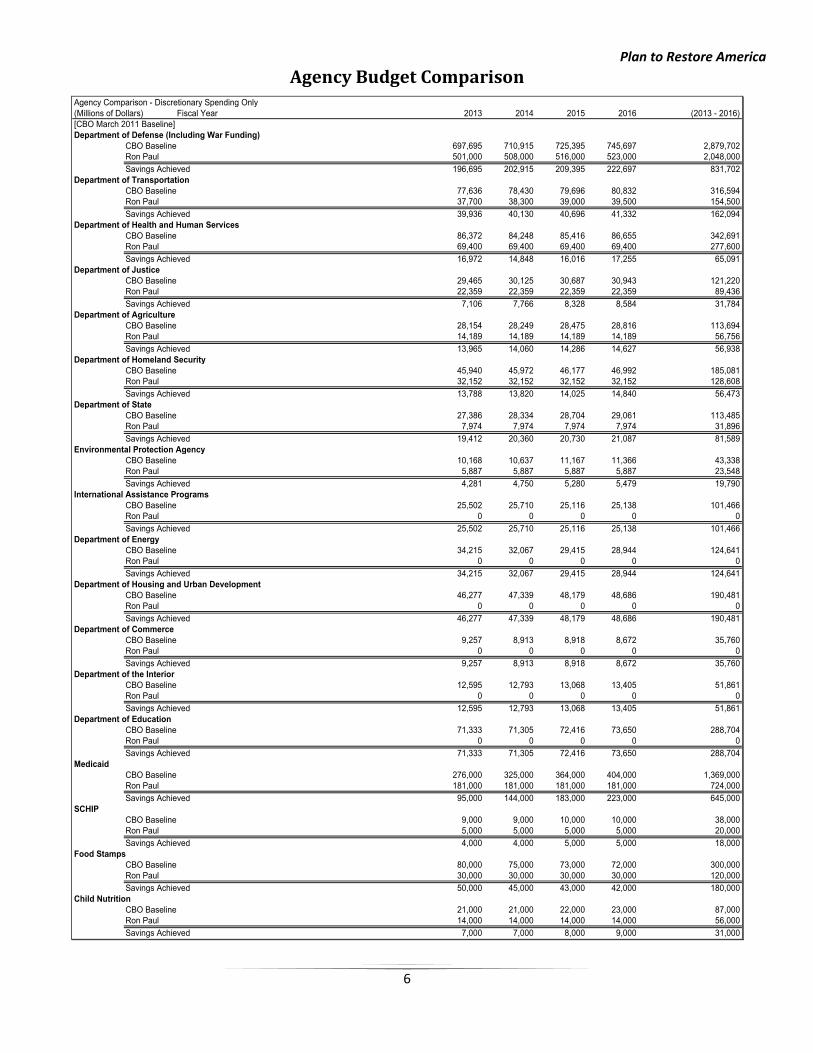
Agency Budget Comparison Agency Comparison - Discretionary Spending Only
(Millions of Dollars) Fiscal Year 2013 2014 2015 2016 (2013 - 2016)
[CBO March 2011 Baseline]
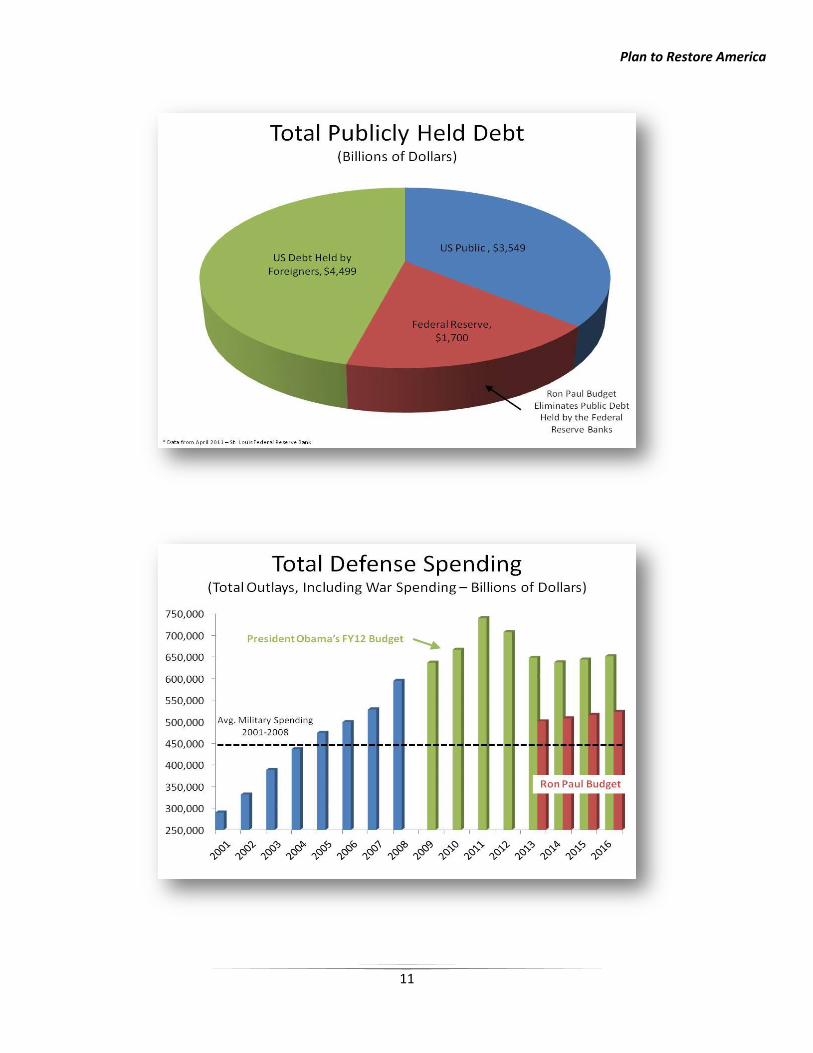
Department of Defense (Including War Funding)
CBO Baseline 697,695 710,915 725,395 745,697 2,879,702
Ron Paul 501,000 508,000 516,000 523,000 2,048,000
Savings Achieved 196,695 202,915 209,395 222,697 831,702
Department of Transportation
CBO Baseline 77,636 78,430 79,696 80,832 316,594
Ron Paul 37,700 38,300 39,000 39,500 154,500
Savings Achieved 39,936 40,130 40,696 41,332 162,094
Department of Health and Human Services
CBO Baseline 86,372 84,248 85,416 86,655 342,691
Ron Paul 69,400 69,400 69,400 69,400 277,600
Savings Achieved 16,972 14,848 16,016 17,255 65,091
Department of Justice
CBO Baseline 29,465 30,125 30,687 30,943 121,220
Ron Paul 22,359 22,359 22,359 22,359 89,436
Savings Achieved 7,106 7,766 8,328 8,584 31,784
Department of Agriculture
CBO Baseline 28,154 28,249 28,475 28,816 113,694
Ron Paul 14,189 14,189 14,189 14,189 56,756
Savings Achieved 13,965 14,060 14,286 14,627 56,938
Department of Homeland Security
CBO Baseline 45,940 45,972 46,177 46,992 185,081
Ron Paul 32,152 32,152 32,152 32,152 128,608
Savings Achieved 13,788 13,820 14,025 14,840 56,473
Department of State
CBO Baseline 27,386 28,334 28,704 29,061 113,485
Ron Paul 7,974 7,974 7,974 7,974 31,896
Savings Achieved 19,412 20,360 20,730 21,087 81,589
Environmental Protection Agency
CBO Baseline 10,168 10,637 11,167 11,366 43,338
Ron Paul 5,887 5,887 5,887 5,887 23,548
Savings Achieved 4,281 4,750 5,280 5,479 19,790
International Assistance Programs
CBO Baseline 25,502 25,710 25,116 25,138 101,466
Ron Paul 0 0 0 0 0
Savings Achieved 25,502 25,710 25,116 25,138 101,466
Department of Energy
CBO Baseline 34,215 32,067 29,415 28,944 124,641
Ron Paul 0 0 0 0 0
Savings Achieved 34,215 32,067 29,415 28,944 124,641
Department of Housing and Urban Development
CBO Baseline 46,277 47,339 48,179 48,686 190,481
Ron Paul 0 0 0 0 0
Savings Achieved 46,277 47,339 48,179 48,686 190,481
Department of Commerce
CBO Baseline 9,257 8,913 8,918 8,672 35,760
Ron Paul 0 0 0 0 0
Savings Achieved 9,257 8,913 8,918 8,672 35,760
Department of the Interior
CBO Baseline 12,595 12,793 13,068 13,405 51,861
Ron Paul 0 0 0 0 0
Savings Achieved 12,595 12,793 13,068 13,405 51,861
Department of Education
CBO Baseline 71,333 71,305 72,416 73,650 288,704
Ron Paul 0 0 0 0 0
Savings Achieved 71,333 71,305 72,416 73,650 288,704
Medicaid
CBO Baseline 276,000 325,000 364,000 404,000 1,369,000
Ron Paul 181,000 181,000 181,000 181,000 724,000
Savings Achieved 95,000 144,000 183,000 223,000 645,000
SCHIP
CBO Baseline 9,000 9,000 10,000 10,000 38,000
Ron Paul 5,000 5,000 5,000 5,000 20,000
Savings Achieved 4,000 4,000 5,000 5,000 18,000
Food Stamps
CBO Baseline 80,000 75,000 73,000 72,000 300,000
Ron Paul 30,000 30,000 30,000 30,000 120,000
Savings Achieved 50,000 45,000 43,000 42,000 180,000
Child Nutrition
CBO Baseline 21,000 21,000 22,000 23,000 87,000
Ron Paul 14,000 14,000 14,000 14,000 56,000
Savings Achieved 7,000 7,000 8,000 9,000 31,000
Plan to Restore America
7
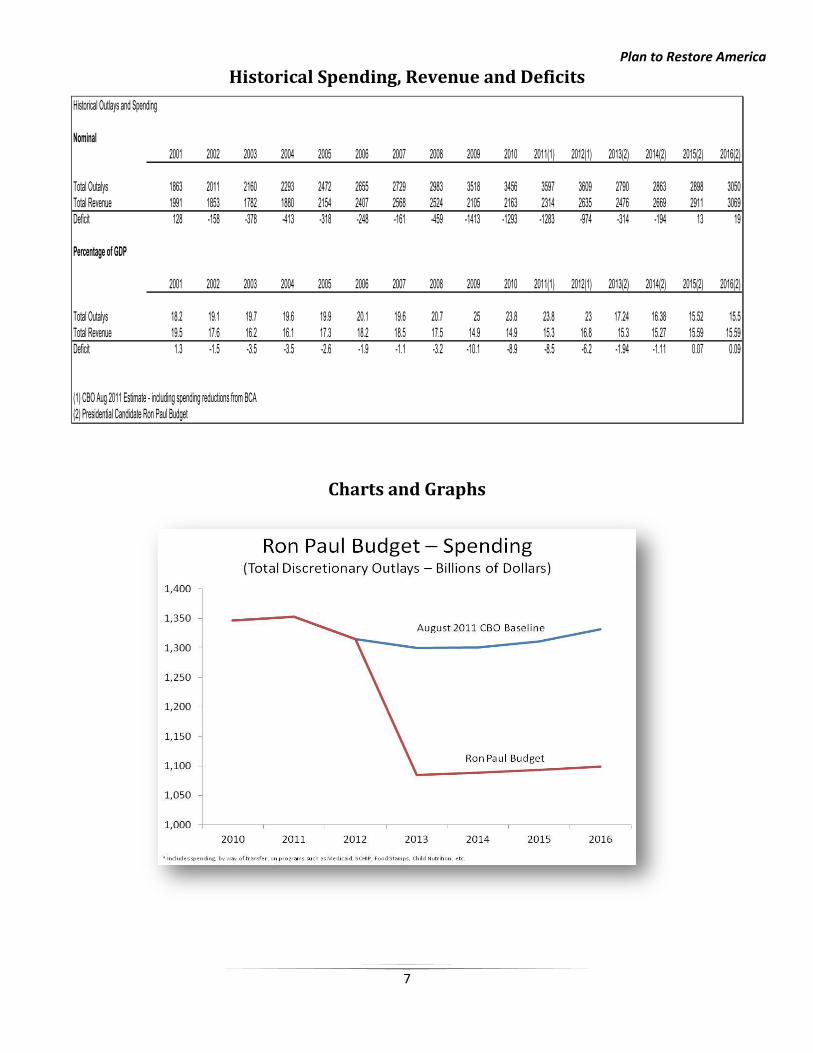
Historical Spending, Revenue and Deficits
Historical Outlays and Spending
Nominal
2001 2002 2003 2004 2005 2006 2007 2008 2009 2010 2011(1) 2012(1) 2013(2) 2014(2) 2015(2) 2016(2)
Total Outalys 1863 2011 2160 2293 2472 2655 2729 2983 3518 3456 3597 3609 2790 2863 2898 3050
Total Revenue 1991 1853 1782 1880 2154 2407 2568 2524 2105 2163 2314 2635 2476 2669 2911 3069
Deficit 128 -158 -378 -413 -318 -248 -161 -459 -1413 -1293 -1283 -974 -314 -194 13 19
Percentage of GDP
2001 2002 2003 2004 2005 2006 2007 2008 2009 2010 2011(1) 2012(1) 2013(2) 2014(2) 2015(2) 2016(2)
Total Outalys 18.2 19.1 19.7 19.6 19.9 20.1 19.6 20.7 25 23.8 23.8 23 17.24 16.38 15.52 15.5
Total Revenue 19.5 17.6 16.2 16.1 17.3 18.2 18.5 17.5 14.9 14.9 15.3 16.8 15.3 15.27 15.59 15.59
Deficit 1.3 -1.5 -3.5 -3.5 -2.6 -1.9 -1.1 -3.2 -10.1 -8.9 -8.5 -6.2 -1.94 -1.11 0.07 0.09
(1) CBO Aug 2011 Estimate - including spending reductions from BCA
(2) Presidential Candidate Ron Paul Budget
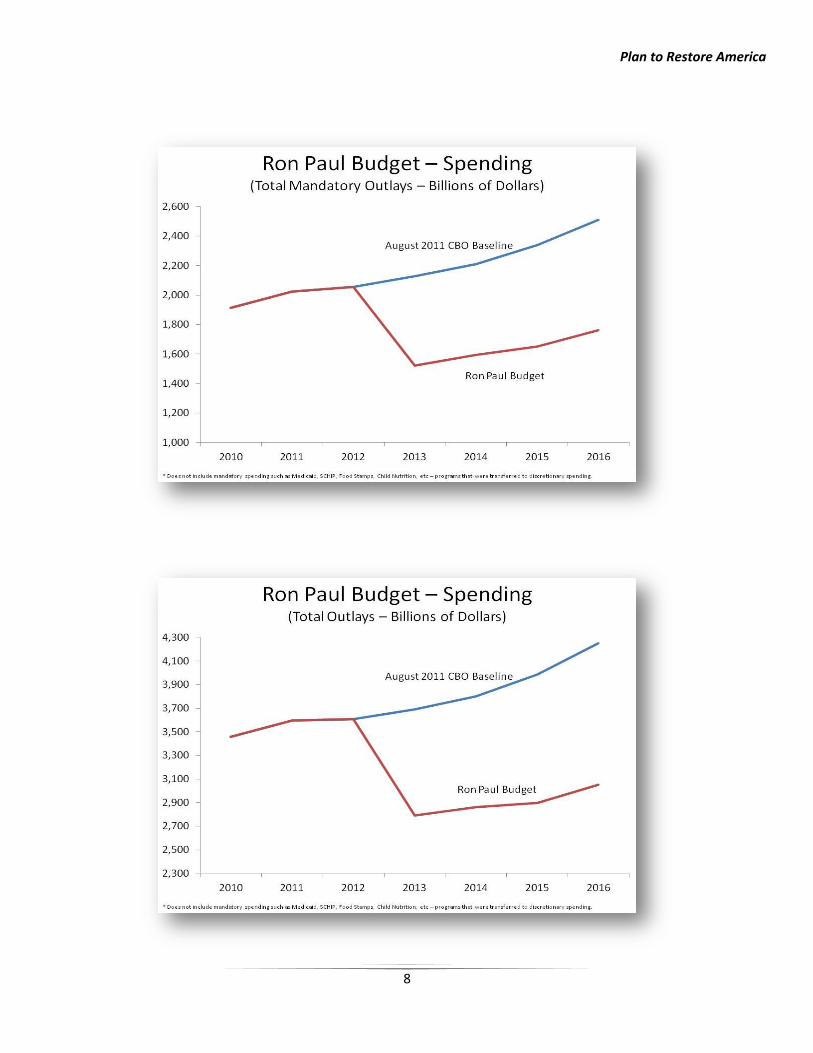
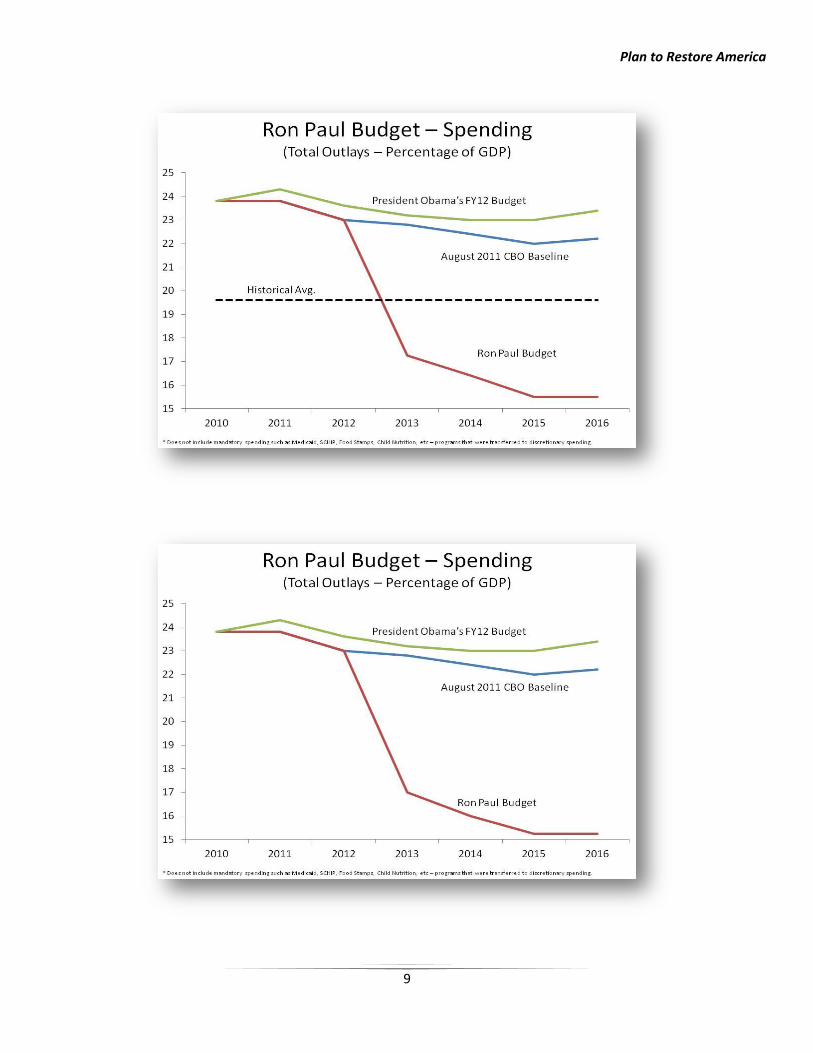
Charts and Graphs
Plan to Restore America
8
Plan to Restore America
9
Plan to Restore America
10
Plan to Restore America
11