Embed Size (px)
Citation preview
Ron Brown, Northeastern Univ.
Catherine Manly, Univ. of MA, Amherst
Lutheria N. Peters, George Mason Univ.
Raja Tayeh, Doane College
July 14, 2012
National Data Institute, Alexandria, VA
Introduction
Hypothesis
Methodology, including datasets
Findings
Conclusions
Limitations
Implications
Problem: ◦ Online education is a fairly new higher ed pathway.
◦ We have limited information about online students.
Purpose: ◦ To describe characteristics of students who self-
report distance postsecondary participation.
◦ To explore the national spatial association of online enrollment across the US by state for an institution that self-reported primarily online delivery.
There is a high spatial association of online enrollment across the United States.
Nationally Descriptive Data Source: NPSAS08 ◦ All students (undergraduates and graduates) who
are enrolled in a completely distance program
Spatial Association Data Source: IPEDS Enrollment ◦ Problem: Most institutions combine online and on-
campus enrollments even if they identify the institution as “primarily online” in IPEDS.
◦ Our data: Look at the only institution reporting completely separate online enrollments in the currently available data: University of Phoenix Online (UOP)
Descriptive percentages (NPSAS 2008)
LISA (Local Indicators of Spatial Association)* ◦ We conducted a test for spatial association using
the Local Moran’s I test statistic. We used:
ArcGIS to prepare our data files, and
Geoda to conduct the analysis and produce cluster and significance maps, and the Moran’s I statistic.
* Anselin, L. (1995). Local Indicators of Spatial Association – LISA.
Geographical Analysis, 27(2), pp. 93-115.
** Anselin, L. (1996). GeoDa: An introducation to spatial data analysis. Geographical Analysis, 38. pp. 5-22.
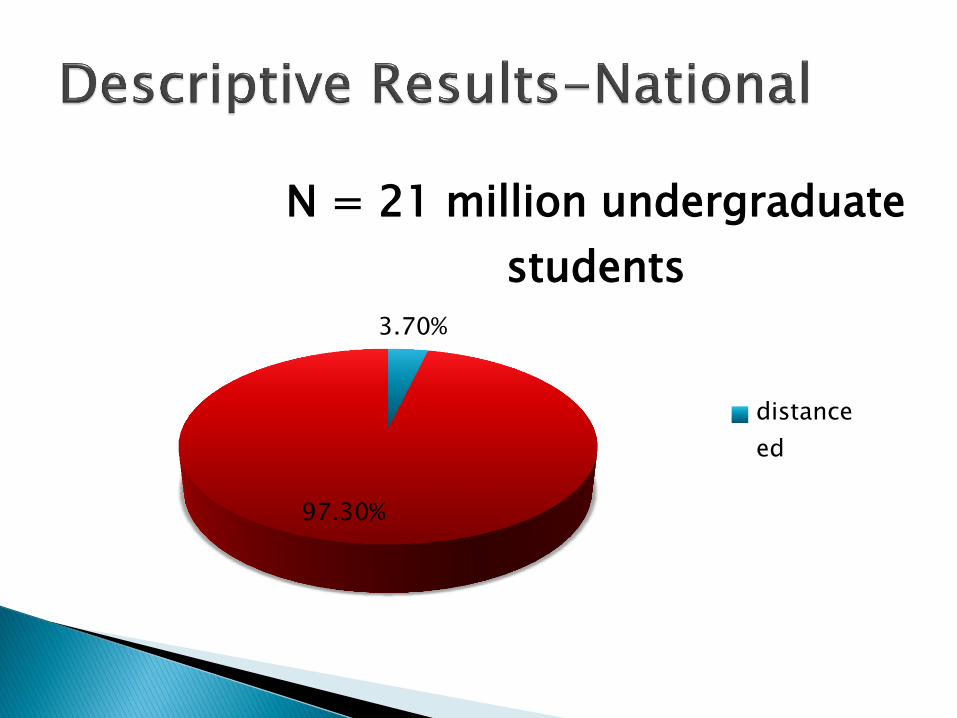
3.70%
97.30%
N = 21 million undergraduate
students
distance
ed

8.70%
91.30%
N= 3,456,000 Graduate students
distance ed
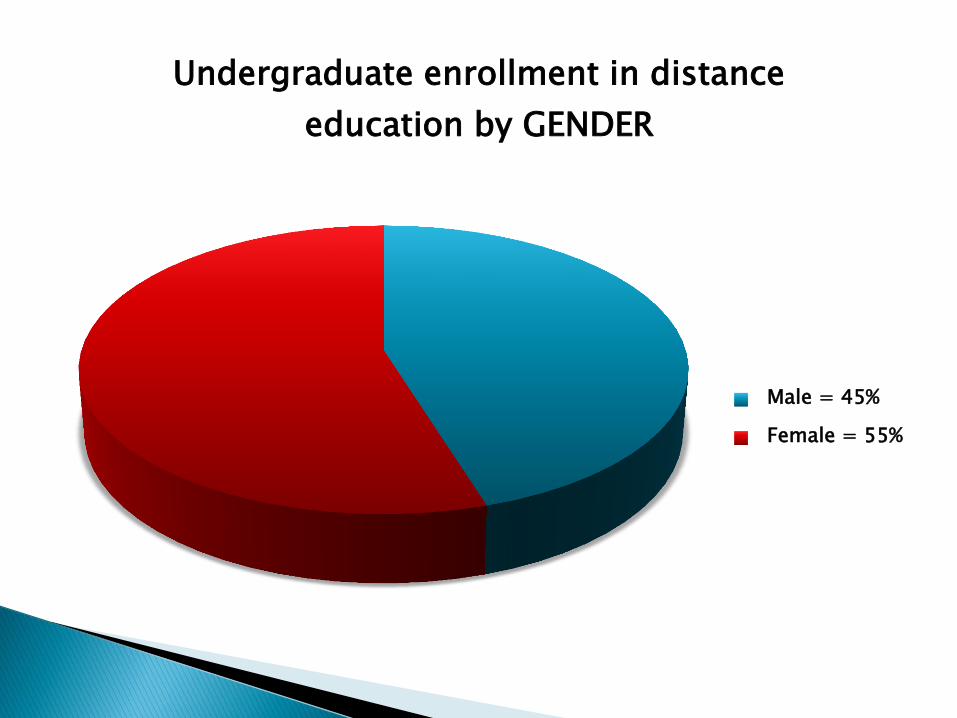
Undergraduate enrollment in distance
education by GENDER
Male = 45%
Female = 55%
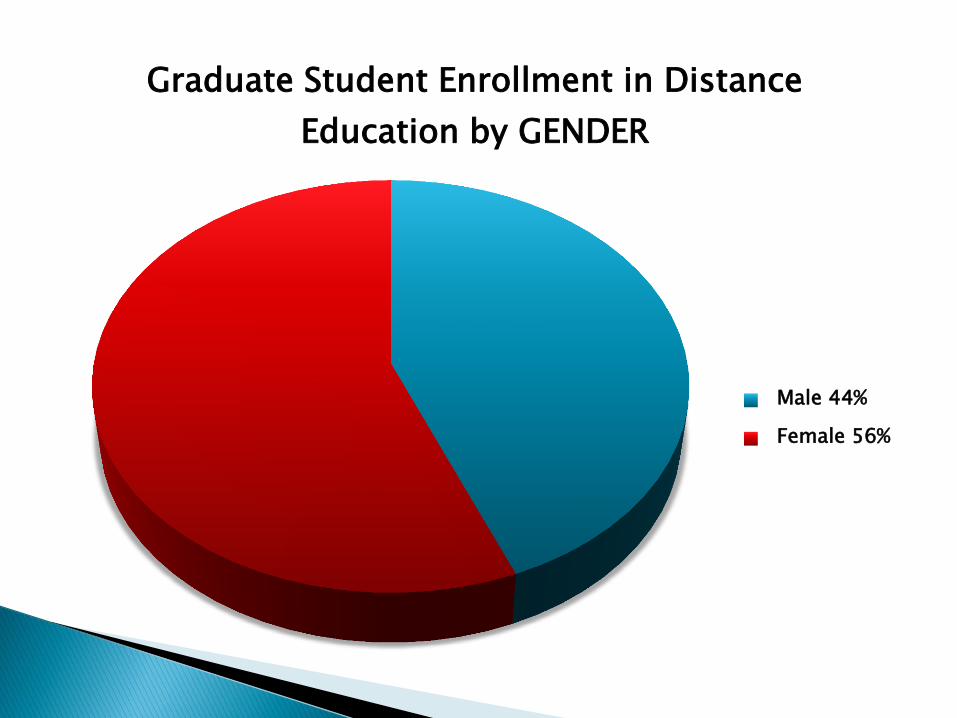
Graduate Student Enrollment in Distance
Education by GENDER
Male 44%
Female 56%
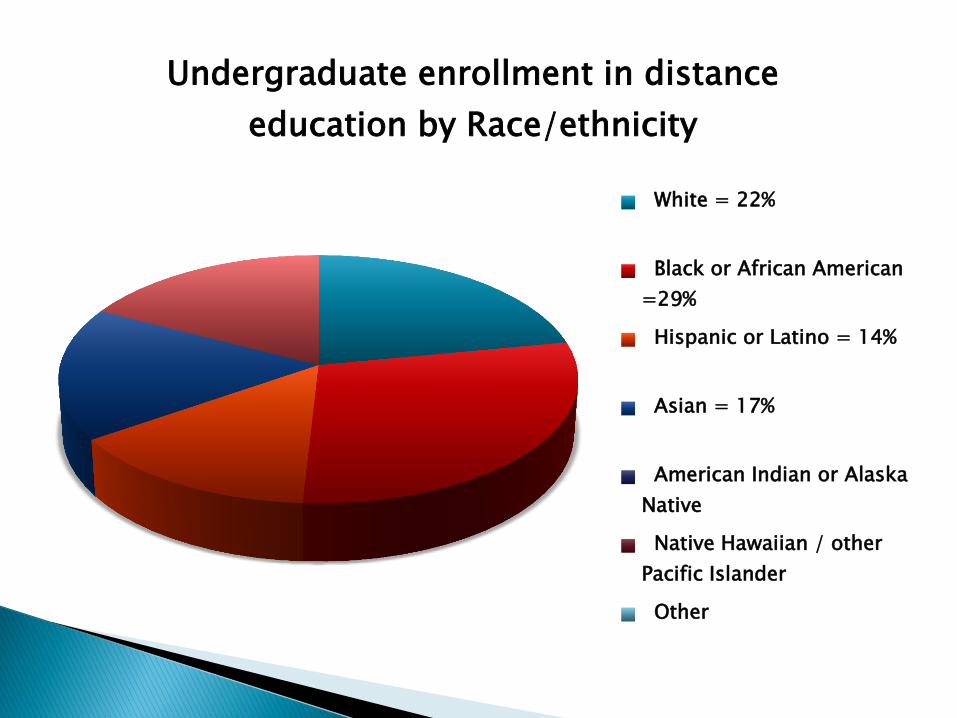
Undergraduate enrollment in distance
education by Race/ethnicity
White = 22%
Black or African American
=29%
Hispanic or Latino = 14%
Asian = 17%
American Indian or Alaska
Native
Native Hawaiian / other
Pacific Islander
Other
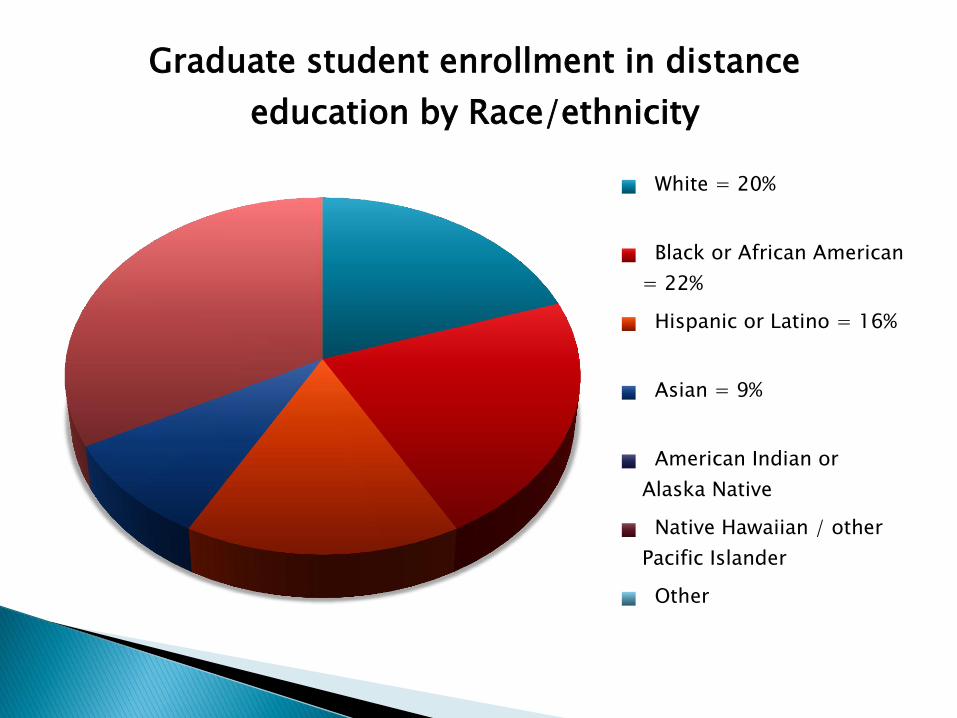
Graduate student enrollment in distance
education by Race/ethnicity
White = 20%
Black or African American
= 22%
Hispanic or Latino = 16%
Asian = 9%
American Indian or
Alaska Native
Native Hawaiian / other
Pacific Islander
Other
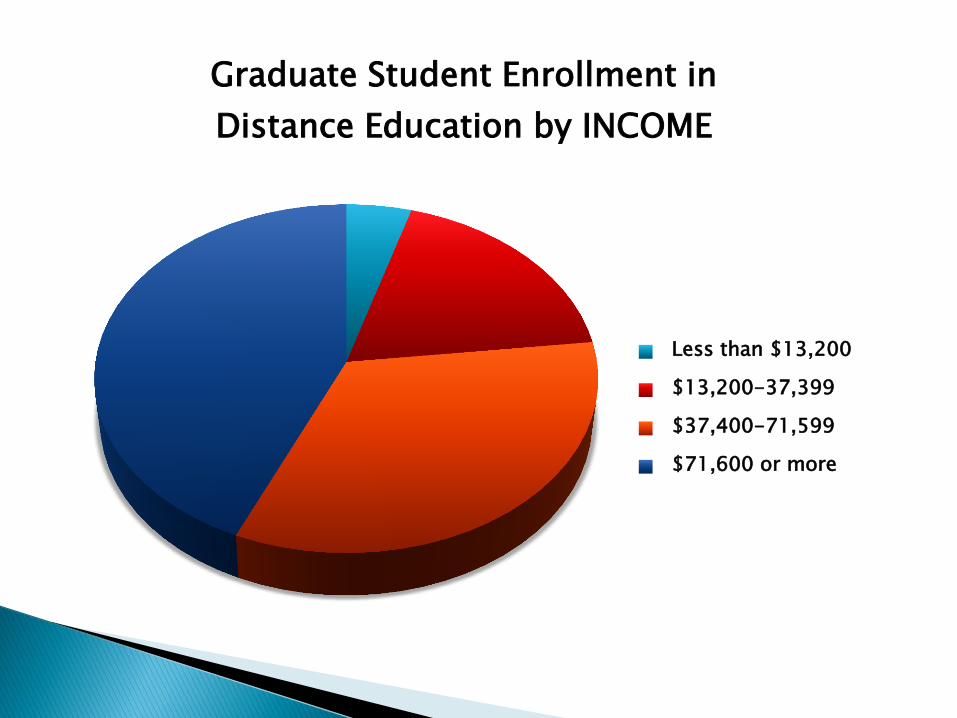
Graduate Student Enrollment in
Distance Education by INCOME
Less than $13,200
$13,200-37,399
$37,400-71,599
$71,600 or more
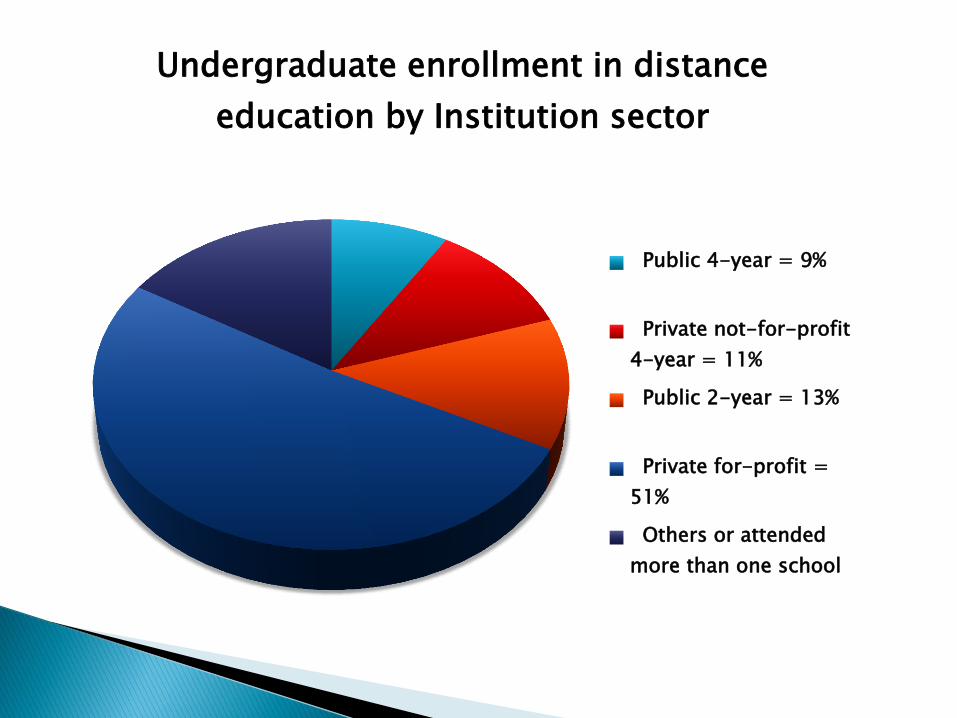
Undergraduate enrollment in distance
education by Institution sector
Public 4-year = 9%
Private not-for-profit
4-year = 11%
Public 2-year = 13%
Private for-profit =
51%
Others or attended
more than one school
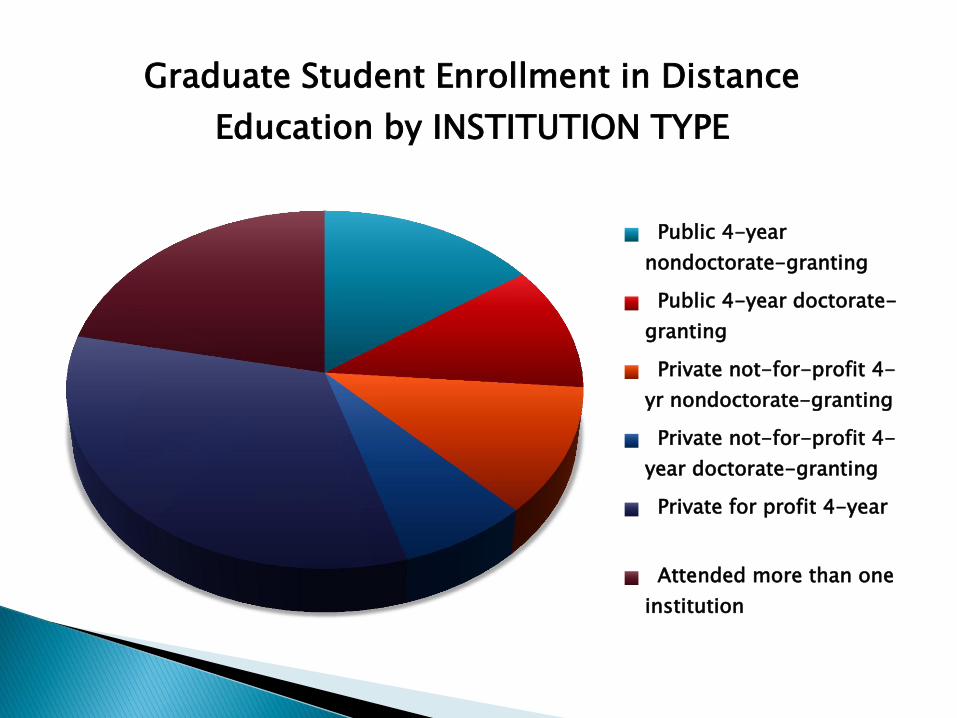
Graduate Student Enrollment in Distance
Education by INSTITUTION TYPE
Public 4-year
nondoctorate-granting
Public 4-year doctorate-
granting
Private not-for-profit 4-
yr nondoctorate-granting
Private not-for-profit 4-
year doctorate-granting
Private for profit 4-year
Attended more than one
institution
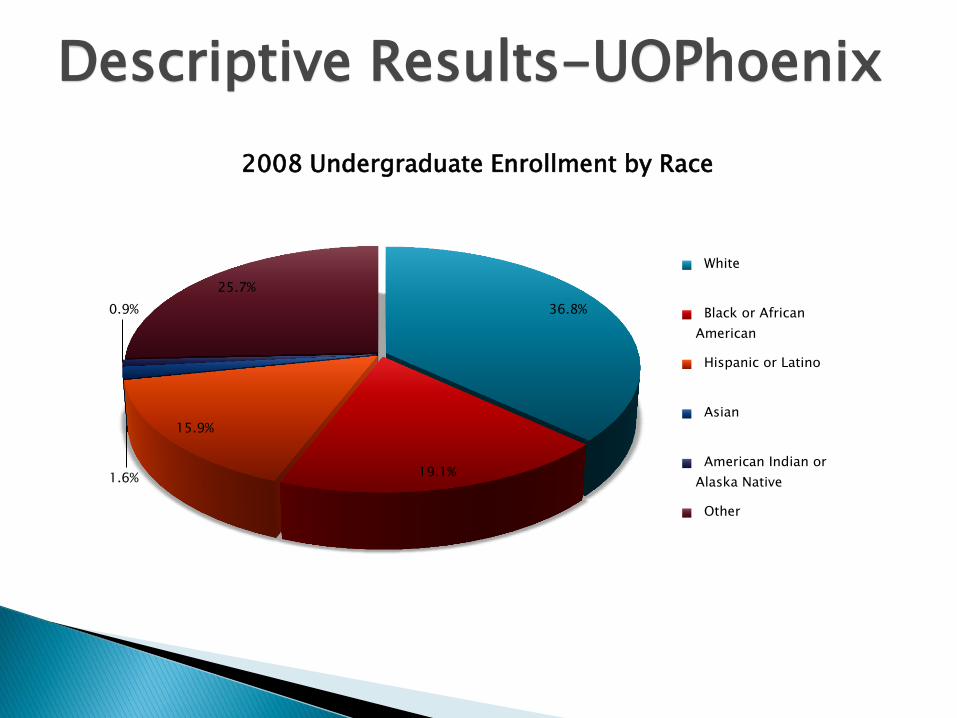
36.8%
19.1%
15.9%
1.6%
0.9%
25.7%
2008 Undergraduate Enrollment by Race
White
Black or African
American
Hispanic or Latino
Asian
American Indian or
Alaska Native
Other
Descriptive Results-UOPhoenix

35.0%
20.7%
14.5% 2.9%
0.7%
26.2%
2008 Graduate Enrollment by Race
White
Black or African American
Hispanic or Latino
Asian
American Indian or Alaska
Native
Other
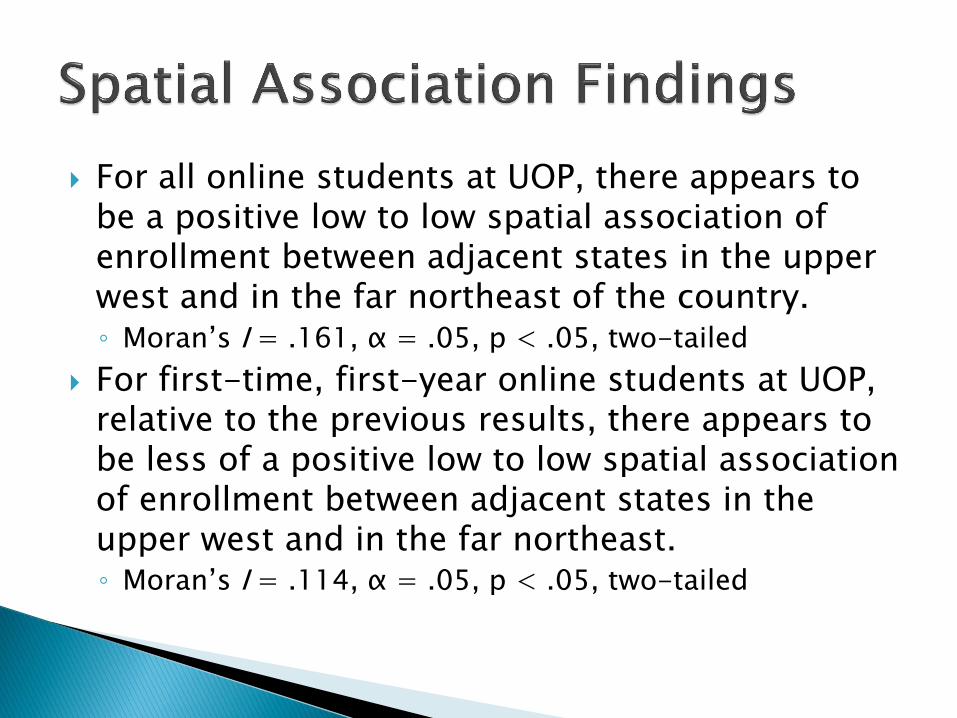
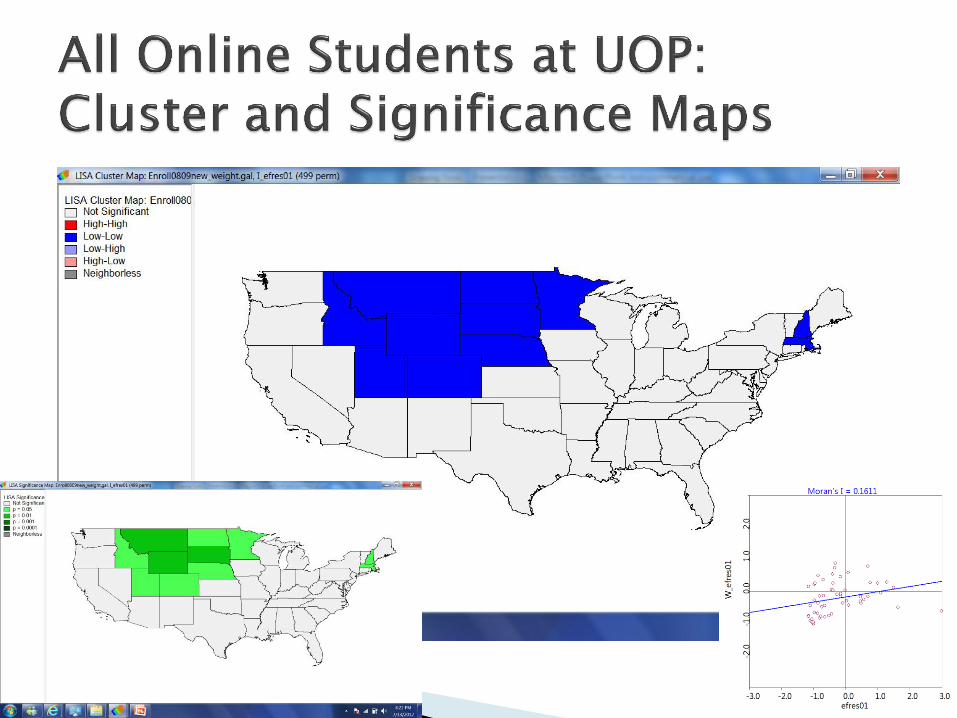
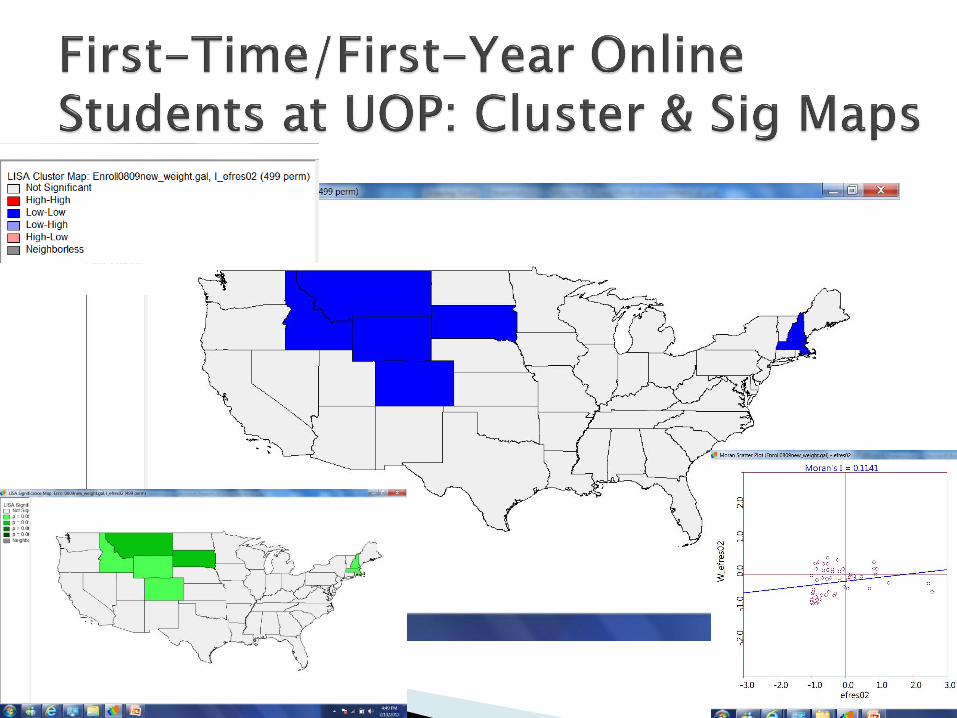
For all online students at UOP, there appears to be a positive low to low spatial association of enrollment between adjacent states in the upper west and in the far northeast of the country. ◦ Moran’s I = .161, α = .05, p < .05, two-tailed
For first-time, first-year online students at UOP, relative to the previous results, there appears to be less of a positive low to low spatial association of enrollment between adjacent states in the upper west and in the far northeast. ◦ Moran’s I = .114, α = .05, p < .05, two-tailed
Students (both undergraduate and graduate) enrolled in distance education in 2008 were predominately female, of mixed racial/ethnic backgrounds, and are more likely enrolled in private, for-profit institutions.
Undergraduate students attending UOP in 2008 are predominately female (~20% greater than the national average) and White.
By race and ethnicity, the predominant graduate students at UOP in 2008 were African American males.
By gender, at the graduate level UOP, the predominant group was White females.
Across the nation for UOP students, there appears to be spatial association for enrollment (for both all UOP student and for first time, first year students).

Policy-related questions are difficult to address due to data limitations.
NPSAS: Small sample sizes for online students prevent analysis of subsamples within online program enrollments or online completions.
IPEDS: ◦ Not able to identify distance education enrollment (this
data will be collected in next year’s IPEDS). ◦ Institutional reporting practices differ for online
offerings, limiting institutional comparisons.
For the spatial association analysis, we did not have time to normalize for any other variable (e.g. US population, poverty, income, etc.)
Policy ◦ Future datasets with more information on online
enrollments/courses/programs/CIPs/completions will allow policy-related investigation.
Future Research ◦ NCES: Oversampling online students would allow
more research about this growing student group. ◦ Researchers: Continue investigation of location
through a variety of spatial analyses. For example: Spatial density to reveal online program “hot spots”
(online student location ÷ traditional program density)
Role of transportation & accessibility in college choice