Embed Size (px)
Citation preview
Rome 30-31 May 2008
Agriculture and the Agriculture Equipment Manufacturing
Industry in the United States of America
Presented by Russell A. Fowlerrepresenting the Association of Equipment Manufacturers
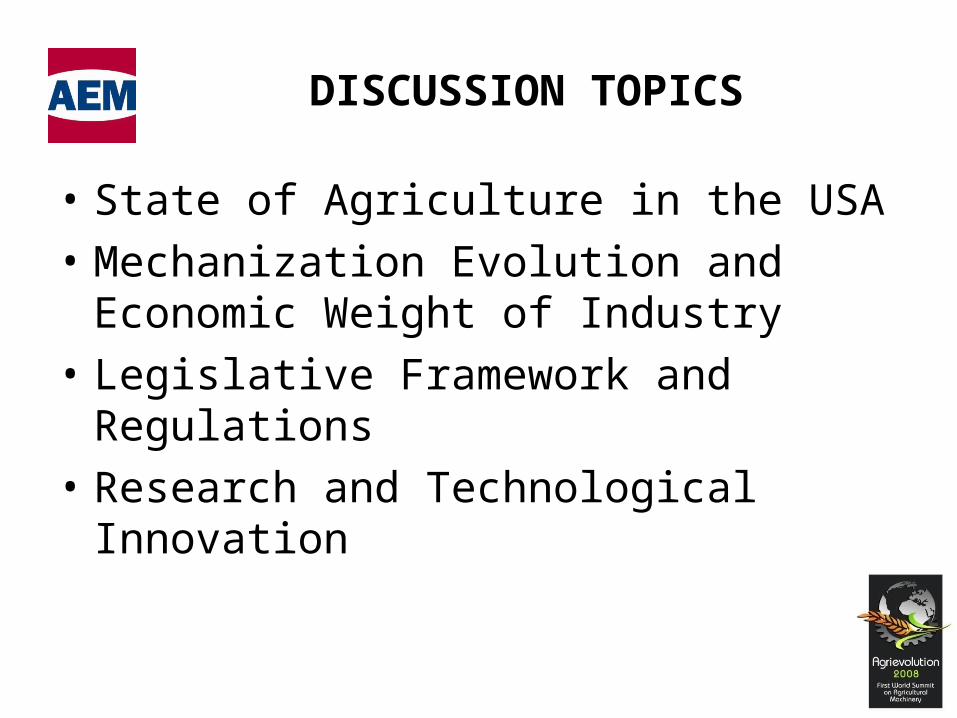
DISCUSSION TOPICS
• State of Agriculture in the USA• Mechanization Evolution and Economic
Weight of Industry• Legislative Framework and Regulations • Research and Technological Innovation
STATE OF AGRICULTURE IN THE USA
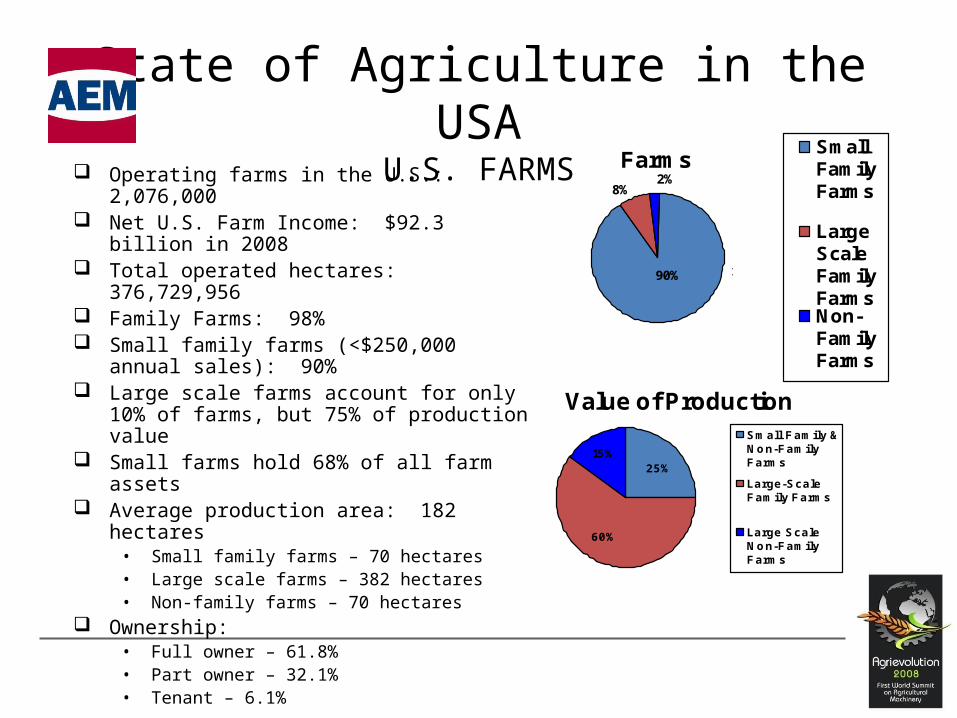
State of Agriculture in the USAU.S. FARMS
Operating farms in the U.S.: 2,076,000 Net U.S. Farm Income: $92.3 billion in 2008 Total operated hectares: 376,729,956 Family Farms: 98% Small family farms (<$250,000 annual sales):
90% Large scale farms account for only 10% of
farms, but 75% of production value Small farms hold 68% of all farm assets Average production area: 182 hectares
• Small family farms – 70 hectares• Large scale farms – 382 hectares• Non-family farms – 70 hectares
Ownership:• Full owner – 61.8%• Part owner – 32.1%• Tenant – 6.1%
Farms
90%
8%2%
SmallFamilyFarms
LargeScaleFamilyFarmsNon-FamilyFarms
x
Value of Production
15%
60%
25%
Small Family &Non-FamilyFarms
Large-ScaleFamily Farms
Large ScaleNon-FamilyFarms
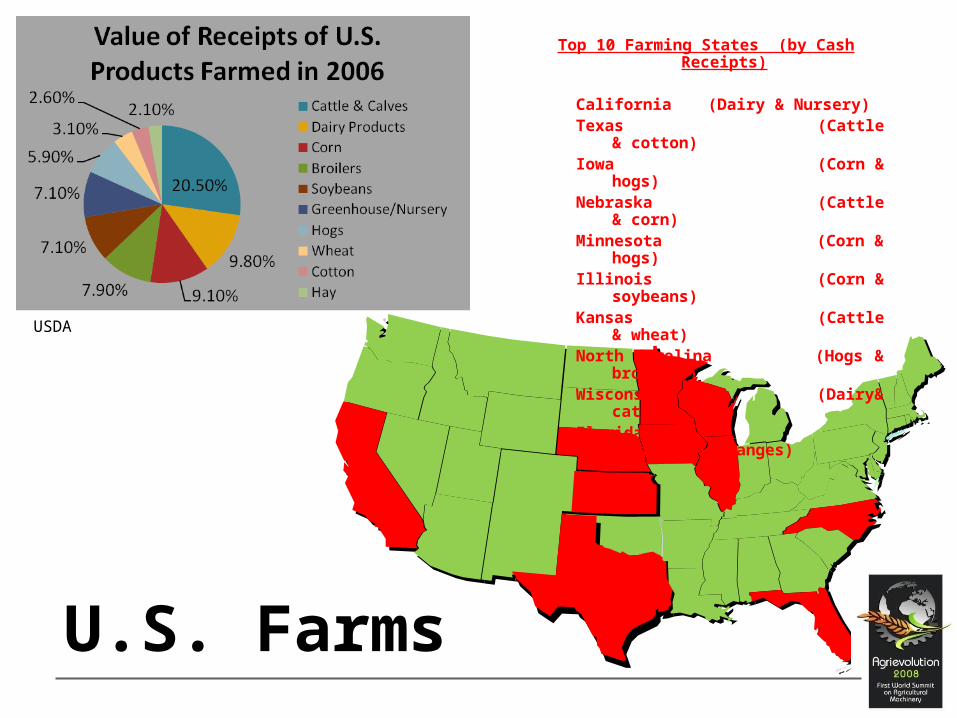
Top 10 Farming States (by Cash Receipts)
California (Dairy & Nursery)Texas (Cattle & cotton)Iowa (Corn & hogs)Nebraska (Cattle & corn)Minnesota (Corn & hogs)Illinois (Corn & soybeans)Kansas (Cattle & wheat)North Carolina (Hogs & broilers)Wisconsin (Dairy& cattle)Florida (Nursery & oranges)
U.S. Farms
USDA
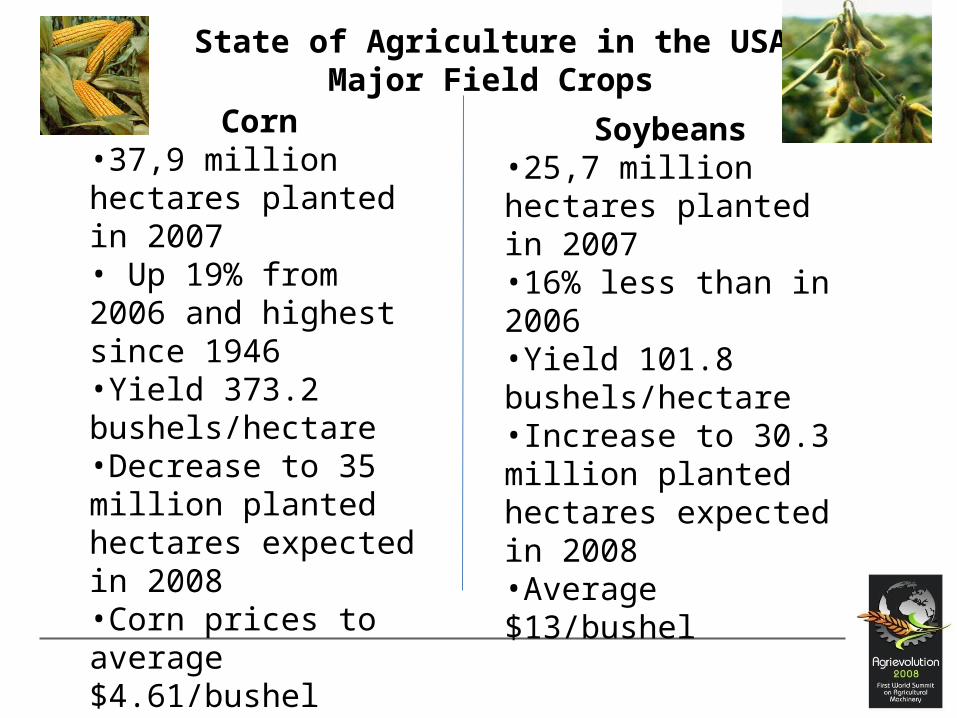
Corn•37,9 million hectares planted in 2007• Up 19% from 2006 and highest since 1946•Yield 373.2 bushels/hectare•Decrease to 35 million planted hectares expected in 2008 •Corn prices to average $4.61/bushel
Soybeans•25,7 million hectares planted in 2007•16% less than in 2006•Yield 101.8 bushels/hectare•Increase to 30.3 million planted hectares expected in 2008•Average $13/bushel
State of Agriculture in the USAMajor Field Crops
Continued increased corn use for EthanolU.S. to produce 11.9 billion gallons in 2008
30% of 2008 corn crop will go to ethanol production
8
U.S. Corn Usage
0
500
1000
1500
2000
2500
3000
3500
4000
4500
5000
5500
6000
6500
7000
Crop Year
Mill
ion
Bu
shel
s
Ethanol Exports Feed Sweeteners
* Informa Est.
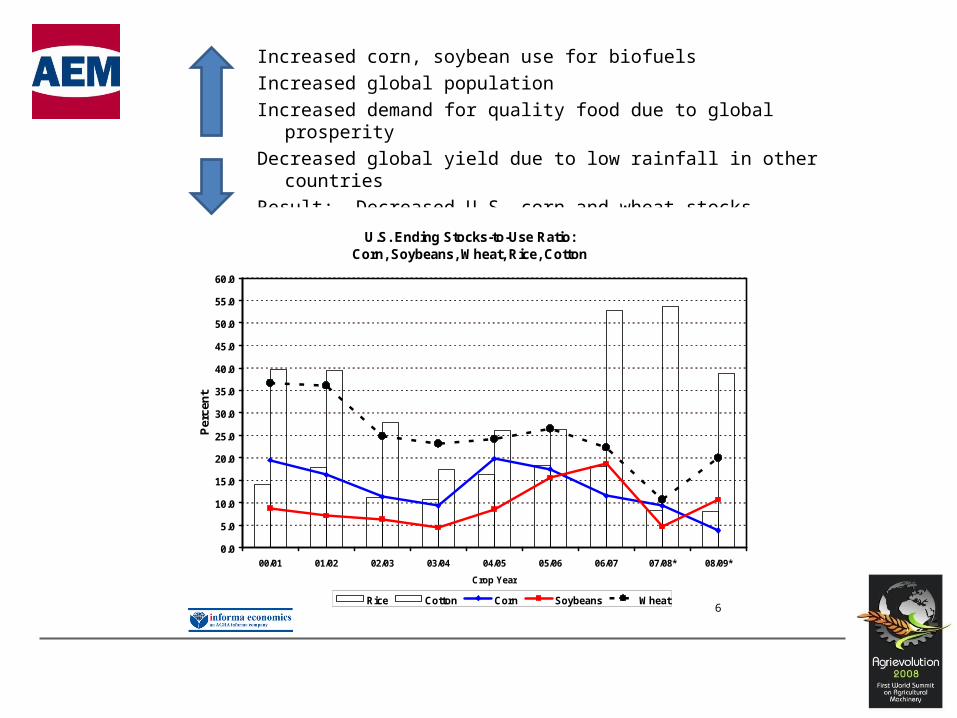
Increased corn, soybean use for biofuels
Increased global population
Increased demand for quality food due to global prosperity
Decreased global yield due to low rainfall in other countries
Result: Decreased U.S. corn and wheat stocks
6
U.S. Ending Stocks-to-Use Ratio: Corn, Soybeans, Wheat, Rice, Cotton
0.0
5.0
10.0
15.0
20.0
25.0
30.0
35.0
40.0
45.0
50.0
55.0
60.0
00/01 01/02 02/03 03/04 04/05 05/06 06/07 07/08* 08/09*
Crop Year
Per
cen
t
Rice Cotton Corn Soybeans Wheat
* Informa Est.

2008ExportsCrop ProductionNet Farm Income

MECHANIZATION EVOLUTION AND ECONOMIC WEIGHT OF
INDUSTRY
EquipmentMarch 2008
March 2007
% Chg.Y-T-D 2008
Y-T-D 2007
% Chg.Beginning Inventory
March 2008
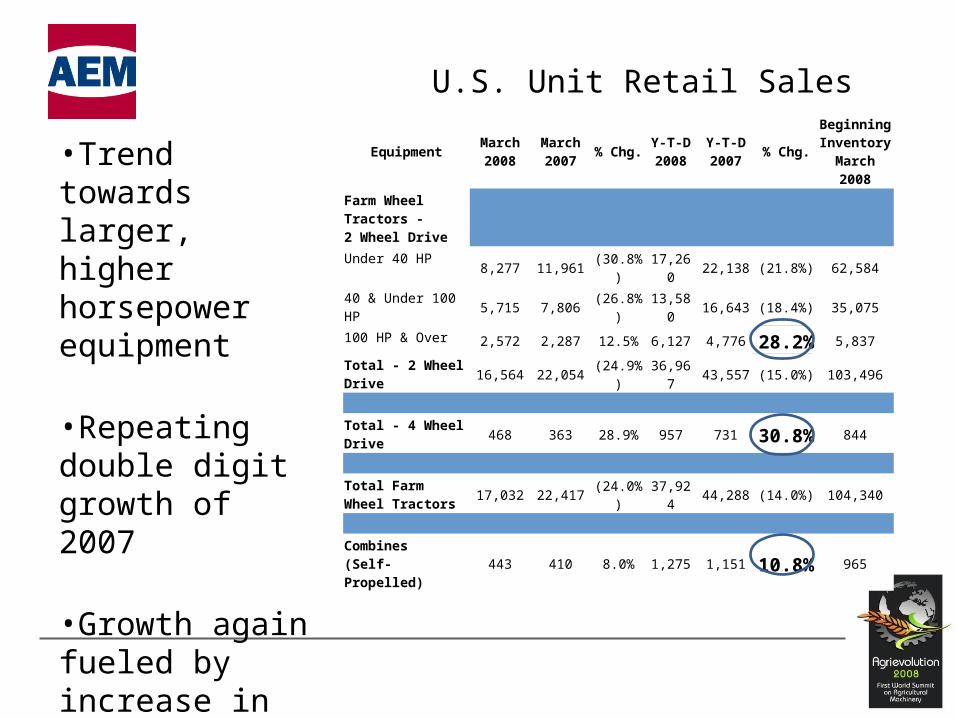
Farm Wheel Tractors -2 Wheel Drive
Under 40 HP8,277 11,961 (30.8%) 17,260 22,138 (21.8%) 62,584
40 & Under 100 HP5,715 7,806 (26.8%) 13,580 16,643 (18.4%) 35,075
100 HP & Over 2,572 2,287 12.5% 6,127 4,776 28.2% 5,837
Total - 2 Wheel Drive
16,564 22,054 (24.9%) 36,967 43,557 (15.0%) 103,496
Total - 4 Wheel Drive
468 363 28.9% 957 731 30.8% 844
Total Farm Wheel Tractors
17,032 22,417 (24.0%) 37,924 44,288 (14.0%) 104,340
Combines(Self-Propelled)
443 410 8.0% 1,275 1,151 10.8% 965
U.S. Unit Retail Sales
•Trend towards larger, higher horsepower equipment
•Repeating double digit growth of 2007
•Growth again fueled by increase in corn production & energy needs
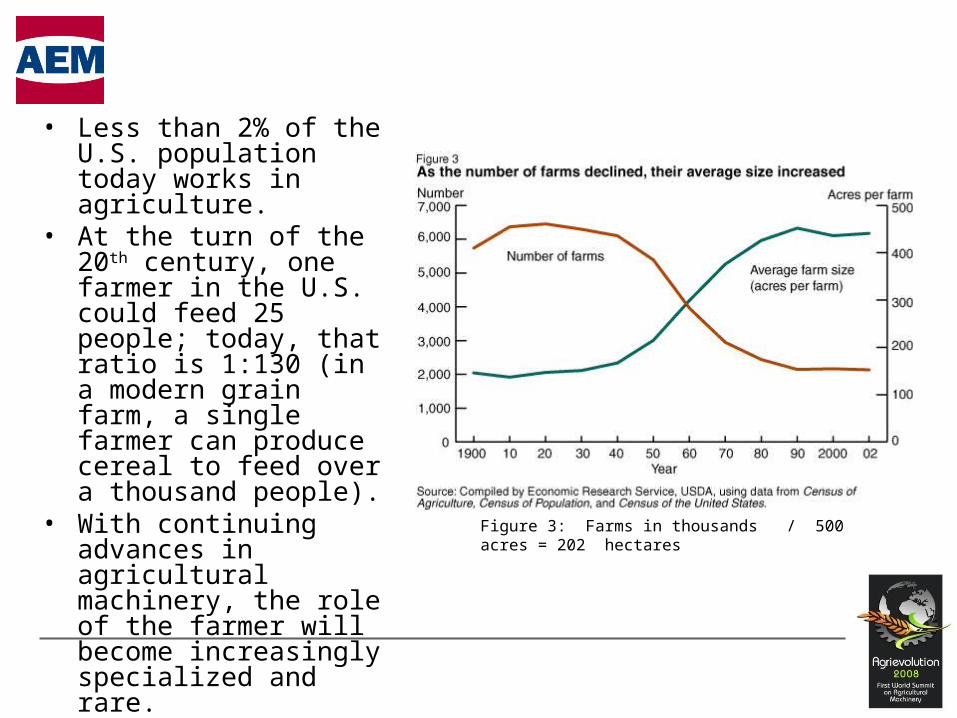
• Less than 2% of the U.S. population today works in agriculture.
• At the turn of the 20th century, one farmer in the U.S. could feed 25 people; today, that ratio is 1:130 (in a modern grain farm, a single farmer can produce cereal to feed over a thousand people).
• With continuing advances in agricultural machinery, the role of the farmer will become increasingly specialized and rare.
• Automation continues to be critical.
Figure 3: Farms in thousands / 500 acres = 202 hectares
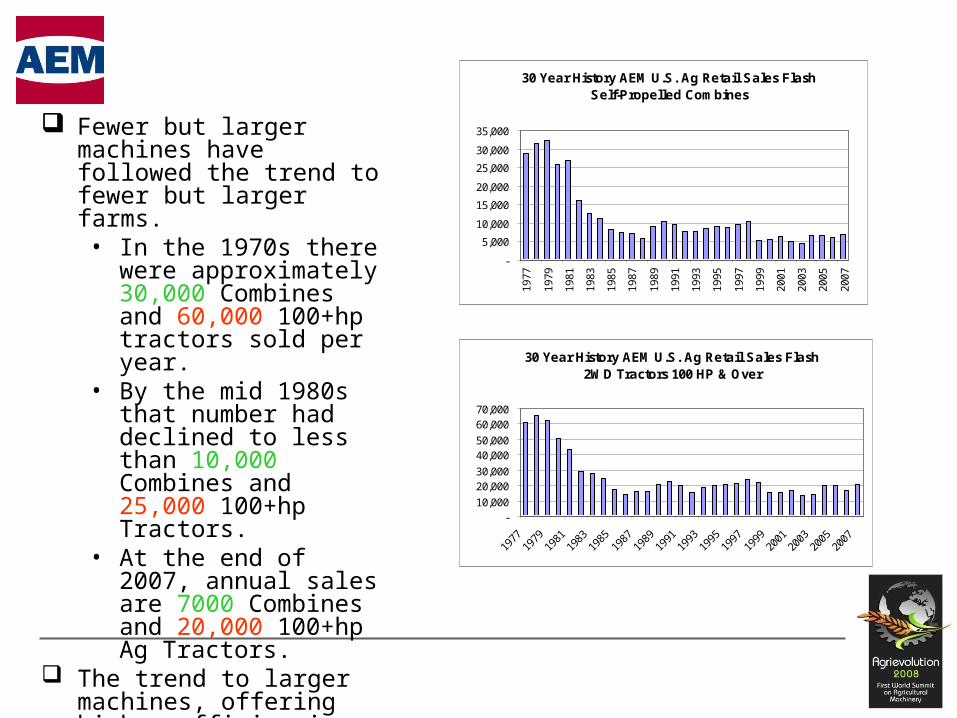
Fewer but larger machines have followed the trend to fewer but larger farms.• In the 1970s there were
approximately 30,000 Combines and 60,000 100+hp tractors sold per year.
• By the mid 1980s that number had declined to less than 10,000 Combines and 25,000 100+hp Tractors.
• At the end of 2007, annual sales are 7000 Combines and 20,000 100+hp Ag Tractors.
The trend to larger machines, offering higher efficiencies and greater productivity gains will continue.
30 Year History AEM U.S. Ag Retail Sales Flash Self-Propelled Combines
-
5,000
10,000
15,000
20,000
25,000
30,000
35,000
1977
1979
1981
1983
1985
1987
1989
1991
1993
1995
1997
1999
2001
2003
2005
2007
30 Year History AEM U.S. Ag Retail Sales Flash2WD Tractors 100 HP & Over
-10,000
20,00030,000
40,00050,000
60,00070,000
1977
1979
1981
1983
1985
1987
1989
1991
1993
1995
1997
1999
2001
2003
2005
2007
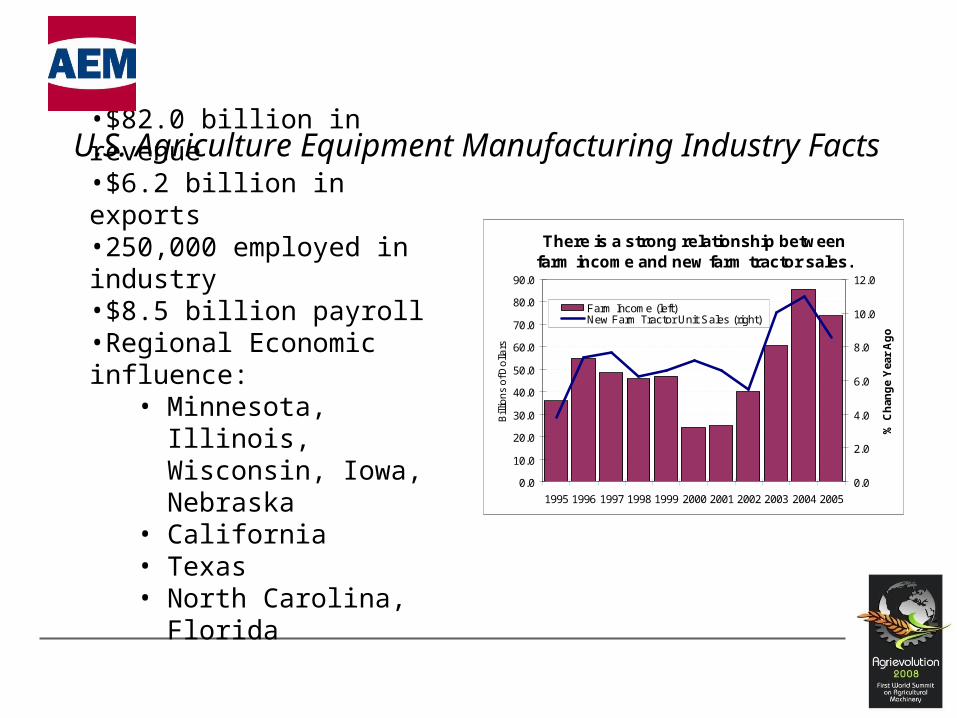
•$82.0 billion in revenue•$6.2 billion in exports•250,000 employed in industry •$8.5 billion payroll•Regional Economic influence:
• Minnesota, Illinois, Wisconsin, Iowa, Nebraska
• California• Texas• North Carolina, Florida
U.S. Agriculture Equipment Manufacturing Industry Facts
There is a strong relationship between farm income and new farm tractor sales.
0.0
10.0
20.0
30.0
40.0
50.0
60.0
70.0
80.0
90.0
1995 1996 1997 1998 1999 2000 2001 2002 2003 2004 2005B
illio
ns
of D
olla
rs
0.0
2.0
4.0
6.0
8.0
10.0
12.0
% C
han
ge
Yea
r A
go
Farm Income (left)New Farm Tractor Unit Sales (right)
LEGISLATIVE FRAMEWORK AND REGULATIONS PERTAINING TO
AGRICULTURE
The Food, Conservation and Energy Act of 2008“The Farm Bill”
• Reauthorizes crop subsidies and conservation programs
• Tightens income eligibility limits for farm payments
• Boosts funding for Food Assistance programs
• Expands land conservation programs
• Offers new incentives for alternative energy research and development
• Programs for Farm, Nutrition and Conservation through 2012.
• Overwhelming bi-partisan support in Congress.
• 1000+ Ag groups supported the bill sent to the President
• President Bush vetoed the bill as too expensive, lacking major reform
• Congress overwhelmingly rejected his veto.

RESEARCH AND TECHNOLOGICAL INNOVATION
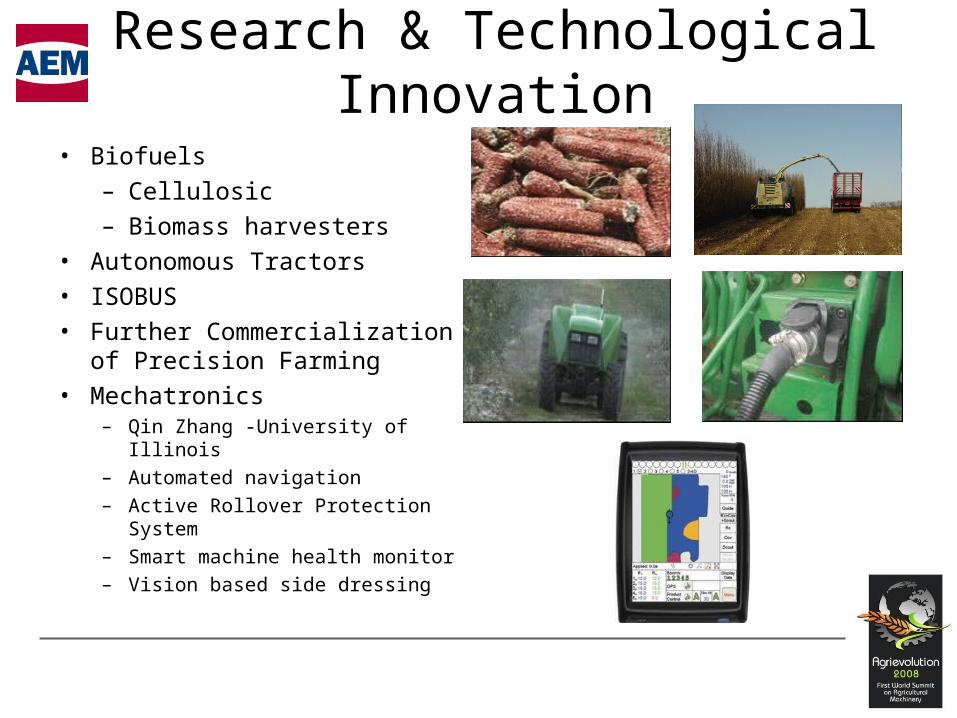
Research & Technological Innovation
• Biofuels– Cellulosic– Biomass harvesters
• Autonomous Tractors• ISOBUS• Further Commercialization of
Precision Farming• Mechatronics
– Qin Zhang -University of Illinois– Automated navigation– Active Rollover Protection System– Smart machine health monitor– Vision based side dressing
Rome 30-31 May 2008


![Welcome to Fowler and Fowler Credit Repair [Compatibility Mode]](https://img.pdfslide.us/doc/110x75/577cc4341a28aba7119879e1/welcome-to-fowler-and-fowler-credit-repair-compatibility-mode.jpg)