Embed Size (px)
Citation preview
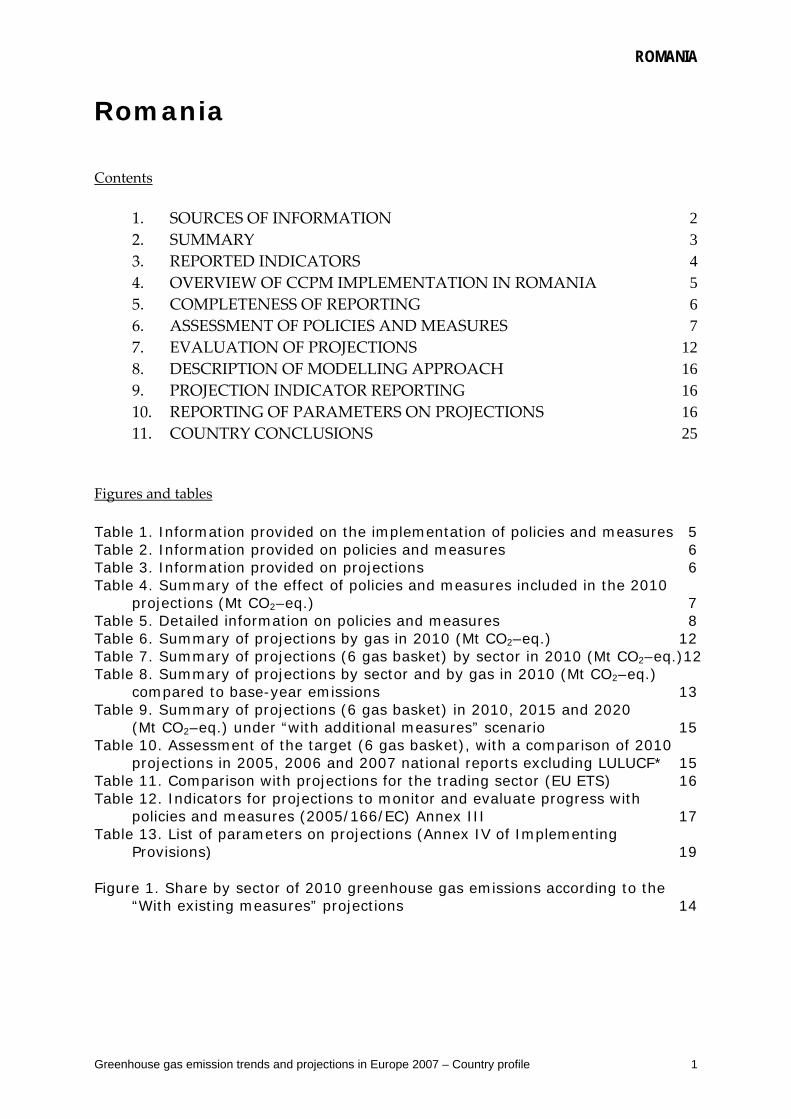
ROMANIA
Greenhouse gas emission trends and projections in Europe 2007 – Country profile 1
Romania Contents
1. SOURCES OF INFORMATION 2 2. SUMMARY 3 3. REPORTED INDICATORS 4 4. OVERVIEW OF CCPM IMPLEMENTATION IN ROMANIA 5 5. COMPLETENESS OF REPORTING 6 6. ASSESSMENT OF POLICIES AND MEASURES 7 7. EVALUATION OF PROJECTIONS 12 8. DESCRIPTION OF MODELLING APPROACH 16 9. PROJECTION INDICATOR REPORTING 16 10. REPORTING OF PARAMETERS ON PROJECTIONS 16 11. COUNTRY CONCLUSIONS 25
Figures and tables Table 1. Information provided on the implementation of policies and measures 5 Table 2. Information provided on policies and measures 6 Table 3. Information provided on projections 6 Table 4. Summary of the effect of policies and measures included in the 2010
projections (Mt CO2–eq.) 7 Table 5. Detailed information on policies and measures 8 Table 6. Summary of projections by gas in 2010 (Mt CO2–eq.) 12 Table 7. Summary of projections (6 gas basket) by sector in 2010 (Mt CO2–eq.)12 Table 8. Summary of projections by sector and by gas in 2010 (Mt CO2–eq.)
compared to base-year emissions 13 Table 9. Summary of projections (6 gas basket) in 2010, 2015 and 2020
(Mt CO2–eq.) under “with additional measures” scenario 15 Table 10. Assessment of the target (6 gas basket), with a comparison of 2010
projections in 2005, 2006 and 2007 national reports excluding LULUCF* 15 Table 11. Comparison with projections for the trading sector (EU ETS) 16 Table 12. Indicators for projections to monitor and evaluate progress with
policies and measures (2005/166/EC) Annex III 17 Table 13. List of parameters on projections (Annex IV of Implementing
Provisions) 19 Figure 1. Share by sector of 2010 greenhouse gas emissions according to the
“With existing measures” projections 14
ROMANIA
Greenhouse gas emission trends and projections in Europe 2007 – Country profile 2
1. SOURCES OF INFORMATION
Report by Romania for the assessment of projected progress; under Decision No 280/2004/EC on the European Parliament and of the Council concerning a mechanism for monitoring Community GHG emissions and for implementing the Kyoto Protocol, 2007 (hereinafter MMS). Romania’s Fourth National Communication on Climate Change under the United Nations Framework Convention on Climate Change, submitted in November, 2006 (hereinafter 4 NC) Romanian National Allocation Plan for 2007 and 2008‐2012 periods, Ministry of Environment and Water Management, December, 2006 (hereinafter NAP2) Romania’s Greenhouse Gas Inventory 1989‐2005, National Inventory Report, March 2007, Bucharest, Romania (hereinafter NIR 2007) ECCP Policies and Measures database, Öko Institut, 2007 http://www.oeko.de/service/pam/index.php Base‐year emissions Base‐year emissions of greenhouse gases are not reported in MMS. Hence in this Country Profile the base‐year data quoted are taken from the NIR 2007. They equal 282.467 Mt CO2 eq. The year 1989 is chosen for emissions of all 6 gases, including fluorinated gases ‐ hydro‐fluorocarbons (HFC), perfluorocarbons (PFCs), and sulphur hexafluoride (SF6). Base year data is not included in The European Communityʹs initial report under the Kyoto Proto‐col ‐ Report to facilitate the calculation of the assigned amount of the European Community pursuant to Article 3, paragraphs 7 and 8 of the Kyoto Protocol (Submission to the UNFCCC Secretariat), EEA Technical report No 10/2006. Romania, being in the year 2006 an accession country, was not obliged to make a submission.
ROMANIA
Greenhouse gas emission trends and projections in Europe 2007 – Country profile 3
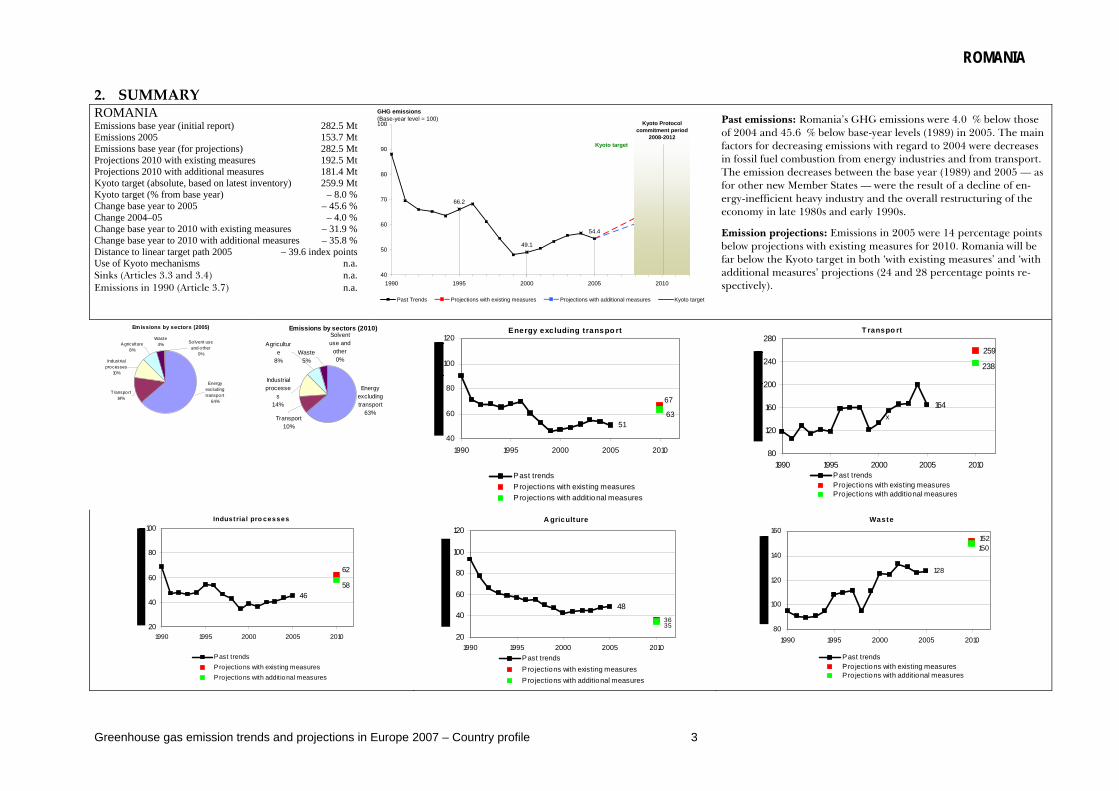
2. SUMMARY ROMANIA Emissions base year (initial report) 282.5 Mt Emissions 2005 153.7 Mt Emissions base year (for projections) 282.5 Mt Projections 2010 with existing measures 192.5 Mt Projections 2010 with additional measures 181.4 Mt Kyoto target (absolute, based on latest inventory) 259.9 Mt Kyoto target (% from base year) – 8.0 % Change base year to 2005 – 45.6 % Change 2004–05 – 4.0 % Change base year to 2010 with existing measures – 31.9 % Change base year to 2010 with additional measures – 35.8 % Distance to linear target path 2005 – 39.6 index points Use of Kyoto mechanisms n.a. Sinks (Articles 3.3 and 3.4) n.a. Emissions in 1990 (Article 3.7) n.a.
49.1
66.268.1
64.254.4
40
50
60
70
80
90
100
1990 1995 2000 2005 2010
GHG emissions (Base-year level = 100)
Past Trends Projections with existing measures Projections with additional measures Kyoto target
Kyoto Protocol commitment period
2008-2012Kyoto target
Past emissions: Romania’s GHG emissions were 4.0 % below those of 2004 and 45.6 % below base-year levels (1989) in 2005. The main factors for decreasing emissions with regard to 2004 were decreases in fossil fuel combustion from energy industries and from transport. The emission decreases between the base year (1989) and 2005 — as for other new Member States — were the result of a decline of en-ergy-inefficient heavy industry and the overall restructuring of the economy in late 1980s and early 1990s.
Emission projections: Emissions in 2005 were 14 percentage points below projections with existing measures for 2010. Romania will be far below the Kyoto target in both ‘with existing measures’ and ‘with additional measures’ projections (24 and 28 percentage points re-spectively).
Emissions by sectors (2005)
Industrial processes
10%
Agriculture8%
Solvent use and o ther
0%
Waste4%
Transport14%
Energy excluding transport
64%
Emissions by sectors (2010)
Transport10%
Energy excluding transport
63%
Waste5%
Solvent use and
other0%
Agriculture
8%
Industrial processe
s14%
Energy excluding transpo rt
51
67
63
40
60
80
100
120
1990 1995 2000 2005 2010
Past trendsPro jections with existing measuresPro jections with additional measures
T ranspo rt
164
259
238
80
120
160
200
240
280
1990 1995 2000 2005 2010Past trendsPro jections with existing measuresPro jections with additional measures
x
Industria l pro cesses
46
62
58
20
40
60
80
100
1990 1995 2000 2005 2010
Past trendsPro jections with existing measuresPro jections with additional measures
A griculture
483635
20
40
60
80
100
120
1990 1995 2000 2005 2010Past trendsPro jections with existing measuresPro jections with additional measures
Waste
128
152150
80
100
120
140
160
1990 1995 2000 2005 2010
Past trendsPro jections with existing measuresPro jections with additional measures
ROMANIA
Greenhouse gas emission trends and projections in Europe 2007 – Country profile 4
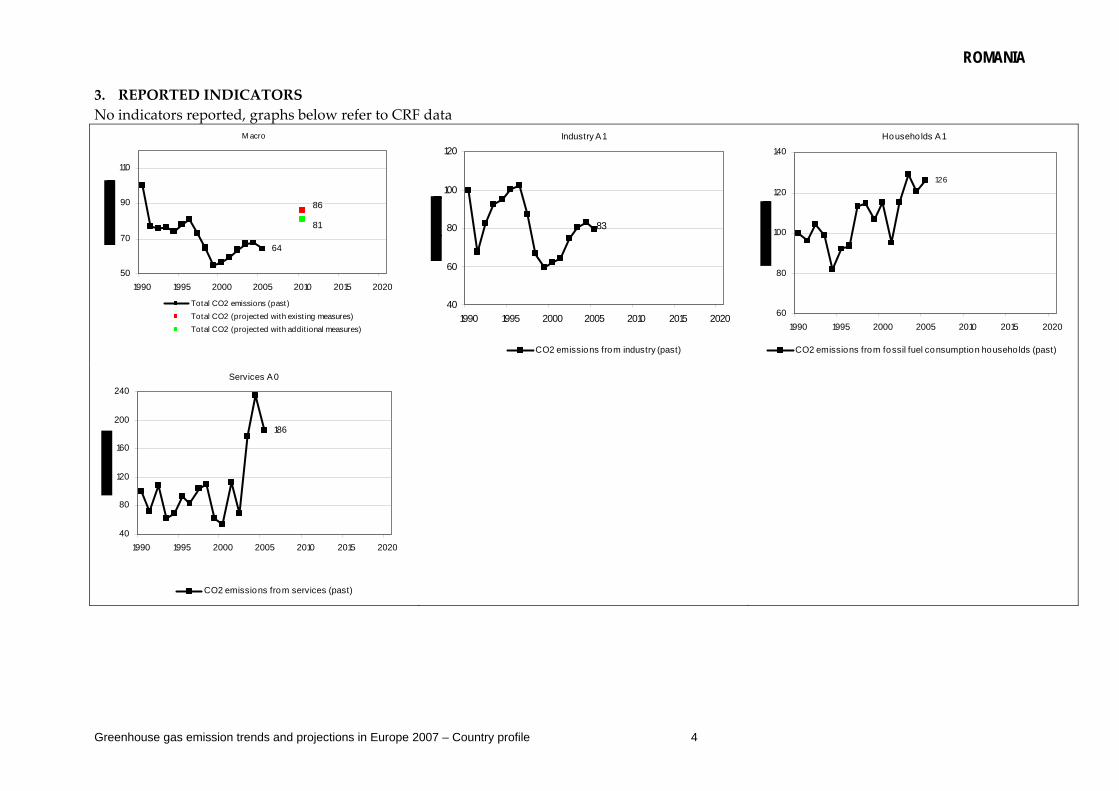
3. REPORTED INDICATORS No indicators reported, graphs below refer to CRF data
M acro
64
86
81
50
70
90
110
1990 1995 2000 2005 2010 2015 2020
Total CO2 emissions (past)Total CO2 (projected with exist ing measures)Total CO2 (projected with addit ional measures)
Industry A1
83
40
60
80
100
120
1990 1995 2000 2005 2010 2015 2020
CO2 emissions from industry (past)
Households A1
126
60
80
100
120
140
1990 1995 2000 2005 2010 2015 2020
CO2 emissions from fossil fuel consumption households (past)
Services A0
186
40
80
120
160
200
240
1990 1995 2000 2005 2010 2015 2020
CO2 emissions from services (past)
ROMANIA
Greenhouse gas emission trends and projections in Europe 2007 – Country profile 5
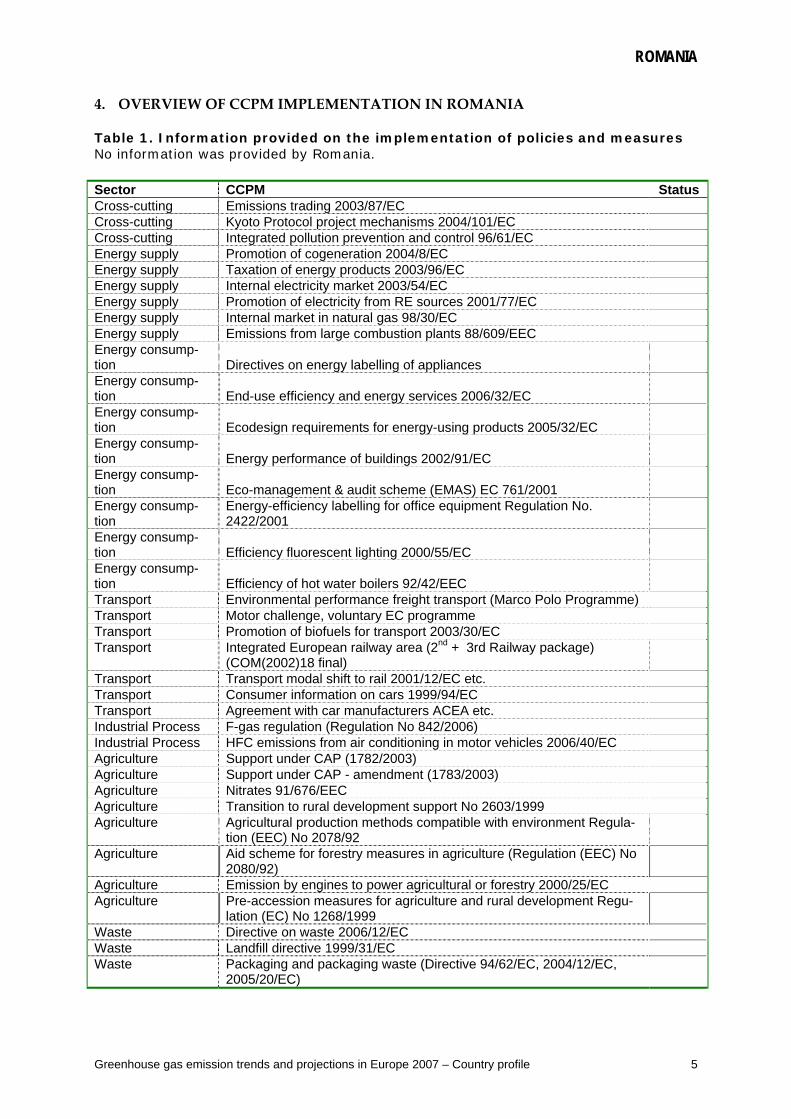
4. OVERVIEW OF CCPM IMPLEMENTATION IN ROMANIA
Table 1. Information provided on the implementation of policies and measures No information was provided by Romania. Sector CCPM Status Cross-cutting Emissions trading 2003/87/EC Cross-cutting Kyoto Protocol project mechanisms 2004/101/EC Cross-cutting Integrated pollution prevention and control 96/61/EC Energy supply Promotion of cogeneration 2004/8/EC Energy supply Taxation of energy products 2003/96/EC Energy supply Internal electricity market 2003/54/EC Energy supply Promotion of electricity from RE sources 2001/77/EC Energy supply Internal market in natural gas 98/30/EC Energy supply Emissions from large combustion plants 88/609/EEC Energy consump-tion Directives on energy labelling of appliances Energy consump-tion End-use efficiency and energy services 2006/32/EC Energy consump-tion Ecodesign requirements for energy-using products 2005/32/EC Energy consump-tion Energy performance of buildings 2002/91/EC Energy consump-tion Eco-management & audit scheme (EMAS) EC 761/2001 Energy consump-tion
Energy-efficiency labelling for office equipment Regulation No. 2422/2001
Energy consump-tion Efficiency fluorescent lighting 2000/55/EC Energy consump-tion Efficiency of hot water boilers 92/42/EEC Transport Environmental performance freight transport (Marco Polo Programme) Transport Motor challenge, voluntary EC programme Transport Promotion of biofuels for transport 2003/30/EC Transport Integrated European railway area (2nd + 3rd Railway package)
(COM(2002)18 final) Transport Transport modal shift to rail 2001/12/EC etc. Transport Consumer information on cars 1999/94/EC Transport Agreement with car manufacturers ACEA etc. Industrial Process F-gas regulation (Regulation No 842/2006) Industrial Process HFC emissions from air conditioning in motor vehicles 2006/40/EC Agriculture Support under CAP (1782/2003) Agriculture Support under CAP - amendment (1783/2003) Agriculture Nitrates 91/676/EEC Agriculture Transition to rural development support No 2603/1999 Agriculture Agricultural production methods compatible with environment Regula-
tion (EEC) No 2078/92 Agriculture Aid scheme for forestry measures in agriculture (Regulation (EEC) No
2080/92) Agriculture Emission by engines to power agricultural or forestry 2000/25/EC Agriculture Pre-accession measures for agriculture and rural development Regu-
lation (EC) No 1268/1999 Waste Directive on waste 2006/12/EC Waste Landfill directive 1999/31/EC Waste Packaging and packaging waste (Directive 94/62/EC, 2004/12/EC,
2005/20/EC)
ROMANIA
Greenhouse gas emission trends and projections in Europe 2007 – Country profile 6
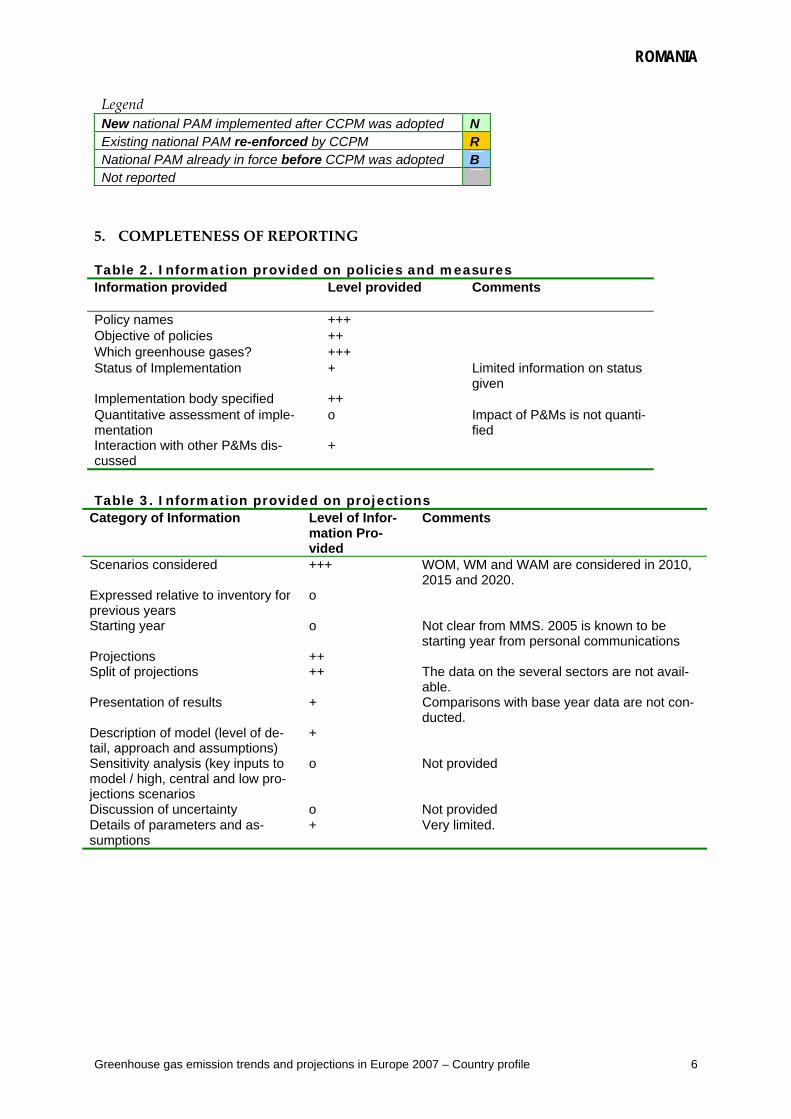
Legend New national PAM implemented after CCPM was adopted N Existing national PAM re-enforced by CCPM R National PAM already in force before CCPM was adopted B Not reported 5. COMPLETENESS OF REPORTING
Table 2. Information provided on policies and measures Information provided Level provided Comments
Policy names +++ Objective of policies ++ Which greenhouse gases? +++ Status of Implementation + Limited information on status
given Implementation body specified ++ Quantitative assessment of imple-mentation
o Impact of P&Ms is not quanti-fied
Interaction with other P&Ms dis-cussed
+
Table 3. Information provided on projections
Category of Information
Level of Infor-mation Pro-vided
Comments
Scenarios considered +++ WOM, WM and WAM are considered in 2010, 2015 and 2020.
Expressed relative to inventory for previous years
o
Starting year o Not clear from MMS. 2005 is known to be starting year from personal communications
Projections ++ Split of projections ++ The data on the several sectors are not avail-
able. Presentation of results + Comparisons with base year data are not con-
ducted. Description of model (level of de-tail, approach and assumptions)
+
Sensitivity analysis (key inputs to model / high, central and low pro-jections scenarios
o Not provided
Discussion of uncertainty o Not provided Details of parameters and as-sumptions
+ Very limited.
ROMANIA
Greenhouse gas emission trends and projections in Europe 2007 – Country profile 7
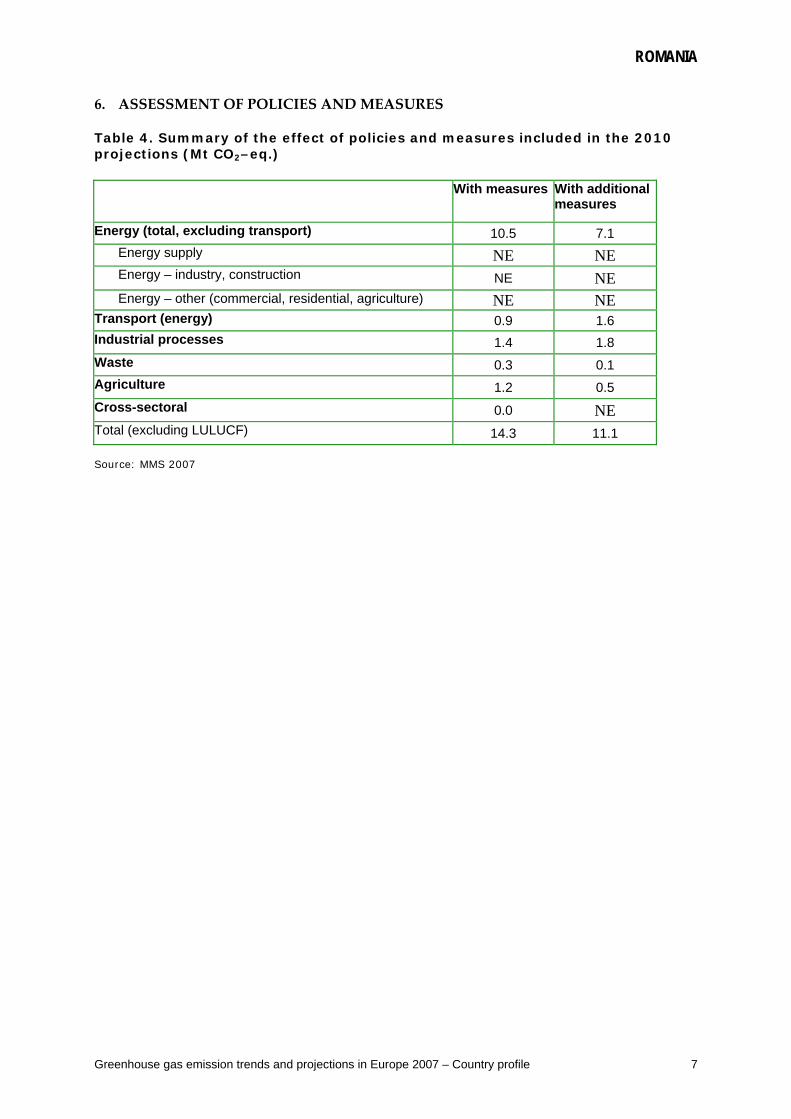
6. ASSESSMENT OF POLICIES AND MEASURES
Table 4. Summary of the effect of policies and measures included in the 2010 projections (Mt CO2–eq.) With measures With additional
measures
Energy (total, excluding transport) 10.5 7.1 Energy supply NE NE Energy – industry, construction NE NE Energy – other (commercial, residential, agriculture) NE NE Transport (energy) 0.9 1.6 Industrial processes 1.4 1.8 Waste 0.3 0.1 Agriculture 1.2 0.5 Cross-sectoral 0.0 NE Total (excluding LULUCF) 14.3 11.1 Source: MMS 2007
ROMANIA
Greenhouse gas emission trends and projections in Europe 2007 – Country profile 8
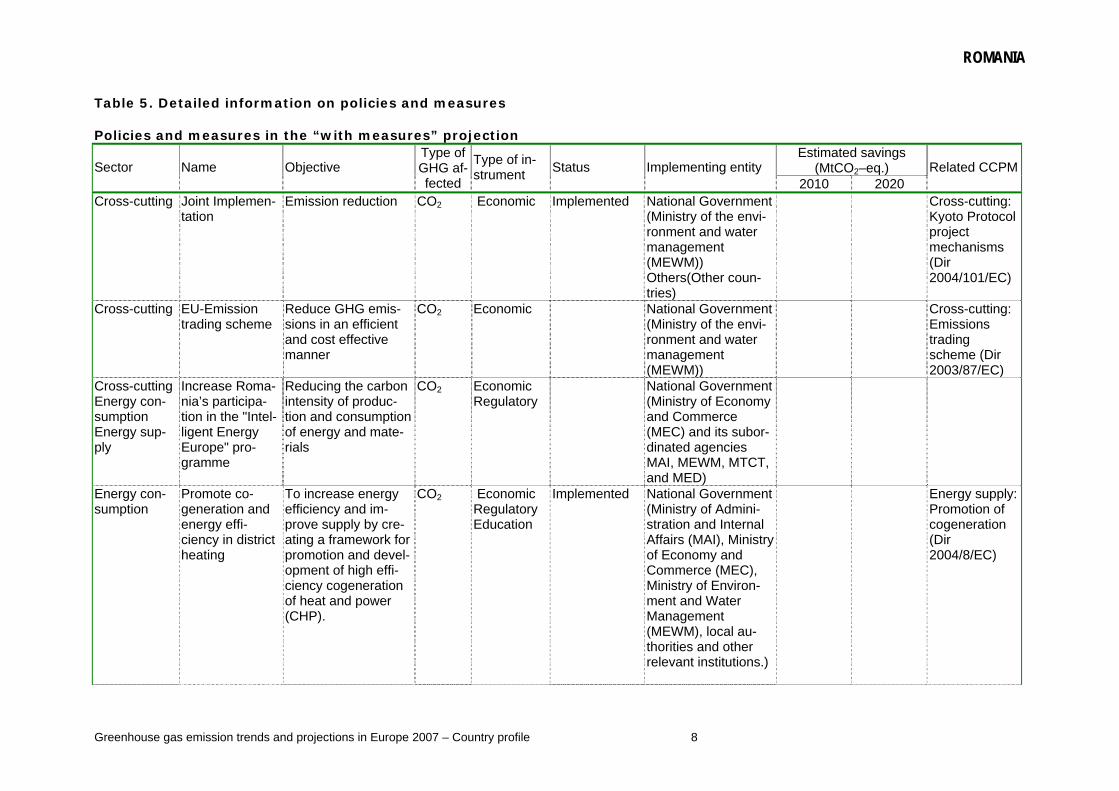
Table 5. Detailed information on policies and measures Policies and measures in the “with measures” projection
Estimated savings (MtCO2–eq.) Sector Name Objective
Type of GHG af-fected
Type of in-strument Status Implementing entity
2010 2020 Related CCPM
Cross-cutting Joint Implemen-tation
Emission reduction CO2 Economic Implemented National Government (Ministry of the envi-ronment and water management (MEWM)) Others(Other coun-tries)
Cross-cutting: Kyoto Protocol project mechanisms (Dir 2004/101/EC)
Cross-cutting EU-Emission trading scheme
Reduce GHG emis-sions in an efficient and cost effective manner
CO2 Economic National Government (Ministry of the envi-ronment and water management (MEWM))
Cross-cutting: Emissions trading scheme (Dir 2003/87/EC)
Cross-cuttingEnergy con-sumption Energy sup-ply
Increase Roma-nia’s participa-tion in the "Intel-ligent Energy Europe" pro-gramme
Reducing the carbon intensity of produc-tion and consumption of energy and mate-rials
CO2 Economic Regulatory
National Government (Ministry of Economy and Commerce (MEC) and its subor-dinated agencies MAI, MEWM, MTCT, and MED)
Energy con-sumption
Promote co-generation and energy effi-ciency in district heating
To increase energy efficiency and im-prove supply by cre-ating a framework for promotion and devel-opment of high effi-ciency cogeneration of heat and power (CHP).
CO2 Economic Regulatory Education
Implemented National Government (Ministry of Admini-stration and Internal Affairs (MAI), Ministry of Economy and Commerce (MEC), Ministry of Environ-ment and Water Management (MEWM), local au-thorities and other relevant institutions.)
Energy supply: Promotion of cogeneration (Dir 2004/8/EC)
ROMANIA
Greenhouse gas emission trends and projections in Europe 2007 – Country profile 9
Estimated savings (MtCO2–eq.) Sector Name Objective
Type of GHG af-fected
Type of in-strument Status Implementing entity
2010 2020 Related CCPM
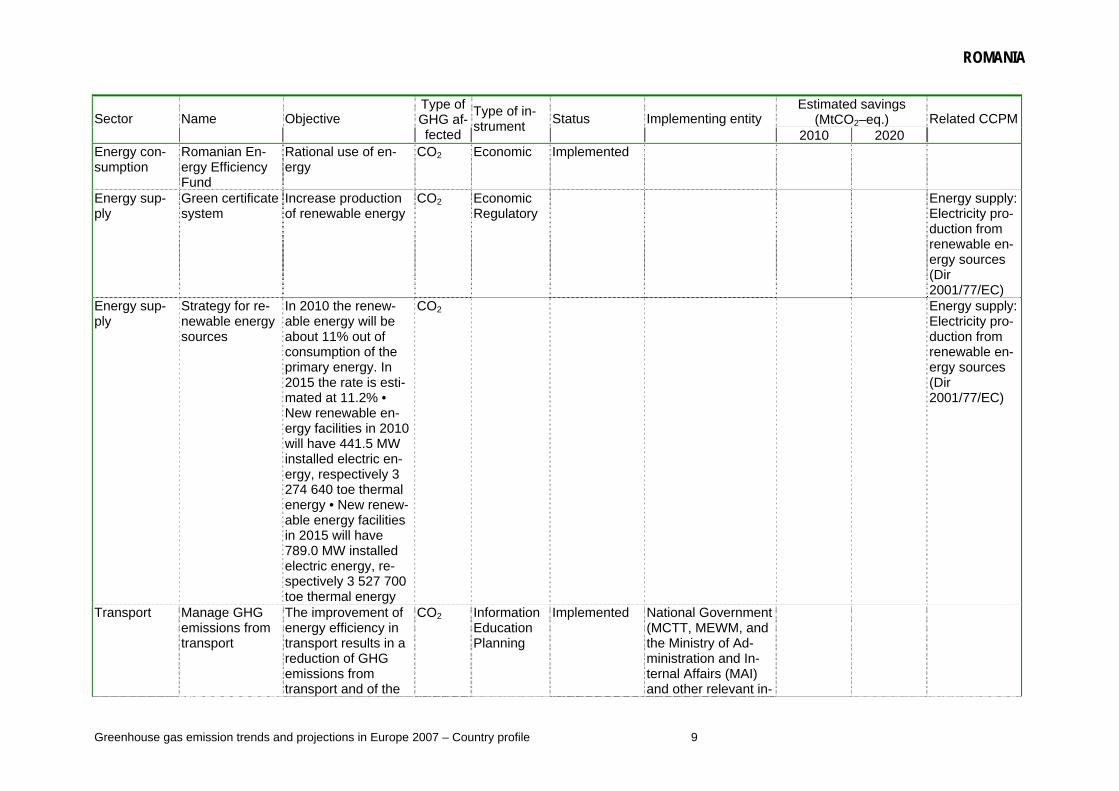
Energy con-sumption
Romanian En-ergy Efficiency Fund
Rational use of en-ergy
CO2 Economic Implemented
Energy sup-ply
Green certificate system
Increase production of renewable energy
CO2 Economic Regulatory
Energy supply: Electricity pro-duction from renewable en-ergy sources (Dir 2001/77/EC)
Energy sup-ply
Strategy for re-newable energy sources
In 2010 the renew-able energy will be about 11% out of consumption of the primary energy. In 2015 the rate is esti-mated at 11.2% • New renewable en-ergy facilities in 2010 will have 441.5 MW installed electric en-ergy, respectively 3 274 640 toe thermal energy • New renew-able energy facilities in 2015 will have 789.0 MW installed electric energy, re-spectively 3 527 700 toe thermal energy
CO2 Energy supply: Electricity pro-duction from renewable en-ergy sources (Dir 2001/77/EC)
Transport Manage GHG emissions from transport
The improvement of energy efficiency in transport results in a reduction of GHG emissions from transport and of the
CO2 InformationEducation Planning
Implemented National Government (MCTT, MEWM, and the Ministry of Ad-ministration and In-ternal Affairs (MAI) and other relevant in-
ROMANIA
Greenhouse gas emission trends and projections in Europe 2007 – Country profile 10
Estimated savings (MtCO2–eq.) Sector Name Objective
Type of GHG af-fected
Type of in-strument Status Implementing entity
2010 2020 Related CCPM
environmental im-pacts.
stitutions.)
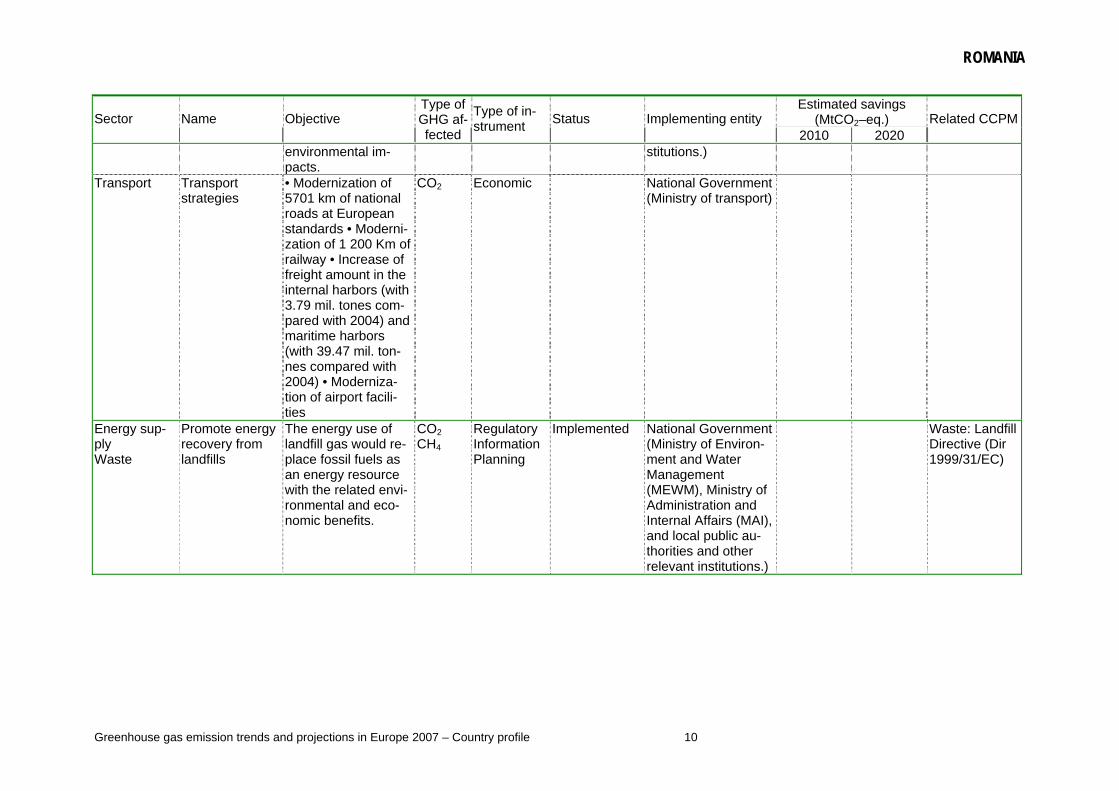
Transport Transport strategies
• Modernization of 5701 km of national roads at European standards • Moderni-zation of 1 200 Km of railway • Increase of freight amount in the internal harbors (with 3.79 mil. tones com-pared with 2004) and maritime harbors (with 39.47 mil. ton-nes compared with 2004) • Moderniza-tion of airport facili-ties
CO2 Economic National Government (Ministry of transport)
Energy sup-ply Waste
Promote energy recovery from landfills
The energy use of landfill gas would re-place fossil fuels as an energy resource with the related envi-ronmental and eco-nomic benefits.
CO2 CH4
Regulatory InformationPlanning
Implemented National Government (Ministry of Environ-ment and Water Management (MEWM), Ministry of Administration and Internal Affairs (MAI), and local public au-thorities and other relevant institutions.)
Waste: Landfill Directive (Dir 1999/31/EC)
ROMANIA
Greenhouse gas emission trends and projections in Europe 2007 – Country profile 11
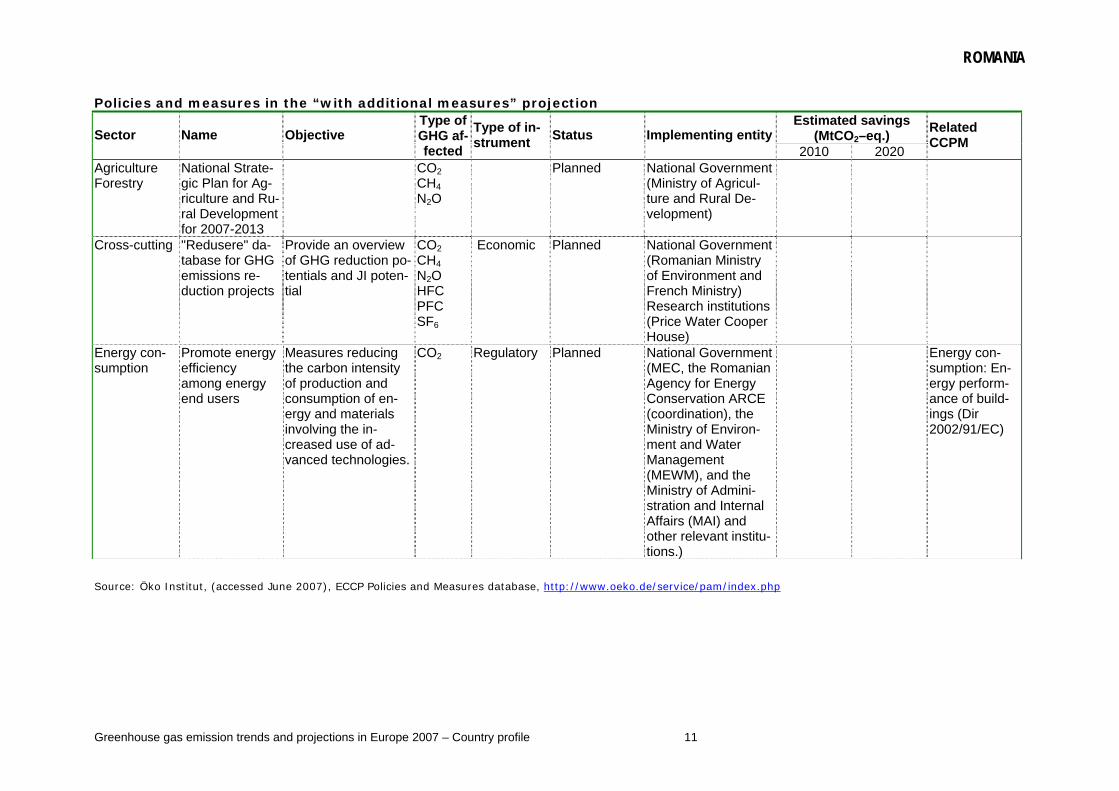
Policies and measures in the “with additional measures” projection Estimated savings
(MtCO2–eq.) Sector Name Objective Type of GHG af-fected
Type of in-strument Status Implementing entity
2010 2020
Related CCPM
Agriculture Forestry
National Strate-gic Plan for Ag-riculture and Ru-ral Development for 2007-2013
CO2 CH4 N2O
Planned National Government (Ministry of Agricul-ture and Rural De-velopment)
Cross-cutting "Redusere" da-tabase for GHG emissions re-duction projects
Provide an overview of GHG reduction po-tentials and JI poten-tial
CO2 CH4 N2O HFC PFC SF6
Economic Planned National Government (Romanian Ministry of Environment and French Ministry) Research institutions (Price Water Cooper House)
Energy con-sumption
Promote energy efficiency among energy end users
Measures reducing the carbon intensity of production and consumption of en-ergy and materials involving the in-creased use of ad-vanced technologies.
CO2 Regulatory Planned National Government (MEC, the Romanian Agency for Energy Conservation ARCE (coordination), the Ministry of Environ-ment and Water Management (MEWM), and the Ministry of Admini-stration and Internal Affairs (MAI) and other relevant institu-tions.)
Energy con-sumption: En-ergy perform-ance of build-ings (Dir 2002/91/EC)
Source: Öko Institut, (accessed June 2007), ECCP Policies and Measures database, http://www.oeko.de/service/pam/index.php
ROMANIA
Greenhouse gas emission trends and projections in Europe 2007 – Country profile 12
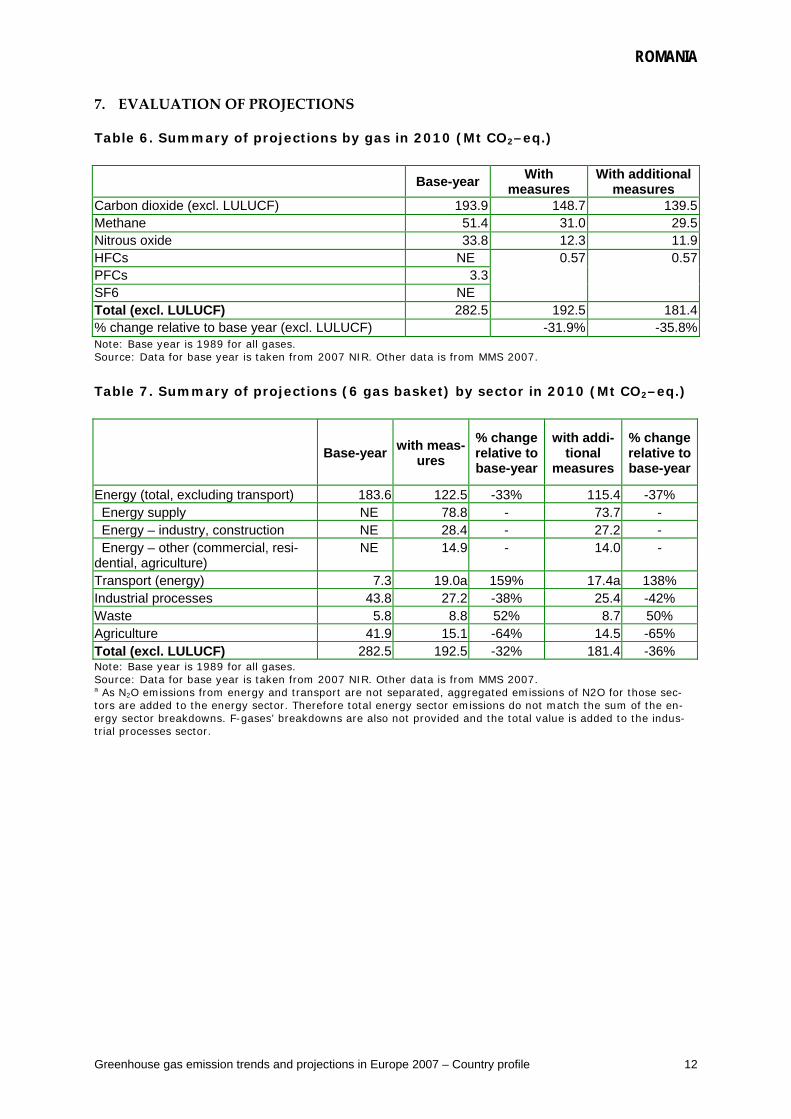
7. EVALUATION OF PROJECTIONS
Table 6. Summary of projections by gas in 2010 (Mt CO2–eq.)
Base-year With measures
With additional measures
Carbon dioxide (excl. LULUCF) 193.9 148.7 139.5Methane 51.4 31.0 29.5Nitrous oxide 33.8 12.3 11.9HFCs NE PFCs 3.3SF6 NE
0.57 0.57
Total (excl. LULUCF) 282.5 192.5 181.4% change relative to base year (excl. LULUCF) -31.9% -35.8%Note: Base year is 1989 for all gases. Source: Data for base year is taken from 2007 NIR. Other data is from MMS 2007.
Table 7. Summary of projections (6 gas basket) by sector in 2010 (Mt CO2–eq.)
Base-year with meas-ures
% change relative to base-year
with addi-tional
measures
% change relative to base-year
Energy (total, excluding transport) 183.6 122.5 -33% 115.4 -37% Energy supply NE 78.8 - 73.7 - Energy – industry, construction NE 28.4 - 27.2 - Energy – other (commercial, resi-dential, agriculture)
NE 14.9 - 14.0 -
Transport (energy) 7.3 19.0a 159% 17.4a 138% Industrial processes 43.8 27.2 -38% 25.4 -42% Waste 5.8 8.8 52% 8.7 50% Agriculture 41.9 15.1 -64% 14.5 -65% Total (excl. LULUCF) 282.5 192.5 -32% 181.4 -36% Note: Base year is 1989 for all gases. Source: Data for base year is taken from 2007 NIR. Other data is from MMS 2007. a As N2O emissions from energy and transport are not separated, aggregated emissions of N2O for those sec-tors are added to the energy sector. Therefore total energy sector emissions do not match the sum of the en-ergy sector breakdowns. F-gases’ breakdowns are also not provided and the total value is added to the indus-trial processes sector.
ROMANIA
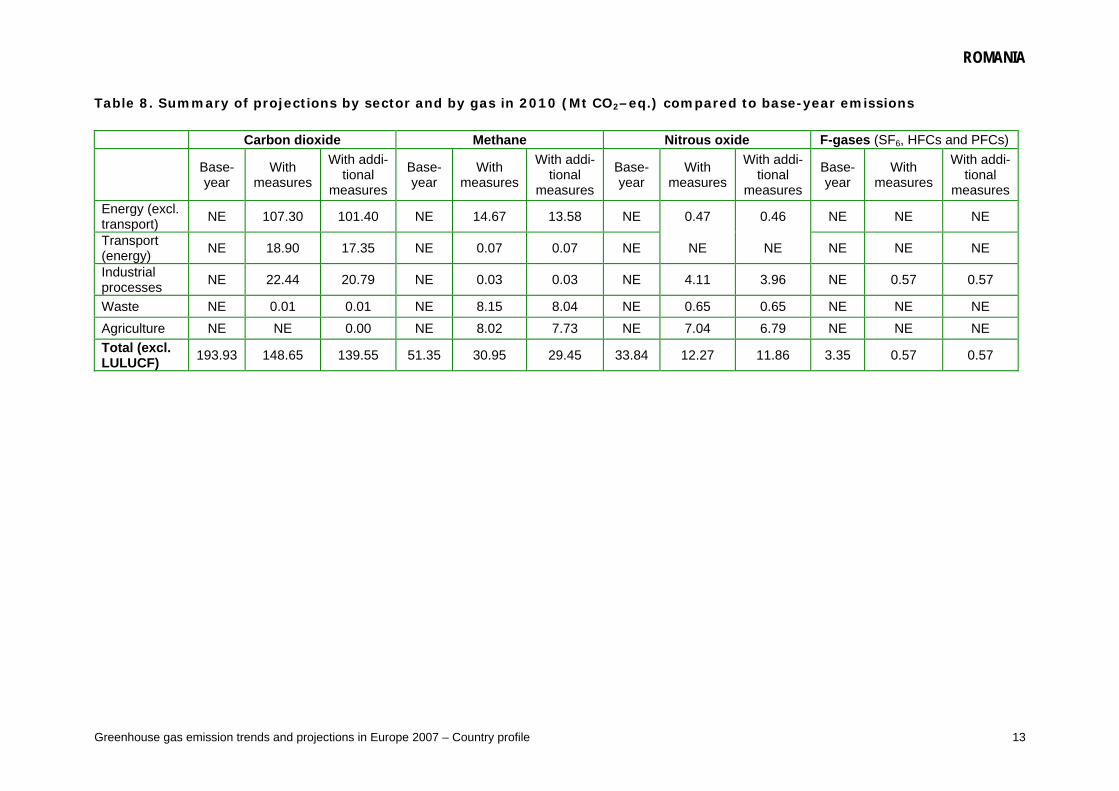
Greenhouse gas emission trends and projections in Europe 2007 – Country profile 13
Table 8. Summary of projections by sector and by gas in 2010 (Mt CO2–eq.) compared to base-year emissions Carbon dioxide Methane Nitrous oxide F-gases (SF6, HFCs and PFCs)
Base-year
With measures
With addi-tional
measures
Base-year
With measures
With addi-tional
measures
Base-year
With measures
With addi-tional
measures
Base-year
With measures
With addi-tional
measures Energy (excl. transport) NE 107.30 101.40 NE 14.67 13.58 NE 0.47 0.46 NE NE NE
Transport (energy) NE 18.90 17.35 NE 0.07 0.07 NE NE NE NE NE NE
Industrial processes NE 22.44 20.79 NE 0.03 0.03 NE 4.11 3.96 NE 0.57 0.57
Waste NE 0.01 0.01 NE 8.15 8.04 NE 0.65 0.65 NE NE NE Agriculture NE NE 0.00 NE 8.02 7.73 NE 7.04 6.79 NE NE NE Total (excl. LULUCF) 193.93 148.65 139.55 51.35 30.95 29.45 33.84 12.27 11.86 3.35 0.57 0.57
ROMANIA
Greenhouse gas emission trends and projections in Europe 2007 – Country profile 14
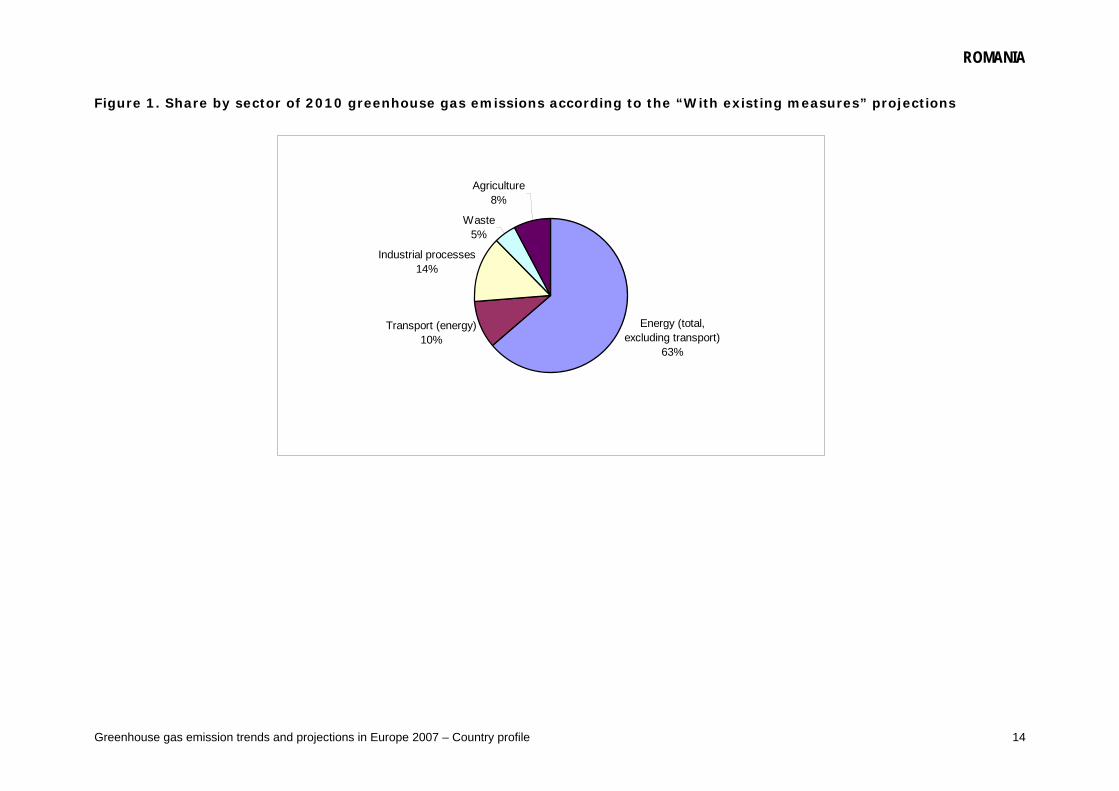
Figure 1. Share by sector of 2010 greenhouse gas emissions according to the “With existing measures” projections
Energy (total, excluding transport)
63%
Transport (energy)10%
Industrial processes14%
Waste5%
Agriculture8%
ROMANIA
Greenhouse gas emission trends and projections in Europe 2007 – Country profile 15
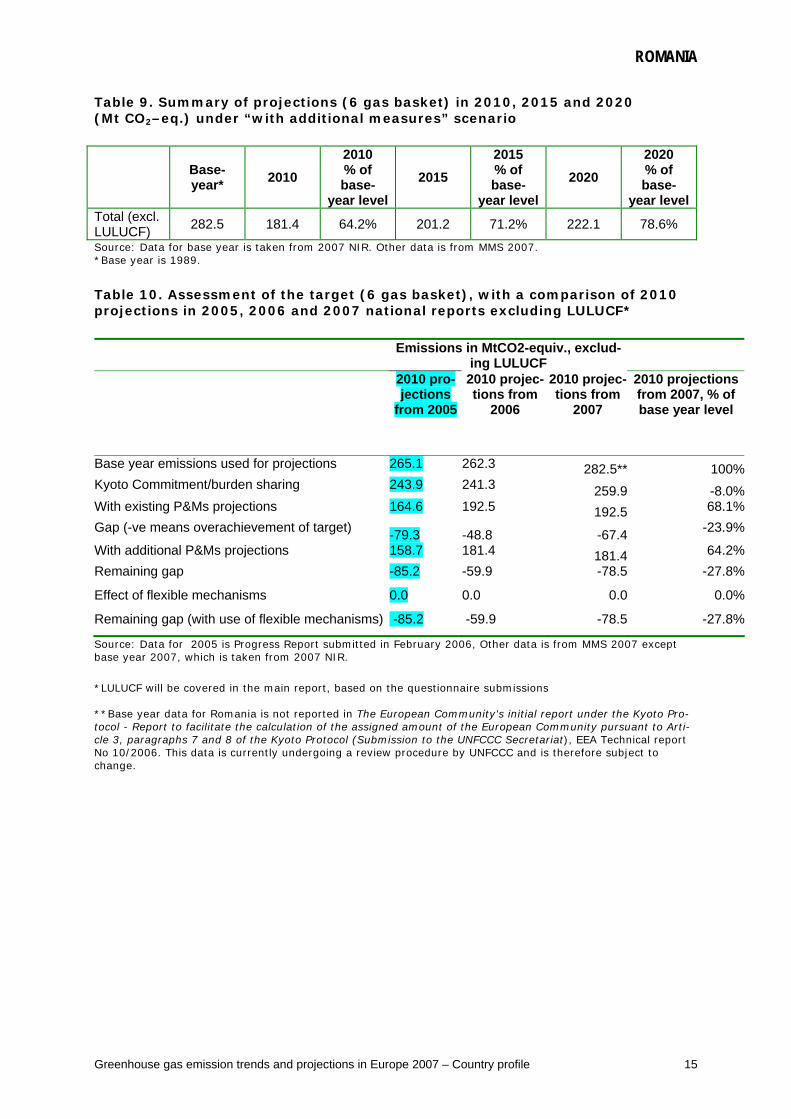
Table 9. Summary of projections (6 gas basket) in 2010, 2015 and 2020 (Mt CO2–eq.) under “with additional measures” scenario
Base-year* 2010
2010 % of base-
year level2015
2015 % of base-
year level2020
2020 % of base-
year levelTotal (excl. LULUCF) 282.5 181.4 64.2% 201.2 71.2% 222.1 78.6%
Source: Data for base year is taken from 2007 NIR. Other data is from MMS 2007. *Base year is 1989. Table 10. Assessment of the target (6 gas basket), with a comparison of 2010 projections in 2005, 2006 and 2007 national reports excluding LULUCF* Emissions in MtCO2-equiv., exclud-
ing LULUCF
2010 pro-jections
from 2005
2010 projec-tions from
2006
2010 projec-tions from
2007
2010 projections from 2007, % of base year level
Base year emissions used for projections 265.1 262.3 282.5** 100%Kyoto Commitment/burden sharing 243.9 241.3 259.9 -8.0%With existing P&Ms projections 164.6 192.5 192.5 68.1%Gap (-ve means overachievement of target) -79.3 -48.8 -67.4 -23.9%
With additional P&Ms projections 158.7 181.4 181.4 64.2%Remaining gap -85.2 -59.9 -78.5 -27.8%
Effect of flexible mechanisms 0.0 0.0 0.0 0.0%
Remaining gap (with use of flexible mechanisms) -85.2 -59.9 -78.5 -27.8%
Source: Data for 2005 is Progress Report submitted in February 2006, Other data is from MMS 2007 except base year 2007, which is taken from 2007 NIR. *LULUCF will be covered in the main report, based on the questionnaire submissions **Base year data for Romania is not reported in The European Community's initial report under the Kyoto Pro-tocol - Report to facilitate the calculation of the assigned amount of the European Community pursuant to Arti-cle 3, paragraphs 7 and 8 of the Kyoto Protocol (Submission to the UNFCCC Secretariat), EEA Technical report No 10/2006. This data is currently undergoing a review procedure by UNFCCC and is therefore subject to change.
ROMANIA
Greenhouse gas emission trends and projections in Europe 2007 – Country profile 16
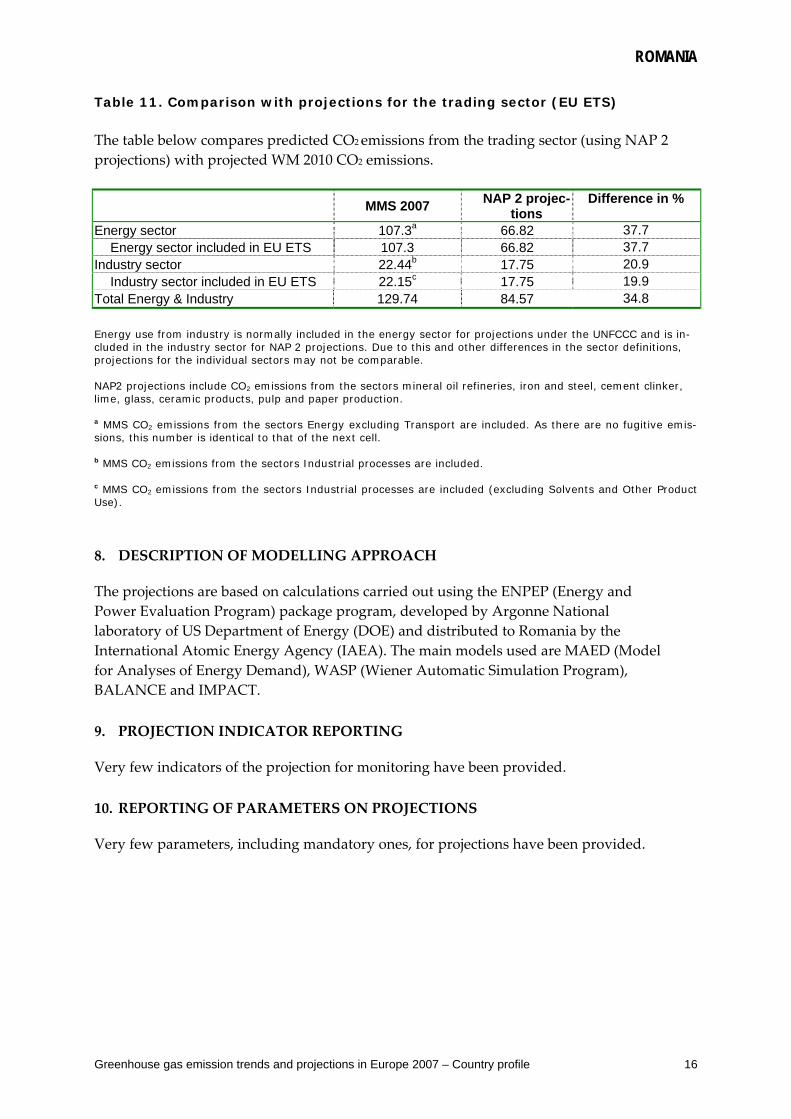
Table 11. Comparison with projections for the trading sector (EU ETS) The table below compares predicted CO2 emissions from the trading sector (using NAP 2 projections) with projected WM 2010 CO2 emissions.
MMS 2007 NAP 2 projec-tions
Difference in %
Energy sector 107.3a 66.82 37.7 Energy sector included in EU ETS 107.3 66.82 37.7
Industry sector 22.44b 17.75 20.9 Industry sector included in EU ETS 22.15c 17.75 19.9
Total Energy & Industry 129.74 84.57 34.8 Energy use from industry is normally included in the energy sector for projections under the UNFCCC and is in-cluded in the industry sector for NAP 2 projections. Due to this and other differences in the sector definitions, projections for the individual sectors may not be comparable. NAP2 projections include CO2 emissions from the sectors mineral oil refineries, iron and steel, cement clinker, lime, glass, ceramic products, pulp and paper production. a MMS CO2 emissions from the sectors Energy excluding Transport are included. As there are no fugitive emis-sions, this number is identical to that of the next cell. b MMS CO2 emissions from the sectors Industrial processes are included. c MMS CO2 emissions from the sectors Industrial processes are included (excluding Solvents and Other Product Use). 8. DESCRIPTION OF MODELLING APPROACH
The projections are based on calculations carried out using the ENPEP (Energy and Power Evaluation Program) package program, developed by Argonne National laboratory of US Department of Energy (DOE) and distributed to Romania by the International Atomic Energy Agency (IAEA). The main models used are MAED (Model for Analyses of Energy Demand), WASP (Wiener Automatic Simulation Program), BALANCE and IMPACT. 9. PROJECTION INDICATOR REPORTING
Very few indicators of the projection for monitoring have been provided. 10. REPORTING OF PARAMETERS ON PROJECTIONS
Very few parameters, including mandatory ones, for projections have been provided.
ROMANIA
Greenhouse gas emission trends and projections in Europe 2007 – Country profile 17
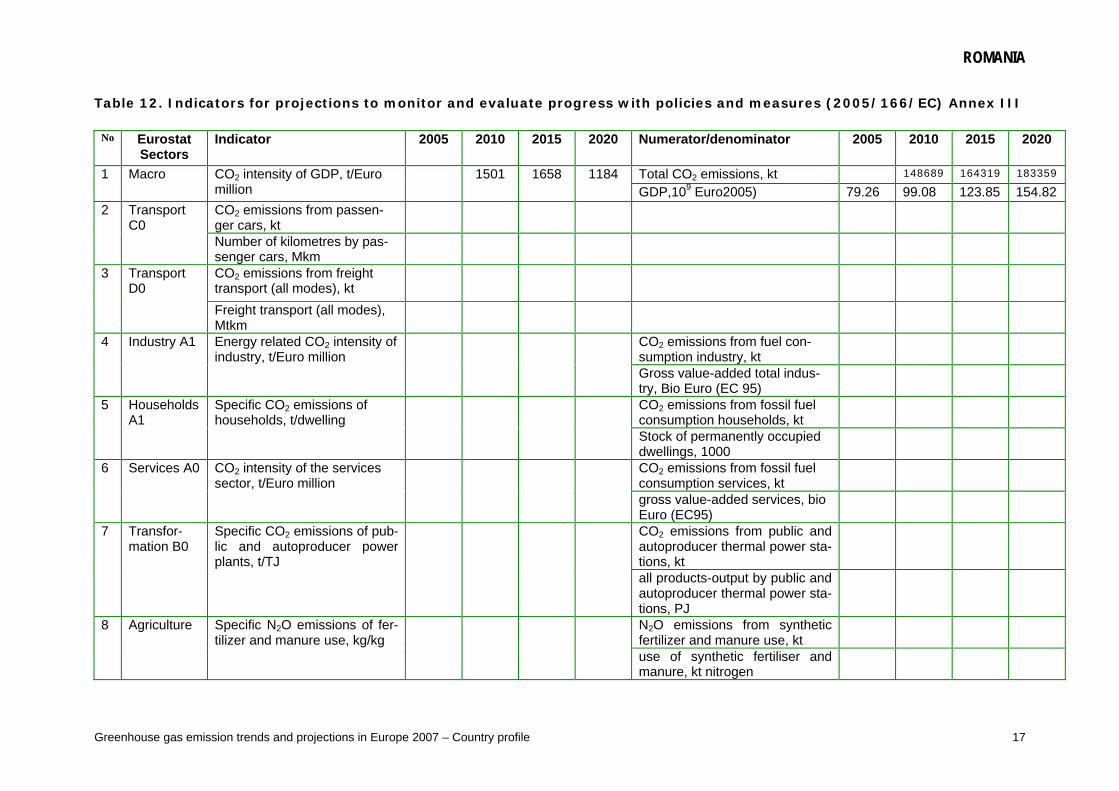
Table 12. Indicators for projections to monitor and evaluate progress with policies and measures (2005/166/EC) Annex III
No Eurostat Sectors
Indicator 2005 2010 2015 2020 Numerator/denominator 2005 2010 2015 2020
Total CO2 emissions, kt 148689 164319 183359 1 Macro CO2 intensity of GDP, t/Euro million
1501 1658 1184 GDP,109 Euro2005) 79.26 99.08 123.85 154.82
CO2 emissions from passen-ger cars, kt
2 Transport C0
Number of kilometres by pas-senger cars, Mkm
CO2 emissions from freight transport (all modes), kt
3 Transport D0
Freight transport (all modes), Mtkm
CO2 emissions from fuel con-sumption industry, kt
4 Industry A1 Energy related CO2 intensity of industry, t/Euro million
Gross value-added total indus-try, Bio Euro (EC 95)
CO2 emissions from fossil fuel consumption households, kt
5 Households A1
Specific CO2 emissions of households, t/dwelling
Stock of permanently occupied dwellings, 1000
CO2 emissions from fossil fuel consumption services, kt
6 Services A0 CO2 intensity of the services sector, t/Euro million
gross value-added services, bio Euro (EC95)
CO2 emissions from public and autoproducer thermal power sta-tions, kt
7 Transfor-mation B0
Specific CO2 emissions of pub-lic and autoproducer power plants, t/TJ
all products-output by public and autoproducer thermal power sta-tions, PJ
N2O emissions from synthetic fertilizer and manure use, kt
8 Agriculture Specific N2O emissions of fer-tilizer and manure use, kg/kg
use of synthetic fertiliser and manure, kt nitrogen
ROMANIA
Greenhouse gas emission trends and projections in Europe 2007 – Country profile 18
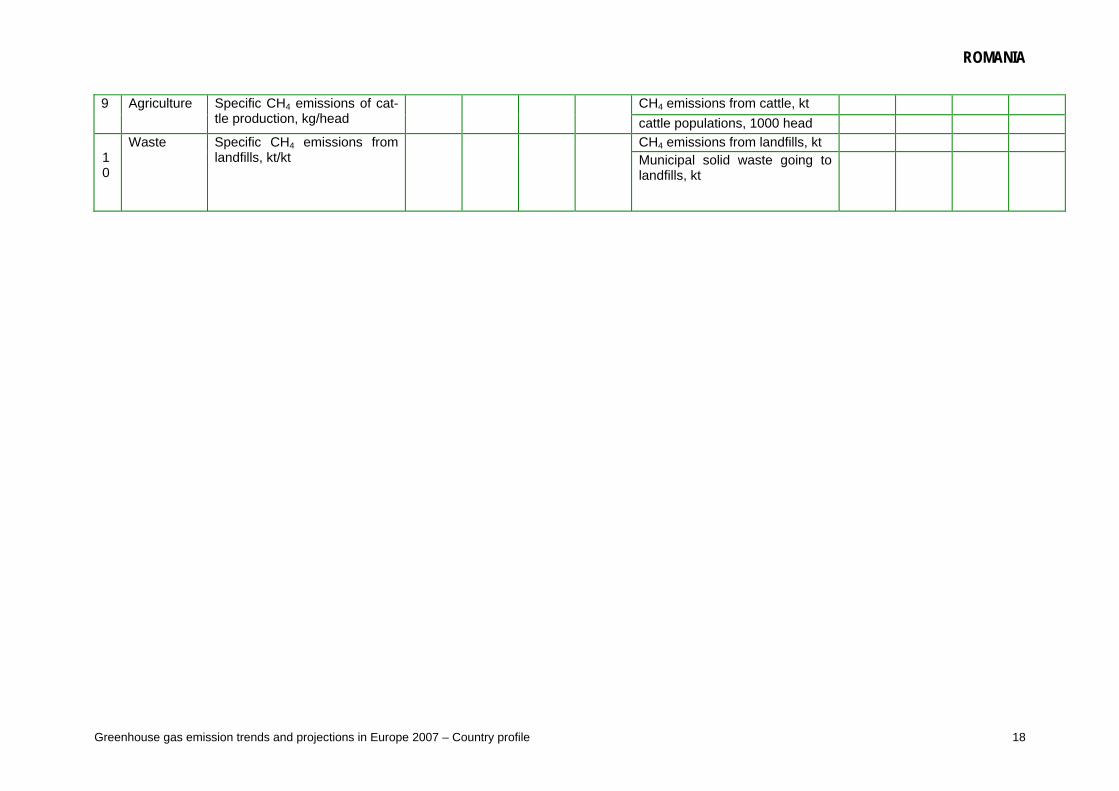
CH4 emissions from cattle, kt 9 Agriculture Specific CH4 emissions of cat-tle production, kg/head
cattle populations, 1000 head CH4 emissions from landfills, kt
10
Waste Specific CH4 emissions from landfills, kt/kt
Municipal solid waste going to landfills, kt
ROMANIA
Greenhouse gas emission trends and projections in Europe 2007 – Country profile 19
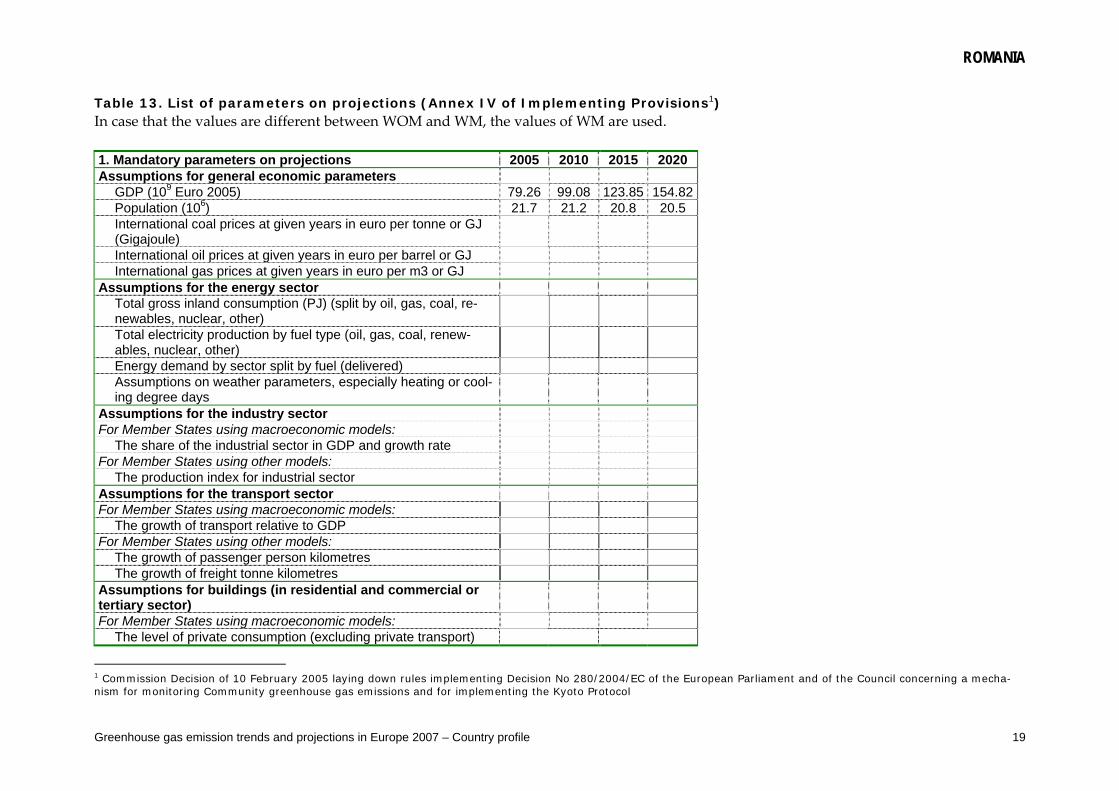
Table 13. List of parameters on projections (Annex IV of Implementing Provisions1) In case that the values are different between WOM and WM, the values of WM are used. 1. Mandatory parameters on projections 2005 2010 2015 2020 Assumptions for general economic parameters
GDP (109 Euro 2005) 79.26 99.08 123.85 154.82Population (106) 21.7 21.2 20.8 20.5 International coal prices at given years in euro per tonne or GJ (Gigajoule)
International oil prices at given years in euro per barrel or GJ International gas prices at given years in euro per m3 or GJ
Assumptions for the energy sector Total gross inland consumption (PJ) (split by oil, gas, coal, re-newables, nuclear, other)
Total electricity production by fuel type (oil, gas, coal, renew-ables, nuclear, other)
Energy demand by sector split by fuel (delivered) Assumptions on weather parameters, especially heating or cool-ing degree days
Assumptions for the industry sector For Member States using macroeconomic models:
The share of the industrial sector in GDP and growth rate For Member States using other models:
The production index for industrial sector Assumptions for the transport sector For Member States using macroeconomic models:
The growth of transport relative to GDP For Member States using other models:
The growth of passenger person kilometres The growth of freight tonne kilometres
Assumptions for buildings (in residential and commercial or tertiary sector)
For Member States using macroeconomic models: The level of private consumption (excluding private transport)
1 Commission Decision of 10 February 2005 laying down rules implementing Decision No 280/2004/EC of the European Parliament and of the Council concerning a mecha-nism for monitoring Community greenhouse gas emissions and for implementing the Kyoto Protocol
ROMANIA
Greenhouse gas emission trends and projections in Europe 2007 – Country profile 20
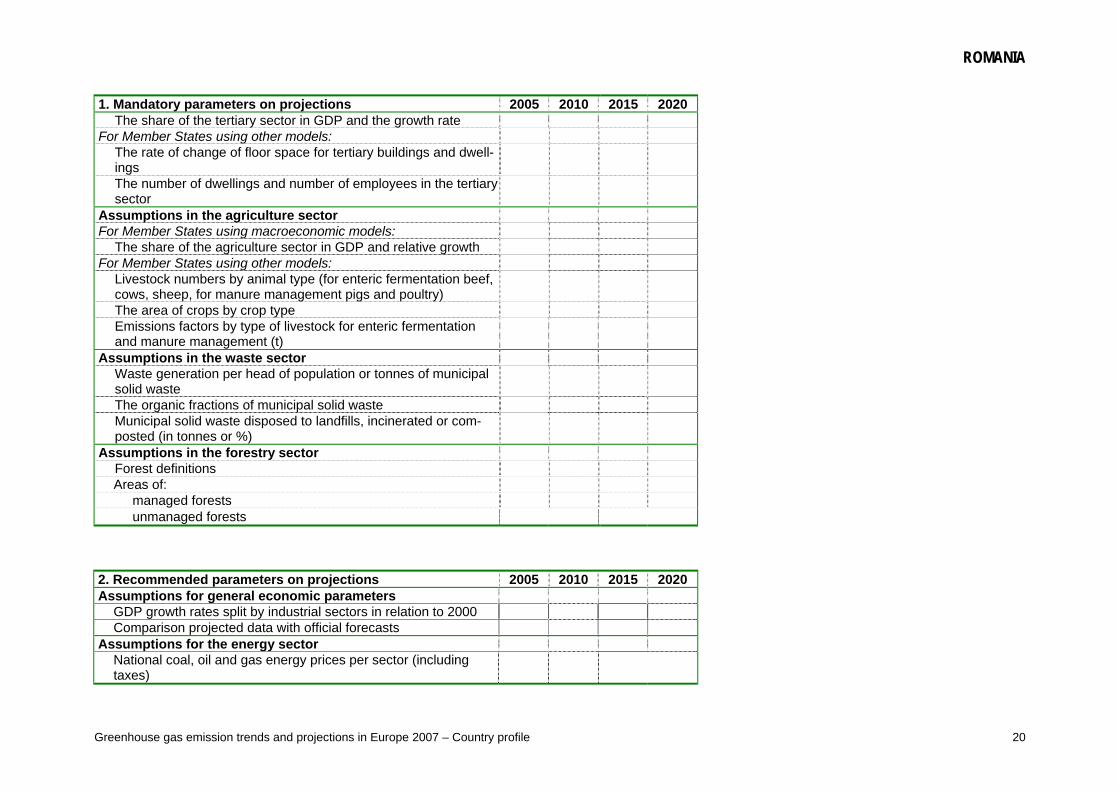
1. Mandatory parameters on projections 2005 2010 2015 2020 The share of the tertiary sector in GDP and the growth rate
For Member States using other models: The rate of change of floor space for tertiary buildings and dwell-ings
The number of dwellings and number of employees in the tertiary sector
Assumptions in the agriculture sector For Member States using macroeconomic models:
The share of the agriculture sector in GDP and relative growth For Member States using other models:
Livestock numbers by animal type (for enteric fermentation beef, cows, sheep, for manure management pigs and poultry)
The area of crops by crop type Emissions factors by type of livestock for enteric fermentation and manure management (t)
Assumptions in the waste sector Waste generation per head of population or tonnes of municipal solid waste
The organic fractions of municipal solid waste Municipal solid waste disposed to landfills, incinerated or com-posted (in tonnes or %)
Assumptions in the forestry sector Forest definitions Areas of:
managed forests unmanaged forests
2. Recommended parameters on projections 2005 2010 2015 2020 Assumptions for general economic parameters
GDP growth rates split by industrial sectors in relation to 2000 Comparison projected data with official forecasts
Assumptions for the energy sector National coal, oil and gas energy prices per sector (including taxes)
ROMANIA
Greenhouse gas emission trends and projections in Europe 2007 – Country profile 21
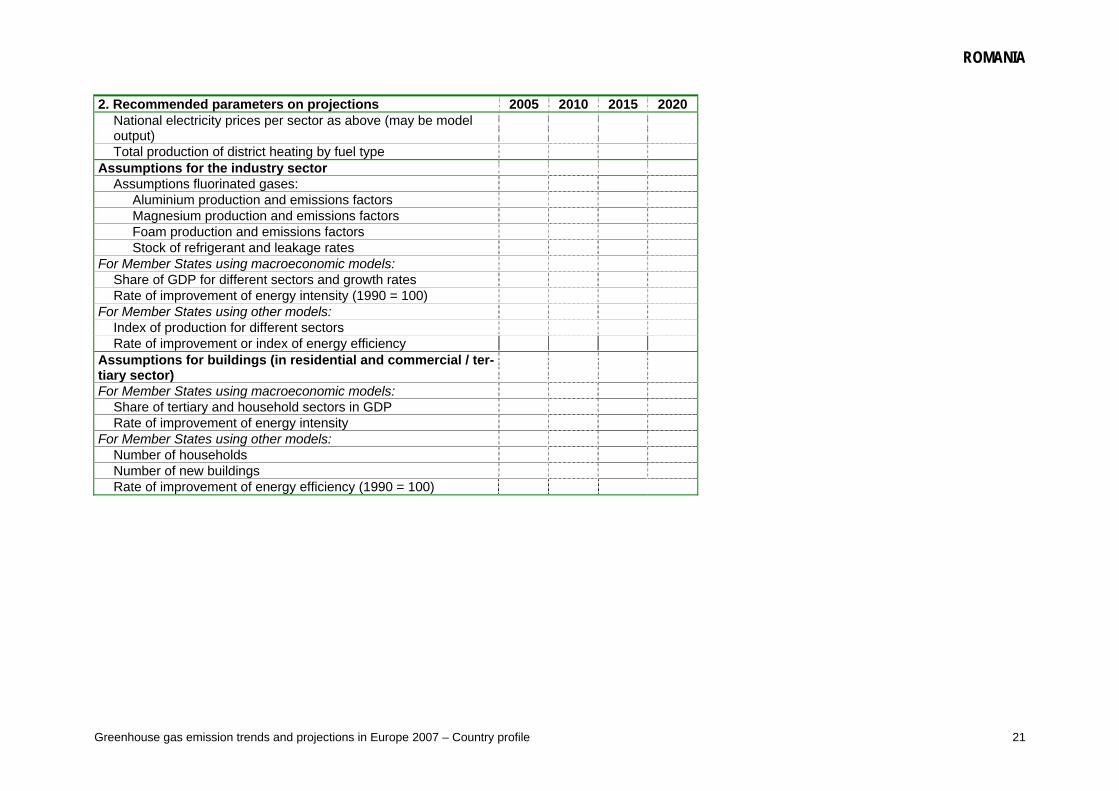
2. Recommended parameters on projections 2005 2010 2015 2020 National electricity prices per sector as above (may be model output) Total production of district heating by fuel type
Assumptions for the industry sector Assumptions fluorinated gases:
Aluminium production and emissions factors Magnesium production and emissions factors Foam production and emissions factors Stock of refrigerant and leakage rates
For Member States using macroeconomic models: Share of GDP for different sectors and growth rates Rate of improvement of energy intensity (1990 = 100)
For Member States using other models: Index of production for different sectors Rate of improvement or index of energy efficiency
Assumptions for buildings (in residential and commercial / ter-tiary sector) For Member States using macroeconomic models:
Share of tertiary and household sectors in GDP Rate of improvement of energy intensity
For Member States using other models: Number of households Number of new buildings Rate of improvement of energy efficiency (1990 = 100)
ROMANIA
Greenhouse gas emission trends and projections in Europe 2007 – Country profile 22
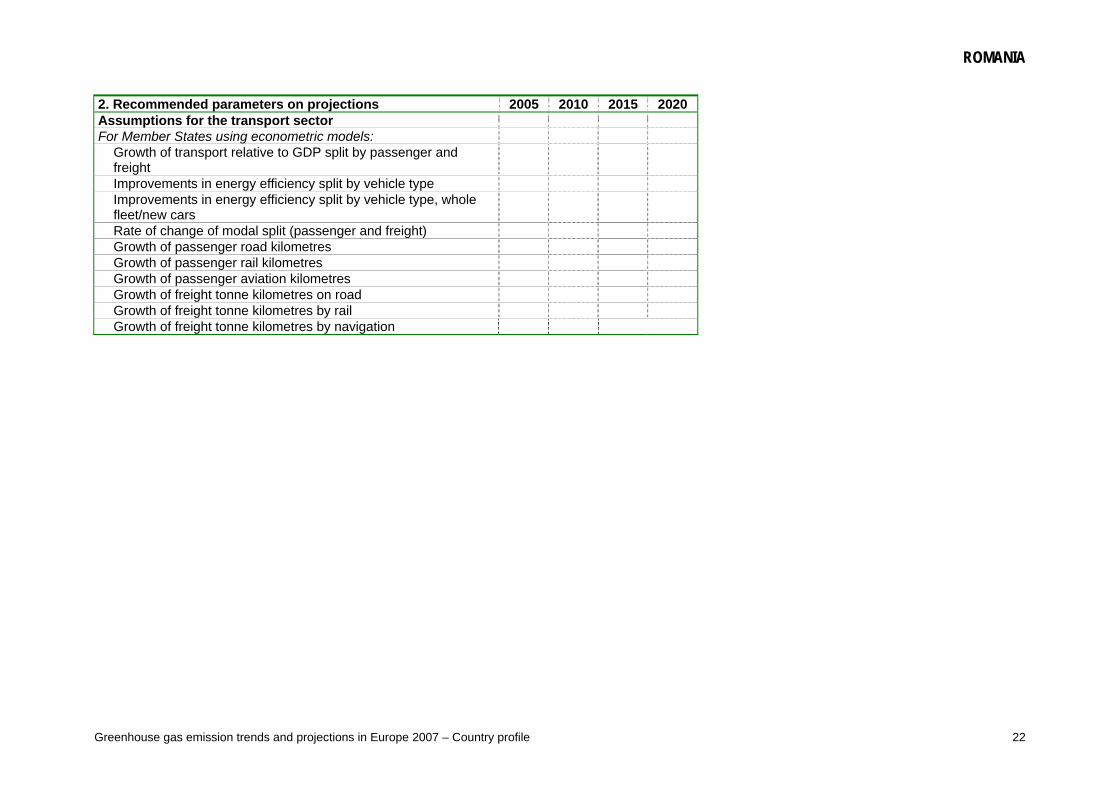
2. Recommended parameters on projections 2005 2010 2015 2020 Assumptions for the transport sector For Member States using econometric models:
Growth of transport relative to GDP split by passenger and freight Improvements in energy efficiency split by vehicle type Improvements in energy efficiency split by vehicle type, whole fleet/new cars Rate of change of modal split (passenger and freight) Growth of passenger road kilometres Growth of passenger rail kilometres Growth of passenger aviation kilometres Growth of freight tonne kilometres on road Growth of freight tonne kilometres by rail Growth of freight tonne kilometres by navigation
ROMANIA
Greenhouse gas emission trends and projections in Europe 2007 – Country profile 23
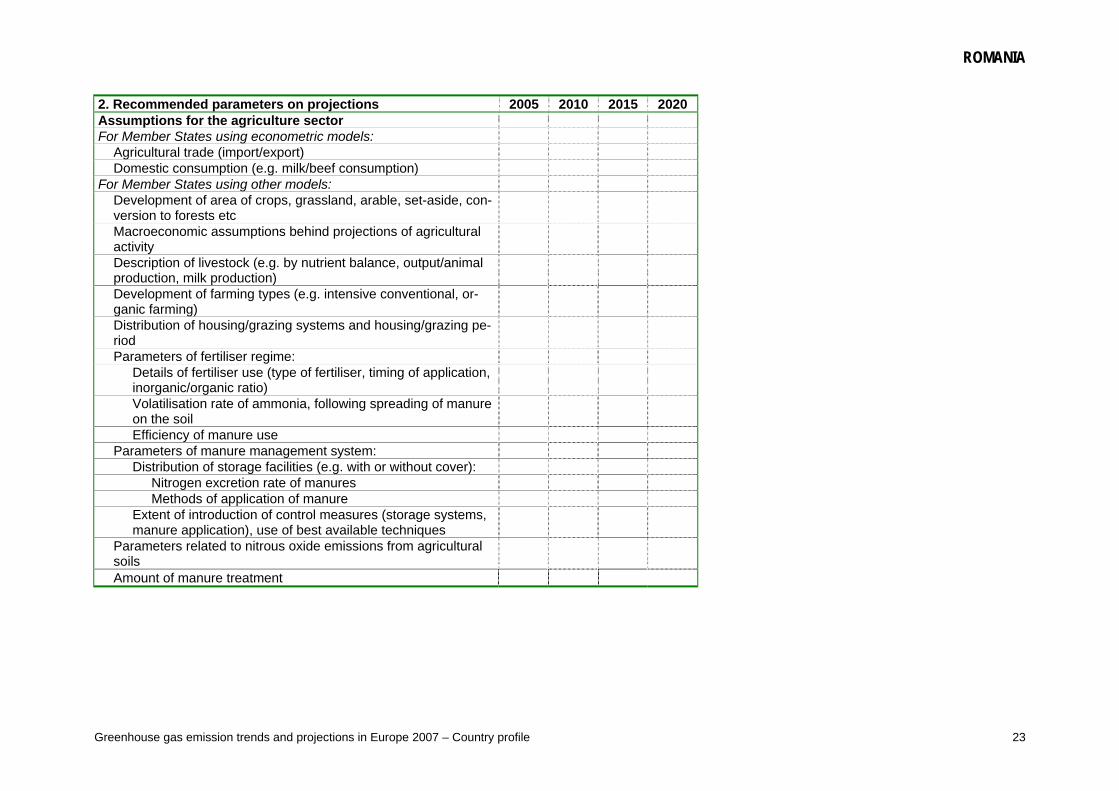
2. Recommended parameters on projections 2005 2010 2015 2020 Assumptions for the agriculture sector For Member States using econometric models:
Agricultural trade (import/export) Domestic consumption (e.g. milk/beef consumption)
For Member States using other models: Development of area of crops, grassland, arable, set-aside, con-version to forests etc Macroeconomic assumptions behind projections of agricultural activity Description of livestock (e.g. by nutrient balance, output/animal production, milk production) Development of farming types (e.g. intensive conventional, or-ganic farming) Distribution of housing/grazing systems and housing/grazing pe-riod Parameters of fertiliser regime:
Details of fertiliser use (type of fertiliser, timing of application, inorganic/organic ratio) Volatilisation rate of ammonia, following spreading of manure on the soil Efficiency of manure use
Parameters of manure management system: Distribution of storage facilities (e.g. with or without cover):
Nitrogen excretion rate of manures Methods of application of manure
Extent of introduction of control measures (storage systems, manure application), use of best available techniques
Parameters related to nitrous oxide emissions from agricultural soils Amount of manure treatment
ROMANIA
Greenhouse gas emission trends and projections in Europe 2007 – Country profile 24
ROMANIA
Greenhouse gas emission trends and projections in Europe 2007 – Country profile 25
11. COUNTRY CONCLUSIONS
Updated emission projections were provided in the recently submitted MMS. Projections are provided for 2010, 2015 and 2020. However, several key data are not provided, including base year emissions. Data for the base year was therefore taken from the 2007 National Inventory Report and may not be fully con‐sistent with the latest projections. Almost all the indicators and the parameters are missing. Romania is expected to meet the Kyoto target with significant margin even without addi‐tional measures. Additional reduction potentials, however, have been identified and if addi‐tional measures are introduced, further significant reduction is expected.