Embed Size (px)
Citation preview
1
Project „Common Strategy for Sustainable Territorial Development of the cross-border area Romania-Bulgaria”- cod MIS ETC 171
Romania-Bulgaria Cross-Border Area
Territorial Analysis Trends, Challenges, Potential
DRAFT 1 - revised
- August 2013 -
2
SUMMARY
1. Geographical position and structure of the region
3
2. Demographics
7
3. Economy and the Workforce
17
4. Education and Research
41
5. Environment and Energy 47
6. Infrastructure and mobility
65
7. Tourism and Leisure
85
8. Health services
87
9. Localities Network
95
3
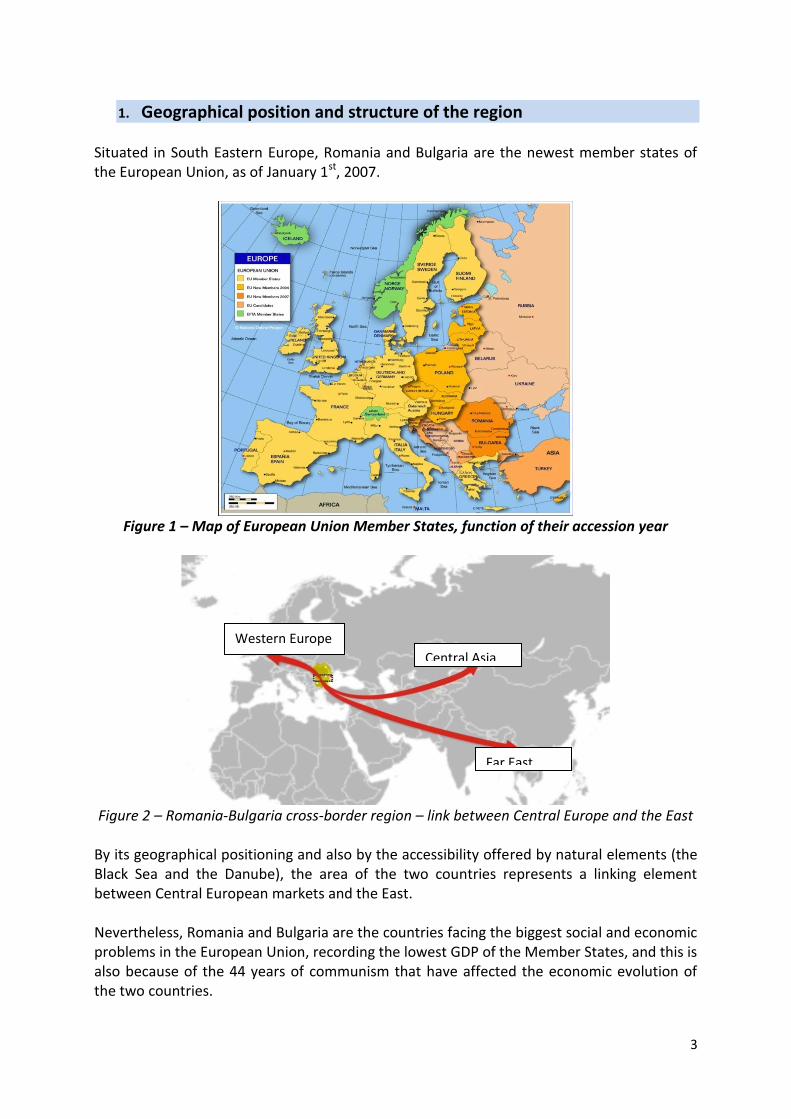
1. Geographical position and structure of the region Situated in South Eastern Europe, Romania and Bulgaria are the newest member states of the European Union, as of January 1st, 2007.
Figure 1 – Map of European Union Member States, function of their accession year
Figure 2 – Romania-Bulgaria cross-border region – link between Central Europe and the East
By its geographical positioning and also by the accessibility offered by natural elements (the Black Sea and the Danube), the area of the two countries represents a linking element between Central European markets and the East. Nevertheless, Romania and Bulgaria are the countries facing the biggest social and economic problems in the European Union, recording the lowest GDP of the Member States, and this is also because of the 44 years of communism that have affected the economic evolution of the two countries.
Western Europe
Central Asia
Far East
4
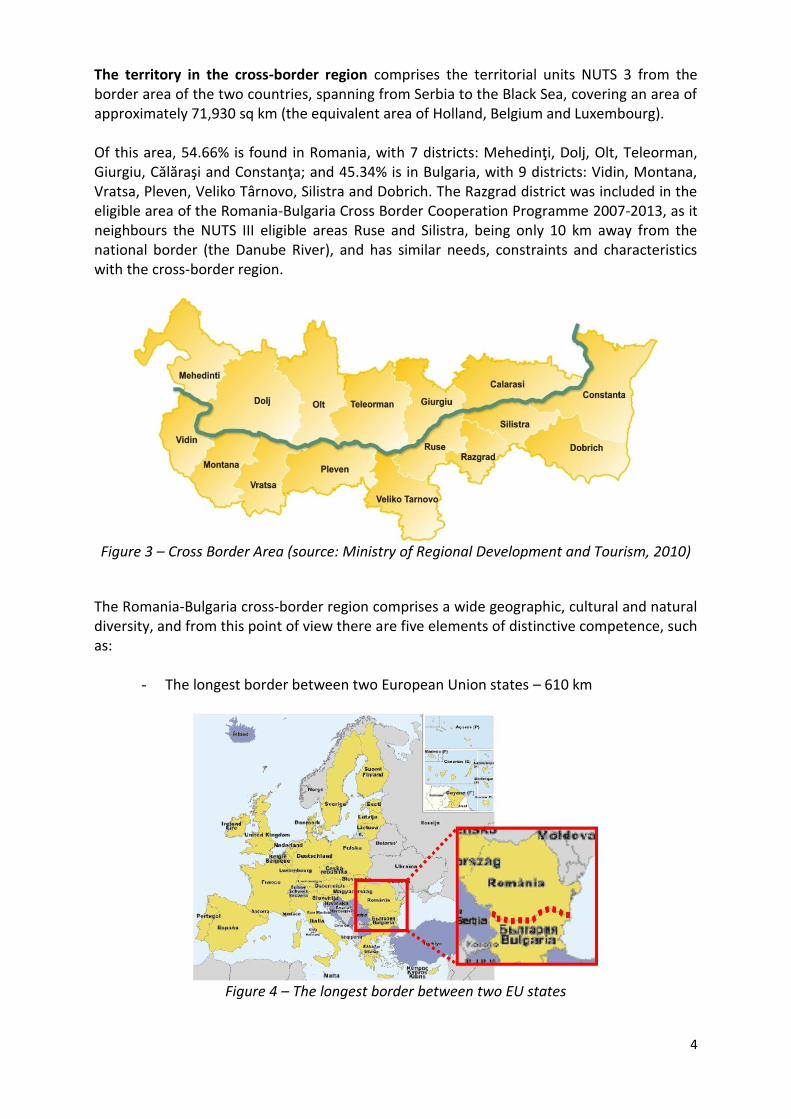
The territory in the cross-border region comprises the territorial units NUTS 3 from the border area of the two countries, spanning from Serbia to the Black Sea, covering an area of approximately 71,930 sq km (the equivalent area of Holland, Belgium and Luxembourg). Of this area, 54.66% is found in Romania, with 7 districts: Mehedinţi, Dolj, Olt, Teleorman, Giurgiu, Călăraşi and Constanţa; and 45.34% is in Bulgaria, with 9 districts: Vidin, Montana, Vratsa, Pleven, Veliko Târnovo, Silistra and Dobrich. The Razgrad district was included in the eligible area of the Romania-Bulgaria Cross Border Cooperation Programme 2007-2013, as it neighbours the NUTS III eligible areas Ruse and Silistra, being only 10 km away from the national border (the Danube River), and has similar needs, constraints and characteristics with the cross-border region.
Figure 3 – Cross Border Area (source: Ministry of Regional Development and Tourism, 2010)
The Romania-Bulgaria cross-border region comprises a wide geographic, cultural and natural diversity, and from this point of view there are five elements of distinctive competence, such as:
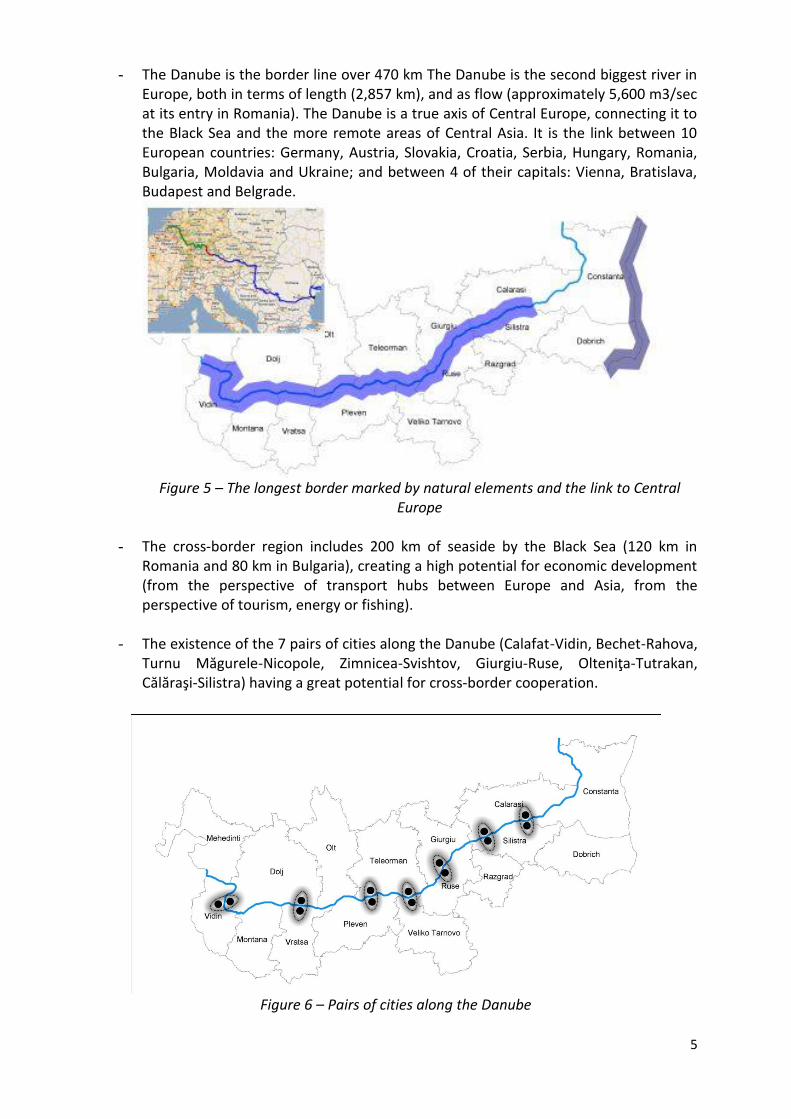
- The longest border between two European Union states – 610 km
Figure 4 – The longest border between two EU states
5
- The Danube is the border line over 470 km The Danube is the second biggest river in Europe, both in terms of length (2,857 km), and as flow (approximately 5,600 m3/sec at its entry in Romania). The Danube is a true axis of Central Europe, connecting it to the Black Sea and the more remote areas of Central Asia. It is the link between 10 European countries: Germany, Austria, Slovakia, Croatia, Serbia, Hungary, Romania, Bulgaria, Moldavia and Ukraine; and between 4 of their capitals: Vienna, Bratislava, Budapest and Belgrade.
Figure 5 – The longest border marked by natural elements and the link to Central
Europe
- The cross-border region includes 200 km of seaside by the Black Sea (120 km in Romania and 80 km in Bulgaria), creating a high potential for economic development (from the perspective of transport hubs between Europe and Asia, from the perspective of tourism, energy or fishing).
- The existence of the 7 pairs of cities along the Danube (Calafat-Vidin, Bechet-Rahova, Turnu Măgurele-Nicopole, Zimnicea-Svishtov, Giurgiu-Ruse, Olteniţa-Tutrakan, Călăraşi-Silistra) having a great potential for cross-border cooperation.
Figure 6 – Pairs of cities along the Danube
6
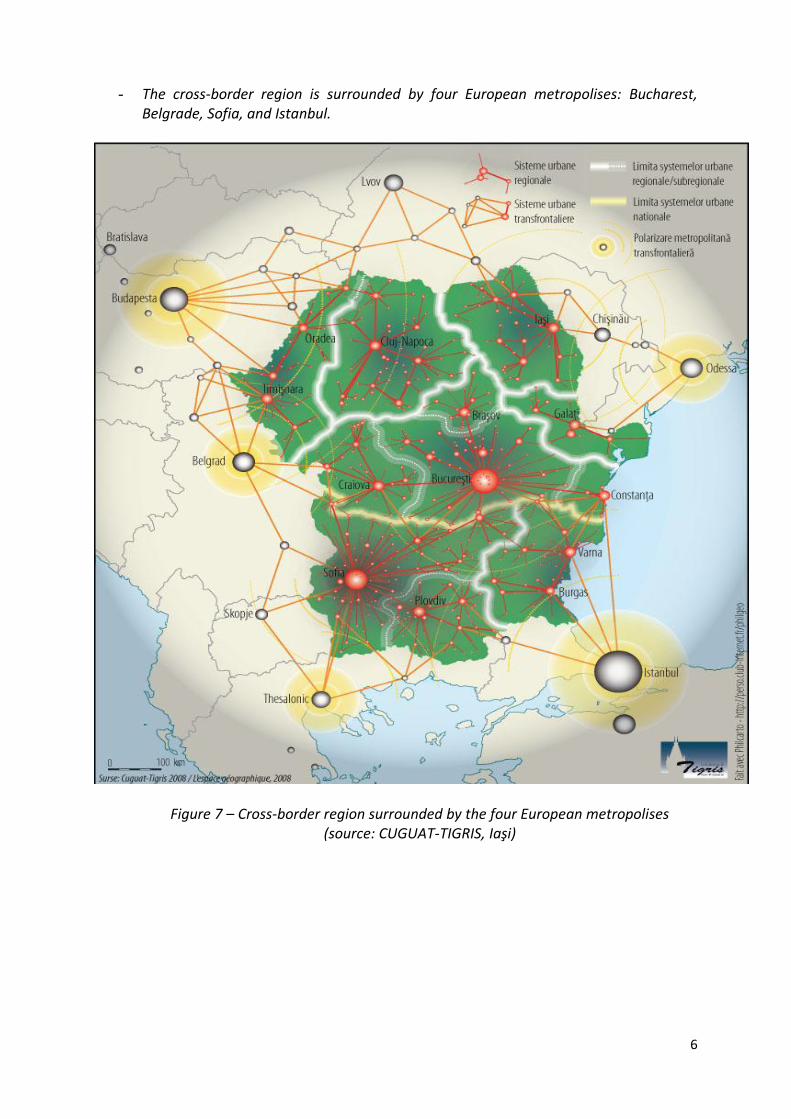
- The cross-border region is surrounded by four European metropolises: Bucharest,
Belgrade, Sofia, and Istanbul.
Figure 7 – Cross-border region surrounded by the four European metropolises (source: CUGUAT-TIGRIS, Iaşi)
7
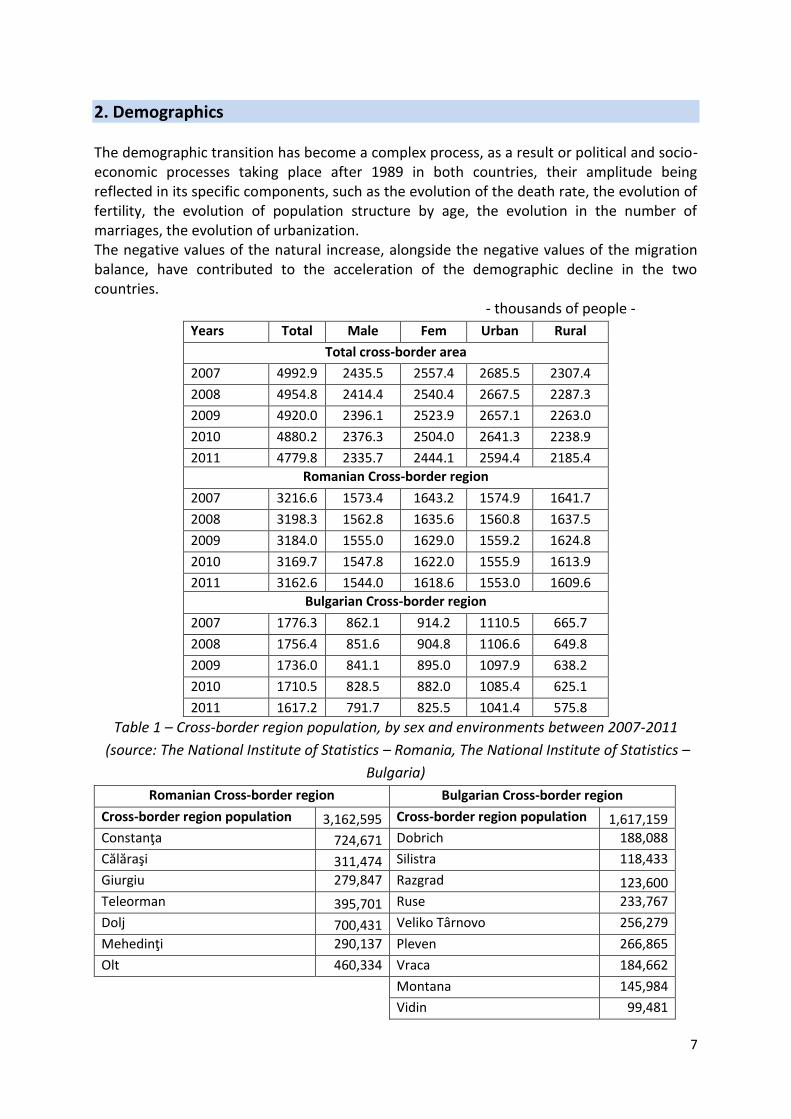
2. Demographics The demographic transition has become a complex process, as a result or political and socio-economic processes taking place after 1989 in both countries, their amplitude being reflected in its specific components, such as the evolution of the death rate, the evolution of fertility, the evolution of population structure by age, the evolution in the number of marriages, the evolution of urbanization. The negative values of the natural increase, alongside the negative values of the migration balance, have contributed to the acceleration of the demographic decline in the two countries.
- thousands of people -
Years Total Male Fem Urban Rural
Total cross-border area
2007 4992.9 2435.5 2557.4 2685.5 2307.4
2008 4954.8 2414.4 2540.4 2667.5 2287.3
2009 4920.0 2396.1 2523.9 2657.1 2263.0
2010 4880.2 2376.3 2504.0 2641.3 2238.9
2011 4779.8 2335.7 2444.1 2594.4 2185.4
Romanian Cross-border region
2007 3216.6 1573.4 1643.2 1574.9 1641.7
2008 3198.3 1562.8 1635.6 1560.8 1637.5
2009 3184.0 1555.0 1629.0 1559.2 1624.8
2010 3169.7 1547.8 1622.0 1555.9 1613.9
2011 3162.6 1544.0 1618.6 1553.0 1609.6
Bulgarian Cross-border region
2007 1776.3 862.1 914.2 1110.5 665.7
2008 1756.4 851.6 904.8 1106.6 649.8
2009 1736.0 841.1 895.0 1097.9 638.2
2010 1710.5 828.5 882.0 1085.4 625.1
2011 1617.2 791.7 825.5 1041.4 575.8
Table 1 – Cross-border region population, by sex and environments between 2007-2011
(source: The National Institute of Statistics – Romania, The National Institute of Statistics –
Bulgaria)
Romanian Cross-border region Bulgarian Cross-border region
Cross-border region population 3,162,595 Cross-border region population 1,617,159
Constanţa 724,671 Dobrich 188,088
Călăraşi 311,474 Silistra 118,433
Giurgiu 279,847 Razgrad 123,600
Teleorman 395,701 Ruse 233,767
Dolj 700,431 Veliko Târnovo 256,279
Mehedinţi 290,137 Pleven 266,865
Olt 460,334 Vraca 184,662
Montana 145,984
Vidin 99,481
8
Table 2 – Cross-border region population by districts in 2011 (source: The National Institute
of Statistics – Romania, The National Institute of Statistics – Bulgaria)
In 2011, the population recorded in the cross-border region was of 4779.8 thousand, of
which 3162.6 thousand (66%) in Romania and 1617.2 thousand (34%) in Bulgaria.
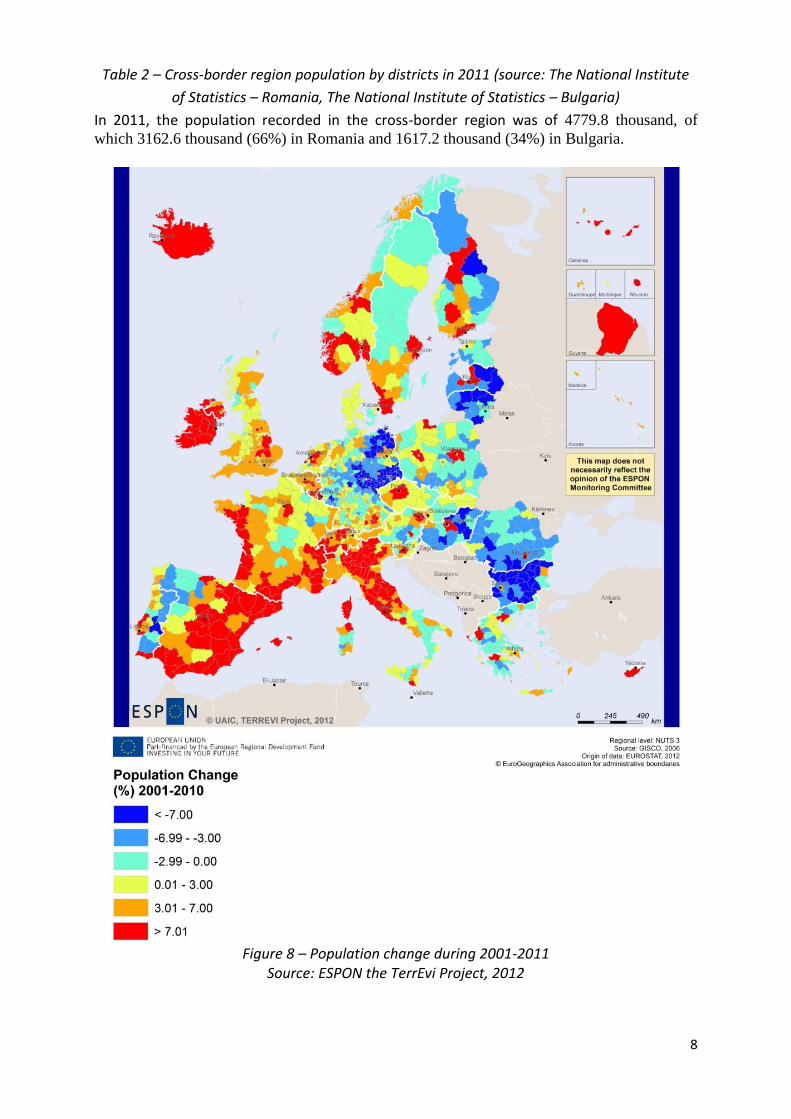
Figure 8 – Population change during 2001-2011
Source: ESPON the TerrEvi Project, 2012
9
According to the preliminary ESPON TerrEvi report, Romania and Bulgaria fall within the exodynamic demographic profile of former communist countries, generating working emigrants. The differences at a NUTS 3 level are generated by the demographic behaviour of the dwelling system, as predominantly rural units are the most affected by emigration (Vidin, Vratsa and Pleven / Teleorman and Olt). At the level of the two regions, the population decreased over the last 5 years by 54 thousand persons in the Romanian region and by 59 thousand persons in the Bulgarian region. This evolution had an impact on the workforce in the two countries and implicitly in the cross-border region, impact that is also reflected in the regional dynamics of the population in 2009/2010.
The highest population density is recorded in the districts of Constanţa and Pleven (102.3 and 62.8 inhabitants per square km, respectively), contrasting with the districts of Mehedinţi and Vidin with 59 and 36 inhabitants per square km, respectively. At the same time the population distribution in the urban regions shows significant differences between the great urban regions such as Constanţa and Ruse (70% urban population) and low-developed urban regions (Giurgiu and Silistra – 31% and 45% of the urban region population). The age structure was strongly influenced by the population ageing process, mainly due to the decrease in birth rates, which has lead to a decrease in the young population and in the life expectancy. The differences of the population structure by age are visible in a territorial profile, being caused by the phenomenon of demographic change and population migration, at the same time it being noticed that the number in the older population is higher in rural regions than in urban ones. In 2010 there were 46 young people per 100 adults on the Romanian territory in the cross-border region, and 49 young people per 100 adults on the Bulgarian territory. As compared to 2007, in 2011 one notices the accentuation of the phenomenon of demographic ageing in the cross-border region, by the increase of the share of population aged 65 years old and over, which was, in 2011, more than 16.6% in the Romanian region and 21.2% in the Bulgarian one. At the same time, the share of the 0-14 years old population registered decreases every year. In 2011, in the Romanian districts by the Danube the young population represented 14.5%, while in the Bulgarian districts it was only 13%. Adult population (15-64 years), in both areas, represents 70% of the total population. Differences in the age structure of the population are especially visible on a regional profile, determined by the territorial variation of demographic phenomena and the migration movements of the population. The „youngest” areas, with a share of over 14% of the population aged 0-14 years old (also areas with the highest birth rates) were Călăraşi and Pleven, having at the other extreme Teleorman and Veliko Târnovo, with percentages under 13%. The districts of Giurgiu and Teleorman recorded a high percentage of older population (over 18.0%) and the Vidin district with a percentage of 25.9%. As compared to 2007, in 2011 the share of population aged 65 years old and over has increased in all the districts in the cross-border region. The population structure by ages and residential regions confirms the fact that the demographic ageing process is more pronounced in the rural. In the rural environment, the number of older population is higher than that in the urban environment.
10
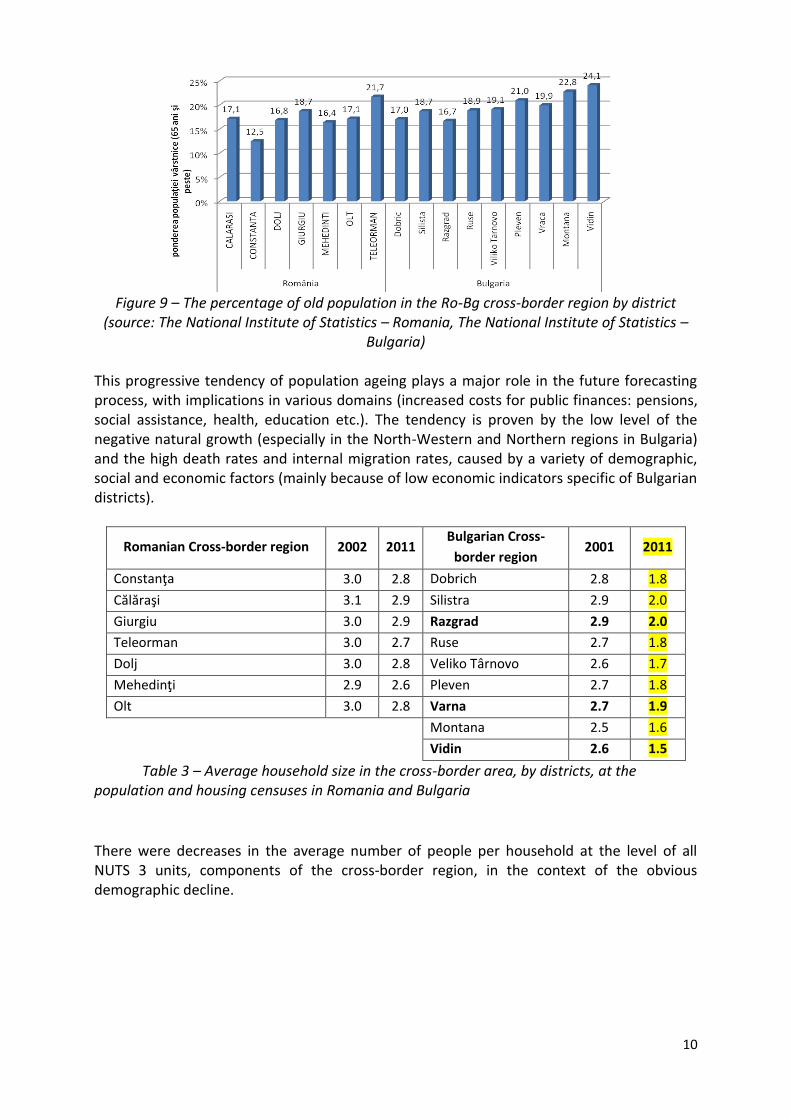
Figure 9 – The percentage of old population in the Ro-Bg cross-border region by district
(source: The National Institute of Statistics – Romania, The National Institute of Statistics – Bulgaria)
This progressive tendency of population ageing plays a major role in the future forecasting process, with implications in various domains (increased costs for public finances: pensions, social assistance, health, education etc.). The tendency is proven by the low level of the negative natural growth (especially in the North-Western and Northern regions in Bulgaria) and the high death rates and internal migration rates, caused by a variety of demographic, social and economic factors (mainly because of low economic indicators specific of Bulgarian districts).
Romanian Cross-border region 2002 2011 Bulgarian Cross-
border region 2001 2011
Constanţa 3.0 2.8 Dobrich 2.8 1.8
Călăraşi 3.1 2.9 Silistra 2.9 2.0
Giurgiu 3.0 2.9 Razgrad 2.9 2.0
Teleorman 3.0 2.7 Ruse 2.7 1.8
Dolj 3.0 2.8 Veliko Târnovo 2.6 1.7
Mehedinţi 2.9 2.6 Pleven 2.7 1.8
Olt 3.0 2.8 Varna 2.7 1.9
Montana 2.5 1.6
Vidin 2.6 1.5
Table 3 – Average household size in the cross-border area, by districts, at the population and housing censuses in Romania and Bulgaria
There were decreases in the average number of people per household at the level of all NUTS 3 units, components of the cross-border region, in the context of the obvious demographic decline.
11
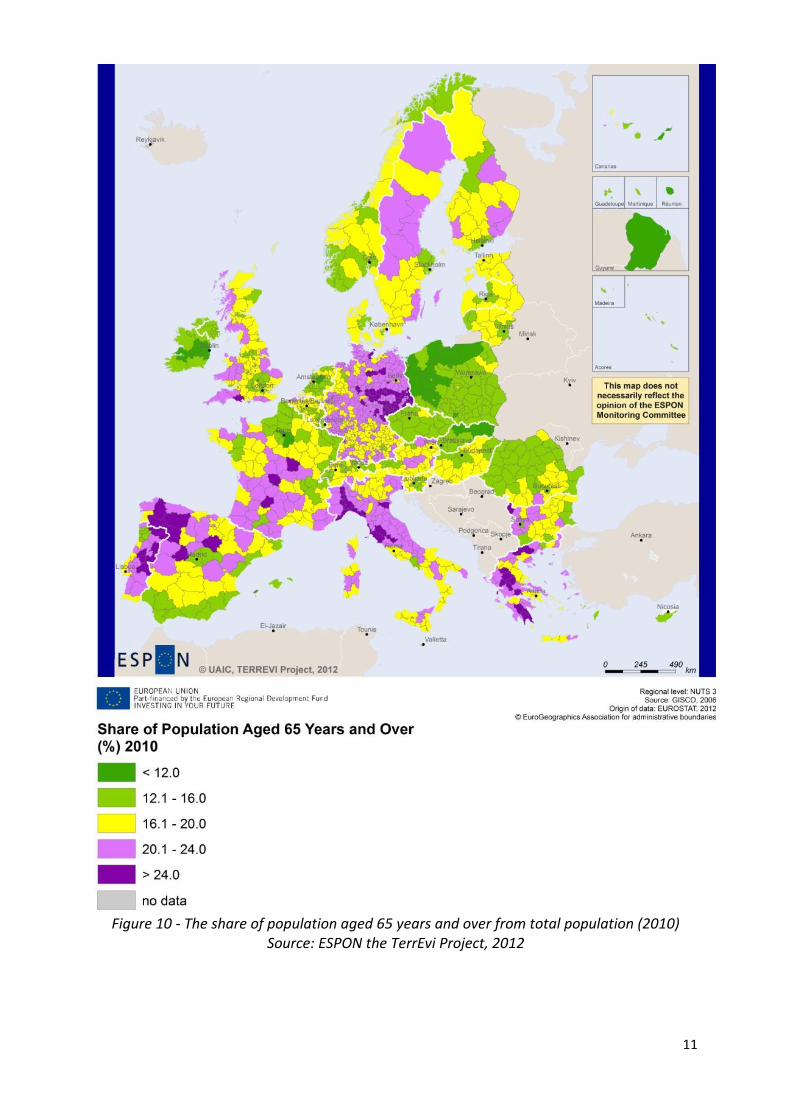
Figure 10 - The share of population aged 65 years and over from total population (2010)
Source: ESPON the TerrEvi Project, 2012
12
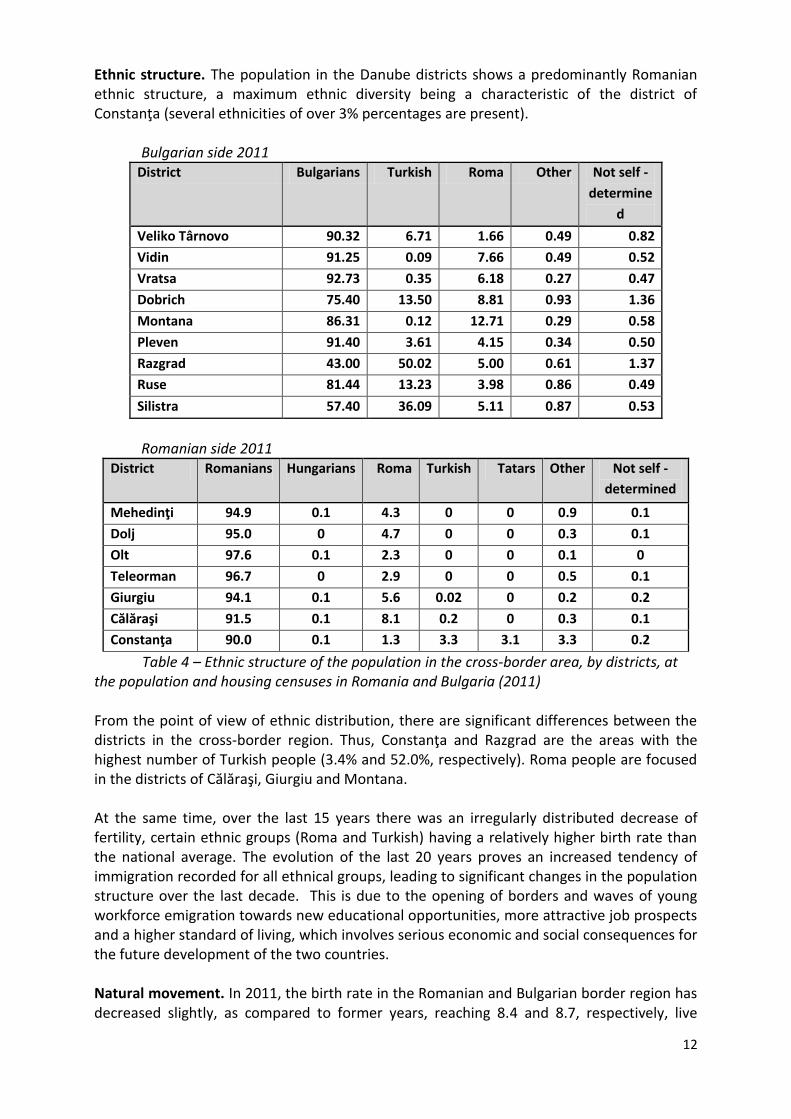
Ethnic structure. The population in the Danube districts shows a predominantly Romanian ethnic structure, a maximum ethnic diversity being a characteristic of the district of Constanţa (several ethnicities of over 3% percentages are present).
Bulgarian side 2011 District Bulgarians Turkish Roma Other Not self -
determine
d
Veliko Târnovo 90.32 6.71 1.66 0.49 0.82
Vidin 91.25 0.09 7.66 0.49 0.52
Vratsa 92.73 0.35 6.18 0.27 0.47
Dobrich 75.40 13.50 8.81 0.93 1.36
Montana 86.31 0.12 12.71 0.29 0.58
Pleven 91.40 3.61 4.15 0.34 0.50
Razgrad 43.00 50.02 5.00 0.61 1.37
Ruse 81.44 13.23 3.98 0.86 0.49
Silistra 57.40 36.09 5.11 0.87 0.53
Romanian side 2011
District Romanians Hungarians Roma Turkish Tatars Other Not self -
determined
Mehedinţi 94.9 0.1 4.3 0 0 0.9 0.1
Dolj 95.0 0 4.7 0 0 0.3 0.1
Olt 97.6 0.1 2.3 0 0 0.1 0
Teleorman 96.7 0 2.9 0 0 0.5 0.1
Giurgiu 94.1 0.1 5.6 0.02 0 0.2 0.2
Călăraşi 91.5 0.1 8.1 0.2 0 0.3 0.1
Constanţa 90.0 0.1 1.3 3.3 3.1 3.3 0.2
Table 4 – Ethnic structure of the population in the cross-border area, by districts, at the population and housing censuses in Romania and Bulgaria (2011) From the point of view of ethnic distribution, there are significant differences between the districts in the cross-border region. Thus, Constanţa and Razgrad are the areas with the highest number of Turkish people (3.4% and 52.0%, respectively). Roma people are focused in the districts of Călăraşi, Giurgiu and Montana. At the same time, over the last 15 years there was an irregularly distributed decrease of fertility, certain ethnic groups (Roma and Turkish) having a relatively higher birth rate than the national average. The evolution of the last 20 years proves an increased tendency of immigration recorded for all ethnical groups, leading to significant changes in the population structure over the last decade. This is due to the opening of borders and waves of young workforce emigration towards new educational opportunities, more attractive job prospects and a higher standard of living, which involves serious economic and social consequences for the future development of the two countries. Natural movement. In 2011, the birth rate in the Romanian and Bulgarian border region has decreased slightly, as compared to former years, reaching 8.4 and 8.7, respectively, live
13
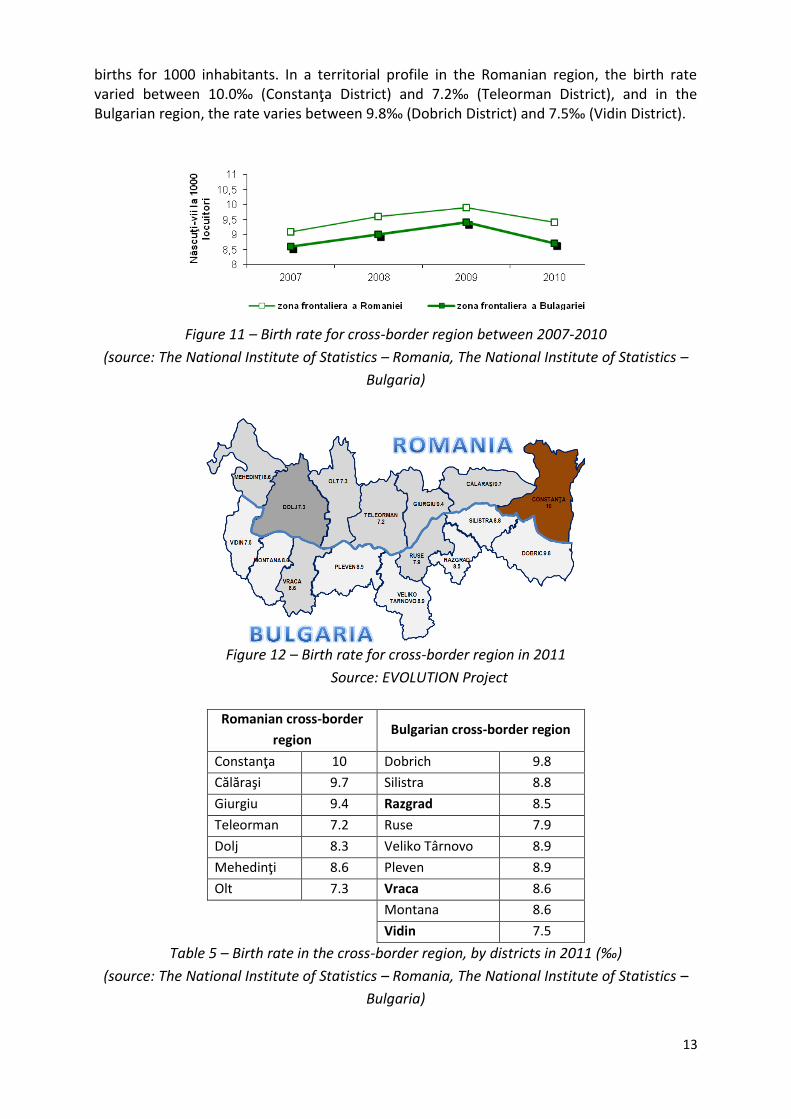
births for 1000 inhabitants. In a territorial profile in the Romanian region, the birth rate varied between 10.0‰ (Constanţa District) and 7.2‰ (Teleorman District), and in the Bulgarian region, the rate varies between 9.8‰ (Dobrich District) and 7.5‰ (Vidin District).
Figure 11 – Birth rate for cross-border region between 2007-2010
(source: The National Institute of Statistics – Romania, The National Institute of Statistics –
Bulgaria)
Figure 12 – Birth rate for cross-border region in 2011
Source: EVOLUTION Project
Romanian cross-border
region Bulgarian cross-border region
Constanţa 10 Dobrich 9.8
Călăraşi 9.7 Silistra 8.8
Giurgiu 9.4 Razgrad 8.5
Teleorman 7.2 Ruse 7.9
Dolj 8.3 Veliko Târnovo 8.9
Mehedinţi 8.6 Pleven 8.9
Olt 7.3 Vraca 8.6
Montana 8.6
Vidin 7.5
Table 5 – Birth rate in the cross-border region, by districts in 2011 (‰)
(source: The National Institute of Statistics – Romania, The National Institute of Statistics –
Bulgaria)
14
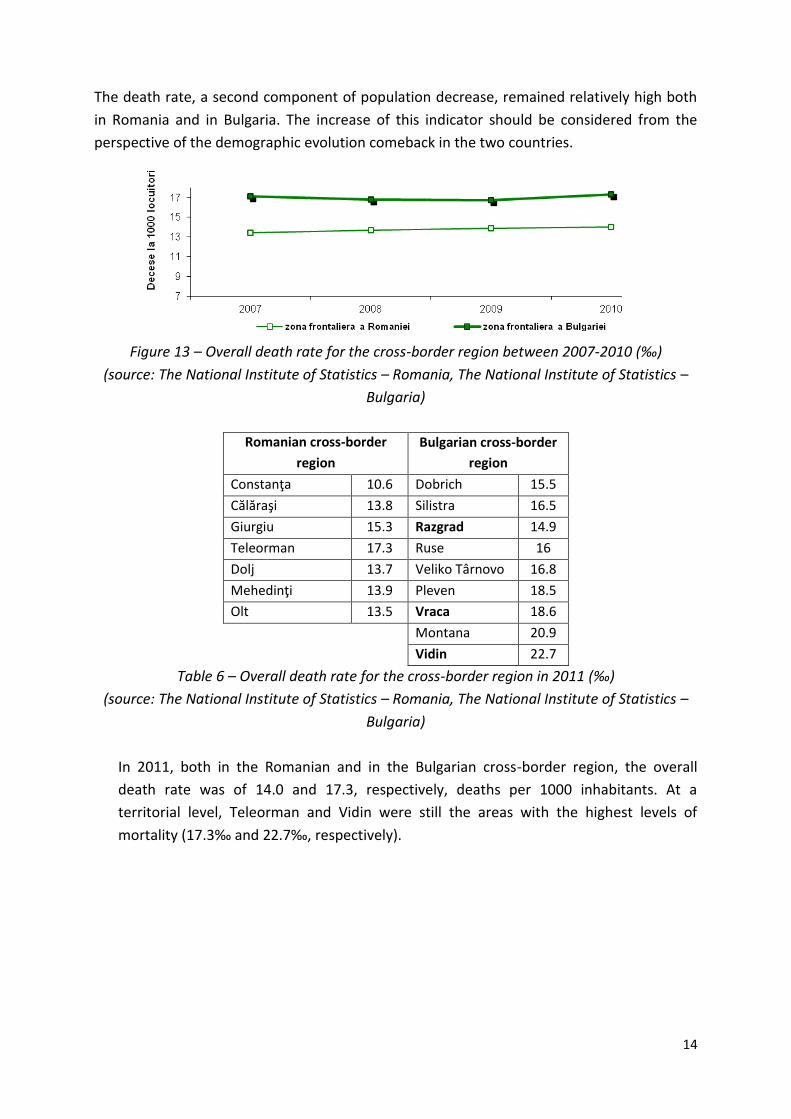
The death rate, a second component of population decrease, remained relatively high both
in Romania and in Bulgaria. The increase of this indicator should be considered from the
perspective of the demographic evolution comeback in the two countries.
Figure 13 – Overall death rate for the cross-border region between 2007-2010 (‰)
(source: The National Institute of Statistics – Romania, The National Institute of Statistics –
Bulgaria)
Romanian cross-border
region
Bulgarian cross-border
region
Constanţa 10.6 Dobrich 15.5
Călăraşi 13.8 Silistra 16.5
Giurgiu 15.3 Razgrad 14.9
Teleorman 17.3 Ruse 16
Dolj 13.7 Veliko Târnovo 16.8
Mehedinţi 13.9 Pleven 18.5
Olt 13.5 Vraca 18.6
Montana 20.9
Vidin 22.7
Table 6 – Overall death rate for the cross-border region in 2011 (‰)
(source: The National Institute of Statistics – Romania, The National Institute of Statistics –
Bulgaria)
In 2011, both in the Romanian and in the Bulgarian cross-border region, the overall
death rate was of 14.0 and 17.3, respectively, deaths per 1000 inhabitants. At a
territorial level, Teleorman and Vidin were still the areas with the highest levels of
mortality (17.3‰ and 22.7‰, respectively).
15
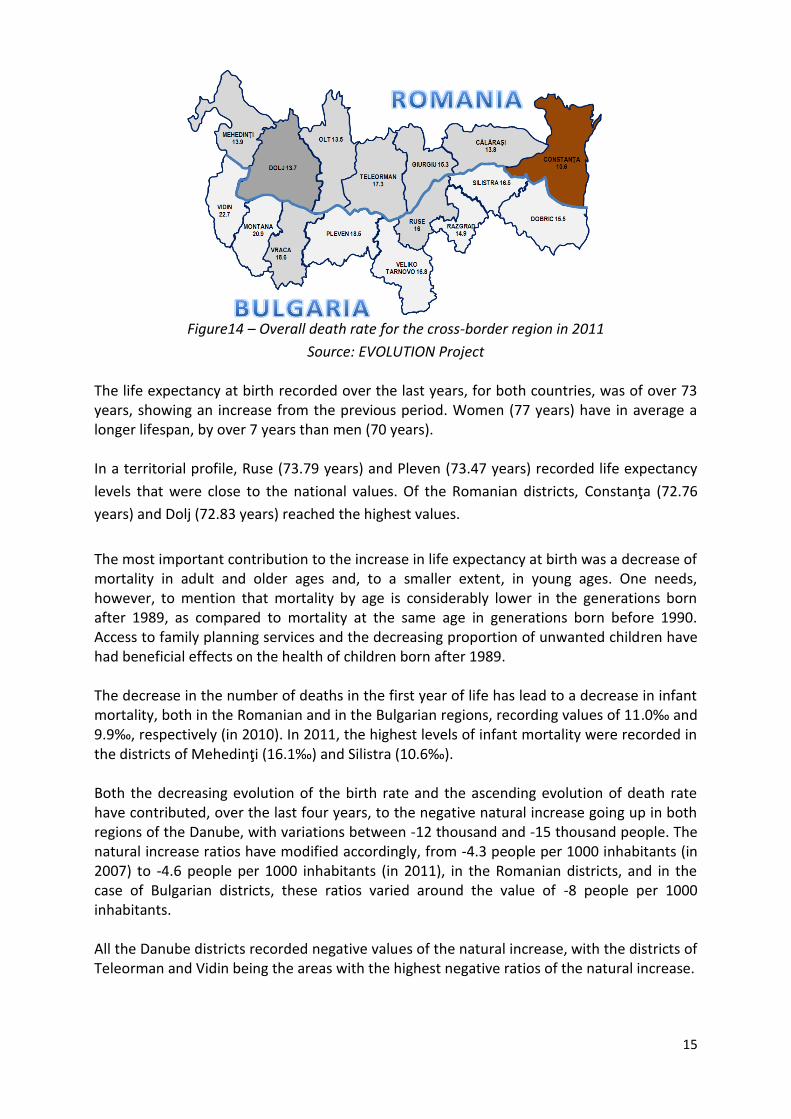
Figure14 – Overall death rate for the cross-border region in 2011
Source: EVOLUTION Project The life expectancy at birth recorded over the last years, for both countries, was of over 73 years, showing an increase from the previous period. Women (77 years) have in average a longer lifespan, by over 7 years than men (70 years). In a territorial profile, Ruse (73.79 years) and Pleven (73.47 years) recorded life expectancy
levels that were close to the national values. Of the Romanian districts, Constanţa (72.76
years) and Dolj (72.83 years) reached the highest values.
The most important contribution to the increase in life expectancy at birth was a decrease of mortality in adult and older ages and, to a smaller extent, in young ages. One needs, however, to mention that mortality by age is considerably lower in the generations born after 1989, as compared to mortality at the same age in generations born before 1990. Access to family planning services and the decreasing proportion of unwanted children have had beneficial effects on the health of children born after 1989. The decrease in the number of deaths in the first year of life has lead to a decrease in infant mortality, both in the Romanian and in the Bulgarian regions, recording values of 11.0‰ and 9.9‰, respectively (in 2010). In 2011, the highest levels of infant mortality were recorded in the districts of Mehedinţi (16.1‰) and Silistra (10.6‰). Both the decreasing evolution of the birth rate and the ascending evolution of death rate have contributed, over the last four years, to the negative natural increase going up in both regions of the Danube, with variations between -12 thousand and -15 thousand people. The natural increase ratios have modified accordingly, from -4.3 people per 1000 inhabitants (in 2007) to -4.6 people per 1000 inhabitants (in 2011), in the Romanian districts, and in the case of Bulgarian districts, these ratios varied around the value of -8 people per 1000 inhabitants. All the Danube districts recorded negative values of the natural increase, with the districts of Teleorman and Vidin being the areas with the highest negative ratios of the natural increase.
16
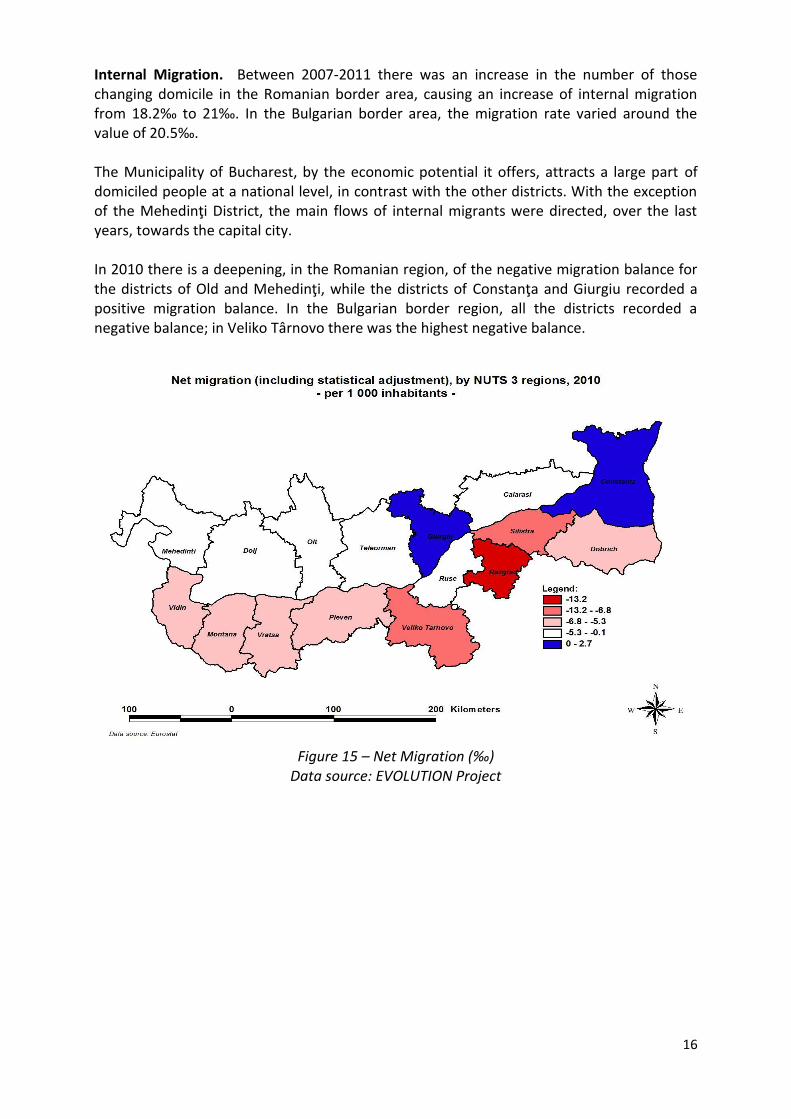
Internal Migration. Between 2007-2011 there was an increase in the number of those changing domicile in the Romanian border area, causing an increase of internal migration from 18.2‰ to 21‰. In the Bulgarian border area, the migration rate varied around the value of 20.5‰. The Municipality of Bucharest, by the economic potential it offers, attracts a large part of domiciled people at a national level, in contrast with the other districts. With the exception of the Mehedinţi District, the main flows of internal migrants were directed, over the last years, towards the capital city. In 2010 there is a deepening, in the Romanian region, of the negative migration balance for the districts of Old and Mehedinţi, while the districts of Constanţa and Giurgiu recorded a positive migration balance. In the Bulgarian border region, all the districts recorded a negative balance; in Veliko Târnovo there was the highest negative balance.
Figure 15 – Net Migration (‰)
Data source: EVOLUTION Project
17
Trends and Challenges:
- Constant decrease of the population by the Danube River - Over the last years there is an accented phenomenon of demographic ageing in
the cross-border region, by the increase in the population aged 65 years and over and the decrease of the ratio of population aged 0-14 years old
- Significant differences between powerful urban areas, such as Constanţa and Ruse (over 70% urban population) and those with a low urban ratio - Giurgiu and Silistra (with 31% and 45%, respectively, population in the urban environment).
- Both in Romania and in Bulgaria the overall death rate is higher than the European average
- The net migration is mostly negative (Bulgarian districts seem slightly more affected by emigration as compared to Romanian districts)
- Qualified and unqualified workforce emigration to developed EU states; - Life expectancy at birth is slightly increasing in both areas
Development needs and priorities - The negative effects of the overall demographical decline will affect the labor
market in the future → preventing the emigration by developing and diversification of local economical activities in order to create jobs and alternatives incomes
- Providing access of inhabitants from areas outlining population shrinkage to high quality social services (education, health, social care)
- Promoting activities in order to stimulate the employment of elderly people - Implementing programs for some death causing disease categories across
population (by age groups) - Promoting social inclusion of disadvantaged minorities
18
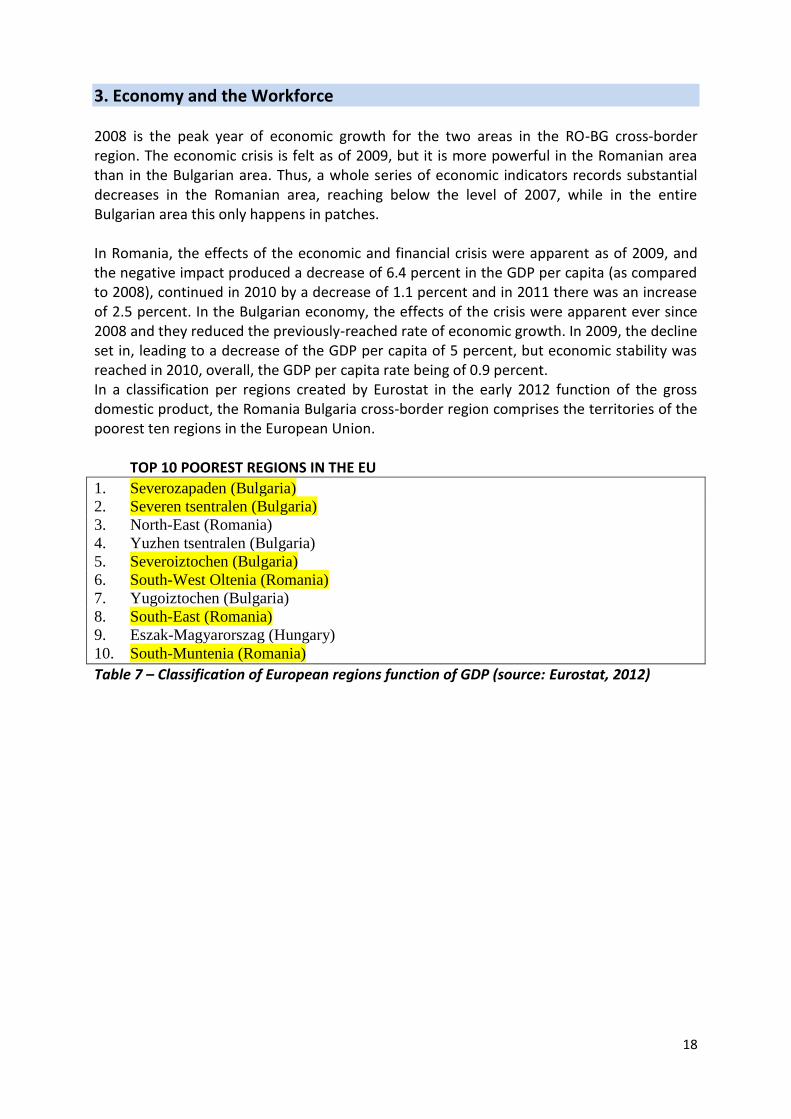
3. Economy and the Workforce 2008 is the peak year of economic growth for the two areas in the RO-BG cross-border region. The economic crisis is felt as of 2009, but it is more powerful in the Romanian area than in the Bulgarian area. Thus, a whole series of economic indicators records substantial decreases in the Romanian area, reaching below the level of 2007, while in the entire Bulgarian area this only happens in patches. In Romania, the effects of the economic and financial crisis were apparent as of 2009, and the negative impact produced a decrease of 6.4 percent in the GDP per capita (as compared to 2008), continued in 2010 by a decrease of 1.1 percent and in 2011 there was an increase of 2.5 percent. In the Bulgarian economy, the effects of the crisis were apparent ever since 2008 and they reduced the previously-reached rate of economic growth. In 2009, the decline set in, leading to a decrease of the GDP per capita of 5 percent, but economic stability was reached in 2010, overall, the GDP per capita rate being of 0.9 percent. In a classification per regions created by Eurostat in the early 2012 function of the gross domestic product, the Romania Bulgaria cross-border region comprises the territories of the poorest ten regions in the European Union.
TOP 10 POOREST REGIONS IN THE EU
1. Severozapaden (Bulgaria)
2. Severen tsentralen (Bulgaria)
3. North-East (Romania)
4. Yuzhen tsentralen (Bulgaria)
5. Severoiztochen (Bulgaria)
6. South-West Oltenia (Romania)
7. Yugoiztochen (Bulgaria)
8. South-East (Romania)
9. Eszak-Magyarorszag (Hungary)
10. South-Muntenia (Romania)
Table 7 – Classification of European regions function of GDP (source: Eurostat, 2012)
19
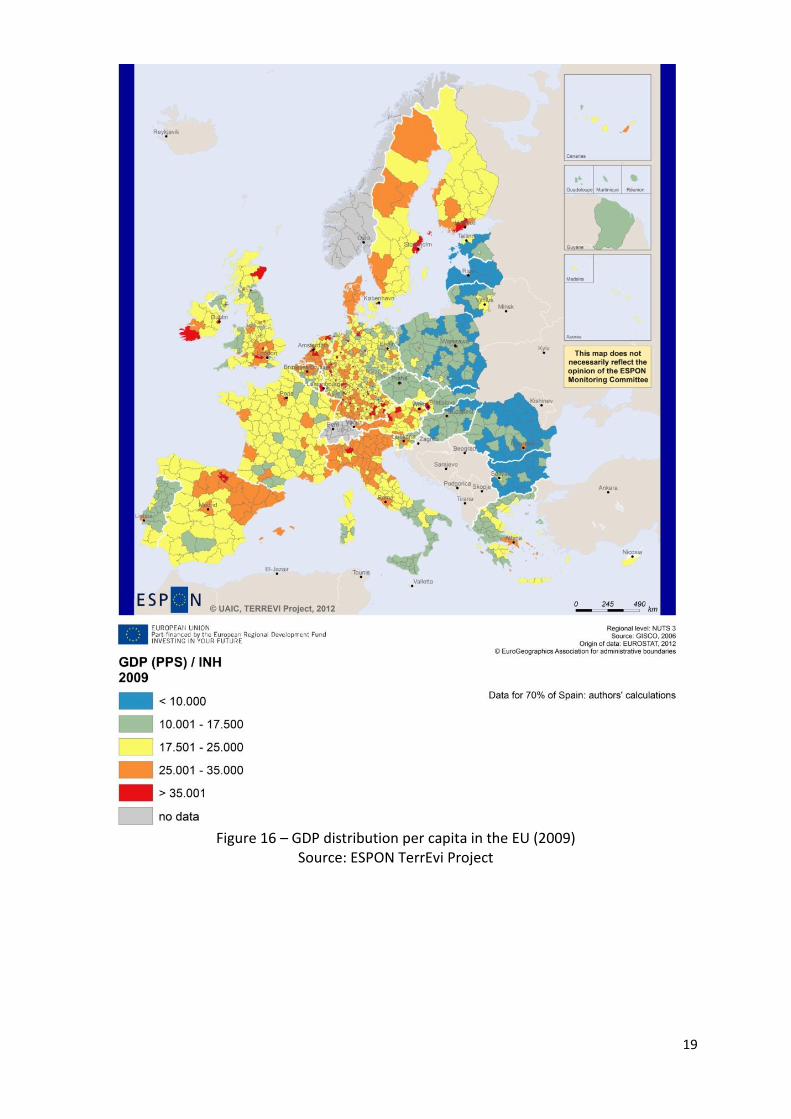
Figure 16 – GDP distribution per capita in the EU (2009)
Source: ESPON TerrEvi Project
20
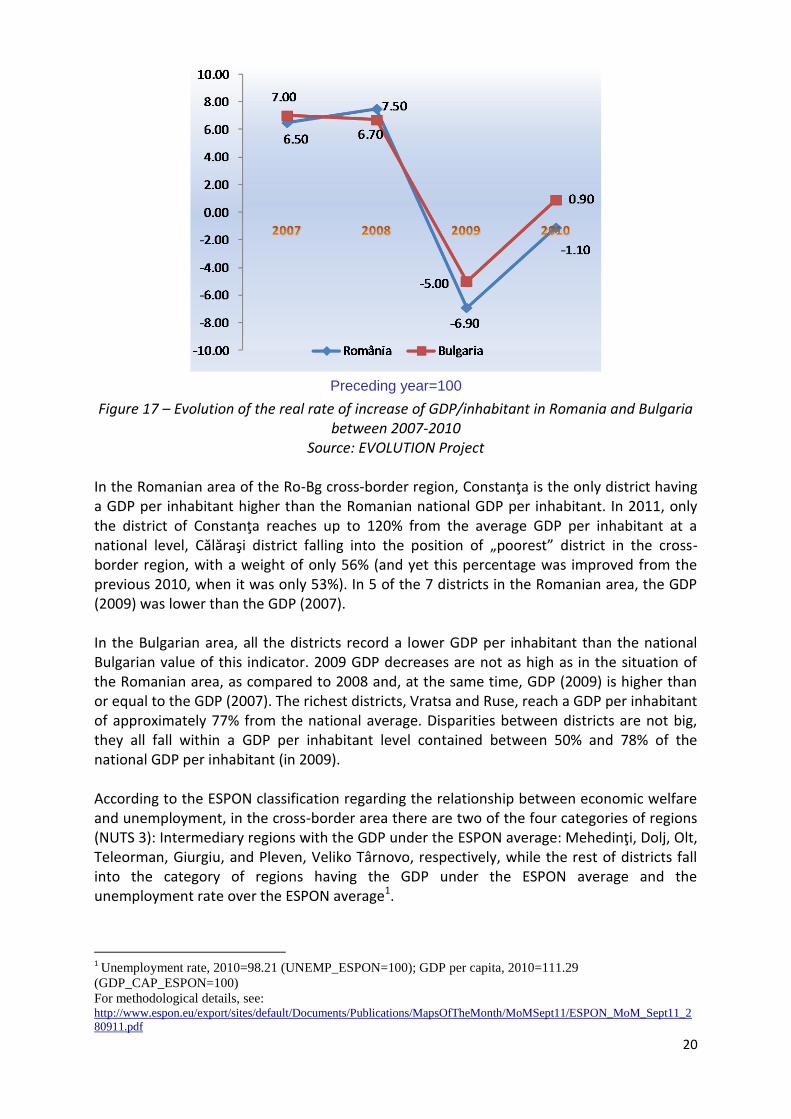
Figure 17 – Evolution of the real rate of increase of GDP/inhabitant in Romania and Bulgaria
between 2007-2010 Source: EVOLUTION Project
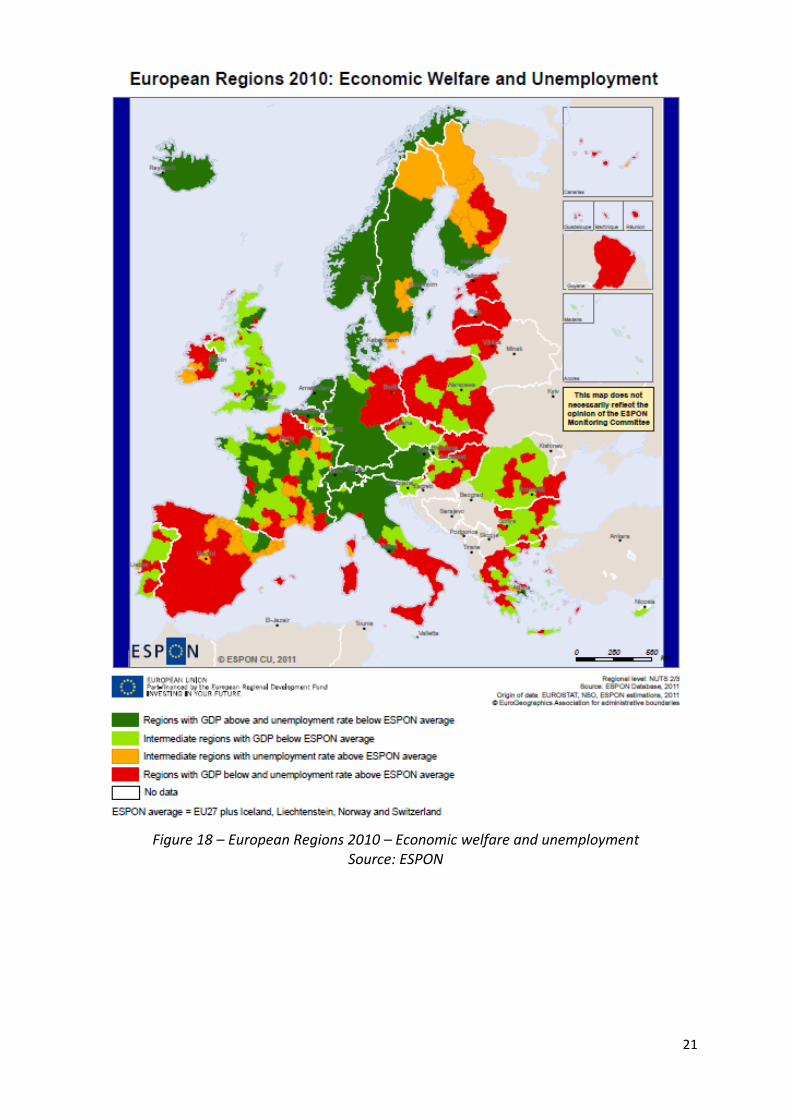
In the Romanian area of the Ro-Bg cross-border region, Constanţa is the only district having a GDP per inhabitant higher than the Romanian national GDP per inhabitant. In 2011, only the district of Constanţa reaches up to 120% from the average GDP per inhabitant at a national level, Călăraşi district falling into the position of „poorest” district in the cross-border region, with a weight of only 56% (and yet this percentage was improved from the previous 2010, when it was only 53%). In 5 of the 7 districts in the Romanian area, the GDP (2009) was lower than the GDP (2007). In the Bulgarian area, all the districts record a lower GDP per inhabitant than the national Bulgarian value of this indicator. 2009 GDP decreases are not as high as in the situation of the Romanian area, as compared to 2008 and, at the same time, GDP (2009) is higher than or equal to the GDP (2007). The richest districts, Vratsa and Ruse, reach a GDP per inhabitant of approximately 77% from the national average. Disparities between districts are not big, they all fall within a GDP per inhabitant level contained between 50% and 78% of the national GDP per inhabitant (in 2009). According to the ESPON classification regarding the relationship between economic welfare and unemployment, in the cross-border area there are two of the four categories of regions (NUTS 3): Intermediary regions with the GDP under the ESPON average: Mehedinţi, Dolj, Olt, Teleorman, Giurgiu, and Pleven, Veliko Târnovo, respectively, while the rest of districts fall into the category of regions having the GDP under the ESPON average and the unemployment rate over the ESPON average1.
1 Unemployment rate, 2010=98.21 (UNEMP_ESPON=100); GDP per capita, 2010=111.29
(GDP_CAP_ESPON=100)
For methodological details, see: http://www.espon.eu/export/sites/default/Documents/Publications/MapsOfTheMonth/MoMSept11/ESPON_MoM_Sept11_2
80911.pdf
Preceding year=100
21
Figure 18 – European Regions 2010 – Economic welfare and unemployment
Source: ESPON
22
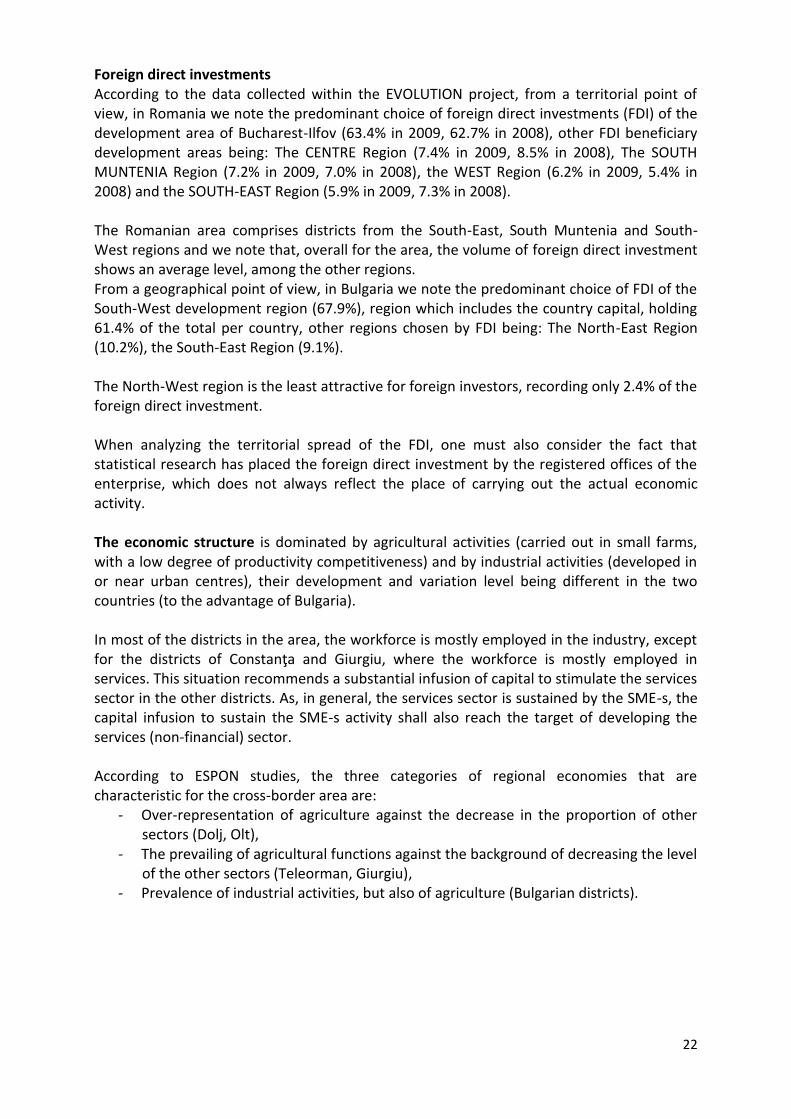
Foreign direct investments According to the data collected within the EVOLUTION project, from a territorial point of view, in Romania we note the predominant choice of foreign direct investments (FDI) of the development area of Bucharest-Ilfov (63.4% in 2009, 62.7% in 2008), other FDI beneficiary development areas being: The CENTRE Region (7.4% in 2009, 8.5% in 2008), The SOUTH MUNTENIA Region (7.2% in 2009, 7.0% in 2008), the WEST Region (6.2% in 2009, 5.4% in 2008) and the SOUTH-EAST Region (5.9% in 2009, 7.3% in 2008). The Romanian area comprises districts from the South-East, South Muntenia and South-West regions and we note that, overall for the area, the volume of foreign direct investment shows an average level, among the other regions. From a geographical point of view, in Bulgaria we note the predominant choice of FDI of the South-West development region (67.9%), region which includes the country capital, holding 61.4% of the total per country, other regions chosen by FDI being: The North-East Region (10.2%), the South-East Region (9.1%). The North-West region is the least attractive for foreign investors, recording only 2.4% of the foreign direct investment. When analyzing the territorial spread of the FDI, one must also consider the fact that statistical research has placed the foreign direct investment by the registered offices of the enterprise, which does not always reflect the place of carrying out the actual economic activity. The economic structure is dominated by agricultural activities (carried out in small farms, with a low degree of productivity competitiveness) and by industrial activities (developed in or near urban centres), their development and variation level being different in the two countries (to the advantage of Bulgaria). In most of the districts in the area, the workforce is mostly employed in the industry, except for the districts of Constanţa and Giurgiu, where the workforce is mostly employed in services. This situation recommends a substantial infusion of capital to stimulate the services sector in the other districts. As, in general, the services sector is sustained by the SME-s, the capital infusion to sustain the SME-s activity shall also reach the target of developing the services (non-financial) sector. According to ESPON studies, the three categories of regional economies that are characteristic for the cross-border area are:
- Over-representation of agriculture against the decrease in the proportion of other sectors (Dolj, Olt),
- The prevailing of agricultural functions against the background of decreasing the level of the other sectors (Teleorman, Giurgiu),
- Prevalence of industrial activities, but also of agriculture (Bulgarian districts).
23
Fig.19 –Typology of Regional Economies
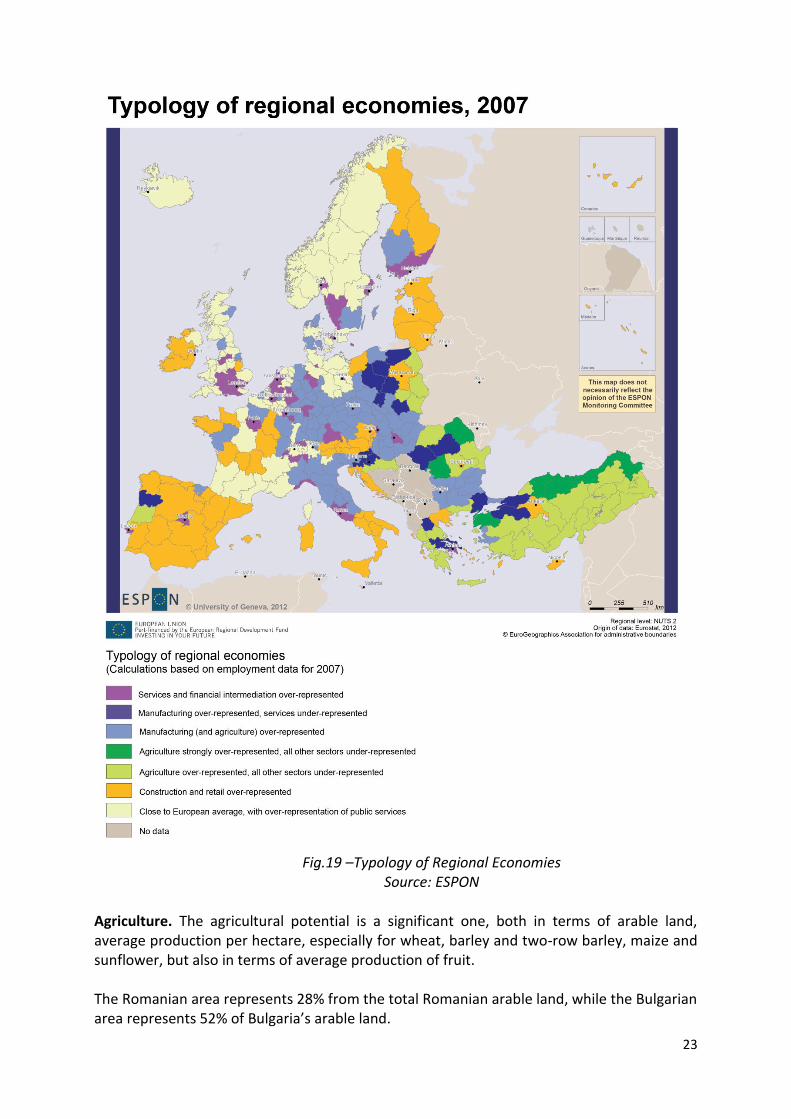
Source: ESPON Agriculture. The agricultural potential is a significant one, both in terms of arable land, average production per hectare, especially for wheat, barley and two-row barley, maize and sunflower, but also in terms of average production of fruit. The Romanian area represents 28% from the total Romanian arable land, while the Bulgarian area represents 52% of Bulgaria’s arable land.
24
Figure 20 – Distribution of arable land in 2009 (%) Source: EVOLUTION Project
Dominant cereal crops are wheat, maize, followed by sunflower and cole, barley, oats. Challenges regarding the agricultural potential:
A large part of the irrigation systems were deallocated, the draught periodically bringing disaster to agricultural surfaces. Land improvement works are necessary to provide the necessary infrastructure for irrigations.
The current structure of the land is not the most appropriate for the local natural conditions.
The non-agricultural sector. The origins of industry in the Valley of the Danube are related to the exploitation of vegetal resources in the hinterland (Romanian Geography, vol. V). After the introduction of milling units and other food industries, the connection of port towns to the railway network resulted in the emergence of rolling stock fixing workshops. Later on, shipyards were built. The electric power industry is represented by the hydro-energetic complex Porţile de Fier (Iron Gates) I and II and the nuclear energy from Cernavodă. Unfortunately, on the Romanian side one cannot claim that the Danube is an industrial axis with intense cooperation between its centres, because of the peripheral position and of the influence of other inland industrial centres.
Bulgarian Area
Romanian Area
25
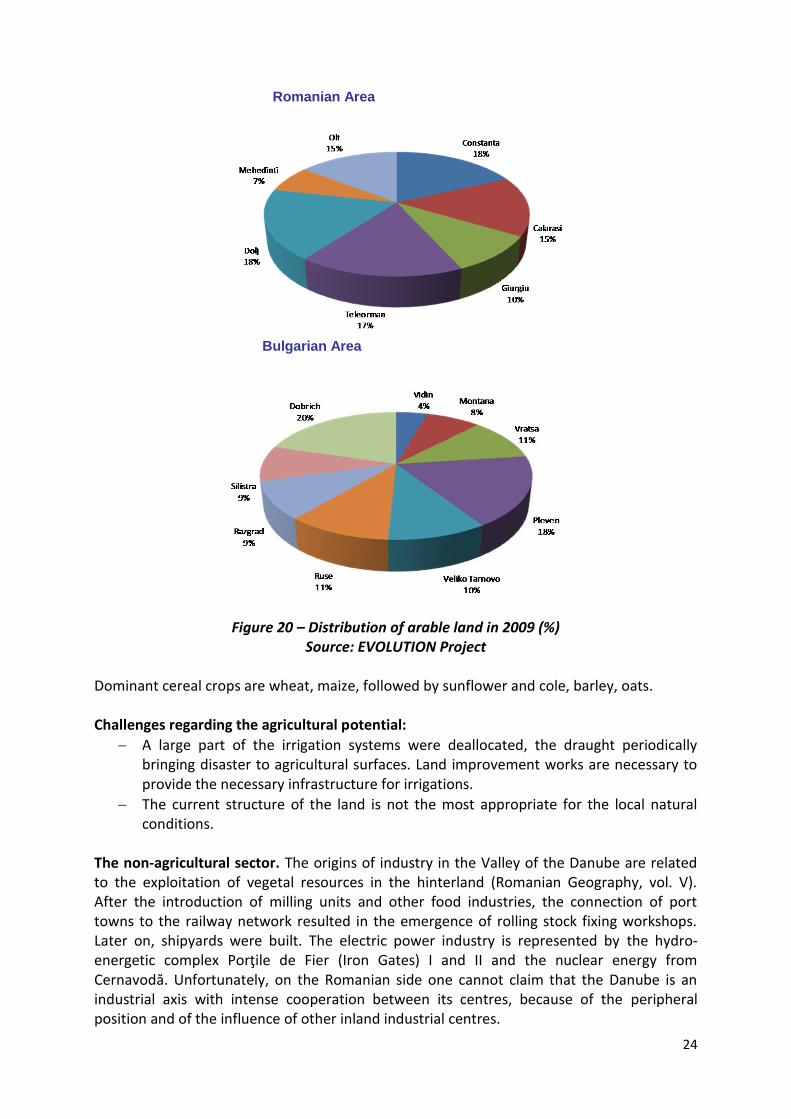
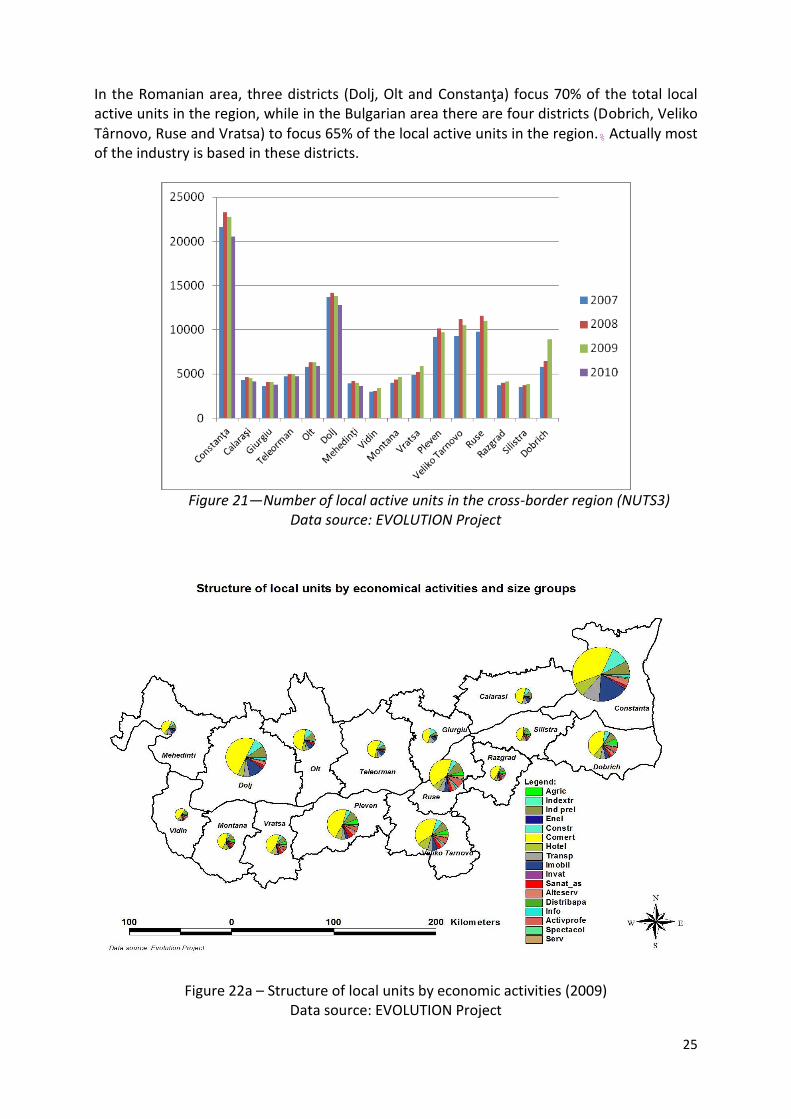
In the Romanian area, three districts (Dolj, Olt and Constanţa) focus 70% of the total local active units in the region, while in the Bulgarian area there are four districts (Dobrich, Veliko Târnovo, Ruse and Vratsa) to focus 65% of the local active units in the region.% Actually most of the industry is based in these districts.
Figure 21—Number of local active units in the cross-border region (NUTS3)
Data source: EVOLUTION Project
Figure 22a – Structure of local units by economic activities (2009) Data source: EVOLUTION Project
26
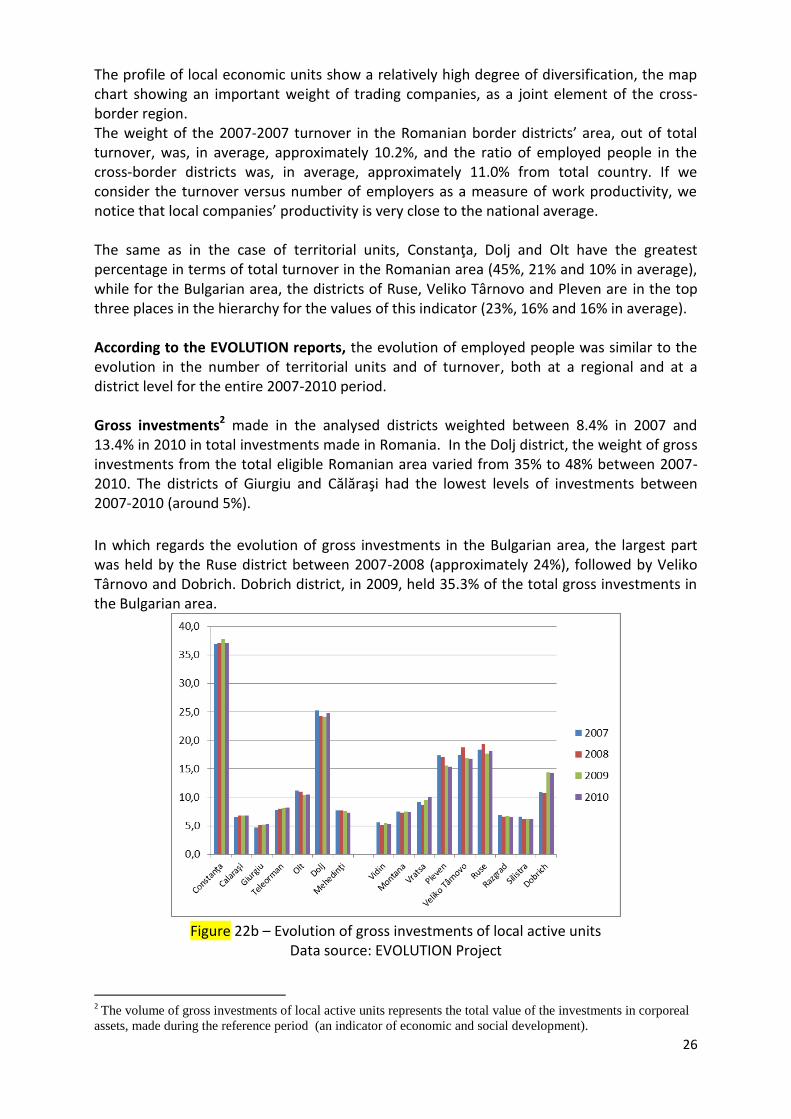
The profile of local economic units show a relatively high degree of diversification, the map chart showing an important weight of trading companies, as a joint element of the cross-border region. The weight of the 2007-2007 turnover in the Romanian border districts’ area, out of total turnover, was, in average, approximately 10.2%, and the ratio of employed people in the cross-border districts was, in average, approximately 11.0% from total country. If we consider the turnover versus number of employers as a measure of work productivity, we notice that local companies’ productivity is very close to the national average. The same as in the case of territorial units, Constanţa, Dolj and Olt have the greatest percentage in terms of total turnover in the Romanian area (45%, 21% and 10% in average), while for the Bulgarian area, the districts of Ruse, Veliko Târnovo and Pleven are in the top three places in the hierarchy for the values of this indicator (23%, 16% and 16% in average). According to the EVOLUTION reports, the evolution of employed people was similar to the evolution in the number of territorial units and of turnover, both at a regional and at a district level for the entire 2007-2010 period. Gross investments2 made in the analysed districts weighted between 8.4% in 2007 and 13.4% in 2010 in total investments made in Romania. In the Dolj district, the weight of gross investments from the total eligible Romanian area varied from 35% to 48% between 2007-2010. The districts of Giurgiu and Călăraşi had the lowest levels of investments between 2007-2010 (around 5%).
In which regards the evolution of gross investments in the Bulgarian area, the largest part was held by the Ruse district between 2007-2008 (approximately 24%), followed by Veliko Târnovo and Dobrich. Dobrich district, in 2009, held 35.3% of the total gross investments in the Bulgarian area.
Figure 22b – Evolution of gross investments of local active units
Data source: EVOLUTION Project
2 The volume of gross investments of local active units represents the total value of the investments in corporeal
assets, made during the reference period (an indicator of economic and social development).
27
Business environment perception3. The overall evolution of the business environment throughout 2011 was considered by Romanian and Bulgarian entrepreneurs as hindering development in 49.39% of companies, neutral in 35.06% of SME-s and favourable for business in 15.5% of the enterprises. Nearly half of the decision factors in the SME-s are not happy with the environment where they carry out their activity, situation which is mainly due to the international economic crisis started at the end of 2008.
Investigated Romanian and Bulgarian entrepreneurs / managers have shown that at the
present tine they face the following difficulties: decrease of internal demand (noted in
55.13% of SME-s), excessive taxing (35.08%), bureaucracy (33.17%), inflation (32.94%), high
cost of loans (32.46%), excessive controls (25.30%), delays at receiving payments of
invoices from private companies (20.76%), competition of imported goods (20.05%),
difficult access to loans (17.42%), corruption (16.71%), personnel hiring, training, and
retention (16.23%), unpaid invoices by state institutions (14.80%), relative instability of the
national currency4 (14.08%), increase of payroll expenses (12.17%), decrease of export
demand (9.07%), poor quality of infrastructure (7.88%) etc.
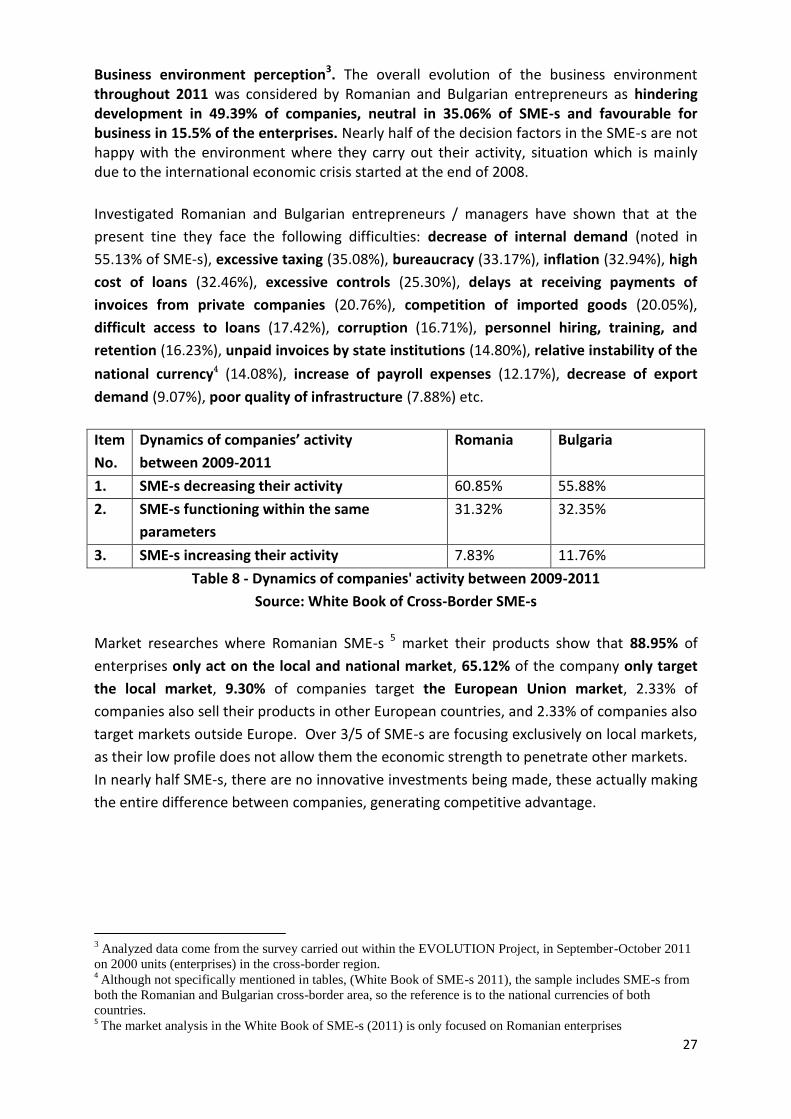
Item
No.
Dynamics of companies’ activity
between 2009-2011
Romania Bulgaria
1. SME-s decreasing their activity 60.85% 55.88%
2. SME-s functioning within the same
parameters
31.32% 32.35%
3. SME-s increasing their activity 7.83% 11.76%
Table 8 - Dynamics of companies' activity between 2009-2011
Source: White Book of Cross-Border SME-s
Market researches where Romanian SME-s 5 market their products show that 88.95% of
enterprises only act on the local and national market, 65.12% of the company only target
the local market, 9.30% of companies target the European Union market, 2.33% of
companies also sell their products in other European countries, and 2.33% of companies also
target markets outside Europe. Over 3/5 of SME-s are focusing exclusively on local markets,
as their low profile does not allow them the economic strength to penetrate other markets.
In nearly half SME-s, there are no innovative investments being made, these actually making
the entire difference between companies, generating competitive advantage.
3 Analyzed data come from the survey carried out within the EVOLUTION Project, in September-October 2011
on 2000 units (enterprises) in the cross-border region. 4 Although not specifically mentioned in tables, (White Book of SME-s 2011), the sample includes SME-s from
both the Romanian and Bulgarian cross-border area, so the reference is to the national currencies of both
countries. 5 The market analysis in the White Book of SME-s (2011) is only focused on Romanian enterprises
28
Challenges outlined by the companies in the cross-border region (EVOLUTION study):
- Predominant opinion of company managers that the level of taxation for legal entities in the two countries rather discourages the entrepreneurial activity.
- The current level of bureaucracy is high in both areas, being a hindrance for the activity of the companies
- Having the Danube nearby is considered an advantage for business development in 39% of the Romanian companies questioned and 29% of the Bulgarian companies questioned.
- Employing workforce from the neighbouring country is not seen as an explicit advantage for business development by most companies in the region (81% RO, 91% BG)
- The important drawbacks in carrying out their activity, for the companies in the Romanian area, are the limited access to qualified personnel, lack of performing technology and lack of quality raw material, as well as the limited access to lending.
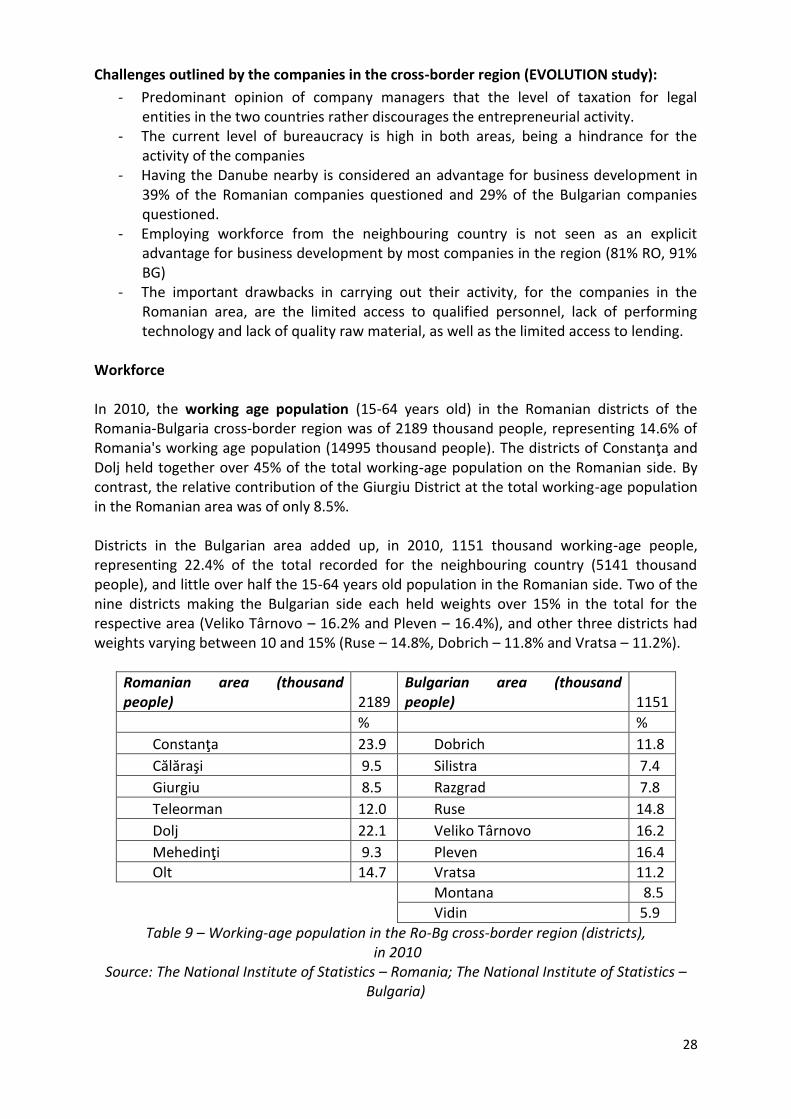
Workforce In 2010, the working age population (15-64 years old) in the Romanian districts of the Romania-Bulgaria cross-border region was of 2189 thousand people, representing 14.6% of Romania's working age population (14995 thousand people). The districts of Constanţa and Dolj held together over 45% of the total working-age population on the Romanian side. By contrast, the relative contribution of the Giurgiu District at the total working-age population in the Romanian area was of only 8.5%. Districts in the Bulgarian area added up, in 2010, 1151 thousand working-age people, representing 22.4% of the total recorded for the neighbouring country (5141 thousand people), and little over half the 15-64 years old population in the Romanian side. Two of the nine districts making the Bulgarian side each held weights over 15% in the total for the respective area (Veliko Târnovo – 16.2% and Pleven – 16.4%), and other three districts had weights varying between 10 and 15% (Ruse – 14.8%, Dobrich – 11.8% and Vratsa – 11.2%).
Romanian area (thousand people) 2189
Bulgarian area (thousand people) 1151
% %
Constanţa 23.9 Dobrich 11.8
Călăraşi 9.5 Silistra 7.4
Giurgiu 8.5 Razgrad 7.8
Teleorman 12.0 Ruse 14.8
Dolj 22.1 Veliko Târnovo 16.2
Mehedinţi 9.3 Pleven 16.4
Olt 14.7 Vratsa 11.2
Montana 8.5
Vidin 5.9
Table 9 – Working-age population in the Ro-Bg cross-border region (districts), in 2010
Source: The National Institute of Statistics – Romania; The National Institute of Statistics – Bulgaria)
29
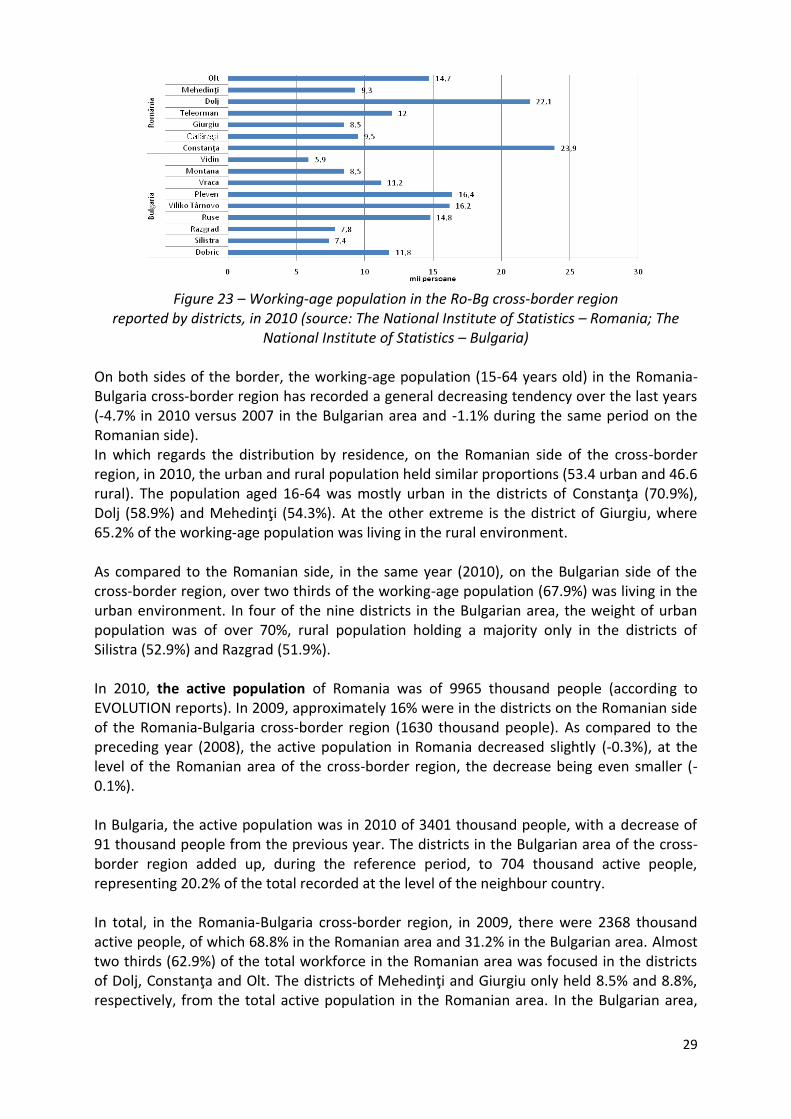
Figure 23 – Working-age population in the Ro-Bg cross-border region
reported by districts, in 2010 (source: The National Institute of Statistics – Romania; The National Institute of Statistics – Bulgaria)
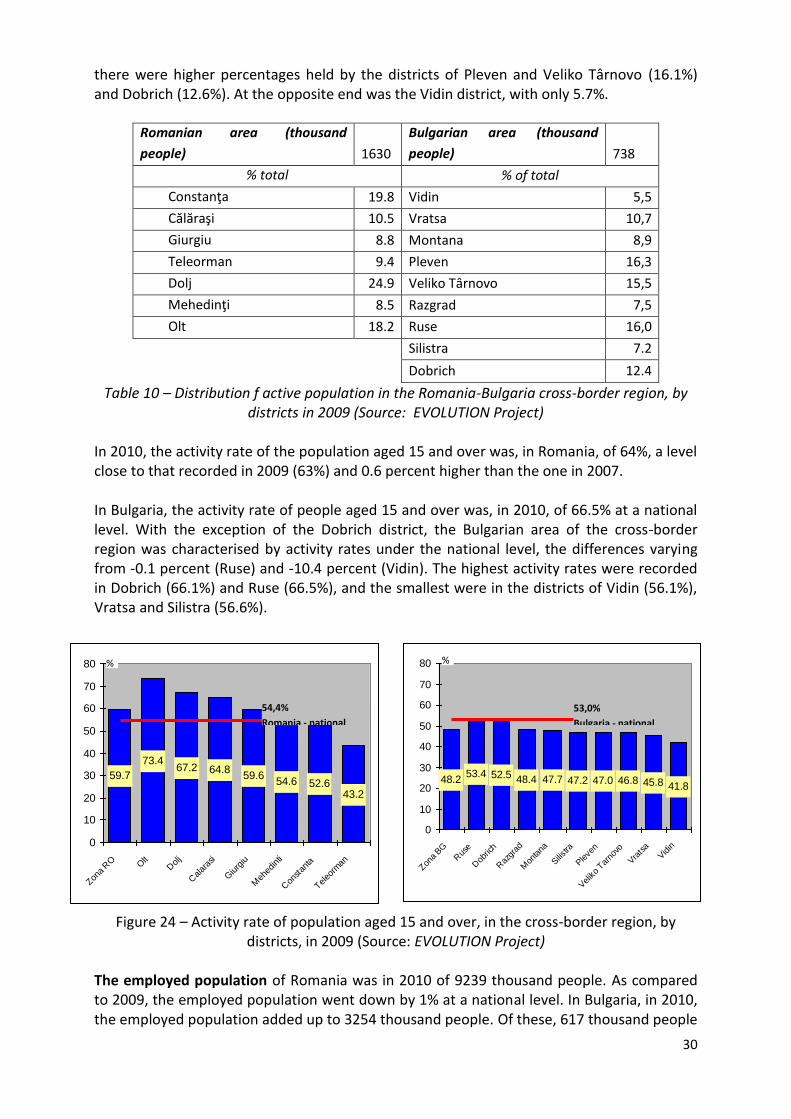
On both sides of the border, the working-age population (15-64 years old) in the Romania-Bulgaria cross-border region has recorded a general decreasing tendency over the last years (-4.7% in 2010 versus 2007 in the Bulgarian area and -1.1% during the same period on the Romanian side). In which regards the distribution by residence, on the Romanian side of the cross-border region, in 2010, the urban and rural population held similar proportions (53.4 urban and 46.6 rural). The population aged 16-64 was mostly urban in the districts of Constanţa (70.9%), Dolj (58.9%) and Mehedinţi (54.3%). At the other extreme is the district of Giurgiu, where 65.2% of the working-age population was living in the rural environment. As compared to the Romanian side, in the same year (2010), on the Bulgarian side of the cross-border region, over two thirds of the working-age population (67.9%) was living in the urban environment. In four of the nine districts in the Bulgarian area, the weight of urban population was of over 70%, rural population holding a majority only in the districts of Silistra (52.9%) and Razgrad (51.9%). In 2010, the active population of Romania was of 9965 thousand people (according to EVOLUTION reports). In 2009, approximately 16% were in the districts on the Romanian side of the Romania-Bulgaria cross-border region (1630 thousand people). As compared to the preceding year (2008), the active population in Romania decreased slightly (-0.3%), at the level of the Romanian area of the cross-border region, the decrease being even smaller (-0.1%). In Bulgaria, the active population was in 2010 of 3401 thousand people, with a decrease of 91 thousand people from the previous year. The districts in the Bulgarian area of the cross-border region added up, during the reference period, to 704 thousand active people, representing 20.2% of the total recorded at the level of the neighbour country. In total, in the Romania-Bulgaria cross-border region, in 2009, there were 2368 thousand active people, of which 68.8% in the Romanian area and 31.2% in the Bulgarian area. Almost two thirds (62.9%) of the total workforce in the Romanian area was focused in the districts of Dolj, Constanţa and Olt. The districts of Mehedinţi and Giurgiu only held 8.5% and 8.8%, respectively, from the total active population in the Romanian area. In the Bulgarian area,
30
there were higher percentages held by the districts of Pleven and Veliko Târnovo (16.1%) and Dobrich (12.6%). At the opposite end was the Vidin district, with only 5.7%.
Romanian area (thousand
people) 1630
Bulgarian area (thousand
people) 738
% total % of total
Constanţa 19.8 Vidin 5,5
Călăraşi 10.5 Vratsa 10,7
Giurgiu 8.8 Montana 8,9
Teleorman 9.4 Pleven 16,3
Dolj 24.9 Veliko Târnovo 15,5
Mehedinţi 8.5 Razgrad 7,5
Olt 18.2 Ruse 16,0
Silistra 7.2
Dobrich 12.4
Table 10 – Distribution f active population in the Romania-Bulgaria cross-border region, by districts in 2009 (Source: EVOLUTION Project)
In 2010, the activity rate of the population aged 15 and over was, in Romania, of 64%, a level close to that recorded in 2009 (63%) and 0.6 percent higher than the one in 2007. In Bulgaria, the activity rate of people aged 15 and over was, in 2010, of 66.5% at a national level. With the exception of the Dobrich district, the Bulgarian area of the cross-border region was characterised by activity rates under the national level, the differences varying from -0.1 percent (Ruse) and -10.4 percent (Vidin). The highest activity rates were recorded in Dobrich (66.1%) and Ruse (66.5%), and the smallest were in the districts of Vidin (56.1%), Vratsa and Silistra (56.6%).
59.7
73.467.2 64.8
59.654.6 52.6
43.2
0
10
20
30
40
50
60
70
80
Zon
a RO O
ltDolj
Calar
asi
Giurg
iu
Meh
edinti
Con
stan
ta
Teleo
rman
48.253.4 52.5 48.4 47.7 47.2 47.0 46.8 45.8 41.8
0
10
20
30
40
50
60
70
80
Zon
a BG
Rus
e
Dob
rich
Raz
grad
Mon
tana
Silistra
Pleve
n
Veliko Tar
novo
Vra
tsa
Vidin
Figure 24 – Activity rate of population aged 15 and over, in the cross-border region, by districts, in 2009 (Source: EVOLUTION Project)
The employed population of Romania was in 2010 of 9239 thousand people. As compared to 2009, the employed population went down by 1% at a national level. In Bulgaria, in 2010, the employed population added up to 3254 thousand people. Of these, 617 thousand people
% %
54,4%
Romania - national
53,0%
Bulgaria - national
31
(20.3%) were living in the Bulgarian area of the Romania-Bulgaria cross-border region. As compared to 2008, the employed population decreased by 3% at a national level and by 11.1% in the Bulgarian area of the cross-border region. The employed population decreased in all the 9 districts of the Bulgarian area, the most drastic decreases being recorded in Pleven (-15.6%) and Vidin (-14.2%), Montana and Pleven (17.2%). In the Bulgarian area of the cross-border region, the most important percentages of employed population were held by the districts of Veliko Târnovo (15.3%), Pleven (16.3%) and Ruse (17%). The distribution of employed population by education also shows important differences in the development levels of the two countries, both on a national, and on a regional level. In 2010, the majority of the employed population had a secondary level of education in both countries, both at a national level, and at the level of the regions in the Romanian area of the cross-border region. At a national level, the weight of population with secondary education was around 60% in both countries (58.8% in Romania and 60.2% in Bulgaria), among the regions of interest in the entire cross-border region, this indicator ranged between 53.1% (South-West Oltenia - on the Romanian side) – 68.1% (North-West in the Bulgarian area).
- % -
Total University Secondary Low
Romania 100.0 16.0 58.8 25.2
South-East 100.0 12.7 60.1 27.2
South Muntenia 100.0 12.0 59.7 28.3
South West Oltenia 100.0 14.4 53.1 32.5
Bulgaria 100.0 27.3 60.2 12.5
North-West 100.0 23.9 68.1 8.0
Centre North 100.0 23.7 62.5 13.8
North-East 100.0 25.8 57.2 17.0
Table 11 – Distribution of employed population by education in the Romania-Bulgaria cross-border region (Source: EVOLUTION Project)
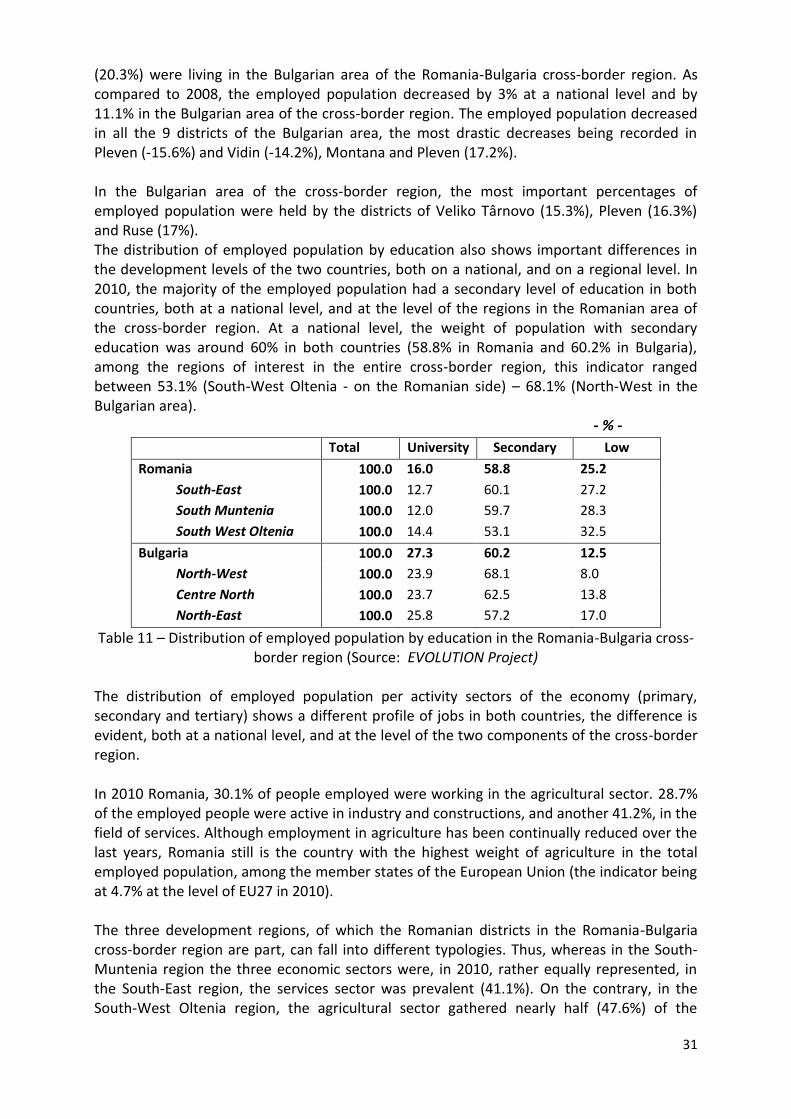
The distribution of employed population per activity sectors of the economy (primary, secondary and tertiary) shows a different profile of jobs in both countries, the difference is evident, both at a national level, and at the level of the two components of the cross-border region. In 2010 Romania, 30.1% of people employed were working in the agricultural sector. 28.7% of the employed people were active in industry and constructions, and another 41.2%, in the field of services. Although employment in agriculture has been continually reduced over the last years, Romania still is the country with the highest weight of agriculture in the total employed population, among the member states of the European Union (the indicator being at 4.7% at the level of EU27 in 2010). The three development regions, of which the Romanian districts in the Romania-Bulgaria cross-border region are part, can fall into different typologies. Thus, whereas in the South-Muntenia region the three economic sectors were, in 2010, rather equally represented, in the South-East region, the services sector was prevalent (41.1%). On the contrary, in the South-West Oltenia region, the agricultural sector gathered nearly half (47.6%) of the
32
employed population in the region. However, the significant weight (over 28%) of the agricultural sector was a common characteristic of the three development regions. In Bulgaria, in 2010, the services sector was employing over half of the employed population (59.9%), a third of employed people (33.3%) were working in the secondary sector (industrial activities and constructions), and only 6.8% of employed people were working in the agricultural sector. Overall, the same distribution of the employed population per activity sectors can be noticed at the level of planning sectors, including sectors in the Bulgarian area of the cross-border region.
Figure 25 – Distribution of employed population per sectors of activity of the national
economy in the Romania-Bulgaria cross-border region, in 2010 Source: EVOLUTION Project
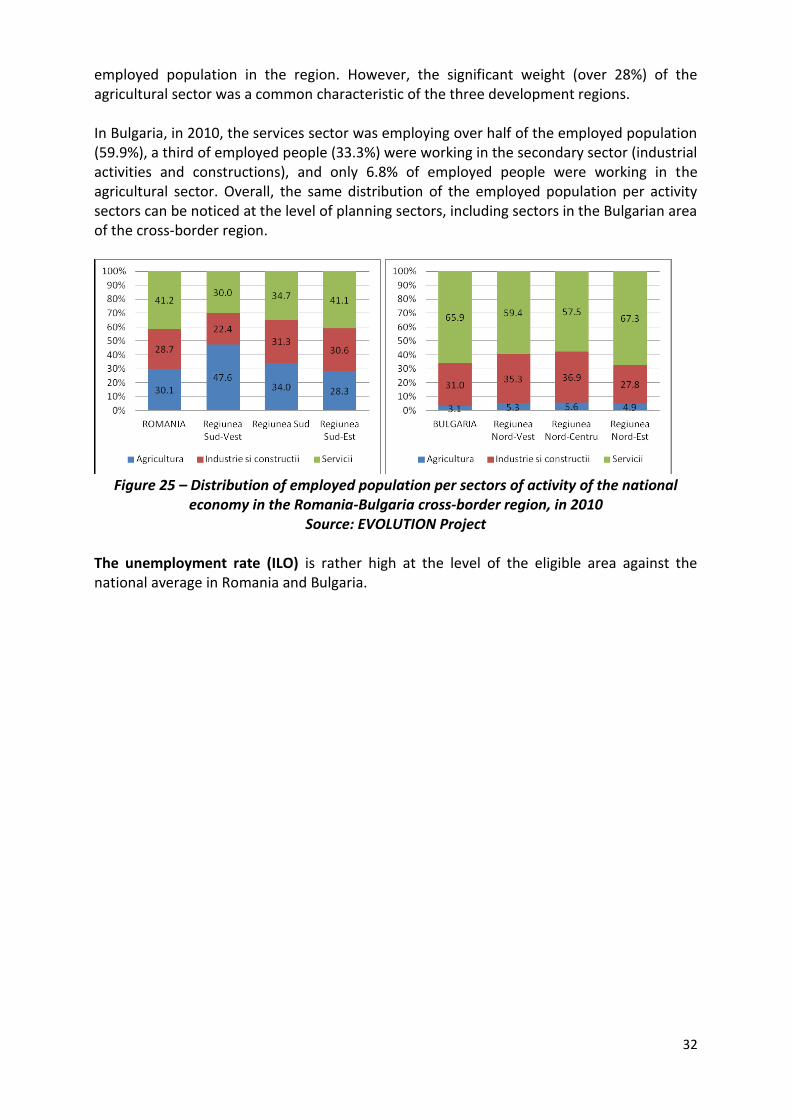
The unemployment rate (ILO) is rather high at the level of the eligible area against the national average in Romania and Bulgaria.
33
Figure 26 – Unemployment rate Source: ESPON TerrEvi project
In Romania, in 2011, the unemployment rate was of 7.4% at the level of the entire country, increasing as compared to 2008, by 1.6 percent. Three of the 7 districts making up the Romanian area of the cross-border region had in 2009 unemployment rates over the national level (and over that of the Romanian area in the cross-border region), namely: Călăraşi (13.5%), Constanţa (11.4%) and Mehedinţi (7.4%).
34
In Bulgaria, the ILO unemployment rate was, in 2011, of 11.2% - a value higher by 4.4 percent than the one recorded in 2009. in the Bulgarian area of the cross-border region, the unemployment rate was of 13.6%. Among the districts in the area, the unemployment rate varied between 8.8% in Vratsa and 20.3% in Razgrad. The unemployment rate among young people was, in Romania, in 2011, of 23.7% at the level of the entire country. In the districts of the area, young people were affected differently by the unemployment phenomenon, the lowest rates being noted in the districts of Olt (4.3%) and Giurgiu (8.6%), and the highest were in Constanţa (26.6%) and Călăraşi (24.0%). In Bulgaria, in the same year (2011), 26.6% of the active young people were ILO unemployed. The phenomenon was more intensive in the Bulgarian area of the cross-border region, where the unemployment rate for the young people recorded a value of 19.7%.
Total Low Secondary University Romania (national level)
100.0 27.2 63.3 9.5
South-East 100.0 27.9 64.4 7.7
South Muntenia 100.0 27.0 64.8 8.2
South West Oltenia
100.0 25.9 61.0 13.1
Bulgaria (national level)
100.0 32.9 55.7 11.4
North-West 100.0 27.1 64.2 8.7
Centre North 100.0 41.4 48.3 10.2
North-East 100.0 48.8 45.1 6.1
Table 12 – Structure of ILO unemployment by level of education, in the Romania-Bulgaria cross-border region, 2011
Source: EVOLUTION Project
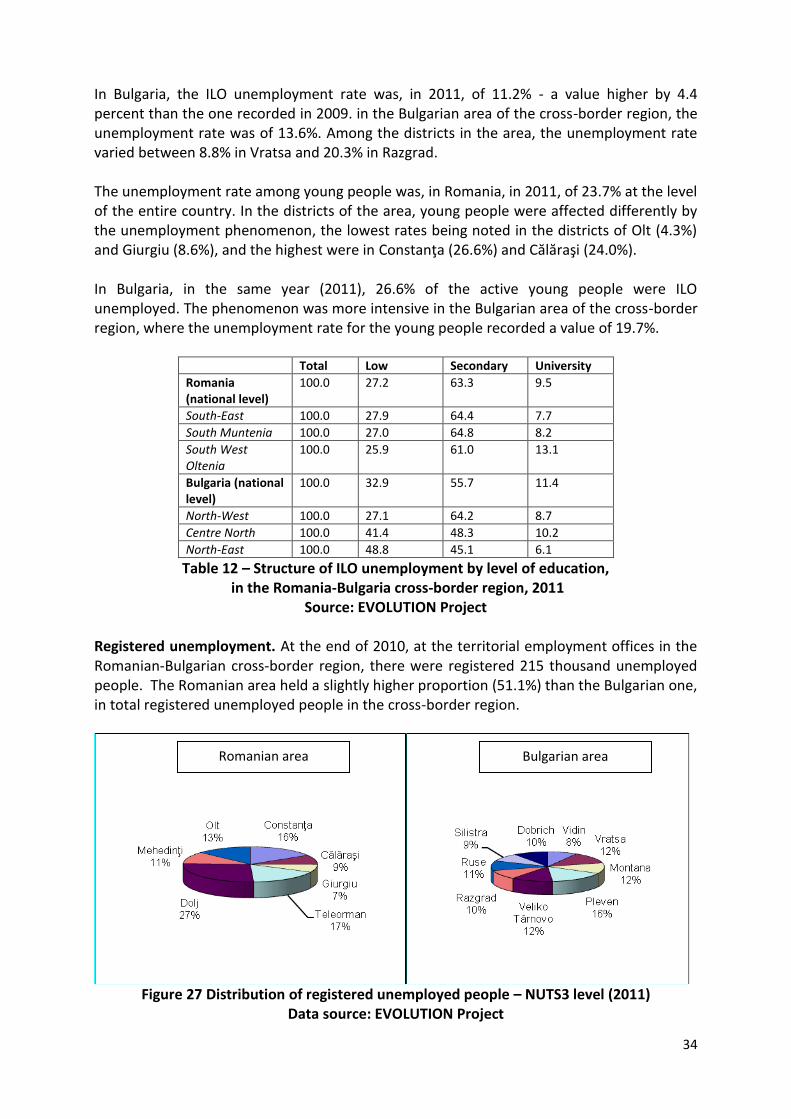
Registered unemployment. At the end of 2010, at the territorial employment offices in the Romanian-Bulgarian cross-border region, there were registered 215 thousand unemployed people. The Romanian area held a slightly higher proportion (51.1%) than the Bulgarian one, in total registered unemployed people in the cross-border region.
Figure 27 Distribution of registered unemployed people – NUTS3 level (2011)
Data source: EVOLUTION Project
Romanian area Bulgarian area
35
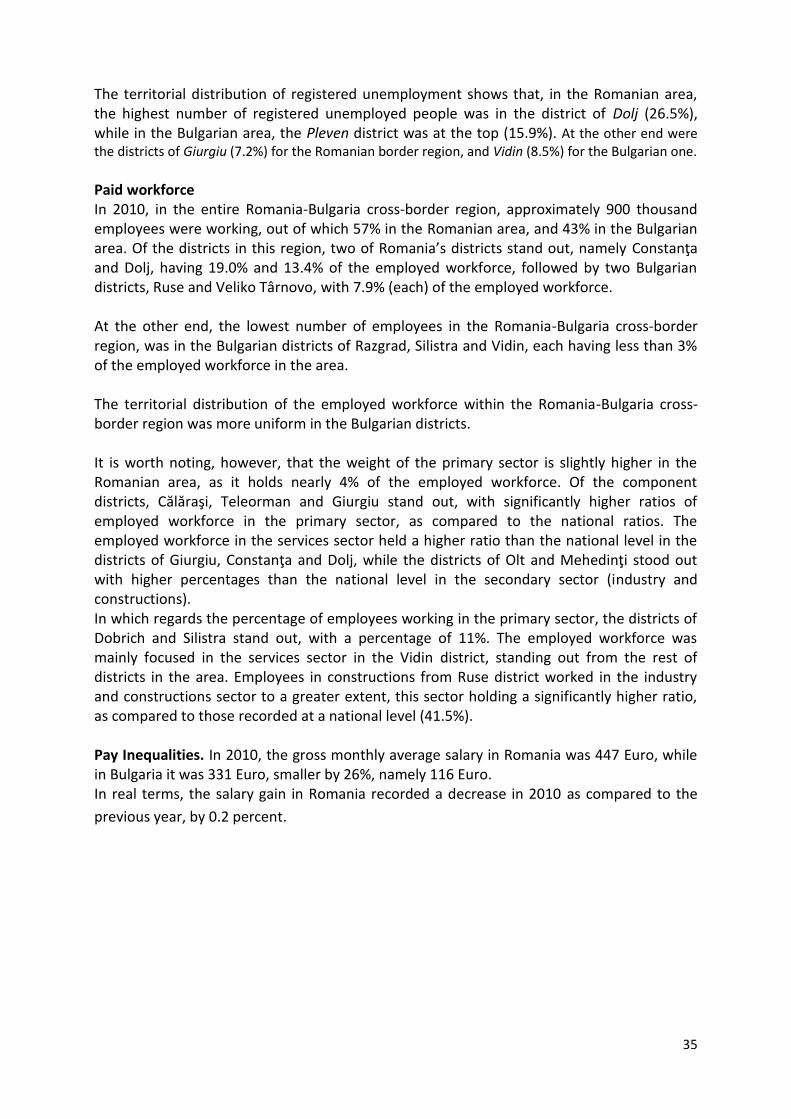
The territorial distribution of registered unemployment shows that, in the Romanian area, the highest number of registered unemployed people was in the district of Dolj (26.5%), while in the Bulgarian area, the Pleven district was at the top (15.9%). At the other end were the districts of Giurgiu (7.2%) for the Romanian border region, and Vidin (8.5%) for the Bulgarian one. Paid workforce In 2010, in the entire Romania-Bulgaria cross-border region, approximately 900 thousand employees were working, out of which 57% in the Romanian area, and 43% in the Bulgarian area. Of the districts in this region, two of Romania’s districts stand out, namely Constanţa and Dolj, having 19.0% and 13.4% of the employed workforce, followed by two Bulgarian districts, Ruse and Veliko Târnovo, with 7.9% (each) of the employed workforce. At the other end, the lowest number of employees in the Romania-Bulgaria cross-border region, was in the Bulgarian districts of Razgrad, Silistra and Vidin, each having less than 3% of the employed workforce in the area. The territorial distribution of the employed workforce within the Romania-Bulgaria cross-border region was more uniform in the Bulgarian districts. It is worth noting, however, that the weight of the primary sector is slightly higher in the Romanian area, as it holds nearly 4% of the employed workforce. Of the component districts, Călăraşi, Teleorman and Giurgiu stand out, with significantly higher ratios of employed workforce in the primary sector, as compared to the national ratios. The employed workforce in the services sector held a higher ratio than the national level in the districts of Giurgiu, Constanţa and Dolj, while the districts of Olt and Mehedinţi stood out with higher percentages than the national level in the secondary sector (industry and constructions). In which regards the percentage of employees working in the primary sector, the districts of Dobrich and Silistra stand out, with a percentage of 11%. The employed workforce was mainly focused in the services sector in the Vidin district, standing out from the rest of districts in the area. Employees in constructions from Ruse district worked in the industry and constructions sector to a greater extent, this sector holding a significantly higher ratio, as compared to those recorded at a national level (41.5%). Pay Inequalities. In 2010, the gross monthly average salary in Romania was 447 Euro, while in Bulgaria it was 331 Euro, smaller by 26%, namely 116 Euro. In real terms, the salary gain in Romania recorded a decrease in 2010 as compared to the
previous year, by 0.2 percent.
36
Figure 28 – Gross average salary gains in the Romania-Bulgaria cross-border region, By districts, in 2010 (Euro/month)
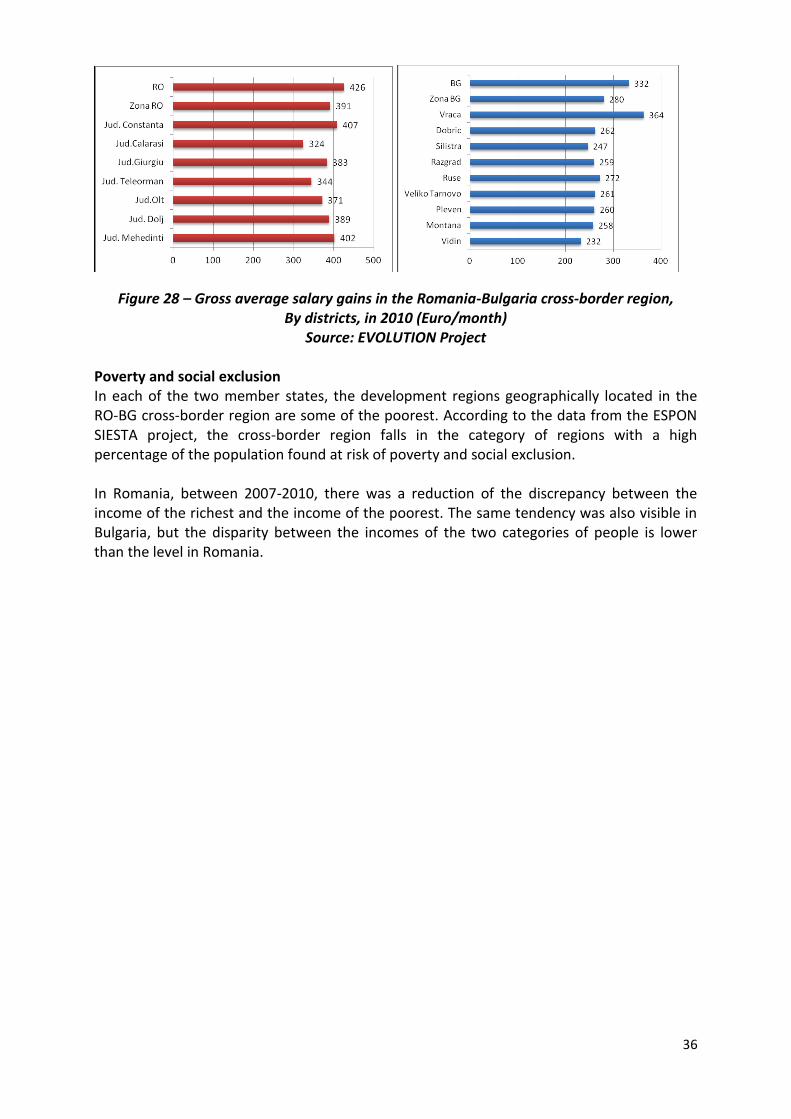
Source: EVOLUTION Project Poverty and social exclusion In each of the two member states, the development regions geographically located in the RO-BG cross-border region are some of the poorest. According to the data from the ESPON SIESTA project, the cross-border region falls in the category of regions with a high percentage of the population found at risk of poverty and social exclusion. In Romania, between 2007-2010, there was a reduction of the discrepancy between the income of the richest and the income of the poorest. The same tendency was also visible in Bulgaria, but the disparity between the incomes of the two categories of people is lower than the level in Romania.
37
Figure 29 – Percentage of population risking poverty or social exclusion %
Source: ESPON
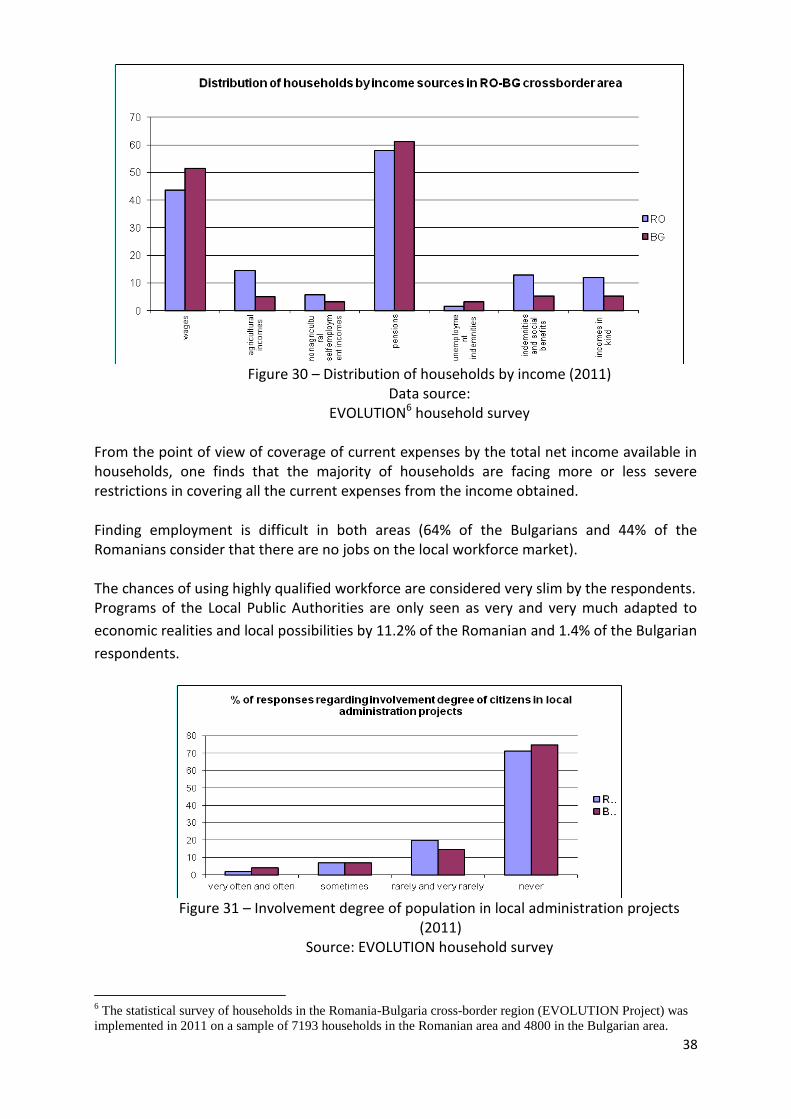
The main sources of income in both areas are salaries and pensions. For the Romanian area,
there is a higher percentage of households obtaining income in kind, than the one recorded
in the Bulgarian area.
38
Figure 30 – Distribution of households by income (2011)
Data source: EVOLUTION6 household survey
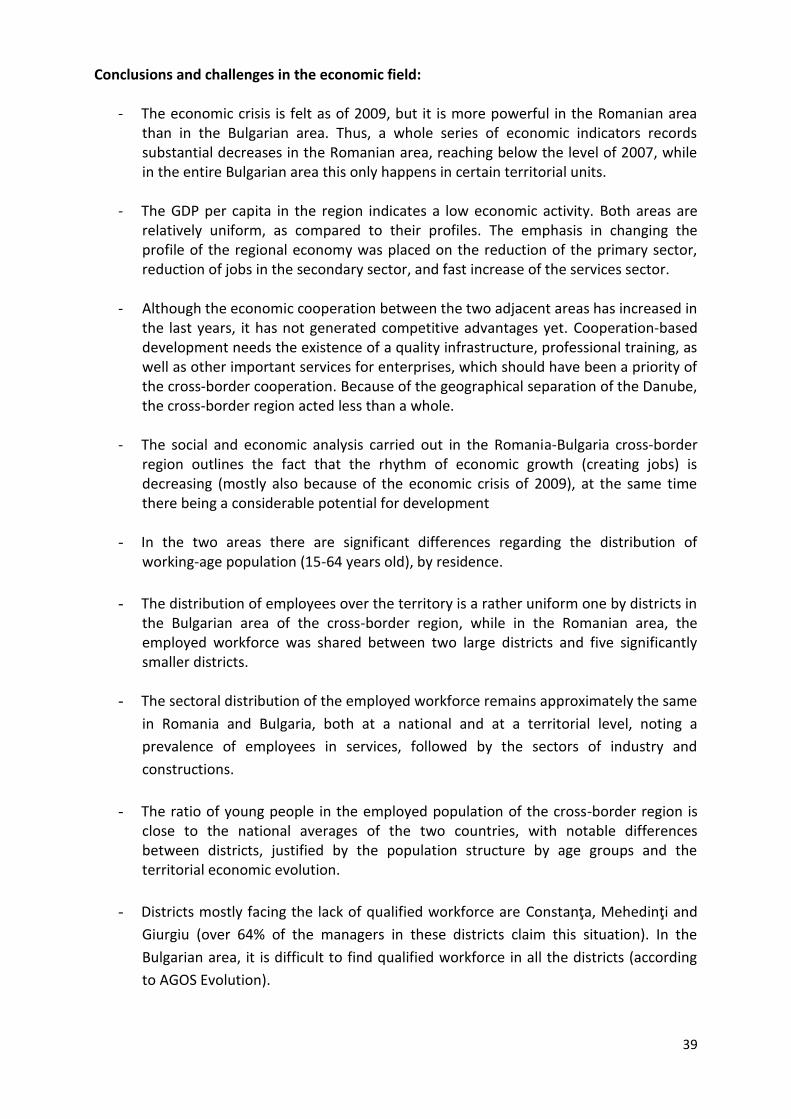
From the point of view of coverage of current expenses by the total net income available in households, one finds that the majority of households are facing more or less severe restrictions in covering all the current expenses from the income obtained. Finding employment is difficult in both areas (64% of the Bulgarians and 44% of the Romanians consider that there are no jobs on the local workforce market). The chances of using highly qualified workforce are considered very slim by the respondents. Programs of the Local Public Authorities are only seen as very and very much adapted to
economic realities and local possibilities by 11.2% of the Romanian and 1.4% of the Bulgarian
respondents.
Figure 31 – Involvement degree of population in local administration projects
(2011) Source: EVOLUTION household survey
6 The statistical survey of households in the Romania-Bulgaria cross-border region (EVOLUTION Project) was
implemented in 2011 on a sample of 7193 households in the Romanian area and 4800 in the Bulgarian area.
39
Conclusions and challenges in the economic field:
- The economic crisis is felt as of 2009, but it is more powerful in the Romanian area than in the Bulgarian area. Thus, a whole series of economic indicators records substantial decreases in the Romanian area, reaching below the level of 2007, while in the entire Bulgarian area this only happens in certain territorial units.
- The GDP per capita in the region indicates a low economic activity. Both areas are relatively uniform, as compared to their profiles. The emphasis in changing the profile of the regional economy was placed on the reduction of the primary sector, reduction of jobs in the secondary sector, and fast increase of the services sector.
- Although the economic cooperation between the two adjacent areas has increased in
the last years, it has not generated competitive advantages yet. Cooperation-based development needs the existence of a quality infrastructure, professional training, as well as other important services for enterprises, which should have been a priority of the cross-border cooperation. Because of the geographical separation of the Danube, the cross-border region acted less than a whole.
- The social and economic analysis carried out in the Romania-Bulgaria cross-border
region outlines the fact that the rhythm of economic growth (creating jobs) is decreasing (mostly also because of the economic crisis of 2009), at the same time there being a considerable potential for development
- In the two areas there are significant differences regarding the distribution of working-age population (15-64 years old), by residence.
- The distribution of employees over the territory is a rather uniform one by districts in the Bulgarian area of the cross-border region, while in the Romanian area, the employed workforce was shared between two large districts and five significantly smaller districts.
- The sectoral distribution of the employed workforce remains approximately the same
in Romania and Bulgaria, both at a national and at a territorial level, noting a
prevalence of employees in services, followed by the sectors of industry and
constructions.
- The ratio of young people in the employed population of the cross-border region is
close to the national averages of the two countries, with notable differences between districts, justified by the population structure by age groups and the territorial economic evolution.
- Districts mostly facing the lack of qualified workforce are Constanţa, Mehedinţi and
Giurgiu (over 64% of the managers in these districts claim this situation). In the
Bulgarian area, it is difficult to find qualified workforce in all the districts (according
to AGOS Evolution).
40
- The ILO unemployment rate among young people (15-24 years old) in the two areas
considered together is below the national averages, outlining 6 Bulgarian districts
and 3 Romanian ones with values under the national average.
- The unemployment phenomenon affects less people having higher education (both
at a national level, and at the level of the development/ planning regions of which
the districts in the cross-border region) are part.
Development needs and priorities:
- Promoting economic activities for young people
- Enlarging and diversifying the offer of training and carrier guidance services for
workforce resources (including on-the-job training / vocational training /
entrepreneurship education programs)
- Creating an inventory of existing and necessary land improvements in the cross
border area
- Evaluating the local training needs and identifying the jobs and occupations required
at the level of local labor market
- Supporting innovation capacity of SMEs
- Initiating partnerships between school and economic units in order to achieve a
better integration on the labor market of the graduates from vocational and
technical schools
- Promoting cooperation between universities / research institutes and entrepreneurs
in order to identify activities with high value added which provide best chances to
foster local competitiveness
- Implementing basic social care services in rural areas / enlarging and diversifying of
public and private social services network in urban areas
- Developing a monitoring system of local needs concerning social services / creating
local mechanisms for identifying / monitoring and evaluating of vulnerable social
groups and disadvantaged urban areas
41
4. Education and Research The slow, but continued process of demographic ageing has lead to the decrease of school-age population (3-23 years old) and, implicitly, that of school population. During the 2010-2011 school / academic year, the school population registered in Romania in the national education system was of 4.02 million people. The data for the 2010-2011 school / academic year show a decrease of the school population by 3.5%, as compared to the previous school / academic year, and by 7.3% as compared to the 2006-2007 school / academic year. During the 2010-2011 school / academic year, 16.7% of the total school population in Romania was pre-school, 66.6% were pupils in the pre-university system and 16.7% were university students. In the Romanian area of the cross-border region, the school population was, in the 2010-2011 school / academic year, of 559335 pupils and students, with a weight of 13.9% of the total school population in Romania. The biggest percentage of school population in the Romanian area was recorded in the district of Constanţa (27.5%) and Dolj (24.4%). In the 2010-2011 school / academic year, in the Bulgarian area of the cross-border region, there were 223,136 students registered, representing 21.6% of Bulgaria’s school population, the biggest proportion of school population in the Bulgarian area was recorded in the districts of Veliko Târnovo (15.2%) and Pleven (17.5%).
In the Romanian cross-border region, there are pre-schools, nurseries and compulsory education units (primary or secondary education) in nearly all the localities, with a presence in both the urban and the rural environments; The same applies to the pre-schools or nurseries in the Bulgarian cross-border region, but not in the case of primary or secondary education, present to a smaller extent in the localities of the area (81.2%), half of the rural households declaring that these primary or secondary education facilities miss from the locality (source AGOS Evolution). In all the districts of the Romanian area, in the 2009-2010 school year, the rate of promoting to higher secondary studies had an ascending evolution, as compared to the 2006-2007 school year. In all the districts of the Bulgarian area, in the 2009-2010 school year, the rate of promoting to higher secondary studies had an ascending evolution, as compared to the 2006-2007 school year. The teaching staff in the Romanian area of the Ro-Bg cross-border region decreased by 3.0% in the 2009-2010 school year, and in the Bulgarian area, it decreased by 7.7% as compared to the previous year. Top districts in the Ro-BG cross-border area, with the highest number of teaching staff in the 2009-2010 school year, were Dolj and Constanţa, and the top districts in the Bulgarian area were Veliko Târnovo and Pleven. In the Romanian area of the Ro-Bg cross-border region, the highest number of students coming back to a teacher is in the Giurgiu district, in the pre-school and secondary systems.
42
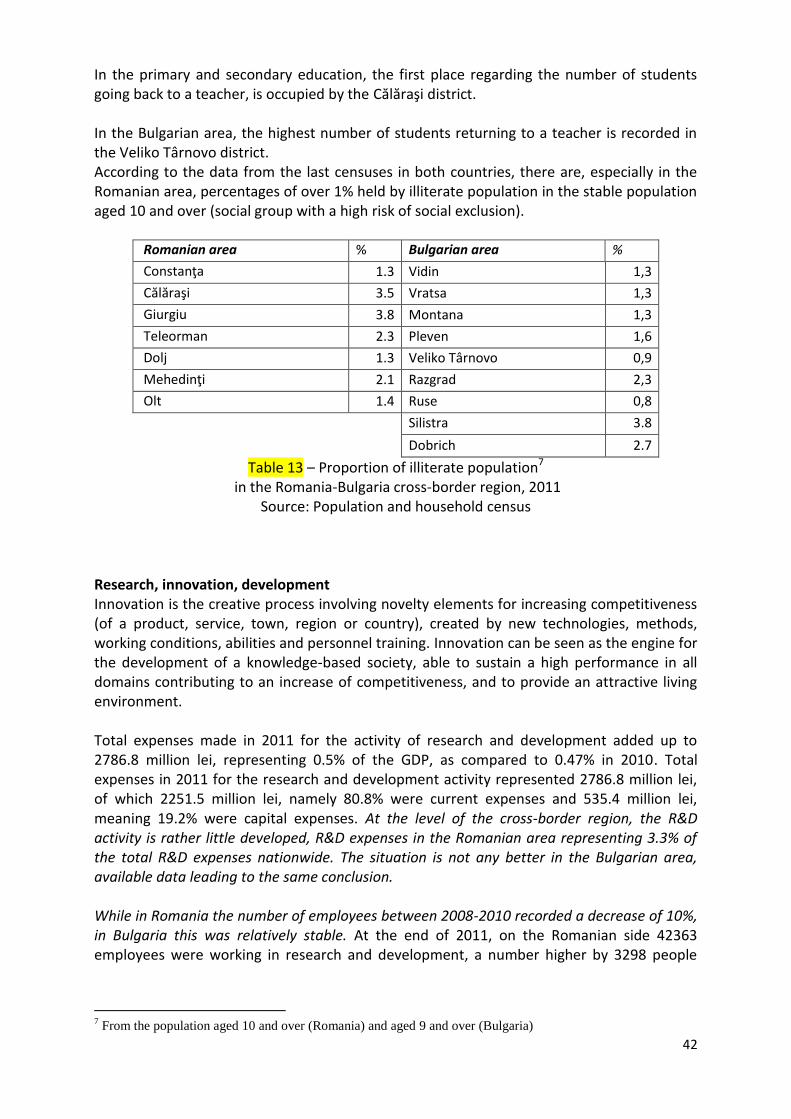
In the primary and secondary education, the first place regarding the number of students going back to a teacher, is occupied by the Călăraşi district. In the Bulgarian area, the highest number of students returning to a teacher is recorded in the Veliko Târnovo district. According to the data from the last censuses in both countries, there are, especially in the Romanian area, percentages of over 1% held by illiterate population in the stable population aged 10 and over (social group with a high risk of social exclusion).
Romanian area % Bulgarian area %
Constanţa 1.3 Vidin 1,3
Călăraşi 3.5 Vratsa 1,3
Giurgiu 3.8 Montana 1,3
Teleorman 2.3 Pleven 1,6
Dolj 1.3 Veliko Târnovo 0,9
Mehedinţi 2.1 Razgrad 2,3
Olt 1.4 Ruse 0,8
Silistra 3.8
Dobrich 2.7
Table 13 – Proportion of illiterate population7 in the Romania-Bulgaria cross-border region, 2011
Source: Population and household census Research, innovation, development Innovation is the creative process involving novelty elements for increasing competitiveness (of a product, service, town, region or country), created by new technologies, methods, working conditions, abilities and personnel training. Innovation can be seen as the engine for the development of a knowledge-based society, able to sustain a high performance in all domains contributing to an increase of competitiveness, and to provide an attractive living environment. Total expenses made in 2011 for the activity of research and development added up to 2786.8 million lei, representing 0.5% of the GDP, as compared to 0.47% in 2010. Total expenses in 2011 for the research and development activity represented 2786.8 million lei, of which 2251.5 million lei, namely 80.8% were current expenses and 535.4 million lei, meaning 19.2% were capital expenses. At the level of the cross-border region, the R&D activity is rather little developed, R&D expenses in the Romanian area representing 3.3% of the total R&D expenses nationwide. The situation is not any better in the Bulgarian area, available data leading to the same conclusion. While in Romania the number of employees between 2008-2010 recorded a decrease of 10%, in Bulgaria this was relatively stable. At the end of 2011, on the Romanian side 42363 employees were working in research and development, a number higher by 3298 people
7 From the population aged 10 and over (Romania) and aged 9 and over (Bulgaria)
43
than the one recorded at the end of 2010. in Bulgaria 3250 employees were working in research and development in 2010, decreasing from 2009.
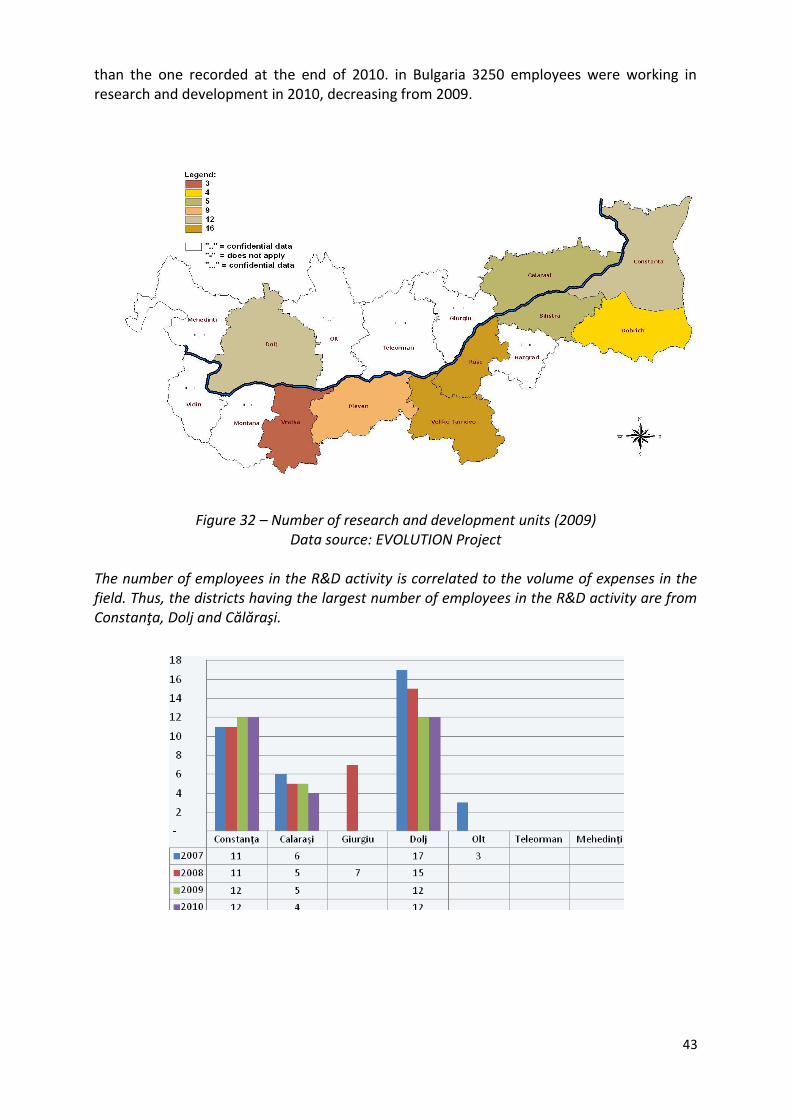
Figure 32 – Number of research and development units (2009)
Data source: EVOLUTION Project
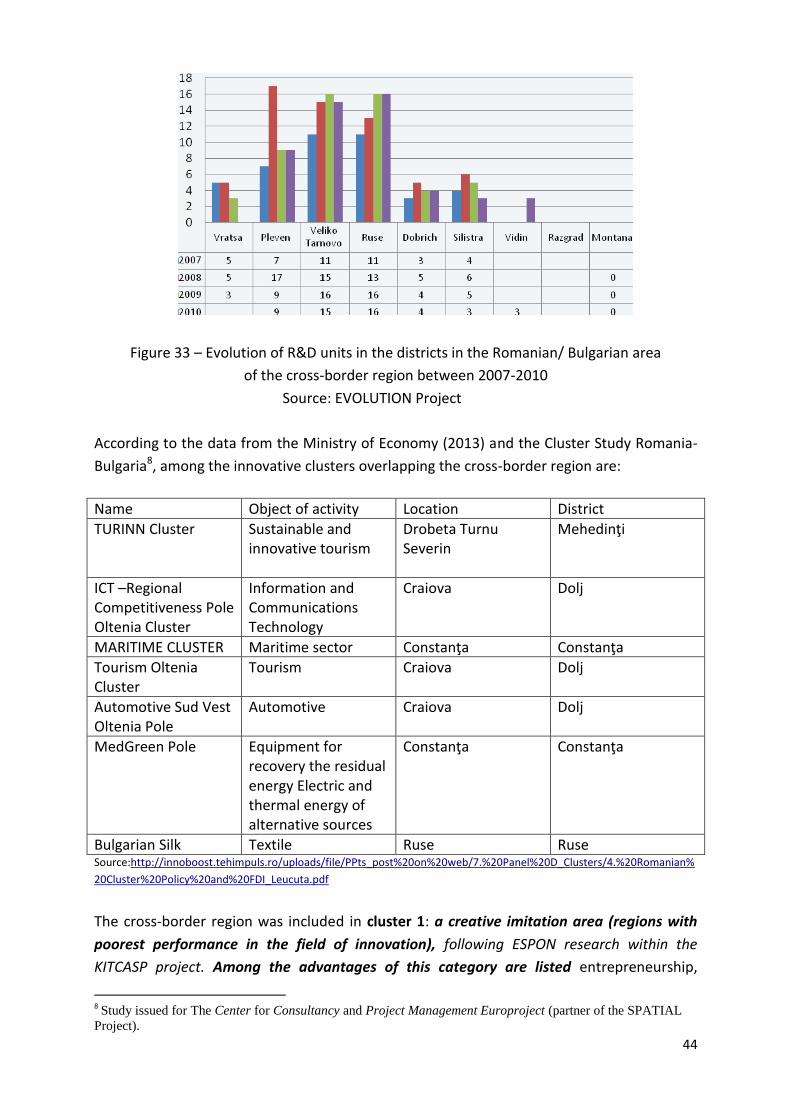
The number of employees in the R&D activity is correlated to the volume of expenses in the field. Thus, the districts having the largest number of employees in the R&D activity are from Constanţa, Dolj and Călăraşi.
44
Figure 33 – Evolution of R&D units in the districts in the Romanian/ Bulgarian area
of the cross-border region between 2007-2010
Source: EVOLUTION Project
According to the data from the Ministry of Economy (2013) and the Cluster Study Romania-
Bulgaria8, among the innovative clusters overlapping the cross-border region are:
Name Object of activity Location District
TURINN Cluster
Sustainable and innovative tourism
Drobeta Turnu Severin
Mehedinţi
ICT –Regional Competitiveness Pole Oltenia Cluster
Information and Communications Technology
Craiova Dolj
MARITIME CLUSTER Maritime sector Constanţa Constanţa
Tourism Oltenia Cluster
Tourism Craiova Dolj
Automotive Sud Vest Oltenia Pole
Automotive Craiova Dolj
MedGreen Pole Equipment for recovery the residual energy Electric and thermal energy of alternative sources
Constanţa Constanţa
Bulgarian Silk Textile Ruse Ruse Source:http://innoboost.tehimpuls.ro/uploads/file/PPts_post%20on%20web/7.%20Panel%20D_Clusters/4.%20Romanian%
20Cluster%20Policy%20and%20FDI_Leucuta.pdf
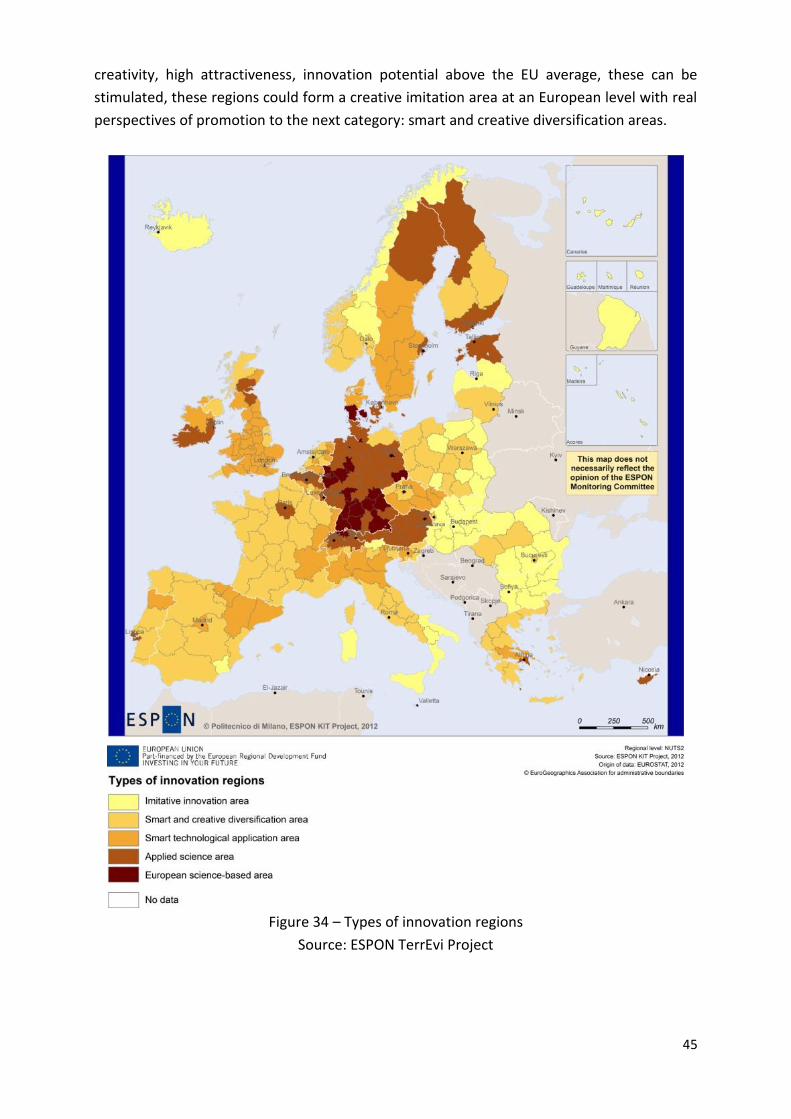
The cross-border region was included in cluster 1: a creative imitation area (regions with
poorest performance in the field of innovation), following ESPON research within the
KITCASP project. Among the advantages of this category are listed entrepreneurship,
8 Study issued for The Center for Consultancy and Project Management Europroject (partner of the SPATIAL
Project).
45
creativity, high attractiveness, innovation potential above the EU average, these can be
stimulated, these regions could form a creative imitation area at an European level with real
perspectives of promotion to the next category: smart and creative diversification areas.
Figure 34 – Types of innovation regions
Source: ESPON TerrEvi Project
46
Signalled issues in this field:
- Inadequate financing possibilities from public funds - The issue of obsolete infrastructure. The equipment in the research units is mostly
obsolete and physically worn-out on a constant background of a chronic lack of investment funds. By the participation of the research units in various government projects, it was only possible to purchase small equipment, which cannot compensate the lack of the necessary modern equipment to participate in European projects or national plans.
- The issue of human resources. At the region level, there is an ageing tendency of the research personnel. Every year, from the young university graduates, a small part is recruited by research institutes, but it has been found that most of them give up their workplace in 1-3 years for better-paid activities. Doctoral or post-doctoral professional training and development programs, stimulating some of the young researchers, may become retention means to keep them in the research institutes.
- The development of logistic and commercial centres, or of joint business incubators,
has a positive perception in the business environment, especially on the Bulgarian
side (55% of the Bulgarian area managers are appreciating their development, as
compared to 39% of the Romanian managers with the same view).
Development needs and priorities:
- Developing pre-school educational opportunities for children under 3 years - Stimulating children from rural areas (including disadvantaged communities) to
attend school - Equalising educational chances by increasing educational opportunities of children
from poor families (including roma and rural communities) also by establishing of alternative / community forms for children from rural isolated settlements
- Ensuring equal access of children / young people to information - Rehabilitation, upgrading and equipping primary and secondary school units - Correlating secondary education forms with local needs and with local resources and
traditions - Increasing potential of R&D by upgrading the existing functional R&D infrastructure - Implementing joint training programmes of the staff from R&D units - Developing logistic / trading centres and joint business support centres

47
-
5. Environment and Energy
Relief and climate Besides its role of Southern border of Romania, the Danube is also considered a climate boundary, being characterised by high values of global solar radiation, oceanic and sub-Mediterranean climate influences, next to influences of aridity and Black Sea influences (Romanian Geography, Volume V). In the context of the Romania-Bulgaria cross-border cooperation development, the emphasized Danube sectors are: Gura Văii-Călăraşi and Călăraşi-Pătlăgeanca (partially) with a focus on Balta Ialomiţei. The Gura Văii-Călăraşi sector has a length of 566 km, collecting the waters of several feeders, both from Bulgaria: Timok, Ogosta, Iskăr, Vit, Iantra, and from Romania: Jiu, Olt Argeş, contributing to the increase of water flow by approximately 600 m3/s at Olteniţa as compared to the Danube Gorge (Defileul Dunării).
The major relief in this sector consists of the Miro Plateau and the Pre-Balkan Plateau in Bulgaria, and in Romania the Severin Wold (Depresiunea Severin - between the Mehedinţi Plateau and Motrului Piedmont), Balacitei Piedmont and the Romanian Plain. The Romanian Plain, mostly overlapping on the surface of analysed districts, was split by the geographic literature in 6 sub regions, including the Danube Flood Plain, which is, however, treated separately in specialty works. These regions are: The Oltenia Plain (including the Olt Floodplain), the Teleorman Plain, the Bărăgan Plain and the Buzău-Siret Plain (the latter is not the object of the present analysis). Still within the cross-border region, we need to mention the South Dobrogea Plateau (as the main relief unit on the territory of Constanţa District), with a total area of 5335 square km and average altitude values of 100-200 m. The climate has yearly average temperatures of
over 11C and low levels of precipitations, of approximately 400 mm yearly, hence the semi-arid continental character. The landscape in the cross-border region (on the Bulgarian side) contains low areas (16.3%), plains (37.7%), hills (31.3%), and mountains (14.7%). In the northern part of the area, the landscape show slow areas and plains (with heights varying between 200 and 400 m), and also numerous low areas spread along the banks by the Danube, such as Bregovsko - Novoselska, Vidinska, Archaro-Orsoyska, Tsiburska, Kozloduyska, Ostrovska, Cheernopolska, Svishtov-Belenska, Vidimska, Batinska, Brushlyanska, Popino-Garvanska and the Aidemirska Plain. Also, within the Romania-Bulgaria cross-border region, there are a series of islands belonging to Bulgaria, the island of Belene having the largest area (41.1 sq. km), followed by the island of Kozlodui (6.1 sq km) and the Island of Vardim (5.0 sq km). The area has a moderate continental climate, with hot summers and cold winters, with high annual amplitude, with abounding precipitations during the spring and summer, and less during the wintertime. The average yearly temperature has the highest values in Southern
Romania (in average 11.5C), while the amount of precipitations decreases gradually from West to East, the difference being of approximately 200 mm. The lower frequency of days of precipitations downstream favours the occurrence of dryness and drought.
48
The average temperature in January (Bulgarian side) varies between 0.0 and -0.5, and the maximum recorded temperatures in the area may reach up to 43.0-44.0° С (Ruse – 44.0 ° С in 1993).
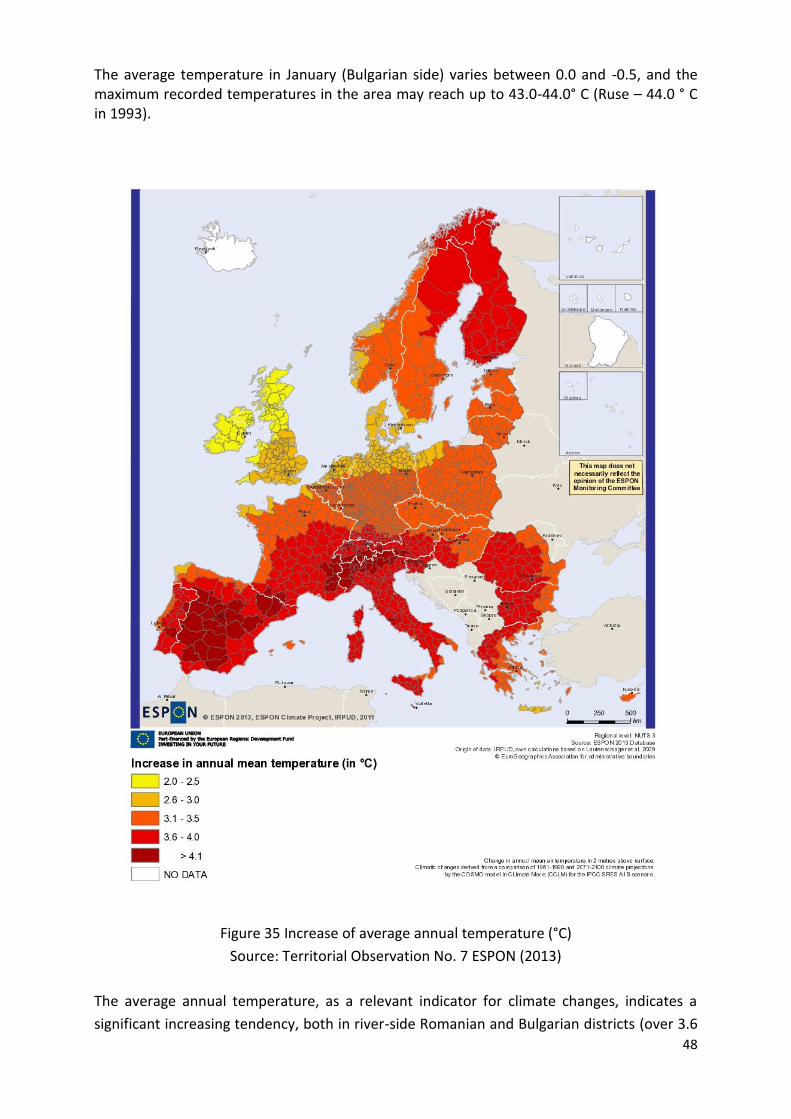
Figure 35 Increase of average annual temperature (°C)
Source: Territorial Observation No. 7 ESPON (2013)
The average annual temperature, as a relevant indicator for climate changes, indicates a
significant increasing tendency, both in river-side Romanian and Bulgarian districts (over 3.6
49
°C), with two exceptions: Constanţa and Dobrich (3.1-3.5 °C), tendencies recorded in the
greatest part of the national territory of the two states and in Southern Europe on wide
areas.
This phenomenon, correlated to the decrease of the average annual amount of
precipitations in summer months, has a major influence on the accentuation of drought and
drought risk, especially in the districts of Olt, Teleorman, Dolj (Romania) and in Montana,
Vratsa, Pleven, Ruse (Bulgaria).
The Călăraşi-Pătlăgeanca sector is characterised by the expansion of ponds. The Danube
Valley in this sector falls on Romanian territory in its majority, limiting the Dobrogea Plateau
to the West and north. The Ialomiţa Pond has a length of 130 km between Călăraşi and the
narrowing of Giurgeni-Vadu Oii. The branching of the Danube distributaries takes place
south of the municipality of Călăraşi. Dobrogea-type fluvial limans fed by valleys of periodic
flow are specific for the right shore.
A characteristic of the hydrographic network in the area is the presence of intermittent-type
rivers, discharging into the Danube through the above-mentioned fluvial limans.
The main natural lakes in the Romanian area of the cross-border region are in the district of
Constanţa (covering 25662 ha). Here we note Lake Sinoie, covering 17150 hectares (66.83%
of the total surface of natural lakes in the Constanţa District and 18.46% of the total surface
of natural lakes in Romania). Lake Porţile de Fier (Iron Gates), in Mehedinţi District, covering
70000 hectares, is the main anthropic lake in Romania, with a weight of 68.32% of the total
anthropic lakes in Romania.
The Bulgarian cross-border area, with its own river network (20 major rivers tributary to the
Danube) falls into the area of the Black Sea drainage area. The main hydrographic
characteristic of the area is given by the high density of the river network. The mountains on
the west and central side of Stara Planina have a dense hydrographic network (over 2km/sq
km).
The embankment, drainage and harnessing activities for irrigation purposes in the Danube
Floodplain, carried out before 1989, caused major changes in vegetation. Floodplain plant
associations are also closely correlated to the predominant intra-area soils (alluvial and clay).
The fauna in the area counts continental and steppe species. There is a large variety of birds,
over 200 species of birds in the low areas, moors, islands and forests close to the Danube.
The presence of large game such as is important for the hunting tourism.
There can be touristic hunting destinations at the specialized hunting stations from the areas
of: Midjur, Bolyarka, Dunărea and Karakuz.
Underground resources. The (Bulgarian) cross-border region is rather poor in minerals,
energetic resources and forestry, as these are located in the Danube Plain. Non-renewable
energy resources (Romanian side) consist of deposits of coal, marble, limestone, stone,
siderite, etc. Coal mining, carried out mainly on the surface, but also underground, in the
50
mining perimeters of Livezile, Zegujani and especially Husnicioara, has been restructured,
and the production output was substantially diminished. Stone and sand excavations in the
Mala I and Mala II quarries are carried out in an integrated system by companies with
construction activities. The resources in the underground of Dolj County include deposits of
crude oil, at Melinesti, Bradesti, Almaj, Simnicu de Sus, Ghercesti, Pielesti, Cosoveni, Malu
Mare, Cârcea, natural gas at Isalnita, Ghercesti, Simnicu de Sus, Pielesti and Cosoveni. On the
territory of Giurgiu District, there are two groups of deposits (containing objectives of
former oil leases of Bolintin, Roata de Jos and Videle), belonging to S.C. OMV PETROM S.A.
Soil resources
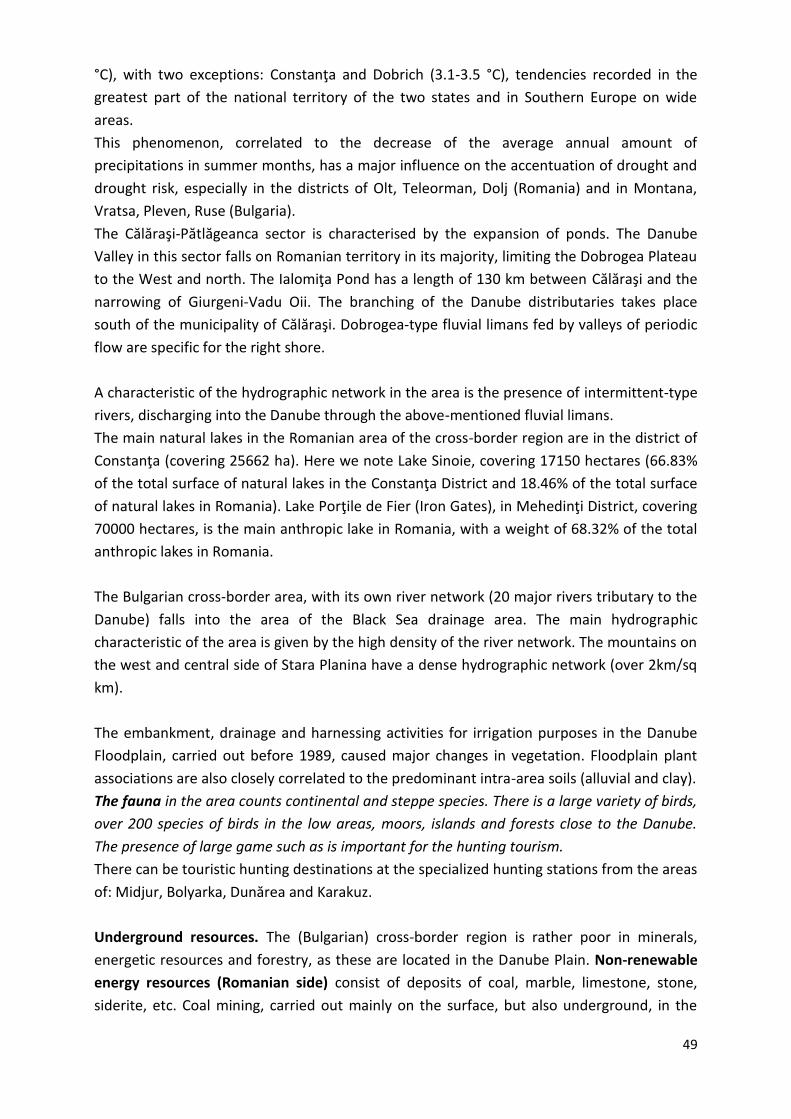
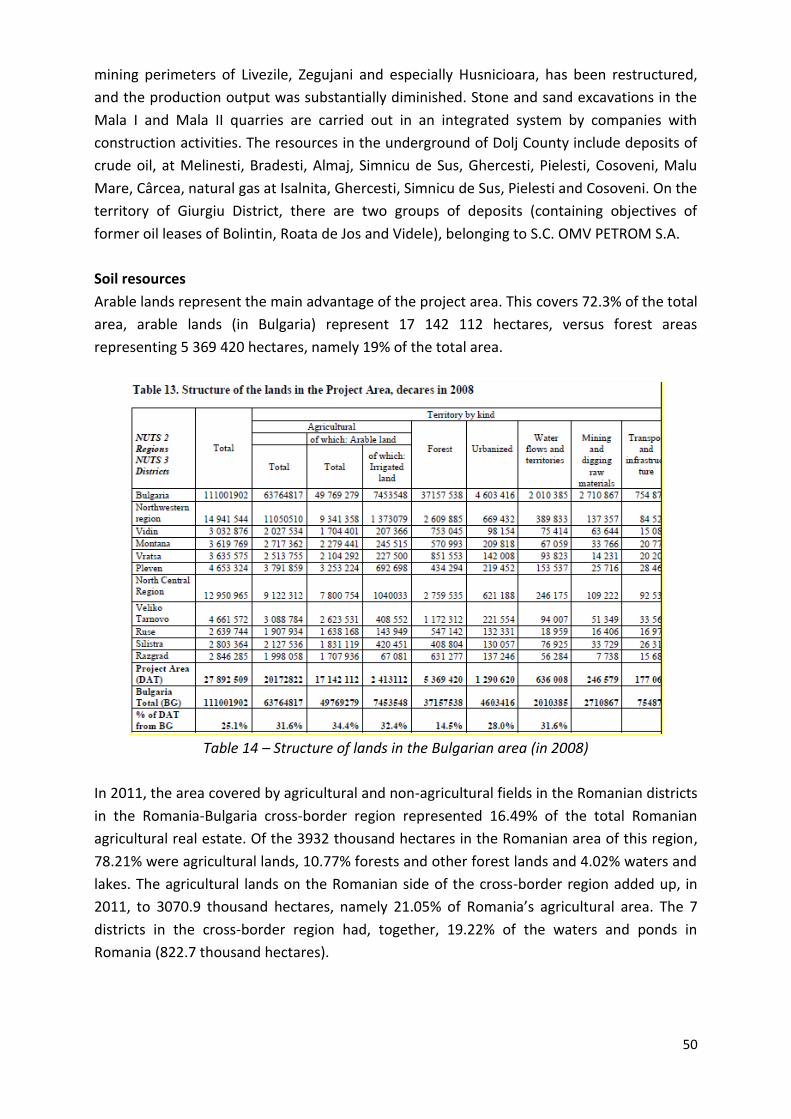
Arable lands represent the main advantage of the project area. This covers 72.3% of the total
area, arable lands (in Bulgaria) represent 17 142 112 hectares, versus forest areas
representing 5 369 420 hectares, namely 19% of the total area.
Table 14 – Structure of lands in the Bulgarian area (in 2008)
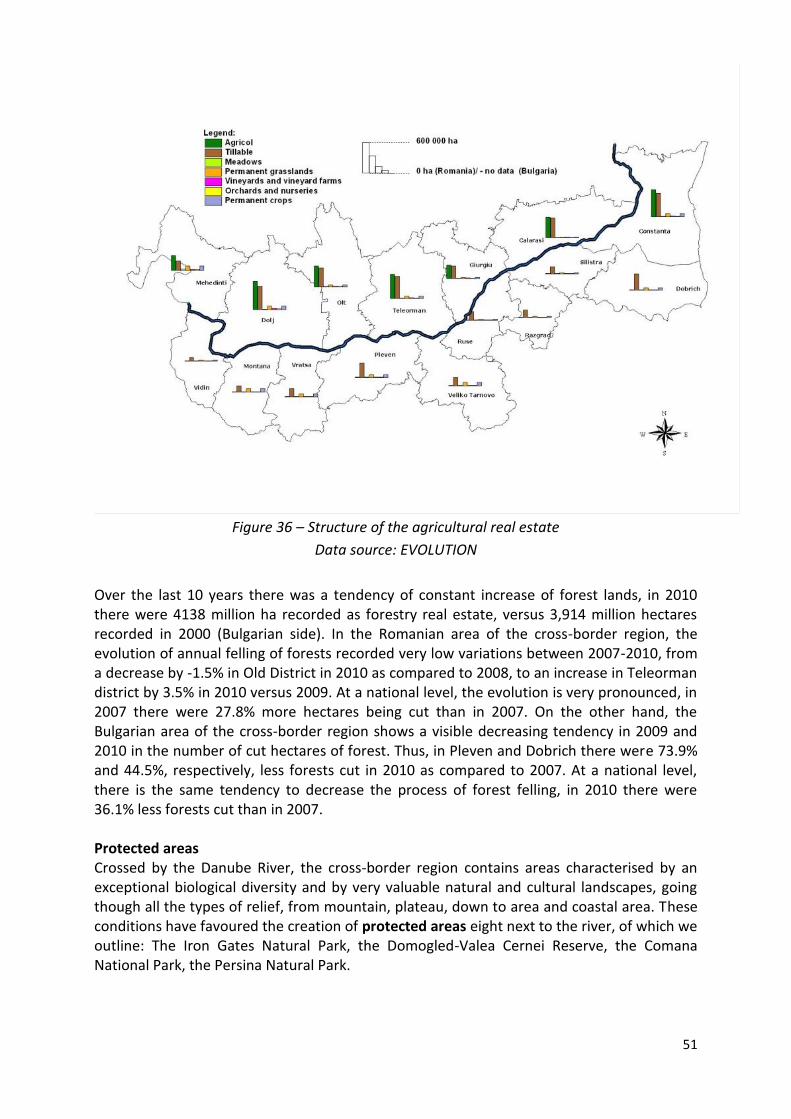
In 2011, the area covered by agricultural and non-agricultural fields in the Romanian districts
in the Romania-Bulgaria cross-border region represented 16.49% of the total Romanian
agricultural real estate. Of the 3932 thousand hectares in the Romanian area of this region,
78.21% were agricultural lands, 10.77% forests and other forest lands and 4.02% waters and
lakes. The agricultural lands on the Romanian side of the cross-border region added up, in
2011, to 3070.9 thousand hectares, namely 21.05% of Romania’s agricultural area. The 7
districts in the cross-border region had, together, 19.22% of the waters and ponds in
Romania (822.7 thousand hectares).
51
Figure 36 – Structure of the agricultural real estate
Data source: EVOLUTION
Over the last 10 years there was a tendency of constant increase of forest lands, in 2010 there were 4138 million ha recorded as forestry real estate, versus 3,914 million hectares recorded in 2000 (Bulgarian side). In the Romanian area of the cross-border region, the evolution of annual felling of forests recorded very low variations between 2007-2010, from a decrease by -1.5% in Old District in 2010 as compared to 2008, to an increase in Teleorman district by 3.5% in 2010 versus 2009. At a national level, the evolution is very pronounced, in 2007 there were 27.8% more hectares being cut than in 2007. On the other hand, the Bulgarian area of the cross-border region shows a visible decreasing tendency in 2009 and 2010 in the number of cut hectares of forest. Thus, in Pleven and Dobrich there were 73.9% and 44.5%, respectively, less forests cut in 2010 as compared to 2007. At a national level, there is the same tendency to decrease the process of forest felling, in 2010 there were 36.1% less forests cut than in 2007. Protected areas Crossed by the Danube River, the cross-border region contains areas characterised by an exceptional biological diversity and by very valuable natural and cultural landscapes, going though all the types of relief, from mountain, plateau, down to area and coastal area. These conditions have favoured the creation of protected areas eight next to the river, of which we outline: The Iron Gates Natural Park, the Domogled-Valea Cernei Reserve, the Comana National Park, the Persina Natural Park.
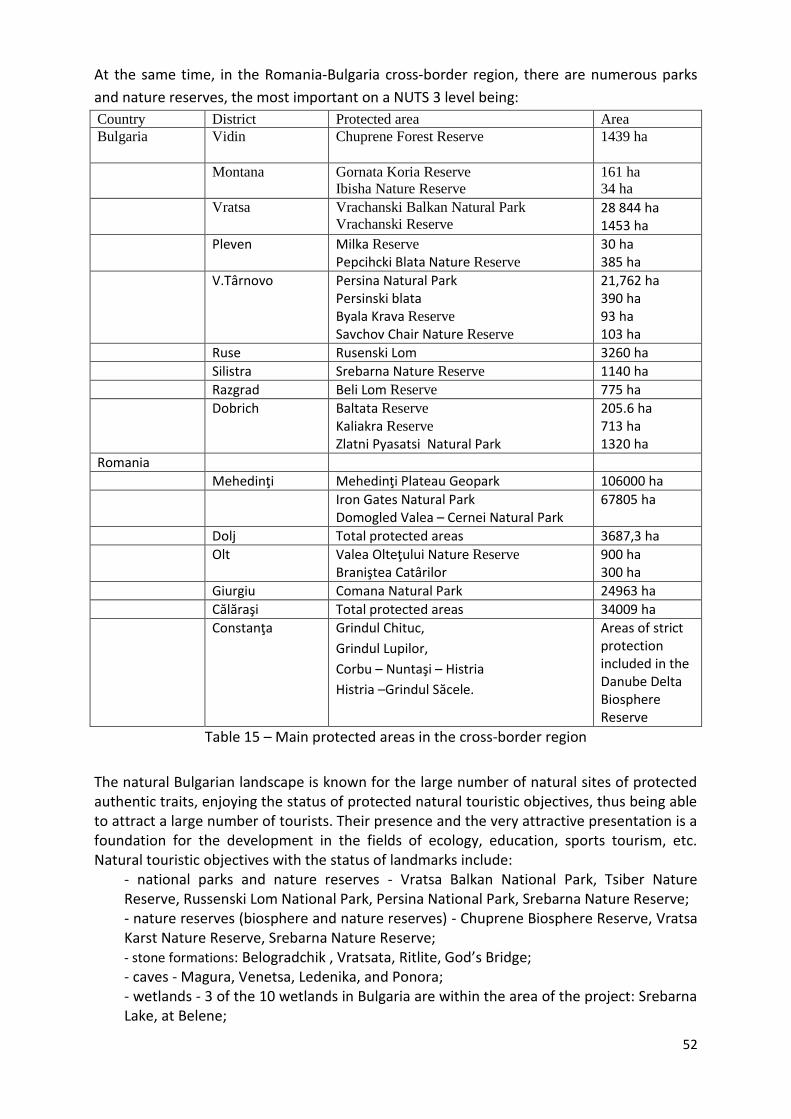
52
At the same time, in the Romania-Bulgaria cross-border region, there are numerous parks
and nature reserves, the most important on a NUTS 3 level being:
Country District Protected area Area Bulgaria Vidin Chuprene Forest Reserve 1439 ha
Montana
Gornata Koria Reserve Ibisha Nature Reserve
161 ha
34 ha
Vratsa
Vrachanski Balkan Natural Park Vrachanski Reserve
28 844 ha 1453 ha
Pleven Milka Reserve Pepcihcki Blata Nature Reserve
30 ha 385 ha
V.Târnovo Persina Natural Park Persinski blata Byala Krava Reserve Savchov Chair Nature Reserve
21,762 ha 390 ha 93 ha 103 ha
Ruse Rusenski Lom 3260 ha
Silistra Srebarna Nature Reserve 1140 ha
Razgrad Beli Lom Reserve 775 ha
Dobrich Baltata Reserve Kaliakra Reserve Zlatni Pyasatsi Natural Park
205.6 ha 713 ha 1320 ha
Romania
Mehedinţi Mehedinţi Plateau Geopark 106000 ha
Iron Gates Natural Park Domogled Valea – Cernei Natural Park
67805 ha
Dolj Total protected areas 3687,3 ha
Olt Valea Olteţului Nature Reserve Braniştea Catârilor
900 ha 300 ha
Giurgiu Comana Natural Park 24963 ha
Călăraşi Total protected areas 34009 ha
Constanţa Grindul Chituc,
Grindul Lupilor,
Corbu – Nuntaşi – Histria
Histria –Grindul Săcele.
Areas of strict protection included in the Danube Delta Biosphere Reserve
Table 15 – Main protected areas in the cross-border region
The natural Bulgarian landscape is known for the large number of natural sites of protected authentic traits, enjoying the status of protected natural touristic objectives, thus being able to attract a large number of tourists. Their presence and the very attractive presentation is a foundation for the development in the fields of ecology, education, sports tourism, etc. Natural touristic objectives with the status of landmarks include:
- national parks and nature reserves - Vratsa Balkan National Park, Tsiber Nature Reserve, Russenski Lom National Park, Persina National Park, Srebarna Nature Reserve; - nature reserves (biosphere and nature reserves) - Chuprene Biosphere Reserve, Vratsa Karst Nature Reserve, Srebarna Nature Reserve; - stone formations: Belogradchik , Vratsata, Ritlite, God’s Bridge; - caves - Magura, Venetsa, Ledenika, and Ponora; - wetlands - 3 of the 10 wetlands in Bulgaria are within the area of the project: Srebarna Lake, at Belene;
53
- islands - Island Ibisha.
At the present, the very attractive touristic destinations are those on the western side of the
area, the most important being the Rocks of Belogradchik, with its third-century castle, and
Magura Cave (next to the village of Rabisha, containing 700 wall paintings, being the largest
pre-historic gallery in the Balkan Peninsula), Ledenika Cave, Vratsata and the stone
formations of Ritlite. The Srebarna lake is a natural attraction located in the central and
eastern side of the Bulgarian area, being a nature reserve on the list of UNESCO Natural and
Cultural World Heritage Sites.
There are many protected areas in the cross-border region, included in the European
Union’s „Natura 2000” network of protected areas, with the purpose of protecting
biodiversity and habitats.
There are protected areas with migratory birds in the north area of the Project region. Here
are the protected areas in the wetlands along the project river:
- Former Danube swamps - Mala Preslavets, Garvan Swamp, Orsoya, etc; - Danube islands: Golya, the island close to the Gorni Tsibar village; Lakut, Belene;
Vardim, Pojarevo, etc; - Incubators close to the project river: Hadjidimitrovo; Orsoya, Mechka; - Protected bird areas are in the regions of plains, hills and mountains: Prebalkan and
some parts of the Stara Planina Mountain - The largest protected areas are the Western Balkans, Berkovitsa, Vraţa Balkan,
Karlukovo Karst, Dabnik - Telish, Karaboaz - Gulyantsi, Ludogorie - Bobrata, Ludogorie - Srebarna, etc.
Natural-interest habitats are distributed in a relatively uniform manner in the Romanian
districts, having a bigger territorial incidence in districts with higher variety of relief, climate
and hydrology. In Mehedinţi, 10 Natural 2000 sites were validated, of which 7 spread to
neighbouring districts Gorj, Caras Severin and Dolj, part of them being located within other
protected areas. There are 7 in Dolj, of which 3 are sites of community importance and 4 are
special areas of bird and fauna protection. In Călăraşi there are 5 protected areas of national
interest, adding up to an area of 34009 ha, next to 9 areas of community interest.
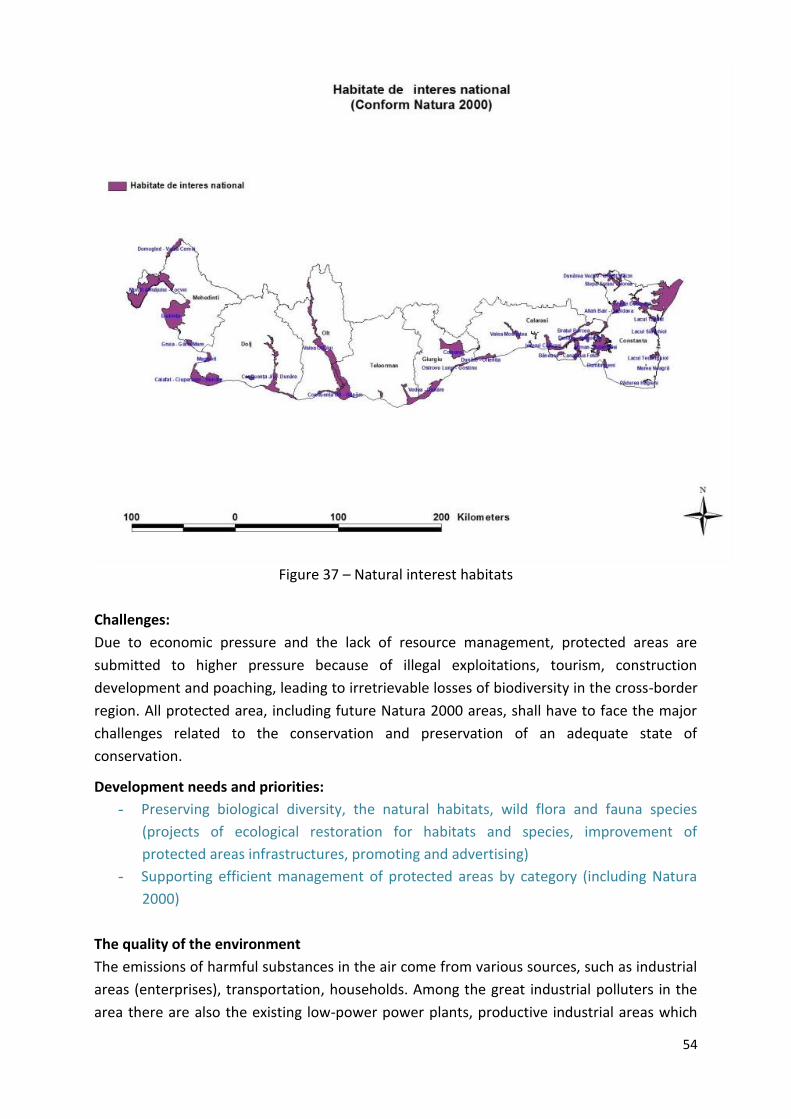
54
Figure 37 – Natural interest habitats
Challenges:
Due to economic pressure and the lack of resource management, protected areas are
submitted to higher pressure because of illegal exploitations, tourism, construction
development and poaching, leading to irretrievable losses of biodiversity in the cross-border
region. All protected area, including future Natura 2000 areas, shall have to face the major
challenges related to the conservation and preservation of an adequate state of
conservation.
Development needs and priorities:
- Preserving biological diversity, the natural habitats, wild flora and fauna species
(projects of ecological restoration for habitats and species, improvement of
protected areas infrastructures, promoting and advertising)
- Supporting efficient management of protected areas by category (including Natura
2000)
The quality of the environment
The emissions of harmful substances in the air come from various sources, such as industrial
areas (enterprises), transportation, households. Among the great industrial polluters in the
area there are also the existing low-power power plants, productive industrial areas which
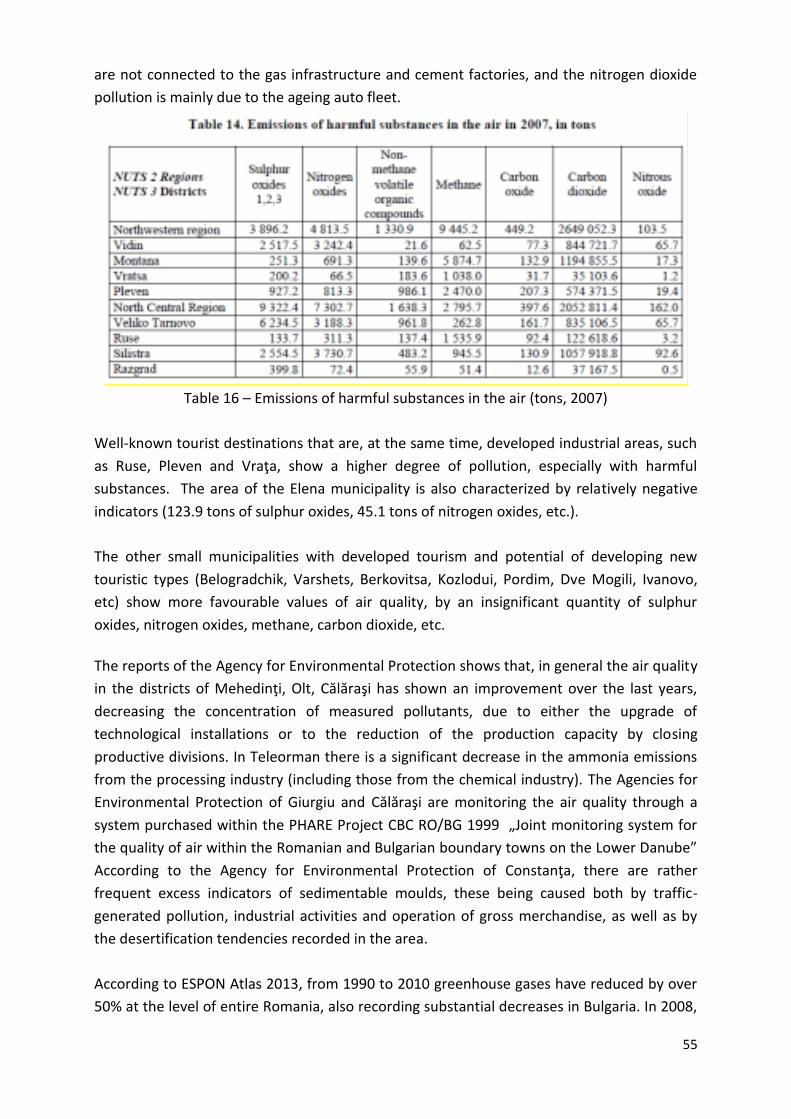
55
are not connected to the gas infrastructure and cement factories, and the nitrogen dioxide
pollution is mainly due to the ageing auto fleet.
Table 16 – Emissions of harmful substances in the air (tons, 2007)
Well-known tourist destinations that are, at the same time, developed industrial areas, such
as Ruse, Pleven and Vraţa, show a higher degree of pollution, especially with harmful
substances. The area of the Elena municipality is also characterized by relatively negative
indicators (123.9 tons of sulphur oxides, 45.1 tons of nitrogen oxides, etc.).
The other small municipalities with developed tourism and potential of developing new
touristic types (Belogradchik, Varshets, Berkovitsa, Kozlodui, Pordim, Dve Mogili, Ivanovo,
etc) show more favourable values of air quality, by an insignificant quantity of sulphur
oxides, nitrogen oxides, methane, carbon dioxide, etc.
The reports of the Agency for Environmental Protection shows that, in general the air quality
in the districts of Mehedinţi, Olt, Călăraşi has shown an improvement over the last years,
decreasing the concentration of measured pollutants, due to either the upgrade of
technological installations or to the reduction of the production capacity by closing
productive divisions. In Teleorman there is a significant decrease in the ammonia emissions
from the processing industry (including those from the chemical industry). The Agencies for
Environmental Protection of Giurgiu and Călăraşi are monitoring the air quality through a
system purchased within the PHARE Project CBC RO/BG 1999 „Joint monitoring system for
the quality of air within the Romanian and Bulgarian boundary towns on the Lower Danube”
According to the Agency for Environmental Protection of Constanţa, there are rather
frequent excess indicators of sedimentable moulds, these being caused both by traffic-
generated pollution, industrial activities and operation of gross merchandise, as well as by
the desertification tendencies recorded in the area.
According to ESPON Atlas 2013, from 1990 to 2010 greenhouse gases have reduced by over
50% at the level of entire Romania, also recording substantial decreases in Bulgaria. In 2008,
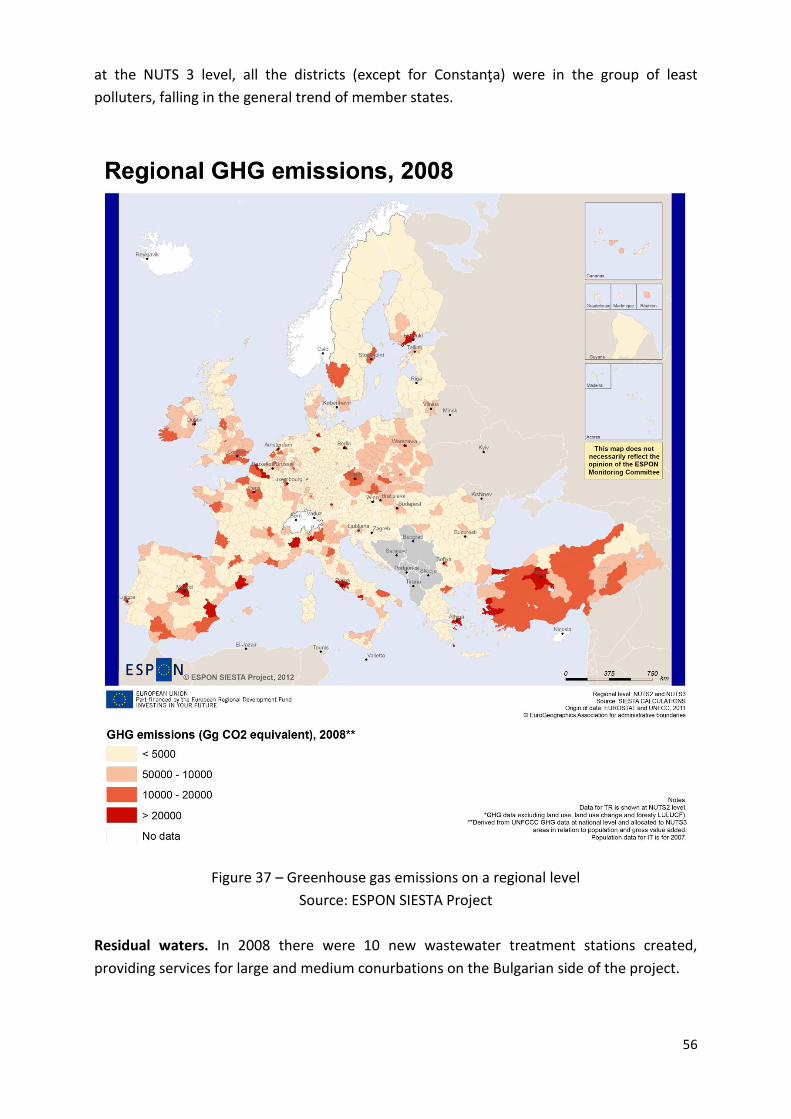
56
at the NUTS 3 level, all the districts (except for Constanţa) were in the group of least
polluters, falling in the general trend of member states.
Figure 37 – Greenhouse gas emissions on a regional level
Source: ESPON SIESTA Project
Residual waters. In 2008 there were 10 new wastewater treatment stations created,
providing services for large and medium conurbations on the Bulgarian side of the project.
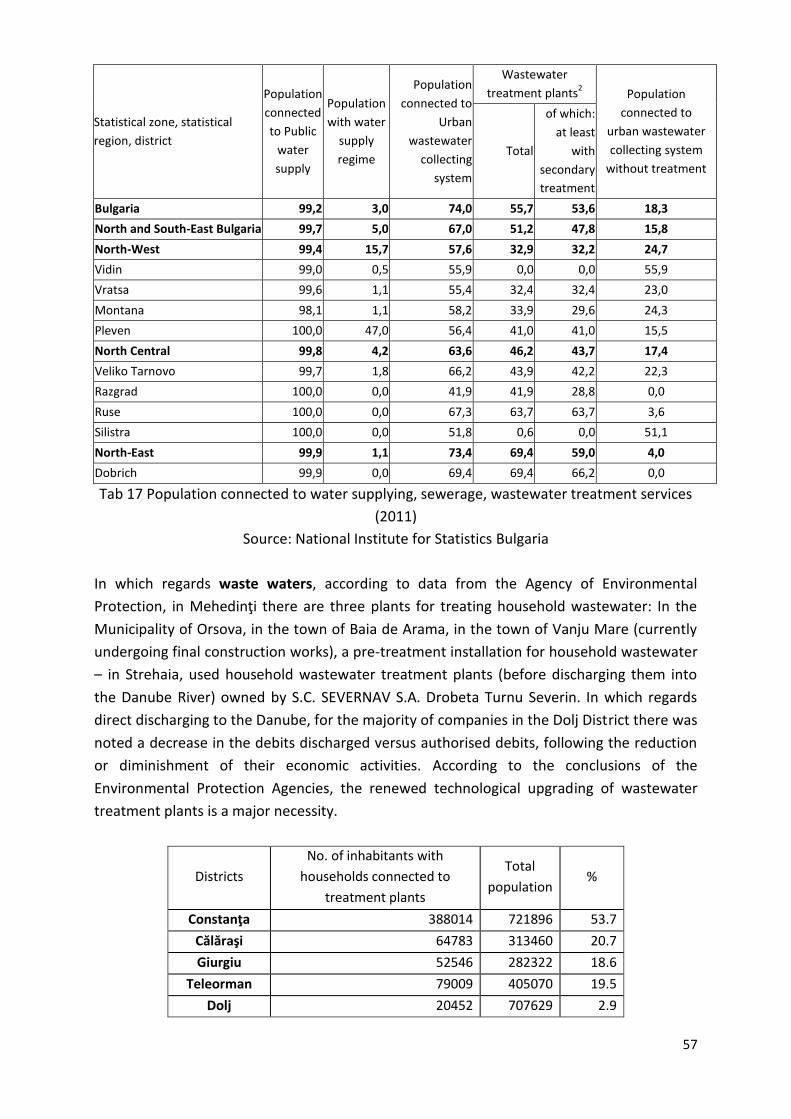
57
Statistical zone, statistical
region, district
Population
connected
to Public
water
supply
Population
with water
supply
regime
Population
connected to
Urban
wastewater
collecting
system
Wastewater
treatment plants2 Population
connected to
urban wastewater
collecting system
without treatment
Total
of which:
at least
with
secondary
treatment
Bulgaria 99,2 3,0 74,0 55,7 53,6 18,3
North and South-East Bulgaria 99,7 5,0 67,0 51,2 47,8 15,8
North-West 99,4 15,7 57,6 32,9 32,2 24,7
Vidin 99,0 0,5 55,9 0,0 0,0 55,9
Vratsa 99,6 1,1 55,4 32,4 32,4 23,0
Montana 98,1 1,1 58,2 33,9 29,6 24,3
Pleven 100,0 47,0 56,4 41,0 41,0 15,5
North Central 99,8 4,2 63,6 46,2 43,7 17,4
Veliko Tarnovo 99,7 1,8 66,2 43,9 42,2 22,3
Razgrad 100,0 0,0 41,9 41,9 28,8 0,0
Ruse 100,0 0,0 67,3 63,7 63,7 3,6
Silistra 100,0 0,0 51,8 0,6 0,0 51,1
North-East 99,9 1,1 73,4 69,4 59,0 4,0
Dobrich 99,9 0,0 69,4 69,4 66,2 0,0
Tab 17 Population connected to water supplying, sewerage, wastewater treatment services
(2011)
Source: National Institute for Statistics Bulgaria
In which regards waste waters, according to data from the Agency of Environmental
Protection, in Mehedinţi there are three plants for treating household wastewater: In the
Municipality of Orsova, in the town of Baia de Arama, in the town of Vanju Mare (currently
undergoing final construction works), a pre-treatment installation for household wastewater
– in Strehaia, used household wastewater treatment plants (before discharging them into
the Danube River) owned by S.C. SEVERNAV S.A. Drobeta Turnu Severin. In which regards
direct discharging to the Danube, for the majority of companies in the Dolj District there was
noted a decrease in the debits discharged versus authorised debits, following the reduction
or diminishment of their economic activities. According to the conclusions of the
Environmental Protection Agencies, the renewed technological upgrading of wastewater
treatment plants is a major necessity.
Districts
No. of inhabitants with
households connected to
treatment plants
Total
population %
Constanţa 388014 721896 53.7
Călăraşi 64783 313460 20.7
Giurgiu 52546 282322 18.6
Teleorman 79009 405070 19.5
Dolj 20452 707629 2.9
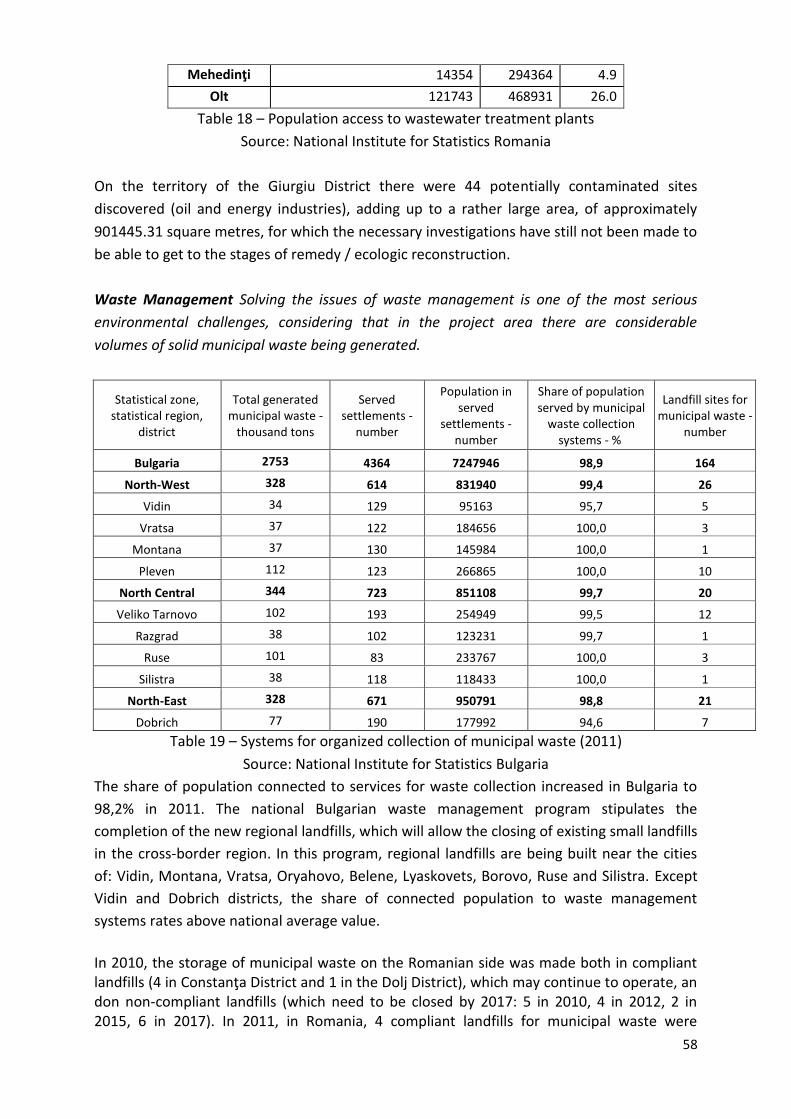
58
Mehedinţi 14354 294364 4.9
Olt 121743 468931 26.0
Table 18 – Population access to wastewater treatment plants
Source: National Institute for Statistics Romania
On the territory of the Giurgiu District there were 44 potentially contaminated sites
discovered (oil and energy industries), adding up to a rather large area, of approximately
901445.31 square metres, for which the necessary investigations have still not been made to
be able to get to the stages of remedy / ecologic reconstruction.
Waste Management Solving the issues of waste management is one of the most serious
environmental challenges, considering that in the project area there are considerable
volumes of solid municipal waste being generated.
Statistical zone, statistical region,
district
Total generated municipal waste -
thousand tons
Served settlements -
number
Population in served
settlements - number
Share of population served by municipal
waste collection systems - %
Landfill sites for municipal waste -
number
Bulgaria 2753 4364 7247946 98,9 164
North-West 328 614 831940 99,4 26
Vidin 34 129 95163 95,7 5
Vratsa 37 122 184656 100,0 3
Montana 37 130 145984 100,0 1
Pleven 112 123 266865 100,0 10
North Central 344 723 851108 99,7 20
Veliko Tarnovo 102 193 254949 99,5 12
Razgrad 38 102 123231 99,7 1
Ruse 101 83 233767 100,0 3
Silistra 38 118 118433 100,0 1
North-East 328 671 950791 98,8 21
Dobrich 77 190 177992 94,6 7
Table 19 – Systems for organized collection of municipal waste (2011)
Source: National Institute for Statistics Bulgaria
The share of population connected to services for waste collection increased in Bulgaria to
98,2% in 2011. The national Bulgarian waste management program stipulates the
completion of the new regional landfills, which will allow the closing of existing small landfills
in the cross-border region. In this program, regional landfills are being built near the cities
of: Vidin, Montana, Vratsa, Oryahovo, Belene, Lyaskovets, Borovo, Ruse and Silistra. Except
Vidin and Dobrich districts, the share of connected population to waste management
systems rates above national average value.
In 2010, the storage of municipal waste on the Romanian side was made both in compliant landfills (4 in Constanţa District and 1 in the Dolj District), which may continue to operate, an don non-compliant landfills (which need to be closed by 2017: 5 in 2010, 4 in 2012, 2 in 2015, 6 in 2017). In 2011, in Romania, 4 compliant landfills for municipal waste were
59
authorized, of which 2 in the districts of Teleorman and Mehedinţi. The population coverage with sanitation services varied in 2009 from 32% (Olt, Mehedinţi) and 81% (Constanţa). Services provided by sanitation companies are only marked as good and very good by 44% of the inhabitants of the cross-border region9. The population in the districts of Constanţa and Giurgiu are the happiest with these services (approx. 50%). (Natural and Anthropic) Risk Areas Natural Risk Floods (hydrologic risk). In a close relation to the Danube water system, the flooding degree sustains both the alluviation processes, and the water intake to the inland lacustrine basins. By ensuring a rhythmic refreshment of circulating water in an optimum circulation system, one provides the normal evolution of terrestrial and aquatic ecosystems. Complex studies carried out over the last decades have shown that flooding periods (of
fluctuating amplitude and duration) have always favoured the adequate development of
biotas, at the same time removing pollutants of various origins. The flooding process
corresponds, for sure, to the Danube levels increase phases.
The natural and anthropic causes of flooding are:
- varied terrain, with the possibility of channelling flows;
- lack of regulatory works (of collecting and evicting) flows from versants neighbouring
localities;
- lack of a drainage network for rain water and the insufficient existing one;
- lack of forestry plantations on non-permanent torrential formations, in their receiving basis and the lack of protective forested areas by the permanent water flows.
- failure to organize (regularize) and maintain water flows. The types of floods produced are:
- overflowing following the increase of river debits and debits of the Danube (the
districts of Brăila, Caraş -Severin, Giurgiu, Gorj, Ialomiţa, Ilfov, Mehedinţi, Olt,
Teleorman, Tulcea );
- flashy streams following short rains with high debits, present in the continental area
of the Delta (the districts of Caras-Severin, Constanţa, Olt, Tulcea).
Hydrotechnical works for flood prevention in Romania are obsolete, 70-80% of them having been built in the 70s and 80s. The highest level of the Danube in Romania and Bulgaria since 1895 was in 2006, with a record level of 9.4 m (30.8 ft) in the north-west of the Vidin city in Bulgaria. The districts of Mehedinţi, Dolj and Olt were severely affected. Damages continued in other villages as well as a result of landslides. 20 dams failed, tens of thousands of people were evicted, thousand of houses were flooded and over 50,000 hectares of arable land were destroyed. According to an ESPON report10, the average number of floods per year and per drainage basin (1985-2012) places the districts in the cross-border region in the high risk category, with the exception of the Dobrich district (moderate risk).
9 AGOS (EVOLUTION Project)
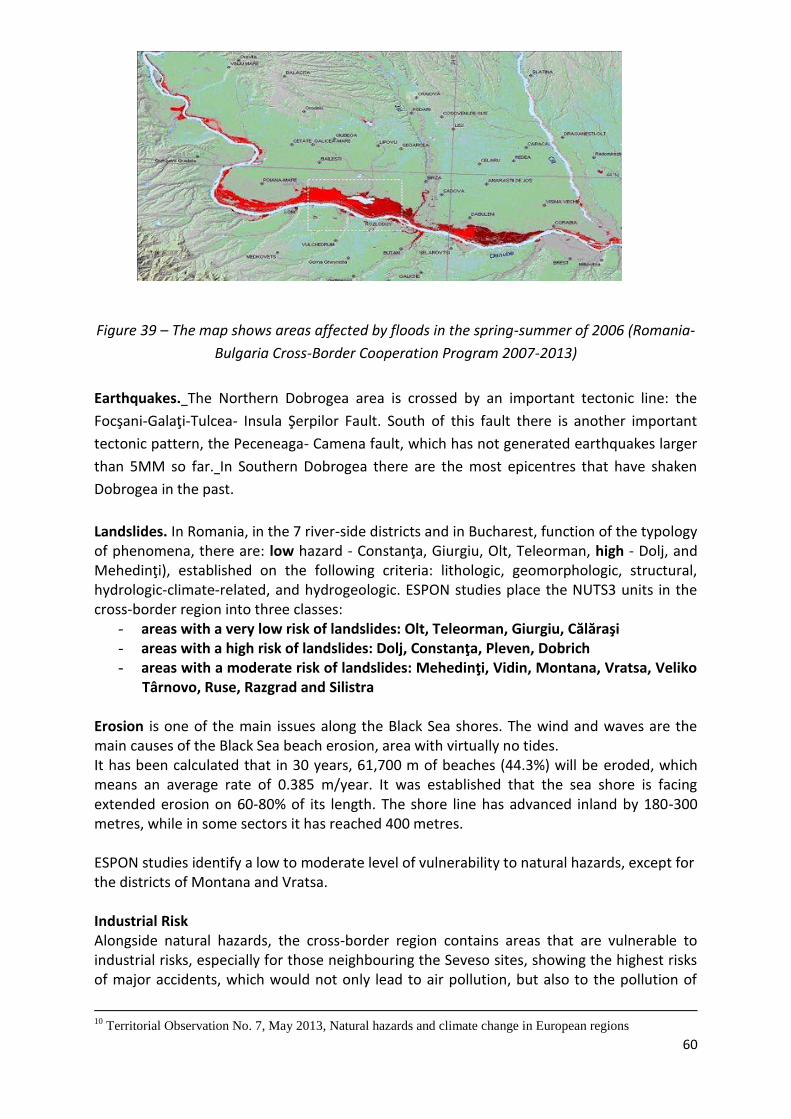
60
Figure 39 – The map shows areas affected by floods in the spring-summer of 2006 (Romania-
Bulgaria Cross-Border Cooperation Program 2007-2013)
Earthquakes. The Northern Dobrogea area is crossed by an important tectonic line: the
Focşani-Galaţi-Tulcea- Insula Şerpilor Fault. South of this fault there is another important
tectonic pattern, the Peceneaga- Camena fault, which has not generated earthquakes larger
than 5MM so far. In Southern Dobrogea there are the most epicentres that have shaken
Dobrogea in the past.
Landslides. In Romania, in the 7 river-side districts and in Bucharest, function of the typology of phenomena, there are: low hazard - Constanţa, Giurgiu, Olt, Teleorman, high - Dolj, and Mehedinţi), established on the following criteria: lithologic, geomorphologic, structural, hydrologic-climate-related, and hydrogeologic. ESPON studies place the NUTS3 units in the cross-border region into three classes:
- areas with a very low risk of landslides: Olt, Teleorman, Giurgiu, Călăraşi - areas with a high risk of landslides: Dolj, Constanţa, Pleven, Dobrich - areas with a moderate risk of landslides: Mehedinţi, Vidin, Montana, Vratsa, Veliko
Târnovo, Ruse, Razgrad and Silistra Erosion is one of the main issues along the Black Sea shores. The wind and waves are the main causes of the Black Sea beach erosion, area with virtually no tides. It has been calculated that in 30 years, 61,700 m of beaches (44.3%) will be eroded, which means an average rate of 0.385 m/year. It was established that the sea shore is facing extended erosion on 60-80% of its length. The shore line has advanced inland by 180-300 metres, while in some sectors it has reached 400 metres. ESPON studies identify a low to moderate level of vulnerability to natural hazards, except for the districts of Montana and Vratsa. Industrial Risk Alongside natural hazards, the cross-border region contains areas that are vulnerable to industrial risks, especially for those neighbouring the Seveso sites, showing the highest risks of major accidents, which would not only lead to air pollution, but also to the pollution of
10
Territorial Observation No. 7, May 2013, Natural hazards and climate change in European regions
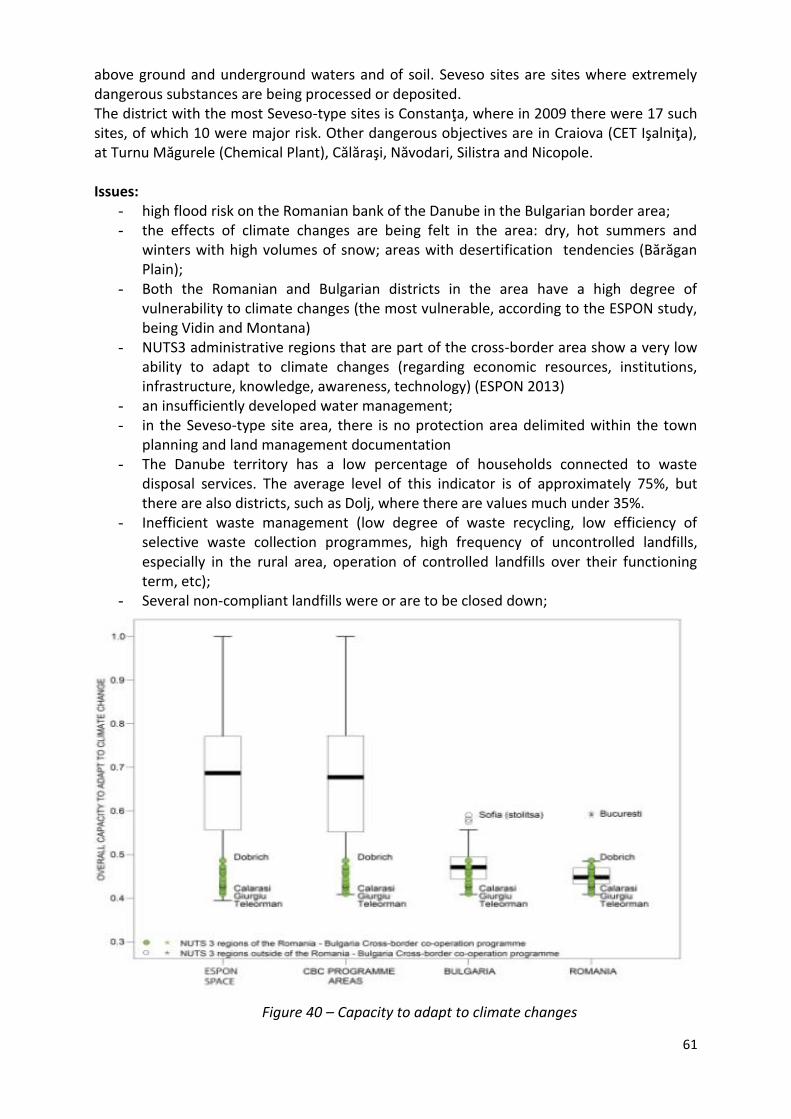
61
above ground and underground waters and of soil. Seveso sites are sites where extremely dangerous substances are being processed or deposited. The district with the most Seveso-type sites is Constanţa, where in 2009 there were 17 such sites, of which 10 were major risk. Other dangerous objectives are in Craiova (CET Işalniţa), at Turnu Măgurele (Chemical Plant), Călăraşi, Năvodari, Silistra and Nicopole. Issues:
- high flood risk on the Romanian bank of the Danube in the Bulgarian border area; - the effects of climate changes are being felt in the area: dry, hot summers and
winters with high volumes of snow; areas with desertification tendencies (Bărăgan Plain);
- Both the Romanian and Bulgarian districts in the area have a high degree of vulnerability to climate changes (the most vulnerable, according to the ESPON study, being Vidin and Montana)
- NUTS3 administrative regions that are part of the cross-border area show a very low ability to adapt to climate changes (regarding economic resources, institutions, infrastructure, knowledge, awareness, technology) (ESPON 2013)
- an insufficiently developed water management; - in the Seveso-type site area, there is no protection area delimited within the town
planning and land management documentation - The Danube territory has a low percentage of households connected to waste
disposal services. The average level of this indicator is of approximately 75%, but there are also districts, such as Dolj, where there are values much under 35%.
- Inefficient waste management (low degree of waste recycling, low efficiency of selective waste collection programmes, high frequency of uncontrolled landfills, especially in the rural area, operation of controlled landfills over their functioning term, etc);
- Several non-compliant landfills were or are to be closed down;
Figure 40 – Capacity to adapt to climate changes
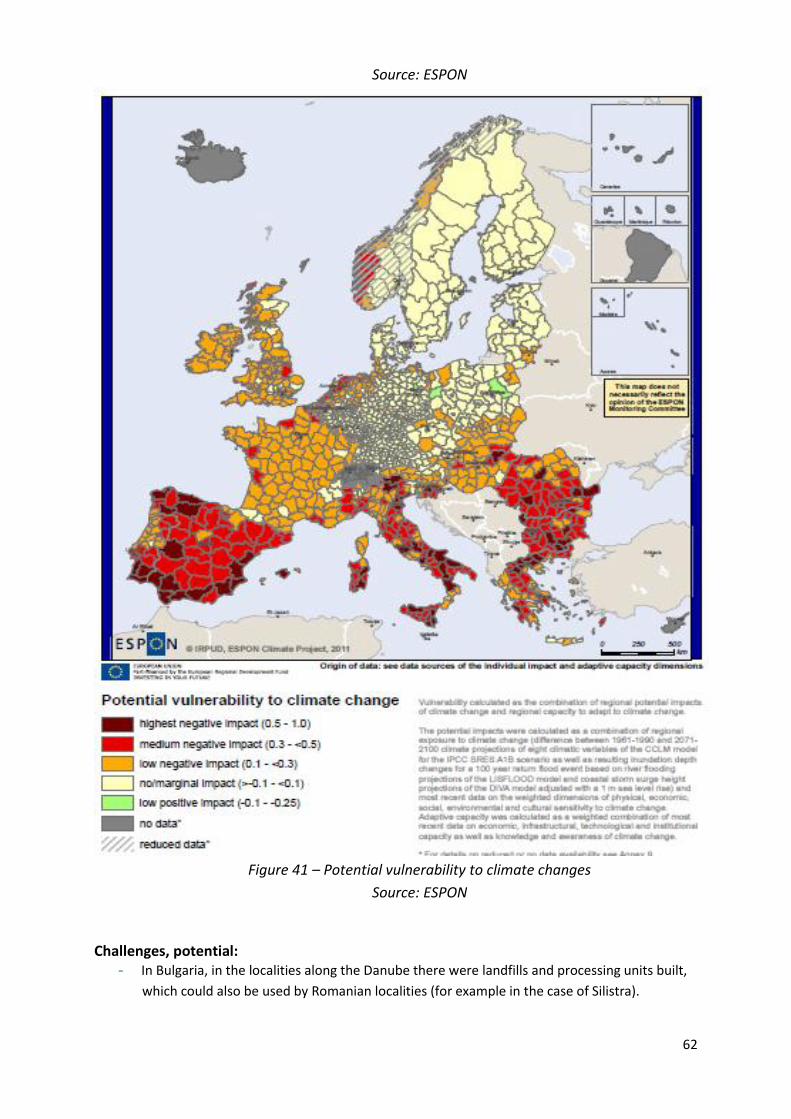
62
Source: ESPON
Figure 41 – Potential vulnerability to climate changes
Source: ESPON
Challenges, potential: - In Bulgaria, in the localities along the Danube there were landfills and processing units built,
which could also be used by Romanian localities (for example in the case of Silistra).
63
Development needs and priorities:
- Introducing new innovative technologies in order to improve the environment quality
- Evaluating settlements vulnerability to different categories of hazards
- Promoting projects for decreasing environmental vulnerability to natural and anthropic hazards (reforestation, land improving etc), including establishing some joint risk management structures (drawing / updating maps for regions / areas with high flood risk / their flood risk management plans)
- Improving equipments regarding environmental infrastructures (e.g. improving
performances of wastewater treatment)
- Ensuring the efficiency of the waste collection / landfilling / recycling process
- Increasing the accessibility of combined emergency (rescue) services in rural areas
- Raising awareness for commune environmental resources at the level of cross border
area).
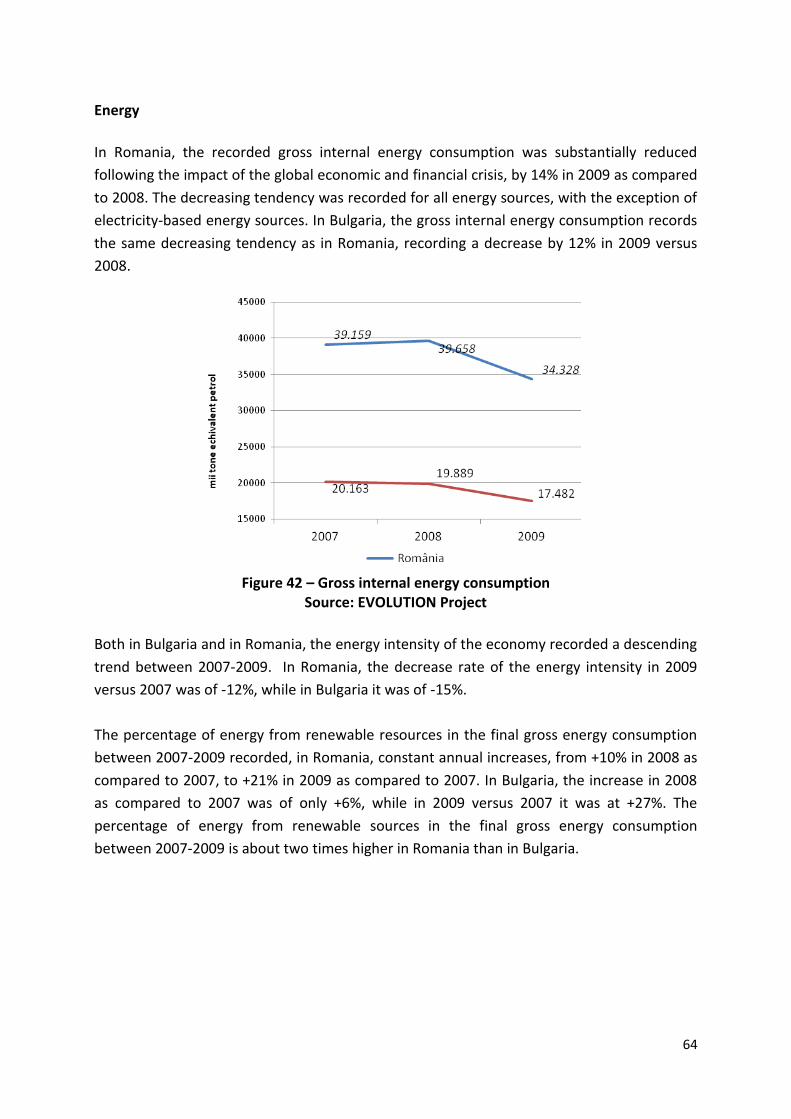
64
Energy
In Romania, the recorded gross internal energy consumption was substantially reduced
following the impact of the global economic and financial crisis, by 14% in 2009 as compared
to 2008. The decreasing tendency was recorded for all energy sources, with the exception of
electricity-based energy sources. In Bulgaria, the gross internal energy consumption records
the same decreasing tendency as in Romania, recording a decrease by 12% in 2009 versus
2008.
Figure 42 – Gross internal energy consumption
Source: EVOLUTION Project
Both in Bulgaria and in Romania, the energy intensity of the economy recorded a descending
trend between 2007-2009. In Romania, the decrease rate of the energy intensity in 2009
versus 2007 was of -12%, while in Bulgaria it was of -15%.
The percentage of energy from renewable resources in the final gross energy consumption
between 2007-2009 recorded, in Romania, constant annual increases, from +10% in 2008 as
compared to 2007, to +21% in 2009 as compared to 2007. In Bulgaria, the increase in 2008
as compared to 2007 was of only +6%, while in 2009 versus 2007 it was at +27%. The
percentage of energy from renewable sources in the final gross energy consumption
between 2007-2009 is about two times higher in Romania than in Bulgaria.
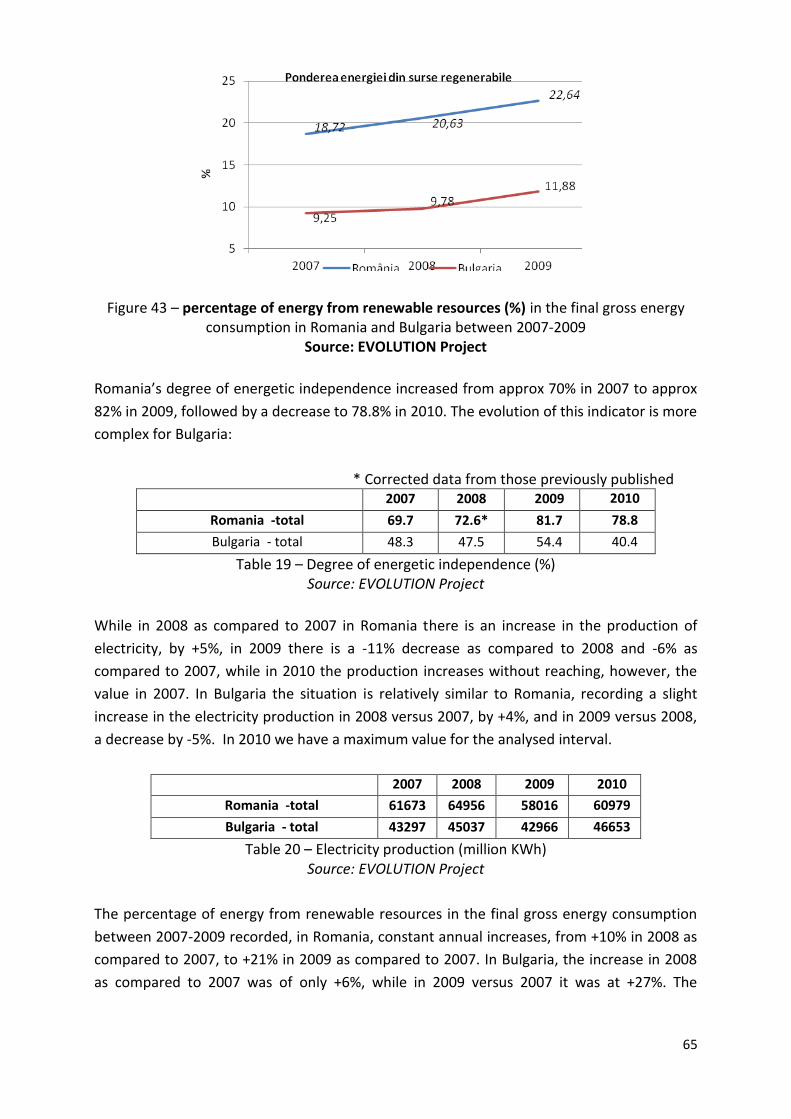
65
Figure 43 – percentage of energy from renewable resources (%) in the final gross energy consumption in Romania and Bulgaria between 2007-2009
Source: EVOLUTION Project
Romania’s degree of energetic independence increased from approx 70% in 2007 to approx
82% in 2009, followed by a decrease to 78.8% in 2010. The evolution of this indicator is more
complex for Bulgaria:
* Corrected data from those previously published 2007 2008 2009 2010
Romania -total 69.7 72.6* 81.7 78.8
Bulgaria - total 48.3 47.5 54.4 40.4
Table 19 – Degree of energetic independence (%) Source: EVOLUTION Project
While in 2008 as compared to 2007 in Romania there is an increase in the production of
electricity, by +5%, in 2009 there is a -11% decrease as compared to 2008 and -6% as
compared to 2007, while in 2010 the production increases without reaching, however, the
value in 2007. In Bulgaria the situation is relatively similar to Romania, recording a slight
increase in the electricity production in 2008 versus 2007, by +4%, and in 2009 versus 2008,
a decrease by -5%. In 2010 we have a maximum value for the analysed interval.
2007 2008 2009 2010
Romania -total 61673 64956 58016 60979
Bulgaria - total 43297 45037 42966 46653
Table 20 – Electricity production (million KWh) Source: EVOLUTION Project
The percentage of energy from renewable resources in the final gross energy consumption
between 2007-2009 recorded, in Romania, constant annual increases, from +10% in 2008 as
compared to 2007, to +21% in 2009 as compared to 2007. In Bulgaria, the increase in 2008
as compared to 2007 was of only +6%, while in 2009 versus 2007 it was at +27%. The
66
percentage of energy from renewable sources in the final gross energy consumption
between 2007-2009 is about two times higher in Romania than in Bulgaria.
2007 2008 2009 2010
Romania 18.72 20.63 22.64 23.4
Bulgaria 9.25 9.78 11.88 13.8
Table 20 – Percentage of energy from renewable resources (%) Source: EVOLUTION Project
Challenges:
- Between 2007-2010, the evolution of indicators in the energy field represents a
faithful mirror of the impact of the global economic crisis on the economies of the
two EU member states.
Development needs and priorities11
- Identifying opportunities regarding using local renewable energy resources
- Increasing security in terms of energy supplying.
6. Infrastructure and mobility The trans-European transport network (TEN-T) is part of the trans-European networks (TEN) and it consists of road, railway, waterway and air transport networks to service the entire European continent. These play a crucial role in providing freedom of movement for passengers and goods within the European Union, at the same time being a major factor in stimulating economic competitiveness and sustainable growth of the European Union, contributing to an increased economic and social cohesion. The development of the TEN-T implies the interconnection and interoperability of national transport networks, as well as easy access to them. The TEN-T network is structured on two layers, as follows:
The TEN-T core network, which will consist of the most important nodes and
connections in the EU, from a strategic and economic point of view, including all means of transportation. This will be set up until December 31st, 2030, the latest – it consists of the most strategically important sections of the TEN-T network (main traffic flows), as well as the sections with the highest added value on an European level: missing cross-border links (neighbouring links), main bottlenecks and multimodal nodes.
The TEN-T comprehensive network, which will provide accessibility to the core network, will link all the regions in the EU, will be multimodal and will offer a basic infrastructure for intermodal passenger and freight transportation. This will be set up until December 31st 2050 the latest – it comprises the basic TEN-T level, consisting of the existing and planned transportation infrastructure which will provide inter-connection of all regions and mobility for European citizens and companies.
11
The lack of some relevant spatially disaggregated indicators regarding the energy sector limits the drawing of
some factual priorities.
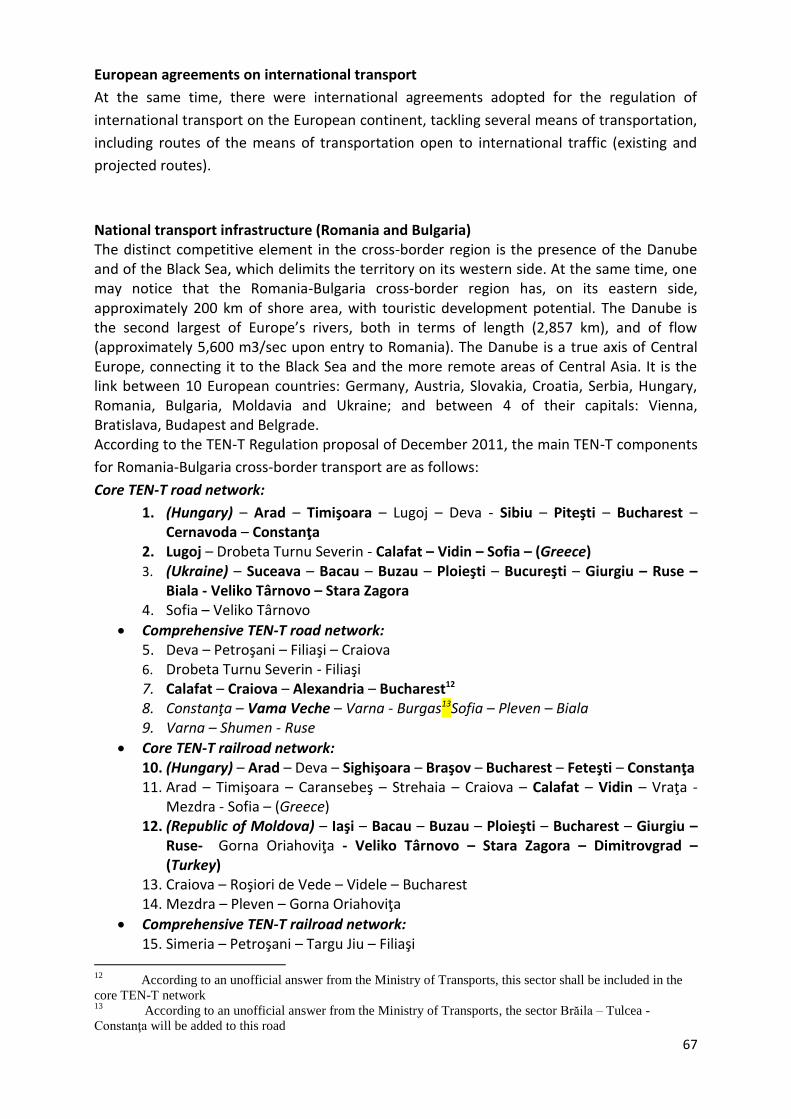
67
European agreements on international transport
At the same time, there were international agreements adopted for the regulation of
international transport on the European continent, tackling several means of transportation,
including routes of the means of transportation open to international traffic (existing and
projected routes).
National transport infrastructure (Romania and Bulgaria) The distinct competitive element in the cross-border region is the presence of the Danube and of the Black Sea, which delimits the territory on its western side. At the same time, one may notice that the Romania-Bulgaria cross-border region has, on its eastern side, approximately 200 km of shore area, with touristic development potential. The Danube is the second largest of Europe’s rivers, both in terms of length (2,857 km), and of flow (approximately 5,600 m3/sec upon entry to Romania). The Danube is a true axis of Central Europe, connecting it to the Black Sea and the more remote areas of Central Asia. It is the link between 10 European countries: Germany, Austria, Slovakia, Croatia, Serbia, Hungary, Romania, Bulgaria, Moldavia and Ukraine; and between 4 of their capitals: Vienna, Bratislava, Budapest and Belgrade. According to the TEN-T Regulation proposal of December 2011, the main TEN-T components
for Romania-Bulgaria cross-border transport are as follows:
Core TEN-T road network:
1. (Hungary) – Arad – Timişoara – Lugoj – Deva - Sibiu – Piteşti – Bucharest – Cernavoda – Constanţa
2. Lugoj – Drobeta Turnu Severin - Calafat – Vidin – Sofia – (Greece) 3. (Ukraine) – Suceava – Bacau – Buzau – Ploieşti – Bucureşti – Giurgiu – Ruse –
Biala - Veliko Târnovo – Stara Zagora 4. Sofia – Veliko Târnovo
Comprehensive TEN-T road network: 5. Deva – Petroşani – Filiaşi – Craiova 6. Drobeta Turnu Severin - Filiaşi 7. Calafat – Craiova – Alexandria – Bucharest12 8. Constanţa – Vama Veche – Varna - Burgas13Sofia – Pleven – Biala 9. Varna – Shumen - Ruse
Core TEN-T railroad network: 10. (Hungary) – Arad – Deva – Sighişoara – Braşov – Bucharest – Feteşti – Constanţa 11. Arad – Timişoara – Caransebeş – Strehaia – Craiova – Calafat – Vidin – Vraţa -
Mezdra - Sofia – (Greece) 12. (Republic of Moldova) – Iaşi – Bacau – Buzau – Ploieşti – Bucharest – Giurgiu –
Ruse- Gorna Oriahoviţa - Veliko Târnovo – Stara Zagora – Dimitrovgrad – (Turkey)
13. Craiova – Roşiori de Vede – Videle – Bucharest 14. Mezdra – Pleven – Gorna Oriahoviţa
Comprehensive TEN-T railroad network: 15. Simeria – Petroşani – Targu Jiu – Filiaşi
12
According to an unofficial answer from the Ministry of Transports, this sector shall be included in the
core TEN-T network 13
According to an unofficial answer from the Ministry of Transports, the sector Brăila – Tulcea -
Constanţa will be added to this road
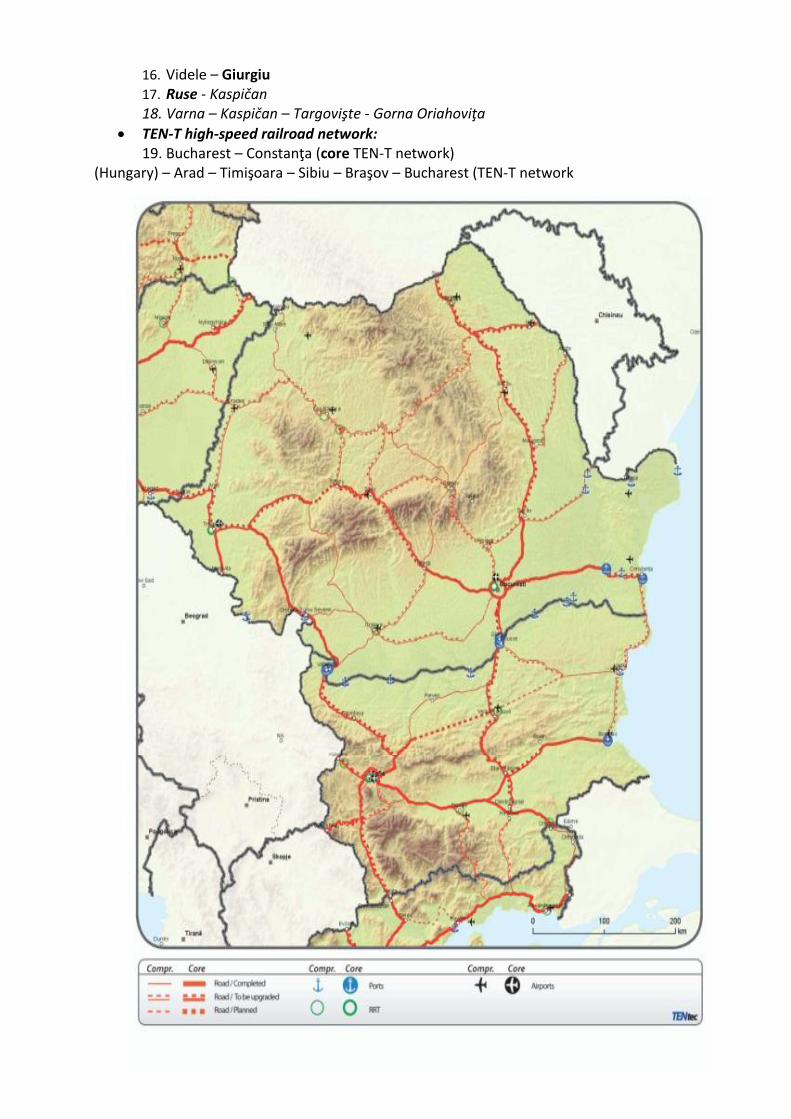
68
16. Videle – Giurgiu 17. Ruse - Kaspičan 18. Varna – Kaspičan – Targovişte - Gorna Oriahoviţa
TEN-T high-speed railroad network: 19. Bucharest – Constanţa (core TEN-T network)
(Hungary) – Arad – Timişoara – Sibiu – Braşov – Bucharest (TEN-T network
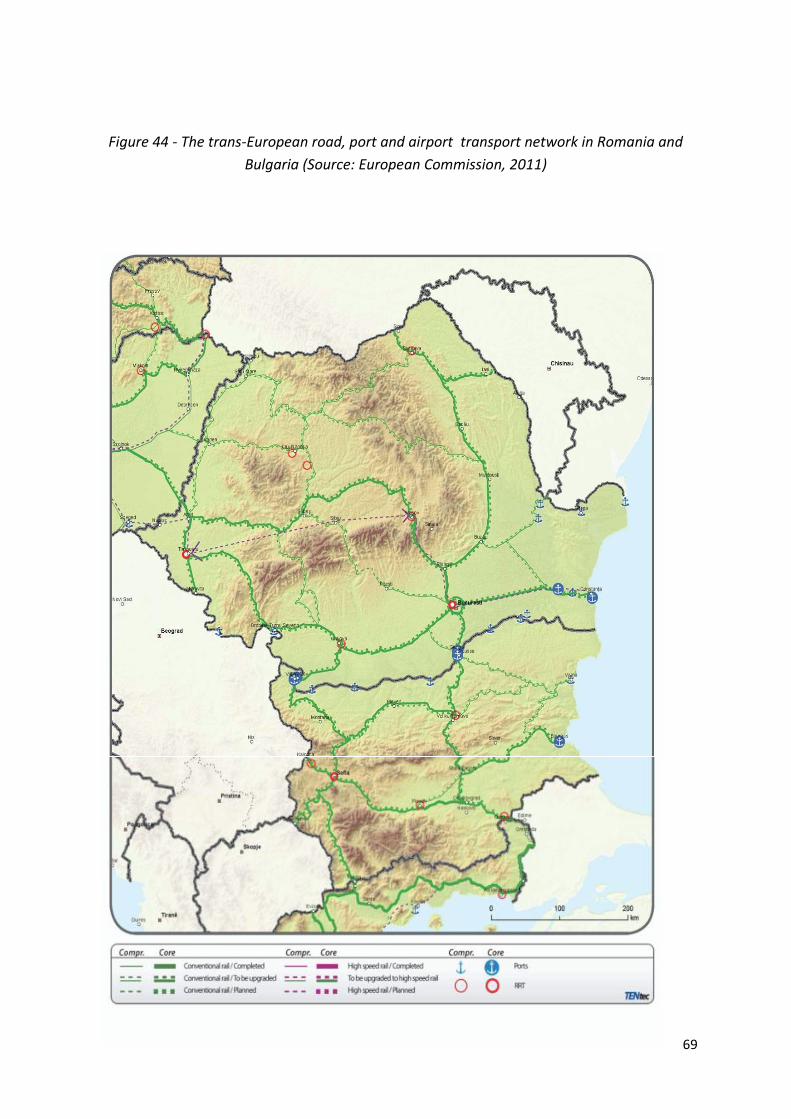
69
Figure 44 - The trans-European road, port and airport transport network in Romania and
Bulgaria (Source: European Commission, 2011)
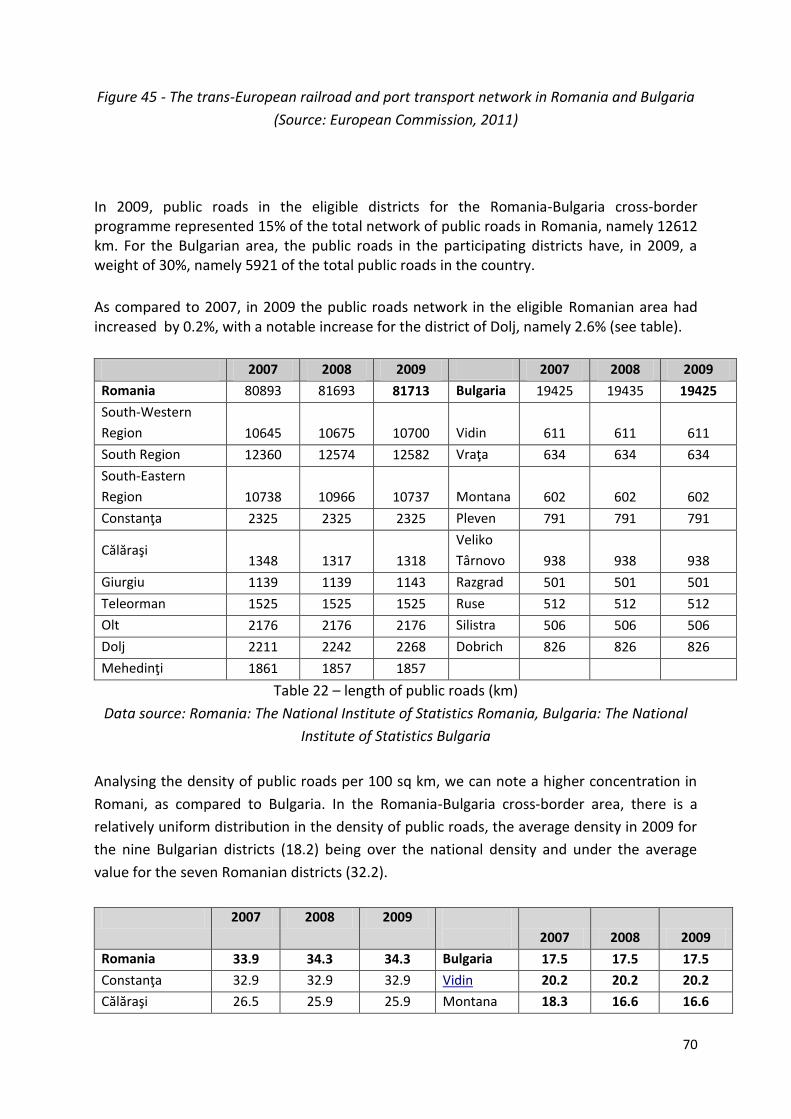
70
Figure 45 - The trans-European railroad and port transport network in Romania and Bulgaria
(Source: European Commission, 2011)
In 2009, public roads in the eligible districts for the Romania-Bulgaria cross-border programme represented 15% of the total network of public roads in Romania, namely 12612 km. For the Bulgarian area, the public roads in the participating districts have, in 2009, a weight of 30%, namely 5921 of the total public roads in the country.
As compared to 2007, in 2009 the public roads network in the eligible Romanian area had increased by 0.2%, with a notable increase for the district of Dolj, namely 2.6% (see table).
2007 2008 2009 2007 2008 2009
Romania 80893 81693 81713 Bulgaria 19425 19435 19425
South-Western
Region 10645 10675 10700 Vidin 611 611 611
South Region 12360 12574 12582 Vraţa 634 634 634
South-Eastern
Region 10738 10966 10737 Montana 602 602 602
Constanţa 2325 2325 2325 Pleven 791 791 791
Călăraşi 1348 1317 1318
Veliko
Târnovo 938 938 938
Giurgiu 1139 1139 1143 Razgrad 501 501 501
Teleorman 1525 1525 1525 Ruse 512 512 512
Olt 2176 2176 2176 Silistra 506 506 506
Dolj 2211 2242 2268 Dobrich 826 826 826
Mehedinţi 1861 1857 1857
Table 22 – length of public roads (km)
Data source: Romania: The National Institute of Statistics Romania, Bulgaria: The National
Institute of Statistics Bulgaria
Analysing the density of public roads per 100 sq km, we can note a higher concentration in
Romani, as compared to Bulgaria. In the Romania-Bulgaria cross-border area, there is a
relatively uniform distribution in the density of public roads, the average density in 2009 for
the nine Bulgarian districts (18.2) being over the national density and under the average
value for the seven Romanian districts (32.2).
2007 2008 2009
2007 2008 2009
Romania 33.9 34.3 34.3 Bulgaria 17.5 17.5 17.5
Constanţa 32.9 32.9 32.9 Vidin 20.2 20.2 20.2
Călăraşi 26.5 25.9 25.9 Montana 18.3 16.6 16.6
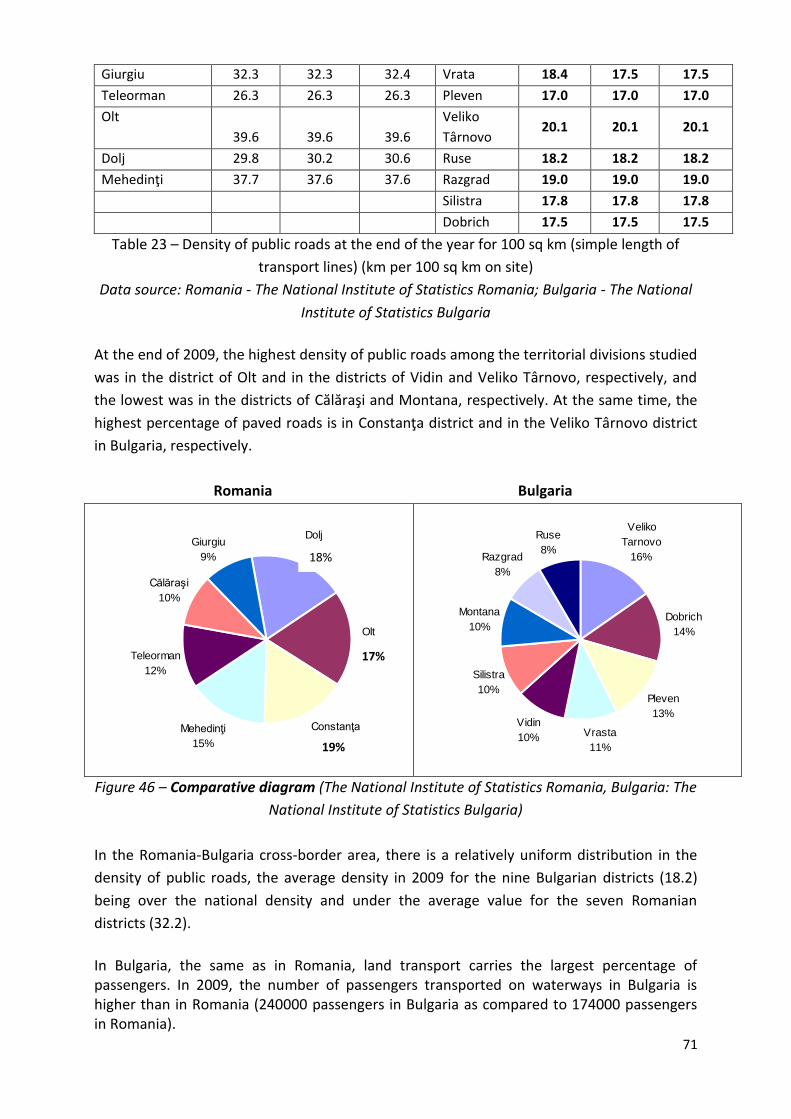
71
Giurgiu 32.3 32.3 32.4 Vrata 18.4 17.5 17.5
Teleorman 26.3 26.3 26.3 Pleven 17.0 17.0 17.0
Olt
39.6 39.6 39.6
Veliko
Târnovo 20.1 20.1 20.1
Dolj 29.8 30.2 30.6 Ruse 18.2 18.2 18.2
Mehedinţi 37.7 37.6 37.6 Razgrad 19.0 19.0 19.0
Silistra 17.8 17.8 17.8
Dobrich 17.5 17.5 17.5
Table 23 – Density of public roads at the end of the year for 100 sq km (simple length of
transport lines) (km per 100 sq km on site)
Data source: Romania - The National Institute of Statistics Romania; Bulgaria - The National
Institute of Statistics Bulgaria
At the end of 2009, the highest density of public roads among the territorial divisions studied
was in the district of Olt and in the districts of Vidin and Veliko Târnovo, respectively, and
the lowest was in the districts of Călăraşi and Montana, respectively. At the same time, the
highest percentage of paved roads is in Constanţa district and in the Veliko Târnovo district
in Bulgaria, respectively.
Romania Bulgaria
Dolj
20%
Olt
18%
Constanţa
16%
Mehedinţi
15%
Teleorman
12%
Călăraşi
10%
Giurgiu
9%
Veliko
Tarnovo
16%
Dobrich
14%
Pleven
13%
Vrasta
11%
Vidin
10%
Silistra
10%
Montana
10%
Razgrad
8%
Ruse
8%
Figure 46 – Comparative diagram (The National Institute of Statistics Romania, Bulgaria: The
National Institute of Statistics Bulgaria)
In the Romania-Bulgaria cross-border area, there is a relatively uniform distribution in the
density of public roads, the average density in 2009 for the nine Bulgarian districts (18.2)
being over the national density and under the average value for the seven Romanian
districts (32.2).
In Bulgaria, the same as in Romania, land transport carries the largest percentage of passengers. In 2009, the number of passengers transported on waterways in Bulgaria is higher than in Romania (240000 passengers in Bulgaria as compared to 174000 passengers in Romania).
18%
17%
19%
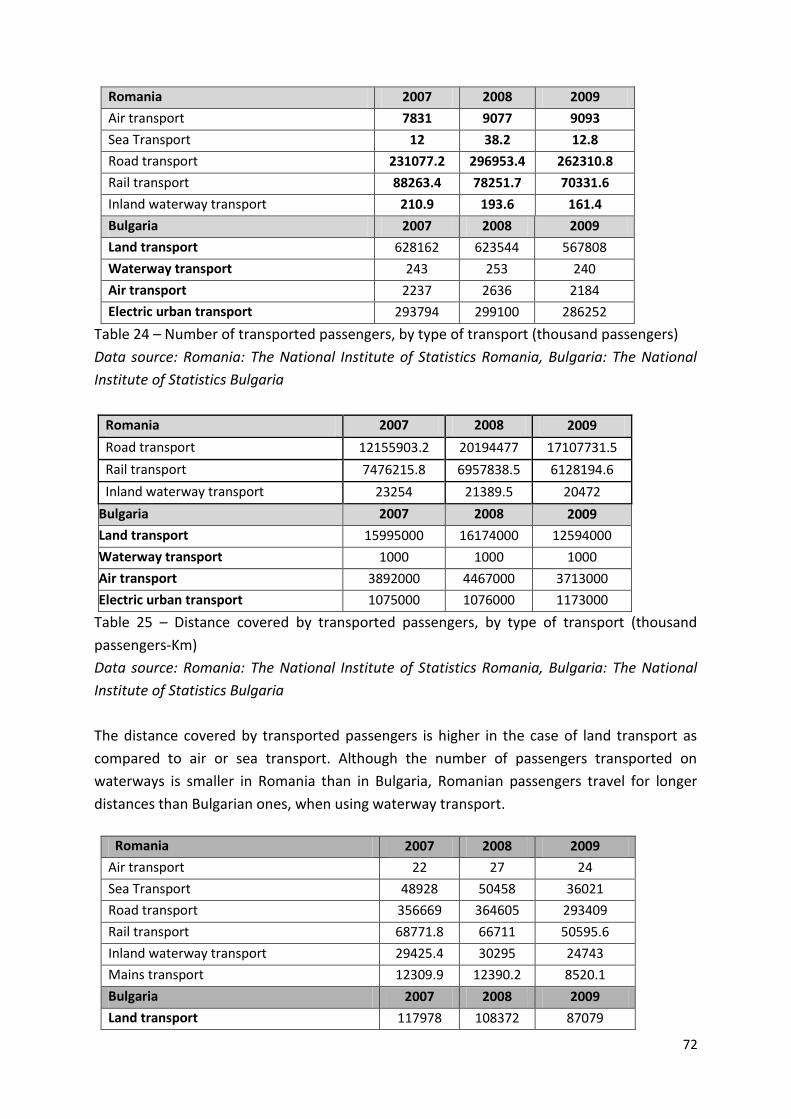
72
Romania 2007 2008 2009
Air transport 7831 9077 9093
Sea Transport 12 38.2 12.8
Road transport 231077.2 296953.4 262310.8
Rail transport 88263.4 78251.7 70331.6
Inland waterway transport 210.9 193.6 161.4
Bulgaria 2007 2008 2009
Land transport 628162 623544 567808
Waterway transport 243 253 240
Air transport 2237 2636 2184
Electric urban transport 293794 299100 286252
Table 24 – Number of transported passengers, by type of transport (thousand passengers)
Data source: Romania: The National Institute of Statistics Romania, Bulgaria: The National
Institute of Statistics Bulgaria
Romania 2007 2008 2009
Road transport 12155903.2 20194477 17107731.5
Rail transport 7476215.8 6957838.5 6128194.6
Inland waterway transport 23254 21389.5 20472
Bulgaria 2007 2008 2009
Land transport 15995000 16174000 12594000
Waterway transport 1000 1000 1000
Air transport 3892000 4467000 3713000
Electric urban transport 1075000 1076000 1173000
Table 25 – Distance covered by transported passengers, by type of transport (thousand
passengers-Km)
Data source: Romania: The National Institute of Statistics Romania, Bulgaria: The National
Institute of Statistics Bulgaria
The distance covered by transported passengers is higher in the case of land transport as
compared to air or sea transport. Although the number of passengers transported on
waterways is smaller in Romania than in Bulgaria, Romanian passengers travel for longer
distances than Bulgarian ones, when using waterway transport.
Romania 2007 2008 2009
Air transport 22 27 24
Sea Transport 48928 50458 36021
Road transport 356669 364605 293409
Rail transport 68771.8 66711 50595.6
Inland waterway transport 29425.4 30295 24743
Mains transport 12309.9 12390.2 8520.1
Bulgaria 2007 2008 2009
Land transport 117978 108372 87079
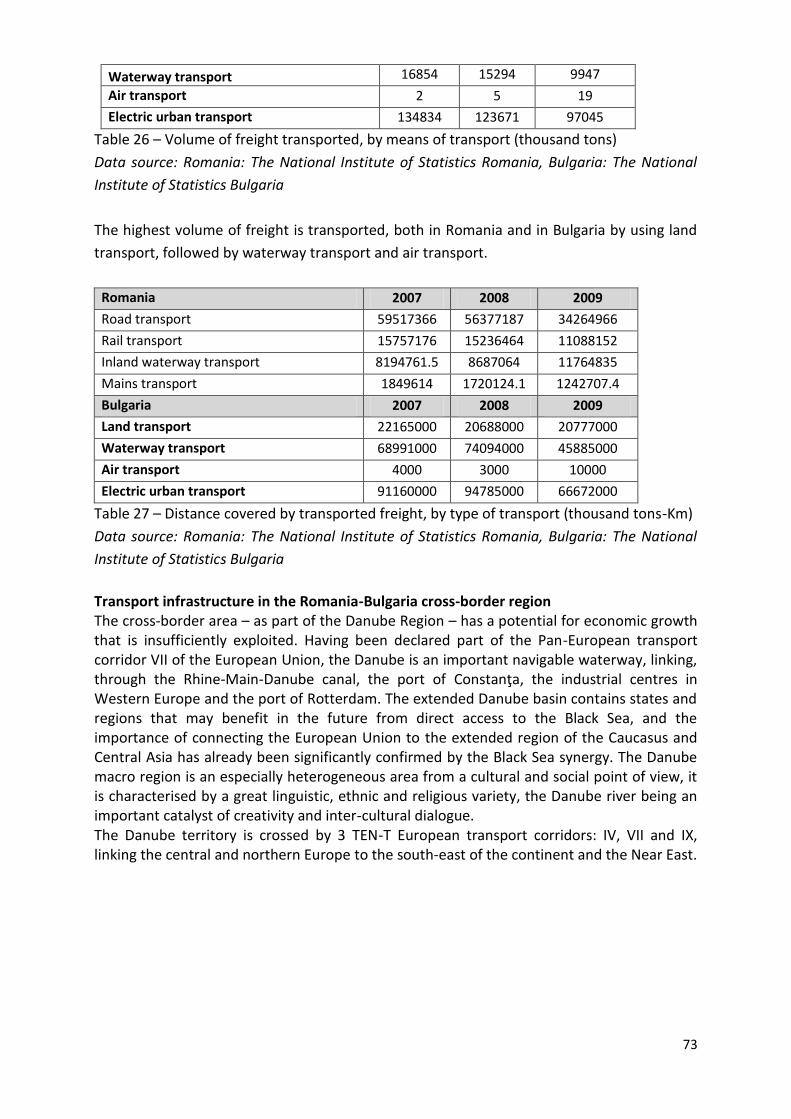
73
Waterway transport 16854 15294 9947
Air transport 2 5 19
Electric urban transport 134834 123671 97045
Table 26 – Volume of freight transported, by means of transport (thousand tons)
Data source: Romania: The National Institute of Statistics Romania, Bulgaria: The National
Institute of Statistics Bulgaria
The highest volume of freight is transported, both in Romania and in Bulgaria by using land
transport, followed by waterway transport and air transport.
Romania 2007 2008 2009
Road transport 59517366 56377187 34264966
Rail transport 15757176 15236464 11088152
Inland waterway transport 8194761.5 8687064 11764835
Mains transport 1849614 1720124.1 1242707.4
Bulgaria 2007 2008 2009
Land transport 22165000 20688000 20777000
Waterway transport 68991000 74094000 45885000
Air transport 4000 3000 10000
Electric urban transport 91160000 94785000 66672000
Table 27 – Distance covered by transported freight, by type of transport (thousand tons-Km)
Data source: Romania: The National Institute of Statistics Romania, Bulgaria: The National
Institute of Statistics Bulgaria
Transport infrastructure in the Romania-Bulgaria cross-border region The cross-border area – as part of the Danube Region – has a potential for economic growth that is insufficiently exploited. Having been declared part of the Pan-European transport corridor VII of the European Union, the Danube is an important navigable waterway, linking, through the Rhine-Main-Danube canal, the port of Constanţa, the industrial centres in Western Europe and the port of Rotterdam. The extended Danube basin contains states and regions that may benefit in the future from direct access to the Black Sea, and the importance of connecting the European Union to the extended region of the Caucasus and Central Asia has already been significantly confirmed by the Black Sea synergy. The Danube macro region is an especially heterogeneous area from a cultural and social point of view, it is characterised by a great linguistic, ethnic and religious variety, the Danube river being an important catalyst of creativity and inter-cultural dialogue. The Danube territory is crossed by 3 TEN-T European transport corridors: IV, VII and IX, linking the central and northern Europe to the south-east of the continent and the Near East.
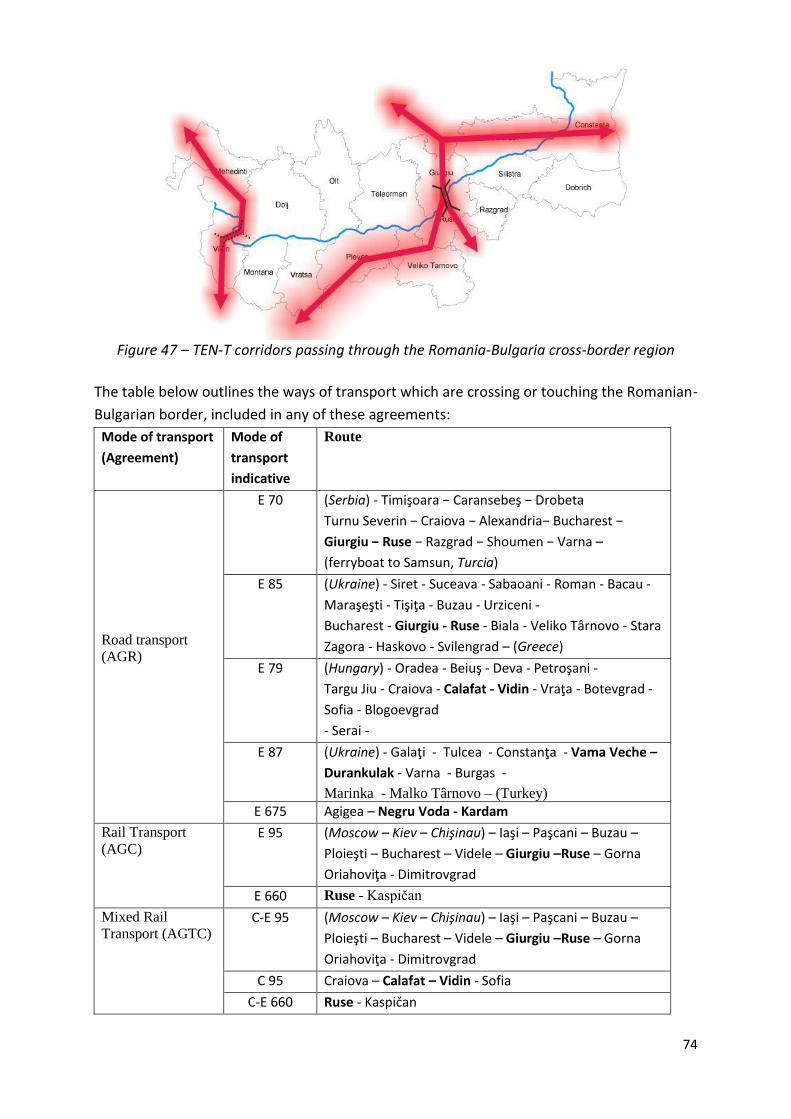
74
Figure 47 – TEN-T corridors passing through the Romania-Bulgaria cross-border region
The table below outlines the ways of transport which are crossing or touching the Romanian-
Bulgarian border, included in any of these agreements:
Mode of transport
(Agreement)
Mode of
transport
indicative
Route
Road transport
(AGR)
E 70 (Serbia) - Timişoara − Caransebeş − Drobeta
Turnu Severin − Craiova − Alexandria− Bucharest −
Giurgiu − Ruse − Razgrad − Shoumen − Varna –
(ferryboat to Samsun, Turcia)
E 85 (Ukraine) - Siret - Suceava - Sabaoani - Roman - Bacau -
Maraşeşti - Tişiţa - Buzau - Urziceni -
Bucharest - Giurgiu - Ruse - Biala - Veliko Târnovo - Stara
Zagora - Haskovo - Svilengrad – (Greece)
E 79 (Hungary) - Oradea - Beiuş - Deva - Petroşani -
Targu Jiu - Craiova - Calafat - Vidin - Vraţa - Botevgrad -
Sofia - Blogoevgrad
- Serai -
E 87 (Ukraine) - Galaţi - Tulcea - Constanţa - Vama Veche –
Durankulak - Varna - Burgas -
Marinka - Malko Târnovo – (Turkey) E 675 Agigea – Negru Voda - Kardam
Rail Transport
(AGC) E 95 (Moscow – Kiev – Chişinau) – Iaşi – Paşcani – Buzau –
Ploieşti – Bucharest – Videle – Giurgiu –Ruse – Gorna
Oriahoviţa - Dimitrovgrad
E 660 Ruse - Kaspičan
Mixed Rail
Transport (AGTC) C-E 95 (Moscow – Kiev – Chişinau) – Iaşi – Paşcani – Buzau –
Ploieşti – Bucharest – Videle – Giurgiu –Ruse – Gorna
Oriahoviţa - Dimitrovgrad
C 95 Craiova – Calafat – Vidin - Sofia
C-E 660 Ruse - Kaspičan
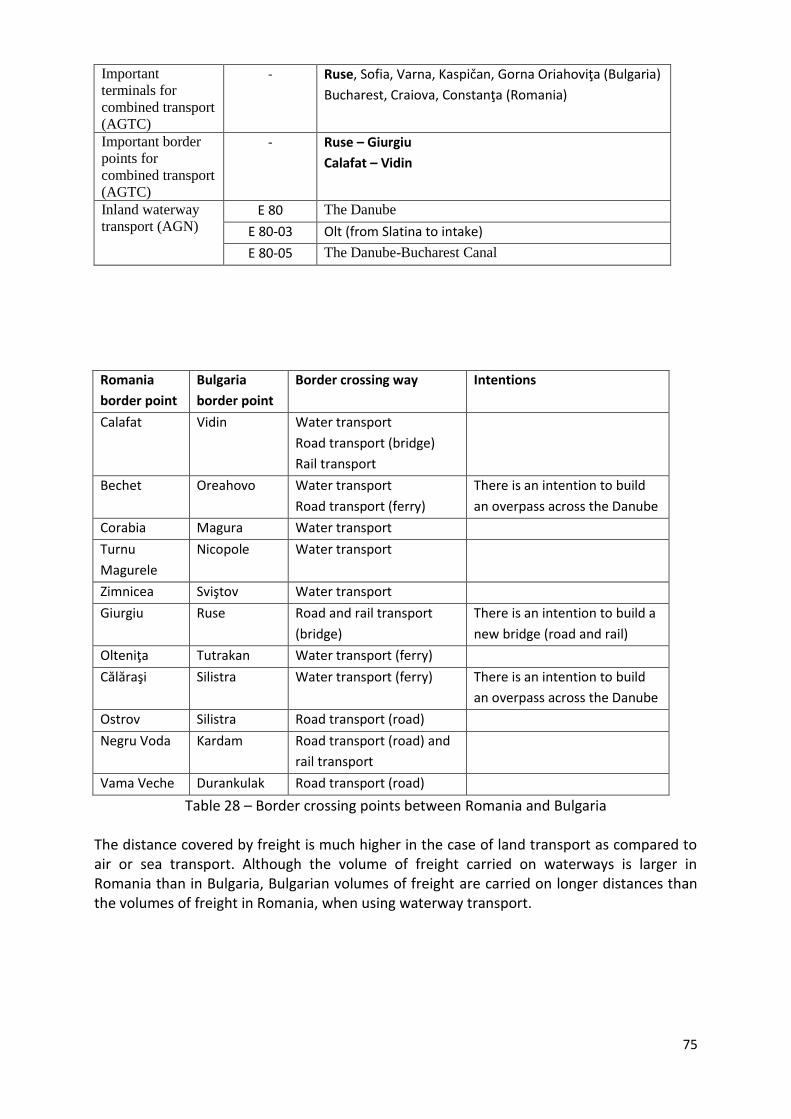
75
Important
terminals for
combined transport
(AGTC)
- Ruse, Sofia, Varna, Kaspičan, Gorna Oriahoviţa (Bulgaria)
Bucharest, Craiova, Constanţa (Romania)
Important border
points for
combined transport
(AGTC)
- Ruse – Giurgiu
Calafat – Vidin
Inland waterway
transport (AGN) E 80 The Danube
E 80-03 Olt (from Slatina to intake)
E 80-05 The Danube-Bucharest Canal
Romania
border point
Bulgaria
border point
Border crossing way Intentions
Calafat Vidin Water transport
Road transport (bridge)
Rail transport
Bechet Oreahovo Water transport
Road transport (ferry)
There is an intention to build
an overpass across the Danube
Corabia Magura Water transport
Turnu
Magurele
Nicopole Water transport
Zimnicea Sviştov Water transport
Giurgiu Ruse Road and rail transport
(bridge)
There is an intention to build a
new bridge (road and rail)
Olteniţa Tutrakan Water transport (ferry)
Călăraşi
Silistra Water transport (ferry) There is an intention to build
an overpass across the Danube
Ostrov Silistra Road transport (road)
Negru Voda Kardam Road transport (road) and
rail transport
Vama Veche Durankulak Road transport (road)
Table 28 – Border crossing points between Romania and Bulgaria The distance covered by freight is much higher in the case of land transport as compared to air or sea transport. Although the volume of freight carried on waterways is larger in Romania than in Bulgaria, Bulgarian volumes of freight are carried on longer distances than the volumes of freight in Romania, when using waterway transport.
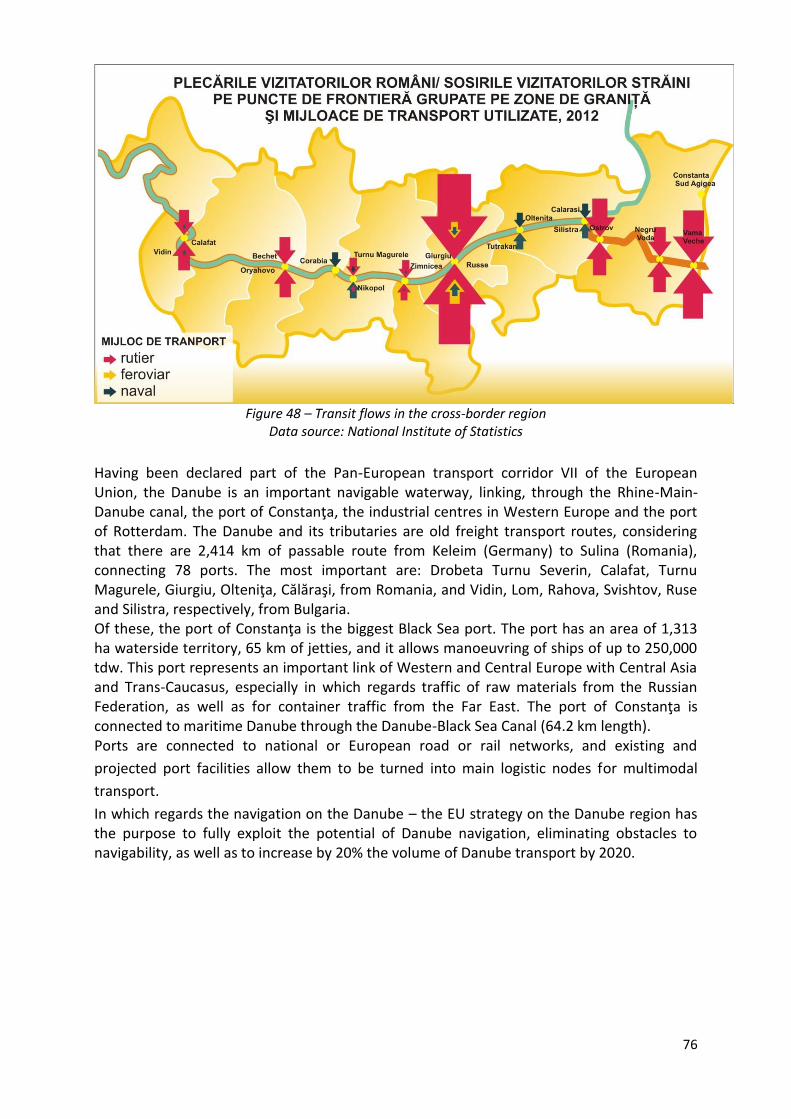
76
Figure 48 – Transit flows in the cross-border region
Data source: National Institute of Statistics
Having been declared part of the Pan-European transport corridor VII of the European Union, the Danube is an important navigable waterway, linking, through the Rhine-Main-Danube canal, the port of Constanţa, the industrial centres in Western Europe and the port of Rotterdam. The Danube and its tributaries are old freight transport routes, considering that there are 2,414 km of passable route from Keleim (Germany) to Sulina (Romania), connecting 78 ports. The most important are: Drobeta Turnu Severin, Calafat, Turnu Magurele, Giurgiu, Olteniţa, Călăraşi, from Romania, and Vidin, Lom, Rahova, Svishtov, Ruse and Silistra, respectively, from Bulgaria. Of these, the port of Constanţa is the biggest Black Sea port. The port has an area of 1,313 ha waterside territory, 65 km of jetties, and it allows manoeuvring of ships of up to 250,000 tdw. This port represents an important link of Western and Central Europe with Central Asia and Trans-Caucasus, especially in which regards traffic of raw materials from the Russian Federation, as well as for container traffic from the Far East. The port of Constanţa is connected to maritime Danube through the Danube-Black Sea Canal (64.2 km length). Ports are connected to national or European road or rail networks, and existing and
projected port facilities allow them to be turned into main logistic nodes for multimodal
transport.
In which regards the navigation on the Danube – the EU strategy on the Danube region has the purpose to fully exploit the potential of Danube navigation, eliminating obstacles to navigability, as well as to increase by 20% the volume of Danube transport by 2020.
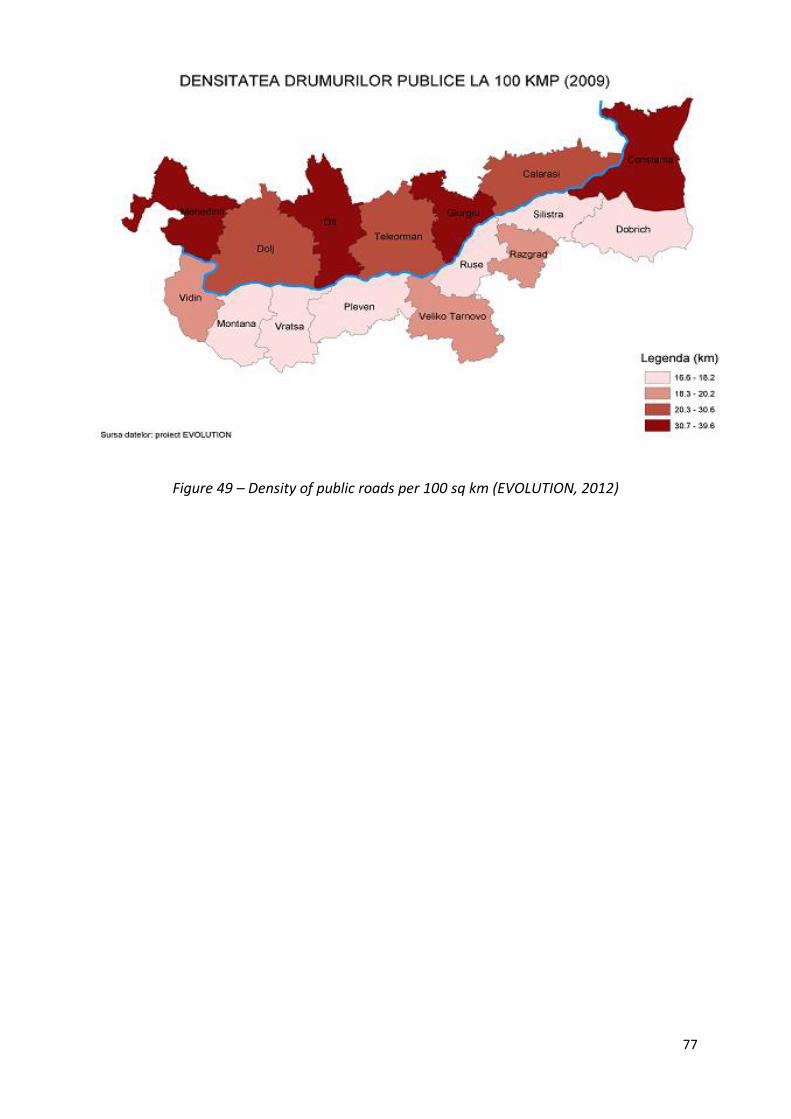
77
Figure 49 – Density of public roads per 100 sq km (EVOLUTION, 2012)
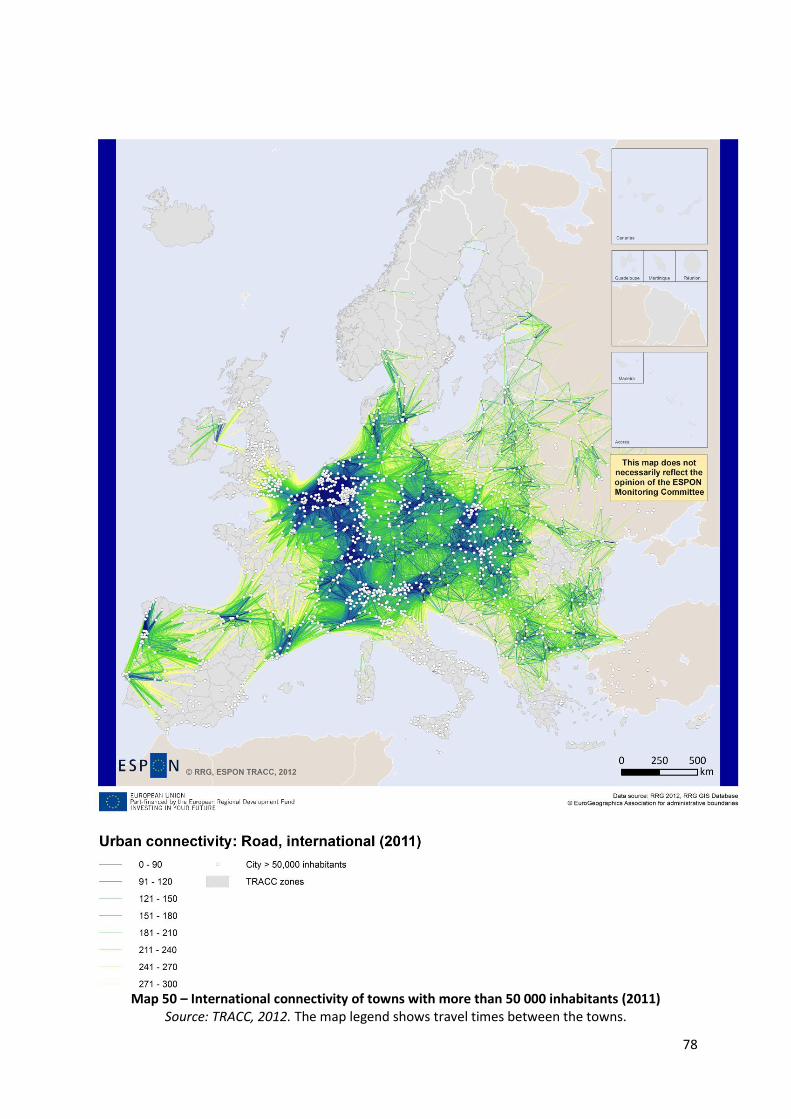
78
Map 50 – International connectivity of towns with more than 50 000 inhabitants (2011) Source: TRACC, 2012. The map legend shows travel times between the towns.
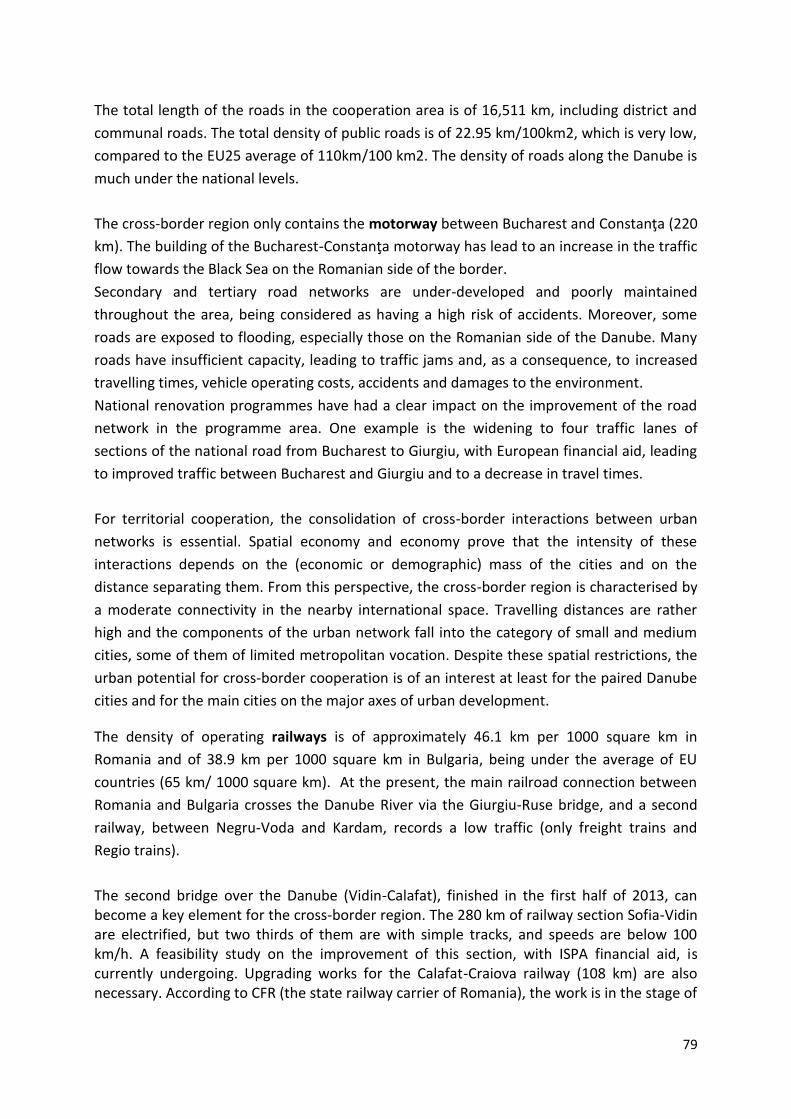
79
The total length of the roads in the cooperation area is of 16,511 km, including district and
communal roads. The total density of public roads is of 22.95 km/100km2, which is very low,
compared to the EU25 average of 110km/100 km2. The density of roads along the Danube is
much under the national levels.
The cross-border region only contains the motorway between Bucharest and Constanţa (220
km). The building of the Bucharest-Constanţa motorway has lead to an increase in the traffic
flow towards the Black Sea on the Romanian side of the border.
Secondary and tertiary road networks are under-developed and poorly maintained
throughout the area, being considered as having a high risk of accidents. Moreover, some
roads are exposed to flooding, especially those on the Romanian side of the Danube. Many
roads have insufficient capacity, leading to traffic jams and, as a consequence, to increased
travelling times, vehicle operating costs, accidents and damages to the environment.
National renovation programmes have had a clear impact on the improvement of the road
network in the programme area. One example is the widening to four traffic lanes of
sections of the national road from Bucharest to Giurgiu, with European financial aid, leading
to improved traffic between Bucharest and Giurgiu and to a decrease in travel times.
For territorial cooperation, the consolidation of cross-border interactions between urban
networks is essential. Spatial economy and economy prove that the intensity of these
interactions depends on the (economic or demographic) mass of the cities and on the
distance separating them. From this perspective, the cross-border region is characterised by
a moderate connectivity in the nearby international space. Travelling distances are rather
high and the components of the urban network fall into the category of small and medium
cities, some of them of limited metropolitan vocation. Despite these spatial restrictions, the
urban potential for cross-border cooperation is of an interest at least for the paired Danube
cities and for the main cities on the major axes of urban development.
The density of operating railways is of approximately 46.1 km per 1000 square km in
Romania and of 38.9 km per 1000 square km in Bulgaria, being under the average of EU
countries (65 km/ 1000 square km). At the present, the main railroad connection between
Romania and Bulgaria crosses the Danube River via the Giurgiu-Ruse bridge, and a second
railway, between Negru-Voda and Kardam, records a low traffic (only freight trains and
Regio trains).
The second bridge over the Danube (Vidin-Calafat), finished in the first half of 2013, can become a key element for the cross-border region. The 280 km of railway section Sofia-Vidin are electrified, but two thirds of them are with simple tracks, and speeds are below 100 km/h. A feasibility study on the improvement of this section, with ISPA financial aid, is currently undergoing. Upgrading works for the Calafat-Craiova railway (108 km) are also necessary. According to CFR (the state railway carrier of Romania), the work is in the stage of
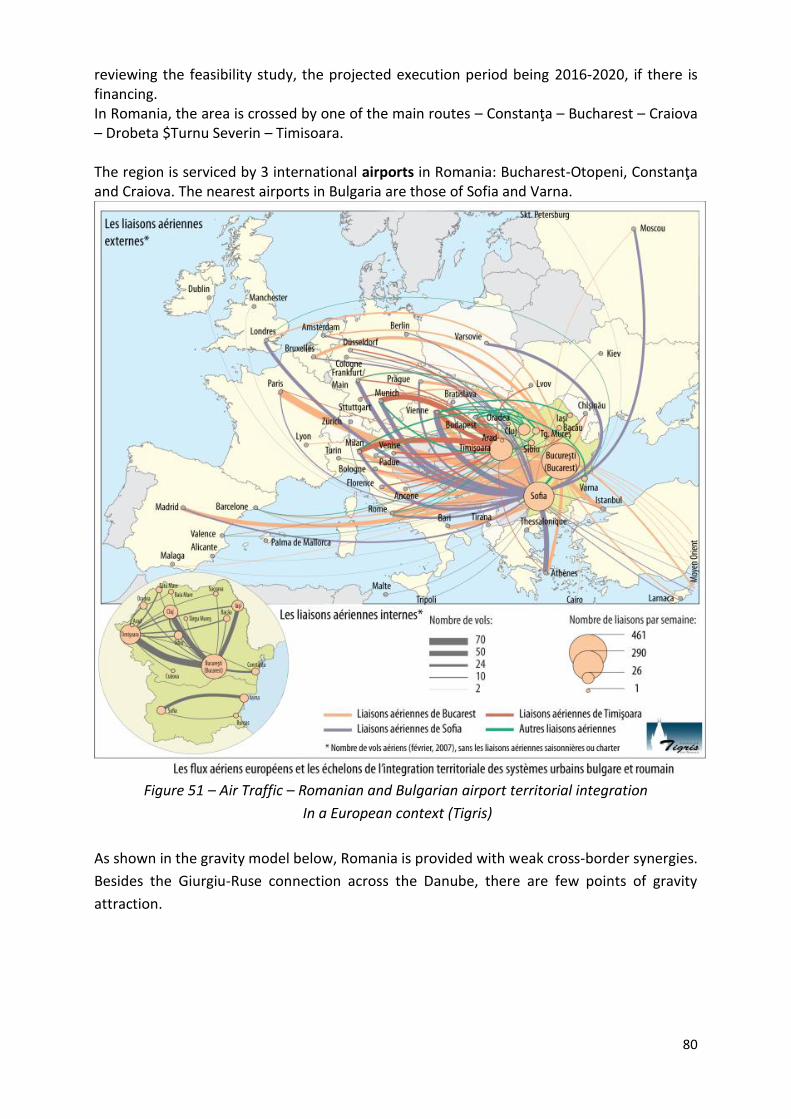
80
reviewing the feasibility study, the projected execution period being 2016-2020, if there is financing. In Romania, the area is crossed by one of the main routes – Constanţa – Bucharest – Craiova – Drobeta $Turnu Severin – Timisoara. The region is serviced by 3 international airports in Romania: Bucharest-Otopeni, Constanţa and Craiova. The nearest airports in Bulgaria are those of Sofia and Varna.
Figure 51 – Air Traffic – Romanian and Bulgarian airport territorial integration
In a European context (Tigris)
As shown in the gravity model below, Romania is provided with weak cross-border synergies.
Besides the Giurgiu-Ruse connection across the Danube, there are few points of gravity
attraction.
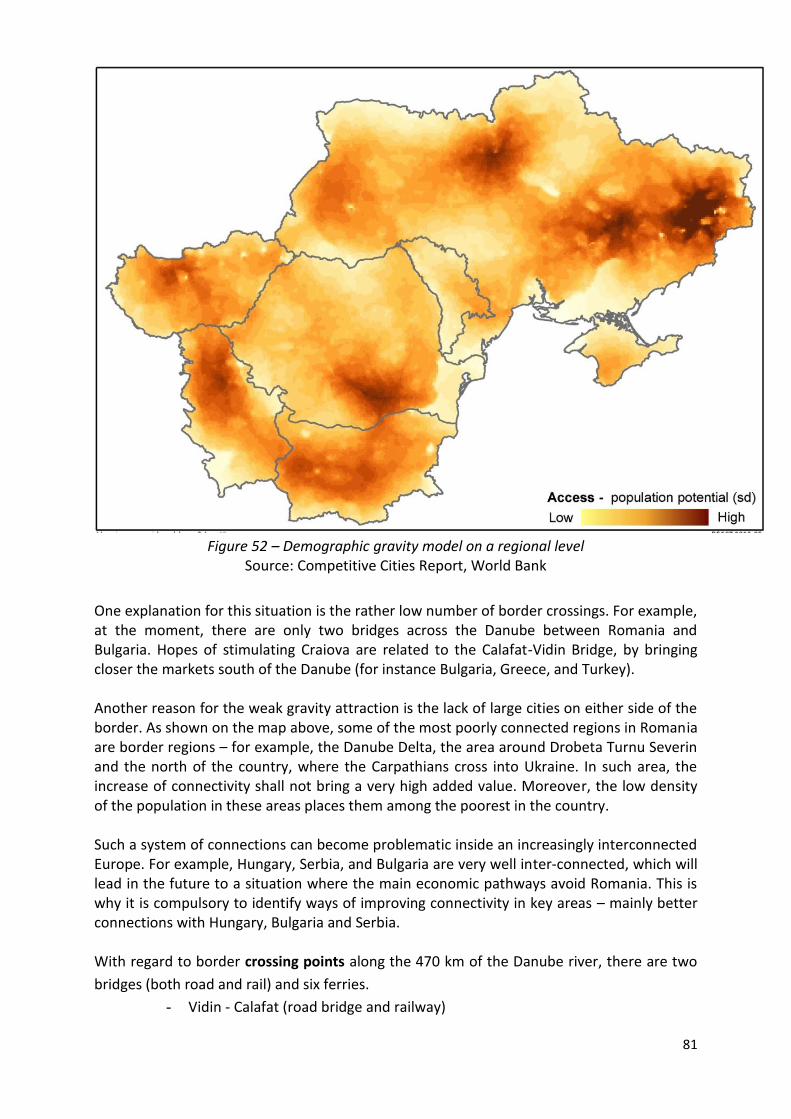
81
Figure 52 – Demographic gravity model on a regional level
Source: Competitive Cities Report, World Bank
One explanation for this situation is the rather low number of border crossings. For example, at the moment, there are only two bridges across the Danube between Romania and Bulgaria. Hopes of stimulating Craiova are related to the Calafat-Vidin Bridge, by bringing closer the markets south of the Danube (for instance Bulgaria, Greece, and Turkey). Another reason for the weak gravity attraction is the lack of large cities on either side of the border. As shown on the map above, some of the most poorly connected regions in Romania are border regions – for example, the Danube Delta, the area around Drobeta Turnu Severin and the north of the country, where the Carpathians cross into Ukraine. In such area, the increase of connectivity shall not bring a very high added value. Moreover, the low density of the population in these areas places them among the poorest in the country. Such a system of connections can become problematic inside an increasingly interconnected Europe. For example, Hungary, Serbia, and Bulgaria are very well inter-connected, which will lead in the future to a situation where the main economic pathways avoid Romania. This is why it is compulsory to identify ways of improving connectivity in key areas – mainly better connections with Hungary, Bulgaria and Serbia. With regard to border crossing points along the 470 km of the Danube river, there are two
bridges (both road and rail) and six ferries.
- Vidin - Calafat (road bridge and railway)
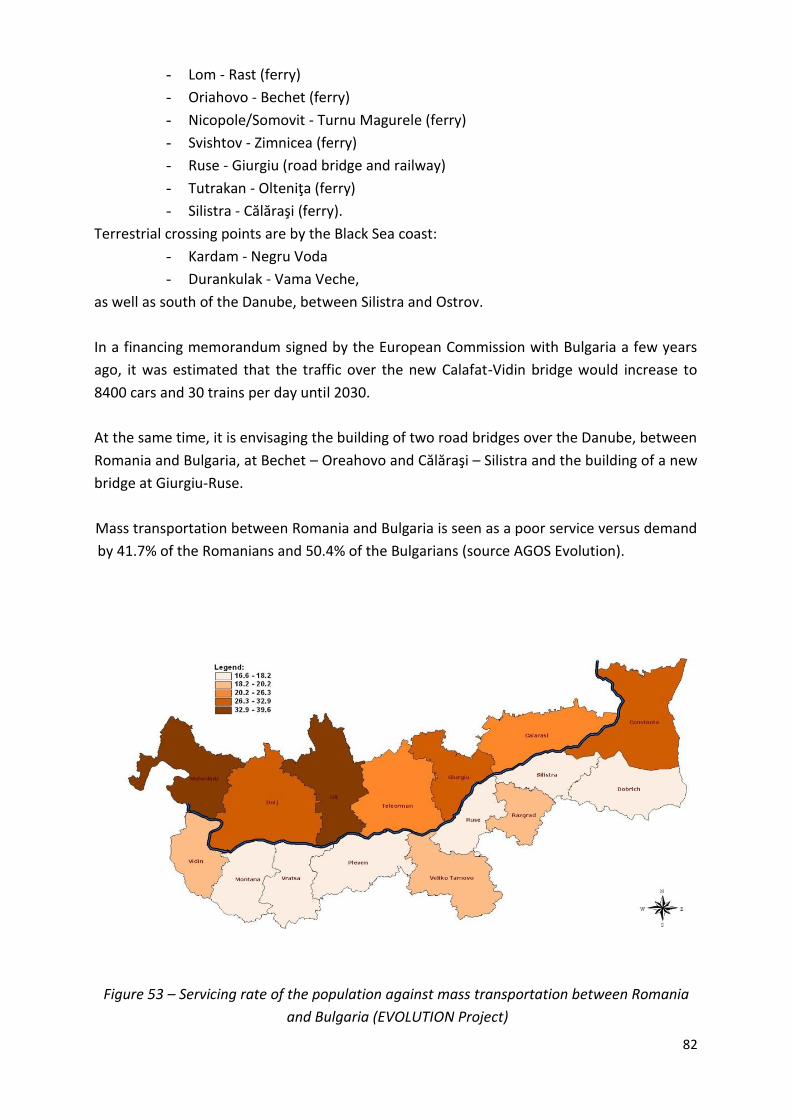
82
- Lom - Rast (ferry)
- Oriahovo - Bechet (ferry)
- Nicopole/Somovit - Turnu Magurele (ferry)
- Svishtov - Zimnicea (ferry)
- Ruse - Giurgiu (road bridge and railway)
- Tutrakan - Olteniţa (ferry)
- Silistra - Călăraşi (ferry).
Terrestrial crossing points are by the Black Sea coast:
- Kardam - Negru Voda
- Durankulak - Vama Veche,
as well as south of the Danube, between Silistra and Ostrov.
In a financing memorandum signed by the European Commission with Bulgaria a few years
ago, it was estimated that the traffic over the new Calafat-Vidin bridge would increase to
8400 cars and 30 trains per day until 2030.
At the same time, it is envisaging the building of two road bridges over the Danube, between
Romania and Bulgaria, at Bechet – Oreahovo and Călăraşi – Silistra and the building of a new
bridge at Giurgiu-Ruse.
Mass transportation between Romania and Bulgaria is seen as a poor service versus demand
by 41.7% of the Romanians and 50.4% of the Bulgarians (source AGOS Evolution).
Figure 53 – Servicing rate of the population against mass transportation between Romania
and Bulgaria (EVOLUTION Project)
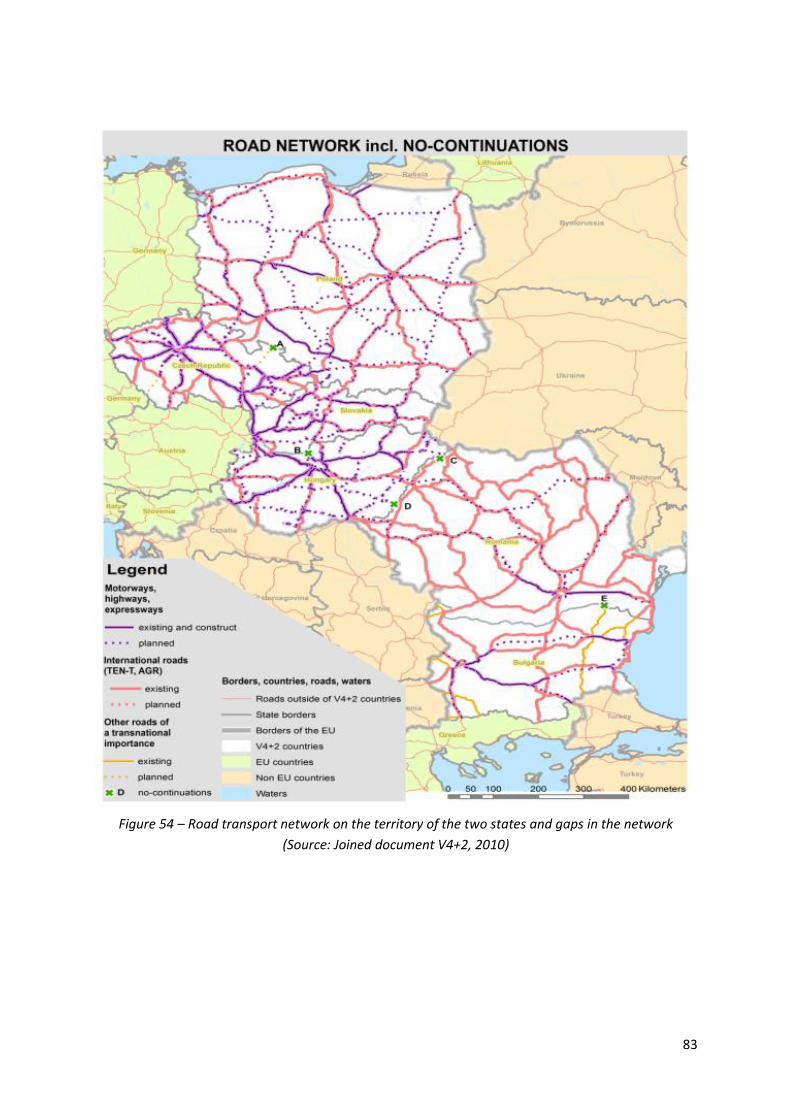
83
Figure 54 – Road transport network on the territory of the two states and gaps in the network
(Source: Joined document V4+2, 2010)
84
Problems recorded at the transport network level According to the ministry conclusions drawn during the 2010 Budapest ministry reunion of Visegrad group states + Romania and Bulgaria, the member states have undertakes to organize bilateral meetings to identify solutions to eliminate gaps in transport corridors and development axe son each border. Thus, in April 2012, there was a first Romanian-Bulgarian meeting, with representatives of the Ministry of Regional Development and Tourism and those from the correspondent Bulgarian ministry, from this meeting were issued the following ideas regarding the gap between Shumen and Călăraşi through Silistra:
A. The main gap is due to the lack of a bridge across the Danube, as Călăraşi is connected by national roads to the Bucharest-Constanţa motorway and to E584 Slobozia – Galaţi – Giurgiuleşti.
B. It is necessary to identify the terminology, to check whether it is possible to declare the national road connecting Călăraşi a “road of transnational importance”
C. It is necessary to consult on this issue representatives from the transports ministries of the two countries;
The Ministry of Regional Development and Public Administration has taken the necessary steps to consult the Ministry of Transports and Infrastructure, but no official answer has been received so far on this subject. The following information was obtained following informal discussions with representatives of the General Division for European Affairs and International Relations:
D. the category “other road of transnational importance” does not exist in the Romanian or European legislation,
E. the Shumen – Silistra road does not fall into the category of roads open to European traffic (not included in the AGR), so its inclusion in the category of “other road of transnational importance” rather expresses an intention or interpretation of the Bulgarian side
F. According to traffic studies, between Călăraşi and the border point the traffic is of approximately 2000 vehicles/day, which, according to the Ministry of Transports and Infrastructure, does not motivate an investment for transforming the road in expressway or motorway.
G. There is an interest of the local administrations of the cities of Silistra and Călăraşi to build a public-private partnership or a concession for a bridge across the Danube in this place. In 2010, a partnership agreement was even signed between the Municipalities of Călăraşi and Silistra regarding this issue. The Ministry of Transports in Romania has expressed its availability for collaboration on this subject, but no actual proposals have been made.
H. There is a Common Statement by the Government of Romania and the Government of the Republic of Bulgaria regarding the building of new bridges across the Danube river, signed at Sofia (Bulgaria) on September 23rd, 2010; the bridges considered are in the Călăraşi-Silistra and Bechet-Oreahovo area, This Statement specifies the need to create a Romanian-Bulgarian Working Group on issues of transport infrastructure, with the purpose of sustaining initiatives to build new bridges across the Danube.
I. There is a pre-feasibility study for the Bechet-Oreahovo bridge, estimating a necessary value of 150 million Euro to build the bridge; no study was made for the Călăraşi-Silistra bridge, therefore the necessary building value has not been estimated;
85
Other identified issues:
- The main impediment to cross-border cooperation is a lack of border crossing points, turning the area in a peripheral one;
- Failure to exploit the water transport potential given by the Danube (under 15% of capacity);
- Physical degradation of ports and ports infrastructure – 20% of the docks in riverside ports on the Romanian side are over 60 years old and need urgent reconstruction; another 65% of these docks are in a precarious physical state because of lack of financing for maintenance and repairs;
- Lack of a motorway on the route Bucharest-Alexandria-Craiova-Drobeta Turnu-Severin, which would attract investments and would ensure the increase of a development axis on this direction;
- National roads are crossing many localities, fact which, together with the lack of beltways, cause a high circulation time (in Romania);
- A large number of administrative and territorial units without access to the main road and rail transport corridors;
- Area exposed to blizzards during wintertime, which causes blocking of the transport routes;
- the lack of rail infrastructure investments has lead to a decreased interest in this type of transportation (very long times of covering the distance between localities, especially for secondary routes – in Romania, for example - Roşiori de Vede-Alexandria, 31 km covered in 50 minutes; Craiova-Calafat, 107 km covered in 3,15 hours; or even on main routes, such as Bucharest-Giurgiu - 2,52 hours);
- Big differences in road density between Romania and Bulgaria; - Lack of plans for urban mobility for the main urban centres, which would allow a
better flow of persons and goods transport and the lack of bicycle lanes, which would provide an alternative to motor transport.
Development needs and priorities: - completing the Danube-Bucharest Canal - rehabilitation of the Calafat - Craiova - Bucharest-Constanţa rail route - updating of the Craiova-Calafat road (84 km) - completing the Bucharest-Constanţa motorway and completing the beltways in the
municipalities of Bucharest and Constanţa; - expansion of motorway network; - the presence in the region of the main airport in the country – Otopeni, as well as of
two other international airports – Craiova and Constanţa - upgrading the technical rail transport conditions and improving the facilities for
intermodal transport - improving navigation conditions in some Danube Bulgarian sectors
- upgrading overall technical conditions of the Danube harbours infrastructure - developing and implementing the urban mobility plans for the main cities - creating byke routes in urban centers as an alternative to motor driven transports - ensuring access for isolated settlements to transport networks - developing public transport services in towns according also to the adjacent rural
areas needs
86
7. Tourism and Leisure
In the Romanian area, the districts with high-importance tourist attractions are especially
Constanţa, Mehedinţi and Călăraşi, while in the Bulgarian area there are Dobrich, Veliko
Târnovo and Vidin.
The data analysis shows that the most tourist accommodation structures (998 in 2007, 1085
in 2008, 1108 in 2009 and 195 in 2010) are on the Romanian side, in the Constanţa District,
with an opening to the Black Sea, where the large number of structures is especially
influenced by the hotels, that have recorded an increase by 9.1% in 2010 as compared to
2007. Hotels held the highest weight of the total number of accommodation structures in
the district, namely 33.2% in 2007, 33.1% in 2008, 34.2% in 2009 and 32.9% in 2010).
Constanţa district also holds a significant number of tourist villas (increasing by 18.2% in
2010 as compared to 2007) and bungalows (approx. 200 units per analysed year).
In the other Romanian districts, the number of tourist accommodation structures is much
under the level of Constanţa district. Thus, in 2007, the second place as number of structures
was occupied by the Dolj district (26 structures), in 2008 the second place as number of
structures was occupied by the Dolj district (22 structures), while in 2009 it was held by the
Mehedinţi district (30 structures), and in 2010 the districts of Dolj and Mehedinţi each held
27 structures.
When speaking of the types of tourist accommodation structures specific for the rural area -
agritourists boarding houses – in the Constanţa district there is the largest number (around
33 in 2007 and 2008, 20 in 2009 and 35 in 2010).
In the Bulgarian area, the largest number of tourist accommodation structures is in the
Dobrich district, opening to the Black Sea, similar to Constanţa in Romania. Thus, the Dobrich
district held, in 2008, 175 tourist accommodation structures, in 2009 it held 121 structures
and in 2010 – 105 structures.
The Dobrich district held, in 2008, a percentage of 5.4% of the total number of existing
structures in Bulgaria, and in the subsequent years there was a decrease (3.4% in 2009 and
3.0 in 2010).
At the same time, there is an increase in the percentage of number of structures out of the
total existing structures in Bulgaria, in Ruse District, namely from 1.2% in 2008 up to 3.3% in
2010.
There were also slight increases in the district of Veliko Târnovo of the percentage out of
total Bulgarian structures (from 2.1% in 2008 to 2.7% in 2010).
Challenges in the field of tourism
61% of Romanian companies and 76% of Bulgarian ones consider that there are still unused tourist attractions in their district.
The economic environment in the Romanian area awards a slightly higher importance to tourist attractions in the area than the Bulgarian economic environment.
87
In the Romanian area, the districts with high-importance tourist attractions are especially Constanţa, Mehedinţi and Călăraşi, while in the Bulgarian area there are Dobrich, Veliko Târnovo and Vidin, these need a much more efficient exploitation of resources
Despite the recommendations and intentions to develop alternatives to traditional tourist products and to the over-developed well-known resorts, the development of such a type of tourism (cultural, ecologic, spa, adventure, etc.) has been limited and statistically unnoticeable. For a lot of potential attractions, exploitation ahs not been possible (to attract more long-stay tourists), and the local tourist infrastructure is incomplete, obsolete, worn-out or missing. Thus, the Bulgarian regions along the Danube are not very popular tourist destinations, and there is the need to create a positive regional image.
In order to exploit the tourist area, approximately 60% of the total population of the Romanian area consider that tourism in the areas where they live can be developed by the improvement of the general aspect of their locality and by building and repairing roads (over 46%). Bulgarians in the cross-border region consider that the main ways to develop tourist potential are the improvement of the general aspect of their locality (61.6%) and the improvement of the technical and urban infrastructure (60.6%)14. Leisure An important cultural means accessible to local population to increase the cultural and educational level is the network and activity of public libraries (district, municipal, town or communal). The Romanian area had in 2011 a number of 513 public libraries. In the districts of Olt and Dolj there are the most public libraries, with 108 libraries open in Olt and 100 in Dolj district, respectively. Data on the number and activity of libraries, by districts, are only available on a regional level, and for libraries holding more than 200000 volumes, in the public data series of the National Institute of Statistics in Bulgaria. This is why the number of recorded libraries is smaller than on the Romanian side. In 2010, on the Romanian territory there were 687 functioning museums. Of these, in Constanţa district there are 21 museums, in Dolj there are 19 museums, in Olt 13 museums, in Teleorman 7 museums, in Călăraşi and Giurgiu 5 museums each, and in Mehedinţi 3 museums. Therefore, the cross-border region has 73 available museums. While on a national scale there were 8 more museums opened between 2007-2010, in the cross-border region 4 ,museums were closed (in Constanţa, Dolj, Olt and Teleorman). On the Bulgarian territory there were, in 2011, 197 operating museums. Of these, in the Bulgarian cross-border region, the most museums are in the district of Veliko Târnovo – 10 museums. In the Montana district, 6 museums were recorded, in Dobrich 6 museums, Pleven and Ruse districts had 4 museums each, and the districts of Razgrad, Vidin and Vratsa only held 3 museums each.
14
AGOS (EVOLUTION Project)
88
Between 2007-2011, in the Bulgarian cross-border region, the number of museums remained constant in the districts of Dobrich, Pleven, Razgrad, Ruse, Vidin and Vratsa, and in the districts of Montana and Veliko Târnovo the number of museums decreased by 1 and 2 units, respectively, and in Silistra the number of museums increased by one unit. In the Romanian cross-border region there were, in 2010, 15 theatres and entertainment venues, with the largest number in Dolj (5 units). Also, Mehedinţi and Constanţa hold three theatres and entertainment venues each, Olt holds two, Teleorman and Giurgiu one each, while is Călăraşi there is no such institution. In Bulgaria, data is only available at a regional level (7 in the North-West region, 9 in the North-East and North-Centre regions). The Romanian cross-border region only holds 6 cinemas (as compared to 10 in 2007), located in two of the seven districts (four cinemas in Constanţa and two in Dolj). Even if the number of cinemas has halved in Constanţa in 2010 as compared to 2007, the number of viewers has increased from 46 viewers per 1000 inhabitants in 2007 to 301 viewers per 1000 inhabitants in 2010. the three planning regions in the Bulgarian area held 14 cinemas in 2011, as compared to 20 in 2007. Going to museums, theatres, cinemas is strongly influenced by the area where they are located. In tourist areas, with pleasure resorts, in mountain or seaside areas, there were cities developed with a powerful culture-oriented infrastructure, with cinemas and theatres (e.g. Constanţa).
8. Health services
Between 2007-2011, in Romania, hospitals enjoyed an increase in numbers, by 17 units, on a national level. However, in the cross-border region, in Constanţa district there was an increase in the number of hospitals by 5 units (from 13 hospitals in 2007 to 18 hospitals in 2011), the other districts retaining the same number of hospitals over the analysed period. Thus, in Dolj there were 15 hospitals, in Teleorman 8 hospitals, in Olt 6 hospitals and in the districts of Călăraşi and Mehedinţi the number of hospitals had decreased in 2011 as compared to 2007 by 2 units and in the Giurgiu District it had decreased by one unit. However, the number of hospitals decreased by 39 units in 2011 as compared to 2010.
However, in the Bulgarian cross-border region there were increases in the number of hospitals both in Pleven, by one unit (from 11 hospitals in 2007 to 12 hospitals in 2008, number which was constantly maintained until 2011), and in Vratsa, by two units (from 12 hospitals in 2007 to 14 hospitals in 2011), and in Vidin and Ruse there was a decrease in the number of hospitals in 2007 as compared to 2011. Very close to the national average, the Dolj district had 6.4 hospital beds per 1000 inhabitants throughout the entire 2007-2011 period (except for 2008, when there were only 6.3 hospital beds). The other districts in the Romanian cross-border region have a lower number of hospital beds per 1000 inhabitants. Thus, in 2011, the number of hospital beds per 1000 inhabitants was of 5.7 beds in Constanţa district, 5.0 in the Mehedinţi district and 4.9 in the Teleorman district, with 4.5 beds in the Olt district and 3.76 beds in Călăraşi district, and only 2.93 hospital beds in the Giurgiu district.
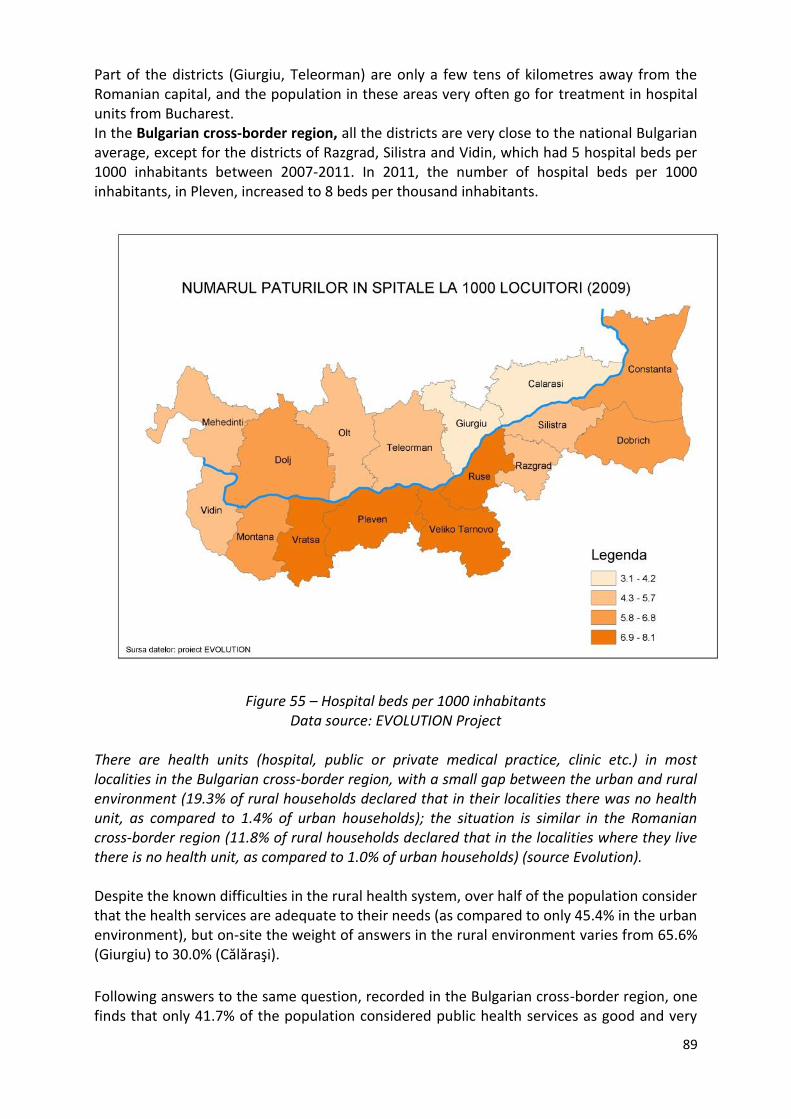
89
Part of the districts (Giurgiu, Teleorman) are only a few tens of kilometres away from the Romanian capital, and the population in these areas very often go for treatment in hospital units from Bucharest. In the Bulgarian cross-border region, all the districts are very close to the national Bulgarian average, except for the districts of Razgrad, Silistra and Vidin, which had 5 hospital beds per 1000 inhabitants between 2007-2011. In 2011, the number of hospital beds per 1000 inhabitants, in Pleven, increased to 8 beds per thousand inhabitants.
Figure 55 – Hospital beds per 1000 inhabitants
Data source: EVOLUTION Project
There are health units (hospital, public or private medical practice, clinic etc.) in most localities in the Bulgarian cross-border region, with a small gap between the urban and rural environment (19.3% of rural households declared that in their localities there was no health unit, as compared to 1.4% of urban households); the situation is similar in the Romanian cross-border region (11.8% of rural households declared that in the localities where they live there is no health unit, as compared to 1.0% of urban households) (source Evolution). Despite the known difficulties in the rural health system, over half of the population consider that the health services are adequate to their needs (as compared to only 45.4% in the urban environment), but on-site the weight of answers in the rural environment varies from 65.6% (Giurgiu) to 30.0% (Călăraşi).
Following answers to the same question, recorded in the Bulgarian cross-border region, one finds that only 41.7% of the population considered public health services as good and very
90
good, with 34.0% considering them satisfactory and 24.3% considering that they do not answer citizens’ needs. The repartition of weights per residential areas is rather balanced. There are rather close proportions in the urban and rural environment: 42.2% of town population and 41.0% of rural population consider that public health services are good and very good, and the degree of discontent is the same (24.3%), both in the urban and in the rural environment. Thus, at a national level, in Romania, between 2007-2011, there were between 22.4 doctors (in 2007) and 24.6 doctors (in 2011) per 10000 inhabitants, and between 5.4 dentists (in 2007) and 6.3 dentists (in 2011). During the same period, in Bulgaria, at a national level there were 36.5 doctors (in 2007) and 38.7 doctors (in 2011) per 10000 inhabitants, and 8.4 dentists (2007) to 9.1 dentists (2011). In the Romanian area, the best situation regarding medical personnel provided to the population was in the Dolj district, where in 2011 there were, for each 10000 inhabitants: 30.02 doctors, 6.08 dentists, 8.74 pharmacists and 66.74 nurses and in the Constanţa district, where during the same year, there were, for each 10000 inhabitants: 26.69 doctors, 8.49 dentists, 9.47 pharmacists, and 58.2 nurses, respectively. In the Bulgarian area, the best situation of medical care provision was recorded in the Pleven district, where in 2011 there were, for each 10000 inhabitants 50.21 doctors, and in the Razgrad district there was the lowest number of doctors per 10000 inhabitants, namely 25.64 doctors. Development needs and priorities:
- Enhancing access to basic health services for areas and communities partially covered
(especially rural areas)
- Ensuring minimal medical equipments for the health units from rural areas
- Improving transport accesibility to the urban centres which provide high quality or
specialised medical services
- Extending the emergency rescue services in the uncovered areas. Other general interest services
Districts in the Romanian area had an ascending trend with regards to the number of
housing between 2006-2011, with a significant increase in the Constanţa district (over 14000
homes). In the Bulgarian area, there were increases recorded in the districts of Dobrich and
Veliko Târnovo (around 2000 houses each).
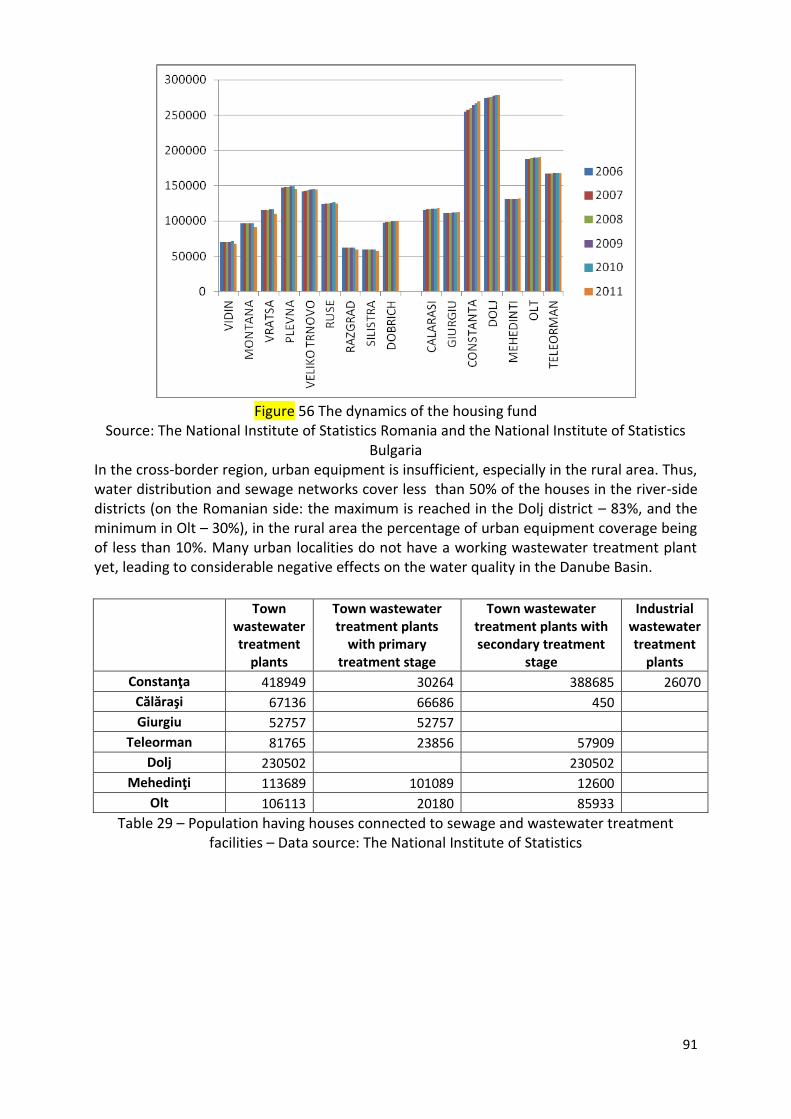
91
Figure 56 The dynamics of the housing fund
Source: The National Institute of Statistics Romania and the National Institute of Statistics Bulgaria
In the cross-border region, urban equipment is insufficient, especially in the rural area. Thus, water distribution and sewage networks cover less than 50% of the houses in the river-side districts (on the Romanian side: the maximum is reached in the Dolj district – 83%, and the minimum in Olt – 30%), in the rural area the percentage of urban equipment coverage being of less than 10%. Many urban localities do not have a working wastewater treatment plant yet, leading to considerable negative effects on the water quality in the Danube Basin.
Town wastewater treatment
plants
Town wastewater treatment plants
with primary treatment stage
Town wastewater treatment plants with secondary treatment
stage
Industrial wastewater treatment
plants
Constanţa 418949 30264 388685 26070
Călăraşi 67136 66686 450
Giurgiu 52757 52757
Teleorman 81765 23856 57909
Dolj 230502 230502
Mehedinţi 113689 101089 12600
Olt 106113 20180 85933
Table 29 – Population having houses connected to sewage and wastewater treatment facilities – Data source: The National Institute of Statistics
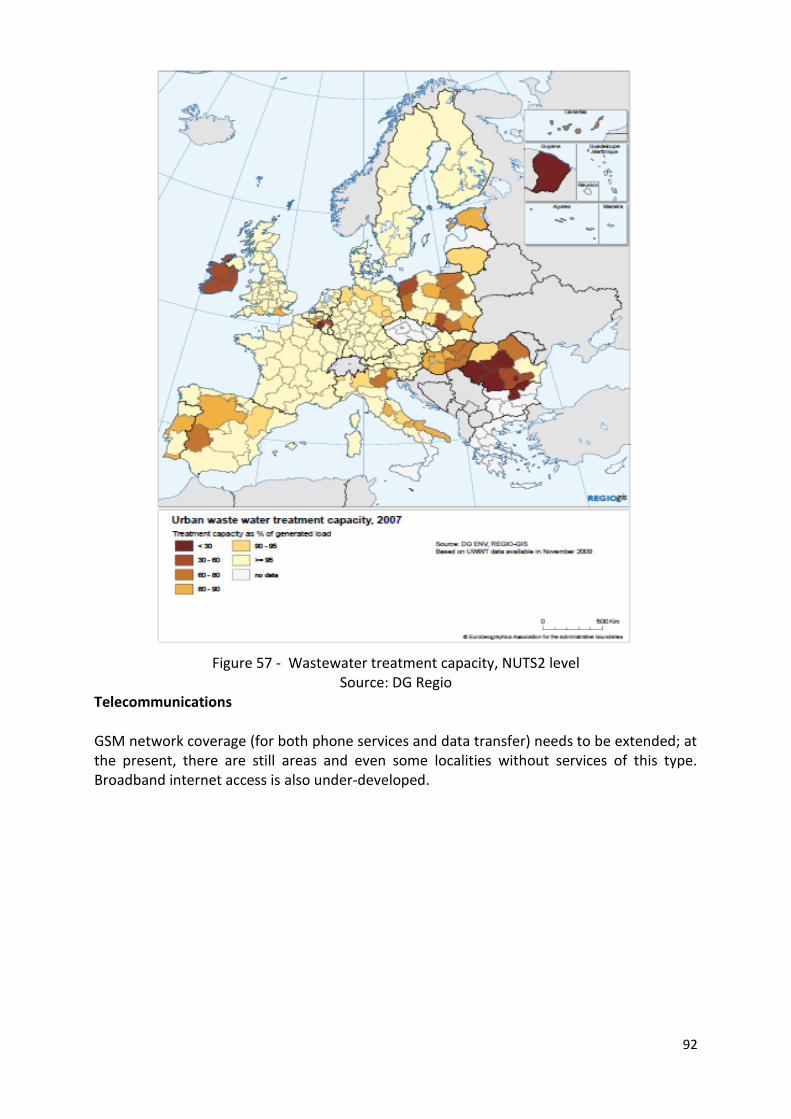
92
Figure 57 - Wastewater treatment capacity, NUTS2 level
Source: DG Regio Telecommunications GSM network coverage (for both phone services and data transfer) needs to be extended; at the present, there are still areas and even some localities without services of this type. Broadband internet access is also under-developed.
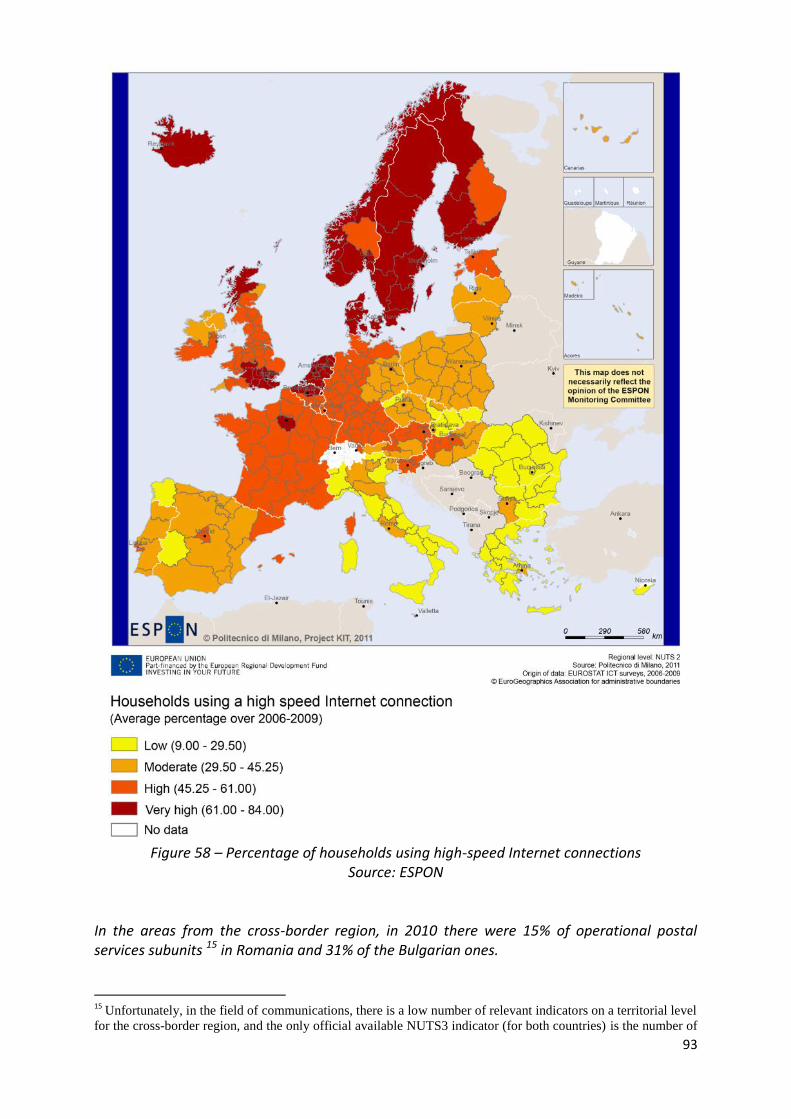
93
Figure 58 – Percentage of households using high-speed Internet connections
Source: ESPON
In the areas from the cross-border region, in 2010 there were 15% of operational postal services subunits 15 in Romania and 31% of the Bulgarian ones.
15
Unfortunately, in the field of communications, there is a low number of relevant indicators on a territorial level
for the cross-border region, and the only official available NUTS3 indicator (for both countries) is the number of
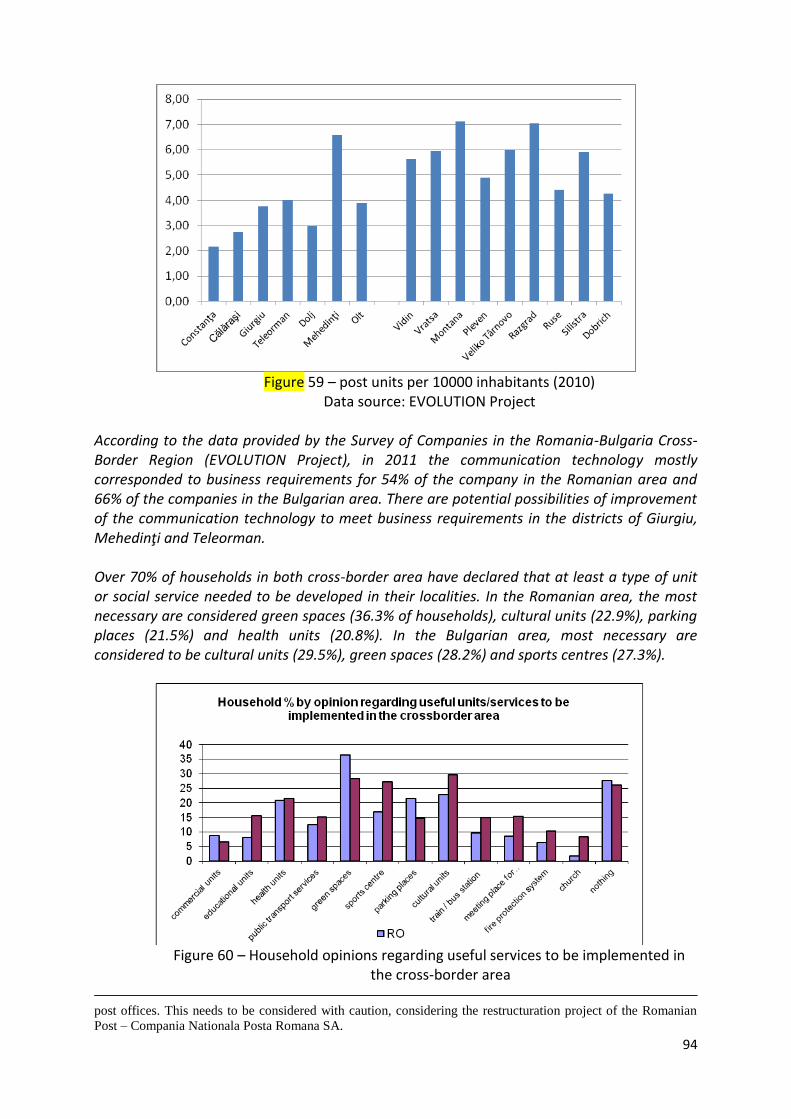
94
Figure 59 – post units per 10000 inhabitants (2010)
Data source: EVOLUTION Project According to the data provided by the Survey of Companies in the Romania-Bulgaria Cross-Border Region (EVOLUTION Project), in 2011 the communication technology mostly corresponded to business requirements for 54% of the company in the Romanian area and 66% of the companies in the Bulgarian area. There are potential possibilities of improvement of the communication technology to meet business requirements in the districts of Giurgiu, Mehedinţi and Teleorman. Over 70% of households in both cross-border area have declared that at least a type of unit or social service needed to be developed in their localities. In the Romanian area, the most necessary are considered green spaces (36.3% of households), cultural units (22.9%), parking places (21.5%) and health units (20.8%). In the Bulgarian area, most necessary are considered to be cultural units (29.5%), green spaces (28.2%) and sports centres (27.3%).
Figure 60 – Household opinions regarding useful services to be implemented in
the cross-border area post offices. This needs to be considered with caution, considering the restructuration project of the Romanian
Post – Compania Nationala Posta Romana SA.
95
Data source: EVOLUTION household survey
Issues:
- 4 towns and over 450 communes did not have, in 2011, a sewage system (Romanian area) – for example, in the Olt district only 30% of total households have a toilet connected to the sewage system.
- Romanian and Bulgarian districts in the cross-border region (where there is data) have the lowest capacities of wastewater treatment on EU territory (excepting Constanţa)
- A big part of the region’s wastewater treatment plants only have a primary treatment stage.
- 91% of the rural population did not have an internet connection in 2008. Development needs and priorities:
- Improving equipments regarding environmental infrastructures (e.g. improving
performances of wastewater treatment)
- Improving quality and efficiency of public utilities community services
- Extending access to broadband internet (especially in rural areas / disadvantaged
isolated areas)
- Developing public points with access to internet (telecentres).
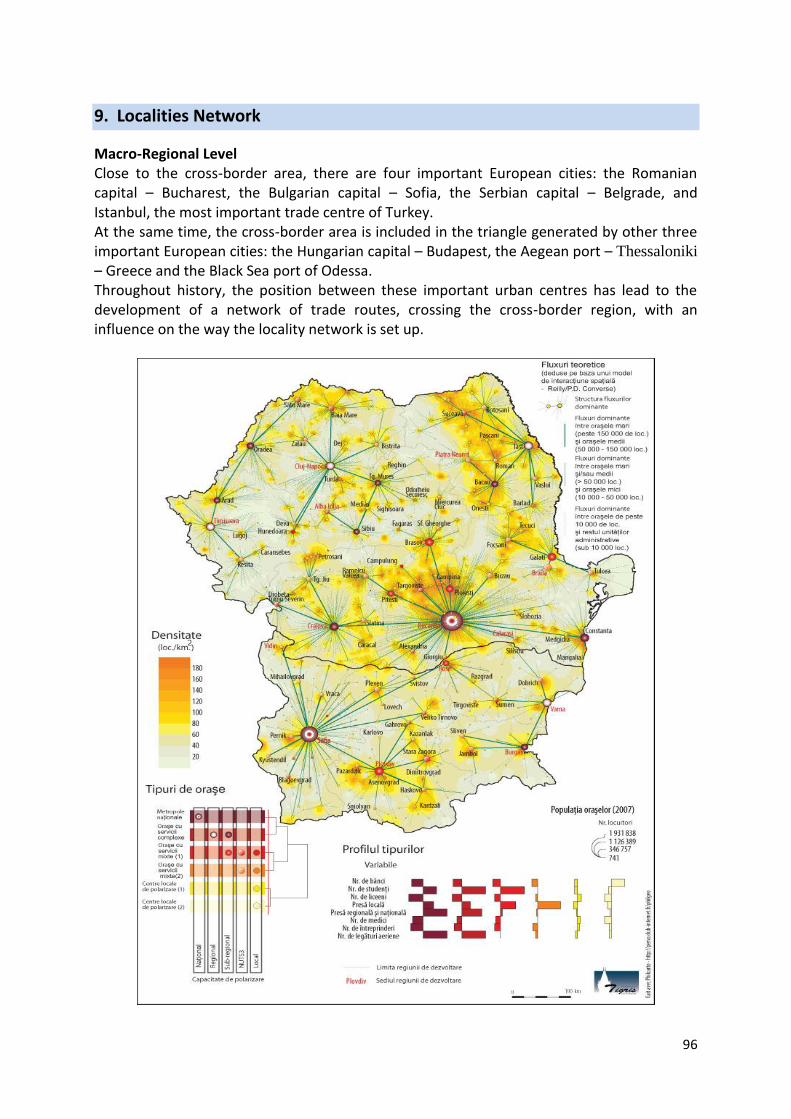
96
9. Localities Network
Macro-Regional Level Close to the cross-border area, there are four important European cities: the Romanian capital – Bucharest, the Bulgarian capital – Sofia, the Serbian capital – Belgrade, and Istanbul, the most important trade centre of Turkey. At the same time, the cross-border area is included in the triangle generated by other three important European cities: the Hungarian capital – Budapest, the Aegean port – Thessaloniki
– Greece and the Black Sea port of Odessa. Throughout history, the position between these important urban centres has lead to the development of a network of trade routes, crossing the cross-border region, with an influence on the way the locality network is set up.
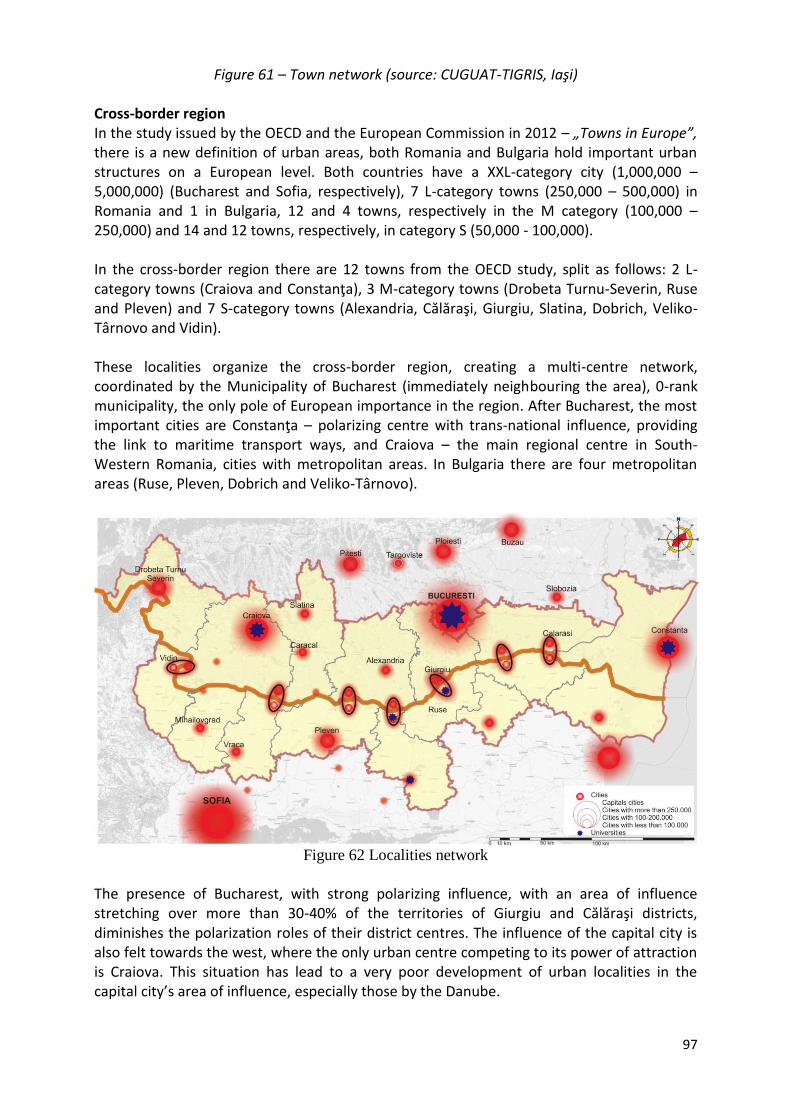
97
Figure 61 – Town network (source: CUGUAT-TIGRIS, Iaşi) Cross-border region In the study issued by the OECD and the European Commission in 2012 – „Towns in Europe”, there is a new definition of urban areas, both Romania and Bulgaria hold important urban structures on a European level. Both countries have a XXL-category city (1,000,000 – 5,000,000) (Bucharest and Sofia, respectively), 7 L-category towns (250,000 – 500,000) in Romania and 1 in Bulgaria, 12 and 4 towns, respectively in the M category (100,000 – 250,000) and 14 and 12 towns, respectively, in category S (50,000 - 100,000). In the cross-border region there are 12 towns from the OECD study, split as follows: 2 L-category towns (Craiova and Constanţa), 3 M-category towns (Drobeta Turnu-Severin, Ruse and Pleven) and 7 S-category towns (Alexandria, Călăraşi, Giurgiu, Slatina, Dobrich, Veliko-Târnovo and Vidin). These localities organize the cross-border region, creating a multi-centre network, coordinated by the Municipality of Bucharest (immediately neighbouring the area), 0-rank municipality, the only pole of European importance in the region. After Bucharest, the most important cities are Constanţa – polarizing centre with trans-national influence, providing the link to maritime transport ways, and Craiova – the main regional centre in South-Western Romania, cities with metropolitan areas. In Bulgaria there are four metropolitan areas (Ruse, Pleven, Dobrich and Veliko-Târnovo).
Figure 62 Localities network
The presence of Bucharest, with strong polarizing influence, with an area of influence stretching over more than 30-40% of the territories of Giurgiu and Călăraşi districts, diminishes the polarization roles of their district centres. The influence of the capital city is also felt towards the west, where the only urban centre competing to its power of attraction is Craiova. This situation has lead to a very poor development of urban localities in the capital city’s area of influence, especially those by the Danube.
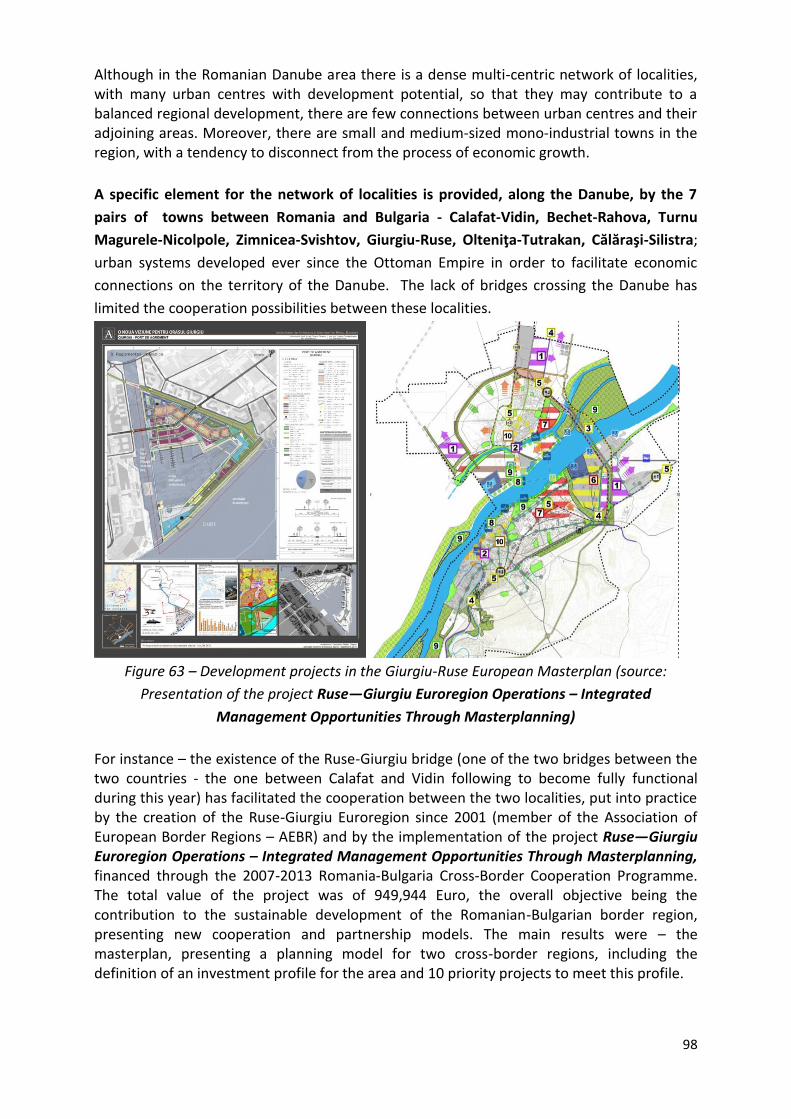
98
Although in the Romanian Danube area there is a dense multi-centric network of localities, with many urban centres with development potential, so that they may contribute to a balanced regional development, there are few connections between urban centres and their adjoining areas. Moreover, there are small and medium-sized mono-industrial towns in the region, with a tendency to disconnect from the process of economic growth.
A specific element for the network of localities is provided, along the Danube, by the 7
pairs of towns between Romania and Bulgaria - Calafat-Vidin, Bechet-Rahova, Turnu
Magurele-Nicolpole, Zimnicea-Svishtov, Giurgiu-Ruse, Olteniţa-Tutrakan, Călăraşi-Silistra;
urban systems developed ever since the Ottoman Empire in order to facilitate economic
connections on the territory of the Danube. The lack of bridges crossing the Danube has
limited the cooperation possibilities between these localities.
Figure 63 – Development projects in the Giurgiu-Ruse European Masterplan (source:
Presentation of the project Ruse—Giurgiu Euroregion Operations – Integrated
Management Opportunities Through Masterplanning)
For instance – the existence of the Ruse-Giurgiu bridge (one of the two bridges between the two countries - the one between Calafat and Vidin following to become fully functional during this year) has facilitated the cooperation between the two localities, put into practice by the creation of the Ruse-Giurgiu Euroregion since 2001 (member of the Association of European Border Regions – AEBR) and by the implementation of the project Ruse—Giurgiu Euroregion Operations – Integrated Management Opportunities Through Masterplanning, financed through the 2007-2013 Romania-Bulgaria Cross-Border Cooperation Programme. The total value of the project was of 949,944 Euro, the overall objective being the contribution to the sustainable development of the Romanian-Bulgarian border region, presenting new cooperation and partnership models. The main results were – the masterplan, presenting a planning model for two cross-border regions, including the definition of an investment profile for the area and 10 priority projects to meet this profile.
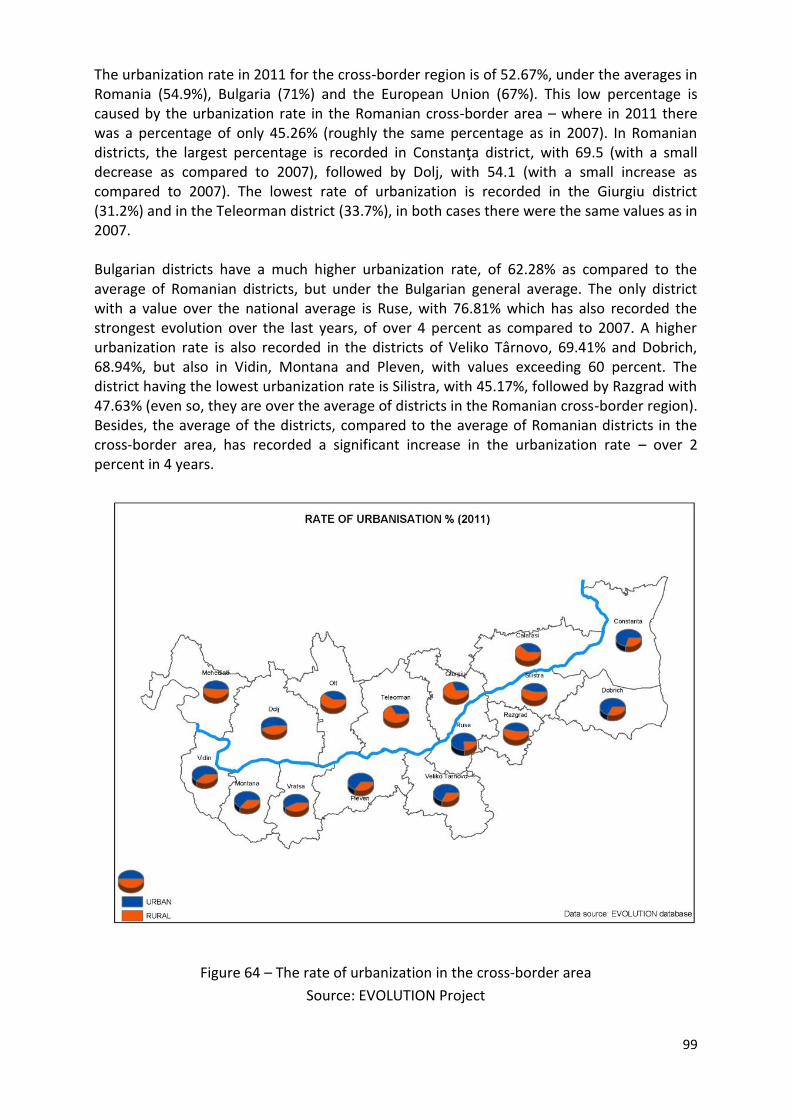
99
The urbanization rate in 2011 for the cross-border region is of 52.67%, under the averages in Romania (54.9%), Bulgaria (71%) and the European Union (67%). This low percentage is caused by the urbanization rate in the Romanian cross-border area – where in 2011 there was a percentage of only 45.26% (roughly the same percentage as in 2007). In Romanian districts, the largest percentage is recorded in Constanţa district, with 69.5 (with a small decrease as compared to 2007), followed by Dolj, with 54.1 (with a small increase as compared to 2007). The lowest rate of urbanization is recorded in the Giurgiu district (31.2%) and in the Teleorman district (33.7%), in both cases there were the same values as in 2007. Bulgarian districts have a much higher urbanization rate, of 62.28% as compared to the average of Romanian districts, but under the Bulgarian general average. The only district with a value over the national average is Ruse, with 76.81% which has also recorded the strongest evolution over the last years, of over 4 percent as compared to 2007. A higher urbanization rate is also recorded in the districts of Veliko Târnovo, 69.41% and Dobrich, 68.94%, but also in Vidin, Montana and Pleven, with values exceeding 60 percent. The district having the lowest urbanization rate is Silistra, with 45.17%, followed by Razgrad with 47.63% (even so, they are over the average of districts in the Romanian cross-border region). Besides, the average of the districts, compared to the average of Romanian districts in the cross-border area, has recorded a significant increase in the urbanization rate – over 2 percent in 4 years.
Figure 64 – The rate of urbanization in the cross-border area
Source: EVOLUTION Project
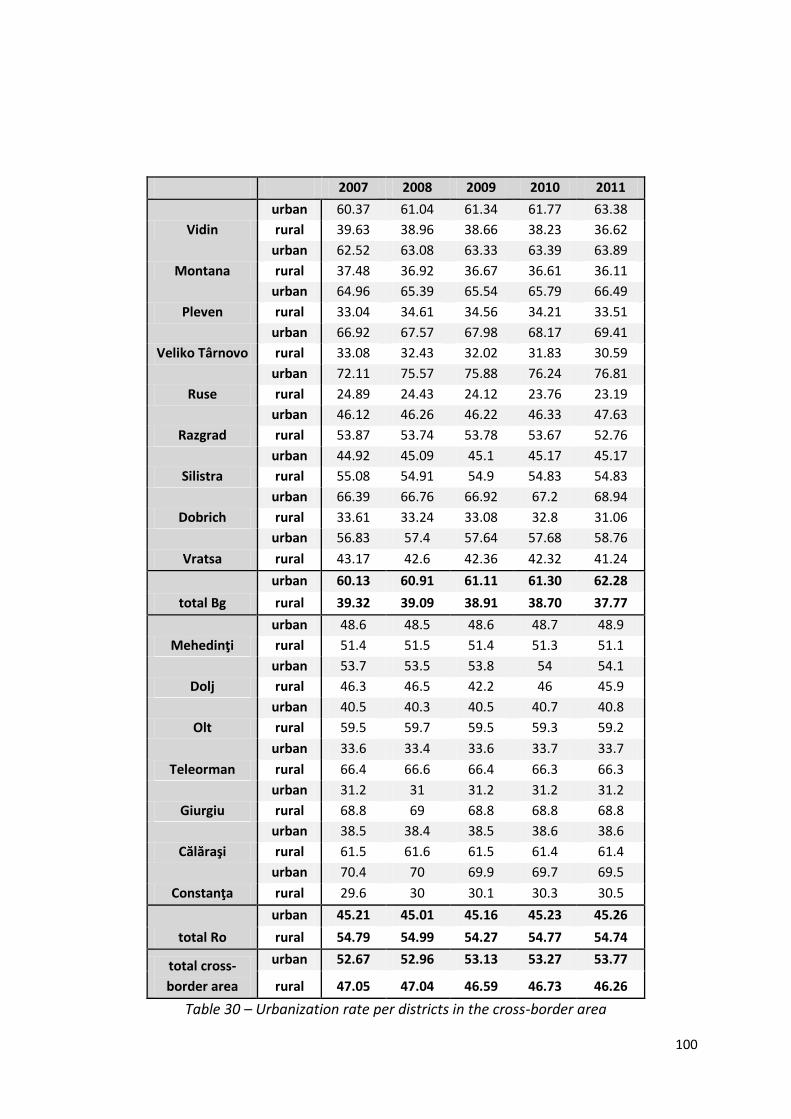
100
2007 2008 2009 2010 2011
Vidin
urban 60.37 61.04 61.34 61.77 63.38
rural 39.63 38.96 38.66 38.23 36.62
Montana
urban 62.52 63.08 63.33 63.39 63.89
rural 37.48 36.92 36.67 36.61 36.11
Pleven
urban 64.96 65.39 65.54 65.79 66.49
rural 33.04 34.61 34.56 34.21 33.51
Veliko Târnovo
urban 66.92 67.57 67.98 68.17 69.41
rural 33.08 32.43 32.02 31.83 30.59
Ruse
urban 72.11 75.57 75.88 76.24 76.81
rural 24.89 24.43 24.12 23.76 23.19
Razgrad
urban 46.12 46.26 46.22 46.33 47.63
rural 53.87 53.74 53.78 53.67 52.76
Silistra
urban 44.92 45.09 45.1 45.17 45.17
rural 55.08 54.91 54.9 54.83 54.83
Dobrich
urban 66.39 66.76 66.92 67.2 68.94
rural 33.61 33.24 33.08 32.8 31.06
Vratsa
urban 56.83 57.4 57.64 57.68 58.76
rural 43.17 42.6 42.36 42.32 41.24
total Bg
urban 60.13 60.91 61.11 61.30 62.28
rural 39.32 39.09 38.91 38.70 37.77
Mehedinţi
urban 48.6 48.5 48.6 48.7 48.9
rural 51.4 51.5 51.4 51.3 51.1
Dolj
urban 53.7 53.5 53.8 54 54.1
rural 46.3 46.5 42.2 46 45.9
Olt
urban 40.5 40.3 40.5 40.7 40.8
rural 59.5 59.7 59.5 59.3 59.2
Teleorman
urban 33.6 33.4 33.6 33.7 33.7
rural 66.4 66.6 66.4 66.3 66.3
Giurgiu
urban 31.2 31 31.2 31.2 31.2
rural 68.8 69 68.8 68.8 68.8
Călăraşi
urban 38.5 38.4 38.5 38.6 38.6
rural 61.5 61.6 61.5 61.4 61.4
Constanţa
urban 70.4 70 69.9 69.7 69.5
rural 29.6 30 30.1 30.3 30.5
total Ro
urban 45.21 45.01 45.16 45.23 45.26
rural 54.79 54.99 54.27 54.77 54.74
total cross-
border area
urban 52.67 52.96 53.13 53.27 53.77
rural 47.05 47.04 46.59 46.73 46.26
Table 30 – Urbanization rate per districts in the cross-border area
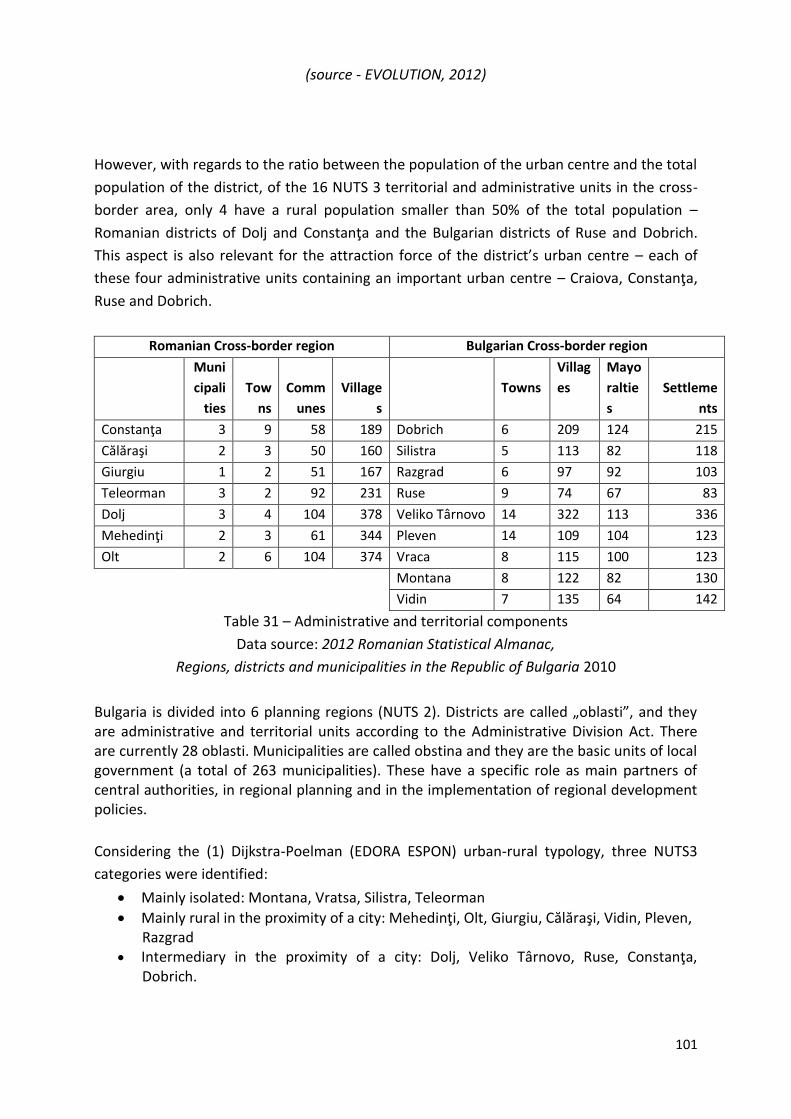
101
(source - EVOLUTION, 2012)
However, with regards to the ratio between the population of the urban centre and the total
population of the district, of the 16 NUTS 3 territorial and administrative units in the cross-
border area, only 4 have a rural population smaller than 50% of the total population –
Romanian districts of Dolj and Constanţa and the Bulgarian districts of Ruse and Dobrich.
This aspect is also relevant for the attraction force of the district’s urban centre – each of
these four administrative units containing an important urban centre – Craiova, Constanţa,
Ruse and Dobrich.
Romanian Cross-border region Bulgarian Cross-border region
Muni
cipali
ties
Tow
ns
Comm
unes
Village
s
Towns
Villag
es
Mayo
raltie
s
Settleme
nts
Constanţa 3 9 58 189 Dobrich 6 209 124 215
Călăraşi 2 3 50 160 Silistra 5 113 82 118
Giurgiu 1 2 51 167 Razgrad 6 97 92 103
Teleorman 3 2 92 231 Ruse 9 74 67 83
Dolj 3 4 104 378 Veliko Târnovo 14 322 113 336
Mehedinţi 2 3 61 344 Pleven 14 109 104 123
Olt 2 6 104 374 Vraca 8 115 100 123
Montana 8 122 82 130
Vidin 7 135 64 142
Table 31 – Administrative and territorial components
Data source: 2012 Romanian Statistical Almanac,
Regions, districts and municipalities in the Republic of Bulgaria 2010
Bulgaria is divided into 6 planning regions (NUTS 2). Districts are called „oblasti”, and they are administrative and territorial units according to the Administrative Division Act. There are currently 28 oblasti. Municipalities are called obstina and they are the basic units of local government (a total of 263 municipalities). These have a specific role as main partners of central authorities, in regional planning and in the implementation of regional development policies.
Considering the (1) Dijkstra-Poelman (EDORA ESPON) urban-rural typology, three NUTS3
categories were identified:
Mainly isolated: Montana, Vratsa, Silistra, Teleorman
Mainly rural in the proximity of a city: Mehedinţi, Olt, Giurgiu, Călăraşi, Vidin, Pleven, Razgrad
Intermediary in the proximity of a city: Dolj, Veliko Târnovo, Ruse, Constanţa, Dobrich.
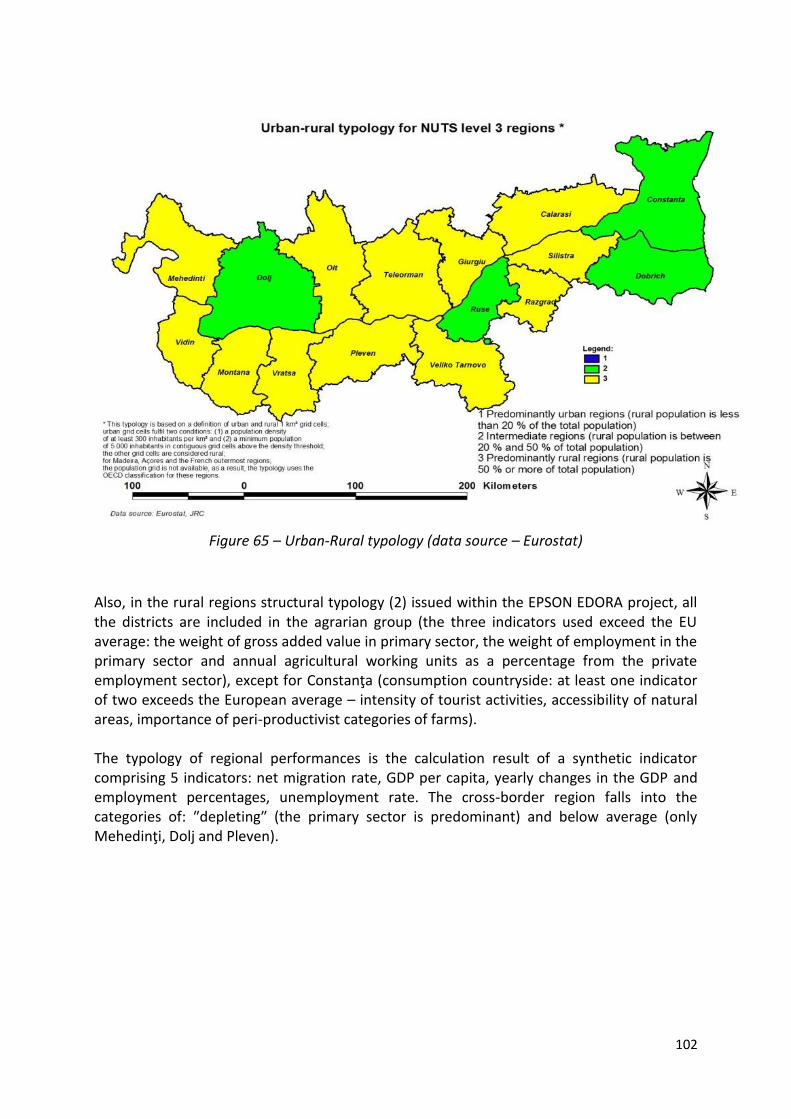
102
Figure 65 – Urban-Rural typology (data source – Eurostat)
Also, in the rural regions structural typology (2) issued within the EPSON EDORA project, all the districts are included in the agrarian group (the three indicators used exceed the EU average: the weight of gross added value in primary sector, the weight of employment in the primary sector and annual agricultural working units as a percentage from the private employment sector), except for Constanţa (consumption countryside: at least one indicator of two exceeds the European average – intensity of tourist activities, accessibility of natural areas, importance of peri-productivist categories of farms). The typology of regional performances is the calculation result of a synthetic indicator comprising 5 indicators: net migration rate, GDP per capita, yearly changes in the GDP and employment percentages, unemployment rate. The cross-border region falls into the categories of: ″depleting″ (the primary sector is predominant) and below average (only Mehedinţi, Dolj and Pleven).
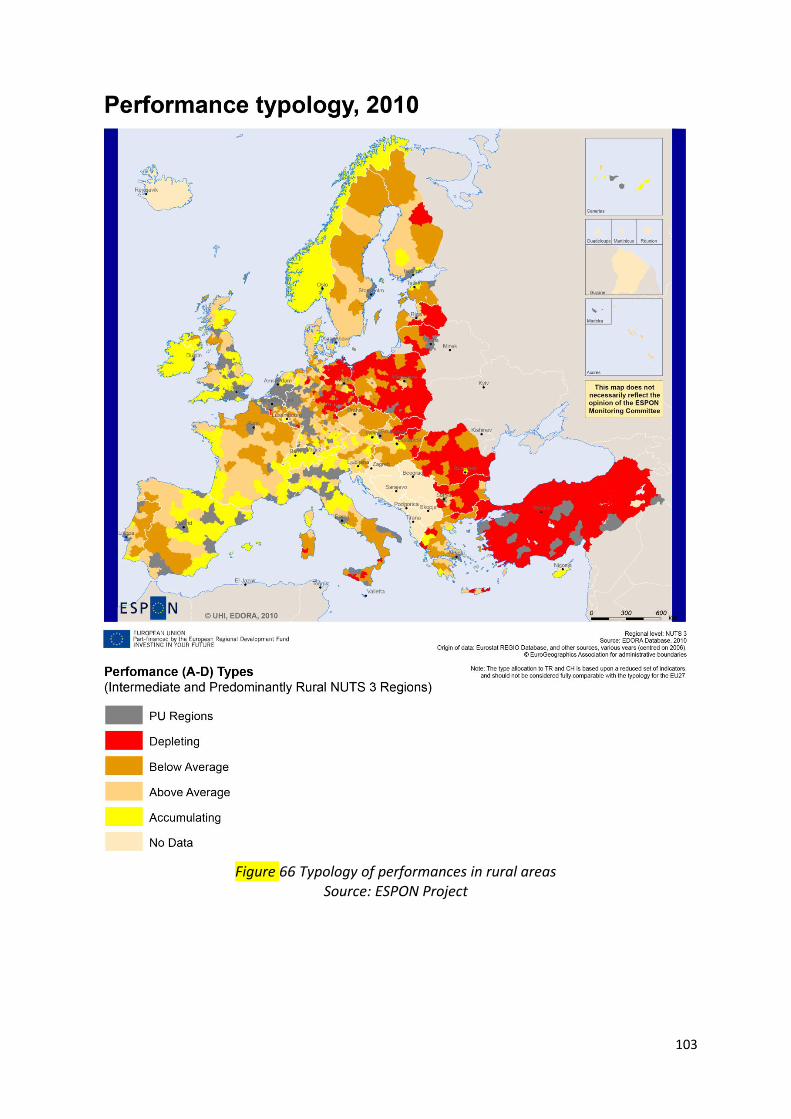
103
Figure 66 Typology of performances in rural areas
Source: ESPON Project
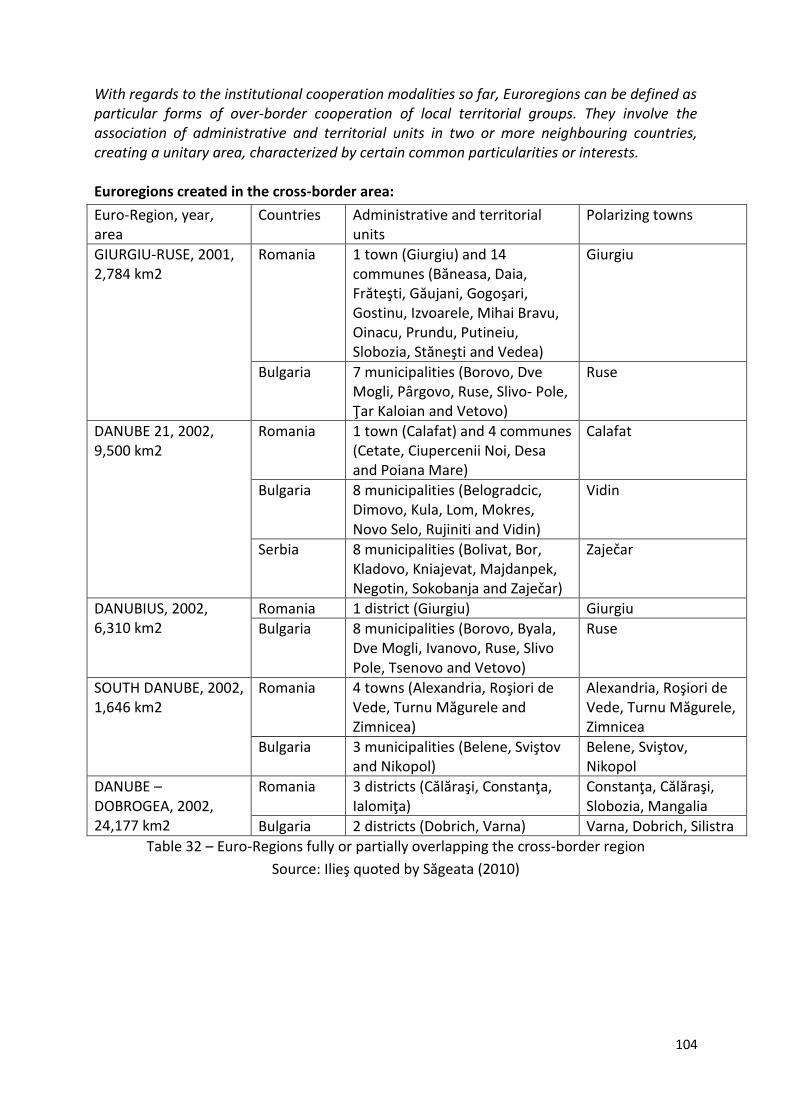
104
With regards to the institutional cooperation modalities so far, Euroregions can be defined as particular forms of over-border cooperation of local territorial groups. They involve the association of administrative and territorial units in two or more neighbouring countries, creating a unitary area, characterized by certain common particularities or interests. Euroregions created in the cross-border area:
Euro-Region, year, area
Countries Administrative and territorial units
Polarizing towns
GIURGIU-RUSE, 2001, 2,784 km2
Romania 1 town (Giurgiu) and 14 communes (Băneasa, Daia, Frăteşti, Găujani, Gogoşari, Gostinu, Izvoarele, Mihai Bravu, Oinacu, Prundu, Putineiu, Slobozia, Stăneşti and Vedea)
Giurgiu
Bulgaria 7 municipalities (Borovo, Dve Mogli, Pârgovo, Ruse, Slivo- Pole, Ţar Kaloian and Vetovo)
Ruse
DANUBE 21, 2002, 9,500 km2
Romania 1 town (Calafat) and 4 communes (Cetate, Ciupercenii Noi, Desa and Poiana Mare)
Calafat
Bulgaria 8 municipalities (Belogradcic, Dimovo, Kula, Lom, Mokres, Novo Selo, Rujiniti and Vidin)
Vidin
Serbia 8 municipalities (Bolivat, Bor, Kladovo, Kniajevat, Majdanpek, Negotin, Sokobanja and Zaječar)
Zaječar
DANUBIUS, 2002, 6,310 km2
Romania 1 district (Giurgiu) Giurgiu
Bulgaria 8 municipalities (Borovo, Byala, Dve Mogli, Ivanovo, Ruse, Slivo Pole, Tsenovo and Vetovo)
Ruse
SOUTH DANUBE, 2002, 1,646 km2
Romania 4 towns (Alexandria, Roşiori de Vede, Turnu Măgurele and Zimnicea)
Alexandria, Roşiori de Vede, Turnu Măgurele, Zimnicea
Bulgaria 3 municipalities (Belene, Sviştov and Nikopol)
Belene, Sviştov, Nikopol
DANUBE – DOBROGEA, 2002, 24,177 km2
Romania 3 districts (Călăraşi, Constanţa, Ialomiţa)
Constanţa, Călăraşi, Slobozia, Mangalia
Bulgaria 2 districts (Dobrich, Varna) Varna, Dobrich, Silistra
Table 32 – Euro-Regions fully or partially overlapping the cross-border region
Source: Ilieş quoted by Săgeata (2010)
105
Main issues:
- the lack of connections between Danube pair towns has lead to a limitation in their cooperation and the critical state of their economic issues;
- low urbanization rate in the cross-border region (below the averages of Romania and Bulgaria), holding very small percentages in the districts of Giurgiu and Teleorman;
- the excessive polarization of Bucharest, together with a lack of cooperation between localities, have lead to the diminished economic capacity of neighbouring towns, for an area of almost 100 km (especially to the west and to the east);
- lack of a Bucharest metropolitan area, to lead to a controlled and coherent development around it;
- the lack of real estate cadastre and urban databases causes misunderstandings between localities and implicitly a lack of trust from the investors, as well as blockages in the national or European-funded development projects (the case of the municipality of Craiova);
- chaotic development of Black Sea resorts; - the economic and administrative incapacity of resort towns (normally those under
10,000 inhabitants) to provide adequate management (protection, exploitation, regeneration);
- insufficient urban equipment in localities;
Development potential:
- position of the cross-border region between important European centres; - the possibility of cooperation between paired towns along the Danube could lead to
overcoming existing economic and social disparities in Southern Romania and Northern Bulgaria, and it also represents a great potential for cross-border cooperation;
- the presence of Bucharest in the region, as a town focusing 50% of the foreign investments in Romania;
- the presence of a multi-centre network of localities, with towns of all categories – cities over 300,000 inhabitants (two of the 7 increase poles in Romania – Constanţa and Craiova), average towns with over 100,000 inhabitants – Drobeta Turnu Severin in Romania, and two of the most important towns in Bulgaria – Ruse and Pleven.
- The Giurgiu-Ruse cooperation as an approach model in the cross-border region; - a high urbanization rate in Bulgarian localities
Development needs and priorities:
- enhancement the territorial role of some urban or rural localities for ensuring the
access to services, information, transport for the inhabitants from shrinking areas
- promoting urban-rural / rural-rural partnerships in order to develop joint
intercomunal projects, infrastructure investments, diversify activities, provide acces
to transport infrastructure, informations and knowledge
- strenghtening some functional categories of rural settlements in order to stimulate
their competitiveness in a distinct field (e.g. communes with high touristic
endowment/potential)