Embed Size (px)
Citation preview

© 2012 International Monetary Fund October 2012 IMF Country Report No. 12/290
August 13, 2012 2012 January 29, 2001 Romania: 2012 Article IV Consultation and Sixth Review Under the Stand-By Arrangement, and Requests for Waiver of Nonobservance of Performance Criterion and Modification of Performance Criteria—Staff Report; Staff Supplement; Public Information Notice and Press Release on the Executive Board Discussion; and Statement by the Executive Director for Romania. Under Article IV of the IMF’s Articles of Agreement, the IMF holds bilateral discussions with members, usually every year. In the context of a combined discussion of the 2012 Article IV consultation with Romania and the Sixth Review Under the Stand-By Arrangement, and Requests for Waiver of Nonobservance of Performance Criterion and Modification of Performance Criteria, the following documents have been released and are included in this package: The staff report for the combined 2012 Article IV consultation and the Sixth Review Under the
Stand-By Arrangement, and Requests for Waiver of Nonobservance of Performance Criterion and Modification of Performance Criteria, prepared by a staff team of the IMF, following discussions that ended on August 13, 2012, with the officials of Romania on economic developments and policies. Based on information available at the time of these discussions, the staff report was completed on September 13, 2012. The views expressed in the staff report are those of the staff team and do not necessarily reflect the views of the Executive Board of the IMF.
A staff supplement of September 25, 2012, updating information on recent economic developments.
A Public Information Notice (PIN) and Press Release, summarizing the views of the Executive Board as expressed during its September 28, 2012, discussion of the staff report on issues related to the Article IV consultation and the IMF arrangement, respectively.
A statement by the Executive Director for Romania.
The documents listed below have been or will be separately released. Letter of Intent sent to the IMF by the authorities of Romania*
Memorandum of Economic and Financial Policies by the authorities of Romania* Technical Memorandum of Understanding* Selected Issues Paper *Also included in Staff Report
The policy of publication of staff reports and other documents allows for the deletion of market-sensitive information.
Copies of this report are available to the public from
International Monetary Fund Publication Services 700 19th Street, N.W. Washington, D.C. 20431
Telephone: (202) 623-7430 Telefax: (202) 623-7201 E-mail: [email protected] Internet: http://www.imf.org
International Monetary Fund Washington, D.C.

INTERNATIONAL MONETARY FUND
ROMANIA
Staff Report for the 2012 Article IV Consultation, Sixth Review Under the Stand-By Arrangement, and Requests for Waiver of Nonobservance of Performance Criterion
and Modification of Performance Criteria
Prepared by the European Department in Consultation with Other Departments
Approved by Poul M. Thomsen and Vivek Arora
September 13, 2012 Discussions: Held in Bucharest during August 1–14, 2012. The mission met with interim
President Antonescu, Prime Minister Ponta, Deputy Prime Minister Georgescu, National Bank of Romania (NBR) Governor Isarescu and other senior officials, and representatives of political parties, labor and business organizations, and financial institutions. The staff team comprised E. de Vrijer (head), J. Ralyea; A. Tuladhar; C. Saborowski (all EUR); J. Bersch (SPR); F. Eich (FAD); and H. Hesse (MCM). T. Lybek (Resident Representative) assisted the mission. Discussions were held jointly with staff from the European Commission. S. Matei (Senior Advisor to the Executive Director) and World Bank staff attended some of the meetings; European Central Bank staff participated as an observer. Stand-By Arrangement: A 24-month, SDR 3,090.6 million (€3.4 billion, US$5.0 billion, 300 percent of quota) Stand-By Arrangement (SBA) was approved by the Executive Board on March 25, 2011 (Country Report No. 11/80) and became effective March 31, 2011. The seventh tranche of SDR 430 million (€509 million) will be made available upon completion of this review. The authorities are treating the arrangement as precautionary. Additional funds under the program are provided by the European Union and the World Bank (also on a precautionary basis). Previous Article IV consultation: The previous consultation was concluded on July 2, 2010 (Country Report No. 10/227). Data: Romania subscribes to the SDDS; data provision is adequate for surveillance (Informational Annex). Political developments: Prime Minister Ponta of the Socialist Democratic Party (PSD) came to power on May 7, 2012, with the support of the National Liberal Party (PNL), the Conservative Party, and independent parliamentarians. Parliament voted on July 6 to impeach President Basescu, but a required referendum held on July 29, 2012 did not achieve sufficient voter turnout to uphold the impeachment. Exchange Rate Regime: Romania has accepted the obligations of Article VIII and the exchange rate system is free of restrictions on current international payments and transfers. The de facto exchange rate arrangement is classified as floating and the de jure exchange rate arrangement as managed floating.

2
Contents Page
I. Executive Summary ................................................................................................................4
II. Context: A Vulnerable Recovery ..........................................................................................5
III. Program Implementation .....................................................................................................7
IV. Outlook and Risks................................................................................................................7
V. Policy Discussions ..............................................................................................................12 A. Main Challenges .....................................................................................................12 B. Achieving Fiscal Sustainability ...............................................................................12 C. Preserving Low Inflation with a Flexible Exchange Rate.......................................17 D. Maintaining Medium-Term External Sustainability ...............................................20 E. Developing a Resilient Banking System .................................................................22
VI. Medium-Term Perspective: Fostering Higher and Inclusive Growth ...............................24 A. Upgrading the Energy and Transportation Sectors .................................................26 B. Restructuring State-Owned Enterprises ..................................................................27 C. EU Funds Absorption ..............................................................................................27 D. Labor Market Reform .............................................................................................28
VII. Program Modalities and Other Issues ..............................................................................29
VIII. Staff Appraisal ................................................................................................................30 Boxes 1. Stand-By Arrangement ..........................................................................................................8 2. Medium Term Growth Potential ..........................................................................................10 3. Addressing the Challenges of the Healthcare System .........................................................17 4. Effectiveness of Interest Rate Transmission in Romania ....................................................19 5. Adequacy of International Reserves ....................................................................................20 6. Foreign Bank Deleveraging in Romania..............................................................................23 7. Main Amendments to Labor and Social Assistance Legislations ........................................29 Tables 1. Quantitative Program Targets ..............................................................................................34 2. Performance for Sixth Review .............................................................................................35 3. Selected Economic and Social Indicators, 2008–13 ............................................................36 4. Macroeconomic Framework, Current Policies, 2008–17 ....................................................37 5. Balance of Payments, 2008–17 ............................................................................................38 6. Gross Financing Requirements, 2010–13 ............................................................................39 7. General Government Operations, 2008–14 .........................................................................40 8. Monetary Survey, 2008–13 ..................................................................................................42 9. Financial Soundness Indicators, 2008–12 ............................................................................43

3
10. Schedule of Reviews and Purchases ..................................................................................44 11. Indicators of Fund Credit, 2012–17 ...................................................................................45 12. Public Sector Debt Sustainability Framework, 2007–17 ...................................................46 13. External Debt Sustainability Framework, 2007–17 ...........................................................47 Figures 1. Real Sector, 2007–12 ...........................................................................................................48 2. External Sector, 2007–12 .....................................................................................................49 3. Labor Sector, 2007–12 .........................................................................................................50 4. Monetary Sector, 2005–12 ...................................................................................................51 5. Fiscal Operations, 2005–12 .................................................................................................52 6. Financial Sector, 2007–12 ...................................................................................................53 7. Financial Developments .......................................................................................................54 8. Public Debt Sustainability: Bound Tests .............................................................................55 9. External Debt Sustainability: Bound Tests ..........................................................................56 Appendix I. Letter of Intent ......................................................................................................................57 Attachments I. Memorandum of Economic and Financial Policies ..............................................................59 II. Technical Memorandum of Understanding.........................................................................74

4
I. EXECUTIVE SUMMARY
1. Significant progress has been made in macroeconomic stabilization under two successive SBAs but the economic recovery remains fragile. Growth is expected to remain subdued in the near term and to only gradually recover over the medium term, with risks to the outlook mostly on the downside. With strong trade and financial sector linkages, Romania is exposed to the euro area crisis. Fiscal and external reserves provide a buffer and the banking sector remains well-capitalized. At the same time, the political situation has become more unsettling with three governments in 2012, uneasy cohabitation between the President and the governing coalition that has sought to remove him, and parliamentary elections to be held in the fall. The political uncertainty has contributed to accelerated exchange rate depreciation and higher financing costs, and has dented confidence.
2. Romania’s overall track record under the program continues to be good. All performance criteria for the sixth program review were met except the one on reducing central government arrears, which was missed by a small margin. All indicative targets, except the ceiling on the stock of local government arrears, were met. Corrective actions are being taken to reduce the stock of arrears and prevent accumulation of new arrears. The structural benchmarks on increasing electricity prices, integrating the accounting reporting system with the Treasury payment system, and preparing comprehensive amendments to the health care legislation were met. However, progress on the structural agenda, in particular privatization of public enterprises, has remained slow. As prior actions for completion of this review, the government has committed to undertake public offerings of shares in two public enterprises where preparations are more advanced.
3. A prudent fiscal and monetary policy stance and decisive implementation of the structural reform agenda are needed to ensure macroeconomic stability and increase growth.
Strong fiscal discipline will be needed, especially ahead of the upcoming parliamentary elections, to meet the fiscal program targets and achieve fiscal sustainability.
The monetary policy stance should lean towards tightening in light of risks to inflation as well as potential capital outflows and exchange rate pressures.
In the financial sector, where vulnerability to spillovers from euro-area parent banks to Romanian subsidiaries is high, measures are needed to ensure adequate capital and liquidity buffers, mitigate the rise in nonperforming loans, and finalize contingency plans.
Pressing ahead with structural reforms, in particular in the energy and transport sectors and of public enterprises, would provide a much-needed impetus for investment and growth. Improving EU funds absorption is a priority to unlock significant resources that would help further real convergence with other European countries.

5
II. CONTEXT: A VULNERABLE RECOVERY
4. Following the severe downturn during the 2008–09 crisis, Romania has made significant progress in restoring macroeconomic stability. Large external and fiscal imbalances were reduced to more sustainable levels under two consecutive IMF SBAs, supported by the European Union and the World Bank. The current account deficit declined sharply from 11½ percent of GDP in 2008 to 4½ percent in 2011, and the structural fiscal deficit narrowed from 7½ percent of GDP to 3 percent over the same period. Annual inflation dropped from a high of 8 percent at end-2010 to 2 percent in June 2012, partly reflecting the temporary impact of the good 2011 harvest. Core inflation fell from above 5 percent in 2008 to about 2 percent recently. The adjustment helped ease financing pressures as spreads narrowed considerably until the early part of 2012, and renewed access to the Eurobond market together with support from the EBRD covered fiscal and external financing needs.
5. Romania’s growth momentum during the post-crisis period remained weak. Growth resumed at 2½ percent in 2011, boosted by a bumper harvest, but nevertheless lagged behind most other European emerging economies. The unemployment rate increased from 5.8 percent in 2008 to 7.3 percent in 2010 and has remained elevated since then. With the euro area entering recession and domestic political tensions on the rise, recent developments point to a stronger growth slowdown in 2012 than previously expected. After two quarters of decline, real GDP rebounded by 0.5 percent (q/q) in 2012:Q2 on the back of solid domestic demand but high-frequency data indicate that the economy may have slowed again since May.
-2.0
-1.0
0.0
1.0
2.0
3.0
4.0
5.0
6.0
ROM LVA BGR LIT HUN CZE HRV POL
Change in Fiscal Structural Balance(in percent of GDP, 2008–11)
Romania has implemented a relatively large f iscal adjustment...
Sources: WEO and Eurostat.Note: Cyclically adjusted balances are used for HRV and LVA.
-5.0
0.0
5.0
10.0
15.0
20.0
25.0
30.0
BGR LVA LIT HUN HRV ROM POL CZE
Change in Current Account(in percent of GDP, 2008–12)
while current acount def icit has also reversed signif icantly...
Source: WEO
BGRCZE
EST
HUN
LVA LTU
POL
ROM
SVK
SVN 0.0
2.0
4.0
6.0
8.0
10.0
12.0
14.0
-30.0 -20.0 -10.0 0.0
Trou
gh to
201
1Q4
Peak (pre 2008:Q4) to trough
Crisis Growth Performance
Source: WEO; and IMF staff calculations.

6
6. Political uncertainty and market stress have increased. Protests against austerity measures precipitated the resignation of the Prime Minister in February 2012, and his successor lost a no-confidence vote shortly thereafter. The opposition took power on May 7, and subsequently won the June local elections. Amidst mounting frictions between the governing coalition and President Basescu, Parliament voted on July 6 to impeach the President. However, the required public referendum held on July 29 failed to garner the minimum turnout (more than 50 percent), thereby invalidating the results and restoring Mr. Basescu to the Presidency. Parliamentary elections are scheduled for December 9. Increased risk perception stemming from the overlapping of heightened political uncertainty with the euro area crisis led to a rise in the sovereign CDS spread for Romania by about 50 basis points since end-April. Yields on interbank loans and treasury bills have also climbed and the equity market has given up a little more than half of its gains from earlier in the year. Capital outflows in recent months have precipitated an exchange rate depreciation of about 3½ percent so far this year, compared to 2 percent during 2010–11.
7. The banking sector is vulnerable to spillovers from the euro area and the weak economic recovery. The banking system is 80 percent foreign owned (Austrian banks dominate with 38 percent of system assets and subsidiaries of Greek banks hold about 14 percent of system assets). Compared to regional peers, foreign bank deleveraging has been moderate thus far. Bank capitalization has remained strong at 14.7 percent at end-June and funding pressures have been contained with parent banks maintaining their commitments (partly owing to the European Banking Cooperative Initiative, EBCI) and steady deposit growth for the system as a whole. However, funding and capitalization have become more differentiated among banks. Nonperforming loans (NPLs) have risen to almost 17 percent by end-June 2012, due to the weak economic activity and the vulnerability of un-hedged borrowers of foreign-currency loans. Provisions at end-June covered 98 percent of the nonperforming loans.1 Bank profitability remains poor, mainly because of higher provisioning, and real credit growth has remained subdued amidst private sector deleveraging.
8. The authorities have incorporated key recommendations from the 2010 Article IV consultation into their economic programs. The authorities have sustained fiscal consolidation through continued expenditure reductions, including measures to keep the wage bill in check. In addition, significant pension reforms have improved the financial soundness of the public pension system while capital budgeting improvements are ongoing. The authorities have also implemented some of the advice on structural reforms. In particular, a roadmap for
1 Including IFRS provisions for NPLs of 69 percent and an additional prudential filter introduced at the time of transition to IFRS.
0100200300400500600700800900
7/1/
2008
9/23
/200
812
/16/
2008
3/10
/200
96/
2/20
098/
25/2
009
11/1
7/20
092/
9/20
105/
4/20
107/
27/2
010
10/1
9/20
101/
11/2
011
4/5/
2011
6/28
/201
19/
20/2
011
12/1
3/20
113/
6/20
125/
29/2
012
CDS, 5-Year
Bulgaria
Hungary
Romania
Risk premium declined since the crisis period but has come under increased market stress lately.
Source: Bloomberg.

7
energy price liberalization was adopted and labor market reforms have introduced more flexibility in employment relationships, which has contributed to some recovery in employment rates. However, progress toward reducing the state’s involvement in the energy and transportation sectors through divestment and improving corporate governance has been limited.
III. PROGRAM IMPLEMENTATION
9. All performance criteria and indicative targets for end-June were met except for those for central and local government arrears. Weaker fiscal discipline ahead of the local government elections and spending pressures in the health care sector resulted in missed arrears targets for end-June. Central government and social security arrears remained broadly flat compared to end-March and the performance criterion was missed by a small margin. However, local government arrears continued to increase and the indicative target was missed by almost 0.1 percent of GDP. Corrective actions are being taken to reduce arrears as described in the attached Memorandum of Economic and Financial Policies (MEFP, ¶5). Inflation remained within the inner band of the inflation consultation mechanism.
10. All structural benchmarks set for the review were met. Electricity prices were raised by five percent to ensure better cost recovery. On the fiscal side, as a further step towards implementing a commitment control system, a tender was launched for providing software to integrate the accounting reporting system with the Treasury payment system. A new draft of a comprehensive health care reform law was prepared and put up for public debate and consultation with the IMF, the EU, and the World Bank. However, the structural benchmark for holding initial public offerings (IPOs) of government shares in Hidroelectrica and Romgaz, scheduled for October, has been postponed to March 2013 pending resolution of the insolvency procedures for Hidroelectrica and further due diligence work on Romgaz.
IV. OUTLOOK AND RISKS
11. The macroeconomic outlook for 2012–13 is challenging. Economic activity is projected to pick up more slowly than previously anticipated while inflation is expected to rise but remain within the NBR target band.
Staff projects real GDP growth to slow to about 1 percent in 2012, and to gradually pick up to 2½ percent in 2013, due to diminished confidence, continued low capital inflows and EU funds absorption, and the slowdown in external demand related to the euro area recession. Moreover, the recent drought will weaken agricultural output in the second half of 2012. Unemployment would only slightly decline.

8
Box 1. Romania: Stand-By Arrangement
Access: SDR 3,090.6 million, 300 percent of quota.
Length: 24 months.
Phasing. SDR 60 million was made available upon effectiveness of the arrangement, which was approved on March 25, 2011, and became effective on March 31, 2011. The subsequent five disbursements amounting to SDR 2.15 billion became available during June 2011–June 2012 with the completion of the first through fifth reviews. SDR 430 million will be made available subject to the completion of this review. Two subsequent disbursements, totaling SDR 450.6 million, are contingent upon completion of the seventh and eighth reviews.
Conditionality
Quantitative Performance Criteria A floor on the change in net foreign assets A floor on the overall general government cash balance A ceiling on central government and social security domestic arrears A ceiling on general government guarantees Non-accumulation of external debt arrears Quantitative Indicative Targets A ceiling on general government current primary spending A ceiling on local government domestic arrears A floor on the operating balance and a ceiling on arrears of the key public enterprises A ceiling on the execution of the National Development and Infrastructure Program (PNDI) A consultation band around the 12-month rate of inflation of consumer prices Prior Actions Approve government ordinance to allow that: (i) resources available to local governments, currently limited to co-financing investment, can be used for paying arrears; and (ii) the central government can directly pay off arrears of local governments from shared taxes. Increase gas prices for non-residential consumers by 10 percent and for households by 5 percent. Launch the tender for a secondary public offering of 15 percent of Transgaz shares. Launch the tender for the majority privatization of Oltchim.
Structural Benchmarks Prepare comprehensive amendments to the health care legislation to address the persistent budgetary shortfalls and to ensure high quality health care services; by June 30, 2012. Launch tender for providing software to integrate the accounting reporting system with the Treasury payment system; by June 30, 2012. Increase by 5 percent the electricity price for both residential and nonresidential consumers; by June 30, 2012. Hold IPOs of government shares in Romgaz and Hidroelectrica; by March 15, 2013(reset). Update of the investment database to identify priority local government projects funded through budgetary and EU funds, and publication a list of low priority projects which will be discontinued; by September 30, 2012. Publish up-to-date financial statements of all public hospitals on a webpage of the Ministry of Health; by October 30, 2012. Sign contract with legal and transaction advisor for majority privatization of Oltenia; by November 30, 2012. Finalize a detailed definition of the structural architecture of the accounting and treasury reporting system; by December 30, 2012.

9
Upper band (+1)
Lower band (-1)
7.5
5.0
4.0 3.8 3.5 3.53.0
3.0
Projections
012345678910
0123456789
10
Dec
-05
Mar
-06
Jun-
06Se
p-06
Dec
-06
Mar
-07
Jun-
07Se
p-07
Dec
-07
Mar
-08
Jun-
08Se
p-08
Dec
-08
Mar
-09
Jun-
09Se
p-09
Dec
-09
Mar
-10
Jun-
10Se
p-10
Dec
-10
Mar
-11
Jun-
11Se
p-11
Dec
-11
Mar
-12
Jun-
12Se
p-12
Dec
-12
Target s
HICP inflation
Source: Haver; and IMF staff estimates.
After several years of target misses, inflation is expected to remain within the target band.
Inflation Targets and Outcomes (Percent) Headline inflation is projected to increase over the summer as favorable base effects on food prices recede. In addition, inflation is pushed up due to pass-through of the recent leu depreciation, rising international food prices, and expected increases in administrative prices. Nevertheless, headline inflation is projected to remain within the central bank’s target band, reaching 3.6 percent by year-end and, given the sizable output gap, abating to 3.2 percent by end-2013.
The external current account deficit is projected to narrow to below 4 percent of GDP in 2012–13 as net capital inflows would remain low and sluggish domestic demand weakens import growth. Under the baseline scenario, no financing gap is envisaged, consistent with the program’s precautionary nature.
12. Growth will remain subdued over the medium term as the output gap narrows (Box 2). Potential growth is projected to gradually reach 3 percent over the medium term. Increases in the capital stock and productivity improvements, partly on account of EU funds absorption and structural reform, would be the main growth drivers in the coming years. The unemployment rate would moderate to about 6 percent as economic activity picks up and recent reforms of the labor legislation support employment. Inflation is expected to stabilize within the new target range of 2.5 +/- 1 percent. The current account deficit would widen to around 4½ percent of GDP over the medium term, consistent with investment needs exceeding national savings to achieve real convergence over time.
13. Risks to the outlook, particularly in the short term, are firmly on the downside (Risk Assessment Matrix). Prolonged political instability could hamper effective economic policy making, derailing program implementation and increasing risk premiums/financing costs while further depreciating the exchange rate. Continued low EU funds absorption would undermine growth prospects. Romania has strong trade and financial linkages with the euro area. In the event of a deeper recession or financial crisis in the euro area, exports would fall in line with the drop in euro area activity; risk premiums would rise and capital inflows could decline further, increasing bank funding costs and depreciating the currency; bank credit would fall as deleveraging accelerates; and confidence would plummet, dragging down domestic demand further. Romania’s sizable gross external financing needs for the second half of 2012 (almost 15 percent of GDP, of which 60 percent is short term) also pose risks. Judging by
‐8
-6
-4
-2
0
2
4
6
8
-8
-6
-4
-2
0
2
4
6
8
2007 2008 2009 2010 2011E 2012P 2013P
Real GDP Growth: Risks to the Forecast (percent change)
90 percent confidenceinterval
70 percent confidence interval
50 percent confidenceinterval
Sources: WEO; and IMF staff calculations.

10
Romania’s experience in 2008–10, an economic contraction of up to 5 percent could be possible, notwithstanding existing fiscal and foreign exchange buffers. On the upside, a speedy normalization of the political situation and acceleration of reforms or a stronger global recovery could boost market sentiment and activity. Inflation risks are tilted to the upside, including from higher-than-expected world food prices.2
Box 2. Romania: Medium-Term Growth Potential
Output contracted sharply during the global crisis and is expected to recover only gradually. In the run up to the crisis, Romania’s growth was driven by structural reforms, productivity increases, and increasingly by foreign-financed investment. With the onset of the crisis, the boom came to a halt and unemployment increased. Medium-term growth projections have been revised down from 4 percent to 3.5 percent due to delays in structural reforms and a lower-than-expected capacity to absorb EU funds.
Measuring potential output involves a high degree of uncertainty in transition economies that experienced boom-bust cycles. The Romanian economy underwent substantial structural changes that spurred an uptake in growth while the declining manufacturing sector pushed large numbers of workers out of the labor force. Therefore, various techniques were used to determine the extent to which potential output was scarred by the crisis (based on a Hodrick-Prescott (HP) filter, a production function (PF) approach and a multivariate (MV) filter; see Selected Issues Paper, Chapter 1). Estimates of potential output that are based on HP filtering have known deficiencies related to end-point estimates and ignore relevant information in structural economic relationships. The MV filter proposed in Benes et al (2010) could serve to avoid such pitfalls and is chosen as the benchmark model.
The MV filter projects that potential growth will take time to recover and that the output gap would narrow only gradually. Potential growth is projected to remain below 2 percent until 2014 and to increase only gradually to 3 percent by 2017. The slow recovery suggests that the crisis has indeed left lasting scars in the economy. The implied negative output gap is larger and more persistent than predicted by the HP filter and the PF approach, remaining negative throughout the projection horizon.
2 In staff’s view, the mid-year public-sector salary increase is unlikely to have a marked effect on private wages and inflation. There is little demonstration effect, as it is merely a restoration of past cuts that were not followed in the private sector. Reductions in public employment also mitigate its effect on the private labor market.
-8
-6
-4
-2
0
2
4
6
8
10
2001
2002
2003
2004
2005
2006
2007
2008
2009
2010
2011
2012
2013
2014
2015
2016
2017
Actual growth (proj.)
Multivariate model
HP filter
Production function
Potential GDP Growth
Sources: WEO; Haver; and IMF staff estimates.
-6
-4
-2
0
2
4
6
8
2000
2001
2002
2003
2004
2005
2006
2007
2008
2009
2010
2011
2012
2013
2014
2015
2016
2017
Multivariate model
HP filter
Production function
Output Gap
Sources: WEO; Haver; and IMF staff estimates.

11
Romania: Risk Assessment Matrix3
Nature/Source of Main Threats
Overall Level of Concern
Likelihood of Severe Realization of Threat in the Next 1-3 Years and Channel of Vulnerability
(high, medium, or low)
Expected Impact if Threat is Realized (high, medium, or low)
1. Public/political backlash against reforms
High Reform fatigue is settling in as evidenced by street protests
earlier this year against a proposed healthcare reform bill and austerity.
The current government is the third one this year and parliamentary elections are scheduled for this fall.
Medium Structural reforms initiatives would be put on hold,
dampening growth prospects.
Could induce loss of consumer and investor confidence and more financial market volatility, including pressure on the exchange rate.
2. EU funds absorption falls short of expectations.
High EU funds absorption this year is running well below the stated
goal.
In mid-June, the government revised the absorption goal for 2012 downwards from €6 billion to €5.6 billion.
Medium Growth projections rely heavily on anticipated
pick up in EU funds absorption.
Growth could be lower in the medium term, if EU funds absorption falls well short of expectations.
Implementation capacity needs to be improved
3. Strong intensification of euro area crisis
Medium Romania has strong trade and financial links with euro area
members. Exports to Germany, Italy, and France comprise about 40 percent of total exports and the banking system is largely owned by euro area banks.
Foreign-currency denominated loans comprise about 60 percent of bank loans to the private sector.
High Judging by the experience in 2008–10, a drop of
up to 5 percent in GDP could be possible.
An exchange rate depreciation of 15–20 percent could seriously impact bank portfolios.
ELA might be necessary along with drawing on the program. Automatic stabilizers should be allowed to operate.
4. Acceleration of foreign-bank deleveraging
Medium The largest 9 foreign-owned banks reduced their exposure by
7 percent from end-December 2011 to end-July 2012.
High Credit would plummet, dragging down investment
and consumption, and NPLs would spike.
Intensified pressure on exchange rate and possible deterioration of bank balance sheets (see above).
ELA might be necessary to shore up banks’ funding.
In extreme case, bank intervention may be necessary if depositors lose confidence in individual banks.
5. Drying up of financial markets.
Low Government rollover needs in Q3 and Q4 of 2012 amount to
25.2 billion lei (4 percent of GDP).
Foreign liabilities of the banking system amount to around €23.3 billion (17 percent of GDP), of which €9.4 billion fall due over the next 12 months, including roughly €1.6 billion to nonparent depositors and creditors.
Medium Fiscal buffers and foreign exchange reserves cover
most of the maturing debt in the short term.
However, some fiscal tightening and program financing could be necessary.
3 The Risks Assessment Matrix shows events that could materially alter the baseline path discussed in this report (which is the scenario most likely to materialize in the view of the staff). The relative likelyhood of risks listed is the staff’s subjective assessment of the risks surrounding this baseline. The RAM reflects staff's views on the source of risks and overall level of concerns as of the time of discussions with the authorities.

12
14. A severe economic downturn together with a depreciation shock would significantly weaken banks’ capital buffers. The high dependency of Romanian banks on parent funding and the high share of foreign-currency lending (about two-thirds of total credit) expose the banking sector to two major sources of risk: (i) liquidity risks in case inflows from abroad dry up or deposits are withdrawn; and (ii) foreign-exchange risk through the banks’ exposure to un-hedged businesses and households. Further deterioration of economic conditions would also adversely impact asset quality, funding costs and profitability. A depreciation shock and economic downturn of the magnitude seen in 2008–09 would significantly weaken banks’ capital buffers. Updated stress tests by the NBR show that the overall banking system could withstand a deterioration of the economic environment but some individual banks would be challenged.
V. POLICY DISCUSSIONS
A. Main Challenges
15. Romania’s main economic challenges are to secure macroeconomic stability and boost growth. The authorities were aware of the importance of bolstering their credibility in economic policy making and considered that decisive implementation of their economic program supported by the IMF, EU, and World Bank would provide a critical anchor to achieve these goals. In this regard, the main priorities are:
Maintaining strong fiscal discipline to ensure the targeted deficit reduction for 2012–13, reduce payments arrears, and achieve fiscal sustainability by 2014. A financially viable health care reform is important to deal with rising aging costs over the longer term;
Adhering to a prudent monetary policy stance in light of risks to inflation, potential capital outflows, and exchange rate pressures;
Ensuring that banks have sufficient capital and liquidity while refining contingency plans to deal with contagion from abroad and mitigating the rise in nonperforming loans;
Reviving growth and job creation through a more conducive business environment, far-reaching reforms in the energy and transport sectors, public enterprise reform, higher absorption of EU funds, and continued implementation of the recent labor market reform.
B. Achieving Fiscal Sustainability
16. Romania has undertaken significant fiscal adjustments since 2009. The general government deficit (ESA terms) has been brought down from 9 percent of GDP in 2009 to 5.2 percent in 2011, and is targeted to reach 3 percent of GDP in 2012, as required under the EU Excessive Deficit Procedure. This has been achieved largely through expenditure

13
containment, in particular of the public-sector wage bill and pensions. The pro-cyclical adjustment was needed to halt the rapid increase in the public debt ratio during 2009–10 (to above 30 percent of GDP) and restore market confidence.
17. Fiscal performance under the program has remained on track. In the first half of the year, tax revenues over-performed slightly and overall spending was contained as strict control was maintained over current spending, with a continued decline in public employment. Some resources were reallocated to higher capital spending and co-financing for EU-funded projects, while the execution of off-budget National Development and Infrastructure Program (PNDI) projects was contained. However, the arrears targets for both the central and the local governments were missed.
18. The government is determined to exercise continued expenditure restraint, in order to achieve the 2012 deficit target. The cash deficit target was increased by 0.3 percentage point to 2.2 percent of GDP (consistent with a 3 percent of GDP deficit in ESA terms) during the last review to accommodate an increase in public wages by 8 percent in July, partially reversing the crisis-related cuts in mid-2010, and to compensate pensioners for health contribution payments ruled illegal by the Constitutional Court. Nevertheless, the public sector wage bill will remain at 6.7 percent of GDP, as in 2011. To protect against possible adverse developments, the government has frozen 10 percent of state budget allocations. The authorities are also
-10
0
10
20
30
40
50
60
IE EL PT ES UK SI CY SK
EU-2
7 FR LT RO CZ
NL
DE IT FI LV MT LU BE AT PL EE BG DK
HU SE
Change in Debt, 2009–12 (In percent of GDP)
Source: Eurostat.
-4-202468
101214
EL RO PT LV SP UK
PO LT IE CY SK FR CZ IT
EU-2
7BG SV BE N
EH
U DE
MT
AU FI LU SW ES DK
Change in Cyclically Adjusted Balance (ESA), 2009–12 (In percent of GDP)
Source: Eurostat.
AUTBEL
BGR
CYP
CZE
DNK
EST
FIN FRADEU
GRC
HUN
IRL
ITALVA LTU
LUX
MLTNLD
POL
PRT
ROM
SVK
SVN ESP
SWEGBR
0.01.02.03.04.05.06.07.08.09.0
3 4 5 6 7
Capi
tal S
pend
ng (
perc
ent
of G
DP)
Infrastructure Quality Index
Efficiency of Capital Spending in the EU-27, 2011
Source: Eurostat; World Competitiveness Report.
January to June 2012 Performance Cumulative, mil lei Program Actual Diff
Total revenue 94.0 93.1 -0.9 Current revenue 88.1 89.7 1.6
Tax revenue 79.8 80.4 0.7 Nontax revenue 8.4 9.3 0.9
Capital revenue 0.46 0.3 -0.2 Grants 5.5 3.2 -2.3 Financial operations -0.1 -0.2 -0.1
Total expenditure 100.6 99.8 -0.8 Current 93.3 92.3 -1.1 Capital 7.4 7.9 0.6 Reserve fund 0.1 0.0 -0.1 Net lending -0.2 -0.3 -0.2
Deficit/Surplus -6.6 -6.8 -0.2Deficit/Surplus including PNDI and CFR loan -7.8 -7.6 0.1
Source: Romanian authorities.

14
working with the World Bank to prioritize public investment and discontinue low quality projects (structural benchmark for local government projects). This is important in light of the relatively high level but low quality of public capital spending in Romania. Given the interruption of EU fund disbursements for a number of programs, the authorities will slow down capital outlays, while unspent funds from the PNDI will be saved. The government was also resolved to firmly resist pressures to relax fiscal discipline ahead of the parliamentary elections in the fall.
19. The government is seeking to strengthen tax collections, mainly through improved administrative measures. Despite high rates for the VAT and social security contributions, the narrow tax base and weak compliance have reduced revenue yields in Romania compared to regional peers. The tax authority has begun integrating social contributions with tax collections. Measures to streamline the tax system for capital gains and for the sale of bank receivables have been enacted. Additional measures will be undertaken, including moving VAT collection onto a cash accounting basis for small businesses, revising the base for property taxes, and enlarging the tax base in agriculture and for the self-employed (MEFP ¶14). Administrative measures will also be undertaken, with technical assistance from the IMF and the World Bank, to improve tax collection (MEFP ¶15). The authorities agreed that new tax measures such as the possible introduction of a progressive tax regime will be discussed with the IMF and the EU prior to implementation.
20. Reducing arrears remains a challenge. Government arrears have increased again since early 2012, and now stand at around 0.2 percent of GDP (mostly in local governments). In SOEs monitored under the program, arrears in the second quarter of 2012 stood at 3.3 percent of GDP, below the indicative program ceiling. The authorities are undertaking several measures to redress this problem:
To introduce a commitment control system, the government continues to work on integrating the accounting reporting system with the Treasury payment system. A detailed definition of the structural architecture of the system will be prepared by end- 2012 (structural benchmark) with the aim of conducting trial runs in 2013.
Arrears at the local government level also reflected unfunded commitments made
EE 0.83 CZ 1.1 BG 1.0 BG 0.4
SL 0.72 EE 0.9 LT 0.9 CZ 0.4
BG 0.71 PL 0.9 RO 0.8 SL 0.3
CZ 0.69 SL 0.9 LV 0.8 SK 0.3
HU 0.64 SK 0.9 EE 0.7 RO 0.2
LT 0.59 HU 0.8 HU 0.7 PL 0.2
SK 0.58 LT 0.8 PL 0.7 LV 0.2
PL 2/ 0.55 BG 0.8 CZ 0.6 EE 0.1
RO 0.55 LV 0.7 SK 0.6 HU 0.1
LV 0.50 RO 0.6 SL 0.6 LT 0.1
Source: Fiscal Council of Romania.
2/ 2010 data for Poland.
1/ Revenue Productivity is measured as the ratio of revenues (as a share of respective tax
base) to tax rate.
VAT SSC PIT CIT
Revenue Productivity 1/
2010 2011March June
Total 25.8 22.1 24.1 21.5 Central government 0.2 0.1 0.1 0.1 Local government 0.9 0.8 0.8 1.2 State-owned enterprises 1/ 24.7 21.2 23.2 20.2
Memorandum: Nominal GDP 522.6 578.6 607.8 607.3Source: Romanian authorities.1/ Based on preliminary and possibly incomplete data
2012
Arrears(In billions of lei)

15
during the pre-election period, which shows serious shortcomings in the monitoring and enforcement of the Local Government Public Finance Law (LGPFL). To address this problem, the authorities will, as a prior action, approve a government ordinance to ensure that tax-sharing resources available to local governments will be used to reduce arrears (MEFP ¶11). In addition, the central government, jointly with the Court of Accounts, will strictly enforce sanctions on local governments that breach the LGPFL.
In the health sector, arrears at the Health Insurance Fund have been eliminated but hospital arrears—albeit small in magnitude—remain. The clawback tax will be fully used to pay down outstanding bills and ensure non-accumulation of arrears in the pharmaceutical sector. This should also help to prepare for the implementation of the EU Late Payments Directive in March 2013. The authorities will step up monitoring of public hospital budget execution and publish up-to-date financial statements of all public hospitals (structural benchmark). Mandatory financial audits of all public hospitals will be established and sanctions will be introduced for hospital managers overspending their budgets. Additional short-term measures for cost control will also be introduced (MEFP ¶12). However, the implementation of the co-payment law has been deferred until after the elections to 2013.
For SOEs, the authorities are making progress in reducing arrears in monitored companies through swap operations, payments, and other financial operations. These measures should permit arrears of companies under monitoring to be reduced by RON 4 to 5 billion (three-quarters of a percent of GDP) in the second half of 2012.
21. The government agreed with the importance of maintaining adequate fiscal buffers. After some over-financing in the first part of 2012, recent treasury auctions at rising yields have been below planned levels and fiscal buffers have declined. However, in view of the considerable downside risks to the outlook, the fiscal buffers should be rebuilt when possible back to the target of covering at least four months of gross financing needs. To limit debt service costs and reduce rollover risks, the debt management strategy should seek to diversify the investor base and continue to develop the yield curve.
22. The government’s medium-term fiscal strategy envisages some further consolidation in 2013–14. Following the large fiscal adjustment since 2009, achieving fiscal sustainability is now within reach. The government plans to undertake a structural effort of ½ percent of GDP in 2013–14, in order to reach the current Medium-Term Objective (MTO) of a structural deficit of 0.7 percent of GDP. In staff’s view, with significant pension reforms already underway, further efforts to address age-related spending pressures should directly target the health

16
0
2
4
6
8
10
12
Net
herla
nds
Fran
ceG
erm
any
Den
mar
kPo
rtug
alA
ustr
iaBe
lgiu
mG
reec
eU
nite
d Ki
ngdo
mSw
eden
Spai
nIta
lySl
oven
iaIre
land
Finl
and
Slov
akia
Mal
taCz
ech
Repu
blic
Luxe
mbo
urg
Pola
ndH
unga
ryLi
thua
nia
Bulg
aria
Latv
iaEs
toni
aCy
prus
Rom
ania
Total Health Expenditure (Share of GDP, 2010)
Unweighted average = 9.0
Source: WHO Global Health Expenditure Database.
sector (MEPF ¶12), rather than aiming for a MTO that is more ambitious than required under the EU Fiscal Compact (structural deficit below 1 percent of GDP; see Selected Issues Paper, Chapter 3). In the event of a significant downturn, the government should allow automatic stabilizers to operate freely. Under such circumstances, it will be important to specify a credible multi-year consolidation strategy to be implemented once the economy recovers.
23. Amendments to the fiscal framework are being considered to help cement policy discipline. The Fiscal Responsibility Law introduced expenditure-based fiscal rules, established an independent fiscal council and improved budgetary procedures significantly. To meet the institutional requirements of the EU Fiscal Compact, the authorities are considering adoption of a fiscal rule on the structural budget balance target as well as of automatic correction mechanisms in case debt levels exceed certain thresholds. The role of the independent fiscal council, established in 2010, should also be strengthened.
24. Entitlement reform remains a key challenge to ensure fiscal sustainability. The medium-term outlook for fiscal sustainability is favorable by EU standards. Public debt, at 34½ percent of GDP, remains moderate, and is expected to decline to 31 percent of GDP by 2017 under the baseline scenario. While demographic pressures are significant, the 2010 pension reform has helped address some of these challenges by increasing the statutory retirement age, limiting pension indexation to inflation, widening the contribution base and tightening eligibility for early and invalidity pensions. Further action may be needed in the future to keep the pension age in line with rising life expectancy. In the healthcare sector, cost pressures remain high and spending is expected to increase by more than one percent of GDP by 2030. Beyond 2030, age-related spending pressures are expected to accelerate.
25. A comprehensive reform of the healthcare system is currently being debated. A revised draft of a new framework law has been published for public consultation (structural benchmark), which will be submitted to parliament by end-2012, along with impact assessments of the reform options. The reform aims to raise the efficiency of healthcare spending in
0.0
2.0
4.0
6.0
8.0
10.0
12.0
2010 2020 2030 2060
Public Health Spending (In percent of GDP)
RO
EU27
Source: European Commission Ageing Report, 2012.Note: For health care spending, cost convergence scenario is used.
0.02.04.06.08.0
10.012.014.016.0
2010 2020 2030 2060
Public Pensions (In percent of GDP)
RO
EU27
Source: European Commission Ageing Report, 2012.

17
Romania, enhance service quality, and address the persistent budgetary shortfalls. Over the medium and longer term, given that public healthcare spending is among the lowest in the EU, the reforms seek to ensure adequate financing of the system, while factoring in the costs of population aging into future spending needs (Box 3).
Box 3. Romania: Addressing the Challenges of the Healthcare System
The Romanian authorities face four major challenges reforming the healthcare system: (i) eliminating current financial imbalances; (ii) tackling inefficiencies; (iii) improving healthcare services and health outcomes; and (iv) establishing a long-term sustainable funding structure. The government’s draft law contains a number of measures aimed at reducing financial imbalances, including by establishing the “real cost of treatment” of hospital care. Other measures include granting hospitals greater autonomy, and introducing a flat-rate co-payment and vice taxes which can directly benefit the social health insurance fund. On the spending side, one of the main measures to improve healthcare services would be to establish a strategic network of state-owned hospitals across the country. The government intends to reduce inefficiencies by letting mutual healthcare insurers compete on service quality for the newly-defined basic package and negotiate directly with the healthcare providers. The draft law also envisions that private insurers could offer voluntary insurance supplementing a newly-defined basic package. While the draft law appears to go in the right direction in some areas, further measures are needed to ensure that the government can meet its challenges. For example, the implications of increased hospital autonomy on the behavior of hospital managers would need to be analyzed more carefully. The central government should monitor hospitals closely, intervene if necessary and have bankruptcy procedures in place. The value added of the mutual insurers would also have to be established clearly. The draft law also does not fully address the challenge of ensuring long-term financial viability. Measures to do so could include a widening of the contribution base, raising contribution rates and improving the collection efficiency of general taxation (see Selected Issues Paper, Chapter 4). Evidence that voluntary supplementary health insurance can be a major source of revenue is mixed.
C. Preserving Low Inflation with a Flexible Exchange Rate
26. The monetary easing cycle has ended as exchange rate pressures intensified. The negative output gap and falling inflation allowed the NBR to reduce its policy rate in four steps by a cumulative 100 basis points to 5.25 percent over the six-month period to April. The central bank also stepped up its repo operations, in part to offset intervention in the foreign exchange market. However, with capital outflows on the rise and increasing domestic and external uncertainties, the central bank has kept the policy rate constant since May. More recently, liquidity injections through repo operations have been reduced. Consequently, the

18
interbank rate has increased to close to the policy rate. Nonetheless, the depreciation against the euro since the beginning of the year had a loosening effect on monetary conditions.
27. Inflation dynamics and risks of further exchange rate depreciation warrant a prudent monetary policy stance, supported by a consistent macroeconomic policy mix. Inflation is expected to rebound towards the upper end of the target band later in the year with risks tilted to the upside. Also, given that Romania has a history of high inflation, anchoring inflation expectations will remain a challenge. Moreover, lower capital inflows and central bank intervention to smooth exchange rate pressures have reduced international reserves. With these factors in mind, the authorities agreed with the need for a prudent monetary policy stance, in order to help contain capital outflows and exchange rate depreciation, and further anchor inflation expectations. The authorities indicated that they will maintain existing bank reserve requirements, and increase the policy rate if exchange rate pressures persist. To strengthen the transmission mechanism, the authorities should continue to build credibility pursue efforts to deepen equity and bond markets, promote financial sector development, and improve regulatory quality in the economy as a whole. (Box 4).
28. The NBR should avoid excessive intervention in support of the leu beyond smoothing exchange rate volatility, allowing for some depreciation as long as inflation is expected to remain within the target band and balance sheet effects (stemming from the sizable legacy stock of foreign-currency bank loans to un-hedged borrowers) are manageable. Amidst a difficult external environment and political uncertainty, maintaining adequate reserve buffers provides an important cushion against shocks (Box 5). The program target on net foreign assets of the NBR has been revised downwards to reflect the projected decline in capital inflows in the wake of the euro crisis and political uncertainty, while ensuring continued full coverage of short-term debt at remaining maturities.
-0.06
-0.04
-0.02
0.00
0.02
0.04
0.06
0.08
-0.08
-0.05
-0.03
0.00
0.03
0.05
0.08
2008M1 2008M8 2009M3 2009M10 2010M5 2010M12 2011M7 2012M2
MCI
Real Interest rate contribution (rhs)
REER contribution (rhs)
Sources: Bloomberg; IFS; and IMF staff estimates.1/ Weighted average of the annual change in the three-month real interbank offer rate and the realeffective exchange rate (at a ratio of 1.5 to 1).
Monetary conditions have started to tighten recently.
Real Monetary Conditions Index (MCI) 1/
2
7
12
17
22
27
Jan-
07
Apr
-07
Jul-
07
Oct
-07
Jan-
08
Apr
-08
Jul-
08
Oct
-08
Jan-
09
Apr
-09
Jul-
09
Oct
-09
Jan-
10
Apr
-10
Jul-
10
Oct
-10
Jan-
11
Apr
-11
Jul-
11
Oct
-11
Jan-
12
Apr
-12
Jul-
12
Deposits (new)Lending (new loans)Policy rateInterbank rateTbill primary market
Sources: NBR; and Haver.
Interest Rates on RON Instruments(Percent)
Interest rates have fallen over time but the central bank has recently ended its easing cycle.

19
Box 4. Effectiveness of Interest Rate Transmission in Romania
Effective interest rate transmission is crucial for the NBR to signal its monetary policy stance in a credible manner. Under the current inflation targeting monetary policy framework, the central bank sets its reference interest rate to signal its policy stance and uses open market operations to control liquidity in the banking system. Long-run pass-through of changes in the policy rate to interbank rates has been close to complete, but impulses are transmitted slowly (see Selected Issues Paper, Chapter 5). Rolling regressions, using data since August 2005 when the inflation targeting regime was put into place, suggest that long-run pass-through from the policy rate to money market rates was initially below 80 percent but has since increased to close to 100 percent. The speed of transmission also improved but continues to be relatively low, with only about 80 percent of total pass-through reaching market rates within two months following a policy change.
Pass-through to retail lending rates was initially weak but now compares well to that in other emerging markets. The findings suggests that pass-through to retail lending rates reached over 70 percent for the period as a whole, placing Romania above the median for emerging markets. However, short-run pass-through was low in the early years of inflation targeting—just above 20 percent—and increased to a moderate 60 percent in recent years. A more effective transmission mechanism would require a more developed and better regulated financial system. Based on a structural panel vector auto-regression, staff finds that countries with effective interest rate transmission have a strong monetary policy mandate, a good overall economic regulatory environment, and a well developed and healthy financial system. While the monetary policy framework in Romania is adequate, financial markets remain shallow compared to most of Romania’s peers, are highly dollarized, and frequently have excess liquidity.
0
0.2
0.4
0.6
0.8
1
1.2
2007
m12
2008
m5
2008
m10
2009
m3
2009
m8
2010
m1
2010
m6
2010
m11
2011
m4
2011
m9
2012
m2
Pass
-thr
ough
Long- and Short Run Pass-Through: ARDL ModelRolling Regressions Controlling for 2008:Q2-2009:Q2
Lending rate, long run pass-through
Lending rate, share of pass-through after two monthsIB rate, long run pass-through
IB rate, share of pass-through after two months
Sources: WEO; Haver; and IMF staff estimates.
20
Box 5. Romania: Adequacy of International Reserves
Reserves are above most standard rules-of-thumb. The reserve level of EUR 36.6 billion at end- July 2012 fully covered external short-term debt (at remaining maturity), as recommended by the so-called “Greenspan-Guidotti” rule, the most commonly used reserve metric for emerging markets. Coverage of prospective imports was seven months, well above the three months benchmark, and broad money coverage, intended to capture the risk of capital flight, was above the 20 percent reference level. International reserves are also higher than suggested by a new reserve adequacy metric developed by Fund staff for emerging markets, which balances the costs and benefits of holding reserves.1/
Romania’s own history suggests taking a prudent stance as international reserves provide a buffer in an uncertain environment. Prior to the global crisis, international reserves seemed appropriate by most metrics, but fell short of fully covering short-term debt. During the period of economic and financial stress, external debt shifted further towards short-term maturities, exposing the country to capital flight. Since then, maintaining full coverage of short-term external debt has been a key objective of IMF supported programs. By end-2013, reserve coverage is expected to decline to a still comfortable 87½ percent as large Fund repayments come due.
_________________________
1/ The new reserve adequacy metric is constructed based on the empirically observed relative riskiness of different potential drains on reserves and the amount of liquid reserve assets that should be held against each of these risk factors based on past crisis experience across countries. See IMF (2011) “Assessing Reserve Adequacy”, IMF Policy Papers, Washington, DC.
D. Maintaining Medium-Term External Sustainability
29. Staff’s exchange rate assessment indicates that the currency is broadly in line with fundamentals. The CGER external sustainability and macroeconomic balance approaches suggest a marginal undervaluation of the exchange rate of around ½ to 1 percent, while the equilibrium real exchange rate approach suggests a slightly higher undervaluation of about
60
80
100
120
140
160
180
200
2000 2001 2002 2003 2004 2005 2006 2007 2008 2009 2010 2011
Real exports to the EU over total EU real imports excl. oilReal effective exchange rate (+ = appreciation)
Sources: World Economic Outlook, Directions of Trade Statistics, INS, and IMF staff calculations.
Market Share and Real Effective Exchange Rate(Index, 2000 = 100)
0
10
20
30
40
50
60
70
80
Romania Czech Republic Hungary Poland Serbia
International Reserves Relative to Adequacy Metrics (July 2012, In percent of GDP)
ReservesNew reserve metric (100-150 percent)3 months of prospective imports100 percent of short-term debt20 percent of M2
Note: Reserves are as of July 2012, while all other variables are as of 2011, except for prospective imports (for 2012).Sources: WEO; International Financial Statistics; and IMF staff calculations.

21
4¾ percent, which is within the margin of error. In addition, competitiveness has improved with the REER depreciating by 8 percent as of end-June 2012 (y-o-y) and Romania continues to gain export market share in the EU. However, structural conditions continue holding back external competitiveness (see Selected Issues Paper, Chapter 7).
30. The external debt sustainability analysis indicates that the projected current account deficits are sustainable. Gross external debt stood at 73 percent of GDP at end-June 2012, one-third of which was public debt. Around one-fifth of external debt is at short-term maturities, mainly of the non-bank private sector. The projected medium-term current account deficit of 4½ percent of GDP is in line with a declining external debt-to-GDP ratio. Bound tests indicate that 30 percent depreciation would substantially increase the external debt-to-GDP ratio over the medium-term, while other standard shocks would only lead to a slower decline in the external debt ratio.
31. The current account deficits are expected to be financed comfortably over the medium term. The projected medium-term current account deficit is is line with the norm derivered from the macroeconomic balance approach and is consistent with a partial financing of domestic investment through foreign savings. Intercompany loans account for one-third of short-term external debt, reducing rollover risks. Financing assumptions are rather conservative with Romania’s FDI and current transfer inflows projected with a significant discount relative to pre-crisis levels. Medium-term FDI inflows are consistent with recent experience and do not include potential inflows from the privatization agenda. In addition, official current transfers are conservatively estimated as utilization of EU Funds allocated to Romania has remained low. Thus, there is significant upside to FDI inflows and official transfers if the privatization efforts materialize and Romania manages to better absorb EU funds.
32. Further progress in structural reform is needed to prepare for eventual euro adoption. The authorities’ stated objective is to join the euro area in 2015, but they view the target date more as a lever for reform to boost economic flexibility and productivity than as a strict deadline. The authorities were aware that the timetable for adopting the euro should take into account that entry into the euro area takes away the exchange rate as an important adjustment tool in the face of shocks or competitiveness pressures. Given the need for further structural reforms and improvements in public sector operations to prepare for euro adoption, the authorities were resolved to focus on implementing their economic program.
30
30.5
31
31.5
32
32.5
33
33.5
Mar-09 Sep-09 Mar-10 Sep-10 Mar-11 Sep-11 Mar-12
EBCI Parent Funding Exposure to Romania (Bn €)
Source: European Bank Coordination Initiative.

22
E. Developing a Resilient Banking System
33. Financial sector developments in Europe pose challenges to Romania’s banking system through several channels. Romania’s asset markets and spreads tend to co-move closely with its regional peers and have been strongly impacted by both the 2008 financial crisis and the intensification of the euro area crisis (see Selected Issues Paper, Chapter 6). Increases in Romania’s CDS and EMBIG spreads directly impact bank financing costs. The banks are also exposed to funding risk as deleveraging takes hold. The significant presence of Greek banks heightens these risks further.
34. A gradual parent funding retrenchment and fragmentation of interbank markets have led to a deterioration of bank liquidity for some banks. Compared to regional peers, foreign-owned bank deleveraging has been orderly and moderate so far (Box 6). Nevertheless, interbank markets are fragmented due to perceived counterparty risk, and some banks with strained liquidity have been offering above-average deposit rates to compensate for lower parent funding. Greek banks continue to have limited access to interbank funding and rely primarily on parents and swap markets as foreign exchange sources. To help reduce interbank market fragmentation, the NBR is preparing measures to enable banks to engage in collateralized interbank lending.
35. NPLs have steadily increased in recent years. Driven by the deterioration of the economic environment, leu depreciation, and the limited ability of banks to write them off, NPLs reached 16.8 percent in June (compared to 14 percent at end-2011). NPLs are highest for micro-enterprises and SMEs. NPLs among corporates are lower and mainly concentrated in the construction sector. Business loans denominated in leu (19 percent at June) performed worse than foreign-currency loans (16.4 percent), partly reflecting adverse selection since weaker corporates are more constrained in obtaining credit in foreign currency. Short-term loans also tended to perform worse than medium- and long-term credit. Solvency stress tests conducted by the NBR suggest that while the overall banking system is broadly resilient to further economic deterioration and exchange rate depreciation, a few banks would be challenged in case of large collateral price declines, shrinking net interest rate margins and higher interest rates.
36. Despite increasing strains, the Romanian banking sector maintains significant buffers to deal with further pressures. Reflecting continued
-
5.00
10.00
15.00
20.00
25.00
30.00
35.00
40.00
Mar
-08
Jul-
08
Nov
-08
Mar
-09
Jul-
09
Nov
-09
Mar
-10
Jul-
10
Nov
-10
Mar
-11
Jul-
11
Nov
-11
Mar
-12
NPL Rates by Corporate Type
SME
Micro
Small
Medium
Corporates
Sources: Romanian authorities.
17.3
15.9
17.5
15.3
14.6
15.9
17.9
14.8
18.1
28.4
11.8
19.9
17.5
17.5
14.2
14.6
15.0
14.9
20.7
23.8
16.6
17.2
16.4
12.8
15.8
15.3
14.3
14.9
0
5
10
15
20
25
30
Serb
ia 1/
Alba
nia
Bulg
aria
Lithu
ania
Rom
ania
Mon
tene
gro
Ukr
aine
Hun
gary
Latv
ia
Mol
dova
Slov
enia
Croa
tia BiH
Mac
edon
ia 1/
Pola
nd
Russ
ia 1/
Slov
ak R
epub
lic
Czec
h Re
publ
ic
Esto
nia
Bela
rus
Turk
ey
CESE
E av
erag
e
Germ
any
Fran
ce
Unite
d Ki
ngdo
m
Unite
d St
ates
Indi
a
Sout
h Af
rica
Capital Adequacy Ratio
Sources: Romanian authorities; IMF staff estimates.1/ Data shown capped at 100 percent. These countries report provision ratios above 100 percent, reflecting inclusion of general provisioning or provisions related to loans extended by non-resident parts of banking groups that also operate domestically.

23
Box 6. Foreign Bank Deleveraging in Romania
The risk of disruptive parent funding withdrawals by European banks from Central and Southeastern Europe (CESEE) has been a longstanding concern. Some orderly deleveraging, however, is unavoidable given past excessive credit booms and European banks’ decision to shrink non-core assets over time. However, disorderly foreign bank deleveraging could lead to a credit crunch with spillovers to the real economy.
Compared to regional peers, foreign bank deleveraging has been moderate so far, partly due to the EBCI. In July, the total exposure to Romania of the nine largest foreign banks that participated in the EBCI fell to 94 percent (against March 2009 exposure) from 101.3 percent at end-2011, notably due to reduced exposure to non-financial institutions. Exposure of parent banks to their subsidiaries has remained at a similar level between March 2009 and July 2012.
Overall bank system parent funding has been orderly, declining moderately since end-2011. At end-July, it stood at 89.2 percent of the end-2011 level. The decline in overall sector exposure of BIS reporting banks to Romania has been in the average for the CESEE (excl. Russia and Turkey) with a 20 percent deleveraging ($13.4bn) between 2008:Q3 and 2012:Q1, much less than in Ukraine (52.8 percent), Latvia (38.3 percent) or Hungary (38 percent). Relative to GDP, the 7.2 percentage points decline also compares favorably against many other CESEE countries. Part of the reduction in exposure can be explained by the reabsorption of loans by subsidiaries that during the credit boom period had been outsourced to SPVs and parent-related affiliates abroad. Furthermore, the majority of banks’ parent funding (close to 70 percent) has a maturity of over one year, preventing an abrupt withdrawal.
Deleveraging has been driven by different factors. Some causes for the orderly foreign bank deleveraging in Romania were weak parent banks (especially Greek banks), changes in parent funding strategy (e.g., some French banks) or some loss in domestic funding (e.g., Greek subsidiaries). If the overall financial sector environment were to further deteriorate, including with further rising NPLs and continued poor profitability, some parents could scale back long-term support for their subsidiaries, thus making them more reliant on domestic funding.
shareholder support and retained earnings, the capitalization of the banking sector remained strong at 14.7 percent at end-June, akin to regional levels, albeit with some differences between banks. All banks except one have a capital ratio above the regulatory minimum of 10 percent.4 Greek banks continue to exhibit capital buffers exceeding the system average, inter alia owing to capital injections from parent banks. The introduction of IFRS provisioning in early 2012 has gone smoothly. The maintenance of a prudential filter and pro-active bank supervision has ensured that a prudent provisioning regime remains in place.
4 The bank supervisor is undertaking intensive supervision in this case.
17.0
17.5
18.0
18.5
19.0
19.5
20.0
20.5
Dec-11 Jan-12 Feb-12 Mar-12 Apr-12 May-12 Jun-12 Jul-12
Bank System Parent Funding (In billion €)
Sources: BIS.

24
37. The authorities have introduced several regulatory and legislative changes that aim at safeguarding financial stability. The NBR adopted measures in 2011 to restrict foreign-currency lending to un-hedged household borrowers. The NBR has continued to closely oversee bank practices to avoid ever-greening so as to ensure that IFRS loan-loss provisioning and collateral valuations as well as the assessment of credit risk of restructured loans remain prudent and in line with good international practices. In June 2012, the fiscal code was amended to ensure a neutral tax treatment of bank receivables sold to Romanian firms, in order to enable banks to improve their balance sheet management. In addition, rigidities in insolvency and foreclosure procedures should be removed, including by implementing the forthcoming recommendations of the World Bank Report on Standards and Codes on insolvency and creditor rights.
38. The authorities have continued to strengthen their crisis management arrangements and contingency planning. In January 2012, amendments to the bank resolution legislation were adopted that introduce bridge bank and other resolution powers for dealing with failing banks. The NBR is finalizing the regulation on the authorization of the bridge bank and internal procedures for these newly-introduced bank resolution measures. The NBR, Deposit Guarantee Fund (DGF), and Ministry of Public Finance (MOPF) continue to coordinate the implementation of operational preparedness plans.5 The NBR and the DGF signed a Memorandum of Understanding that ensures the DGF will be given sufficient information on potential problem institutions early enough to enable it to meet its obligations effectively.
VI. MEDIUM-TERM PERSPECTIVE: FOSTERING HIGHER AND INCLUSIVE GROWTH
39. Convergence to EU standards of living has nearly stalled since the onset of the 2008–09 financial crisis. Over the decade preceding the crisis, strong productivity gains fuelled by a credit-led investment boom and prospective EU entry enabled Romania to reach nearly half the EU average per-capita income level. This increase occurred despite significant labor shedding during the transition. Labor utilization has remained fairly stagnant since then, likely reflecting rigid labor markets, demographic changes, and the large informal economy. Little progress in closing the income gap was made in recent years.
5 The deposit coverage ratio target of banks’ contributions to the DGF has been raised, a DGF resolution fund has been set up, and a contingent funding line with the MOPF has been established.

25
40. Romania remains one of the least economically developed members of the EU. Poverty rates are higher, the healthcare and education systems are underfunded and of relatively low quality, and convergence with EU norms lags other emerging European countries. Over the last two years, the authorities have started to address some of the causes for these poor outcomes through key pension and labor market reforms as well as measures to improve the regulatory and pricing framework for the energy sector. Nonetheless, since 2010, Romania has fallen behind other countries in terms of perceptions of corruption, ease of doing business, and global competitiveness.
41. The authorities agreed that unlocking a higher and inclusive growth potential will require decisive implementation of their ambitious reform agenda. To address the significant reform gaps, action should be taken to improve the business environment, reform the energy and transport sectors, re-invigorate public enterprise reform, and drastically upgrade the capacity to absorb EU funds. Reforms to improve education outcomes and increase employment rates as well as measures to protect the most vulnerable will be important.
42. A stable and predictable business environment is prerequisite to attracting more investment. In order to provide potential investors a clear perspective on their future rights and obligations, ad hoc changes in the legislation should be avoided as much as possible. Thorough preparation of new laws through consultation with all stakeholders and impact analyses would help to stabilize the legal and regulatory framework, and avoid unintended consequences. Better access to impartial and timely justice is needed to guarantee that the law applies to all and to limit costly distortions. There also remains ample scope to improve the transparency of
0
0.1
0.2
0.3
0.4
0.5
0.6
0.7
0.8
2000 2002 2004 2006 2008 2010
Inde
xGDP-PPP per Capita, Relative to EU-27, 2000‒11
Romania
Bulgaria
NMS-8
Sources: EUROSTAT; and IMF staff estimates.
EU (27 countries)
Belgium
Bulgaria
Czech Republic
DenmarkGermany
Estonia
Greece
SpainFrance
Italy
Cyprus
Latvia LithuaniaHungary
Malta
NetherlandsAustria
Poland Portugal
Romania
SloveniaSlovakia
FinlandSweden
United Kingdom
Romania (2000)Romania (2005)
0.2
0.4
0.6
0.8
1
1.2
1.4
1.6
0.8 0.9 1 1.1 1.2
PPP/
Empl
oym
ent
Employment/PopulationSource: Eurostat
Convergence Indicators (2011) Relative to EU27
Rankings 1/
2010 2012 2010 2012 2010 2012Romania 71 75 55 72 64 67Average EU 27 30 36 39 39 28 36
1/ Out of 183 countries, except for competitiveness where 139 countries were ranked.
Corruption Perception Index (Transparency International)
Ease of Doing Business (World Bank)
Competitiveness (World Economic Forum)

26
government operations, including in procurement. Reducing the turnover in key government agencies and basing their staffing exclusively on professional qualifications would allow for building up experience and upgrading service provision. An effective use of the anti-money laundering framework would help detect and deter corruption, in particular by requiring financial and non-financial institutions to extend due diligence to customers who are domestic politically exposed persons and by strengthening cooperation between competent authorities.
A. Upgrading the Energy and Transportation Sectors
43. The poor quality of Romania’s energy and transportation infrastructure remains a major obstacle to improving competitiveness and long-term growth. This reflects a number of factors, including a regulatory and pricing structure that mandated below market prices for electricity and gas stifled investment in the energy sector; past political interference in the energy regulator; and the dominance of inefficient state-owned enterprises (SOEs). Estimates of investment needs run into the tens of billions of dollars over the next decade in the energy sector alone. In the transportation sector, there remains a strong need to cut costs and improve service provision, while increasing the efficiency of public investments in the rail and road network.
44. Under the current program, the authorities have taken a number of actions to establish a framework to improve the efficiency of the energy sector. In June, Parliament approved legislation to bring Romania into compliance with EU energy directives.6 The government has also approved roadmaps to deregulate electricity and gas prices that envisage full liberalization over the coming years. Regulated electricity prices have been increased by five percent at end-June (structural benchmark) and another ad-hoc increase is scheduled for gas prices (prior action). Moreover, the authorities have cancelled or renegotiated all bilateral contracts that obligated the hydro-electric power producer (Hidroelectrica) to sell electricity at below market prices. The electricity for cancelled contracts will now be sold on the open market.
45. Steadfast implementation of the regulatory and price reforms over the medium term is key. Legislation has been submitted to parliament to restore the independence of the energy regulator (ANRE). The effective implementation of the gas and electricity roadmaps will require the pass through of price increases to end-users and measures to protect vulnerable
6 The main components of the EU Third Energy Package are directives on common rules for an internal EU market in gas and electricity. These focus on the unbundling of transmission networks, more effective regulatory oversight, and protection for vulnerable consumers. The package entered into force on September 3, 2009, and member states had until March 3, 2011, to transpose its provisions into national law.
AUTBEL
BGR
CZEDNK
EST
FIN FRADEU
GRC
HUNIRL
ITA
LVA
LTU
LUXNLD
POL
PRT
ROM
SVKSVN ESP
SWEGBR
2
3
4
5
6
7
8
2 3 4 5 6 7
Elec
tric
ity
Serv
ice
Qua
lity
Inde
x
Railroad Quality Index
Quality of Rail and Electricity Service, EU-27
Source: World Competitiveness Report.

27
consumers. A package of tax and regulatory measures, in consultation with gas and electricity sector stakeholders, is being prepared that will include a windfall levy to help finance the social protection measures. In the transportation sector, a better balance needs to be struck between the availability of subsidies and the public service obligations of the rail passenger company.
B. Restructuring State-Owned Enterprises
46. Reform of state-owned enterprises continues to lag. The arrears and operating balance targets for the SOEs monitored under the program for end-June were met. While this has placed overall SOE arrears on a downward path, at about 3.3 percent of GDP these remain a drag on the economy. In addition, many public enterprises are loss-making and thus a burden on the economy and the public purse. However, SOE corporate governance reform and the privatization agenda continue to experience significant delays. Given that SOEs account for over half of the activity in the energy sector and about a third in the transportation and storage sectors, the slow progress in restructuring inefficient SOEs severely hampers investment and growth.
47. The success of SOE reform in boosting Romania’s growth potential and enhancing its competitiveness will require the government to act as a responsible shareholder. This would entail a number of actions (see the Selected Issues Paper, Chapter 2): (i) implement the provisions of the SOE corporate governance law passed last year, including the appointment of professional boards and managers; (ii) promote transparency through the regular publication of comprehensive reports on SOE performance, as is done in other European countries; and (iii) use privatization more aggressively to gain technical and managerial expertise, attract financing for investment, and reduce the fiscal risk of SOEs.
48. The authorities were resolved to accelerate SOE reform going forward. To jump start the privatization agenda, the government has decided to launch the tenders for a secondary public offering in the state-owned gas transmission operator (Transgaz) and the sale of the remaining state’s interest in a chemical company (Oltchim) as prior actions for completion of the review. It was also committed to pressing ahead with several other priority privatizations and intends to hold an initial public offering of part of its shares in Hidroelectica once the company exits insolvency (MEFP ¶31–32). The authorities will also continue to introduce professional management in a number of SOEs (MEFP ¶27–29)
C. EU Funds Absorption
49. The process for absorbing EU funds continues to be plagued by difficulties. Romania ranks worst among all new EU member states in using structural funds with an absorption rate of around half the regional average. While this partly reflects its later entry into
0
5
10
15
20
25
30
35
2006
2007
2008
2009
2010
2011
2012
Q2
SOE Arrears (billions of RON)
700 local government SOEs
240 central government SOEs
154 central government SOEs
Sources: Romanian authorities; and IMF staff estimates.

28
the European Union, it also underscores significant difficulties in project identification, procurement, and auditing. In a recent setback, the Romanian audit authority found problems in system management in previous years. Consequently, payments for certain programs have been interrupted. To mitigate future de-commitment risks, the government has decided that for high-priority EU-funded projects with problems, funds will be allocated from the budgets of the respective line ministries to offset the interruption of EU reimbursement. For other projects, payments will be suspended until the situation has been clarified with the European Commission (EC). The authorities are keen on stepping up efforts to boost absorption. They are closely working with the EC to simplify procedures and implement the April 2011 EU Priority Action Plan for the absorption of Structural and Cohesion Funds. There is also a need to strengthen technical expertise and proper incentives at all involved authorities.
D. Labor Market Reform
50. Implementation of new labor market and social assistance legislation is progressing, and has yielded some early positive results (Box 7).
A new Labor Code was put in place in mid-2011 which introduced more flexibility in employment relationships including for fixed-term employment. The government considered that this reform has significantly improved the functioning of the labor market and noted that employment rates have since improved, driven by growing numbers of fixed-term contracts.
The government put in place a new Social Dialogue Law to reform the collective bargaining process and ensure that wage developments will be more in line with productivity growth at firm level. The authorities are monitoring implementation of the Social Dialogue Law and will ensure that any amendments will be undertaken in consultation with all stakeholders without introducing undue rigidities in the collective bargaining process. They will also continue cooperation with the International Labor Organization (ILO), in order to ensure that the new legislation is consistent with core ILO conventions.
The new Social Assistance Law is an important step in streamlining social benefits and improving targeting. Secondary legislation is currently being prepared. The authorities will ensure that the newly designed social assistance law is fully effective by January 2013, before energy price liberalization commences for households.
0
20
40
60
LT ET PL SV LV HU SK CZ BG RO
Aver
age
Payment Rate of Structural Funds in 2007‒13 Financial Perspective, as of March 2012 (in percent)
Sources: European Commission.
012345678910
4000
4050
4100
4150
4200
4250
4300
4350
Apr
-11
May
-11
Jun-
11
Jul-
11
Aug
-11
Sep-
11
Oct
-11
Nov
-11
Dec
-11
Jan-
12
Feb-
12
Mar
-12
Apr
-12
May
-12
Jun-
12
Jul-
12
Registered Employees ('000)
Total number of employees (SA)
Percent share of fixed term contracts (right axis)
Sources: Romanian authorities.

29
In view of the low labor participation rate in Romania and the high unemployment among youth and older workers, the authorities are currently assessing possible measures to increase the employment rate. They agreed with staff on the need to carefully assess the impact of possible measures, including tax policy options aimed at reducing the labor wedge, actions to strengthen incentives for workers to enter and remain in the labor force, and efforts to enhance job search assistance and training.
Box 7. Romania: Main Amendments to Labor and Social Assistance Legislation
Labor Code Extension of the scope and duration of fixed-term/temporary employment contracts.
Extension of probationary periods.
Extension of period to compensate overtime by paid hours off.
Introduction of performance evaluation in the criteria considered in the collective layoff process. Social Dialogue Law
Cap on maximum duration of collective labor contracts. Removal of collective labor contracts at national level. Tightening criteria for establishment and representativity of labor unions at firm level. Removal of automatic erga-omnes extension of sector contracts. Public sector wage setting done by government after consultation with social partners instead of
through collective bargaining.
Social Assistance Law Improved targeting by consolidation of 54 categories of social benefits into 9 groups such as
guaranteed minimum income, disability, child allowance, disaster relief, etc. Improved verification and fraud control. Integration of social service delivery.
VII. PROGRAM MODALITIES AND OTHER ISSUES
51. The attached Letter of Intent (LOI) and MEFP describe the authorities’ progress in implementing their economic program and set out their commitments through mid-January 2013. Some modifications to the program’s conditionality are proposed (Tables 1–2):
• Four prior actions are proposed (Table 2). The prior actions are: (i) approve government ordinance to allow that: (a) resources available to local governments, currently limited to co-financing investment, can be used for paying arrears, and (b) the central government can directly pay off arrears of local governments from shared taxes; (ii) increase gas prices for non-residential consumers by 10 percent and for households by 5 percent; (iii) launch the tender for a secondary public offering of 15 percent of Transgaz shares; and (iv) launch the tender for the majority privatization of Oltchim.
Modifications to the end- September targets are proposed. The NFA target for end-September 2012 was lowered due to lower-than-projected capital inflows. An adjustor for

30
general government capital spending has been introduced for end-September, at a level lower than the adjustor currently in place for end-June in order to allow a smoother path of capital spending over the year.
Four new structural benchmarks are proposed (Table 2): (i) update the investment database to identify priority local government projects funded through budgetary and EU funds, and publish a list of low priority projects which will be discontinued; (ii) publish up-to-date financial statements of all public hospitals on a webpage of the Ministry of Health; (iii) sign a contract with a legal and transaction advisor for the majority privatization of Oltenia; and (iv) finalize a detailed definition of the structural architecture of the accounting and treasury reporting system.
52. Program modalities. Romania is not expected to face actual balance of payments financing needs in 2012 under the baseline scenario. The Stand-By Arrangement as well as financing commitments from the European Union and the World Bank will continue to be treated as precautionary.
53. Program risks. Romania’s capacity to repay the Fund is expected to remain strong. Fund credit outstanding is expected to decline from 40.7 percent of gross reserves in 2012. Peak payments would be in 2013 and 2014 at a still manageable 16.3 percent and 15.8 percent of gross reserves, or 9.5 percent and 8.3 percent of exports of goods and services, respectively. While this exposure is large, servicing risks are mitigated by the relatively low level of public debt. Public indebtedness (including guarantees) is expected to remain under 35 percent of GDP, with public external debt peaking at around 24 percent of GDP in 2012. Total external debt was 72.1 percent of GDP in 2011 and is projected to decline over the medium-term. In addition, an update in 2011 of the 2009 safeguards assessment found a robust safeguards framework at the NBR, while recommending measures to sustain NFA reporting standards and effective audit oversight, and enhance accounting disclosures.
VIII. STAFF APPRAISAL
54. Economic activity is expected to remain subdued in the near term due to reduced confidence and weakened trade and capital flows from political uncertainty and the recession in Europe; continued difficulties in absorbing EU-funds; and the impact of the drought on agriculture. Annual headline inflation would pick up in coming months towards the upper level of the inflation band by year-end due to rising food prices and pass-through from the depreciation. The external current account deficit is expected to narrow further in 2012 and, in light of the sluggish recovery, to widen only slightly over the medium term. Risks to the outlook are mostly on the downside.
55. Strict fiscal discipline is needed, ahead of parliamentary elections in the fall, to achieve the fiscal targets for 2012. Although the sizable deficit reduction implies a pro-cyclical stance, it is critical to bolster market confidence and exit the EU Excessive Deficit Procedure.

31
Staff welcomes the significant progress made in containing the public sector wage bill. Continued restraint is needed to discontinue low-priority spending while pressures to reduce tax rates ahead of the elections should be firmly resisted. Controlling government and healthcare sector arrears is a priority. If a significant worsening of the euro area crisis was to occur and result in a sharp contraction of economic activity in Romania, the government should let the automatic stabilizers act freely. Under such circumstances, it will be important to specify a credible multi-year consolidation strategy to be implemented once the economy recovers. To guard against this risk, it is important to maintain adequate fiscal buffers.
56. Prudent fiscal policies over the medium term must be maintained and putting in place the institutional framework required under the EU Fiscal Compact would strengthen fiscal discipline and policymaking. Following the large fiscal adjustment since 2009, achieving fiscal sustainability in the coming years is now within reach and the government should follow through on its commitment to achieve a structural deficit of less than 1 percent of GDP by 2014. Staff welcomes the focus beyond 2012 on targeting the structural balance which allows fiscal policy to play a stabilizing role over the economic cycle.
57. Further entitlement reforms should be undertaken to deal with rising aging costs and improve service delivery in healthcare. The 2010 pension reform is already helping to address this challenge but further action may be needed in the future to keep the pension age in line with rising life expectancy. In the health care system, the public consultation on draft legislation is a welcome first step to prepare for an overhaul of the benefits package and financing mechanisms. Before moving this process further, an impact analysis should be undertaken to ensure the financial sustainability of the planned reform. In light of the low level of public health care spending in Romania, there is a strong need to mobilize adequate financing to improve service delivery and to better contain costs.
58. A prudent monetary policy stance while maintaining exchange rate flexibility is warranted going forward. The central bank has appropriately refrained from further monetary policy easing in recent months in light of lower net capital inflows and exchange rate depreciation. Inflation risks are tilted to the upside, including from higher-than-expected world food prices. Exchange rate flexibility and retaining adequate international reserves buffers provide an important cushion against external shocks. The NBR should avoid excessive intervention in support of the leu, allowing for some further depreciation as long as inflation remains within the target band and bank balance sheets effects are manageable. The monetary policy stance should be tightened if exchange rate pressures persist. To help reduce interbank market fragmentation, the NBR should facilitate collateralized interbank lending.
59. In light of the uncertain environment and spillover risks from the euro area, it is important that the NBR continues its intensive bank supervision and further elaborates its crisis preparedness. Staff welcomes the pro-active supervision practices in place. Any necessary measures should be taken to ensure that banks have sufficient capital and liquidity. It is equally important that the NBR, in coordination with other relevant authorities, stands ready to

32
implement its crisis management framework and updates detailed contingency plans on an ongoing basis.
60. Further action is needed to mitigate the rise in nonperforming loans. Provisions almost fully cover nonperforming loans but profitability is poor, mainly because of the persistent need for higher provisioning. Staff welcomes the recent amendment to the fiscal code that ensures a neutral tax treatment of bank receivables sold to asset-recovery firms. In addition, the authorities should swiftly implement the forthcoming recommendations of the World Bank Report on Standards and Codes on insolvency and creditor rights. Banks should be able to write off fully provisioned NPLs.
61. Decisive implementation of the structural reform agenda is crucial to accelerate convergence with other EU countries. The key priorities are to improve the business climate, modernize the energy and transport sectors, re-invigorate public enterprise reform, boost EU funds absorption, and further improve the functioning of the labor market. Accelerating progress in these areas is critical to fostering higher and inclusive growth.
62. Reform of the energy and transportation sectors and of public enterprises is indispensable to help boost Romania’s long-term growth potential. Determined implementation of the realignment of gas and electricity end-user prices with costs is crucial to stimulate energy efficiency; unlock the large investments needed to expand domestic production and improve delivery systems; and increase resources available for social spending and investment in infrastructure. At the same time, targeted social assistance should be put in place to protect vulnerable households from the impact of the necessary price adjustments. Major efforts are needed to improve the efficiency of public investments in the rail and road network. Corporate governance in public enterprises must be significantly improved and the envisaged privatization of public enterprises needs to be followed through, in order to attract capital to finance new investments and facilitate technology transfers.
63. Building on the recent reform of the labor market legislation, efforts should now turn to raising the employment rate. It is important to ensure that the new Labor Code and Social Dialogue Laware consistent with core ILO conventions, while efforts to undo the progress made should be firmly resisted. Staff welcomes the government’s intention to address the low labor force participation in Romania and the high unemployment of younger and older workers.
64. On the basis of Romania’s performance under the SBA, staff supports the authorities’ request for completing the sixth review. Staff also supports the approval of a waiver of nonobservance of the end-June 2012 performance criterion on the accumulation of central government’s arrears given the small size of the deviation and the corrective actions undertaken by the government. Staff recommends establishment of quantitative conditionality for end-December 2012, and approval of the modification of program conditionality, as proposed in the attached Letter of Intent.

33
65. Decisive implementation of the IMF-supported program is important to foster confidence and facilitate private capital flows. The precautionary SBA, together with the financing commitments from the European Union and the World Bank, provides an important buffer against possible future shocks, while assisting Romania in continuing its economic adjustment. When the current SBA expires in March next year, any potential future program engagement with the Fund will depend on the overall track-record under the present program and the external environment.
66. It is proposed that the next Article IV consultation be held on a 24-month cycle, subject to the decision on consultation cycles in program countries.

34
2010Dec March June June Sept Dec
Actual Actual Actual Actual Actual Actual Prog. Prelim. Prog. Prog.
I. Quantitative Performance Criteria1. Floor on the change in net foreign assets (mln euros) 1/ 2/ 20,026 119 1896 292.8 -457 1696 -557 -457 -250 -8002. Floor on general government overall balance (mln lei) 3/ -33,621 -5,254 -11,260 -13,685 -23,837 -3,421 -7,770 -7631 -9,700 -14,6603. Ceiling on stock of central government and social security arrears (bn lei) 0.19 0.15 0.11 0.10 0.09 0.14 0.06 0.15 0.04 0.024. 7.6 8.1 6.0 5.8 6.5 7.0 14.0 7.7 14.0 14.0
II. Continuous Performance Criterion5. Nonaccumulation of external debt arrears 0 0 0 0 0 0 0 0 0 0
III. Inflation Consultation6. 12-month rate of inflation in consumer prices
Outer band (upper limit) … … … … … 4.4 5.9 5.6Inner band (upper limit) … … … … … 3.4 4.9 4.6Actual/Center point 8.0 8.0 7.9 3.5 3.1 2.4 2.4 2.0 3.9 3.6Inner band (lower limit) … … … … … 1.4 2.9 2.6Outer band (lower limit) … … … … … 0.4 1.9 1.6
IV. Indicative Target7. Ceiling on general government current primary spending (excl. EU funds and social assistance, mln lei) 131,938 30,670 62,578 94,133 128,317 30,921 64,800 63,968 99,000 133,7008. Floor on operating balance (earnings before interest and tax, net of subsidies) of key SOEs. 4/
(as defined in TMU (bn. lei)) -6.8 -0.7 -1.8 -2.4 -2.0 -0.4 -2.2 1.4 -2.7 -3.29. Ceiling on stock of arrears of key SOEs (as defined in TMU (bn lei)) 17.9 19.2 19.7 18.5 14.9 16.2 15.0 13.6 12.5 9.010. Ceiling on stock of local government arrears (bn lei) 0.91 0.82 0.81 0.82 0.75 0.82 0.50 1.17 0.75 0.3011. Ceiling on the execution of the PNDI program (mln lei) 4/ … … … … … 66 400 67 700 1,000
1/ The end-December 2010 figure is a stock.2/
3/
4/ Cumulative figure during calendar year (e.g. March 2012 figure is cumulative from January 1, 2012).
Table 1. Romania: Quantitative Program Targets
Ceiling on general government guarantees issued since end-2008 (face value, bn lei)
2011 2012June Sept Dec March
The June 2012 target is adjusted downward by 817 million Euros to reflect less than projected Eurobond placement of the MoPF, and the target is adjusted upward by 10 million Euros to reflect higher than projected commercial bank reserve requirement held with the NBR.Cumulative figure during calendar year (e.g. March 2011 figure is cumulative from January 1, 2011). March 2012 target is adjusted by RON 1,450 million to RON 4,550 for capital spending. June 2012 target is adjusted by RON 769.8 million to 7769.8 million for the loan to CFR Infrastructura.

35

36

37
2008 2009 2010 2013 2014 2015 2016 2017Est. Prog. Proj. Proj. Proj. Proj. Proj. Proj.
GDP and prices (annual percent change)Real GDP 7.3 -6.6 -1.6 2.5 1.5 0.9 2.5 3.0 3.3 3.5 3.5Real domestic demand 7.3 -12.0 -1.5 3.1 1.8 0.6 2.6 3.2 3.6 3.6 3.7
Consumption 8.7 -7.4 -1.3 0.3 0.6 0.8 1.8 2.9 3.4 3.5 3.5Investment 15.6 -28.1 -2.1 6.3 8.3 5.4 4.8 4.7 4.4 4.4 4.4Exports 8.3 -6.4 14.0 9.9 5.2 4.7 6.3 8.0 8.2 8.2 8.6Imports 7.9 -20.5 11.9 10.5 5.6 3.3 6.1 8.0 8.3 7.9 8.3
Consumer price index (CPI, average) 7.8 5.6 6.1 5.8 2.9 3.0 3.2 3.0 2.9 2.7 2.6Consumer price index (CPI, end of period) 6.3 4.7 8.0 3.1 3.4 3.6 3.2 3.0 2.9 2.7 2.6
Saving and investment (in percent of GDP)Gross national saving 19.7 21.2 20.4 24.4 25.7 25.2 25.5 25.7 25.7 25.4 25.5
Government 1.5 -2.0 0.8 3.3 4.8 4.2 5.1 5.8 5.8 5.8 5.8Private 18.2 23.2 19.6 21.1 20.9 21.0 20.4 19.9 19.9 19.6 19.7
Gross domestic investment 31.3 25.4 24.8 28.8 30.2 28.9 29.3 29.7 30.0 29.9 30.0Government 6.3 5.2 7.3 7.4 6.7 6.4 7.0 7.2 7.1 7.1 7.0Private 25.0 20.1 17.6 21.4 23.5 22.5 22.3 22.4 22.9 22.8 22.9
General government (in percent of GDP)Revenue 32.2 31.2 32.3 31.4 32.5 32.3 32.8 33.3 33.2 32.9 32.7
Tax revenue 27.9 27.2 26.5 26.9 27.2 27.3 27.6 27.5 27.4 27.3 27.2Non-Tax revenue 3.1 2.9 3.8 3.1 2.9 2.9 2.9 2.9 2.9 2.9 2.9Grants 0.9 1.0 1.8 1.2 2.2 1.9 2.2 2.8 2.7 2.5 2.4
Expenditure 37.0 38.5 38.7 35.5 34.7 34.5 34.6 34.7 34.5 34.2 33.9Fiscal balance -4.8 -7.3 -6.4 -4.1 -2.2 -2.2 -1.8 -1.4 -1.4 -1.3 -1.3Fiscal balance (including PNDI) -4.8 -7.3 -6.4 -4.1 -2.4 -2.4 -2.0 -1.9 -1.8 -1.8 -1.6Structural fiscal balance 1/ -7.5 -6.8 -4.9 -3.0 -0.6 -0.9 -0.6 -0.4 -0.6 -0.7 -0.8Gross public debt (direct debt only) 11.8 21.7 28.2 30.2 31.6 32.0 32.0 31.4 30.8 30.1 29.5Gross public debt (including guarantees) 13.6 23.8 31.2 33.0 34.2 34.6 34.5 33.7 32.9 32.1 31.3
Monetary aggregates (annual percent change)Broad money (M3) 17.5 9.0 6.9 6.6 6.7 2.7 6.1 6.7 6.8 6.9 6.7Credit to private sector 33.7 0.9 4.7 6.6 4.0 2.2 6.1 7.0 7.1 7.2 7.2
Balance of payments (in percent of GDP)Current account -11.6 -4.2 -4.4 -4.4 -4.4 -3.7 -3.8 -4.0 -4.3 -4.5 -4.5
Trade balance -13.7 -5.8 -6.1 -5.5 -5.5 -5.2 -5.3 -5.5 -5.8 -5.7 -5.7Services balance 0.5 -0.2 0.3 0.3 0.1 0.1 0.1 0.1 0.0 0.0 0.1Income balance -2.7 -1.6 -1.5 -1.7 -1.7 -1.0 -1.2 -1.2 -1.5 -1.6 -1.5Transfers balance 4.3 3.5 2.9 2.6 2.7 2.5 2.7 2.7 3.0 2.8 2.7
Capital and financial account balance 12.7 -2.5 1.0 1.3 4.5 2.7 4.8 6.1 5.8 5.8 5.6Foreign direct investment, balance 6.7 3.0 1.8 1.4 1.9 0.9 1.2 1.5 1.6 1.6 1.7
Memorandum items:Gross international reserves (in billions of euros) 28.3 30.9 36.0 37.3 37.7 36.5 33.0 31.5 32.0 33.9 36.0Gross international reserves (in months of next year's imports) 7.8 7.2 7.2 7.3 6.5 6.9 5.8 5.1 4.8 4.6 4.6International investment position (in percent of GDP) -49.4 -62.3 -62.7 -60.5 -63.5 -63.2 -68.5 -71.1 -71.4 -70.7 -69.9Real effective exchange rate (annual average), percent change -5.0 -7.5 1.9 2.8 -2.5 -6.4 -2.5 1.1 1.5 1.5 2.0External debt (in percent of GDP) 51.8 68.6 74.5 72.1 71.7 71.1 69.1 66.1 64.3 64.1 63.1Short-term external debt (in percent of GDP) 14.7 13.0 15.7 16.7 16.8 15.2 15.3 14.9 14.5 14.0 13.7Terms of trade (merchandise, percent change) 3.3 1.1 2.6 3.9 -0.8 -0.1 0.0 -0.7 -0.6 -0.1 -0.3Nominal GDP (in millions of lei) 514,700 501,139 522,561 578,552 607,541 607,300 644,600 687,982 734,877 785,596 838,502Nominal GDP (in millions of Euros) 139,766 118,269 124,130 136,518 139,489 135,585 139,138 148,185 158,840 170,720 183,534Output Gap 7.1 -1.2 -3.9 -3.3 -4.8 -4.0 -3.5 -2.9 -2.4 -1.9 -1.5Potential Output (percent change) 3.4 1.3 1.2 1.8 2.0 1.7 1.9 2.3 2.8 3.0 3.1
2011
Sources: Romanian authorities; and Fund staff estimates and projections.1/ Actual fiscal balance adjusted for the automatic effects of the business cycle.
2012
Table 4. Romania Macroeconomic Framework, Current Policies, 2008–17

38
2008 2009 2010 2011 2013 2014 2015 2016 2017
Act Act Act Act Prog Proj. Proj. Proj. Proj. Proj. Proj.
Current account balance -16.2 -4.9 -5.5 -6.0 -6.2 -5.0 -5.2 -5.9 -6.8 -7.7 -8.2Merchandise trade balance -19.1 -6.9 -7.6 -7.5 -7.7 -7.1 -7.3 -8.2 -9.2 -9.8 -10.5
Exports (f.o.b.) 33.7 29.1 37.4 45.0 48.4 46.3 48.6 51.7 56.1 61.0 66.8Imports (f.o.b.) 52.8 36.0 45.0 52.6 56.1 53.4 55.9 59.9 65.4 70.8 77.3
Services balance 0.7 -0.3 0.4 0.4 0.1 0.1 0.1 0.1 0.0 0.1 0.1Exports of non-factor services 8.8 7.1 6.6 7.4 7.7 7.6 7.9 8.4 9.2 10.0 10.9Imports of non-factor services 8.1 7.4 6.2 7.0 7.6 7.5 7.8 8.4 9.1 9.9 10.8
Income balance -3.7 -1.9 -1.9 -2.4 -2.3 -1.4 -1.7 -1.7 -2.3 -2.7 -2.8Receipts 2.3 1.2 0.9 1.3 1.0 1.0 1.0 1.0 1.1 1.1 1.2Payments 6.0 3.1 2.8 3.6 3.3 2.4 2.7 2.8 3.4 3.8 3.9
Current transfer balance 6.0 4.1 3.6 3.5 3.7 3.3 3.7 4.0 4.7 4.7 5.0
Capital and financial account balance 17.8 -2.9 1.2 1.8 6.6 3.7 6.7 9.1 9.2 9.8 10.3Capital account balance 0.6 0.6 0.2 0.4 0.7 1.4 0.6 0.6 0.6 0.6 0.6Foreign direct investment balance 9.3 3.6 2.2 1.9 2.6 1.2 1.6 2.3 2.6 2.8 3.2Portfolio investment balance -0.9 0.5 0.9 1.8 1.8 1.9 2.5 3.1 3.1 3.0 3.1Other investment balance 8.7 -7.6 -2.1 -2.3 1.4 -0.8 2.0 3.2 3.0 3.4 3.5
General government 0.2 -2.0 0.1 -0.4 -0.1 0.4 0.6 0.1 -0.8 -0.6 -0.9 Domestic banks 3.0 -4.5 1.0 -0.1 0.8 -1.0 -0.2 0.3 0.7 0.8 0.9 Other private sector 5.5 -1.0 -3.2 -1.8 0.8 -0.1 1.6 2.8 3.0 3.2 3.5
Errors and omissions -1.7 -1.0 -0.2 0.8 0.0 0.8 0.0 0.0 0.0 0.0 0.0
Multilateral financing ... 2.1 3.7 3.5 ... 1.4 ... ... ... ... ...European Commission ... 1.5 2.2 1.4 ... 0.0 ... ... ... ... ...World Bank ... 0.3 0.0 0.7 ... 0.0 ... ... ... ... ...EIB/EBRD/IFC ... 0.3 1.5 1.4 ... 1.4 ... ... ... ... ...
Overall balance 0.0 -6.7 -0.8 0.0 2.0 0.8 1.5 3.2 2.4 2.1 2.1
Financing 0.0 6.7 0.8 0.0 -2.0 -0.8 -1.5 -3.2 -2.4 -2.1 -2.1Gross international reserves (increase: -) 0.0 -1.1 -3.5 -0.9 -0.5 0.8 3.4 1.5 -0.5 -1.9 -2.1Use of Fund credit, net 0.0 6.8 4.3 0.9 -1.5 -1.6 -4.9 -4.7 -1.9 -0.2 0.0
Purchases 1/ 0.0 6.8 4.3 0.9 0.0 0.0 0.0 0.0 0.0 0.0 0.0Repurchases 0.0 0.0 0.0 0.0 -1.5 -1.6 -4.9 -4.7 -1.9 -0.2 0.0
Other liabilities, net 0.0 1.0 0.0 0.0 0.0 0.0 0.0 0.0 0.0 0.0 0.0
Memorandum items:Current account balance -11.6 -4.2 -4.4 -4.4 -4.4 -3.7 -3.8 -4.0 -4.3 -4.5 -4.5Foreign direct investment balance 6.7 3.0 1.8 1.4 1.9 0.9 1.2 1.5 1.6 1.6 1.7Merchandise trade balance -13.7 -5.8 -6.1 -5.5 -5.5 -5.2 -5.3 -5.5 -5.8 -5.7 -5.7
Exports 24.1 24.6 30.1 33.0 34.7 34.2 34.9 34.9 35.3 35.7 36.4Imports 37.8 30.4 36.2 38.5 40.2 39.4 40.2 40.4 41.2 41.4 42.1
Gross external financing requirement 33.1 29.5 25.9 27.7 30.3 30.3 31.5 29.4 28.5 25.6 24.8
Terms of trade (merchandise) 3.3 1.1 2.6 3.9 -0.8 -0.1 0.0 -0.7 -0.6 -0.1 -0.3Export volume 8.3 -6.4 14.0 9.9 5.2 4.7 6.3 8.0 8.2 8.2 8.6Import volume 7.9 -20.5 11.9 10.5 5.6 3.3 6.1 8.0 8.4 7.9 8.3Export prices 18.6 4.7 6.0 8.9 1.1 -1.9 -1.5 -1.5 0.2 0.2 0.7Import prices 15.3 3.3 3.6 7.1 1.1 -1.8 -1.4 -0.8 0.8 0.3 1.0
Gross international reserves 2/ 28.3 30.9 36.0 37.3 37.7 36.5 33.0 31.5 32.0 33.9 36.0Excluding Fund credit 28.3 24.1 24.7 25.3 26.6 25.3 26.7 29.9 31.8 33.9 36.0
GDP 139.8 118.3 124.1 136.5 139.4 135.6 139.1 148.2 158.8 170.7 183.5
(Annual percentage change)
(In billions of euros)
Sources: Romanian authorities; and Fund staff estimates and projections.1/ Includes IMF disbursement to the Treasury of €0.9 billion in 2009 and €1.2 billion in 2010.2/ Operational definition. Reflects the allocation of SDR 908.8 million that was made avaialable in two tranches in August and September 2009.
(In percent of GDP)
Table 5. Romania: Balance of Payments, 2008–17(In billions of euros, unless otherwise indicated)
2012

39
Year Q1 Q2 Q3 Q4 Year YearAct Act Act Act Proj Proj Proj. Proj.
I. Total financing requirements 38.2 39.2 11.0 11.7 8.9 8.2 39.8 33.8I.A. Current account deficit 5.5 6.0 0.5 1.9 1.3 1.3 5.0 5.2I.B. Short-term debt 21.0 21.9 8.0 6.5 6.8 4.9 26.2 20.8
Public sector 4.6 5.9 3.1 1.7 1.1 0.7 6.5 4.3Banks 11.2 11.9 3.9 4.1 4.2 2.7 14.9 11.4Corporates 5.2 4.1 1.1 0.8 1.5 1.4 4.8 5.1
I.C. Maturing medium- and long-term debt 11.3 11.1 2.3 3.0 1.8 3.2 10.3 9.0Public sector 1.7 1.8 0.4 1.1 0.3 0.5 2.2 1.3Banks 3.2 3.6 1.3 1.0 0.5 0.4 3.1 3.1Corporates 6.4 5.7 0.6 0.9 1.1 2.3 4.9 4.5
I.D. Other net capital outflows 1/ 0.4 0.2 0.2 0.3 -1.0 -1.1 -1.7 -1.2
II. Total financing sources 33.9 35.0 12.5 9.0 8.9 8.2 38.5 35.4II.A. Foreign direct investment, net 2.2 1.9 0.3 0.3 0.3 0.3 1.2 1.6II.B. Capital account inflows 0.2 0.4 0.4 0.6 0.1 0.1 1.4 0.6II.C. Short-term debt 23.2 24.6 8.5 4.9 6.0 4.5 24.0 21.4
Public sector 5.4 6.3 3.3 1.2 1.1 0.7 6.3 4.3Banks 12.5 12.3 4.2 2.7 3.4 2.3 12.6 11.6Corporates 5.3 5.9 1.0 1.0 1.6 1.5 5.1 5.5
II.D. Medium- and long-term debt 8.2 8.1 3.2 3.1 2.4 3.2 11.9 11.7Public sector 2.3 2.7 2.1 0.7 0.9 0.3 4.1 4.0Banks 2.3 3.0 0.8 1.8 0.4 0.5 3.4 3.3Corporates 3.7 2.4 0.3 0.6 1.1 2.4 4.4 4.4
Errors and Omissions -0.2 0.8 0.2 0.5 0.0 0.0 0.8 0.0
III. Increase in gross reserves 3.5 0.9 1.8 -2.1 -0.1 -0.4 -0.8 -3.4
IV. Financing Gap 8.0 4.4 0.1 0.1 -0.1 -0.3 -0.2 -4.9
V. Program financing 8.0 4.4 0.1 0.1 -0.1 -0.3 -0.2 -4.9IMF 2/ 4.3 0.9 0.0 0.0 -0.7 -0.9 -1.6 -4.9
Purchases 4.3 0.9 0.0 0.0 0.0 0.0 0.0 0.0Repurchases 0.0 0.0 0.0 0.0 -0.7 -0.9 -1.6 -4.9
Others 3.7 3.5 0.1 0.1 0.6 0.6 1.4 0.0European Commission 2.2 1.4 0.0 0.0 0.0 0.0 0.0 0.0World Bank 0.0 0.7 0.0 0.0 0.0 0.0 0.0 0.0EIB/EBRD/IFC 1.5 1.4 0.1 0.1 0.6 0.6 1.4 0.0
Memorandum items:Rollover rates for amortizing debt ST (in percent)
Public sector 118 108 107 70 100 100 96 100Banks 112 104 109 67 80 85 85 103Corporates 101 143 95 129 105 105 107 107
Rollover rates for amortizing debt MLT (in percent)Public sector 135 149 552 64 375 65 182 304Banks 71 84 62 190 78 108 110 105Corporates 58 42 54 62 100 105 90 97
Rollover rates for total amortizing debt (in percent)Public sector 122 117 157 68 153 86 118 148Banks 102 99 97 90 80 88 89 103Corporates 77 84 80 93 103 105 98 102
Gross international reserves 3/ 36.0 37.3 38.8 37.1 … … 36.5 33.0Coverage of gross international reserves
- Months of imports of GFNS (next year) 7.2 7.3 7.3 7.0 … … 6.9 5.8- Short-term external debt (in percent) 118.6 103.2 106.1 99.1 … … 94.5 87.5
Source: Romanian authorities and IMF staff estimates.1/ Includes includes portfolio equity, financial derivatives and other investments, assets position.2/ Last disbursement of the previous program is treated as precautionary.3/ Operational Definition.
Table 6. Romania: Gross Financing Requirements, 2010–13(In billions of euros, unless otherwise indicated)
20102011 2012 2013

40
2008 2009 2010 2011 2012 2012 2013 2014Act. 6/ Prog Proj. 7/ Proj Proj
Revenue 32.2 31.2 32.3 31.4 32.5 32.3 32.8 33.3 Taxes 27.9 27.2 26.5 26.9 27.2 27.3 27.6 27.5 Corporate income tax 2.8 2.7 2.1 1.9 2.0 2.0 2.0 2.0 Personal income tax 3.6 3.7 3.4 3.4 3.5 3.6 3.6 3.6 VAT 7.9 6.8 7.5 8.3 8.4 8.6 8.4 8.4 Excises 2.7 3.1 3.3 3.3 3.4 3.4 3.5 3.5 Customs duties 0.2 0.1 0.1 0.1 0.1 0.1 0.1 0.1 Social security contributions 9.5 9.5 8.7 8.8 8.5 8.4 8.6 8.6 Other taxes 1.2 1.2 1.3 1.2 1.3 1.3 1.3 1.3 Nontax revenue 3.1 2.9 3.8 3.1 2.9 2.9 2.9 2.9 Capital revenue 0.2 0.1 0.1 0.1 0.2 0.1 0.1 0.1 Grants, including EU disbursements 0.9 1.0 1.8 1.2 2.2 1.9 2.2 2.8
Expenditure 37.0 38.5 38.7 35.5 34.7 34.5 34.6 34.7 Current expenditure 32.5 34.6 35.1 31.6 30.9 30.9 31.2 31.5 Compensation of employees 8.9 9.3 8.2 6.7 6.7 6.7 7.1 7.0 Goods and services 6.2 5.6 5.7 5.5 5.4 5.4 5.2 5.2 Interest 0.7 1.2 1.4 1.5 1.7 1.9 1.8 1.7 Subsidies 1.5 1.4 1.3 1.1 0.9 0.9 0.8 0.8 Transfers 15.1 16.6 18.2 16.4 15.8 15.7 16.0 16.5 Pensions 6.4 8.0 8.1 8.2 7.9 7.9 7.7 7.6 Other social transfers 4.1 4.8 5.1 3.6 3.2 3.2 3.1 3.1 Other transfers 1/ 3.4 3.4 4.5 4.2 4.2 4.1 4.7 5.2 Other spending 1.2 0.5 0.6 0.5 0.4 0.4 0.4 0.5 Proj. with ext. credits 0.0 0.4 0.3 0.4 0.4 0.3 0.3 0.3 Capital expenditure 2/ 4.6 4.4 3.7 4.0 3.7 3.5 3.4 3.2 Reserve fund 0.0 0.0 0.0 0.0 0.2 0.2 0.0 0.0 Net lending and expense refunds -0.1 -0.5 -0.1 -0.1 0.0 0.0 0.0 0.0
Fiscal balance -4.8 -7.3 -6.4 -4.1 -2.2 -2.2 -1.8 -1.4 Primary balance -4.1 -6.1 -5.0 -2.6 -0.6 -0.4 0.0 0.3
Fiscal balance including PNDI -7.3 -6.4 -4.1 -2.4 -2.4 -2.0 -1.6
Financing 4.8 7.3 6.4 4.1 2.2 2.2 1.8 1.4 External borrowing (net) 0.4 2.6 2.8 2.6 1.9 1.9 0.8 0.7 Domestic borrowing (net) 2.9 5.8 4.0 2.1 1.3 1.3 1.0 0.7 Use of deposits 1.4 -1.2 -0.4 -0.7 -1.0 -1.0 0.0 0.0 Privatization proceeds 0.1 0.1 0.1 0.0 0.0 0.0 0.0 0.0
Financial liabilities Gross public debt 3/ 13.6 23.8 31.2 33.0 34.6 34.6 34.5 33.7 Gross public debt excl. guarantees 11.8 21.7 28.2 30.2 32.0 32.0 32.0 31.4 External 6.9 10.0 13.0 14.3 15.5 15.6 15.5 15.2 Domestic 4.9 11.7 15.2 15.9 16.5 16.4 16.5 16.2
Memorandum items:Total capital spending (excluding PNDI) 6.3 5.2 7.3 7.4 6.8 6.4 7.0 7.2Fiscal balance (ESA95 basis) 6/ -5.7 -9.0 -6.8 -5.2 -2.8 -3.0 -2.2 -1.2Gross public debt (ESA95 basis) 6/ 13.4 23.6 30.5 31.2 … … … …Output gap 4/ 7.1 -1.2 -3.9 -3.3 -4.8 -4.0 -3.5 -2.9Conventional structural fiscal balance -7.5 -6.8 -4.9 -3.0 -0.6 -0.9 -0.6 -0.4Gross public debt (authorities definition) 5/ 21.3 29.4 37.2 38.5 … … … …Nominal GDP (in billions of RON) 514.7 501.1 522.6 578.6 607.5 607.3 644.6 688.0
Sources: Ministry of Finance; Eurostat; and Fund staff projections.1/ Includes EU-financed capital projects.2/ Does not include all capital spending.3/ Total consolidated public debt, including government debt, local government debt, and guarantees. 4/ Percentage deviation of actual from potential GDP.5/ Includes guarantees and intra-governmental debt.
7/ Includes arrears reduction plans in VAT (2262m), transfers (1562m), reserve fund (500m) and capital (200m).
Table 7. Romania: General Government Operations, 2008–14(In percent of GDP)
6/ Includes arrears reduction plans in VAT (1131m), SSC (1089m), CIT (82m), excises (74m), transfers (804m), capex (738m), subsidies (729m), goods and services (127m).
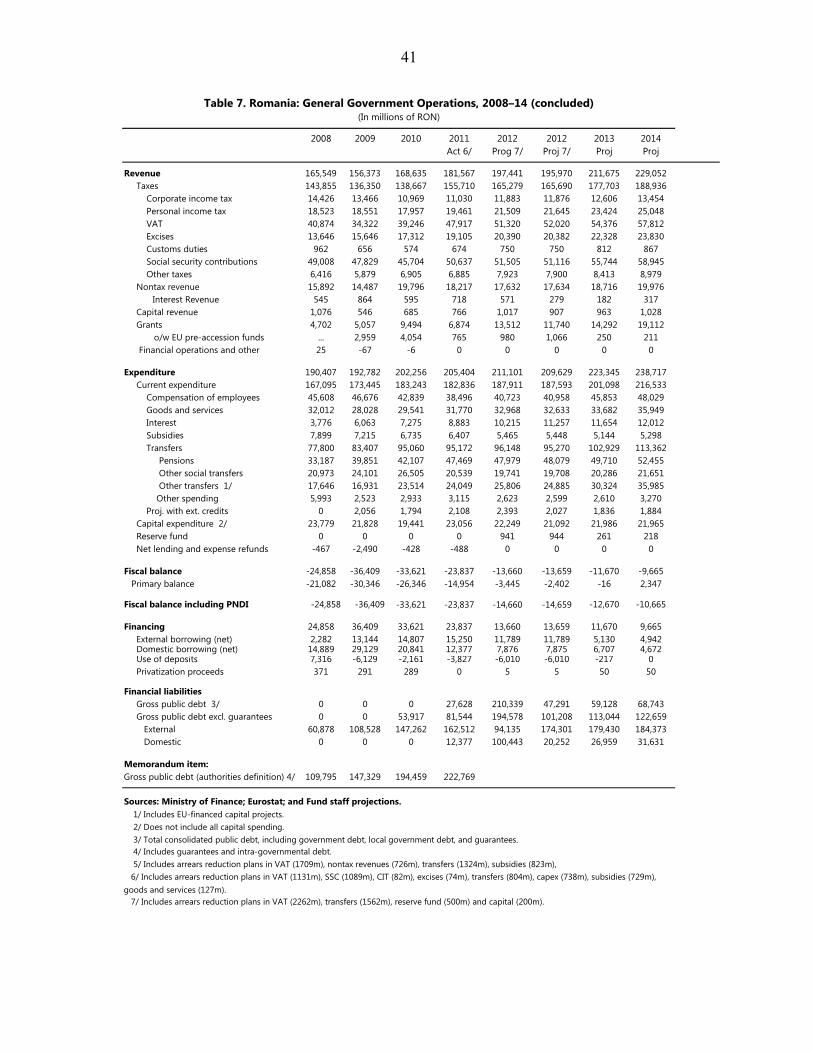
41
2008 2009 2010 2011 2012 2012 2013 2014Act 6/ Prog 7/ Proj 7/ Proj Proj
Revenue 165,549 156,373 168,635 181,567 197,441 195,970 211,675 229,052 Taxes 143,855 136,350 138,667 155,710 165,279 165,690 177,703 188,936 Corporate income tax 14,426 13,466 10,969 11,030 11,883 11,876 12,606 13,454 Personal income tax 18,523 18,551 17,957 19,461 21,509 21,645 23,424 25,048 VAT 40,874 34,322 39,246 47,917 51,320 52,020 54,376 57,812 Excises 13,646 15,646 17,312 19,105 20,390 20,382 22,328 23,830 Customs duties 962 656 574 674 750 750 812 867 Social security contributions 49,008 47,829 45,704 50,637 51,505 51,116 55,744 58,945 Other taxes 6,416 5,879 6,905 6,885 7,923 7,900 8,413 8,979 Nontax revenue 15,892 14,487 19,796 18,217 17,632 17,634 18,716 19,976
Interest Revenue 545 864 595 718 571 279 182 317 Capital revenue 1,076 546 685 766 1,017 907 963 1,028 Grants 4,702 5,057 9,494 6,874 13,512 11,740 14,292 19,112 o/w EU pre-accession funds ... 2,959 4,054 765 980 1,066 250 211 Financial operations and other 25 -67 -6 0 0 0 0 0
Expenditure 190,407 192,782 202,256 205,404 211,101 209,629 223,345 238,717 Current expenditure 167,095 173,445 183,243 182,836 187,911 187,593 201,098 216,533 Compensation of employees 45,608 46,676 42,839 38,496 40,723 40,958 45,853 48,029 Goods and services 32,012 28,028 29,541 31,770 32,968 32,633 33,682 35,949 Interest 3,776 6,063 7,275 8,883 10,215 11,257 11,654 12,012 Subsidies 7,899 7,215 6,735 6,407 5,465 5,448 5,144 5,298 Transfers 77,800 83,407 95,060 95,172 96,148 95,270 102,929 113,362 Pensions 33,187 39,851 42,107 47,469 47,979 48,079 49,710 52,455 Other social transfers 20,973 24,101 26,505 20,539 19,741 19,708 20,286 21,651 Other transfers 1/ 17,646 16,931 23,514 24,049 25,806 24,885 30,324 35,985 Other spending 5,993 2,523 2,933 3,115 2,623 2,599 2,610 3,270 Proj. with ext. credits 0 2,056 1,794 2,108 2,393 2,027 1,836 1,884 Capital expenditure 2/ 23,779 21,828 19,441 23,056 22,249 21,092 21,986 21,965 Reserve fund 0 0 0 0 941 944 261 218 Net lending and expense refunds -467 -2,490 -428 -488 0 0 0 0
Fiscal balance -24,858 -36,409 -33,621 -23,837 -13,660 -13,659 -11,670 -9,665 Primary balance -21,082 -30,346 -26,346 -14,954 -3,445 -2,402 -16 2,347
Fiscal balance including PNDI -24,858 -36,409 -33,621 -23,837 -14,660 -14,659 -12,670 -10,665
Financing 24,858 36,409 33,621 23,837 13,660 13,659 11,670 9,665 External borrowing (net) 2,282 13,144 14,807 15,250 11,789 11,789 5,130 4,942 Domestic borrowing (net) 14,889 29,129 20,841 12,377 7,876 7,875 6,707 4,672 Use of deposits 7,316 -6,129 -2,161 -3,827 -6,010 -6,010 -217 0 Privatization proceeds 371 291 289 0 5 5 50 50
Financial liabilities Gross public debt 3/ 0 0 0 27,628 210,339 47,291 59,128 68,743 Gross public debt excl. guarantees 0 0 53,917 81,544 194,578 101,208 113,044 122,659 External 60,878 108,528 147,262 162,512 94,135 174,301 179,430 184,373 Domestic 0 0 0 12,377 100,443 20,252 26,959 31,631
Memorandum item:Gross public debt (authorities definition) 4/ 109,795 147,329 194,459 222,769
Sources: Ministry of Finance; Eurostat; and Fund staff projections.1/ Includes EU-financed capital projects.2/ Does not include all capital spending.
4/ Includes guarantees and intra-governmental debt.
7/ Includes arrears reduction plans in VAT (2262m), transfers (1562m), reserve fund (500m) and capital (200m).
Table 7. Romania: General Government Operations, 2008–14 (concluded)(In millions of RON)
3/ Total consolidated public debt, including government debt, local government debt, and guarantees.
5/ Includes arrears reduction plans in VAT (1709m), nontax revenues (726m), transfers (1324m), subsidies (823m), 6/ Includes arrears reduction plans in VAT (1131m), SSC (1089m), CIT (82m), excises (74m), transfers (804m), capex (738m), subsidies (729m), goods and services (127m).

42
Table 8. Romania: Monetary Survey, 2008–13 (In millions of lei (RON), unless otherwise indicated; end of period)
Dec-08 Dec-09 Dec-10 Dec-11 Dec-13Q1 Q2 Q3 Proj. Q4 Proj. Proj.
I. Banking System
Net foreign assets 13,138 17,684 19,086 15,740 23,431 20,470 22,528 19,717 26,169In million euros 3,297 4,182 4,454 3,644 5,351 4,601 5,127 4,473 6,026
o/w commercial banks -24,388 -19,708 -21,086 -21,846 -21,224 -20,715 -20,211 -20,250 -15,306
Net domestic assets 160,890 171,946 183,687 200,468 192,849 196,461 195,046 202,222 209,403Public sector credit (Net) 6,923 26,748 43,140 52,596 45,542 51,884 58,884 60,471 67,178Private sector credit 198,056 199,887 209,294 223,037 224,401 227,087 227,367 227,916 241,890Other -44,089 -54,688 -68,747 -75,165 -77,094 -82,510 -91,205 -86,165 -99,665
Broad Money (M3) 174,028 189,630 202,773 216,208 216,281 216,931 217,574 221,940 235,571Money market instruments 399 1,617 3,201 4,149 1,992 481 516 550 584Intermediate money (M2) 173,629 188,013 199,572 212,059 214,289 216,450 217,058 221,390 234,987
Narrow money (M1) 92,549 79,361 81,592 85,834 84,934 87,840 90,213 90,078 95,611Currency in circulation 25,287 23,968 26,794 30,610 30,879 31,895 32,422 31,540 33,477Overnight deposits 67,262 55,394 54,799 55,224 54,056 55,945 57,791 58,538 62,134
II. National Bank of RomaniaNet foreign assets 110,323 101,015 109,433 110,106 116,372 112,638 111,328 108,972 92,638
In million euros 27,683 23,891 25,540 25,489 26,574 25,315 25,338 24,723 21,333Net domestic assets -59,855 -49,354 -54,330 -48,541 -62,920 -53,976 -52,366 -45,537 -25,307
Public sector credit, net -1,428 -13,626 -12,795 -13,564 -30,496 -23,559 -23,559 -23,559 -17,559Credit to banks, net -51,126 -23,848 -26,148 -19,529 -18,927 -13,103 -11,103 -11,529 -2,529Other -7,301 -11,880 -15,387 -15,448 -13,497 -17,314 -17,704 -10,449 -5,219
Reserve money 50,468 51,662 55,103 61,565 53,451 58,662 58,963 63,435 67,332
Broad money (M3) 17.5 9.0 6.9 6.6 10.2 8.5 4.0 2.7 6.1NFA contribution -10.8 2.6 0.7 -1.7 5.6 -1.7 -1.6 1.8 2.9NDA contribution 28.3 6.4 6.2 8.3 4.5 10.2 5.6 0.8 3.2
Reserve money 3.3 2.4 6.7 11.7 7.2 12.2 6.0 3.0 6.1NFA contribution 28.4 -18.4 16.3 1.2 32.2 -7.9 -15.3 -1.8 -25.7NDA contribution -25.1 20.8 -9.6 10.5 -25.1 20.1 21.3 4.9 31.9
Domestic credit, real 34.4 5.6 3.2 5.9 8.1 10.4 4.4 1.0 3.8Private sector, real 25.7 -3.6 -3.0 3.3 7.4 4.2 -1.2 -1.4 2.8Public sector, real -238.5 268.9 49.4 18.2 11.7 49.2 34.0 10.9 7.6
Broad money (M3), in real terms 10.5 4.0 -1.0 3.4 7.6 6.3 0.1 -1.0 2.8Private credit, nominal 33.7 0.9 4.7 6.6 10.0 6.3 2.7 2.2 6.1
Memorandum itemsCPI inflation, eop 6.3 4.7 8.0 3.1 2.4 2.0 3.9 3.6 3.2Inflation target 2.8 - 4.8 2.5 - 4.5 2.5 - 4.5 2.0 - 4.0 2.0 - 4.0 2.0 - 4.0 2.0 - 4.0 2.0 - 4.0 1.5 - 3.5Interest rates (percent):
Policy interest rate 10.25 8.00 6.25 6.0 5.25 5.25 … … …Interbank offer rate, 1 week 12.7 10.7 3.6 6.0 3.4 5.2 … … …Corporate loans 1/ 19.5 15.4 9.4 9.7 9.0 9.5 … … …Household time deposits 1/ 15.27 9.9 7.6 6.6 6.2 5.6 … … …
Share of foreign currency private deposits 35.6 39.3 36.1 33.6 33.0 34.3 … … …Share of foreign currency private loans 57.8 60.1 63.0 63.4 63.7 63.7 … … …M2 velocity 2.96 2.67 2.62 2.73 2.04 3.40 2.65 2.74 2.74Money multiplier (M3/reserve money) 3.45 3.67 3.68 3.51 4.05 3.70 3.69 3.50 3.50
Sources: National Bank of Romania; and Fund staff estimates.1/ Rates for new local currency denominated transactions.
2012
(Annual percentage change)

43
2008 2009 2010 2010 2010 2010 2011 2011 2011 2011 2012 2012
Dec. Dec. Mar. Jun. Sep. Dec. Mar. June Sep. Dec. Mar. Jun.
Core indicatorsCapital adequacy
Capital to risk-weighted assets 13.8 14.7 15.0 14.3 14.6 15.0 14.9 14.2 13.4 14.5 14.6 14.7
Tier 1 capital to risk-weighted assets 11.8 13.4 14.2 13.4 13.8 14.2 14.5 13.6 12.9 13.9 13.8 13.7
Asset qualityNonperforming loans (1/) to total gross loans 2.8 7.9 9.1 10.2 11.7 11.9 12.7 13.4 14.2 14.3 15.9 16.8
Earnings and profitabilityReturn on assets 1.6 0.2 0.5 -0.1 -0.2 -0.2 0.5 0.1 -0.3 -0.1 0.1 -0.1
Return on equity( 2/) 17.0 2.9 6.0 -1.6 -2.1 -1.7 5.0 0.6 -3.4 -1.4 1.3 -1.0
Net interest income to operating income 44.8 44.1 55.7 58.2 58.7 60.6 59.8 63.7 62.3 61.9 63.0 63.5
Noninterest expense to operating income (cost to income) 55.7 63.9 56.5 59.2 58.6 64.9 65.6 67.5 66.1 68.2 55.8 60.0
Personnel expense to operating income 23.4 20.3 20.7 21.6 21.2 21.0 22.8 23.3 22.4 22.1 25.1 25.8
Liquidity Liquid assets (3/)to total assets 47.1 57.4 58.6 59.1 59.3 60.0 58.8 58.7 60.7 58.6 57.4 59.3
Liquid assets (3/) to short-term liabilities (4/) 230.5 132.0 150.0 146.7 148.7 142.2 151.8 143.5 143.6 138.8 152.4 145.3Liquid assets (3/) to total attracted and borrowed sources 116.2 79.4 81.2 79.8 82.1 80.9 80.5 80.4 81.6 79.7 75.6 79.0
Foreign exchange riskNet open position in foreign exchange, in percent of capital 1.6 2.3 1.6 -3.2 1.4 -1.4 -2.9 -3.4 -4.2 -4.8 -3.9 -3.4Lending in foreign exchange, in percent of non-gov. credit 57.8 60.1 60.4 62.8 62.5 63.0 62.2 62.9 63.6 63.4 63.7 63.7Foreign currency liabilities, in percent of total attracted and borrowed sources 43.7 42.8 43.6 44.7 44.1 43.5 43.8 43.2 43.6 43.1 44.4 44.7Deposits in foreign exchange, in percent of non-gov. dom. deposits 34.8 38.8 37 38 37.4 36.0 35.6 34.6 34.0 33.5 32.9 34.1
Encouraged indicators Deposit-taking institutions
Leverage ratio (5/) 8.1 7.6 8.1 7.9 7.9 8.1 8.0 7.8 7.5 7.9 8.6 8.4
Personnel expenses to noninterest expenses 41.9 31.8 36.6 36.4 36.1 32.3 34.7 34.5 33.9 32.3 45.0 43.0
Customer deposits to total (non-interbank) loans 81.9 88.7 88.3 85.1 86.0 84.8 84.0 81.6 81.7 84.0 84.6 84.1
Source: Romanian National Bank.1/ The NPLs represent un-adjusted exposures of loans and related interests overdue for more than 90 days and/or for which legal proceedings were initiated. 2/ Return on equity is calculated as Net profit/loss to average own capital. 3/ Liquid assets = balance sheet assets and off balance sheets items with residual maturity of up to three months.4/ Short term liabilities =balance sheet liabilities and off balance sheet items with residual maturity of up to three months.5/ Tier 1 Capital to average assets.
Table 9. Romania: Financial Soundness Indicators, 2008–12 (In percent)

44
Date Millions of SDRs Percent of Quota Conditions
March 25, 2011 60.0 5.82 Approval of arrangementJune 27, 2011 430.0 41.74 First review and end-March 2011 performance criteriaSeptember 29, 2011 430.0 41.74 Second review and end-June 2011 performance criteriaDecember 19, 2011 430.0 41.74 Third review and end-September 2011 performance criteriaMarch 21, 2012 430.0 41.74 Fourth review and end-December 2011 performance criteriaJune 15, 2012 430.0 41.74 Fifth review and end-March 2012 performance criteriaSeptember 15, 2012 430.0 41.74 Sixth review and end-June 2012 performance criteriaDecember 15, 2012 430.0 41.74 Seventh review and end-September 2012 performance criteriaMarch 15, 2013 20.6 2.00 Eighth review and end-December 2012 performance criteria
Total 3090.6 300Source: IMF staff estimates.
Table 10. Romania: Schedule of Reviews and Purchases
Amount of Purchase

45
2012 2013 2014 2015 2016 2017
Existing Fund CreditStock 2/ 9,261.8 5,210.0 1,328.9 96.1 0.0 0.0Obligations 3/ 788.4 4,139.7 3,921.3 1,241.4 97.0 0.7
Repurchase 761.0 4,051.8 3,881.1 1,232.8 96.1 0.0Charges 27.4 88.0 40.1 8.6 0.9 0.7
Prospective Fund Credit under Stand-By ArrangementDisbursement 3,070.0 20.6 0.0 0.0 0.0 0.0Stock 2/ 3,070.0 3,090.6 3,090.6 2,760.6 1,217.9 2.6Obligations 3/ 19.0 32.8 33.4 363.4 1,568.3 1,224.2
Repurchase 0.0 0.0 0.0 330.0 1,542.7 1,215.3Charges 19.0 32.8 33.4 33.4 25.5 8.9
Stock of existing and prospective Fund creditIn millions of SDR 12,332 8,301 4,419 2,857 1,218 3In percent of quota 1,197 806 429 277 118 0In percent of GDP 10.9 7.3 3.6 2.2 0.9 0In percent of exports of goods and services 27.5 17.9 9.0 5.4 2.1 0In percent of gross reserves 40.7 30.7 17.2 11.0 4.4 0
Obligations to the Fund from existing and prospective Fund arrangementsIn millions of SDR 870 4,413 4,064 1,627 1,666 1,225In percent of quota 84.5 428.4 394.5 157.9 161.7 118.9In percent of GDP 0.8 3.9 3.4 1.3 1.2 0.8In percent of exports of goods and services 1.9 9.5 8.3 3.1 2.9 1.9In percent of gross reserves 2.9 16.3 15.8 6.2 6.0 4.2
Source: IMF staff estimates.1/ Using IMF actual disbursements, SDR interest rate as well as exchange rate of SDR/US$ and US$/€ of July 27, 2012.2/ End of period.3/ Repayment schedule based on repurchase obligations.
Table 11. Romania: Indicators of Fund Credit, 2012–17 1/(In millions of SDR)

46
Projections2007 2008 2009 2010 2011 2012 2013 2014 2015 2016 2017 Debt-stabilizing
primarybalance 9/
Baseline: Public sector debt 1/ 12.7 13.6 23.8 31.2 33.0 34.6 34.5 33.7 32.9 32.1 31.4 -0.6o/w foreign-currency denominated 9.3 8.6 15.3 20.0 20.0 20.4 18.8 17.8 17.0 16.2 15.4
Change in public sector debt 0.1 0.9 10.1 7.4 1.8 1.7 -0.2 -0.8 -0.8 -0.8 -0.7Identified debt-creating flows (4+7+12) 0.7 3.7 8.0 6.9 1.9 0.7 -0.2 -0.8 -0.8 -0.8 -0.8
Primary deficit 2.4 4.1 6.1 5.0 2.6 0.4 0.0 -0.3 -0.4 -0.4 -0.5Revenue and grants 32.3 32.2 31.2 32.3 31.4 32.3 32.8 33.3 33.2 32.9 32.7Primary (noninterest) expenditure 34.6 36.3 37.3 37.3 34.0 32.7 32.8 32.9 32.8 32.5 32.2
Automatic debt dynamics 2/ -1.8 -0.5 1.9 1.8 -0.7 0.3 -0.2 -0.4 -0.4 -0.4 -0.3Contribution from interest rate/growth differential 3/ -1.4 -1.7 1.6 0.4 -1.5 0.3 -0.2 -0.4 -0.4 -0.4 -0.3
Of which contribution from real interest rate -0.8 -1.0 0.7 0.0 -0.8 0.6 0.6 0.5 0.7 0.7 0.8Of which contribution from real GDP growth -0.7 -0.8 0.9 0.4 -0.7 -0.3 -0.8 -1.0 -1.0 -1.1 -1.1
Contribution from exchange rate depreciation 4/ -0.4 1.2 0.3 1.4 0.8 ... ... ... ... ... ...Other identified debt-creating flows 0.2 0.1 0.1 0.1 0.0 0.0 0.0 0.0 0.0 0.0 0.0
Privatization receipts (negative) 0.2 0.1 0.1 0.1 0.0 0.0 0.0 0.0 0.0 0.0 0.0Recognition of implicit or contingent liabilities 0.0 0.0 0.0 0.0 0.0 0.0 0.0 0.0 0.0 0.0 0.0Other (specify, e.g. bank recapitalization) 0.0 0.0 0.0 0.0 0.0 0.0 0.0 0.0 0.0 0.0 0.0
Residual, including asset changes (2-3) 5/ -0.6 -2.8 2.1 0.5 -0.1 1.0 0.0 0.0 0.0 0.0 0.0
Public sector debt-to-revenue ratio 1/ 39.4 42.4 76.2 96.7 105.0 107.3 104.9 101.1 99.2 97.6 96.1
Gross financing need 6/ 4.4 6.7 18.4 13.9 12.6 11.0 10.6 9.7 7.9 6.6 6.3in billions of U.S. dollars 7.5 13.6 30.2 22.8 23.8 19.1 18.8 18.5 16.4 15.0 15.4
Scenario with key variables at their historical averages 7/ 34.6 33.7 33.0 32.3 31.7 31.2 -3.1Scenario with no policy change (constant primary balance) in 2012-2017 34.6 34.9 34.8 34.8 34.8 34.9 -0.7
Key Macroeconomic and Fiscal Assumptions Underlying Baseline
Real GDP growth (in percent) 6.3 7.3 -6.6 -1.6 2.5 0.9 2.5 3.0 3.3 3.5 3.5Average nominal interest rate on public debt (in percent) 8/ 7.1 7.1 8.6 6.1 5.4 5.9 5.5 5.4 5.6 5.7 5.8Average real interest rate (nominal rate minus change in GDP deflator, in percent) -6.4 -8.2 4.4 0.1 -2.6 1.9 2.0 1.8 2.2 2.4 2.7Nominal appreciation (increase in US dollar value of local currency, in percent) 4.5 -13.3 -3.5 -8.4 -4.0 ... ... ... ... ... ...Inflation rate (GDP deflator, in percent) 13.5 15.3 4.2 6.0 8.1 4.0 3.6 3.6 3.4 3.3 3.1Growth of real primary spending (deflated by GDP deflator, in percent) 12.0 12.4 -4.0 -1.5 -6.7 -2.9 3.0 3.4 2.7 2.6 2.6Primary deficit 2.4 4.1 6.1 5.0 2.6 0.4 0.0 -0.3 -0.4 -0.4 -0.5
1/ Coverage: general government gross debt, including guarantees.2/ Derived as [(r - p(1+g) - g + ae(1+r)]/(1+g+p+gp)) times previous period debt ratio, with r = interest rate; p = growth rate of GDP deflator; g = real GDP growth rate; a = share of foreign-currency denominated debt; and e = nominal exchange rate depreciation (measured by increase in local currency value of U.S. dollar).3/ The real interest rate contribution is derived from the denominator in footnote 2/ as r - π (1+g) and the real growth contribution as -g.4/ The exchange rate contribution is derived from the numerator in footnote 2/ as ae(1+r). 5/ For projections, this line includes exchange rate changes.6/ Defined as public sector deficit, plus amortization of medium and long-term public sector debt, plus short-term debt at end of previous period. 7/ The key variables include real GDP growth; real interest rate; and primary balance in percent of GDP.8/ Derived as nominal interest expenditure divided by previous period debt stock.9/ Assumes that key variables (real GDP growth, real interest rate, and other identified debt-creating flows) remain at the level of the last projection year.
Table 12. Romania: Public Sector Debt Sustainability Framework, 2007-2017(In percent of GDP, unless otherwise indicated)
Actual

47
Projections2007 2008 2009 2010 2011 2012 2013 2014 2015 2016 2017 Debt-stabilizing
non-interest current account 6/
Baseline: External debt 47.0 51.8 68.6 74.5 72.1 71.1 69.1 66.1 64.3 64.1 63.1 -6.5
Change in external debt 4.9 4.7 16.9 5.9 -2.4 -1.0 -2.0 -3.0 -1.7 -0.2 -0.9Identified external debt-creating flows (4+8+9) -1.5 0.4 10.2 -1.3 -5.1 0.7 -0.9 -1.6 -1.3 -1.0 -1.1
Current account deficit, excluding interest payments 11.6 9.2 1.8 2.0 2.2 2.0 2.0 2.3 2.8 3.1 3.2Deficit in balance of goods and services 14.0 13.2 6.1 5.8 5.2 5.1 5.2 5.5 5.8 5.7 5.7
Exports 29.2 30.4 30.6 35.4 38.4 39.7 40.6 40.6 41.1 41.6 42.3Imports 43.2 43.6 36.6 41.2 43.6 44.9 45.8 46.1 46.9 47.2 48.0
Net non-debt creating capital inflows (negative) -5.8 -6.0 -3.4 -2.5 -2.7 -2.3 -2.9 -3.6 -3.6 -3.4 -3.4Automatic debt dynamics 1/ -7.2 -2.8 11.8 -0.8 -4.5 1.1 0.0 -0.3 -0.5 -0.7 -0.8
Contribution from nominal interest rate 1.8 2.3 2.4 2.4 2.2 1.7 1.7 1.7 1.5 1.4 1.3Contribution from real GDP growth -2.1 -3.1 4.0 1.1 -1.7 -0.7 -1.7 -1.9 -2.0 -2.1 -2.1Contribution from price and exchange rate changes 2/ -7.0 -2.0 5.4 -4.3 -5.1 ... ... ... ... ... ...
Residual, incl. change in gross foreign assets (2-3) 3/ 6.4 4.3 6.7 7.2 2.7 -1.8 -1.1 -1.5 -0.4 0.8 0.1
External debt-to-exports ratio (in percent) 160.9 170.3 224.5 210.2 187.9 178.9 170.2 162.7 156.5 154.2 149.2
Gross external financing need (in billions of Euros) 4/ 35.9 46.2 34.9 32.1 37.8 41.1 43.8 43.6 45.3 43.8 45.5in percent of GDP 28.8 33.1 29.5 25.9 27.7 30.3 31.5 29.4 28.5 25.6 24.8
Scenario with key variables at their historical averages 5/ 71.1 65.8 62.4 60.3 59.1 57.4 -9.1
Key Macroeconomic Assumptions Underlying Baseline
Real GDP growth (in percent) 6.3 7.3 -6.6 -1.6 2.5 0.9 2.5 3.0 3.3 3.5 3.5GDP deflator in Euros (change in percent) 19.8 4.5 -9.4 6.7 7.3 -1.6 0.1 3.4 3.8 3.8 3.8Nominal external interest rate (in percent) 5.6 5.5 3.9 3.7 3.3 2.4 2.5 2.6 2.5 2.4 2.2Growth of exports (Euro terms, in percent) 15.9 16.6 -14.9 21.7 19.1 2.8 4.8 6.5 8.6 8.7 9.5Growth of imports (Euro terms, in percent) 24.7 13.2 -28.9 18.2 16.3 2.2 4.7 7.2 9.2 8.2 9.3Current account balance, excluding interest payments -11.6 -9.2 -1.8 -2.0 -2.2 -2.0 -2.0 -2.3 -2.8 -3.1 -3.2Net non-debt creating capital inflows 5.8 6.0 3.4 2.5 2.7 2.3 2.9 3.6 3.6 3.4 3.4
1/ Derived as [r - g - r(1+g) + ea(1+r)]/(1+g+r+gr) times previous period debt stock, with r = nominal effective interest rate on external debt; r = change in domestic GDP deflator in US dollar terms, g = real GDP growth rate, e = nominal appreciation (increase in dollar value of domestic currency), and a = share of domestic-currency denominated debt in total external debt.2/ The contribution from price and exchange rate changes is defined as [-r(1+g) + ea(1+r)]/(1+g+r+gr) times previous period debt stock. r increases with an appreciating domestic currency (e > 0) and rising inflation (based on GDP deflator). 3/ For projection, line includes the impact of price and exchange rate changes.4/ Defined as current account deficit, plus amortization on medium- and long-term debt, plus short-term debt at end of previous period. 5/ The key variables include real GDP growth; nominal interest rate; dollar deflator growth; and both non-interest current account and non-debt inflows in percent of GDP.
Table 13. Romania: External Debt Sustainability Framework, 2007-2017(In percent of GDP, unless otherwise indicated)
Actual
6/ Long-run, constant balance that stabilizes the debt ratio assuming that key variables (real GDP growth, nominal interest rate, dollar deflator growth, and non-debt inflows in percent of GDP) remain at their levels of the last projection year.

48
Figure 1. Romania: Real Sector, 2007–12
Source: Haver.
-10
-8
-6
-4
-2
0
2
4
6
8
10
12
15
20
25
30
35
40
2007Q1 2008Q1 2009Q1 2010Q1 2011Q1 2012Q1
Real GDP Dynamics
Real GDP, 2000 prices, SA (billion RON)
QoQ, sa (rhs)
YoY (rhs)
The post-crisis economic recovery in Romania remains weak...
-40
-30
-20
-10
0
10
20
30
40
2007Q1 2008Q1 2009Q1 2010Q1 2011Q1 2012Q1
GDP Components Contribution(in percent)
ImportsExportsInvestmentConsumptionGDP growth (yoy)
... as domestic demand recovers slowly.
50
60
70
80
90
100
110
120
130
140
150
-100
-80
-60
-40
-20
0
20
40
2007M1 2008M1 2009M1 2010M1 2011M1 2012M1
Confidence Indicators
Services Confidence, balance
Consumer Confidence, balance
Economic Sentiment Indicator, long-term average=100 (rhs)
Confidence is improving from the low levels seen during the crisis...
-30
-20
-10
0
10
20
30
40
2007M1 2008M1 2009M1 2010M1 2011M1 2012M1
Industrial Production and Retail Sales(SA, yoy )
Retail Sales
Industrial Production
...which has led to a modest recovery in retail sales , offsetting sluggish industrial output growth.

49
Figure 2. Romania: External Sector, 2007–12
Sources: Haver; and National Bank of Romania.
0
1
2
3
4
5
6
-30
-25
-20
-15
-10
-5
0
5
2007M1 2008M1 2009M1 2010M1 2011M1 2012M1
Romania Trade(Billions of Euro)
Trade Balance (12 months, lhs)Exports (sa)Imports (sa)
The trade deficit hasnarrowed since the crisis as export growth has outpaced imports ...
80
90
100
110
120
130
140
10
15
20
25
30
35
40
2007M1 2008M1 2009M1 2010M1 2011M1 2012M1
Forex Reserves excl. Gold and Coverage(Million of euros)
Reserves coverage (S-T Debt) (RHS)Forex Reserves
... and a stabilization of foreign reserves.
-8
-6
-4
-2
0
2
4
6
8
2007Q1 2008Q1 2009Q1 2010Q1 2011Q1 2012Q1
Income Balance and Current Transfers(Percent of GDP)
Income balance
Current transfers
... and transfers have strengthened ...
-20
-15
-10
-5
0
5
2007Q1 2008Q1 2009Q1 2010Q1 2011Q1 2012Q1
Current Account(Percent of GDP)
... thus narrowing the current account.
-15
-10
-5
0
5
10
15
20
25
2007Q1 2008Q1 2009Q1 2010Q1 2011Q1 2012Q1
Capital and Financial Account(Percent of GDP)
Other InvestmentPortfolio investmentFDICapital AccountCapital and Financial
Net capital inflows are receding ...
95
100
105
110
115
120
125
130
2007Q1 2008Q1 2009Q1 2010Q1 2011Q1
REER - ULC deflated(Index, 2007Q1=100)
... leading to depreciation of the Lei ...

50
Figure 3. Romania: Labor Sector, 2007–12
Sources: Eurostat; and Haver.
1000
1200
1400
1600
1800
2000
2200
2400
2600
2800
2007M1 2008M1 2009M1 2010M1 2011M1 2012M1
Average Gross Monthly Wages(Lei per person)
Public Wages
Private Wages
Public wages were cut substantially during the crisis but have been partially reinstated since ...
0
1
2
3
4
5
6
7
8
9
2007Q1 2008Q1 2009Q1 2010Q1 2011Q1 2012Q1
Unemployment(Percent)
Registered unemployment (SA)
Overall unemployment
Overall unemployment remains elevated while jobless claims have fallen since 2010 ...
-4
-3
-2
-1
0
1
2
2007Q1 2008Q1 2009Q1 2010Q1 2011Q1 2012Q1
Employment(Yoy, Percent)
... mainly reflecting administrative tightening and some employment recovery.
80
90
100
110
120
130
140
150
160
170
2007Q1 2008Q1 2009Q1 2010Q1 2011Q1 2012Q1
Productivity- economy wide(SA, Q12007=100)
Output per Employee
Average Gross Monthly Wage
... while private wages have been increasing,productivity has been somewhat lagging behind.
80
90
100
110
120
130
140
2007M1 2008M1 2009M1 2010M1 2011M1 2012M1
ULC Manufacturing(Index, 2007=100)
Unit labor costs dropped after the crisis but have started increasing again in 2011 ...
4.0
4.2
4.4
4.6
4.8
5.0
5.2
5.4
5.6
5.8
6.0
0.0
0.2
0.4
0.6
0.8
1.0
1.2
1.4
1.6
2007M1 2008M1 2009M1 2010M1 2011M1 2012M1
Public and Manufacturing Employment(in million )
Total Employees (rhs)Public EmployeesManufacturing
...while employment has continued to decline in the public sector and has recovered somewhat in manufacturing.

51
Figure 4. Romania: Monetary Sector, 2005–12(Percent)
Sources: Haver; National Bank of Romania; Consensus Forecast; and IMF staff estimates.1/ Value equals percent of respondents reporting an increase minus the percent of respondents reporting a decrease.
Upper band (+1)
Lower band (-1)
7.5
5.0
4.0 3.8 3.53.5 3.0
3.0
Projections
0
1
2
3
4
5
6
7
8
9
10
0
1
2
3
4
5
6
7
8
9
10
2005M12 2007M12 2009M12 2011M12
Inflation Targets and Outcomes
Target s
HICP inflation
Inflation has declined but is projected to increase towards the upper bound of the target band ...
20
30
40
50
60
70
80
90
0
5
10
15
20
25
30
35
2008M1 2009M1 2010M1 2011M1 2012M1
Inflation(yoy)
Headline inflation
Core 3 - excl. administered, volatile, alcohol & tobacco pricesConsumer price expectations 1/ (Percent, SA, RHS)
... while consumer price expectations remain low and core inflation well anchored.
0
5
10
15
20
25
2007M1 2008M1 2009M1 2010M1 2011M1 2012M1
Interest Rates on RON Instruments
Deposits (new)Lending (new loans)Policy rateInterbank rateTbill primary market
Market interest rates have fallen since the onset of the global crisis ...
0
2
4
6
8
10
2007M1 2008M1 2009M1 2010M1 2011M1 2012M1
Interest Rates on EUR Instruments
Deposits (new)
Lending (new loans)
... and interest rate differentials have stabilized.
0
2
4
6
8
10
12
14
2007M1 2008M1 2009M1 2010M1 2011M1 2012M1
Policy Interest Rates CzechHungaryPoland Romania Euro Area Bulgaria
The central bank has ended its recent easing cycle ...
-40
-20
0
20
40
60
80
100
2007M1 2008M1 2009M1 2010M1 2011M1 2012M1
Consumer Price Expectation 1/
Czech HungaryPoland Romania Euro Area Bulgaria
while consumer price expectations remain well anchored.

52
Source: Romania National Authorities; and IMF staff estimates.
-8
-7
-6
-5
-4
-3
-2
-1
0
1
2005 2006 2007 2008 2009 2010 2011 2012
Fiscal balance
Fiscal balance
Primary Balance
Proj.
A large consolidation has led to a sharp reversal of fiscal imbalances ...
17
18
19
20
21
22
30
31
32
33
34
2005 2006 2007 2008 2009 2010 2011 2012
Revenue
Revenue
Taxes (excl. SSC, rhs)
Proj.
Despite large tax increases, revenues remain stable ...
2
3
4
5
28
30
32
34
36
38
40
2005 2006 2007 2008 2009 2010 2011 2012
Expenditures
ExpenditureCurrent expenditureCapital expenditure (rhs)
Proj.
... while current expenditure has declined substantially...
10
15
20
25
30
35
40
2005 2006 2007 2008 2009 2010 2011 2012
Gross General Government Debt
Proj.
The rapid pace of debt increase has moderated ...
-8
-6
-4
-2
0
2
4
6
8
2005 2006 2007 2008 2009 2010 2011 2012
Structural Balance and Output Gap
Structural BalanceOutput Gap
Proj.
... due to a reduced structural deficit .
Figure 5. Romania: Fiscal Operations, 2005–12(Percent of GDP)
6.5
7.0
7.5
8.0
8.5
9.0
9.5
2005 2006 2007 2008 2009 2010 2011 2012
Wage Bill
Proj.
... due to lower wagebill expenditures.

53
Figure 6. Romania: Financial Sector, 2007–12
Sources: Dxtime; and National Bank of Romania.
-20,000
0
20,000
40,000
60,000
80,000
100,000
120,000
140,000
160,000RON Credit
(Millions of Lei)
TotalHouseholdCorporateOther
Private credit remains subdued , both in domestic ...
0
20,000
40,000
60,000
80,000
100,000
120,000
140,000
160,000FX Credit
(Millions of Lei)
Total
Household
Corporate
... and in foreign currency.
78
80
82
84
86
88
90
2008Q4 2010Q1 2010Q3 2011Q1 2011Q3 2012Q1
Deposit to Loan Ratio(Percent)
Deposits have held up recently in spite of some foreign bank deleveraging ...
10
12
14
16
18
20
2008Q4 2010Q1 2010Q3 2011Q1 2011Q3 2012Q1
Capital Adequacy Ratio(Percent)
... and capital adequacy remains adequate ...
0
2
4
6
8
10
12
14
16
18
2008Q4 2010Q1 2010Q3 2011Q1 2011Q3 2012Q1
Nonperforming Loans(Percent of total loans)
... although nonperforming loans are rising .
-0.8
-0.4
0.0
0.4
0.8
1.2
1.6
2.0
-5
0
5
10
15
20
2008Q4 2010Q1 2010Q3 2011Q1 2011Q3 2012Q1
Profitability(Percent )
Return on Equity
Return on Assets (rhs)
... and higher provisioning needs are dragging down profitability.

54
Figure 7. Romania: Financial Developments
Sources: Bloomberg; and Haver.
90
100
110
120
130
140
150
160
7/1/
2008
9/23
/200
812
/16/
2008
3/10
/200
96/
2/20
098/
25/2
009
11/1
7/20
092/
9/20
105/
4/20
107/
27/2
010
10/1
9/20
101/
11/2
011
4/5/
2011
6/28
/201
19/
20/2
011
12/1
3/20
113/
6/20
125/
29/2
012
National Currency per Euro(July 1, 2008 = 100)
CzechHungaryPolandRomania
... while the Lei has depreciated gradually in nominal terms ...
0
20
40
60
80
100
120
140
160
1801/
1/20
074/
1/20
077/
1/20
0710
/1/2
007
1/1/
2008
4/1/
2008
7/1/
2008
10/1
/200
81/
1/20
094/
1/20
097/
1/20
0910
/1/2
009
1/1/
2010
4/1/
2010
7/1/
2010
10/1
/201
01/
1/20
114/
1/20
117/
1/20
1110
/1/2
011
1/1/
2012
4/1/
2012
7/1/
2012
Equity Markets(Jan. 4, 2007 = 100)
BulgariaCzechHungaryPolandRomania
The equity market bounced back after the onset of the crisis but has recently lost some ground...
0
2
4
6
8
10
12
14
16
18
20
1/1/
2007
3/26
/200
76/
18/2
007
9/10
/200
712
/3/2
007
2/25
/200
85/
19/2
008
8/11
/200
811
/3/2
008
1/26
/200
94/
20/2
009
7/13
/200
910
/5/2
009
12/2
8/20
093/
22/2
010
6/14
/201
09/
6/20
1011
/29/
2010
2/21
/201
15/
16/2
011
8/8/
2011
10/3
1/20
111/
23/2
012
4/16
/201
27/
9/20
12
Interbank Offer Rates (3-months, in percent)
BulgariaCzechHungaryPolandRomania
... while interbank rates remained volatile on account of banking sector fragmentation.
0
100
200
300
400
500
600
700
800
900
1000
1/1/
2007
3/26
/200
76/
18/2
007
9/10
/200
712
/3/2
007
2/25
/200
85/
19/2
008
8/11
/200
811
/3/2
008
1/26
/200
94/
20/2
009
7/13
/200
910
/5/2
009
12/2
8/20
093/
22/2
010
6/14
/201
09/
6/20
1011
/29/
2010
2/21
/201
15/
16/2
011
8/8/
2011
10/3
1/20
111/
23/2
012
4/16
/201
27/
9/20
12
EMBIG Spreads(Bps) Bulgaria
Euro AreaHungaryPolandRomania
... together with EMBIG spreads ...
80859095
100105110115120125130
2007
M1
2007
M7
2008
M1
2008
M7
2009
M1
2009
M7
2010
M1
2010
M7
2011
M1
2011
M7
2012
M1
Real Effective Exchange Rates CPI -based (2007 = 100)
Bulgaria Czech Hungary
Poland Romania
... and in real terms.
0100200300400500600700800900
7/1/
2008
9/23
/200
812
/16/
2008
3/10
/200
96/
2/20
098/
25/2
009
11/1
7/20
092/
9/20
105/
4/20
107/
27/2
010
10/1
9/20
101/
11/2
011
4/5/
2011
6/28
/201
19/
20/2
011
12/1
3/20
113/
6/20
125/
29/2
012
CDS, 5-year BulgariaCzechHungaryPolandRomania
In contrast to regional trends, CDS spreads have risen in recent months ...

55
Growth shock
47
Baseline
31
0
5
10
15
20
25
30
35
40
45
50
2007 2009 2011 2013 2015 2017
Growth Shock(in percent per year)
PB shock 37
Baseline 31
35
0
5
10
15
20
25
30
35
40
45
50
2007 2009 2011 2013 2015 2017
i-rate shock35
Baseline 31
0
5
10
15
20
25
30
35
40
45
50
2007 2009 2011 2013 2015 2017
Interest rate Shock(in percent)
Figure 8. Romania: Public Debt Sustainability: Bound Tests 1/ 2/ (Public debt in percent of GDP)
Sources: International Monetary Fund, country desk data, and staff estimates.1/ Shaded areas represent actual data. Individual shocks are permanent one-half standard deviation shocks. Figures in the boxes represent average projections for the respective variables in the baseline and scenario being presented. Ten-year historical average for the variable is also shown.2/ For historical scenarios, the historical averages are calculated over the ten-year period, and the information is used to project debt dynamics five years ahead.3/ Permanent 1/4 standard deviation shocks applied to real interest rate, growth rate, and primary balance.4/ One-time real depreciation of 30 percent and 10 percent of GDP shock to contingent liabilities occur in 2013, with real depreciation defined as nominal depreciation (measured by percentage fall in dollar value of local currency) minus domestic inflation (based on GDP deflator).
Historical 31Baseline 31
3
5
7
9
11
13
15
17
19
21
0
5
10
15
20
25
30
35
40
45
50
2007 2009 2011 2013 2015 2017
Baseline and Historical Scenarios
Combined shock
38
Baseline 31
0
5
10
15
20
25
30
35
40
45
50
2007 2009 2011 2013 2015 2017
Combined Shock 3/
30 % depreciation 40
Baseline31
contingent liabilities
shock 41
0
5
10
15
20
25
30
35
40
45
50
2007 2009 2011 2013 2015 2017
Real Depreciation and Contingent Liabilities Shocks 4/
Gross financing need under baseline
(right scale)
Primary Balance Shock (in percent of GDP) andNo Policy Change Scenario (constant primary balance)
No policy change
Baseline: 0.3
Scenario: -0.8
Historical: -2.2
Baseline: 3.2
Scenario: 0.8
Historical: 3.9
Baseline: 2.2
Scenario: 4.8
Historical: -5.5
56
i-rate shock
64
Baseline 63
30
50
70
90
110
130
2007 2009 2011 2013 2015 2017
Interest Rate Shock (in percent)
Figure 9. Romania: External Debt Sustainability: Bound Tests 1/ 2/(External debt in percent of GDP)
Sources: International Monetary Fund, Country desk data, and staff estimates.1/ Shaded areas represent actual data. Individual shocks are permanent one-half standard deviation shocks. Figures in the boxes represent average projections for the respective variables in the baseline and scenario being presented. Ten-year historical average for the variable is also shown. 2/ For historical scenarios, the historical averages are calculated over the ten-year period, and the information is used to project debt dynamics five years ahead.3/ Permanent 1/4 standard deviation shocks applied to real interest rate, growth rate, and current account balance.4/ One-time real depreciation of 30 percent occurs in 2013.
Historical57
Baseline
63
10
20
30
40
50
60
30
50
70
90
110
130
2007 2009 2011 2013 2015 2017
Baseline and Historical Scenarios
CA shock 71
Baseline 63
30
50
70
90
110
130
2007 2009 2011 2013 2015 2017
Combined shock 71
Baseline 63
30
50
70
90
110
130
2007 2009 2011 2013 2015 2017
Combined Shock 3/
30 % depreciation
92
Baseline 63
30
50
70
90
110
130
2007 2009 2011 2013 2015 2017
Real Depreciation Shock 4/
Gross financing need under baseline
(right scale)
Non-Interest Current Account Shock (in percent of GDP)
Growth shock 70
Baseline 63
30
50
70
90
110
130
2007 2009 2011 2013 2015 2017
Growth Shock (in percent per year)
Baseline:
Scenario:
Historical:
2.4
2.8
4.6
Baseline:
Scenario:
Historical:
3.2
0.8
3.9
Baseline:
Scenario:
Historical:
-2.7
-4.5
-5.6

57
Appendix I. Romania: Letter of Intent
Bucharest, September 12, 2012
Mme. Christine Lagarde Managing Director International Monetary Fund Washington, DC 20431 U.S.A. Dear Mme. Lagarde: 1. The Romanian authorities reaffirm our commitment to our economic program supported by the International Monetary Fund (IMF), the European Union (EU), and the World Bank (WB). Implementation of the program was good in most areas, but the broader structural reform agenda continues to progress slowly. We met all but one performance criteria for the sixth program review. We are committed to the additional actions described in the attached Memorandum of Economic and Financial Policies (MEFP), including the acceleration of structural reforms. We expect growth to remain subdued this year, after the economy contracted in the last quarter of 2011 and the first quarter of 2012. The recovery remains vulnerable to difficulties in international financial markets, which require continued firm policy implementation and maintenance of fiscal, monetary, and financial sector buffers to safeguard against risks.
2. Our performance on the quantitative targets and structural reform agenda for the fifth review has been good (MEFP, Tables 1 and 2).
Quantitative performance criteria and indicative targets. All but one end-June 2012 quantitative performance criteria were observed. The performance criterion (PC) on central government arrears was missed by a small margin. All indicative targets, except the ceiling on the stock of local government arrears, were met. Corrective actions are being taken to reduce arrears as described in the attached MEFP (¶5). Inflation remained within the inner band of the inflation consultation mechanism.
Structural benchmarks. We met all the structural benchmarks for June 30, 2012. We increased electricity prices by five percent, launched a tender for providing software to integrate the accounting reporting system with the Treasury payment system, and prepared comprehensive amendments to the health care legislation. We continue to improve the health care amendments as part of the consultation process with the IMF, the EU, and the WB.

58
3. In the attached MEFP, we set out our plans to further advance towards meeting the objectives of our macroeconomic program. In view of our performance under the program supported by the IMF, the EU, and the World Bank and proposed remedial measures, the Government of Romania and the National Bank of Romania (NBR) request a waiver on the missed performance criterion and completion of the sixth review. We intend to continue to treat the arrangement as precautionary.
4. The program will continue to be monitored through quarterly reviews, prior actions, quantitative performance criteria and indicative targets, as well as structural benchmarks. We propose a modification of the September 30, 2012 quantitative performance criteria and the establishment of such criteria for December 31, 2012, as set out in the attached MEFP. The modification consists of a downward revision to the performance criterion on Net Foreign Assets (as described in the Technical Memorandum of Understanding, TMU) due to lower net capital inflows. As detailed in the MEFP, we propose four new structural benchmarks and four prior actions against which to measure progress under the program (MEFP, Table 2). We also request that the structural benchmark on holding of IPOs of government shares in Romgaz and Hidroelectrica to be reset from October 15, 2012, to March 15, 2013. The TMU explains how program targets are measured.
5. We believe that the policies set forth in the letters of March 10, 2011, June 9, 2011, September 14, 2011, December 2, 2011, February 28, 2012, June 8, 2012, and in this Letter are adequate to achieve the objectives of our economic program. We stand ready to take additional measures as appropriate to ensure achievement of these objectives. We will consult with the IMF and European Commission (EC) before modifying measures contained in this Letter and the attached MEFP or adopting new measures that would deviate from the goals of the program, and will provide the IMF and the EC with the necessary information for program monitoring.
6. We authorize the IMF and the EC to publish the Letter of Intent and its attachments, and the related staff reports. This letter is being copied to Mr. Olli Rehn.
Sincerely,
/s/ /s/ Florin Georgescu Mugur Isarescu
Deputy Prime Minister Governor of the National Bank of Romania and Minister of Public Finance

59
Attachment I. Romania: Memorandum of Economic and Financial Policies Recent Economic Developments and Outlook 1. Two consecutive quarterly declines in economic activity (q/q) point to a stronger growth slowdown than previously expected. Real GDP grew by 2½ percent in 2011 on the back of a very good harvest, a modest recovery in private demand supported by export growth. However, real GDP declined by 0.2 percent in the fourth quarter of 2011 (q/q) and by 0.1 percent in the first quarter of 2012 (q/q) as economic activity slowed and adverse weather conditions dampened domestic demand. Preliminary data indicate that second quarter growth will be positive on account of strong retail sales and construction activity. Headline inflation fell to 2 percent in June on account of food price declines from the high levels of a year ago and phasing out of base effects related to earlier VAT rate increases. Annual inflation jumped to 3 percent in July, reflecting the anticipated reversal of base effects and pass through of the exchange rate depreciation. Core inflation in July remained close to 2 percent reflecting the sizeable output gap and the prudent monetary policy stance.
2. We expect growth for the year as a whole to be subdued at around 1 percent. Growth is likely to slow more than previously anticipated as weak external demand and the impact of the recent drought weigh on economic activity. Moreover, the absorption of EU funds is likely to be lower than expected earlier in the year. Inflation should stay within the central bank’s target band, although it will temporarily increase towards the upper end of the band in the third quarter due to rising food prices and reversal of base effects. The current account deficit is expected not to exceed 4 percent of GDP for 2012, reflecting a faster slowdown in import growth compared to exports. Risks to economic activity continue to be tilted to the downside, particularly from developments in international financial markets, lower-than-expected EU funds absorption, the impact of the drought, and increased political uncertainty. Firm policy implementation will thus be crucial in building confidence and securing policy buffers.
Fiscal Policy
3. In the second quarter of 2012, we met our fiscal deficit target. Tax revenues over-performed slightly, reflecting a gradual recovery in wages and enhanced tax collection efforts, while nontax revenues recovered due to dividends from state-owned enterprises (SOEs). Overall spending was below projections as we maintained strict control over current spending, with a continued decline in public employment. Some resources were reallocated to higher capital spending and co-financing for EU-funded projects, while the execution of National Development and Infrastructure Program (PNDI) projects was contained. However, the arrears targets for the general government were missed. Arrears of the local governments continued to increase, while arrears of the central government were unchanged.

60
4. For 2012, we remain fully committed to bringing the fiscal deficit in ESA terms below 3 percent of GDP, in compliance with our commitment under the EU Excessive Deficit Procedure. For 2013, we will reduce the structural deficit by at least 0.5 percent of GDP. To ensure meeting our goal for 2012, we will limit the cash deficit target to 2.2 percent of GDP, which entails a consolidation of some 2 percent of GDP in structural terms. Achieving this target will require continued expenditure restraint and strengthened tax collection efforts. We have already taken measures to protect against possible adverse developments by freezing 10 percent of state budget allocations. The public sector wage bill will remain at 6.7 percent of GDP, as in 2011. In light of the interruption of EU fund reimbursements for a number of programs, capital outlays, including for co-financing of EU-funded projects, will need to slow down to remain within the budgetary envelope. Co-financing of EU-funded projects from the privatization fund will not be undertaken and any unspent funds from the PNDI will be saved. Pressures to relax fiscal discipline ahead of parliamentary elections in the fall will be firmly resisted. We will undertake measures to ensure strict discipline of local government finances and a reduction of arrears.
5. After a year of declining arrears and unpaid bills in the general government (excluding SOEs), arrears have increased again since early 2012, causing program targets to be missed for both the central and local governments. Government arrears increased by RON 205 million since March 2012 and now stand at around 0.2 percent of GDP (concentrated mostly in local governments). In SOEs monitored under the program, arrears in the second quarter of 2012 stood at 3.3 percent of GDP, below the indicative program ceiling.
We are making progress in the integration of the accounting reporting system with the Treasury payment system, including the commitment control and reporting module for all levels of government. We launched a tender for the software provider for the system. We will select the consultant by mid-October 2012 and finalize a detailed definition of the structure architecture of the system by end- December 2012 (structural benchmark). This system will help control spending commitments to avoid future arrears.
Rising arrears at the local government level are a key challenge. These arrears reflect late payments for current spending such as on utilities, especially among smaller local government administration units with limited own revenues. The increase in arrears also reflects unfunded commitments made during the pre-election period, which shows serious shortcomings in the monitoring and enforcement of the Local Government Public Finance Law (LGPFL). To strengthen enforcement, we have conducted a thorough audit of the use made of the allocated additional transfers from the central government for arrears reduction and will undertake a comprehensive analysis of local government arrears to determine their causes and the entities to which the arrears are owed. We will approve a government ordinance to: (i) ensure that tax-sharing resources available to local governments, currently limited to co-financing investment can be used for paying arrears; and (ii) allow the central

61
government to directly pay off arrears of local government from shared taxes (prior action). Accordingly, the central government will begin to pay off local government arrears from September and will jointly with the Court of Accounts strictly enforce sanctions on local governments that breach the LGPFL. We will also seek technical assistance to improve insolvency procedures for local governments. We will submit by September 15 a report on the distribution of local government arrears across local authorities, its sources, the progress made in clearing these arrears, and the status of enforcement activities undertaken.
In the health sector, arrears in registered bills have now been eliminated. The clawback tax has yielded RON 716 million in the first half of 2012, which will be fully used to pay down outstanding bills. We have updated the formula of the claw-back tax with the pharmaceutical industry. All revenues from the clawback tax will be used to reduce payment periods and ensure non-accumulation of arrears in the pharmaceutical sector. In preparation of the implementation of the EU Late Payments Directive, which will become effective as of March 2013, we will identify measures to cover the fiscal needs arising from the timely payment of unpaid bills.
For SOEs, we are making progress in reducing arrears in monitored companies through swap operations, payments, and other financial operations. We anticipate that these measures will permit arrears of companies under monitoring to be reduced by RON 4 to 5 billion (three-quarters of a percent of GDP) in the second half of 2012.
6. To address health sector financial imbalances in 2012-13, we are committed to implementing the following key measures:
We adopted the revised co-payment formula on July 18, 2012. The new formula is based on a modest fixed amount depending on services provided but independent of income, and copayments will be implemented as of January 1, 2013. Emergency services are excluded from the co-payment law.
To control expenditures and ensure efficiency gains in the short term, we will continue to revise and implement the negative list of health services and drugs, and have agreed with health service providers to reduce hospitalization periods. The national hospital bed plan, which established the number of hospital beds that can be contracted in 2012 with health insurance houses in every county, is being implemented through Ministry of Health Order No 1577/2011. We will not introduce any new drugs or indications in the list of compensated drugs without an interim health technology assessment (HTA). To this end, we will elaborate an interim HTA based on objective and quantifiable criteria by end-October 2012. We will continue to encourage generics where possible in the list of compensated and free drugs and pharmacies will be required to better inform their clients of available products. In addition, we will improve the procurement system for hospitals, in particular by

62
centralizing tenders.
We will continue to monitor public hospital budgets to ensure that they are consistent with the expenditure programmed in the general government budget. We will publish up-to-date financial statements of all public hospitals on a web page of the Ministry of Health by end-October 2012 (structural benchmark). Moreover, we will establish mandatory financial audits of all public hospitals (under national or local governments) and financial audits of the use of public funds, and introduce sanctions for hospital managers overspending their available budgets.
We will continue implementation of a new healthcare IT system. We have initiated the auditing of patient registries, which will be completed by end-2012. The contract for the production of patient cards and for the IT system was signed and we began distributing electronic health cards in August. This will help control fraud and abuse in the system while enabling better monitoring of spending commitments. A new electronic prescription module for the National Health Information System became operational in June 2012. Efforts are ongoing under an EU-funded project to build a central data base with electronic health records, which is expected to be in place by mid-2013.
7. We continue our efforts to prepare and implement a comprehensive reform of the healthcare system. We published a revised draft of a new framework law in June (structural benchmark), with public debate between July and October before submitting the law to Parliament by the end-2012. We will publish impact assessments of the reform options before parliamentary discussion and also provide a timetable for the implementation of subsequent legislation. The reform will aim to raise the efficiency of healthcare spending in Romania, enhance service quality, and address the persistent budgetary shortfalls. Over the medium and longer term, given that public healthcare spending is among the lowest in the EU, we will ensure adequate financing of the system, while factoring in the costs of population ageing into future spending needs. To contain the growth of public spending, we will seek to reduce the scope of the public benefits package through greater reliance on cost-sharing and private supplementary insurance. On the revenue side we will explore options to broaden the contribution base to the social health insurance scheme and, if necessary, to raise contribution rates.
8. In July 2012, we enacted measures to streamline the tax system, building on recommendations of IMF technical assistance. These measures aim to: (i) simplify the declaration and payment of taxes on capital gains by changing to a system based on withholding of advance payments made by intermediaries (brokers) and a single statement filed by the taxpayer at the end of the year; and (ii) provide a neutral tax treatment for the sale of bank receivables to Romanian companies. In addition, we will introduce from January 2013 further measures aimed at: (i) simplifying the depreciation schedules for fixed assets; (ii) revising the base for property taxes, which will vary depending on use of the

63
property and not the legal status of the property owner, and options for property tax collection; and (iii) moving VAT collection onto a cash accounting basis for companies with annual turnover below EUR 500,000. From September 1, we will increase tax deductibility for research and development expenditures from 20 percent to 50 percent. We also intend to enlarge the tax base in agriculture and for the self-employed, and to assess the effects on employment and the public finances of tax policy options aimed at reducing the number of long-term unemployed. We are implementing measures to increase excise tax collections, particularly by reducing evasion of excise duties on alcoholic beverages, and will ensure that excise rates are better correlated with the alcohol content and the production process. We will consult with IMF/EC staff before undertaking any further changes of the tax system.
9. We are making progress on a comprehensive reform of the tax administration (ANAF):
We are applying the deregistering criteria for small VAT payers and maintain the commitment to reduce the total number of small taxpayers registered for VAT purposes by 20 percent between December 2011 and December 2012. To further streamline the tax rolls, the government will introduce a mandatory simplified tax regime for small taxpayers. With technical assistance from the IMF and EC, we will prepare draft legislation in this area by end-October 2012, with the goal of implementing it as of January 1, 2013.
We have identified 300 High Net-Wealth Individual (HNWI) taxpayers for the dedicated compliance program. A notification campaign to encourage voluntary declaration of incomes from abroad was undertaken in May. In order to strengthen capacity, we will undertake training programs with the assistance of partner-country tax administration specialists. We are currently seeking financing for an IT tool for risk analysis.
As part of ANAF restructuring and modernization, we aim to consolidate the current 221 tax offices to eight regional directorates (by mid 2013) and 47 local tax offices (by 2015). We will approve by end-2012 a multiannual project with the World Bank to support this process.
We are strengthening tax enforcement efforts by increasing our capacity for risk analysis and audit, and by improving the inter-operability with the Customs Authority and the Financial Guard. In July, we set up a central unit for fighting intra-community VAT fraud, with a focus on high-risk areas. We will improve the procedure for transmitting referrals for tax crimes and enhance the cooperation between ANAF, police and the Prosecutor's Office.
We will strengthen monitoring and control of the production, procurement, and import of energy products and alcoholic beverages. Controls at the EU's external

64
border will be strengthened to combat illicit traffic of cigarettes and other processed tobacco products.
We continue to expand e-filing and improve the one-stop shop for tax declarations. We will also improve procedures for legal interpretations of the tax code by introducing a single channel for communication with taxpayers.
ANAF took over the collection of health contributions by self-employed individuals as scheduled in July. By December 2012, we will adopt the necessary regulations to complete the integration of social contributions within the tax collection processes of ANAF and to allow individual taxpayers to submit a single declaration for income tax and social contributions as of January 2013. We will study the feasibility for ANAF to collect property taxes on behalf of the local authorities.
10. We continue to make progress in the implementation of the action plans based on the recommendations of the functional reviews of government ministries and agencies conducted last year. A new monitoring procedure was put in place, which was used by line ministries in their progress reports submitted in July 2012. We will develop a staffing plan for the line ministries within the parameters of the wage bill allocation in the budget by end-September 2012, based on the functional reviews of these ministries where possible. Separately, we consider improvement of the efficiency and transparency of public procurement procedures as a top priority. In line with the agreed timetable, we will implement by end-December 2012 the recommendations of the assessment carried out by the EC.
11. Although we have made some progress in absorbing EU funds in the first half of the year, further efforts are still required. The Romanian audit authority found problems in system management in previous years. Consequently, some parts of certain programs were interrupted. For high-priority EU-funded projects with problems, we will allocate the funds to offset the interruption of EC reimbursement from the budgets of the respective line ministries. For other projects, we will suspend payments until the situation has been clarified with the EC. We will take all necessary measures to rectify identified problems. Moreover, we will step up our efforts to boost absorption and are closely working with the EC to simplify the procedure that will help with quicker absorption up to the beneficiaries' level. Furthermore, we will continue to implement fully the April 2011 Priority Action Plan for the absorption of Structural and Cohesion Funds.
12. We have compiled an investment portfolio of all government projects to ensure proper monitoring and prioritization, such that funding can be fully secured within a medium-term horizon (3–5 years). As required under Decision 577, we will seek to ensure that national programs co-financed with local governments are fully funded. No new investment projects will be initiated while low priority projects will be discontinued and a list of these projects will be published. The investment database will be updated to identify priority projects funded through budgetary and EU funds by end-September 2012 (structural

65
benchmark). We will work with the World Bank, through a project financed with EU funds, to enhance the capacity of the Ministry of Public Finance (MOPF) to evaluate and monitor public investment projects. The Ministry of Regional Development and Tourism and the Ministry of Environment and Forests are committed to ensure that execution spending under the PNDI does not exceed RON 1 billion in 2012 and RON 1 billion in 2013, and no new PNDI projects will be signed.
13. Market conditions for public debt financing have become more strained owing to heightened domestic political uncertainty and conditions in external markets. We remain committed to consolidating the fiscal buffers, and maintain our ultimate objective of four months of gross financing needs to protect against unforeseen external shocks. The net interest paid on these buffers represents a necessary cost for insurance against shocks. We intend to return to the external market again in the second half of this year, as market conditions permit. We are continuing our efforts to widen the investor base and improve outreach efforts. We have now published the debt management strategy, albeit with delay, and are undertaking a project financed with European funds and implemented with support of the World Bank to strengthen the debt management department. We will publish the update of the 2013-15 debt management strategy in the first quarter of 2013.
Monetary Policy
14. Core inflation has remained relatively low. In the third quarter, headline inflation is expected to temporarily rebound towards the upper end of the central bank's target band of 3±1 percent as dis-inflationary base effects recede. Rapid exchange rate pass through and eventual food price increases will put upward pressure on core inflation. Nonetheless, inflation is expected to remain within the central bank’s target band throughout the year. Upside risks persist, however, including from exchange rate volatility and higher-than-expected global food prices.
15. We have kept the policy rate at 5.25 percent since May on account of domestic and external uncertainties. Lower net capital inflows have resulted in a depreciation of the leu of more than five percent against the euro since the beginning of the year, while the central bank’s stock of foreign reserves has adjusted. The risks of higher inflation and excessive volatility in capital flows and the exchange rate continue to require a prudent monetary policy stance, supported by a consistent macroeconomic policy mix. In the event exchange rate pressures persist, we will tighten our monetary policy stance. We will continue regular repurchase operations as needed to ensure adequate liquidity in the banking system. We will also design and implement the necessary arrangements and internal procedures to allow unlimited numbers (ISIN) of government securities to be eligible for the central bank’s open market operations by end-October 2012. Furthermore, in an effort to enhance the redistribution of liquidity across the banking sector, we will encourage the finalization of the master repurchase agreement and all procedures needed for banks to be able to engage in collateralized T-bill repo interbank lending.

66
Financial Sector
16. The Romanian banking sector maintains reassuring capital buffers and provisions but continues to be vulnerable to spillovers from the ongoing euro area crisis. Annual credit growth to the nonfinancial corporate sector (in real terms and at a constant exchange rate) at end-June remained subdued and declined somewhat to households. Nonperforming loans (NPLs) continued to rise and stood at 16.8 percent in June compared to 14.3 percent at end-2011, driven by the deterioration of the economic environment and partly by tighter supervisory enforcement. Total prudential provisions at end-June were sufficient to cover 98 percent of NPLs while the IFRS provisioning ratio stood at 69 percent. Bank profitability remains poor with an overall system loss during the first half of the year, mainly due to higher provisioning. The capitalization of the banking sector remained strong at 14.7 percent at end-June, albeit with some differences between banks. Overall, system household and corporate deposits have increased by around three percent since end-2011. However, the interbank market remains fragmented, due to perceived counterparty risk, and funding has become more heterogeneous in the deposit segment. Compared to regional peers, foreign-owned bank deleveraging has been orderly and moderate so far.
17. The NBR will continue to intensively supervise the banking system and take any necessary measures to ensure that banks have sufficient capital and liquidity, especially in light of the uncertain environment. The NBR, Deposit Guarantee Fund (DGF), and the MOPF will continue to coordinate the implementation of operational preparedness plans and the arrangements for the acquired bank resolution powers according to their competencies. The NBR will finalize the regulation on the authorization of the bridge bank and internal procedures for the recently introduced bank resolution measures by end-September 2012. The details of the updated NBR contingency planning framework will be shared and agreed with the IMF and EC staff by end-October 2012. The NBR is preparing detailed contingency plans on an ongoing basis. Based on the Memorandum of Understanding between the NBR and the DGF, the two institutions will finalize the necessary internal arrangements to provide the DGF with access to the already agreed set of relevant financial and prudential information. The DGF will build up its expertise in analyzing the financial information provided by the NBR. The NBR will continue to closely oversee bank practices to avoid evergreening so as to ensure that IFRS loan-loss provisioning and collateral valuations, as well as the assessment of credit risk of restructured loans, remain prudent and in line with good international practices. The NBR will continue to collect periodic and detailed supervisory data on restructured loans. As part of the permanent prudential arrangements that will apply in 2013, the prudential filter will remain in place in the current form, in line with the EU regulatory developments. Any amendments to measures adopted in 2011 to restrict foreign-currency lending to unhedged households will be agreed with the IMF and EC staff.
18. We will examine the impact of the recent amendment to the fiscal code that aims at ensuring a neutral tax treatment of bank receivables sold to Romanian firms so that banks can mitigate the rise in impaired loans and improve their balance sheet management. The law

67
amending the Law 503/2004 on the bankruptcy of insurance undertakings will be enacted by end-October 2012. As preserving credit discipline and avoiding moral hazard among debtors contributes significantly towards enhancing financial stability, we will refrain from adopting legislative initiatives (for instance, proposals for the personal insolvency law and for the debt collecting law) or amending Ordinance 50/2010, which would undermine credit discipline.
Structural Reforms
Regulatory and Strategic Reforms in Transport and Energy
19. Comprehensive reform of the energy and transport sectors is a critical element of the program to boost investment and growth. In the transport sector, we have merged the subsidiaries of the railway companies CFR Marfa (freight) and CFR Calatori (passengers) into their parent companies and we will complete the merger of CFR Infrastructura (rail infrastructure) subsidiaries by mid-September 2012. We will bring down the total railway network under management of CFR Infrastructura to 15,500 line kilometers by end-September.
20. We have granted a bridge loan to clear CFR Infrastructura arrears to energy providers and will eliminate penalties and principal on arrears owed to the state-owned electricity supply company, Electrica, by mid-September. This bridge loan will be replaced in part by a government-guaranteed loan to the rail infrastructure company by end-November 2012. As a condition for this arrears clearance scheme, CFR Infrastructura has begun executing cost reduction and revenue enhancement measures to move towards financial viability from 2013. This requires that decisive action is taken to ensure that the state-owned passenger and freight companies pay access charges in full to the infrastructure company. To facilitate full payment, we intend to revaluate the provision of subsidies and the public service obligations (PSO) of the passenger company, and take profitable services out of the PSO starting in 2013. In addition, further measures will be taken to reduce the costs and increase the revenues of the rail passenger company.
21. For the energy sector, we have taken a number of actions to establish a framework to improve the sector’s efficiency. Electricity and gas legislation, in line with EU energy directives, was promulgated and gazetted. We expect the law on the energy regulator (ANRE) to be promulgated by end-September 2012. We also approved a roadmap to deregulate gas prices that envisages complete liberalization of gas prices for non-residential consumers by January 1, 2015, and for households by October 1, 2018. This follows earlier approval of a roadmap to deregulate electricity prices. Regulated electricity prices were also increased by five percent at end-June (structural benchmark).
22. We took the extraordinary step of placing the hydro-electric power producer, Hidroelectrica, into insolvency in June, in view of its deteriorating financial position. The judicial administrator has cancelled all contracts at below-market prices with the energy traders (so called “smart guys”). Hidroelectrica will sell the electricity being released from

68
the cancelled all contracts on the electricity trading platform (OPCOM). In addition, the administrator is pursuing cost savings throughout the company, with a target to reduce costs by at least 10 percent. These measures will result in a significant improvement in Hidroelectrica’s financial position. The results of the renegotiated contracts will be published (price, volume, and maturity reductions).
23. We plan to further enhance the pricing and regulatory framework in the energy sector by undertaking the following additional steps:
We will publish the full versions of the electricity and gas price-liberalization roadmaps by mid-September on the websites of all relevant institutions and start phasing out regulated electricity and gas prices in September and December 2012, respectively. We will provide quarterly progress reports on the implementation of both the gas and electricity roadmaps starting from October 1, 2012.
The pass-through mechanism for electricity and gas purchases by the supply companies provided for in the electricity and gas supply regulation will be applied in line with the regulatory framework, in order to strengthen investment in this sector. To better align the current regulated end-user prices of gas with the actual cost of supply and distribution, we will increase tariff rates for non-residential consumers by 10 percent and for households by five percent by September 15 (prior action). This alignment is necessary because, in recent years, ANRE has not been permitted to fully implement its regulations on gas supply and distribution, which generated a backlog in price adjustments.
We are taking steps to strengthen OPCOM as a trading platform. A working group of OPCOM and large electricity consumers has designed a new trading instrument tailored for the needs of large consumers. OPCOM will submit the new instrument for ANRE’s review and approval. OPCOM is also making progress, in consultation with the gas industry, on the design of a gas trading platform. OPCOM plans to launch the gas platform on December 1, 2012, in a testing/participant training mode and start commercial operation in March 2013. All new bilateral contracts of SOEs will be made transparently and non-discriminatorily through OPCOM (electricity) and other competitive procedures (gas), and the terms of the contracts will be published. As soon as the new gas trading platform is operational, all non-regulated bilateral gas contracts will be traded through it.
We have set-up an inter-ministerial committee, chaired by the MOPF, to prepare in consultation with the oil, gas, and electricity industry a draft package of tax, royalty and regulatory measures for these sectors. The package will cover two parts: (a) a levy to capture part of the extraordinary revenue to firms resulting from the liberalization of gas and electricity prices, as specified in the roadmaps. Funds raised will help finance measures to protect vulnerable consumers from the impact of the

69
necessary retail price adjustments; and (b) a new oil and gas regulatory and taxation regime for the period 2015–24, to be prepared, with professional advice, by end-2012. We plan to put in place the windfall levy from January 2013 and introduce the new oil and gas regulatory and taxation regime by mid-2013. In line with our obligations as a member of the EU, we are ready to begin negotiations on the Inter-Governmental Agreement (IGA) with Russia and will also strive to take steps to diversify our gas supply. We will take the necessary steps to lift the existing implicit export restrictions, and take measures to implement reverse flows on the gas interconnectors.
We will take steps to ensure prompt application of Emergency Ordinance 69/2011 on subsidies for district heating. Municipalities have allowed for some increase in end-consumer prices. We will continue to monitor, and report to the IMF, EC, and WB on a quarterly basis, the financial situation of the district heating system and ensure prompt application of the provisions of the emergency ordinance. We will also ensure that the district heating companies will report to the Ministry of Administration and Interior, which will issue a decision, together with the MOPF, within 30 days, Reimbursement will begin in the following month.
State-Owned Enterprises
24. The second quarter indicative targets on the operating balance and arrears in key companies were met. We note that achievement of the third quarter arrears target is dependent upon finding a buyer for Oltchim and achievement of the fourth quarter arrears target on finalization of the liquidation of C.N. Huilei. While we have achieved improvements in some companies over the last months, overall progress has been slower than anticipated and substantial measures remain to be taken. The specialized divisions of financial control within the MOPF has reviewed and approved most of the 2012 budgets for 117 SOEs under its purview and will complete the budget approval process by mid-September 2012. Ten of these companies are being liquidated. Moreover, the directorate has reviewed all but two of the restructuring plans. The directorate plans to meet with all the companies whose restructuring plans could not be quantified by mid-September 2012. We will monitor performance against those targets on a quarterly basis. We will also prepare and publish the comprehensive reports on SOEs required under Article 58 of ordinance (109/2011) by end-October 2012, and annually thereafter by end-May.
25. Our efforts to accelerate the SOE governance reform agenda by concentrating our efforts on the sale of shares in Transgaz, Romgaz, Hidroelectrica, and Nuclearelectrica (companies in the Ministry of Economy’s portfolio) have not yet yielded any tangible results (with the exception of the significant measures being taken by the insolvency administrators of Hidroelectrica). The planned secondary public offering (SPO) of government shares in Transgaz by end-June 2012 was delayed due to technical problems, but the tender will be launched by mid-September 2012 (prior action). We will miss the deadline for the sale of shares in Romgaz and Hidroelectica by mid-October 2012 (structural benchmark). The

70
transaction advisor for Romgaz recommended that a valuation of Romgaz’s natural gas holdings be completed before an initial public offering (IPO) is launched. We are in the process of hiring a consultant to conduct the study, which we expect to be completed by the end of the year. We are firmly committed to launch the IPO of Romgaz by end-March 2013. We plan to hold an IPO of 10 percent of the shares in Hidroelectrica after the company exits the insolvency process. We will expedite preparations for the sale of Nuclearelectrica shares but will miss the previously agreed deadline of end-2012 by one quarter. We will privatize Oltchim, a large chemical manufacturer, by offering it for sale by mid-September (prior action). The privatization of Tarom (SPO of 20 percent) and CFR Marfă (majority privatization) this year remains a priority for the Ministry of Transportation and Infrastructure.
26. As for other companies in the Ministry of Economy’s portfolio, we plan to sell a majority stake in Electrica Furnizare and Electrica’s three distribution companies by early 2013, followed by an IPO of Electrica by mid-2013. Other companies slated for privatization offerings by early 2013 are: (i) the new energy producer Hunedoara, to be created by end-September 2012 by merging the power plants in Paroşeni and Mintia and four mines of C.N. Huilei (majority privatization); and (ii) the new energy producer Oltenia (majority privatization). The privatization of Oltenia Energy Complex is critical given its large investment needs and key role in Romania’s energy security. With this mind, we will sign a contract with a legal and transaction advisor for the privatization of Oltenia by end-November 2012 (structural benchmark). We may pursue dual listings for some public offerings but will ensure that this does not lead to unnecessary delays in the privatization process. In addition, we will liquidate non-viable companies and plan to file for liquidation of C.N. Huilei by end- September 2012 and Termoelectrica by early October 2012.
27. We are in the process to appoint professional boards and management for key SOEs that remain under majority government ownership as required under the new SOE corporate governance law. New management teams and board members were to be selected by end-June 2012 for Oltchim, Hidroelectrica, and Electrica Furnizare. We now plan to appoint professional boards for Electrica Furnizare by end-August and Hidroelectrica by mid-September 2012. The appointment of a general manager for Electrica Furnizare will take place by end-September. For Hidroelectrica, the appointment of a general manager will take place promptly after the company exits the insolvency process. Given the difficult operating and financial position of Oltchim, we have appointed a special administrator in July to prepare the company for full privatization. We also plan to appoint a professional board and general manager for Oltenia with help from a independent human resource firm by end-September 2012.
28. Going forward, we will accelerate implementation of the SOE corporate governance law. We will only select professional board members and management from lists of qualified candidates prepared by independent firms hired to assist in the process. We recognize that doing otherwise would undermine the credibility of our reform program for the public and

71
for prospective investors. We intend to improve the law through modifications that establish a limited negative list of three companies exempted from the law on defense, public order, and national security grounds. The modifications will also require SOEs to implement the provisions to appoint professional boards and general managers and complete this process within a maximum period of nine months. Moreover, the modifications will specify that the appointment of interim boards and general managers will be only for a limited time period.
29. We have launched a coordinated process to search and appoint professional board members and general managers for the other priority SOEs in the Ministry of Economy’s portfolio, including Romgaz, Nuclearelectrica, and Transgaz. We now plan to complete this process for Romgaz, Nuclearelectrica, and Transgaz by end-2012. All appointments will be published for full transparency. For SOEs under the Ministry of Transportation and Infrastructure, we have hired a human resource firm to select qualified candidates for the boards of directors and managements of eleven firms in its portfolio, including CFR Calatori and CFR Infrastructura. We will appoint the new boards of directors and professional management by end-September 2012.
Other Structural Reforms
30. We continue to make progress in implementing new labor market and social assistance legislation. The new Labor Code has significantly improved the functioning of the labor market, and already contributed to a recovery in employment with substantial number of informal work arrangements being converted to newly registered contracts. Nearly one third of these new contracts are fixed term. We will monitor implementation of the Social Dialogue Law and ensure that any amendments will only be undertaken in consultation with all stakeholders and do not introduce undue rigidities and distortions in the collective bargaining process. We will also continue cooperation with the International Labor Organization (ILO) to ensure that the new legislation respects core ILO Conventions. The government, in consultation with its international partners, will prepare by October a package of measures aimed at job creation for people younger than 25 years and older than 55 years.
31. We will coordinate with all relevant stakeholders the speedy implementation of the forthcoming recommendations from the World Bank Report on Standards and Codes on insolvency and creditor rights.

72
2010Dec March June June Sept Dec
Actual Actual Actual Actual Actual Actual Prog. Prelim. Prog. Prog.
I. Quantitative Performance Criteria1. Floor on the change in net foreign assets (mln euros) 1/ 2/ 20,026 119 1896 292.8 -457 1696 -557 -457 -250 -8002. Floor on general government overall balance (mln lei) 3/ -33,621 -5,254 -11,260 -13,685 -23,837 -3,421 -7,770 -7631 -9,700 -14,6603. Ceiling on stock of central government and social security arrears (bn lei) 0.19 0.15 0.11 0.10 0.09 0.14 0.06 0.15 0.04 0.024. 7.6 8.1 6.0 5.8 6.5 7.0 14.0 7.7 14.0 14.0
II. Continuous Performance Criterion5. Nonaccumulation of external debt arrears 0 0 0 0 0 0 0 0 0 0
III. Inflation Consultation6. 12-month rate of inflation in consumer prices
Outer band (upper limit) … … … … … 4.4 5.9 5.6Inner band (upper limit) … … … … … 3.4 4.9 4.6Actual/Center point 8.0 8.0 7.9 3.5 3.1 2.4 2.4 2.0 3.9 3.6Inner band (lower limit) … … … … … 1.4 2.9 2.6Outer band (lower limit) … … … … … 0.4 1.9 1.6
IV. Indicative Target7. Ceiling on general government current primary spending (excl. EU funds and social assistance, mln lei) 131,938 30,670 62,578 94,133 128,317 30,921 64,800 63,968 99,000 133,7008. Floor on operating balance (earnings before interest and tax, net of subsidies) of key SOEs. 4/
(as defined in TMU (bn. lei)) -6.8 -0.7 -1.8 -2.4 -2.0 -0.4 -2.2 1.4 -2.7 -3.29. Ceiling on stock of arrears of key SOEs (as defined in TMU (bn lei)) 17.9 19.2 19.7 18.5 14.9 16.2 15.0 13.6 12.5 9.010. Ceiling on stock of local government arrears (bn lei) 0.91 0.82 0.81 0.82 0.75 0.82 0.50 1.17 0.75 0.3011. Ceiling on the execution of the PNDI program (mln lei) 4/ … … … … … 66 400 67 700 1,000
1/ The end-December 2010 figure is a stock.2/
3/
4/ Cumulative figure during calendar year (e.g. March 2012 figure is cumulative from January 1, 2012).
Table 1. Romania: Quantitative Program Targets
Ceiling on general government guarantees issued since end-2008 (face value, bn lei)
2011 2012June Sept Dec March
The June 2012 target is adjusted downward by 817 million Euros to reflect less than projected Eurobond placement of the MoPF, and the target is adjusted upward by 10 million Euros to reflect higher than projected commercial bank reserve requirement held with the NBR.Cumulative figure during calendar year (e.g. March 2011 figure is cumulative from January 1, 2011). March 2012 target is adjusted by RON 1,450 million to RON 4,550 for capital spending. June 2012 target is adjusted by RON 769.8 million to 7769.8 million for the loan to CFR Infrastructura.

73
Measure Target Date Comment
Prior action1.
2. Increase gas prices for non-residential consumers by 10 percent and for households by 5 percent.3. Launch the tender for a secondary public offering of 15 percent of Transgaz shares.4. Launch the tender for the majority privatization of Oltchim.
Quantitative performance criteria1. Floor on net foreign assets September 30, 20122. Floor on general government overall balance September 30, 20123. Ceiling on central government and social security domestic arrears September 30, 20124. Ceiling on general government guarantees September 30, 20125. Non-accumulation of external debt arrears September 30, 2012
Quantitative Indicative Target1. Ceiling on general government current primary spending September 30, 20122. Floor on operating balance of key SOEs September 30, 20123. Ceiling on stock of arrears of key SOEs September 30, 20124. Ceiling on stock of local government arrears September 30, 20125. Ceiling on the execution of the PNDI program September 30, 2012
Inflation consultation bandInner band September 30, 2012Outer band September 30, 2012
Structural benchmarks1. Prepare comprehensive amendments to the health care legislation to address the persistent budgetary shortfalls and to ensure high
quality health care services.June 30, 2012 Met
2. Launch tender for providing software to integrate the accounting reporting system with the Treasury payment system. June 30, 2012 Met3. Increase by 5 percent the electricity price for both residential and nonresidential consumers. June 30, 2012 Met4. Hold IPOs of government shares in Romgaz and Hidroelectrica. October 15, 2012 Reset to March 15, 2013
New structural benchmarks1. Update the investment database to identify priority local government projects funded through budgetary and EU funds, and publish
a list of low priority projects which will be discontinued.September 30, 2012
2. Publish up-to-date financial statements of all public hospitals on a webpage of the Ministry of Health. October 31, 20123. Sign a contract with legal and transaction advisor for the majority privatization of Oltenia. November 30, 20124. Finalize a detailed definition of the structural architecture of the accounting and treasury reporting system. December 31, 2012
Table 2. Romania: Performance for Sixth Review
Approve government ordinance to allow that: (i) resources available to local governments, currently limited to co-financing investment, can be used for paying arrears; and (ii) the central government can directly pay off arrears of local governments from shared taxes.

74
Attachment II. Romania: Technical Memorandum of Understanding
September 12, 2012 1. This Technical Memorandum of Understanding (TMU) defines the variables included in the quantitative performance criteria and indicative targets set out in the Memorandum of Economic and Financial Policies (MEFP), the key assumptions, the methods to be applied in assessing program performance, and the reporting requirements to ensure adequate monitoring of economic and financial developments. The quantitative performance criteria and indicative targets, and structural benchmarks for 2011 and 2012 are listed in Tables 1 and 2 of the MEFP, respectively.
2. For the purposes of the program, the exchange rates of the Romanian Leu (RON) to the euro is set at RON 4.2848 = €1, to the U.S. dollar at RON 3.2045 = $1, to the Japanese yen at RON 3.9400 = ¥100, and to the pound sterling at RON 4.9673 = £1, the rates as shown on the National Bank of Romania’s (NBR’s) website as of December 31, 2010. The exchange rates to other currencies, where applicable, will also be the ones shown on the NBR’s website as of December 31, 2010.
3. For the purposes of the program, the general government includes the entities as defined in the 2012 budget. These are: the central government (state budget, treasury, self-financed state entities included in the budget, etc.), local governments, social security funds (pension, health, and unemployment), and the road fund company. This definition of general government also includes any new funds, or other special budgetary and extra budgetary programs that may be created during the program period to carry out operation of a fiscal nature as defined in the IMF’s Manual on Government Finance Statistics 2001. The authorities will inform the IMF staff of the creation of any such new funds or programs immediately. As mentioned in ¶12 below, this definition will be expanded to cover state-owned enterprises incorporated into the general government accounts under ESA95, upon completion of the review being undertaken by Eurostat and successful implementation of the monitoring system being undertaken by the Ministry of Public Finance (MOPF).

75
Quantitative Performance Criteria, Indicative Targets, Inflation Consultation Band, and Continuous Performance Criteria
A. Floor on the Change in Net Foreign Assets
1. For program purposes, Net Foreign Assets (NFA) are defined as the NFA of the NBR minus Treasury liabilities to the International Monetary Fund.
2. NFA of the NBR are defined as the euro value of gross foreign assets of the NBR (including reserve requirements of the commercial banking system held at the NBR) minus gross foreign liabilities of the NBR; and will be measured on the basis of the NBR’s operational rather than accounting definitions. Non-euro denominated foreign assets and liabilities will be converted into euro at the program exchange rates.
3. Gross foreign assets of the NBR are defined to include the NBR’s holdings of SDRs, the country's reserve position at the IMF, holdings of cash, securities and deposits abroad in convertible foreign currencies. Excluded from reserve assets are: (i) gold and other precious metals; (ii) assets in nonconvertible currencies; (iii) illiquid assets; (iv) any assets that are pledged, collateralized, or otherwise encumbered, unless there is also a gross foreign liability associated with it; (v) claims on residents; and (vi) claims in foreign exchange arising from derivatives in foreign currencies vis-à-vis domestic currency (such as futures, forwards, swaps, and options).
4. Gross foreign liabilities of the NBR are defined as all foreign exchange liabilities to residents and nonresidents, including commitments to sell foreign exchange arising from derivatives (such as futures, forwards, swaps, and options), and all credit outstanding from the IMF, but excluding (i) banks’ foreign currency deposits against reserve requirements; and (ii) government foreign currency deposits at the NBR. This definition is meant to bring the concept of foreign liabilities closer to the balance of payment definition, on which the targets are based.
Floor on Cumulative Change in NFA from the Beginning of 2011 and 2012 (in mln. euros)1
2010 2011 2012 Dec. Mar. Jun. Sep. Dec. Dec. Mar. Jun. Sep. Dec. stock actual actual actual actual Stock actual actual PC PC
Cumulative change in NFA
20,026 1192 1,896 293 -4573 19,569 1,6964 -4575 -250 -800
Memorandum Item: Gross
Foreign Assets
32,432 996 2,793 1206 464 32,897 1,662 -496 -850 -2300
1PC = performance criterion; data for end-month. Flows are cumulative from the beginning of the same calendar year (e.g., March 2012 figure is cumulative from January 1, 2012). Current year stocks are obtained by adding the flows to the previous end-year stock. 2 PC met with an adjustment for the WB disbursement of €300 million. 3 PC met with an adjustment for the Eurobond issue of €1000 million. 4 PC met with an upward adjustment by €533 million due to the more than projected Eurobond issue of MoPF. 5 PC met with a downward adjustment by €817 million due to lower than projected Eurobond issue of MoPF and an upward adjustment by €10 million due to higher than projected commercial bank reserve requirements held with the NBR.
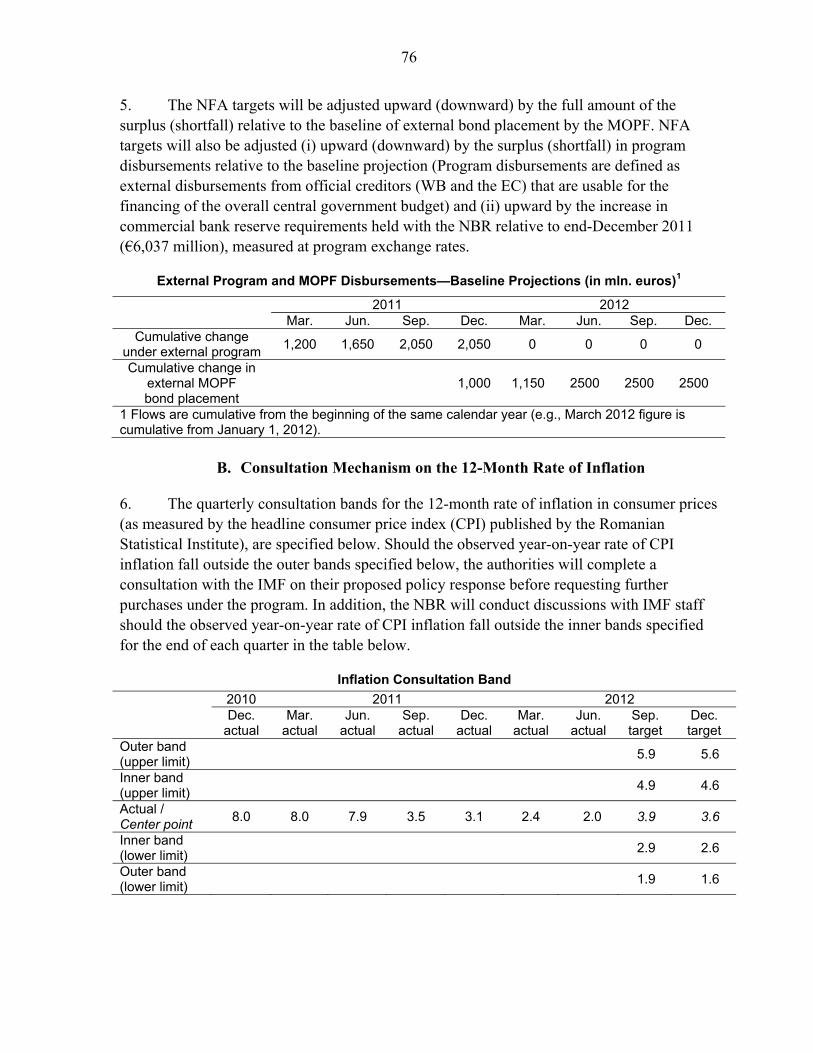
76
5. The NFA targets will be adjusted upward (downward) by the full amount of the surplus (shortfall) relative to the baseline of external bond placement by the MOPF. NFA targets will also be adjusted (i) upward (downward) by the surplus (shortfall) in program disbursements relative to the baseline projection (Program disbursements are defined as external disbursements from official creditors (WB and the EC) that are usable for the financing of the overall central government budget) and (ii) upward by the increase in commercial bank reserve requirements held with the NBR relative to end-December 2011 (€6,037 million), measured at program exchange rates.
External Program and MOPF Disbursements—Baseline Projections (in mln. euros)1
2011 2012 Mar. Jun. Sep. Dec. Mar. Jun. Sep. Dec.
Cumulative change under external program
1,200 1,650 2,050 2,050 0 0 0 0
Cumulative change in external MOPF bond placement
1,000 1,150 2500 2500 2500
1 Flows are cumulative from the beginning of the same calendar year (e.g., March 2012 figure is cumulative from January 1, 2012).
B. Consultation Mechanism on the 12-Month Rate of Inflation
6. The quarterly consultation bands for the 12-month rate of inflation in consumer prices (as measured by the headline consumer price index (CPI) published by the Romanian Statistical Institute), are specified below. Should the observed year-on-year rate of CPI inflation fall outside the outer bands specified below, the authorities will complete a consultation with the IMF on their proposed policy response before requesting further purchases under the program. In addition, the NBR will conduct discussions with IMF staff should the observed year-on-year rate of CPI inflation fall outside the inner bands specified for the end of each quarter in the table below.
Inflation Consultation Band
2010 2011 2012 Dec. Mar. Jun. Sep. Dec. Mar. Jun. Sep. Dec. actual actual actual actual actual actual actual target target
Outer band (upper limit)
5.9 5.6
Inner band (upper limit)
4.9 4.6
Actual / Center point
8.0 8.0 7.9 3.5 3.1 2.4 2.0 3.9 3.6
Inner band (lower limit)
2.9 2.6
Outer band (lower limit)
1.9 1.6

77
C. Performance Criterion on General Government Balance
7. The budget deficit will be monitored quarterly through the cash balance of the general government in GFS 1986 classification. The authorities will consult with IMF staff on corrective measures in the event of shortfalls in government revenue and financing.
8. Starting from end-March 2012 performance criterion, the budget deficit will be measured from above the line using the budget execution data. Expenditure will include the value of the works executed under the contracts from the National Program for Infrastructure Development (PNDI).
9. Once the reporting system for state-owned enterprises (SOEs) is fully functional, the budget deficit target will be modified to be in line with the expanded definition of the general government, which will include the following SOEs: C.N. de Autostrãzi si Drumuri Nationale din România SA, Metrorex SA, Administratia Fluviala Dunarea de Jos, CFR Calatori, CN Huila Petrosani SA, SN a Carbunelui Ploiesti SA, CN Radiocomunicatii Constanta, SC Interventii Feroviare, CFR Infrastructura, SC Termoelectrica SA, Societatea Nationala Aeroportul International Mihail Kogalniceanu, SC Electrificare SA, CN Administratia Canalelor Navigabile Constanţa SA , SC CN Romarm, Santierul Naval Mangalia SA, Societatea Feroviara de Turism SFT CFR, SC Uzina Mecanica Orastie, SC Avioane Craiova SA, SC Petromin SA, SC Constructii Aeronautice SA, SC Sanevit 2003 SA, SC Uzina AutoMecanica SA Moreni, SC Terom SA, SN Plafar SA, and SC Nicolina SA.
10. The Ministry of Public Finance (MOPF) will also provide monthly data to measure the deficit from below the line. The balance of the general government measured from below the line will include:
+ (i) net external financing, excluding valuation gains and losses; + (ii) change in net domestic credit from the financial system, excluding valuation gains and losses from deposits denominated in foreign currency and including adjustments for;
Cumulative Floor on General Government Balance1 (In millions of lei)
End-December 2010 (actual) -33,621 End-March 2011 (actual) -5,254 End-June 2011 (actual) -11,260 End-September 2011 (actual) -13,685 End-December 2011 (actual) -23,837 End-March 2012 (actual)2 -3,421 End-June 2012 (actual)3 -7,631 End-September 2012 (performance criterion) -9,700 End-December 2012 (performance criterion) -14,660 1 Cumulative figure during calendar year (e.g., March 2012 figure is cumulative from January 1, 2012). 2 Target for 2012:Q1 is adjusted by RON 1450 million to RON 4550 for capital spending. 3 Target for 2012:Q2 is adjusted by RON 769.8 for the the bridge loan granted by the Ministry of Finance to CN Cai Ferate CFR SA.

78
+ (a) received EU funds not yet spent (advance payments); + (b) claims of the government on EU funds; + (c) property fund obligations not yet paid; + (iii) change in the stock of issued government securities, net of valuation changes; + (iv) net changes in other financing; of which: (a) temporary financing for EU projects; (b) reimbursement payments from EU for the EU projects 11. If the difference between the general government deficit measured from above the line and from below the line is larger than lei 200 million each quarter during 2011 and 2012, the MOPF will consult with IMF staff.
12. The performance criterion for the general government balance for end-June 2012 and end-September 2012 (measured on a cumulative basis from the beginning of the year) will be adjusted downward by the amount that capital spending (including spending related to EU funds and arrears reduction plans, but excluding the works executed under the contracts from the PNDI) exceeds lei 15,230 million and lei 25,150 million, respectively, up to a limit of lei 1,800 million and lei 700 million, respectively. The performance criterion for the general government balance for end-June 2012 and end-September (measured on a cumulative basis from the beginning of the year) will be adjusted downward by the amount of a bridge bank loan for arrears clearance of CFR Infrastructura, up to a limit of lei 900 million.
D. Performance Criterion Limiting the Issuance of Government Guarantees to the Non-Financial Private Sector and Public Enterprises
13. The issuance of general government guarantees to the nonfinancial private sector and public enterprises will be limited during the program period. This ceiling is set at RON 14 billion but may be adjusted upward by up to RON 9.6 billion for guarantees for financing the Nabucco project. Revision to targets will be renegotiated during future missions to allow for reasonable public guarantees in the context of privatization of majority stakes in state-owned enterprises and securitization of domestic payment arrears.
Ceiling on New General Government Guarantees Issued from end 2008 Until:
(In billions of lei)
End-December 2010 (actual) 7.6 End-March 2011 (actual) 8.1 End-June 2011 (actual) 6.0 End-September 2011 (actual) 5.8 End-December 2011 (actual) 6.5 End-March 2012 (actual ) 7.0 End-June 2012 (actual) 7.7 End-September 2012 (performance criterion) 14.0 End-December 2012 (performance criterion) 14.0

79
E. Performance Criterion on the Stock of Domestic Arrears by the Central Government and Social Security System
14. The performance criterion established on the stock in domestic payments arrears of the central government and social security sector (as defined in ¶3 above) contemplates their elimination during the program period. The stock will be measured net of intergovernmental arrears, but both gross and net arrears will be reported by the government. In case of need, the government will take corrective measures to prevent the accumulation of new spending arrears. For the purpose of the program, arrears mean accounts payable past due date by 90 days (in line with ESA95 definitions for expenditures).
Stock of Central Government and Social Security Arrears
(In billions of lei)
End-December 2010 (actual) 0.19
End-March 2011 (actual) 0.15
End-June 2011 (actual) 0.11
End-September 2011 (actual) 0.10
End-December 2011 (actual) 0.09
End-March 2012 (actual) 0.14
End-June 2012 (actual) 0.15
End-September 2012 (performance criterion) 0.04
End-December 2012 (performance criterion) 0.02
F. Continuous Performance Criteria on Non-Accumulation of External Payments
Arrears by the General Government
15. The general government will not accumulate external payment arrears during the program period. For the purposes of this performance criterion, an external payment arrear will be defined as a payment by the general government that has not been made within seven days of falling due. The performance criterion will apply on a continuous basis.
G. Indicative Target on General Government Current Primary Spending
16. The indicative target on current primary expenditure of the general government is defined as spending on personnel, goods and services excluding EU funds (specified under external grant category), subsidies, transfers to public entities, pensions (social security budget in social assistance category), state aid and other spending in other transfers category, Reserve Fund, and other expenditure as classified in the monthly reporting tables. Actual data (to which the target will be compared) should include payments related to arrears reduction plans.

80
Cumulative Change in General Government Current Primary Expenditures1
(In millions of lei)
End-December 2010 (actual) 131,938 End-March 2011 (actual) 30,670 End-June 2011 (actual) 62,578 End-September 2011 (actual) 94,133 End-December 2011 (actual) 128,317 End-March 2012 (actual) 30,921 End-June 2012 (actual) 63,968 End-September 2012 (indicative) 99,000 End-December 2012 (indicative) 133,700
1 Cumulative figure during calendar year (e.g., March 2012 figure is cumulative from January 1, 2012).
H. Indicative Target on the Execution of the PNDI Program
17. An indicative target on the ceiling is set for the execution of the PNDI program.
Ceiling for the Execution of the PNDI Program1
(In million of lei)
End-March 2012 (actual) 66.1 End-June 2012 (actual) 67.45 End-September 2012 ( indicative ) 700 End-December 2012 ( indicative ) 1,000 1 Cumulative figure during calendar year (e.g., March 2012 figure is cumulative from January 1, 2012).
I. Indicative Target on Local Government Arrears
18. The indicative target on the stock of domestic payments arrears of local governments contemplates no accumulation of new arrears and their reduction during the program period. In case of need, the government will take corrective measures to prevent the accumulation of new spending arrears. For the purpose of the program, arrears mean accounts payable past the due date by 90 days (in line with ESA95 definitions for expenditures).
Stock in Local Government Arrears (In billions of lei)
End-December 2010 (actual) 0.91 End-March 2011 (actual) 0.82 End-June 2011 (actual) 0.81 End-September 2011 (actual) 0.82 End-December 2011 (actual) 0.75 End-March 2012 (actual) 0.81 End-June 2012 (actual) 1.17 End-September 2012 (indicative) 0.75 End-December 2012 (indicative) 0.30
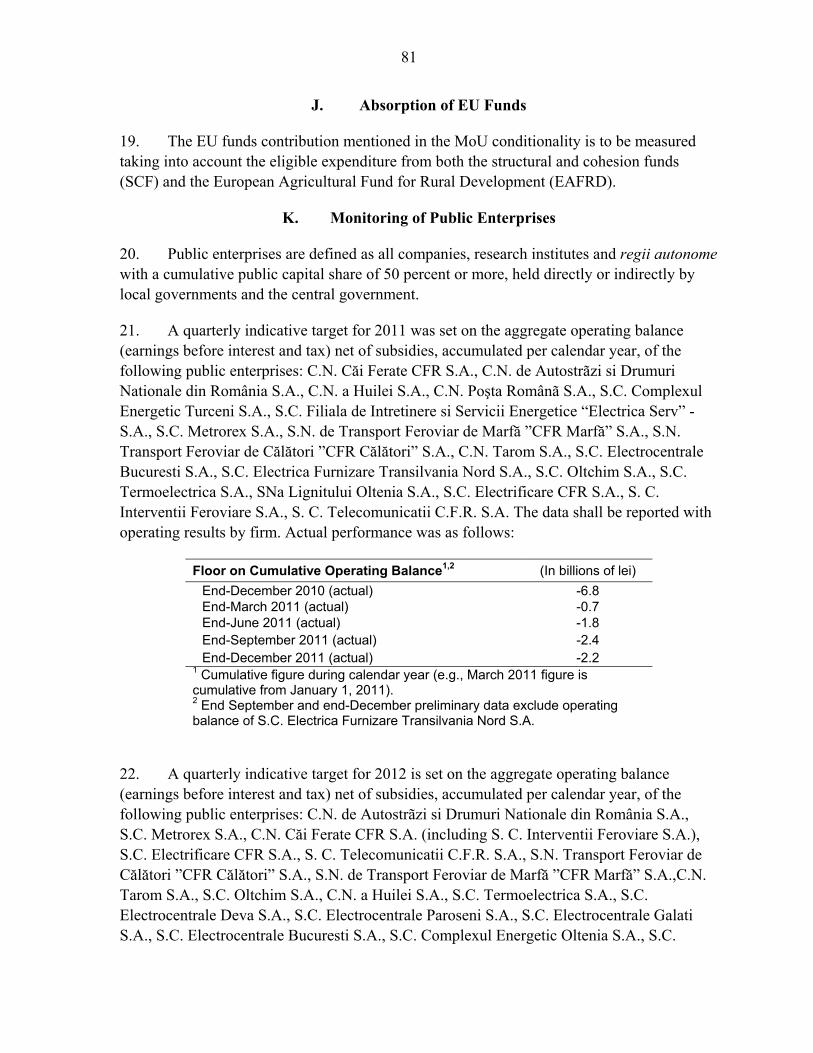
81
J. Absorption of EU Funds
19. The EU funds contribution mentioned in the MoU conditionality is to be measured taking into account the eligible expenditure from both the structural and cohesion funds (SCF) and the European Agricultural Fund for Rural Development (EAFRD).
K. Monitoring of Public Enterprises
20. Public enterprises are defined as all companies, research institutes and regii autonome with a cumulative public capital share of 50 percent or more, held directly or indirectly by local governments and the central government.
21. A quarterly indicative target for 2011 was set on the aggregate operating balance (earnings before interest and tax) net of subsidies, accumulated per calendar year, of the following public enterprises: C.N. Căi Ferate CFR S.A., C.N. de Autostrãzi si Drumuri Nationale din România S.A., C.N. a Huilei S.A., C.N. Poşta Românã S.A., S.C. Complexul Energetic Turceni S.A., S.C. Filiala de Intretinere si Servicii Energetice “Electrica Serv” - S.A., S.C. Metrorex S.A., S.N. de Transport Feroviar de Marfă ”CFR Marfă” S.A., S.N. Transport Feroviar de Călători ”CFR Călători” S.A., C.N. Tarom S.A., S.C. Electrocentrale Bucuresti S.A., S.C. Electrica Furnizare Transilvania Nord S.A., S.C. Oltchim S.A., S.C. Termoelectrica S.A., SNa Lignitului Oltenia S.A., S.C. Electrificare CFR S.A., S. C. Interventii Feroviare S.A., S. C. Telecomunicatii C.F.R. S.A. The data shall be reported with operating results by firm. Actual performance was as follows:
Floor on Cumulative Operating Balance1,2 (In billions of lei)
End-December 2010 (actual) -6.8 End-March 2011 (actual) -0.7 End-June 2011 (actual) -1.8 End-September 2011 (actual) -2.4 End-December 2011 (actual) -2.2
1 Cumulative figure during calendar year (e.g., March 2011 figure is cumulative from January 1, 2011). 2 End September and end-December preliminary data exclude operating balance of S.C. Electrica Furnizare Transilvania Nord S.A.
22. A quarterly indicative target for 2012 is set on the aggregate operating balance (earnings before interest and tax) net of subsidies, accumulated per calendar year, of the following public enterprises: C.N. de Autostrãzi si Drumuri Nationale din România S.A., S.C. Metrorex S.A., C.N. Căi Ferate CFR S.A. (including S. C. Interventii Feroviare S.A.), S.C. Electrificare CFR S.A., S. C. Telecomunicatii C.F.R. S.A., S.N. Transport Feroviar de Călători ”CFR Călători” S.A., S.N. de Transport Feroviar de Marfă ”CFR Marfă” S.A.,C.N. Tarom S.A., S.C. Oltchim S.A., C.N. a Huilei S.A., S.C. Termoelectrica S.A., S.C. Electrocentrale Deva S.A., S.C. Electrocentrale Paroseni S.A., S.C. Electrocentrale Galati S.A., S.C. Electrocentrale Bucuresti S.A., S.C. Complexul Energetic Oltenia S.A., S.C.

82
Hidroelectrica, S.C. Electrica S.A., C.N. Poşta Românã S.A. The data shall be reported with operating results by firm. The targets will be as follows:
Floor on Cumulative Operating Balance1 (In billions of lei)
End-March 2012 (preliminary) -0.4 End-June 2012 (preliminary) -1.4 End-September 2012 (indicative) -2.7 End-December 2012 (indicative) -3.2
1 Cumulative figure during calendar year (e.g., March 2012 figure is cumulative from January 1, 2012).
23. In case one of these firms is liquidated, or its majority share is privatized or merged with a company not listed above, the aggregate target listed above will be adjusted by the original operating balance target for this firm. If any of the companies listed above is split into a new company, both companies will remain under monitoring. If some of the above companies are merged, the newly created companies will remain under monitoring.
24. A quarterly indicative target for 2011 was set on the stock of arrears of the public enterprises listed in ¶23. The data shall be reported at the firm level. Actual performance was as follows:
Ceiling on Stock of Arrears1 (In billions of lei)
End-December 2010 (actual) 17.9 End-March 2011 (actual) 19.2
End-June 2011 (actual) 19.7
End-September 2011 (actual) 18.5
End-December 2011 (actual) 14.8 1 End September and end-December preliminary data exclude arrears of S.C. Electrica Furnizare Transilvania Nord S.A.
25. A quarterly indicative target for 2012 is set on the stock of arrears of the public enterprises listed in ¶24. The data shall be reported at the firm level. The targets will be as follows:
Ceiling on Stock of Arrears (In billions of lei)
End-March 2012 (preliminary) 16.2
End-June 2012 (preliminary) 13.6 End-September 2012 (indicative) 12.5 End-December 2012 (indicative) 9.0
26. In case one of these firms is liquidated, its majority share is privatized or is merged with a company not listed above, the aggregate target listed above will be adjusted by the original arrears target for this firm. If any of the companies listed above is split into a new company, both companies will remain under monitoring. If some of the above companies are merged, the newly created companies will remain under monitoring.

83
L. Private Management for Key SOEs
27. Private management will be selected, in line with MEFP ¶27 and ¶28, at least for the following state-owned enterprises: i) S.N. Nuclearelectrica ii) C.N. Căi Ferate CFR S.A. (including S. C. Interventii Feroviare S.A.), iii) S.C. Complexul Energetic Oltenia S.A., iv) S.C. Electrica Furnizare S.A., v) S.C. Hidroelectrica, (vi) S.N. Romgaz, (vii) S.N. Transport Feroviar de Călători “CFR Călători” S.A., and (viii) S.N. Transgaz.
28. In addition, private management is envisaged in the course of 2012 for the following additional companies: i) C.N. Autostrazi si Drumui Nationale din Romania S.A. ii) C.N. Telecomunicatii CFR S.A., (iii) S.C. Electrificare CFR S.A. (iv) C.N. Tarom S.A. (v) S.C. Transport cu Metroul Bucuresti S.A. “Metrorex” and (vi) S.N. de Transport Feroviar de Marfă ”CFR Marfă” S.A..
M. Reporting Requirements for the Prior Actions
29. For the prior action related to Transgaz, the launching of the tender will involve depositing of the public tender documents with the securities commission (CNVM) and the stock exchange. For the prior action related to Oltchim, the launching of the tender will involve publication of the prospectus (Request for Bidders).
N. Reporting Requirements
30. Performance under the program will be monitored from data supplied to the IMF and EC by the NBR and the MOPF as outlined in the table below. The authorities will transmit promptly to IMF and EC staff any data revisions as well as other information necessary to monitor the arrangement with the IMF and EC.

84
Romania: Data Provision to the IMF and EC
Item Periodicity
To be provided by the Ministry of Finance
Preliminary monthly data on general government accounts, including public enterprises as defined by ESA95
Monthly, on the 25th day of the following month
Quarterly final data on project execution under the Program for National Infrastructure Development
Quarterly, on the 25th day past the test date
Quarterly final data on general government accounts, including public enterprises as defined by ESA95
Quarterly cash data, on the 35th day past the test date; Quarterly accrual data, on the 55th day past test date
The budget deficit of the general government using ESA95 definition
Quarterly, with a lag of three months
Preliminary data on below-the-line financing for the general government
Monthly, with a lag of no more than 35 days past the test date
Final quarterly data on below-the-line financing for the general government
Quarterly, no later than 45 days past the test date
Total accounts payable and arrears of the general government, including local governments
Preliminary monthly, within the next month. Quarterly, within 55 days
Stock of the central government external arrears
Daily, with a lag of not more than seven days
Public debt and new guarantees issued by the general government
Monthly, within one month
Preliminary monthly data on general government primary spending, net of EU disbursements
Preliminary monthly data within 25 days
Final quarterly data on general government primary spending, net of EU disbursements
Quarterly, within 35 days from the test date

85
Preliminary data on the operating balance, profits, stock of arrears, and personnel expenditures for each key public enterprise as defined in ¶22
Quarterly, within 30 days
Final data on the operating balance, profits, stock of arrears, and personnel expenditures for each key public enterprise as defined in ¶22
Quarterly, end May for the previous year and end-August for first half of the current year
Data on EU project grants (reimbursements and advances), capital expenditures and subsidies covered by EU advances or eligible for EU reimbursement on EU supported projects specifically agreed with the EU
Monthly, within three weeks of the end of each month
The balance of the TSA in RON Monthly, within two weeks of the end of
each month The balance of the two foreign currency accounts used for budget financing and public debt redemption purposes (average, and end-of-period)
Monthly, within two weeks of the end of each month
The balance of the privatization receipts registered in the account of the State Treasury, details on any claims on these receipts and projected net outflows.
Monthly, within two weeks of the end of each month
Reporting of progress in the implementation of the Romanian public administration's functional review
Quarterly, to be sent two weeks before each mission for each of the 12 ministries
To be provided by the National Bank of Romania
NFA data, by components, in both program and actual exchange rates
Weekly, each Monday succeeding the reporting week and with a 3 working day lag in the case of end-quarter data
Monetary survey data in the format agreed with IMF and EC staff
Monthly, within 30 days of the end of the month

86
The schedule of contractual external payments of the banking sector falling due in the next four quarters, interest and amortization (for medium and long-term loans)
Monthly, 45 days after the end of each month
The schedule of contractual external payments of the corporate sector falling due in the next four quarters interest and amortization (for medium and long-term loans)
Monthly, 45 days after the end of each month
The stock of short-term external debt of banks and corporate
Monthly, 45 days after the end of each month
Balance of payments in the IMF format currently used to report
Monthly, 45 days after the end of each month
Exposure (deposits, loans, subordinated loans) of (i) foreign parent banks to their subsidiaries in Romania; (ii) IFI and (iii) other creditors to banks in Romania (by national and foreign currency).
Monthly, 20 days after the end of each month
Financial soundness indicators1 Monthly, 45 days after the end of each month Foreign currency reserves including information on FX market interventions and swaps by the NBR
Bi-weekly
The IMF and the EC shall be immediately informed in case of sudden loss of reserves exceeding EUR 600 million, or if the stock of foreign exchange reserves falls below the floor of EUR 23 billion
Immediately, upon occurrence
1 Data on solvency should be provided on quarterly basis.

87
ANNEX Measures to Improve Performance of SOEs under Monitoring
Ministry of Transportation and Infrastructure
Appoint professional board members and management for CFR Infrastructura, CFR Marfă , CFR Călători, Tarom, and the roads company from short lists of qualified candidates selected by an independent human resource firm by end-September 2012.
C.N. Căi Ferate CFR S.A “CFR Infrastructura” (including S.C Interventii Feroviare).
Complete merger of Interventii Feroviare, S.C. Întretinere Mecanizată and S.C. Sere si Pepiniere into CN. Cai Ferate CFR by mid-September 2012;
Continue seeking and implementing cost reduction and revenue enhancement measures and prepare a report quantifying implemented measures by mid-October 2012;
Complete pilot project for calculating employees’ salaries by line section by mid-October 2012; and extend to rest of network by end-December 2012;
Sign contracts to rent 50 percent of identified rentable locations by end-October 2012;
Obtain, in conjunction with Ministry of Public Finance, a government-guaranteed loan to repay government bridge loan that was provided to clear arrears by-end November 2012;
Increase the tariff for storage of scrap wagons on CFR Infrastructura yards/lines by 5 percent per year by end-November 2012, with the tariff effective date of January 1, 2013;
Establish business plan with market analysis and substantiate revenue forecast that goes beyond mere forecast of train kilometers by end-December 2012; and
Identify sources of financing for contribution to construction works for the Ramnieu Valcea-Valcele railway line.
S.C. Electrificare CFR S.A.
Acquire all electricity via OPCOM when taking over supply and distribution activity for traction energy for the whole railway system;
Complete studies to increase energy efficiency in railway stations by end-October 2012.
S.C. Telecomunicatii C.F.R. S.A.
Elaborate legislation establishing the new framework for supplying telecommunication services within an integrated system by end-December 2012;
Publish at the Trade Registry the merger document between SC Telecomunicații CFR and CFR Insfrastructura by end-December 2012.

88
S.N. de Transport Feroviar de Marfă “CFR Marfă” S.A.
Approve privatization strategy document prepared by transaction consultant by end-September 2012;
Conclude the contract with the software provider for a new payroll module by end-November 2012;
Pre-qualify bidders for majority share of Marfa by mid-November 2012, with a view to signing the privatization agreement by mid-December 2012;
S.N. Transport Feroviar de Călători “CFR Călători” S.A.
Continue to identify savings of RON 300 million to balance the income and expenditure budget for 2012 by end-September 2012;
Seek partial extinction of debts to CFR Infrastructura by fair value transfer of some assets by mid-October 2012;
Reorganize SCRL Brasov SA and identify solutions for effective branch activity by end-November 2012;
Scrap and valorify 200 depreciated cars by end-December 2012.
S.C. Metrorex S.A.
Launch a tender at Bucharest stock exchange for the sale of scrapped rolling stock by end-September 2012;
C.N. de Autostrãzi si Drumuri Nationale din România “roads company” S.A.
Sign a contract to develop the software to improve the methods for selling road vignettes (via SMS and online) by end-September 2012;
Concession of the services and parking spaces on the sections of motorway completed according to Bucuresti-Cernavoda model by end-March 2013.
C.N. Tarom S.A.
Publish prospectus for privatization of at least a 20 percent stake via IPO by end-September 2012, with view to conclude privatization by mid-November 2012;
Reduce costs (e.g. by renegotiation of contracts, voluntary personnel reductions, discontinuation of selected lines and flights, renegotiation of lease-in contract for flying staff, extending the saving oil consumption program).
Ministry of Communication
C.N. Poşta Românã S.A.
Sign contract with legal and transaction advisor for capital increase by at least 20 percent by end-September 2012;
Finalize privatization strategy and elaborate all documentation required to select strategic investor by mid-October 2012;
Finalize capital increase by end-December 2012;

89
Appoint professional management and board members from short list of qualified candidates selected by an independent human resource firm after capital increase.
Ministry of Economy, Trade, and Business Environment
Transgaz
Launch the tender for a secondary public offering of 15 percent of government shares by mid-September 2012;
Appoint professional board members and management from short lists of qualified candidates selected by an independent human resource firm by end- December 2012.
S.N. Romgaz
Sign contract with consultant to value natural gas reserves holdings by end-September 2012;
Complete valuation of natural gas holdings by end-December 2012; Appoint professional board members and management from short lists of qualified
candidates selected by an independent human resource firm by end-December 2012; Publish prospectus for IPO by end-February 2013, with view to launch an IPO by
end-March 2013.
S.N. Nuclearelectrica
Sign a contract with a legal and transaction advisor for privatization by end-October 2012, otherwise republish a more flexible tender for an advisor;
Appoint professional board members and management from short lists of qualified candidates selected by an independent human resource firm by end-December 2012;
Publish prospectus for IPO by end-February 2013, with a view to conclude privatization by end-March 2013.
S.C. Oltchim S.A.
Publish prospectus for privatization by mid-August 2012, with view to designate a winning bidder by mid-September 2012; if the privatization fails the company will be put into voluntary liquidation;
Neither Oltchim nor the government will acquire the refinery in Arpechim prior to privatization.
C.N. a Huilei S.A
File for the merger of viable mines into new company as per law 143/2012 by end-September 2012, with a view to merge new company into S.C. Hunedoara S.A.;
File for liquidation of C.N. a Huilei S.A by end-September 2012.

90
S.C. Termoelectrica S.A., including S.C. Electrocentrale Paroseni S.A., S.C. Electrocentrale Deva S.A. and S.C. Electrocentrale Galati S.A.
Hold general shareholders meeting to approve liquidation of non-viable assets by end-August 2012;
Merge Electrocentrale Deva and Electrocentrale Paroseni to create S.C. Hunedoara S.A. by end-September 2012;
Separate Bralia and Galati operations, and shareholdings in energy companies and place into Electrocentrale Group by mid-October 2012;
File for Termoelectrica liquidation in mid-October 2012.
S.C. Hunedoara S.A. (to be created by merger of Electorcentrale Deva and Electrocentrale Parsoeni with four viable mines from C.N. a Huilei S.A)
Create S.C Hunedoara by merging Electrocentrale Deva and Electrocentrale Paroseni by end-September 2012;
Merge company created through merger of viable mines of C.N. a Huilei S.A into S. C. Hunedoara S.A. by end-January 2013;
Sign contract with legal and transaction advisor for majority privatization by end-April 2013
S.C. Electrocentrale Bucuresti S.A.
Agree with municipality of Bucharest on a strategy for clearing Radet Bucuresti’s arrears to Elcen Bucuresti by mid-October 2012;
Sign contract with legal and transaction advisor for majority privatization by end-November 2012, dependent on agreement with municipality of Bucharest (see above);
Publish prospectus for majority privatization of the company by early 2013, with view to conclude privatization shortly thereafter, dependent on agreement with municipality of Bucharest (see above).
S.C. Complexul Energetic Oltenia S.A.
Appoint professional board members and management from short lists of qualified candidates selected by an independent human resource firm by end-September 2012;
Sign contract with legal and transaction advisor for majority privatization (IPO of 15 percent of capital and sale of another 50 percent of government shares to a strategic investor) by end-November 2012;
Launch a tender for the IPO by early-2013, with the view to launch a tender for a strategic investor shortly thereafter.
S.C. Hidroelectrica S.A.
Sign contract with consultant to advise on privatization process by end-August 2012; Publish results of cancellation and/or renegotiation (price, quantity, and duration) of
bilateral contracts by mid-September 2012;

91
Sell electricity that becomes available from cancellation and/or renegotiation of bilateral contracts on OPCOM;
Appoint professional board members from short list of qualified candidates selected by an independent human resource firm by mid-September 2012;
Publish prospectus for privation within three months after Hidroelectrica exists insolvency procedure, with view to launch an IPO one month later.
S.C. Electrica S.A. including subsidiaries
Clear all arrears and penalties owed by CFR Infrastructura by mid-September 2012; Appoint professional board members and management for Electrica Furnizare from
short lists of qualified candidates selected by an independent human resource firm by end-September 2012;
Sign contract with a legal and transaction advisor for privatizations of the five regional service companies and Electra Serv by end-December 2012;
Launch a tender for the sale of the five regional service companies and Electra Serv strategic investors by early-2013;
Sign contract with a legal and transaction advisor for the majority sale of the three distribution companies and Electrica Furnizare by end-October 2012 with a view to concluding the privatization by end-2012/early-2013;
File for liquidation for all service companies for which privatization failed.

INTERNATIONAL MONETARY FUND
ROMANIA
Staff Report for the 2012 Article IV Consultation, Sixth Review Under the Stand-By
Arrangement, and Requests for Waiver of Nonobservance of Performance Criterion and
Modification of Performance Criteria—Informational Annex
Prepared by the European Department
September 13, 2012
Contents Page
I. Fund Relations ...............................................................................................................2
II. Relations with the World Bank ......................................................................................5
III. Statistical Issues .............................................................................................................9

2
ANNEX I. ROMANIA: FUND RELATIONS
As of July 31, 2012
I. Membership Status: Joined 12/15/72 Article VIII
II. General Resources Account: SDR million % Quota
Quota 1,030.20 100.00
Fund holdings of currency 11,599.2 1,125.92
Reserve Tranche Position 0.00 0.00
III. SDR Department: SDR million % Allocation
Net cumulative allocation 984.77 100.00
Holdings 242.39 24.61
IV. Outstanding Purchases and Loans: SDR Million % Quota
Stand-by Arrangements 10,569.00 1,025.92
V. Financial Arrangements:
Expira- Amount Amount
Approval tion Approved Drawn
Type Date Date (SDR million) (SDR million)
Stand-By 03/31/11 03/30/13 3,090.6 0.00
Stand-By 05/04/09 03/30/11 11,443.00 10,569.00
Stand-By 07/07/04 07/06/06 250.00 0.00
Stand-By 10/31/01 10/15/03 300.00 300.00
Stand-By 08/05/99 02/28/01 400.00 139.75
Stand-By 04/22/97 05/21/98 301.50 120.60
Stand-By 05/11/94 04/22/97 320.50 94.27
Stand-By 05/29/92 03/28/93 314.04 261.70
Stand-By 04/11/91 04/10/92 380.50 318.10
VI. Projected Payments to Fund (Expectations Basis)1
(SDR million; based on existing use of resources and present holdings of SDRs):
1 This schedule presents all currently scheduled payments to the IMF, including repayment expectations where
applicable and repayment obligations otherwise. The IMF Executive Board can extend repayment expectations (within
predetermined limits) upon request by the debtor country if its external payments position is not strong enough to meet
the expectations without undue hardship or risk.
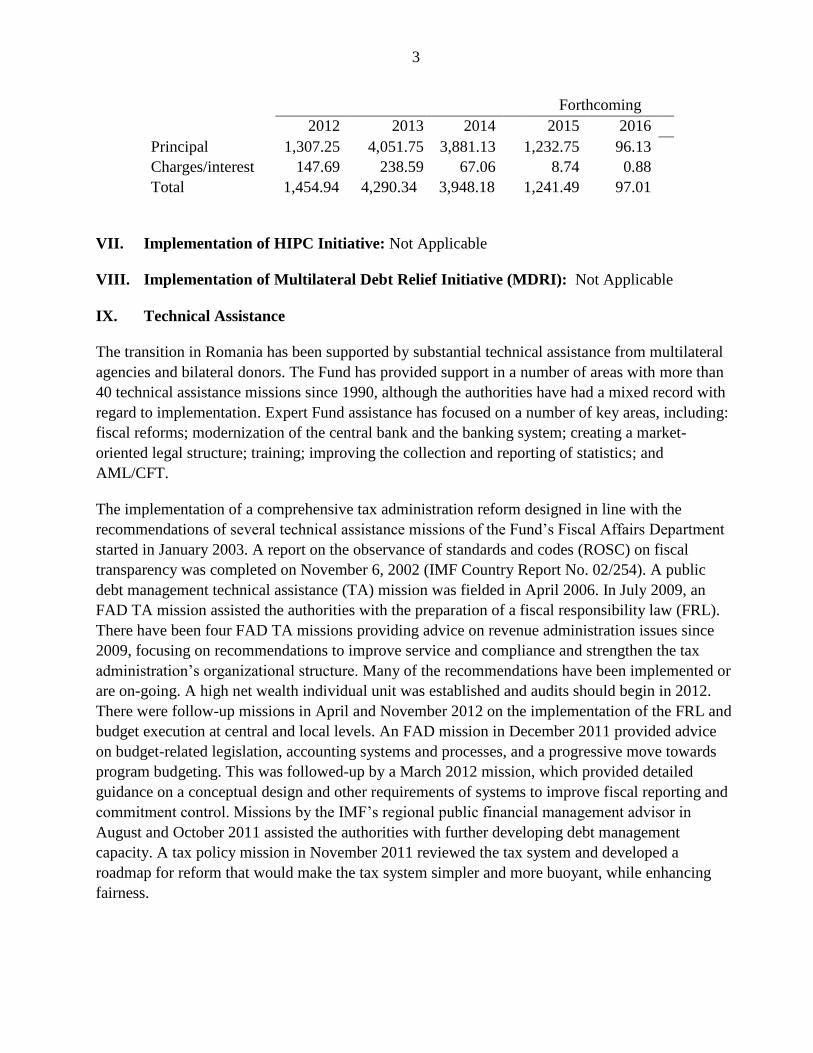
3
Forthcoming
2012 2013 2014 2015 2016
Principal 1,307.25 4,051.75 3,881.13 1,232.75 96.13
Charges/interest 147.69 238.59 67.06 8.74 0.88
Total 1,454.94 4,290.34 3,948.18 1,241.49 97.01
VII. Implementation of HIPC Initiative: Not Applicable
VIII. Implementation of Multilateral Debt Relief Initiative (MDRI): Not Applicable
IX. Technical Assistance
The transition in Romania has been supported by substantial technical assistance from multilateral
agencies and bilateral donors. The Fund has provided support in a number of areas with more than
40 technical assistance missions since 1990, although the authorities have had a mixed record with
regard to implementation. Expert Fund assistance has focused on a number of key areas, including:
fiscal reforms; modernization of the central bank and the banking system; creating a market-
oriented legal structure; training; improving the collection and reporting of statistics; and
AML/CFT.
The implementation of a comprehensive tax administration reform designed in line with the
recommendations of several technical assistance missions of the Fund’s Fiscal Affairs Department
started in January 2003. A report on the observance of standards and codes (ROSC) on fiscal
transparency was completed on November 6, 2002 (IMF Country Report No. 02/254). A public
debt management technical assistance (TA) mission was fielded in April 2006. In July 2009, an
FAD TA mission assisted the authorities with the preparation of a fiscal responsibility law (FRL).
There have been four FAD TA missions providing advice on revenue administration issues since
2009, focusing on recommendations to improve service and compliance and strengthen the tax
administration’s organizational structure. Many of the recommendations have been implemented or
are on-going. A high net wealth individual unit was established and audits should begin in 2012.
There were follow-up missions in April and November 2012 on the implementation of the FRL and
budget execution at central and local levels. An FAD mission in December 2011 provided advice
on budget-related legislation, accounting systems and processes, and a progressive move towards
program budgeting. This was followed-up by a March 2012 mission, which provided detailed
guidance on a conceptual design and other requirements of systems to improve fiscal reporting and
commitment control. Missions by the IMF’s regional public financial management advisor in
August and October 2011 assisted the authorities with further developing debt management
capacity. A tax policy mission in November 2011 reviewed the tax system and developed a
roadmap for reform that would make the tax system simpler and more buoyant, while enhancing
fairness.

4
In 2003 an FSAP was completed, and an FSAP Update was completed in Aug 2009. Furthermore,
technical assistance by the Fund’s Monetary and Capital Markets Department (MCM) on (liquidity)
stress testing took place in September 2010 and October 2011. In November 2010, a MCM TA
mission on bank resolution was completed which followed a TA mission in October 2009 by the
IMF’s Legal Department to assess Romania’s progress in amending the banking and winding-up
legislations.
X. Anti-Money Laundering and Combating the Financing of Terrorism Framework
The authorities have undertaken a number of measures to improve the legal and institutional
structural to combat money laundering and corruption. In 2011, a law that imposes international
standards on prevention and sanctioning of money laundering became effective. Financial
institutions are applying enhanced customer due diligence on all foreign politically exposed persons
(PEPs) and follow a risk-based approach in the application of enhanced customer due diligence on
domestic PEPs in accordance with recommendations of the Financial Action Task Force.
Databases on depositors, landowners, and shareholders are maintained to assist the authorities in
identifying beneficial owners of assets and a protocol exists for the sharing of information,
including on suspicious transactions, between the local financial intelligence unit and national anti-
corruption agency (ANI). A national anti-corruption strategy was recently endorsed by the
government and parliament and the Ministry of Justice has taken the lead in coordinating its
implementation and establishing benchmarks to monitor its implementation.
XI. Safeguards Assessment
Under the Fund’s safeguards assessment policy, the National Bank of Romania (NBR) was subject
to full safeguards assessment with respect to the Stand-By Arrangement approved on
August 4, 2009. The assessment, completed on August 29, 2009, concluded that the NBR continues
to have a relatively strong safeguards framework in place. An update of the assessment conducted
in 2011 found a robust safeguards framework at the NBR and recommended measures to sustain
NFA reporting standards and effective audit oversight, and enhance accounting disclosures.
XII. Resident Representative
The Fund has had a resident representative in Bucharest since 1991. Mr. Tonny Lybek assumed the
post of regional resident representative in March 2009.

5
ANNEX II. ROMANIA: RELATIONS WITH THE WORLD BANK
A. Partnership in Romania’s Development Strategy
Like all countries in the region, Romania had to deal with the aftermath of the economic crisis
combined with the risk of a renewed and deeper crisis in the euro area. Romania’s challenge
now is to combine short-term crisis management with medium-term structural reforms that will
make it not only more resistant to shocks, but will also allow it to take advantage of a future
economic upswing. Structural reforms must support resumed convergence toward EU living
standards, a sustainably macroeconomic and fiscal framework, and social cohesion.
The World Bank’s Development Policy Loan with Deferred Drawdown Option (DPL-DDO)
helps to support Romania in the event of an exogenous macroeconomic shock while
contributing to advancing the structural reform program. The DPL-DDO makes financing
available up to EUR 1 billion that can be drawn down by the Government if and when required,
provided they are on track with the macroeconomic framework and the reform program supported
by the DPL-DDO. Structural reforms in the areas of public finance, the energy sector and the health
sector are supported through this World Bank program. The DPL-DDO complements the IMF and
EC assistance (TA) programs. The World Bank also has several sector investment operations,
technical assistance programs, economic and sector work, and commitments through the
International Finance Corporation.
The IMF and World Bank staffs maintain a close collaborative relationship in supporting the
Government’s reform program and coordinate their policy advice to the Romanian
authorities.
B. IMF-World Bank Collaboration in Specific Areas
Public sector reform. The Bank and the Fund support measures to address the weaknesses in
public expenditure management that relate to addressing fiscal deficits and improving revenue
collection through tax policy and administration reforms. The Bank’s DPL-DDO program supports
the strengthening of the Medium Term Expenditure Framework to improve the financial
management and predictability of public spending as well as the quality of public services. The
DPL-DDO also supports the modernization of tax administration, with the objective to enhance
revenue collection, improve tax compliance and reduce the transactions costs for doing business. In
addition, through the DPL-DDO and a series of TA programs, some financed from the EU
structural funds, the Bank supports measures to enhance strategic planning and policy formulation
and coordination, as well as the establishment of policy monitoring and evaluation systems at the
center of the Government. The purpose of the technical assistance is to strengthen linkages between
resources and performance in the public sector.
Financial sector reforms. Under the DPL series, the Bank is supporting measures to strengthen the
functioning and resilience of the financial sector. TA was also provided to the financial sector
authorities, and the Ministry of Justice of Romania, in relation with the DPL series. The TA focused

6
in particular on: a) assistance to the Ministry of Justice in the preparation of Guidelines for
Corporate Debt Restructuring and in amending the Insolvency Law so as to remove obstacles to
out-of-court corporate debt restructuring; and b) assistance to the National Bank of Romania (NBR)
on the preparation of Guidelines for Mortgage Debt Restructuring. A crisis simulation exercise is
planned for mid September 2012. The exercise will assess coordination and decision-making
processes between and within the NBR and the Ministry of Public Finance. It will also test the new
legal mechanisms for bank resolution which were recently approved. The securities regulator and
the pension regulator will be involved as role players in the exercise. A first version draft scenario
is currently for comments with the NBR and the Ministry of Public Finance.
C. Areas Where the World Bank Leads and Its Analyses Serve as Inputs Into the IMF
Policy Formulation and Advice
Social Protection. Under the IMF-Bank partnership, the IMF has paid close attention to the social
dimension of the programs. For example, the fiscal deficit target allows for protecting the poor and
low-income earners from the impact of the global crisis, through higher social spending and
measures to increase the coverage of the best targeted programs and the protection of the vulnerable
household consumers against the energy price increases. At the same time the IMF welcomed the
consolidation of the social assistance programs which is supported by the results-based program
financed by the Bank, beginning with 2012.
Health. The Bank supports the Government program in health through an investment operation and
the DPL-DDO program. The DPL-DDO program aims at strengthening the financial sustainability
of the national health system through: (i) the revision of the basic package of subsidized health
services, procedures and drugs through the introduction health technology assessment; and (ii) the
implementation of the National Hospital Rationalization Strategy, including the reduction of the
total number hospital beds.
Energy. Through the DPL-DDO the Bank supports key structural reforms in the energy sector.
These include the privatization or sale of minority stakes in energy generators, transporters and
distributors; the liberalization of the electricity and gas markets; governance reforms in energy
SOEs, including the restructuring of boards and the appointment of professional management; legal
and regulatory changes to align with the EU norms; and measures to encourage the participation of
the private sector in energy.
D. IFC Program
IFC’s current committed portfolio is $619 million, the fourth largest in the Europe and
Central Asia region after Turkey, Russia and Ukraine. IFC has played an active crisis response
role in Romania, investing over $630 million of its own funds and mobilizing an additional
$242 million in 25 projects since July 2009, with particular support provided to the financial,
renewable energy, and health sectors.

7
While vulnerabilities from the euro zone crisis and global economic downturn persist, IFC
will continue to play a countercyclical role through selective private sector investments in
Romania. In the real sector, this includes supporting projects which create jobs, increase
investment in underserved frontier regions, contribute to the growth and competitiveness of local
firms in promising sectors such as agribusiness and infrastructure, and improve resource efficiency.
IFC will support competitive domestic firms seeking to expand into regional markets, as well as
South-South investment into Romania. In the banking sector, which is largely dominated by foreign
banks (accounting for approximately 80 percent of banking assets), IFC works with local banks to
strengthen their capacity to provide loans to underserved sectors, such micro, small- and medium-
size enterprises and the agri sector, and to offer products such as local currency, trade and energy
efficiency finance. The IFC response in Romania focuses on supporting both banks and non-
banking financial institutions in providing: (i) trade products to address immediate liquidity
concerns; (ii) mezzanine and equity investments to shore up capital shortfalls with particular focus
on the recapitalization of existing banking sector clients; and (iii) scaled-up funding support to
micro, small- and medium-size enterprises. These actions, in coordination with other private
investors and development finance institutions, are also expected to counter the deleveraging risk in
these markets.
E. World Bank Group Strategy and Lending Operations
The current IBRD and IFC Country Partnership Strategy (CPS) for Romania, covering the
period 2009-2013, was presented to the Board on July 16 2009. The main objective of the
Country Strategy is to deepen the reform agenda for improved public sector management, economic
growth and competitiveness, and social and spatial cohesion. The focus of the DPL-DDO program
on public financial management, governance of SOEs in the energy sector, and health sector
reforms is consistent with these objectives. The DPL-DDO program takes also into account the
added focus of the CPS Progress Report (CPSPR)2 on the European perspective: (i) policy reforms
to reap the benefits of EU membership and meet the objectives of the Europe 2020 strategy;
(ii) modernization of public institutions to enhance resource allocation and absorption of EU funds;
and (iii) complement to EU funding. The CPS outlines a substantial Analytical and Advisory
Services program that complements the DPL-DDO program.
Romania’s lending portfolio consists of 12 lending operations with an undisbursed
commitment of $1,068 billion and an Analytical and Advisory Activities portfolio of eight
ongoing activities3, including two Fee-Based Services (FBS-Transport and Justice). The size of the
portfolio increased by about 75 percent as compared with June 2011 with the approval at end FY11
of the Modernization of Social Assistance Loan ($710M). Grant financing increased as well, as a
new IDF grant for M&E of Policymaking (US$0.43M) was added, mid March, to the ongoing
portfolio.
2 Progress Report on the Country Partnership Strategy for Romania FY09-FY13: Report No. 60255-RO,
November 28, 2011.
3 As of April 2012.

8
The weight of Analytic and Advisory Activities in country services is increasing significantly,
with main emphasis on Fee-Based TA. This reflects the addition to the Bank program of the
Fee-Based Functional Reviews TA (FBS FRs) and the follow up through the MAP (Modernization
of Public Administration) TA program. Moreover, the Government through the European
Commission, requested the Bank (and other IFIs - EIB, EBRD) to support the strengthening of its
capacity in policy and strategy formulation, sector and project planning, design and implementation
in order to increase the absorption capacity of EU structural and cohesion funds. In this sense a
Memorandum of Understanding between the Government and the Bank was signed in January 2012
as an umbrella for the further development of specific activities. Meetings and exchanges with all
stakeholders took place in Q3FY12 along the areas for technical assistance: public administration
reforms; regional development; environment and climate change; energy; transport;
competitiveness; human resources development.
The composition of Romania’s program is shifting from investment landing and analytical
work to results based and DPL lending, and Fee-Based Services. This development is generated
by the actual needs of the Government, namely: (i) an ambitious reform program for the Social
Assistance Sector, that could be best supported by the Bank via a Results-Based operation; (ii) the
Government structural reform agenda that needs to be completed (SOEs, Energy, Transport, Health
sectors) combined with GOR’s market orientation for the financing of its public debt, which called
for a “buffer” deferred draw-down DPL that can support the implementation of reforms and also
consolidate Romania’s position on the financial markets, without adding to the debt outstanding;
(iii) the availability of non-reimbursable Structural Funds (whose absorption is a first priority for
Romania) which reduces the interest for classical SILs and calls on the Bank to only complement
EU support via operations that can boost the outcomes from current budgets. Fee-based services
weight in country services is increasing, in line with Romania’s actual priorities of modernizing its
public administration, and strengthening its capacity for EU Funds absorption (32 FBS projects
under preparation).

9
ANNEX III. ROMANIA: STATISTICAL ISSUES
Romania—STATISTICAL ISSUES
As of August 27, 2012
I. Assessment of Data Adequacy for Surveillance
General: Data provision is adequate for surveillance. The quality of the national accounts,
price, fiscal, and balance of payments data is adequate. The authorities have improved
economic and financial statistics with technical assistance, including from the Fund, over the
past several years. Romania began participating in the GDDS in February 2001 and
graduated to subscription to the SDDS in Aug 2005.
National accounts: Quarterly and annual national accounts statistics are produced by the
National Institute for Statistics (INS) using the European System of Accounts 1995 (ESA95).
Estimates are methodologically sound and are reported to the Fund on a timely basis for
publication in the International Financial Statistics (IFS). Provisional and semi-final
versions are disseminated in the Statistical Yearbook and other publications, as well as on the
web (www.insse.ro).
Inflation: The Consumer Price Index is subject to standard annual re-weighting, and is
considered reliable. In January 2004, the INS changed the coverage of the Producer Price
Index to include the domestic and export sectors.
Labor market: Labor market statistics are broadly adequate. The definition used for
employment is consistent with ESA 95.
Public finances: Annual GFS data are reported on an accrual basis derived from cash data
using various adjustment methods. Tax revenues are adjusted using the time-adjusted cash
method; expense data are adjusted using due-for-payments data; and interest payments are
calculated on an accrual basis. Beginning in 2002, the Special Fund for Development of the
Energy System, the Special Fund for Public Roads, the Special Fund “Romanian Agriculture
Development,” and the Special Fund “Romania” were included in the state budget, while the
Special Fund for Insured Protection was eliminated from general government accounts. The
reported data excluded data on the Agency for Recovery Bank Assets.4 EUR receives
monthly cash budget execution data. Accrual data are available on a quarterly basis and with
a 55 day lag after the end of each quarter.
Consolidated data on central government operations are reported for inclusion in the GFS
4 Formerly the Agency for Bank Asset Recovery and the Authority for Privatization and Management of State
Ownership.

10
Yearbook. Consolidated general government data were reported for the first time for
inclusion in the 2005 GFS Yearbook.
Monetary and financial data: The National Bank of Romania (NBR) reports monetary and
financial statistics on a regular and timely basis for publication in the IFS. Since
December 2004, the NBR reports monetary data to STA using the Standardized Report
Forms (SRFs). The data are being published in the IFS Supplement, beginning
September 2006. Romania’s data and metadata for financial soundness indicators are posted
on the IMF’s website (http://www.imf.org/external/np/sta/fsi/eng/cce/index.htm).
Balance of payments: The NBR routinely reports balance of payments statistics to the Fund
in a timely fashion. A 2003 STA mission undertook a detailed review of the NBR’s
compilation methodology for balance of payments and international investment position
statistics, developed in consultation with Eurostat, and concluded that the proposed system is
broadly appropriate. The STA mission supported implementation of this compilation system
in 2004, along with a new FDI survey. The authorities have agreed to balance of payments
publication in the BPM6 format using a matrix conversion system starting from August 2012.
II. Data Standards and Quality
Romania is subscriber to the Fund’s Special
Data Dissemination Standard (SDDS) since
August 4, 2005.
IMF Reports on the Observance of Standards
and Codes (ROSC) have been published as
Country Report No. 01/206, 02/254 and
03/389.

11
ROMANIA: TABLE OF COMMON INDICATORS REQUIRED FOR SURVEILLANCE
(AS OF AUG 27, 2012)
Date of
latest
observation
Date
received
Frequenc
y of
Data6
Frequency of
Reporting6
Frequency of
Publication6
Exchange Rates July 2012 Aug.2012 D and M D and M D and M
International Reserve Assets and Reserve
Liabilities of the Monetary Authorities1
July 2012 Aug.2012 D and M W and M M
Reserve/Base Money July 2012 Aug.2012 D and M W and M M
Broad Money July 2012 Aug.2012 M M M
Central Bank Balance Sheet July 2012 Aug.2012 M M M
Consolidated Balance Sheet of the Banking
System
July 2012 Aug.2012 M M M
Interest Rates2 July 2012 Aug.2012 M M M
Consumer Price Index July 2012 Aug.2012 M M M
Revenue, Expenditure, Balance and
Composition of Financing3 – General
Government4
July 2012
Aug.2012
M
M
M
Revenue, Expenditure, Balance and
Composition of Financing3– Central
Government
July 2012
Aug.2012
M
M
M
Stocks of Central Government and Central
Government-Guaranteed Debt5
June 2012 Aug.2012 M M M
External Current Account Balance June 2012 Aug.2012 M M Q
Exports and Imports of Goods and Services June 2012 Aug.2012 M M M
GDP/GNP Q1 2012 Aug.2012 Q Q Q
Gross External Debt Q1 2012 Aug.2012 M M Q
International Investment Position 7 Q1 2012 Aug.2012 Q Q Q
1 Includes reserve assets pledged or otherwise encumbered as well as net derivative positions. 2 Both market-based and officially-determined, including discount rates, money market rates, rates on treasury bills, notes and
bonds. 3 Foreign, domestic bank, and domestic non-bank financing. 4 The general government consists of the central government (budgetary funds, extra budgetary funds, and social security funds),
and state and local governments. 5 Including currency and maturity composition.
6 Daily (D), weekly (W), monthly (M), quarterly (Q), annually (A), irregular (I); and not available (NA).
7 Includes external gross financial asset and liability positions vis-à-vis nonresidents.

INTERNATIONAL MONETARY FUND
ROMANIA
Staff Report for the 2012 Article IV Consultation, Sixth Review Under the Stand-By
Arrangement, and Requests for Waiver of Nonobservance of Performance Criterion
and Modification of Performance Criteria—Supplementary Information
Prepared by the European Department
(In Consultation with Other Departments)
Approved by Poul M. Thomsen and Vivek Arora
September 25, 2012
1. This supplement provides an update on economic and policy developments since
the issuance of the staff report on September 13, 2012. The additional information does
not change the thrust of the staff appraisal.
2. Recent indicators suggest positive growth due to higher domestic demand. The
latest GDP data release for 2012:Q2 showed a 0.5 percent real expansion broadly in line with
expectations and driven largely by a stronger-than-expected recovery in domestic demand
which offset a negative contribution from net exports. Real GDP growth in 2012:Q1 was
revised up from -0.1 percent to 0.1 percent. High frequency indicators suggest that industrial
production is recovering from a temporary dip in June while retail and wholesale trade
continue to show solid growth. However, consumer confidence has been stagnating since
May.
3. Annual inflation increased to 3.9 percent reaching the upper bound of the target
band. This rate was somewhat higher than expected, reflecting the impact of food and fuel
price increases. Core inflation remained stable at 2.5 percent, in line with projections.
4. Financial market conditions have improved somewhat as the political
uncertainty subsided following the Constitutional Court decision that reinstated
Mr. Basescu as President. The five-year sovereign CDS spreads have declined by more
than 110 bps since early-August to slightly above 310 bps in recent days. The authorities
have successfully issued a 10-year Eurobond at 5.1 percent yield which was met with strong
market demand. The stock market has benefited from the recent improved market sentiment
and gained about 14 percent year to date. Improved market sentiment contributed to a leu
appreciation of 3 percent against the euro from the record lows reached in early-August,
which allowed the NBR to scale down interventions in support of the leu while holding
depreciation against the euro at about 4 percent for the year. Banking system deposits and
total exposure of the largest foreign banks have remained stable in recent weeks.

2
5. Preliminary figures through August show budget performance remains on track
to meet program targets. The cash deficit through August reached 1.2 percent of GDP
compared to the target of 2.2 percent for 2012. Strict spending discipline has been
maintained. Efforts to reduce local government arrears are ongoing.
6. The government has completed the prior actions. On September 10, the
government approved an Ordinance changing the mechanism for tax sharing to enable
payment of local government arrears. On September 15, the government issued an order
increasing gas prices for both household and non-household consumers as planned. These
steps will help ensure full cost recovery and market-based pricing. On September 6 and
September 18, respectively, the tenders for the public offerings of shares in Oltchim and
Transgaz were launched.

3
Measure Target Date Comment
Prior action
1.
2. Increase gas prices for non-residential consumers by 10 percent and for households by 5 percent. Met
3. Launch the tender for a secondary public offering of 15 percent of Transgaz shares. Met
4. Launch the tender for the majority privatization of Oltchim. Met
Quantitative performance criteria
1. Floor on net foreign assets September 30, 2012
2. Floor on general government overall balance September 30, 2012
3. Ceiling on central government and social security domestic arrears September 30, 2012
4. Ceiling on general government guarantees September 30, 2012
5. Non-accumulation of external debt arrears September 30, 2012
Quantitative Indicative Target
1. Ceiling on general government current primary spending September 30, 2012
2. Floor on operating balance of key SOEs September 30, 2012
3. Ceiling on stock of arrears of key SOEs September 30, 2012
4. Ceiling on stock of local government arrears September 30, 2012
5. Ceiling on the execution of the PNDI program September 30, 2012
Inflation consultation band
Inner band September 30, 2012
Outer band September 30, 2012
Structural benchmarks
1. Prepare comprehensive amendments to the health care legislation to address the persistent budgetary shortfalls
and to ensure high quality health care services.
June 30, 2012 Met
2. Launch tender for providing software to integrate the accounting reporting system with the Treasury payment June 30, 2012 Met
3. Increase by 5 percent the electricity price for both residential and nonresidential consumers. June 30, 2012 Met
4. Hold IPOs of government shares in Romgaz and Hidroelectrica. October 15, 2012 Reset to March 15, 2013
New structural benchmarks
1. Update the investment database to identify priority local government projects funded through budgetary and EU
funds, and publish a list of low priority projects which will be discontinued.
September 30, 2012
2. Publish up-to-date financial statements of all public hospitals on a webpage of the Ministry of Health. October 31, 2012
3. Sign a contract with legal and transaction advisor for the majority privatization of Oltenia. November 30, 2012
4. Finalize a detailed definition of the structural architecture of the accounting and treasury reporting system. December 31, 2012
Approve government ordinance to allow that: (i) resources available to local governments, currently limited to co-
financing investment, can be used for paying arrears; and (ii) the central government can directly pay off arrears of Five days before the
Board meeting
Met
Table 1. Romania: Performance for Sixth Review

Public Information Notice (PIN) No. 12/122 FOR IMMEDIATE RELEASE October 23, 2012
IMF Executive Board Concludes 2012 Article IV Consultation with Romania
On September 28, 2012, the Executive Board of the International Monetary Fund (IMF) concluded the 2012 Article IV Consultation with Romania.1 Background Following the severe downturn in 2008–09, the Romanian economy has undertaken a large adjustment to restore macroeconomic stability. Under two successive IMF Stand-By Arrangements and with support of the European Commission and the World Bank, significant progress has been made in reversing large external and internal imbalances. Sustained fiscal consolidation, mainly achieved through spending constraints of the wage bill and public pensions, has resulted in a significant reduction of the fiscal deficit. Growth resumed in 2011 and annual inflation has declined to record lows earlier this year. Unemployment remains high, but labor market reforms have contributed to a better-functioning labor market and a recovery in employment. Bank capital buffers have been shored up and contingency plans have been prepared. Structural reforms in the energy and transportation sectors have progressed, albeit slowly. These policy actions have helped to ease financing pressures and allowed Romania renewed access to the Eurobond market. 1 Under Article IV of the IMF's Articles of Agreement, the IMF holds bilateral discussions with members, usually every year. A staff team visits the country, collects economic and financial information, and discusses with officials the country's economic developments and policies. On return to headquarters, the staff prepares a report, which forms the basis for discussion by the Executive Board. At the conclusion of the discussion, the Managing Director, as Chairman of the Board, summarizes the views of Executive Directors, and this summary is transmitted to the country's authorities. An explanation of any qualifiers used in summings up can be found here: http://www.imf.org/external/np/sec/misc/qualifiers.htm.
International Monetary Fund 700 19th Street, NW Washington, D. C. 20431 USA

2 Nevertheless, the post-crisis recovery remains fragile and the outlook is challenging. With strong trade and financial sector linkages to the euro area, Romania remains vulnerable to the regional economic slowdown. While the economy is expected to grow by 0.9 percent this year, the growth momentum has been weak, and is lagging behind most other European emerging economies. Difficulties in absorbing European Union structural funds and frequent delays in advancing the structural reform agenda are weighing on the economy’s potential growth. The weak recovery together with the so far moderate ongoing private sector deleveraging, mainly concerning households, are impacting the banking system as nonperforming loans accumulate, bank profitability continues to be low, and real credit growth remains subdued. Heightened uncertainty owing to political tensions between the ruling coalition and the President has taken a toll on investor confidence, leading to capital outflows and exchange rate depreciation pressures. These developments along with rising inflationary pressures have underscored the need for a prudent monetary policy stance. Strong commitment to achieving fiscal sustainability and judicious implementation of the structural reform agenda remain crucial to anchor policy credibility, ensure macroeconomic stability, and boost inclusive growth. Executive Board Assessment Executive Directors commended the Romanian authorities for restoring macroeconomic stability and reducing large external and fiscal imbalances. Directors noted however that the difficult external environment and domestic political uncertainty are weighing on the economy. They welcomed the authorities’ continued commitment to the program objectives, stressing the importance of sustained policy discipline and accelerated implementation of structural reforms to reinforce the economy’s resilience and boost its growth potential. Directors commended the sizeable fiscal adjustment undertaken and welcomed the authorities’ commitment to stay within the 2012 fiscal target of 3 percent and reach the medium-term objective by 2014. They recognized the significant progress made in reducing current spending and encouraged continued restraint ahead of the upcoming elections. Directors emphasized the importance of prioritizing capital outlays and improving EU funds absorption. They also underscored the need to take remedial measures to reduce outstanding arrears and avoid further accumulation of arrears, in particular at the local government level. Reform of the healthcare system should help address medium-term fiscal pressures, while improving service delivery. Directors stressed that accelerating the pace of structural reforms is critical to fostering higher and inclusive growth. They welcomed the progress on labor market reform and energy prices but underscored the need for further action in the energy and transportation sectors, while protecting the poor. Deeper reform and privatization of the state-owned enterprises and improvements in the institutional and regulatory frameworks and the business climate are

3 priorities going forward. Directors also called for stepped up efforts to increase the employment rate and reform the education system. Directors underscored the importance of pursuing a prudent monetary policy stance while maintaining exchange rate flexibility. They encouraged the central bank to limit intervention in the foreign exchange market to smoothing volatility and to stand ready to tighten the policy stance should exchange rate pressures persist. Directors noted that the Romanian banking system maintains significant buffers to deal with the potential adverse effects of tensions in euro area financial markets. They encouraged the authorities to continue to strengthen bank supervision and the financial sector safety net, and mitigate the rise in nonperforming loans.
Public Information Notices (PINs) form part of the IMF's efforts to promote transparency of the IMF's views and analysis of economic developments and policies. With the consent of the country (or countries) concerned, PINs are issued after Executive Board discussions of Article IV consultations with member countries, of its surveillance of developments at the regional level, of post-program monitoring, and of ex post assessments of member countries with longer-term program engagements. PINs are also issued after Executive Board discussions of general policy matters, unless otherwise decided by the Executive Board in a particular case. The staff report (use the free Adobe Acrobat Reader to view this pdf file) for the 2012 Article IV Consultation with Romania is also available.

4
Romania: Selected Economic and Social Indicators, 2008–13 2008 2009 2010 2011 2012 2013
Est. Prog. Proj. Proj.
Output and prices (Annual percentage change)
Real GDP 7.3 -6.6 -1.6 2.5 1.5 0.9 2.5
Contributions to GDP growth
Domestic demand 8.3 -13.5 -1.6 3.2 1.9 0.6 2.7
Net exports -1.0 7.0 0.0 -0.8 -0.4 0.4 -0.2
Consumer price index (CPI, average) 7.8 5.6 6.1 5.8 2.9 3.0 3.2
Consumer price index (CPI, end of period) 6.3 4.7 8.0 3.1 3.4 3.6 3.2
CORE 3 price index (CPI, end of period) 5.5 2.3 4.2 2.4 2.5 2.9 2.7
Producer price index (end of period) 15.3 1.9 6.3 8.9 … … …
Unemployment rate (average) 5.8 6.9 7.3 7.4 7.2 7.2 7.0
Nominal wages 26.1 4.8 3.1 4.9 5.0 4.0 5.0
Saving and Investment (In percent of GDP)
Gross domestic investment 31.3 25.4 24.8 28.8 30.2 28.9 29.3
Gross national savings 19.7 21.2 20.4 24.4 25.7 25.2 25.5
General government finances 1/
Revenue 32.2 31.2 32.3 31.4 32.5 32.3 32.8
Expenditure 37.0 38.5 38.7 35.5 34.7 34.5 34.6
Fiscal balance -4.8 -7.3 -6.4 -4.1 -2.2 -2.2 -1.8
External financing 0.4 2.6 2.8 2.6 1.9 1.9 0.8
Domestic financing 4.4 4.6 3.6 1.5 0.4 0.3 1.0
Privatization proceeds 2/ 0.1 0.1 0.1 0.0 0.0 0.0 0.0
Fiscal balance (including PNDI) -4.8 -7.3 -6.4 -4.1 -2.4 -2.4 -2.0
Structural fiscal balance 3/ -7.5 -6.8 -4.9 -3.0 -0.6 -0.9 -0.6
Gross public debt (direct debt only) 11.8 21.7 28.2 30.2 31.6 32.0 32.0
Gross public debt (including guarantees) 13.6 23.8 31.2 33.0 34.2 34.6 34.5
Money and credit (Annual percentage change)
Broad money (M3) 17.5 9.0 6.9 6.6 6.7 2.7 6.1
Credit to private sector 33.7 0.9 4.7 6.6 4.0 2.2 6.1
Interest rates, eop (In percent)
Euribor, six-months 3.5 4.5 1.2 1.6 … … …
NBR policy rate 10.3 8.0 6.3 6.0 … … …
NBR lending rate (Lombard) 14.3 12.0 10.3 10.0 … … …
Interbank offer rate (1 week) 12.7 10.7 3.6 6.0 … … …
Balance of payments (In percent of GDP)
Current account balance -11.6 -4.2 -4.4 -4.4 -4.4 -3.7 -3.8
Merchandise trade balance -13.7 -5.8 -6.1 -5.5 -5.5 -5.2 -5.3
Capital and financial account balance 12.7 -2.5 1.0 1.3 4.7 2.7 4.8
Foreign direct investment balance 6.7 3.0 1.8 1.4 1.9 0.9 1.2
International investment position -49.4 -62.3 -62.7 -60.5 -63.5 -63.2 -68.5
Gross official reserves 20.2 26.1 29.0 27.3 27.0 26.9 23.7

5
Romania: Selected Economic and Social Indicators, 2008–13 (concluded) 2008 2009 2010 2011 2012 2013
Est. Prog. Proj. Proj.
Gross external debt 51.8 68.6 74.5 72.1 71.7 71.1 69.1 Exchange rates
Lei per euro (end of period) 4.0 4.2 4.3 4.3 … … …
Lei per euro (average) 3.7 4.2 4.2 4.2 … … …
Real effective exchange rate
CPI based (percentage change) -5.0 -7.5 1.9 2.8 … … …
GDP deflator based (percentage change) 1.6 -8.7 1.9 2.6 … … … Memorandum Items:
Nominal GDP (in bn RON) 514.7 501.1 522.6 578.6 607.5 607.3 644.6
Social and Other Indicators
GDP per capita (current US$, 2011): $8,863; GDP per capita, PPP (current international $, 2009): $15,163
People at risk of poverty or social exclusion: 40.3% (2011) Sources: Romanian authorities; IMF staff estimates and projections; and World Development Indicators database. 1/ General government finances refer to cash figures. 2/ Excludes receipts from planned privatizations under the program. 3/ Actual fiscal balance adjusted for the automatic effects of the business cycle.

Press Release No. 12/372
FOR IMMEDIATE RELEASE
September 28, 2012
IMF Completes Sixth Review Under the Stand-By Arrangement for Romania
The Executive Board of the International Monetary Fund (IMF) today completed the sixth
review of Romania’s economic performance under a program supported by a 24-month
Stand-By Arrangement (SBA). The authorities have indicated that they will continue to treat
the arrangement as precautionary and therefore do not intend to draw under it.
Completion of the review makes an additional amount equivalent to SDR 430 million (about
€512.9 million, or about US$663.1 million) available for disbursement, bringing the total
resources that are currently available to Romania under the SBA to SDR 2.640 billion (about
€3.2 billion, or about US$4.1 billion).
The SBA was approved on March 25, 2011 (see Press Release No 11/101) in the amount of
SDR 3,090.6 million (about €3.7 billion, or about US$4.8 billion).
In completing the review, the Executive Board also approved a waiver for the nonobservance
of a performance criterion regarding central government and social security domestic arrears,
and the modification of the performance criterion concerning the net foreign assets of the
central bank.
Following the Executive Board’s discussion on Romania, Mr. David Lipton, First Deputy
Managing Director and Acting Chair, said:
“Romania continues to make good progress under the precautionary program. All
performance criteria and indicative targets were met except for the central and local
government arrears. Nevertheless, the economic outlook remains challenging due to the
difficult external and internal environments that have led to exchange rate pressures and
undermined confidence. Growth is expected to slow while inflation is approaching the upper
bound of the NBR’s target band. Steadfast program implementation is essential to preserve
the hard won macroeconomic stability, and boost investment and growth potential.
International Monetary Fund
Washington, D.C. 20431 USA

2
“The authorities have maintained strict spending discipline consistent with the goal of
lowering the budget deficit to 3 percent of GDP in 2012. Remedial measures to ensure a
decline in arrears remain a priority. A slowdown of capital outlays will be required in light of
the recent interruption of EU fund disbursements for some programs. Additional efforts are
needed to improve tax administration and reform the health care, energy and transportation
sectors. While progress is being made towards liberalizing energy prices, it will also be
important to step up the reform of state-owned enterprises.
“The banking system maintains significant buffers to deal with rising non-performing loans
and potential spillovers from elsewhere in Europe. However, the authorities should remain
vigilant and continue to strengthen the financial-sector safety net and contingency planning.
Intervention in support of the leu should be limited to smoothing exchange rate volatility.”

Statement by Mr. Menno Snel, Executive Director for Romania, and Mr. Serban Matei, Senior Advisor to the Executive Director
September 28, 2012 The economic program, supported by the Fund, the European Commission, and the World Bank, played an important role in stabilizing the Romanian economy, generating concrete results in boosting growth and maintaining fiscal and financial stability. Romania’s performance under the current program continues to be strong, and all performance criteria for the sixth review were met, except for the one on accumulation of central government arrears, which was missed by a small margin. The authorities continue their efforts on accomplishing the goals of a broad structural agenda, with a focus on reforming the healthcare sector and state-owned enterprises. Recent economic developments Romania’s economic recovery continues. Real GDP grew by 2.5 percent in 2011 on the back of a very good harvest and thanks to a front-loaded pick-up in exports, which however faded during the year. There was also some recovery in private demand, but it declined by 0.2 percent in the fourth quarter (q/q) and by 0.1 percent in the first quarter of 2012. In the second quarter of 2012, GDP expanded 0.5% (q/q/) and accelerated to 1.2% (y/y) in real terms with industry turning positive and constructions gathering pace, rebounding from a seasonal dip. Economic growth is likely to be less robust than foreseen, reflecting mainly the deteriorating external environment in the euro area and spillover effects from financial market turbulence. Overall, growth in 2012 is expected to reach around 1 percent, with downside risks. The inflation rate reached record lows of 1.8 - 2.0 percent in the period April through June. It increased to 3.9 percent in August, mainly driven by an expected reversal of favorable base effects as a result of developments in food prices in the previous year. These effects are amplified by exchange rate fluctuations, the impact of drought on domestic agricultural output and an increase in international agricultural commodity prices. We expect inflation to climb further in the second half of the year, notwithstanding the persistent negative output gap. Due to the stronger upside risks for the inflation outlook, the NBR has pro-actively stopped interest rate cuts since May and maintained the policy rate at 5.25 percent, while adjusting liquidity conditions. The external position has been consolidated. The current account deficit is expected to be around 4 percent of GDP for 2012, lower than the levels registered in 2009-11, and is seen as stabilizing at around 4.5-5 percent of GDP from 2013 onwards. In 2012, net exports are expected to remain broadly stable, and official transfers are projected to begin recovering.

2
Public debt issuance has been positive so far this year. The authorities successfully tapped the external markets by issuing USD and EUR denominated bonds, extending the maturities at competitive rates. Meanwhile, consolidation of the local currency yield curve has been continued. The efforts to consolidate the fiscal buffers were continued and in June the World Bank has approved a Development Policy Loan of EUR 1 billion. Despite the progress achieved, the recovery remains vulnerable to adverse developments in international markets, weaker-than-expected growth in Western Europe, and possibly more rapid and less orderly bank deleveraging. Spillovers from the ongoing turbulence in the euro area could dampen exports and affect capital flows to Romania. The authorities will remain vigilant, act proactively, and take the necessary steps to contain these risks. Fiscal policy Since the first program started, Romania significantly improved its fiscal position and the authorities remain committed to continue this process in 2013. Under the new fiscal strategy, implementing further structural adjustments, the deficit target in 2013 is set at 2.2 percent in ESA terms. Moreover, to achieve this goal the authorities are committed to continue restraining expenditures and prioritizing investment projects with a focus on EU-funded initiatives. They will also improve tax collection by implementing measures to simplify the tax code and strengthen the tax audit and enforcement efforts, based on the technical assistance recommendations from the Fund and the Bank. For 2012, the authorities remain fully committed to bringing the fiscal deficit below 3 percent of GDP in ESA terms, in compliance with the EU Excessive Deficit Procedure. For 2013, the structural deficit will be reduced by at least 0.5 percent of GDP. To ensure meeting this goal, the cash deficit target will be limited to 2.2 percent of GDP in 2012 and will require continued expenditure restraint and strengthened tax collection. Personnel spending will remain at 6.7 percent of GDP in 2012, unchanged from 2011, reflecting the continued strong decline in public employment. After a year of declining arrears and unpaid bills in the general government, arrears slightly increased in the second quarter 2012, being concentrated mostly in local governments. To strengthen enforcement, the authorities conducted a thorough audit and will undertake a comprehensive analysis of local government arrears to determine their causes. A government ordinance has been issued to ensure that tax-sharing resources available to local governments can be used for paying arrears and to allow the central government to directly pay off arrears of local governments. The arrears in the SOE’s in the first half of 2012 stood below the indicative target for that period, and the authorities anticipate that they will be further reduced in the second half of 2012. In the health

3
sector, arrears in registered bills with the Health Insurance Fund have now been eliminated. Monetary policy The monetary authorities responded appropriately to economic developments, and the central bank has gradually and prudently reduced its policy rate amid abating inflationary pressures in the first half of the current year. Since November 2011, the central bank eased the rate by a cumulative 100 basis points while maintaining the reserve requirements on local and FX currencies. Due to external uncertainties and a heightened upside risk balance for the inflation outlook, the central bank decided in its May, June and August policy meetings to keep the interest rate unchanged. It has also been managing liquidity in the system through weekly repo auctions with banks. Lending and deposit rates for non-bank clients, as well as interbank rates, have generally reflected the cumulative reduction in the NBR policy rate. Headline inflation was 3.9 percent in August as favorable food prices receded. Core inflation continued to decline, reaching a low of 2 percent in March, but it has recently increased somewhat due to expectations fueled by relatively more volatile exchange rate dynamics, as well as by the impact of the expected increase of processed food prices from last year’s lows. However, upside risks remain, including from additional adjustments of administered prices and a stronger than previously estimated rebound of domestic food prices. Nonetheless, inflation is expected to stay within the target band for 2013, after the current volatile food price-related increase dissipates. In light of the gathering risks of contagion from financial disturbances in the region and possible capital outflows, the monetary authorities will remain vigilant against inflation risks and are committed to taking action as needed to ensure the achievement of the medium-term inflation targets. Financial sector The Romanian financial sector so far has weathered well the impact of the economic challenges. The banking system remains well capitalized, with an average capital adequacy ratio of 14.7 percent at end-June 2012. Private sector credit has grown in annual real terms by 4.1 percent through July. At the same time, non-government client bank deposits grew annually in real terms by 6.7 percent through July. However, the NPL ratio rose to 16.8 percent in end-June. Total prudential provisions at end-June were sufficient to cover 98 percent of NPLs. In light of the current uncertain external environment, the central bank remains vigilant to vulnerabilities in the banking system and stands ready to provide liquidity, as necessary, to mitigate segmentation in the interbank market. It has also broadened its range of contingency measures to be deployed - if necessary - to preserve depositor confidence and consolidate financial stability.

4
Structural reforms Under the current program the authorities are committed to reforming the state-owned enterprises, especially in the transport and energy sectors, to enable sustainable economic growth and better competitiveness. The authorities have made progress in the reform agenda, but challenges remain. In the transport sector, the authorities are continuing the implementation of the general transport master plan, which will balance increasing demand and available fiscal means, ensure complementarities between different transport modes and define priorities for the medium and long-term investment. In the energy sector, the authorities have taken a number of actions to establish a framework to improve the sector’s efficiency. Electricity and gas legislation, in line with EU energy directives, was adopted. The law on the energy regulator (ANRE) is expected to be promulgated by mid-October 2012. Following the earlier approval of a roadmap to deregulate electricity prices, a similar step has been taken for gas prices. This envisages complete liberalization of gas prices for non-residential consumers by January 1, 2015, and for households by October 1, 2018. Regulated electricity prices were also increased by five percent at end-June. An extraordinary step was placing the hydro-electric power producer, Hidroelectrica, into insolvency in June, in view of its deteriorating financial position. The judicial administrator has cancelled or renegotiated in market terms contracts at below-market prices with the energy traders. Hidroelectrica will sell the electricity being released from the cancelled contracts on the electricity trading platform (OPCOM). To better align the currently regulated end-user prices of gas with the actual cost of supply and distribution, the authorities have increased tariff rates for non-residential consumers by ten percent and for households by five percent. The authorities will continue the privatization agenda and accelerate implementation of the SOE corporate governance Law. The process has already been started to appoint professional boards and management for key SOEs that remain under majority government ownership. In conclusion, my authorities concur that the current precautionary Stand-By Arrangement will maintain the reform momentum, provide additional security against unforeseen risks, and build on the considerable progress achieved over the past three years, thereby setting the stage for strong and sustainable economic development while maintaining external and internal stability.