Embed Size (px)
Citation preview

Roles of the in-situ observations in the detection of the Kuroshio frontal variability south of Japan
Miyazawa, Y., Guo, X., Zhang, R., and Varlamov, S. M. (JAMSTEC)Watanabe, T., Setou, T., and Ambe, D. (FRA)
SSHA SST in-situ temperature in-situ salinity
The satellite data significantly contribute to the operational ocean forecasting .
But roles of the in-situ temperature and salinity profiles are still unclear.
We demonstrate that the assimilation of the in-situ data effectively capture the Kuroshio frontal variability south of Japan.

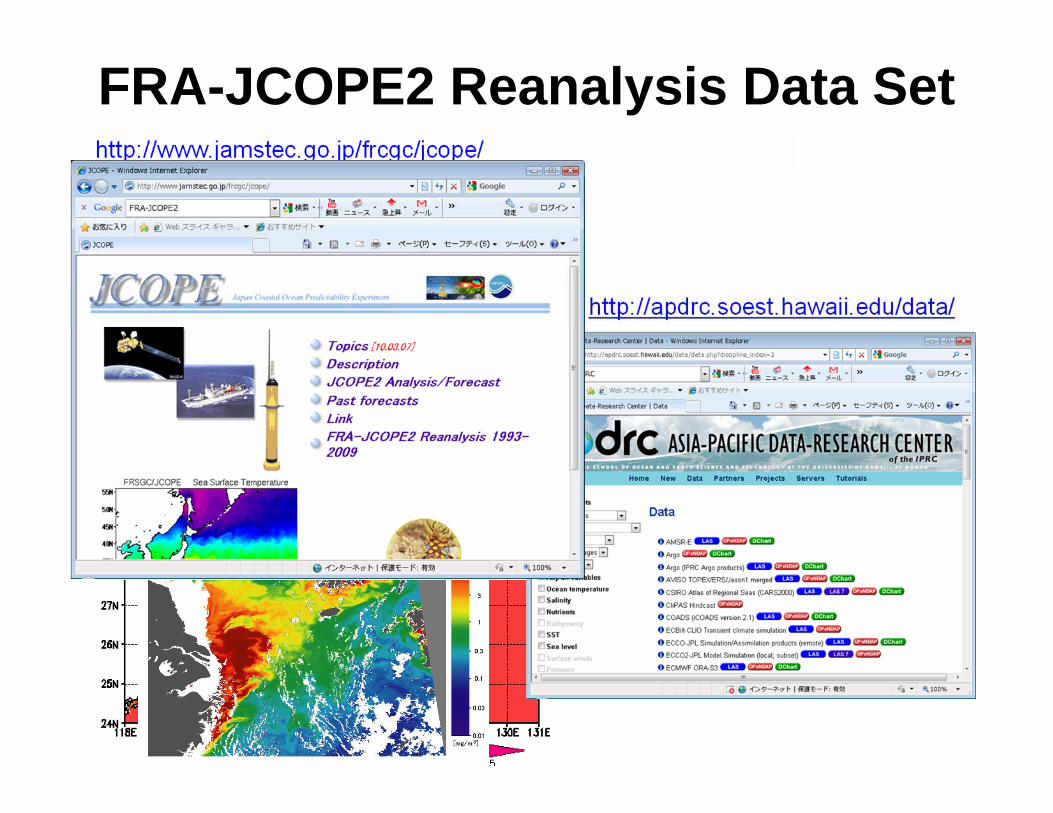
IntroductionWe have recently created new high-resolution reanalysis data, FRA-JCOPE2, for the period from January 1993 to December 2009, 17 years.
The new reanalysis has assimilated huge amount of the in-situ data around Japan, where the dense in-situ observation network has been maintained for past a few decades through the great efforts of fishery research agencies of Japan.
To clarify roles of the dense coastal in-situ observation network, we examined the sensitivity of the in-situ data to the quality of the reanalysis data.
We focus on the Kuroshio frontal disturbances south of Japan andthe relevant warm water intrusions into the coastal areas.

Kuroshio front south of Japan
The Kuroshio front is formed between the Kuroshio warm water and the cold water near the coasts south of Japan.
The Kuroshio front is very active .
The wavelike disturbances propagating along there significantly affect the coastal regions through the Kuroshio warm water intrusions
[Kimura and Sugimoto, 1993; Kasai et al., 1993].

FRA-JCOPE2 ReanalysisPeriod: 1 January 1993 to 31 December 2009 (17 years)
Range: 10.5N-62N, 108-180E (Northwestern Pacific)
Resolution: 1/12 degree, 46 vertical levels, daily-mean
Model:Princeton Ocean Model for Generalized coordinate of sigma (Miyazawa et al., 2009)
Forcing:Wind stress and heat flux: NCEP/NCAR Reanalysis DataRelaxation to monthly climatological salinityMonthly mean Changjiang River Discharge (Jan. 1993 - Dec. 2008)
Data assimilation: - 3-dimentional variational assimilation using temperature-salinity
coupling vertical EOF modes (3DVAR; Fujii and Kamachi, 2003)- Incremental Analysis Update (IAU; Bloom et al., 1996)
Data:- Sea Surface height Anomaly (TOPEX/Poseidon, Jason-1,2, Geosat Follow-On,
Envisat, ERS-1,2)- Sea Surface Temperature (NOA A AVHRR MCSST)- In-situ temperature and salinity profiles (GTSPP, WOD05, FRA-DATA)

FRA-DATA (at least once a month)
The coverage of in-situ hydrographic observation around the Japanese coasts has been very active and dense over past a few decades.
However, more than half of data on coastal repeated hydrographic observation lines conducted by local fisheries research agencies (hereafter referred as FRA-DATA) has not been included in the typical data archives (WOD/GTSPP).
We have created the new reanalysis datathat assimilated all FRA-DATA for the period from 1993 to 2009.
South of Japan

Sensitivity experiments: 1993-1999‘JCOPE2’assimilated the data from only GTSPP
‘FRA-JCOPE2’assimilated the data fromGTSPP, WOD05, FRA-DATA
T
S

Comparison of snapshots‘JCOPE2’ ‘FRA-JCOPE2’
Inclusion of the additional in-situ data seems to intensify the horizontal temperature gradient associated with the Kuroshio front south of Japan.

Power spectra
Upstream region32N,132E,100m
Downstream region34N,138E,100m
Intensified
Around the upstreamregion, 100-day periodicvariation was enhanced.
Around the downstreamregion, 20-day periodicvariation was enhanced..

Wavelet spectra: 34N,138E,100m
The disturbances with the period shorter than 30 days were intensified.

Comparison of snapshotsJCOPE2
FRA-JCOPE2
The Kuroshio frontal waves with the intrusion were enhanced in FRA-JCOPE2.

Observed frontal waves1994.02.16-1994.03.02 1994.03.01-1994.03.16

Intensity of the 20-day variationJCOPE2 FRA-JCOPE2
RMSV of the filtered temperature time sequences at 100m. The time scale of the filter is shorter than 30 days.
The intensity of the variation was enhanced east of the Kii Peninsula.

Lag-correlation pattern analysis 34N,138EJCOPE2
FRA-JCOPE2
0 day +10 day-10 day
The waves with 400km scale with the warm water intrusions were enhanced.
400km

SummaryWe have created a new version of the gridded data of temperature (FRA-JCOPE2), salinity, horizontal velocities, and sea surface height with horizontal resolution of 1/12 , degree using a data-assimilative ocean model.
We investigated the sensitivity of including in-situ observations on the quality of the ocean reanalysis with an emphasis on the Kuroshio frontal variability south of Japan.
By increasing the number of the in-situ hydrographic profiles, more enhanced Kuroshio front variations with approximately 20 days time scale were reproduced south of Japan.
The enhanced features exhibited the wavelike disturbances east of the Kii Peninsula with the wave length of 400 km and considerably affected coastal areas through the consequent warm water intrusion.
The assimilation of operational in-situ observations in coastal regions south of Japan is effective to capture the Kuroshio frontal variability.
.

Global in-situ observation network
FRA-DATA have been reported to the Global Telecommunication Systems in real-timefrom April 2007. FRA-DATA are enhancing the real-time in-situ monitoring network around .Japan.
We suggest the complementally roles of in-situ observations in the nearshore regions(FRA-DATA) and in the open oceans (ARGO)
BATHY/TESAC points reported in January 2010 (JMA website)

Hierarchy of Kuroshio frontal variability How predictable/observable?
Mesoscale(Kimura and Sugimoto, 1993)
(Kimura and Sugimoto, 1993)
(Kimura and Sugimoto, 1993)
Submesoscale(Capet et al., 2008)
…
Horizontal scale
400km 200km 100km 10km …
Timescale
20-30 days 10 days 5 days 1 day …
Verticalscale
~1000m ~ 1000m ~ 1000m ~ 100m …
Dominatedbalance
Geostrophic ? ? Semi-geostrophic
…
Observation FRA-DATA Satellite SST
SatelliteSST
SatelliteSST
…
MODIS Ocean Color
FRA-JCOPE2 Reanalysis Data Set

Kuroshio warm water intrusions
By examining the high-resolution, operational SST data obtained by the ferry ship cruises, Kasai et al. (1993)found two types of the intrusions:
1.The intrusion associated with the Kuroshio frontal waves of 20-day period.
2. The intrusion occurring when the Kuroshiomeandering path fluctuates around the Izu-Ogasawara Ridge with 50-day period
20-DAY
50-DAY
Izu-Ogasawara Ridge
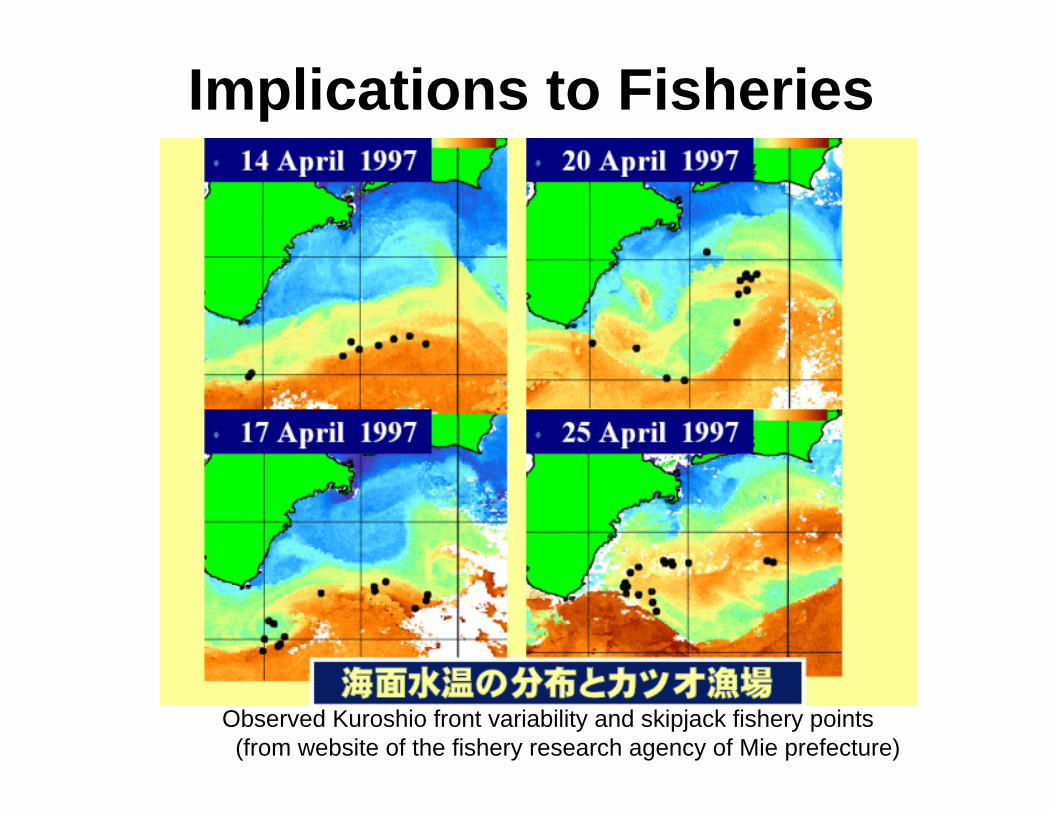
Implications to Fisheries
Observed Kuroshio front variability and skipjack fishery points(from website of the fishery research agency of Mie prefecture)

Revision: FRA-DATA
So far, the target phenomena of FRA-DATA south of Japan have been unclear.
But now we suggest that the target phenomena of FRA-DATA is the Kuroshio frontalwaves with the time scale of 20 days and the spatial scale of 400km.
If FRA people wish to re-organize the FRA-DATA network south of Japan, this Information may be useful for the policy making of FRA.

Implications to Marine BiologyJCOPE2 FRA-JCOPE2

Downscaled Kuroshio variationKimura and Sugimoto (1993)
Suggest the frontal waves withshorter time scales.
↓Hinata et al. (2005) indicated the short term fluctuation strongly affected the wind forcing.
22-26 Dec. 2000 27-31 Dec. 2000 1-5 Jan. 2001

Mesoscale to Submesoscale transition
(Capet et al., 2008)
12km 6km
1.5km 750m
Ideal OffCalifornia CurrentSystem
Simulated by ROMS

East-West Contrast of dynamicsUpstream region32N,132E,100m
Downstream region34N,138E,100m
Consistent with
1.Large available potential energy APE east of the Kii Peninsula (136E)
APE ~ (L0/R0) (h0/H)/2 (Oey, 1988)L0: cross-stream distance of the main flow axis from the coastR0: Rossby internal deformation radiush0: main thermocline depthH: ocean basin depth
L0 is larger east of the Kii Peninsula than west.
2. Intensified kinetic energy of the main stream east of the Kii Peninsula due tothe geostrophic hydraulic jump (Miyama and Miyazawa, 2010)

3-D Variational AssimilationMinimize a cost function:
fXX State variables: Temperature and salinity, 0m 1500m, 24 levels
First guess: Model forecast + GDEM Climatology Temperature/salinity profile dataSea surface height anomaly dataSea surface temperature data
oS
oT yy ,
oyηoTs
y
∑=
+=12
1iEOFii
fi
XCXX α Control variables are amplitudes of T-S coupling EOF modes
Background error covariance matrix B
)()())(())((
)()()()()()()(
1
1
11
1
XHyRXHyXHyRXHy
XHyRXHyXHyRXHyXXBXXXJ
SSTSSTo
SSTt
SSTSSTo
SSHASSHAo
SSHAt
SSHASSHAo
SSSt
SSo
TTo
Tt
TTo
ftf
−−+−−+
−−+−−+−−=
−
−
−−
−

Incremental Analysis Update
ForecastForecastForecast
IAU IAU
Data Data
IAUperiod
IAUperiod
3.5days 3.5days3.5days
7days 7days
IAU
Data
TTTPhysics
dtdT dayobs
fa
Δ−
+=)( _ Time
Constant7days
(Bloom et al. 2000)

MAY 1997JCOPE2 FRA-JCOPE2

144E line: MAY 1997
In-situ observation
JCOPE2
FRA-JCOPE2

Power Spectra : deeper levels500m 1000m
Downstream region34N, 138E

Power Spectra : upstream region32N, 132E, 100m 32N,133E, 100m
32N, 132E, 500m

Wavelet spectra: 32N,132E,100m
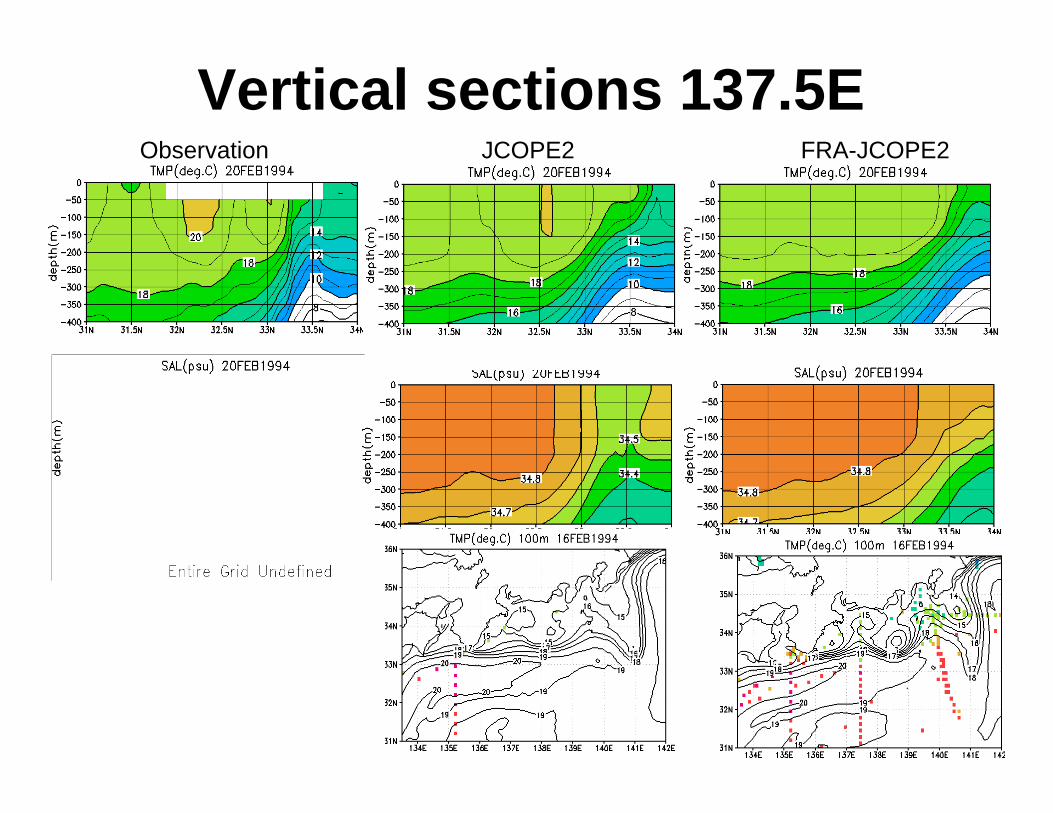
Vertical sections 137.5EObservation JCOPE2 FRA-JCOPE2

Vertical sections 138.5E