Embed Size (px)
Citation preview

University of Central Florida University of Central Florida
STARS STARS
Electronic Theses and Dissertations, 2004-2019
2008
Role Of Transient Receptor Potential Canonical-6 (trpc6) Channel Role Of Transient Receptor Potential Canonical-6 (trpc6) Channel
In Metastasis Of Glioblastoma Multiforme In Metastasis Of Glioblastoma Multiforme
Rajarajeshwari Venkataraman University of Central Florida
Part of the Cancer Biology Commons, Microbiology Commons, Molecular Biology Commons, and the
Oncology Commons
Find similar works at: https://stars.library.ucf.edu/etd
University of Central Florida Libraries http://library.ucf.edu
This Masters Thesis (Open Access) is brought to you for free and open access by STARS. It has been accepted for
inclusion in Electronic Theses and Dissertations, 2004-2019 by an authorized administrator of STARS. For more
information, please contact [email protected].
STARS Citation STARS Citation Venkataraman, Rajarajeshwari, "Role Of Transient Receptor Potential Canonical-6 (trpc6) Channel In Metastasis Of Glioblastoma Multiforme" (2008). Electronic Theses and Dissertations, 2004-2019. 3714. https://stars.library.ucf.edu/etd/3714

ROLE OF TRANSIENT RECEPTOR POTENTIAL CANONICAL-6 (TrpC6)
CHANNEL IN METASTASIS OF GLIOBLASTOMA MULTIFORME
By
RAJARAJESHWARI VENKATARAMAN B.Sc. Mysore University, India, 1996
M.Sc. Maniple Academy of Higher Education, India, 1999
A thesis submitted in partial fulfillment of the requirements
For the degree of Master of Science
In the Department of Molecular Biology and Microbiology
In the Brunet School of Biomedical sciences
In the College of Medicine
At the University of Central Florida
Orlando, Florida
Fall Term
2008

ii
ABSTRACT
Glioblastoma multiforme (GBM) is one of the extremely fatal brain tumors. The main reason
that makes it so lethal is its capability to invade and spread to other parts of CNS producing
secondary tumors. Among other factors hypoxia, reduced oxygen availability, is linked to higher
metastatic potential of cancers. Hypoxia causes numerous changes in genome and proteome of
the cell. These changes help a normal cell to adapt to nutritional deficiency, but the same
changes can increase the malignancy and metastasis in tumor cells. Extensive research by a
number of curious scientists reveal that various pathways involving numerous proteins cross-talk
and interact with each other and execute a response to hypoxia. We are trying to establish the
link between two such pathways – HIF1-alpha pathway and Notch pathway. Both, HIF1-alpha,
which is a transcription factor that becomes active in hypoxic conditions and Notch, which is an
evolutionarily conserved cell-fate determinant, are implicated in hypoxia-induced metastasis of
cancer. In this given project, we confirm the cross talk between Notch and HIF1-alpha pathway
and further continue our study to show that TrpC6 is the downstream mediator of this pathway,
leading to metastasis of GBM. Expression analysis of hypoxia-induced U373 cells (Grade 3
glioblastoma cells), using Real-time PCR, western blot and immunocytochemistry, revealed
elevated levels of Notch, Hif1 and TrpC6 indicating that these proteins might be important for
the cellular response to hypoxia. Blocking Notch and/or HIF1-alpha, either by DAPT or HIF1-
inhibitor, confirmed the communication between these two pathways. Role of TrpC6 in

iii
metastasis was demonstrated by knocking down this gene using siRNA against TrpC6. Inhibition
of TrpC6 markedly decreased cell proliferation, migration, angiogenesis and tumorigenesis in
these hypoxia-induced Glioblastoma cells. In summary, all these results reveal that TrpC6 is
indeed an important member of the Notch-mediated metastasis of Glioblastoma under hypoxic
conditions. This role of TrpC6 can therefore be utilized for pharmacological intervention to
prevent hypoxia-induced metastasis in GBM.

iv
Dedicated to my family and friends
Your support, confidence and love carried me

v
ACKNOWLEDGMENTS
I would like to thank God Almighty for allowing me the privilege and opportunity to
obtain higher education. I thank Dr. Kiminobu Sugaya, for giving me the opportunity to conduct
research in his lab. His commitment to training students, dedication to biomedical research and
high standards has guided me throughout my graduate career. I would also like to thank my
committee members, Dr. Sic.L.Chan, Dr. Steven Ebert and Dr. Dinender Singla, for their
assistance in completion of my thesis and encouragement. Special thanks go to my spouse
Sathyashankar Somasekar for his patience and understanding.
I would like to recognize Dr. Srinivas for assistance and guidance with the project.
Sincere thanks goes to all my lab sisters and brothers, especially Stephanie, Serene, Rasha and
Manny. To my children Shankari and Vignesh, I thank you for providing me with unconditional
love and motivation. Finally I would like to thank my Parents and my family members, you
have made it possible. I love you all.
vi
TABLE OF CONTENTS
LIST OF FIGURES ..................................................................................................................... viii LIST OF TABLES ......................................................................................................................... ix
LIST OF ABBREVIATIONS ......................................................................................................... x CHAPTER 1: INTRODUCTION ................................................................................................... 1
1.1 Glioblastoma Multiforme – Background and pathophysiology............................................ 5 1.2. Signs and Symptoms of the disease ..................................................................................... 6
1.3. Treatment ............................................................................................................................. 6 1.4 Molecular Genetics of GBM ................................................................................................. 7
1.5 Metastasis .............................................................................................................................. 9 1.6 Hypoxia and Metastasis ...................................................................................................... 11 1.7 Research in our lab.............................................................................................................. 12
1.8 Hypoxia Induced Factor 1 ................................................................................................... 12 1.8.1 HIF-1 – Structure and Function ................................................................................... 12
1.8.1A Structure of HIF1: ................................................................................................. 12 1.8.1B Regulation of alpha subunit: ................................................................................. 13 1.8.1C Function of HIF1: .................................................................................................. 14
1.8.2 Role of HIF-1 in Cancer .............................................................................................. 14 1.9 Notch ................................................................................................................................... 15
1.9.1. Structure and Function ................................................................................................ 15 1.9.1A Structure of notch protein: .................................................................................... 15
1.9.1B Processing of notch protein: .................................................................................. 16 1.9.1C Functions of Notch Protein: .................................................................................. 16
1.9.2. Role of Notch in Cancer: ............................................................................................ 17 1.10 TrpC6 ................................................................................................................................ 20
1.10.1 Structure and function of TrpC6 channels ................................................................. 20
1.10.1A Structure of TrpC6: ............................................................................................. 20 1.10.1B Function of TrpC6: .............................................................................................. 21
1.10.2 Role of TrpC6 in Cancer ............................................................................................ 21 1.11 Hypothesis......................................................................................................................... 22 1.12 Aims of the project............................................................................................................ 23 1.13 Experimental design.......................................................................................................... 23
1.13.1 Aim 1: Expression of Notch, TrpC6 and Hif-1 increases during hypoxia ................ 23 1.13.2 Aim 2: HIF1 and Notch pathways crosstalk under hypoxia ...................................... 24 1.13.3 Aim 3: TrpC6 acts as the downstream effector of Notch and HIF1 and is responsible
for the effect of these proteins on metastasis of Glioblastoma. ............................................ 25 CHAPTER 2: MATERIALS AND METHODS .......................................................................... 26
2.1 Cell Culture – .................................................................................................................. 26 2.2 Inducing Hypoxia –......................................................................................................... 26 2.3 Treatment with DAPT/HIF1-Inhibitor – ......................................................................... 26

vii
2.4 siRNA transfection –....................................................................................................... 27 2.5 RNA extraction and Reverse Transcription – ................................................................. 27 2.6 Quantitative Real-Time Polymerase Chain Reaction – .................................................. 28 2.7 Western Blots – ............................................................................................................... 29
2.8 Immunocytochemistry – ................................................................................................. 29 2.9 Cell migration assay – ..................................................................................................... 30 2.10 In-vitro tube morphogenesis on Matrigel – .................................................................. 31 2.11 MTT assay for cell proliferation – ................................................................................ 32 2.12 Soft Agar Colony formation assay – ............................................................................. 32
2.13 Brdu-Incorporation assay - ........................................................................................... 33 CHAPTER 3: RESULTS AND DISCUSSION ............................................................................ 34
3.1 Expression of Notch, HIF1-alpha and TrpC6 increases in U373-MG and GBM primary
culture cells under hypoxic conditions: ................................................................................ 34 3.2 Hypoxia-induced response of Notch involves cross talk with the HIF1 pathway: ......... 36 3.3 TrpC6 is the downstream mediator of Notch-mediated pathway: .................................. 38
CONCLUSIONS........................................................................................................................... 45 REFERENCES .............................................................................. Error! Bookmark not defined.

viii
LIST OF FIGURES
Figure 1: Brain – General features .................................................................................................. 2
Figure 2: Glioblastoma Multiforme ................................................................................................ 5 Figure 3: Genes responsible for development of primary and secondary glioblastoma ................. 8 Figure 4: Schematic representation of structure if HIF1 .............................................................. 14 Figure 5: Structure of Notch ......................................................................................................... 17 Figure 6: Animation depicting Notch processing ......................................................................... 19
Figure 7: Structure of TrpC6 channels.......................................................................................... 21
Figure 8: Transwell insert for migration assay ............................................................................. 31 Figure 9: Expression analysis of Notch, HIF1 and TrpC channels............................................... 35 Figure 10: Effect of CoCl2, DAPT and HIF1-Inhibitor on the expression of Hif1, NICD and
TrpC6: ........................................................................................................................................... 37 Figure 11: Test for siRNA transfection efficiency: ...................................................................... 38
Figure 12: Invasion/Migration assay: ........................................................................................... 40 Figure 13: In-Vitro tube morphogenesis on matrigel: .................................................................. 41 Figure 14: MTT assay ................................................................................................................... 42
Figure 15: Brdu-incorporation assay ............................................................................................ 43 Figure 16: Soft agar colony formation assay ................................................................................ 44
Figure 17: Schematic representation of projected pathway for notch response to hypoxia in
cancer cells .................................................................................................................................... 46
ix
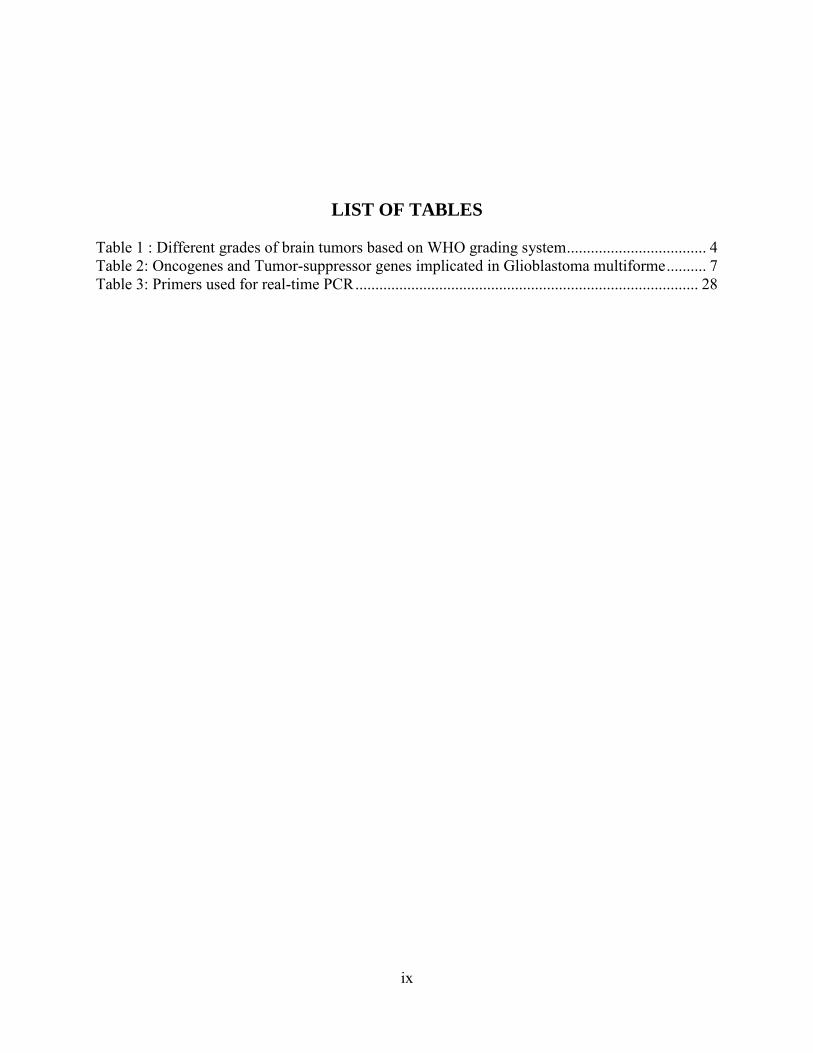
LIST OF TABLES
Table 1 : Different grades of brain tumors based on WHO grading system ................................... 4
Table 2: Oncogenes and Tumor-suppressor genes implicated in Glioblastoma multiforme .......... 7 Table 3: Primers used for real-time PCR ...................................................................................... 28
x
LIST OF ABBREVIATIONS
1. TRPC = Transient Receptor Potential Canonical ion channel
2. NICD = Notch intracellular domain
3. NECD = Notch extracellular domain
4. HIF1 = Hypoxia induced factor-1
5. GBM = Glioblastoma Multiforme
6. CNS = Central nervous system
7. HREs = HIF1 responsive elements
8. VEGF = Vascular Endothelial Growth Factor
9. EMT = Epithelium-Mesenchyme transition
10. DAPT = N-[N-(3,5-Difluorophenacetyl)-L-alanyl]-S-phenylglycine t-butyl ester
11. CoCl2 = Cobalt chloride
12. DMEM = Dulbecco's Modified Eagle Medium
13. siRNA = Small interfering RNA

1
CHAPTER 1: INTRODUCTION
Nervous system is a complex, intricate system of neuronal and non-neuronal supporting cells that
defines what we are. It is a communication system that can receive and send out a lot of
information simultaneously, thus orchestrating all the bodily functions. Human nervous system is
divided into Central nervous system and peripheral nervous system1. Central nervous system
again consists of two main components namely the Brain and the Spinal cord. Peripheral nervous
system is composed of nerves that connect CNS to peripheral structures such as muscles, glands,
etc. Structurally, brain is comprised of 1
1. Brainstem: Medulla oblongata, Pons, Midbrain – Contains ascending and descending
tracts which convey information to and from forebrain or cerebellum.
2. Hindbrain: Cerebellum – Controls fine motor activities and involuntary movements.
3. Forebrain: Diencephalon and the Cerebral hemispheres – Diencephalon contains
Thalamus, hypothalamus, epithalamus and other associated structures. Thalamus acts as a
relay station for all the sensations except olfaction. It receives these inputs and relays it to
specific part of the cerebral hemisphere. Each cerebral hemisphere contains three major
subdivisions including cerebral cortex, subcortical white matter and basal ganglia.
Lying in the core of the forebrain and brainstem are a series of fluid-filled spaces known as
ventricles1. These ventricles are lined by ependymal cells which secrete the Cerebrospinal Fluid
(CSF) that is seen circulating within these cavities. Adjoining these ventricles we can see the
presence of multi potent Stem Cells which help in the partial replacement of dead brain cells.
Owing to the fact that brain in very soft and fragile, it is covered by three protective tissue layers,
collectively called Meninges1. Brain is also surrounded by a protective bony covering known as

2
the Skull. From outside to inside, the three meninges are - Dura mater, Arachnoid mater and Pia
mater. These meninges also extend to cover the spinal cord and part of cranial nerves.
Cranial nerves originate from nuclei present the brain. These nerves could be sensory, motor or
both. 12 pairs of cranial nerves arise from the brain1. The first cranial nerve (Olfactory nerve)
originates from the basal surface of the brain. Others can be seen arising from the brainstem.
Figure 1: Brain – General features
A – Components of central nervous system
B – Ventricles of the brain
C – Meninges of the brain
D – Cranial nerves
A B
C D

3
Endocrine glands including Pituitary and Pineal can be seen closely associated with the brain.
Pituitary is the master of all endocrine glands because it controls their activity. Its activity in turn
is closely controlled by hypothalamus1. Pineal gland, which promotes sleep by producing
melatonin, is also controlled by hypothalamus.
Normal functioning of the brain is vital for the maintenance of a healthy lifestyle. However, the
nervous system is also invariably vulnerable to diseases and injuries. One such condition is
neoplasm of the brain, also known as tumor. A tumor is a mass of abnormally growing cells.
Tumors of the central nervous system, brain tumors, can occur in the brain or any structure
associated with the brain, including cranial nerves, meninges, skull, pituitary and pineal gland.
Brain tumor death accounts for almost a quarter of deaths resulting from cancer in children (19
years of age)2. The incidence of all primary tumors (over 120 different types) in the USA is 14
per 100,000 people3.
Brain tumors can be classified as
Primary or Secondary: Primary tumors originate in the brain itself while the secondary
tumors spread from cancers primarily located in other organs (metastatic tumors)4.
Benign or Malignant: Benign tumors do not spread while malignant tumors can invade
and spread to other parts of the CNS or sometimes even to the adjoining lymph nodes4.
Gliomas or Non-gliomas: A glioma arises from glial cells. Non-gliomas could arise from
optic nerve, pituitary gland, pineal gland, ependymal cells or primitive cells left over
from early development of CNS4, 5
.

4
The main types of gliomas are4, 5
:
Ependymomas — Arise from ependymal cells
Astrocytomas — Arise from astrocytes
Oligodendrogliomas — Arise from oligodendrocytes
Mixed gliomas, such as oligoastrocytomas, contain cells from different types of glia.
Gliomas are further categorized according to their grade, Low-grade or High-grade. The criteria
for grading include microscopic appearances, malignancy level, growth rate, vascularity and
similarity to normal cells. The most commonly used grading system is the World Health
Organization (WHO) grading system6 (Table 1).
Table 1 : Different grades of brain tumors based on WHO grading system
Criteria GRADE 1 GRADE 2 GRADE 3 GRADE 4
Microscopic
appearance
Normal Slightly
abnormal
Abnormal Very abnormal
and have necrotic
tissue.
Malignancy Least May invade
surrounding
tissue
Invade
surrounding
tissue.
Invade wide
areas of
surrounding
tissue.
Growth rate Slow Faster that
Grade1
Fast Rapid
proliferation
Recurrence None May recur as
grade 2 or higher
Frequently recur
as grade 4.
Frequently recur
as grade 4.
Example Pilocytic
astrocytoma
Diffuse or low-
grade
astrocytoma
Anaplastic
astrocytoma
Glioblastoma
Multiforme.
5
1.1 Glioblastoma Multiforme – Background and pathophysiology
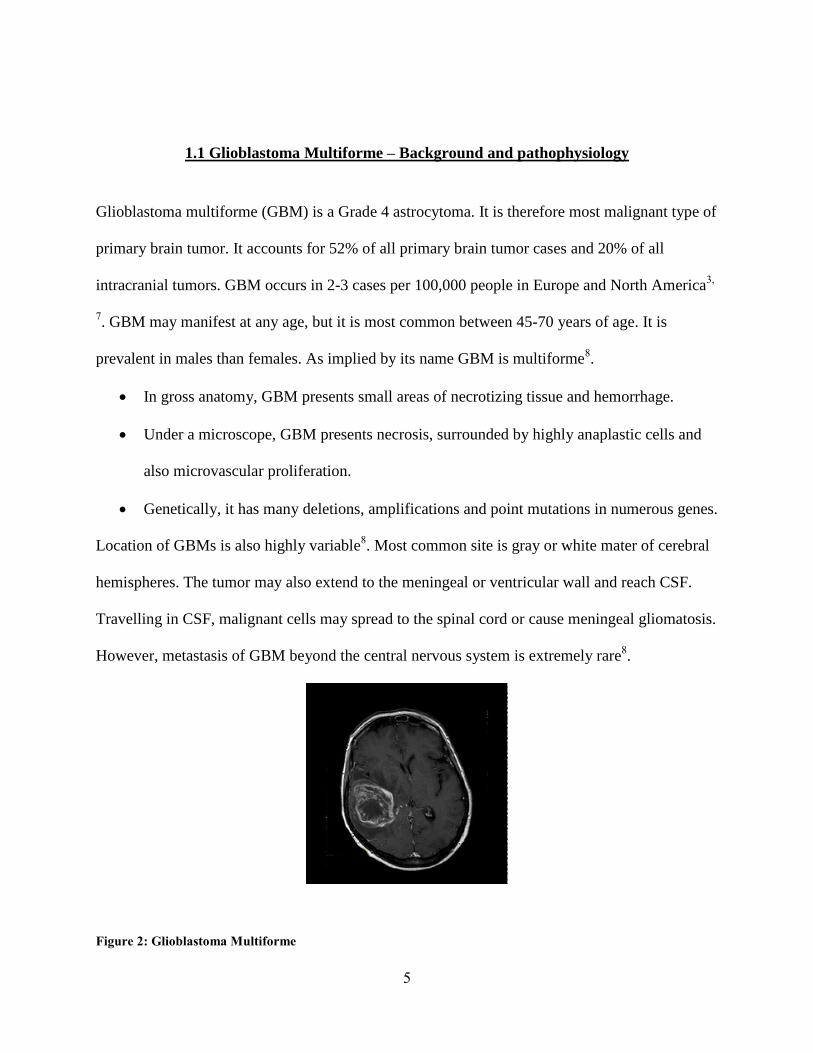
Glioblastoma multiforme (GBM) is a Grade 4 astrocytoma. It is therefore most malignant type of
primary brain tumor. It accounts for 52% of all primary brain tumor cases and 20% of all
intracranial tumors. GBM occurs in 2-3 cases per 100,000 people in Europe and North America3,
7. GBM may manifest at any age, but it is most common between 45-70 years of age. It is
prevalent in males than females. As implied by its name GBM is multiforme8.
In gross anatomy, GBM presents small areas of necrotizing tissue and hemorrhage.
Under a microscope, GBM presents necrosis, surrounded by highly anaplastic cells and
also microvascular proliferation.
Genetically, it has many deletions, amplifications and point mutations in numerous genes.
Location of GBMs is also highly variable8. Most common site is gray or white mater of cerebral
hemispheres. The tumor may also extend to the meningeal or ventricular wall and reach CSF.
Travelling in CSF, malignant cells may spread to the spinal cord or cause meningeal gliomatosis.
However, metastasis of GBM beyond the central nervous system is extremely rare8.
Figure 2: Glioblastoma Multiforme
6
1.2. Signs and Symptoms of the disease
In general, the symptoms may include headaches, personality changes, nausea and vomit. Based
on the site of the tumor, symptoms such as sensory loss, visual loss, hemi paresis, etc can occur.
Seizures can also occur in some patients9. Glioblastomas can be classified as primary or
secondary. Primary or de novo type of GBM affects older adults, especially older than 50 years
of age. The cells are small, undifferentiated and highly proliferative. Secondary GBMs usually
affect younger population (<45 y). It develops from a pre-existing low-grade astrocytoma or
anaplastic astrocytoma10
.
1.3. Treatment
The complex character of the cancer makes it non-responsive to treatments. Diminished self-
repairing capacity, increased susceptibility to damage and protection by blood-brain barrier
makes brain a tough target for therapy. Treatment for GBM is therefore very difficult. Standard
treatments for brain tumors include surgery, radiation therapy and chemotherapy used either
individually or in combination.GBM, in most cases is not completely curable. Therefore, the
goals of treatment are to9:
Eradicate as many tumor cells as possible by surgically removing the tumor.
Use radiation and chemotherapy to destroy as many as possible of the cells still
remaining.
Use radiation and chemotherapy to put remaining tumor cells in a dormant state for as
long as possible.

7
Treatments of primary brain tumors focuses on improving neurologic function (Symptomatic
therapy) and also improve quality of life (Palliative therapy)4. Harsh reality of GBM is that it is
well-known to re-grow8. Thus, being disease-free for long is very unlikely. Usually, the tumor
again develops at the same site or within 2 cm of the original site. Recommended treatment for
such recurrence is extensive surgery and intense local treatment8.
1.4 Molecular Genetics of GBM
There are various reasons which are responsible for transformation of normal cell to cancerous
state. Genetically speaking, there are three groups of genes that exhibit this potential of inducing
cancerous nature to cells10, 11
. They include oncogenes, tumor suppressor genes, and mutator
genes. Oncogenes promote cell proliferation, tumor-suppressor genes inhibit cell proliferation
and mutator genes promote mutations of genes because under normal conditions, these genes
ensure DNA replication and genome integrity10
. Oncogenes and tumor-suppressor genes, whose
abnormal functioning are implicated in glioblastoma multiforme and shown in Table-210
.
Table 2: Oncogenes and Tumor-suppressor genes implicated in Glioblastoma multiforme
# Gene Protein Normal Function Gene type 1 EGFR EGFR Tyrosine kinase receptor Oncogene
2 N-ras Ras Affects cyclin D/E complex Oncogene
3 c-myc c-myc Regulates Cdk4/6 complex Oncogene
4 CDK4 Cdk4 Active in proliferation cells Oncogene
5 PDGFR-α PDGFR Tyrosine kinase receptor Oncogene
6 MDM2 Mdm2 Inhibits p53 transcriptional
activity
Oncogene
7 H-ras Ras Stimulates signal transduction Oncogene
8 TSC-22 TGF-β Modulates p15, fibroblast
mitogen
Oncogene
9 TP53 p53 Induces transcription of MDM2
Tumor suppressor gene
10 CDKN2A/p16 p16 Cdk4 inhibitor Tumor suppressor gene
11 PTEN PTEN Dephosphorylates PIP3 Tumor suppressor gene
12 RB1 PRBl Binds to E2F/DP1 transcription factors
Tumor suppressor gene

8
Figure 3: Genes responsible for development of primary and secondary glioblastoma10
Less frequent but more malignant mutations include the following12
:
• MMAC1-E1, MAGE-E1, NRP/B
• Additional genetic alterations in primary glioblastomas include p16 deletions, p16INK4A
and retinoblastoma (RB) gene protein alterations.
Neural Progenitor cell
Astrocyte
Oligodendrocyte
PRIMARY OR
DE-NOVO
Glioblastoma
LG Astrocytoma
Anaplastic
Astrocytoma
LG Oligodendroglioma
Anaplastic
Oligodendroglioma
EGFR, MDM2, PTEN, P16, RB
TP53, PDGFR,
LOH
RB, LOH, CDK4,
P16
PTEN, PDGFR
LOH
P16
LOH,
EGFR
9
1.5 Metastasis
Metastasis is a complex process causing the spread of a disease from one part of the body to
another. The important steps involved in the metastatic cascade are11, 13
–
1. Detachment13
– As the tumor enlarges, it presses the surrounding structures and blood
vessels. As a result, the space for the tumor regresses and the cells begin to detach. This
process involves down-regulation of E-Cadherin and its switch to N-Cadherin, thereby
reducing cell-cell contact.
2. Invasion13
– The cells that detach from the primary tumor, try to enter the surrounding
lymphatic vessel or vessel. In order to do this, the cells have to penetrate the basement
membrane. The basement membrane is a specialized layer of extracellular matrix that
acts as a barrier for movement of cells from away from their sites of origin. This barrier
is however broken by the cancer cells by secreting several different types of enzymes.
Once inside the vessel, the cells can either colonize there itself or migrate to other places
via blood or lymph.
3. Survival in transport13
– The cells now have to face the challenge of surviving the travel
in the vessels. The main factor posing challenge is the immune system. In order to evade
the body’s immune system, the cancer cells take up many routes. Some of them
include13
o Decreased expression of MHC, which prevents detection by APC.
o Secretion of immunosuppressive factors such as TGF-β that can suppress T-cell
proliferation.
10
o Release of intracellular adhesion molecules, thereby preventing association of T-
cell with APC.
o Developing variants with no recognizable structures.
4. Arrest in distant-organ capillary bed13
– Now that the cells have successfully travelled in
the blood stream, its next intention is to adhere to the microcirculation of a target organ.
In order to do this, the cells secrete some chemicals which attract platelets, thus
surrounding the cancer cells. This produces a sticky mass that can attach to the blood
vessel wall. The site of secondary attachment is dependent on the chemo-attraction
between the cancer cells and the site of interest.
5. Angiogenesis11
– The cells that attach to the endothelial wall of blood vessels break
through this wall and enter the secondary site. Here the cells need extra blood supply to
establish well. This process of formation of new blood vessels is known as
Angiogenesis. The tumor cells secrete many growth factors that enable angiogenesis.
Vascular endothelial growth factor (VEGF) is one such growth factor that attracts
vascular cells that begin to migrate toward the tumor. The vascular cells eventually form
new blood vessels within the tumor, providing ample supply required for growth and
survival of cancer cells.
6. Tumerogenesis13
– The cells are now fully equipped. They have a new site and new
blood vessels with amble blood supply. Therefore, the cells start proliferating and
produce secondary tumors. This process is known as tumorigenesis.
11
1.6 Hypoxia and Metastasis
GBM is highly metastatic. Hypoxia, among others, is an important factor that can enhance
metastasis. Tissue hypoxia may result from many mechanisms. Some of them include14
–
The oxygen tension in the arteries may reduce due to diseases of the lung or even high
altitude (hypoxemic hypoxia).
The oxygen-carrying capability of the blood cells may reduce due to anemia or carbon
monoxide poisoning (anemic hypoxia).
Blockage of the circulatory system components may result in reduced tissue perfusion.
The cells may be unable to utilize the available oxygen due to intoxication, as in cyanide
poisoning.
Some of the reasons for hypoxia in tumor cells include15
–
Increased demand for oxygen due to rapid and uncontrolled proliferation of tumor cells.
Reduced interstitial pressure which is caused due to poor lymphatic drainage in tumor
cells leads to collapse of blood vessels and also reduced pH.
Severe structural abnormalities of tumor microvessels and disturbed microcirculation.
The fact that the regulatory processes are compensated in tumor cells, the changes caused in
these cells due to hypoxia are profound. Hypoxia affects two venues, proteome and genome14
,
and enables the normal cells to adapt to nutritional deficiency but at the same time, it can also
render the tumor cells malignant. Hypoxia stimulates the transcription of many genes including
glycolytic enzymes, glucose transporters, angiogenic molecules, survival and growth factors,

12
enzymes, proteins involved in tumor invasiveness, chaperones, and other resistance-related
proteins. At the same time, hypoxia can inhibit genes like for cell-surface integrins facilitating
tumor cell detachment14
. Sustained hypoxia could result in a more clinically aggressive
phenotype16-20
, increased invasive potential21, 22
, and also augmented regional and distant tumor
cell spreading17, 18, 23-25
. At the same time, the cancer can grow resistant to radiation or other
treatments26-34
.
1.7 Research in our lab
Many curious scientists have explored the effect of hypoxia in normal as well as tumor cells.
These explorations have revealed involvement of many important genes and proteins14
. The
research in our lab and this project in particular focuses on the three such proteins involved in the
hypoxia-induced metastasis of Glioblastoma multiforme, namely HIF1, Notch and TrpC6.
1.8 Hypoxia Induced Factor 1
Hypoxia-induced factor 1 (HIF1) is a highly conserved transcriptional complex that is expressed
in almost all oxygen-breathing organisms. It is an important component of the multi-level
regulatory system that is devoted to oxygen homeostasis in local as well as a systemic level in a
variety of physiological, developmental and pathological conditions.
1.8.1 HIF-1 – Structure and Function
1.8.1A Structure of HIF1:
HIF-1 is a heterodimer14
. It has two subunits – alpha and beta (Fig-3). The beta subunit is
constitutively expressed, while the expression of the alpha subunit is oxygen-regulated. HIF-1
13
belongs to the PER-ARNT-SIM (PAS) subfamily of the basic-helix-loop-helix (bHLH) family of
transcription factors. The alpha-subunit contains an oxygen-dependent degradation (ODD)
domain. This domain allows hydroxylation by proline-hydroxylase-2 (PHD-2)35
. In addition,
HIF-1 alpha subunit contains two transactivation domains (TAD) which regulate HIF-1 target
genes. Two known transcription co-activators, CREB binding protein (CBP) and p300, interact
with the transactivation domain at the C-terminal (C-TAD) of HIF-1 alpha. Both activators are
essential for HIF-1 transcription14, 35
. The beta subunit is identical to aryl hydrocarbon receptor
nuclear translocator (ARNT).
1.8.1B Regulation of alpha subunit:
When the oxygen level in the cell is normal (normoxia), the alpha subunit is prone to
degradation. Under normoxia, prolyl hydroxylase can hydrolyse the prolyl residues in the ODD
domain of the alpha subunit of Hif135
. This targets HIF1 to the E3 ubiquitin ligase leading to
degradation by the proteosome machinery. In hypoxic condition, the enzyme HIF1 prolyl
hydroxylase is inhibited by two ways35
–
In hypoxic conditions, Oxygen, which is a co substrate for this enzymatic reaction, is
depleted. This causes inhibition of the enzyme.
During hypoxia the electron transport chain in the mitochondria is affected. This leads to
accumulation of succinate which is also an end product of the HIF1 hydroxylation
reaction. Thus buildup of succinate in the cell inhibits the enzyme.

14
1.8.1C Function of HIF1:
Upon stabilization HIF-1 protein acts as a transcription factor. It binds to HIF - responsive
elements (HREs) in promoters that contain the sequence NCGTG and upregulates expression of
several genes thereby allowing the cell to survive in hypoxic conditions. The genes upregulated
by HIF-1 include glycolytic enzymes, growth factors and angiogenic molecules like vascular
endothelial growth factor (VEGF), angiotensin that help in angiogenesis14
.
Figure 4: Schematic representation of structure if HIF1
1.8.2 Role of HIF-1 in Cancer
One of the main reasons why cancer cells become malignant and intend to migrate to other areas
is the lack of nutrients and oxygen. Thus hypoxia is a driving force for malignancy and
tumorigenesis. HIF-1 acts as a sensor and responds to changes in levels of cellular oxygen. HIF1
promotes tumor invasion in two ways. It facilitates angiogenesis by inducing VEGF-A and
15
angiotensin-2. It also induces loss of E-cadherin expression via the lysyl oxidase – Snail
activation pathway, thereby allowing epithelium-mesenchyme transition (EMT)14, 35
.
1.9 Notch
Notch is an evolutionarily conserved cell surface receptor36
. The Notch gene was discovered in
1917 by Thomas Hunt Morgan. Knockdown of these gene resulted in a fruit fly with notches
apparent in their wing blades, thus the name. It is involved in a variety of cellular processes such
as cell fate specification, differentiation, proliferation, apoptosis, adhesion, etc36
.
1.9.1. Structure and Function
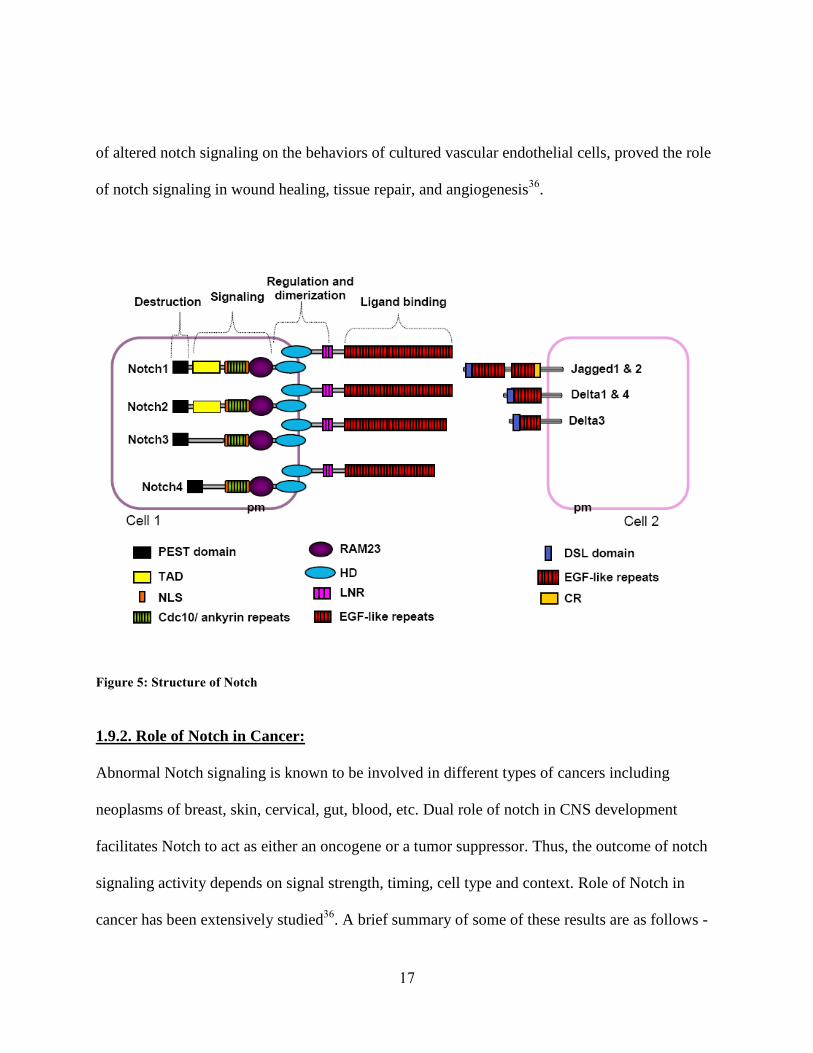
1.9.1A Structure of notch protein:
Notch is present in all metazoans. Four different isoforms, Notch1 to Notch4, are present in
vertebrates. These are type-1 receptors located in membranes (Fig.4)36
. They possess 2 domains
–a large extracellular domain (NECD) and a cytoplasmic domain (NICD). ECD takes part in
ligand binding while NICD is involved in signal transduction. ECD in turn presents numerous
EGF repeats for ligand binding interaction and an inhibitory LNR region. This region prevents
signal transduction in the absence of ligand. NICD possess protein interaction regions in the
form of RAM3 domain and 6 ankyrin repeats. It also has 2 nuclear localization signals, a
transcriptional activation domain (TAD) and a PEST sequence that negatively regulates protein
stability36
(Fig.4). The 4 isoforms of notch differ in the nature of TAD.

16
1.9.1B processing of notch protein:
Notch is synthesized in the endoplasmic reticulum as a 300 kD precursor. It undergoes 3 main
proteolytic steps before it becomes fully functional. The first cleavage S1 takes place during its
transport and processing in Golgi apparatus36, 37
. This step is catalyzed by the enzyme furin-
convertase. It cleaves Notch adjacent to the amino acid sequence RQRR in the extracellular
domain. After S1 cleavage the matured notch protein reaches the membrane. Delta, Serrate and
Lag-2 are some of the known ligands of notch37
. These are found in the membranes of the
adjoining cells. Binding of these ligands induce two subsequent cleavages of the notch protein.
The second, S2, cleavage occurs in the extracellular domain and is facilitated by TACE, also
known as ADAM17. Ligand binding also induces a third, S3, cleavage at the transmembrane
region. This cleavage is catalyzed by gamma -secretase enzyme complex whose activity is
dependent on presenilin-1. S3 cleavage results in release of notch intracellular domain(NICD)
which is the functional part of notch. NICD then migrates to the nucleus where it associates with
CSL transcription factors and acts as a transcriptional co-activator36, 37
(Fig.5).
1.9.1C Functions of Notch Protein:
Notch is functional during development and also adult life. During CNS development, Notch
determines the fate of progenitor stem cells by its interaction with fate determining proteins such
as numb and dab. Notch activity maintains a progenitor state in these stem cells and prevents
differentiation. However, in gliogenesis, notch has an instructive role36
.
Role of notch during somatogenesis, development of CVS and also during development of
endocrine glands such as pancreas is well established by various experimental evidences. Effect
17
of altered notch signaling on the behaviors of cultured vascular endothelial cells, proved the role
of notch signaling in wound healing, tissue repair, and angiogenesis36
.
Figure 5: Structure of Notch
1.9.2. Role of Notch in Cancer:
Abnormal Notch signaling is known to be involved in different types of cancers including
neoplasms of breast, skin, cervical, gut, blood, etc. Dual role of notch in CNS development
facilitates Notch to act as either an oncogene or a tumor suppressor. Thus, the outcome of notch
signaling activity depends on signal strength, timing, cell type and context. Role of Notch in
cancer has been extensively studied36
. A brief summary of some of these results are as follows -

18
Expression of Notch and its ligand increases in gliomas and are required for cell
proliferation and survival38
.
Notch promotes cell proliferation and formation of neural stem cell-like colonies in
glioma via its interaction with wnt pathway39
.
Inhibition of notch signaling markedly reduced epithelial-mesenchymal transition (EMT)
and invasion in glioma, while over expression of NICD increased these processes. This
effect of notch was through its direct or indirect control on expression of Snail-140
.
Notch was seen clustering with and also inducing expression of HIF1-alpha in MCF7
cells treated with estrogen. Therefore, Notch possibly induces HIF1 expression and
promotes angiogenesis41
.
Analysis with Notch-promoter specific reporter gene proved that HIF1-alpha, which is
stabilized in hypoxic conditions, induced expression of Notch and its downstream genes
in embryonic carcinoma cell line P1942
.
Factor Inhibiting HIF1-alpha (FIH-1) negatively regulates NICD by hydroxylating it at
residues N1945 and N2012. This interaction sequesters FIH-1, thereby promoting the
stabilization of HIF-1 in hypoxic conditions. In summary, under hypoxic conditions,
increased expression of notch increases HIF1-alpha functioning43
.

19
Figure 6: Animation depicting Notch processing
1. Notch precursor undergoes first cleavage, catalyzed by furin-convertase, during its
processing in the Golgi complex.
2. Mature Notch is transported to the membrane where it comes in contact with the ligands
such as Delta, Serrate or Lag-2.
3. Ligand binding induces the second cleavage catalyzed by TACE releasing the Notch
extra-cellular domain (NECD) which is engulfed by the adjoining cell for further
processing.
4. This is followed by a third cleavage catalyzed by gamma-secretase enzyme complex. The
result of the last two cleavages is the release of Notch intra-cellular domain (NICD).
5. NICD translocates to the nucleus where it binds to transcription factors like CSL and acts
as a co-activator resulting in the transcription of a number of genes.
20
1.10 TrpC6
Transient Receptor Potential channels are membrane bound ion channels. The TRP genes were
first identified in Drosophila, deficiency of which resulted in blindness by intense light. Trp
channels are divided into three broad groups44
. They are –
a) Transient Receptor Potential Canonical family (TrpC)
b) Transient Receptor Potential Vanilloid Receptor family (TrpV)
c) Transient Receptor Potential Melastatin family (TrpM)
TrpC channels are non-selectively permeable to cat ions, with a selectivity of calcium. Stimulus
for the channel is via phospholipase C and also diacylglycerol activation. TRPC channels
underlie the store-operated channels (SOC) observed in many cell types. These channels open
due to the depletion of intracellular calcium stores45
. TrpC family contains 7 members, TrpC1 to
TrpC7, which are further classified into 4 sub families based on structural and functional
similarities44
. These sub families are
TrpC1
TrpC2
TrpC3, TrpC6 and TrpC7
TrpC4 and TrpC5
TrpC6 is highly expressed in lung, placenta, ovary, spleen, brain, kidneys45
.
1.10.1 Structure and function of TrpC6 channels
1.10.1A Structure of TrpC6:
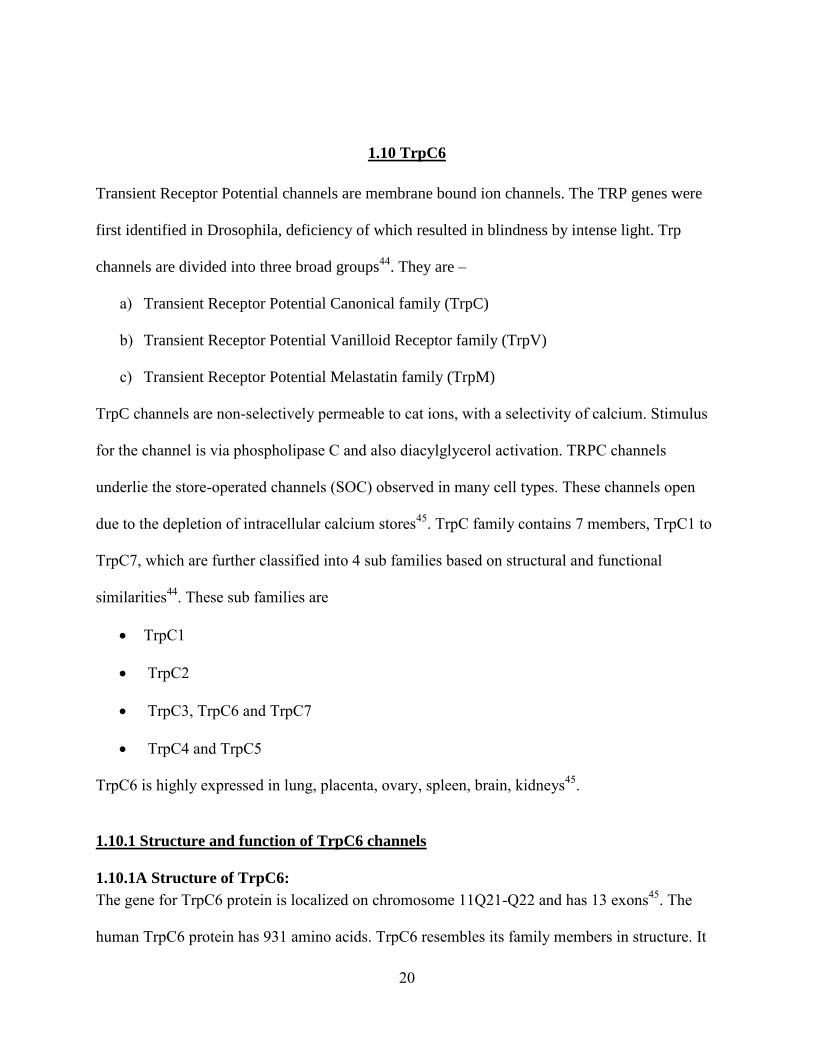
The gene for TrpC6 protein is localized on chromosome 11Q21-Q22 and has 13 exons45
. The
human TrpC6 protein has 931 amino acids. TrpC6 resembles its family members in structure. It
21
has intracellular N and C-terminals and six trans-membrane helices. The pore is predicted to be
formed between the 5th
and 6th
helices. It also presents two glycosylation sites (Asn473
; Asn 561
)
to ensure tightly receptor-operated activity of TrpC6. It has TRP box motif near the C-terminus
and 3 to 4 ankyrin repeats near the N-terminus. Many of the TrpC channel subunits are able to
co-assemble45
.
Figure 7: Structure of TrpC6 channels
1.10.1B Function of TrpC6:
Just like all TrpC channels, TrpC6 is also an ion channel, specific especially to calcium. TrpC6
plays an important role in regulation of vascular and pulmonary smooth muscle contraction.
They are also important in kidney podocytes. Functions of TrpC6 in other cell types still remain
elusive45
.
1.10.2 Role of TrpC6 in Cancer
TrpC6 expression increases in cancerous state, including glioma, breast cancer and human
hepatoma, compared to normal cells46, 47
.
PM
NH3+ COO
-

22
TrpC channels are required for cellular growth because blocking these channels hindered cell
cycle with defects in cytokinesis. Histopathological hallmarks of GBM such as Nuclear atypia
and cell enlargement were seen upon TrpC6 block46
.
TrpC6 is also shown to play an important role in angiogenesis and cell proliferation in cancer
cells. Angiogenesis depends on proliferation and migration of endothelial cells and endothelial
cell permeability. Angiogenic factors, such as VEGF, basic fibroblast growth factor, and platelet-
derived growth factor (PDGF) and calcium are involved in these steps of angiogenesis. TRPC6
being a calcium channel is involved in control of endothelial cell permeability. VEGF increases
intracellular calcium level and also vascular permeability by acting via TrpC6 channels46, 48
.
HIF1-alpha induces elevated expression of TrpC6 channels in hypoxic conditions. Loss-of-
function and gain-of-function studies with HIF1-alpha gene in pulmonary smooth muscle cells
proved that increased expression of TrpC6 observed in hypoxic conditions is controlled by HIF1
transcription complex49
.
TrpC6 channels facilitated calcium influx via store operated calcium entry in human hepatoma
cell lines causing increased cell proliferation. This was proved by overexpression and then by
siRNA knockdown of TrpC6 gene50
.
1.11 Hypothesis
In summary, the facts that linked these three proteins (HIF1, Notch and TrpC6) and lead us
towards our hypothesis are as follows –
HIF1 is expressed under hypoxic conditions which is prevalent in gliomas. HIF1 interacts with
Notch, thus reducing neuronal and muscular differentiation35, 51
.

23
Notch is highly expressed in cancer cells, including glioblastoma. Notch maintains stem cell
characteristics in cancer cells. Notch expression increases during hypoxia. Notch is required for
angiogenesis, cell proliferation and invasion40-42, 52, 53
.
TrpC channels are essential for angiogenesis and the growth of gliomas46, 47, 54
.
Based on these facts, we hypothesize that Notch promotes metastasis of Glioblastoma
multiforme under hypoxic conditions by acting through the TrpC6 channel.
1.12 Aims of the project
1. Expression of Notch, TrpC6 and HIF-1 increases during hypoxia.
2. HIF1 and Notch pathways crosstalk under hypoxia.
3. TrpC6 acts as the downstream mediator of Notch and HIF1 and is responsible for the
effect of these proteins on metastasis of Glioblastoma.
1.13 Experimental design
Lack of food and oxygen is very prevalent in cancer. Thus if we could study the function of the
proteins of our interest under hypoxic conditions, we could correlate that to their physiological
roles. Cobalt chloride is a chemical that mimics hypoxia in the cells. Thus we can use CoCl2 as
the stimulus during cell culture.
1.13.1 Aim 1: Expression of Notch, TrpC6 and Hif-1 increases during hypoxia
Our first aim is to determine whether there is any difference in the activity of Notch, HIF1 and
TrpC6 between normoxic and hypoxic conditions. The changes can be monitored at mRNA level
and also protein level. We will determine the expression levels of all the TrpC channels just to
24
ensure whether the downstream target is only TrpC6 or is it any of the TrpC channels. We will
also compare the expression changes in cancerous cells with non-cancerous cells to determine
the effect of hypoxia on metastasis.
Exp#1 – Induce hypoxia by treating the cells with Cobalt chloride and check the mRNA levels
of Notch and TrpC6 by doing quantitative real-time PCR.
Exp#2 – Do quantitative real-time PCR to check the mRNA expression levels of all the TrpC
channels under hypoxic conditions.
Exp#3 – Analyze the expression levels of Notch and TrpC6 in non-cancerous stem cells after
inducing them with Cobalt chloride by real-time PCR.
Exp#4 – Induce hypoxia by treating the cells with Cobalt chloride and check the changes in the
protein levels of Hif1, Notch and TrpC6 by western blotting and Immunocytochemistry.
1.13.2 Aim 2: HIF1 and Notch pathways crosstalk under hypoxia
Cross-talk between Notch and HIF pathway can be determined by activating/blocking one of
these pathways and checking for expression changes of the other pathway. NICD and Hif-1 can
be activated by inducing hypoxia by treating the cells with Cobalt chloride which mimics
hypoxia. Hif-1 can be inhibited by using the commercially available Hif1-inhibitors. NICD can
be inhibited by treating the cells with the gamma-secretase inhibitor DAPT. Effect of these
treatments on expression of TrpC6 would determine whether TrpC6 is indeed downstream of
Notch or HIF1.

25
Exp#1 – Treat the cells with DAPT and do western blot to detect the changes in expression of
NICD, HIF1 and TrpC6.
Exp#2 – Use the commercially available HIF1-Inhibitor on the cells to block the Hif1 pathway
and determine its effect on NICD and TrpC6 expression.
1.13.3 Aim 3: TrpC6 acts as the downstream effector of Notch and HIF1 and is responsible
for the effect of these proteins on metastasis of Glioblastoma.
Metastasis, which is the movement of the cancerous cells to a new location, involves many steps.
Four important steps involved in this process are – Invasion/Migration, Angiogenesis, Cell
proliferation and Tumorigenesis. Experimental evidences have already proved the importance of
Notch in the metastasis of cancer. In order to confirm our hypothesis that TrpC6 is indeed a
downstream effector of Notch, we will use the gene knockdown technique. We will suppress the
expression of TrpC6 under hypoxic conditions using the siRNA specific for TrpC6. Effect of
such a silencing on migration, angiogenesis and cell proliferation would prove the role of TrpC6
as the downstream effector.
Exp#1 – Determine the efficiency of siRNA transfection by checking the expression of TrpC6 at
the mRNA as well as protein levels.
Exp#2 – Transfect the cells with TrpC6 siRNA, induce hypoxia and then determine the effect on
cellular migration by doing invasion/migration assay.
Exp#3 – Do in vitro vessel formation assay to establish the effect of TrpC6 silencing under
hypoxic condition.
26
Exp#4 – Transfect cells with siRNA, induce hypoxia and do MTT assay and also Brdu
incorporation assay to study its effect on cell proliferation.
Exp#5 – Determine the effect of TrpC6 siRNA on the tumorigenicity of the cancer cells under
hypoxic conditions by doing the soft agar colony formation assay.
CHAPTER 2: MATERIALS AND METHODS
2.1 Cell Culture –
U373-MG (obtained from ATCC) and GBM primary (obtained from a patient) were used for our
study. The cells were maintained in plain DMEM medium (Invitrogen cat# 11965159)
supplemented with 10% Fetal Bovine Serum (Atlanta biologicals cat#S11550), and 1.0%
antibiotic and antimycotic (Invitrogen cat#15240-062).
2.2 Inducing Hypoxia –
Hypoxia, which is the main stimulus for metastasis in our studies, was induced by treating the
cells with 100 µM CoCl2 (Sigma Aldrich, Cat# 232696) dissolved in serum-free, glucose-free
Locke’s medium. The cells were exposed to this treatment for 2, 4, 6, 8 or 16 hrs before the cells
were used for the rest of the experiments.
2.3 Treatment with DAPT/HIF1-Inhibitor –
In order to see the effect of DAPT (Sigma Aldrich Cat# D5942), which is a gamma-secretase
inhibitor, and also HIF1-Inhibitor (Calbiochem Cat# 400083) on the expression levels of TrpC6,
we treated the cells with either of these inhibitors overnight in Opti-MEM. Then the cells were
treated with CoCl2 as mentioned above.
27
2.4 siRNA transfection –
Custom-made siRNA against TrpC6 was obtained from Invitrogen. Scrambled RNA (Invitrogen
cat#12935) was used as transfection control. 20 pmoles of siRNA was used to do the
transfection. The transfection was carried out using Lipofectamine 2000 reagent (Invitrogen
cat#11668-027) according to the manufacturer’s protocol. The cells were then incubated at 37ºC
for 24 hrs. After that, the transfection medium was removed and the cells were treated with
CoCl2 to induce hypoxia, as explained above.
2.5 RNA extraction and Reverse Transcription –
Total RNA from the cell was isolated using Trizol reagent (Invitrogen Cat#15596018), in
accordance with the standard protocol. Briefly, proteins, DNA and RNA in the cells were
separated into 3 distinct layers by adding Chloroform and subsequent centrifugation5555
. Only the
mRNA layer was collected and transferred to a clean microfuge tube. RNA was precipitated by
using isopropanol followed by centrifugation. RNA was seen as a pallet after centrifugation. The
supernatant was carefully discarded and the pallet was washed twice with 75% ethanol. The
RNA was resuspended in 50µl of deionized water. The concentration of RNA was determined by
UV absorbance using a Nanodrop spectrophotometer. The RNA was reverse-transcribed using
iScript cDNA synthesis kit (Bio-Rad Labs., Cat#170-8891). Reaction was performed in a final
volume of 20 µl, containing 1µg of RNA, 4 µl of reaction mix, 1 µl of reverse transcriptase
enzyme and D.water. The cDNA synthesis cycle comprised of 3 steps. The cDNA concentration
was again measured by UV absorbance using a Nanodrop spectrophotometer.

28
2.6 Quantitative Real-Time Polymerase Chain Reaction –
Real time quantitative PCR was performed in a Sequence Detector System (ABI Prism 7900
Sequence Detection System and software; PerkinElmer Life Sciences). Amplification was
performed in a final volume of 30 µl, containing 2 µg of cDNA, primer mixture (0.6 µl each of
sense and antisense primers), 11.3 µl of DI water and 12.5 µl 2x SYBR Green Master Mix (Bio-
Rad Laboratories Cat# 170-8882). The standard amplification program included 40 cycles of two
steps, each comprising heating to 95 °C and heating to 60 °C. Fluorescent product was detected
at the last step of each cycle. In order to verify the purity of the products, a melting curve was
produced after each run. The relative quantitation of gene expression was determined by Delta-
Delta CT METHOD using the following calculation56, 57
–
• ΔCT = target – reference (control)
• ΔCT = target – reference (experiment)
• Difference = ΔCT – ΔCT = ΔΔCT
• Fold change = 2 ΔΔCT
Table 3: Primers used for real-time PCR
GENE SEQUENCE PRODUCT (bp)
hTRPC1 GATGCATTCCATCCTACACT
TACACAGTCCTTCTGCTCCT
249
hTRPC3 CAAGAATGACTATCGGAAGC
GCCACAAACTTTTTGACTTC
201
hTRPC4 GGACTTCAGGACTACATCCA
ACGCAGAGAACTGAAGATGT
201
hTRPC5 CCACCAGCTATCAGATAAGG
CGAAACAAGCCACTTATACC
159
hTRPC6 TGAAGTGAAATCAGTGGTCA
AAATTTCCACTCCACATCAG
175
hTRPC7 CATAGCCTATTGGATTGCTC
GGTAGTCTGTGAAGGTTTCG
176
Hes1 CGGACATTCTGGAAATGACA
CATTGATCTGGGTCATGCAG 155
Hes5 CTCAGCCCCAAAGAGAAAAAA
TAGTCCTGGTGCAGGCTCTT 183
GAPDH AGCCACATCGCTCAGACACC
GTACTCAGCGGCCAGCATCG 169

29
2.7 Western Blots –
Western blotting was carried on as previously described39
. Cells were lyzed in the lysis buffer
(50 mM Tris–HCl, pH 7.4, 150 mM NaCl, 1% NP-40, 1x protease inhibitor cocktail). Cell
extracts were collected by centrifugation. The protein concentration in the cell extracts was
determined using the Bio-Rad Protein Assay reagents (Bio-Rad), according to the manufacturer’s
instructions. Samples were then analyzed by SDS-4-12% polyacrylmide gel electrophoresis
(PAGE) and blotted to PVDF membrane. Nonspecific sites were saturated with 5% milk+PBS-T
before exposure overnight to an anti-HIF-1 (mouse monoclonal Abcam # ab463), NICD (Rabbit
polyclonal activated Notch1 antibody, Abcam # ab8925), TrpC6 (Rabbit polyclonal, Prosci Inc
# 3899) and GAPDH (mouse monoclonal Sigma# 4967) antibodies. This was followed by 3
washes with PBS-T, each lasting 10 min. The membrane was then probed using horseradish
peroxidase (HRP)-conjugated donkey anti-rabbit IgG (Amersham Life Science Cat# NA934)
antibodies and horseradish peroxidase (HRP)-conjugated donkey anti-mouse IgG (Amersham
Life Science Cat# NXA931) antibodies, followed by 3 more washes with PBS-T, each lasting 15
min. The membrane was developed using the ECL reagents (Amersham Biosciences Corp Cat#
RPN2132).
2.8 Immunocytochemistry –
U373 MG cells were seeded at a density of 4 x 10⁴/ml of experimental medium in an eight-well
Lab-Tek II chamber slide. The cells were then incubated for 3,6 and 12 h under 100µm CoCl2.
Cells were washed with PBS, fixed with cold methanol for 5 min, and permeabilized for 5 min in
0.1% Triton-PBS followed by three PBS washes. Nonspecific sites were saturated with 5% goat
serum before exposure overnight to an anti-HIF-1 (mouse monoclonal Abcam # ab463), NICD

30
(Rabbit polyclonal activated Notch1 antibody, Abcam # ab8925) and TrpC6 (Rabbit polyclonal,
Prosci Inc # 3899) antibodies. Negative controls were obtained by omitting the primary
antibody. The cells were washed twice in PBS and incubated for 45 minutes with suitable
secondary IgG Alexa 488 (1:500 in PBS; Molecular Probes, Invitrogen). Cell nuclei were
counterstained with 4',6-diamidino-2-phenylindole (DAPI). Images were acquired by using
Nikon Eclipse E600 fluorescence microscope. Images were processed by using SPOT advance
software, Diagnostic Instruments, Sterling Heights, MI and Photoshop 7.0 (Adobe Systems, San
Jose, CA), with the input levels adjusted to span the range of acquired signal intensities exactly.
2.9 Cell migration assay –
U373 cells were plated in a 24-well dish at a density of 0.8x10⁶ cells. The cells were transfected
with 20 pmoles of siRNA and exposed to hypoxia for 6 hrs. The cells were then trypsinized and
then used for cell migration analysis. Cell migration analysis was performed using Transwell
membrane filters (Corning Costar) containing a polycarbonate filter with 8 µm pores as
previously reported58
. Briefly, the bottom chambers of transwells were filled with complete
growth medium containing chemoattractant growth factors. 1x10⁴ transfected cells in a total
volume of 0.2 ml were seeded into the top well of the inserts in serum free medium along with
CoCl2 (100 µM). and allowed to migrate for 6 hours. At the end of the incubation, non-migrated
cells remaining in the transwell insert were removed. The migrated cells (on the outer bottom of
the transwell) were fixed with methanol and stained with hematoxylin and eosin, and the stained
cells were counted in 5 or more random 100X fields. Each experiment was performed in
triplicate, and the experiment was repeated twice. Growth correction was not applied because no
increase in the cell number was observed during the incubation period of 6 hours.

31
Figure 8: Transwell insert for migration assay
2.10 In-vitro tube morphogenesis on Matrigel –
U373 cells were plated in a 24-well dish at a density of 0.8x10⁶ cells. The cells were transfected
with 20 pmoles of siRNA and exposed to hypoxia for 6 hrs. The conditioned media from these
plates were collected and used for angiogenesis. The vessel morphogenesis assay was done as
previously described58, 59
. HMEC-1 cells were adjusted to a density of 3 x 10⁴ cells in 200 µL of
10% conditioned medium, collected from U373 cells treated with either control (empty vector),
CoCl2 or TRPC6 siRNA with 0.5% FBS and conditioned added to the wells of eight-well
chamber slides precoated with growth factor–depleted Matrigel (7 µg/mL; BD BioSciences,
Bedford, MA). The slides were incubated at 37°C for 18 to 20 hours. The medium was then
removed gently without disturbing newly formed tubules. The images were captured at a 40x
magnification on Nikon Optiphot II microscope. Total tube length of each well was measured
using IP Lab Image Analysis Program (Scanalytics, Inc., Arlington, VA).

32
2.11 MTT assay for cell proliferation –
U373 cells were plated in a 24-well dish at a density of 0.8x10⁶ cells. The cells were transfected
with 20 pmoles of siRNA and exposed to hypoxia for 6 hrs. The cells were then trypsinized and
then used for MTT assay. The cells were replated in 96-well plates and allowed to grow in
serum-free media containing CoCl2 for 1, 2 or 3 days. Then MTT assay was carried on in
accordance with the manufacturer’s protocol (ATCC Cat# 30-1010K). Briefly, following
incubation with CoCl2 for designated time, 10 µL of MTT reagent was added to each well and
further maintained @ 37°C for another 2 hrs until purple precipitate could be seen. This was
followed by addition of 100 µL of detergent reagent and incubation in the dark for 2 hrs. After
that, the absorbance was recorded at 570nm using a spectrophotometer. The number of viable
proliferating cells was determined based on the OD reading.
2.12 Soft Agar Colony formation assay –
Soft agar assays were performed as described previously60
. An underlay of 0.5% agar in DMEM
containing 5% fetal calf serum was prepared by mixing equal volumes of 1% agarose and
2x
DMEM 10% fetal calf serum. Two milliliters of this mixture were pipetted into the wells of six-
well plates and allowed to set. Cells (5 x10
3) were seeded in each well of a
six-well culture dish
containing 0.3% top low-melt agarose. The agarose was allowed to set, and the plates were
incubated in a humidified chamber at 37 C for 14 d. Colonies were counted
in a blinded manner
using an x10 objective on a Nikon inverted microscope. Colonies with a diameter
larger than 20
µm were scored. Data are expressed as average number of colonies formed as well as the average
diameter of colonies.

33
2.13 Brdu-Incorporation assay -
U373-MG cells were seeded in an 8-well chamber slide at a density of 2.5x10⁴ cells/well. Then
the cells were transfected with 20 pmoles of siRNA, incubated in transfection media for 24 hrs
and then maintained in serum-free Locke’s media with 100 µM CoCl2 for 6 hrs. The cells were
also exposed to 10 µM Brdu for 3 hrs before overnight fixing with 4% PFA. The DNA of the
cells was degraded by treatment with 2N HCL for 30min, then the acidity was neutralized by
incubating with borate buffer for 15 min followed by 3 washes with PBS. Non-specific sites
were blocked with PBS+0.1% Triton x+3% donkey serum followed by overnight incubation with
anti-Brdu primary antibody. The cells were then washed thrice with PBS and incubated with
anti-rat, TRITC-conjugated secondary antibody for 1 hr. Nuclei were counterstained with DAPI.
Images were acquired by using Nikon Eclipse E600 fluorescence microscope. Images were
processed by using SPOT advance software, Diagnostic Instruments, Sterling Heights, MI and
Photoshop 7.0 (Adobe Systems, San Jose, CA), with the input levels adjusted to span the range
of acquired signal intensities exactly.
34
CHAPTER 3: RESULTS AND DISCUSSION
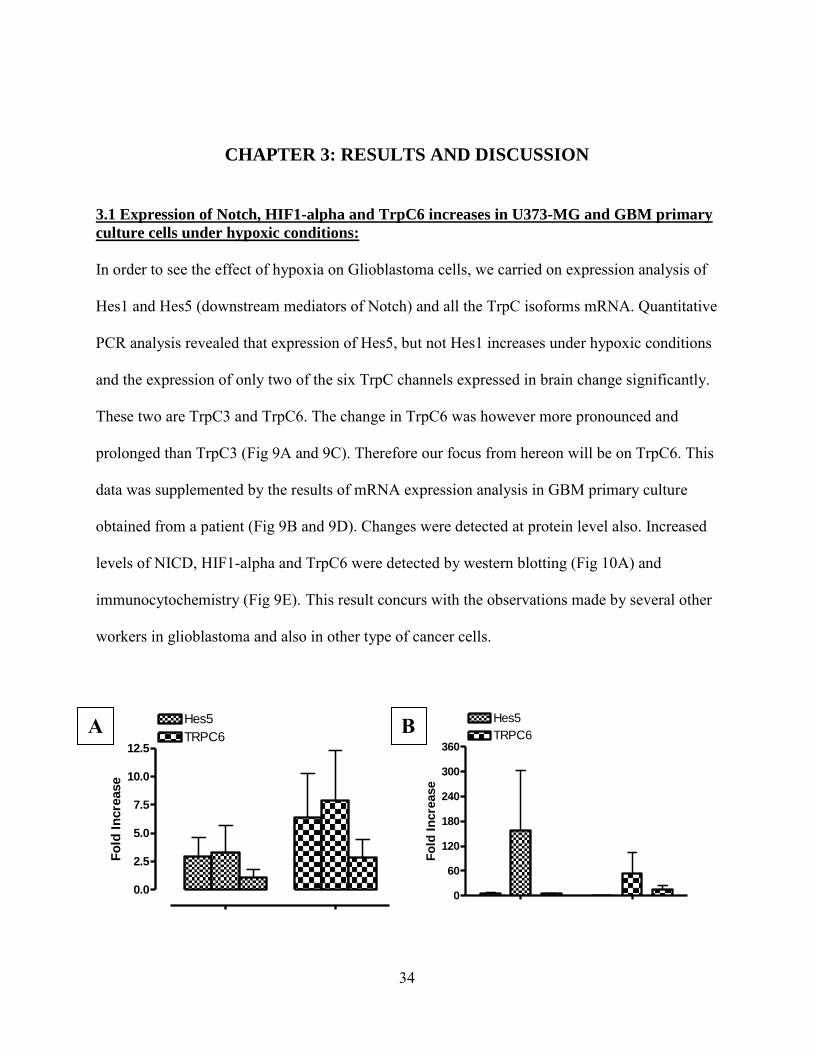
3.1 Expression of Notch, HIF1-alpha and TrpC6 increases in U373-MG and GBM primary
culture cells under hypoxic conditions:
In order to see the effect of hypoxia on Glioblastoma cells, we carried on expression analysis of
Hes1 and Hes5 (downstream mediators of Notch) and all the TrpC isoforms mRNA. Quantitative
PCR analysis revealed that expression of Hes5, but not Hes1 increases under hypoxic conditions
and the expression of only two of the six TrpC channels expressed in brain change significantly.
These two are TrpC3 and TrpC6. The change in TrpC6 was however more pronounced and
prolonged than TrpC3 (Fig 9A and 9C). Therefore our focus from hereon will be on TrpC6. This
data was supplemented by the results of mRNA expression analysis in GBM primary culture
obtained from a patient (Fig 9B and 9D). Changes were detected at protein level also. Increased
levels of NICD, HIF1-alpha and TrpC6 were detected by western blotting (Fig 10A) and
immunocytochemistry (Fig 9E). This result concurs with the observations made by several other
workers in glioblastoma and also in other type of cancer cells.
0.0
2.5
5.0
7.5
10.0
12.5
Hes5
TRPC6
Fo
ld I
ncre
ase
0
60
120
180
240
300
360
Hes5
TRPC6
Fo
ld I
ncre
ase
A B
35
TRPC1
TRPC3
TRPC4
TRPC5
TRPC6
TRPC7
Hes
1
Hes
5
0
5
10
15
20
25TRPC1
TRPC3
TRPC4
TRPC5
TRPC6
TRPC7
Hes1
Hes5
Fo
ld I
ncre
ase
TRPC1
TRPC3
TRPC4
TRPC5
TRPC6
TRPC7
Hes
1
Hes
5
0
10
20
30
40
50
60TRPC1
TRPC3
TRPC4
TRPC5
TRPC6
TRPC7
Hes1
Hes5
Fo
ld I
ncre
ase
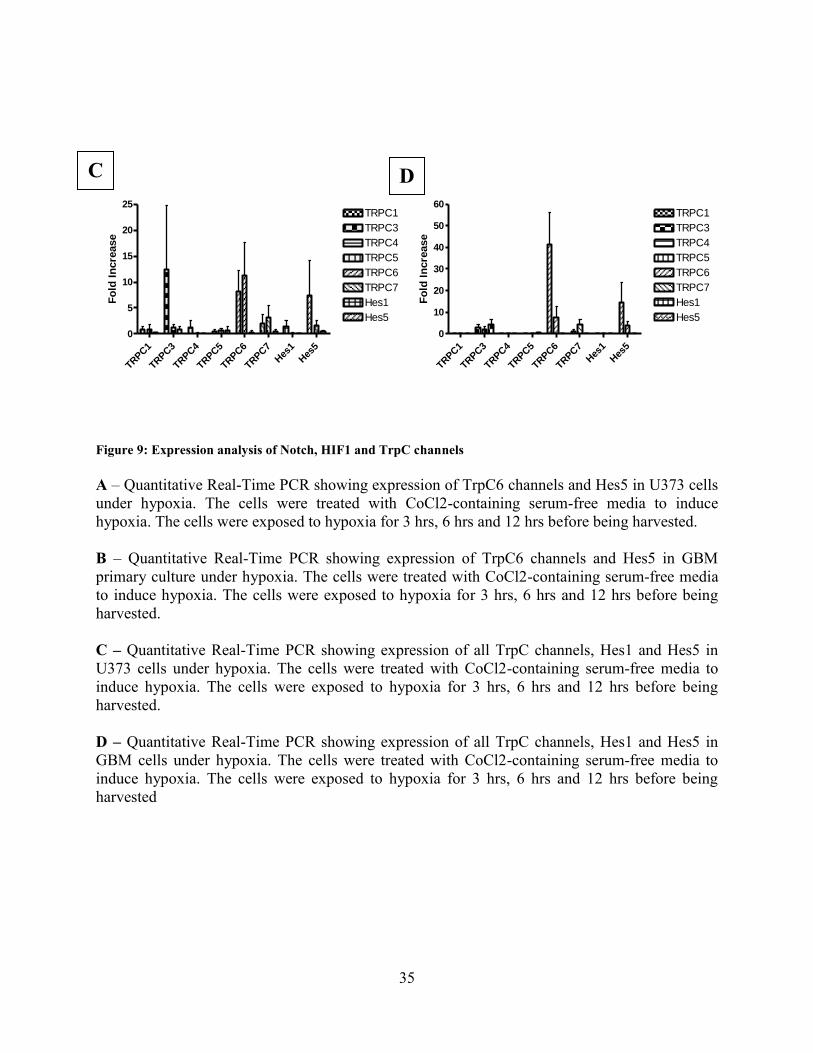
Figure 9: Expression analysis of Notch, HIF1 and TrpC channels
A – Quantitative Real-Time PCR showing expression of TrpC6 channels and Hes5 in U373 cells
under hypoxia. The cells were treated with CoCl2-containing serum-free media to induce
hypoxia. The cells were exposed to hypoxia for 3 hrs, 6 hrs and 12 hrs before being harvested.
B – Quantitative Real-Time PCR showing expression of TrpC6 channels and Hes5 in GBM
primary culture under hypoxia. The cells were treated with CoCl2-containing serum-free media
to induce hypoxia. The cells were exposed to hypoxia for 3 hrs, 6 hrs and 12 hrs before being
harvested.
C – Quantitative Real-Time PCR showing expression of all TrpC channels, Hes1 and Hes5 in
U373 cells under hypoxia. The cells were treated with CoCl2-containing serum-free media to
induce hypoxia. The cells were exposed to hypoxia for 3 hrs, 6 hrs and 12 hrs before being
harvested.
D – Quantitative Real-Time PCR showing expression of all TrpC channels, Hes1 and Hes5 in
GBM cells under hypoxia. The cells were treated with CoCl2-containing serum-free media to
induce hypoxia. The cells were exposed to hypoxia for 3 hrs, 6 hrs and 12 hrs before being
harvested
C D

36
E – Immunocytochemistry showing the effect of hypoxia on expression of NICD, TrpC6 and
HIF1 in U373 cells. Three time-points, 3 hrs, 6 hrs and 12 hrs, were chosen for analysis.
3.2 Hypoxia-induced response of Notch involves cross talk with the HIF1 pathway:
Since Notch is a very important response element in hypoxic conditions, we want to check
whether it acted via HIF1-alpha. Therefore, we blocked Notch and HIF1 one at a time and
checked the expression of the other. Notch activity was blocked by treating the cells with DAPT,
which blocks the enzyme gamma-secretase, which is involved in the last trans-membrane
cleavage of Notch, resulting in reduced NICD production. Immunoblotting with anti-HIF1
antibody revealed decreased HIF1 levels, confirming the fact that Notch interacts positively with
E

37
HIF1-alpha (Fig 10B). Our next step was to check which of these proteins was upstream.
Immunoblotting with anti-notch after blocking HIF1 with HIF1-Inhibitor did not change the
expression of NICD (Fig 10C). Thus NICD is probably upstream of HIF1.
0
1000
2000
3000
4000
CoCl2
DAPT+CoCl2
HIF1+CoCl2
HIF-1
Pro
tein
/GA
PD
H r
ati
o
0
500
1000
1500
2000
2500
CoCl2
DAPT + CoCl2
HIF1-I + CoCl2
NICD
Pro
tein
/GA
PD
H r
ati
o
0
1000
2000
3000
CoCl2
DAPT + CoCl2
HIF1-I + CoCl2
TRPC6
Pro
tein
/GA
PD
H R
ati
o
Figure 10: Effect of CoCl2, DAPT and HIF1-Inhibitor on the expression of Hif1, NICD and TrpC6:
A – U373 cells were grown in serum-free media containing CoCl2 for 2, 4, 8 and 16 hrs to
induce hypoxia. The lysates were run in SDS-PAGE, transferred to PVDF membrane and then
probed with GAPDH, HIF1-alpha, NICD and TrpC6 B – U373 cells were pre-treated with DAPT in Opti-MEM for 2 hrs and then grown in serum-
free media containing CoCl2 for 2, 4, 8 and 16 hrs to induce hypoxia. The lysates were run in
SDS-PAGE, transferred to PVDF membrane and then probed with GAPDH, HIF1-alpha, NICD
and TrpC6
C – U373 cells were pre-treated with HIF1-inhibitor in Opti-MEM for 2 hrs and then grown in
serum-free media containing CoCl2 for 2, 4, 8 and 16 hrs to induce hypoxia. The lysates were
run in SDS-PAGE, transferred to PVDF membrane and then probed with GAPDH, HIF1-alpha,
NICD and TrpC6
D,E,F – Densitometry analysis of HIF1-alpha, NICD and TrpC6 expression based on the
intensity of band in the western blots.
B A C
D E F

38
3.3 TrpC6 is the downstream mediator of Notch-mediated pathway:
Expression of TrpC6 was affected by blocking Notch and HIF1 (Fig 9B and 9C). Thus it is the
downstream mediator of both these proteins. Role of TrpC6 in the pathway was further
confirmed by knocking down TrpC6 using specific siRNA. Abrogation of TrpC6 after
transfection with siRNA confirmed the specificity and efficiency of the siRNA (Fig 10A and Fig
10B).
C2 S2 C4 S4 C6 S6 C8 S8 C16 S160
500
1000
1500
2000
2500
3000
3500
Fo
ld C
han
ge
Figure 11: Test for siRNA transfection efficiency:
A – Quantitative Real-Time PCR to check of efficiency of TrpC6 siRNA transfection. U373
cells were either transfected with TrpC6 siRNA (S2, S4, S6, S8, S16) or not transfected with
siRNA (C2, C4, C6, C8, C16), exposed to hypoxia for 2, 4, 6, 8 and 16 hrs and then harvested
for PCR.
B – Western blots showing the expression levels of TrpC6 to check for the efficiency of TrpC6
siRNA. U373 cells were either transfected with TrpC6 siRNA (S2, S4, S8, S16) or not
transfected with siRNA (C2, C4, C8, C16), exposed to hypoxia for 2, 4, 8 and 16 hrs and then
harvested for western blot analysis. GAPDH was used as loading control.
B
A
39
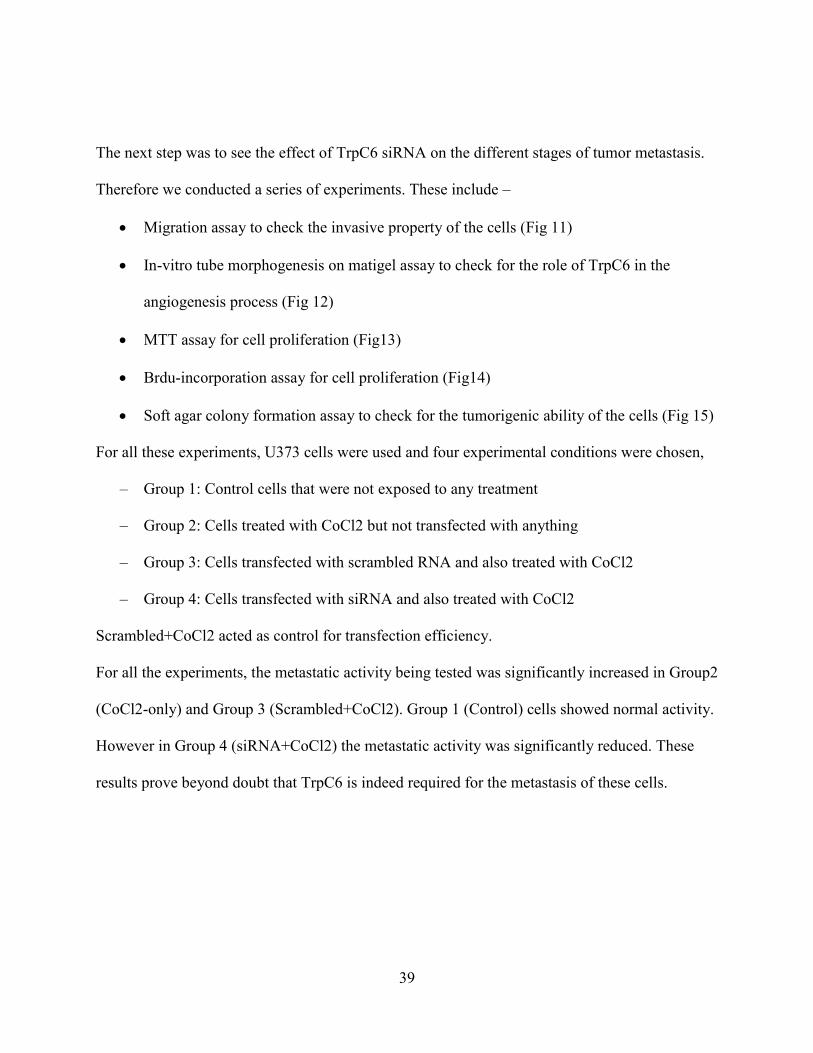
The next step was to see the effect of TrpC6 siRNA on the different stages of tumor metastasis.
Therefore we conducted a series of experiments. These include –
Migration assay to check the invasive property of the cells (Fig 11)
In-vitro tube morphogenesis on matigel assay to check for the role of TrpC6 in the
angiogenesis process (Fig 12)
MTT assay for cell proliferation (Fig13)
Brdu-incorporation assay for cell proliferation (Fig14)
Soft agar colony formation assay to check for the tumorigenic ability of the cells (Fig 15)
For all these experiments, U373 cells were used and four experimental conditions were chosen,
– Group 1: Control cells that were not exposed to any treatment
– Group 2: Cells treated with CoCl2 but not transfected with anything
– Group 3: Cells transfected with scrambled RNA and also treated with CoCl2
– Group 4: Cells transfected with siRNA and also treated with CoCl2
Scrambled+CoCl2 acted as control for transfection efficiency.
For all the experiments, the metastatic activity being tested was significantly increased in Group2
(CoCl2-only) and Group 3 (Scrambled+CoCl2). Group 1 (Control) cells showed normal activity.
However in Group 4 (siRNA+CoCl2) the metastatic activity was significantly reduced. These
results prove beyond doubt that TrpC6 is indeed required for the metastasis of these cells.
40
Contr
ol
CoC
l2
Scr
amble
d+CoC
l2
siRNA
0
40
80
120
160 *
*
*
% I
nvasio
n C
ell
s
Figure 12: Invasion/Migration assay:
The transfected cells were incubated in transfection media for 24 hrs. Cells treated with CoCl2
were exposed to hypoxia for 6 hrs. The cells were then trypsinized and used for migration assay.
A – Picture of the tube-formation showing the number of new blood vessels formed.
B – Graphical representation of percentage of branching points.
A
B

41
Contr
ol
CoC
l2
Scram
bled+C
oCl2
siRNA+C
oCl2
0
2
4
6
8
Bra
nc
h P
oin
ts X
Nu
mb
er
of
Bra
nc
he
s/F
ield
(x
10
00
)
Figure 13: In-Vitro tube morphogenesis on matrigel:
The transfected cells were incubated in transfection media for 24 hrs. Cells treated with CoCl2
were exposed to hypoxia for 6 hrs. The conditioned media from these cells were collected and
used for angiogenesis assay.
A – Picture of the tube-formation showing the number of new blood vessels formed.
B – Graphical representation of percentage of branching points.
A
B
42
0 1 2 3
0.00
0.25
0.50
0.75
1.00
Control
CoCl2
Scrambled+CoCl2
siRNA+CoCl2
Time (in days)
OD
at
570 n
m
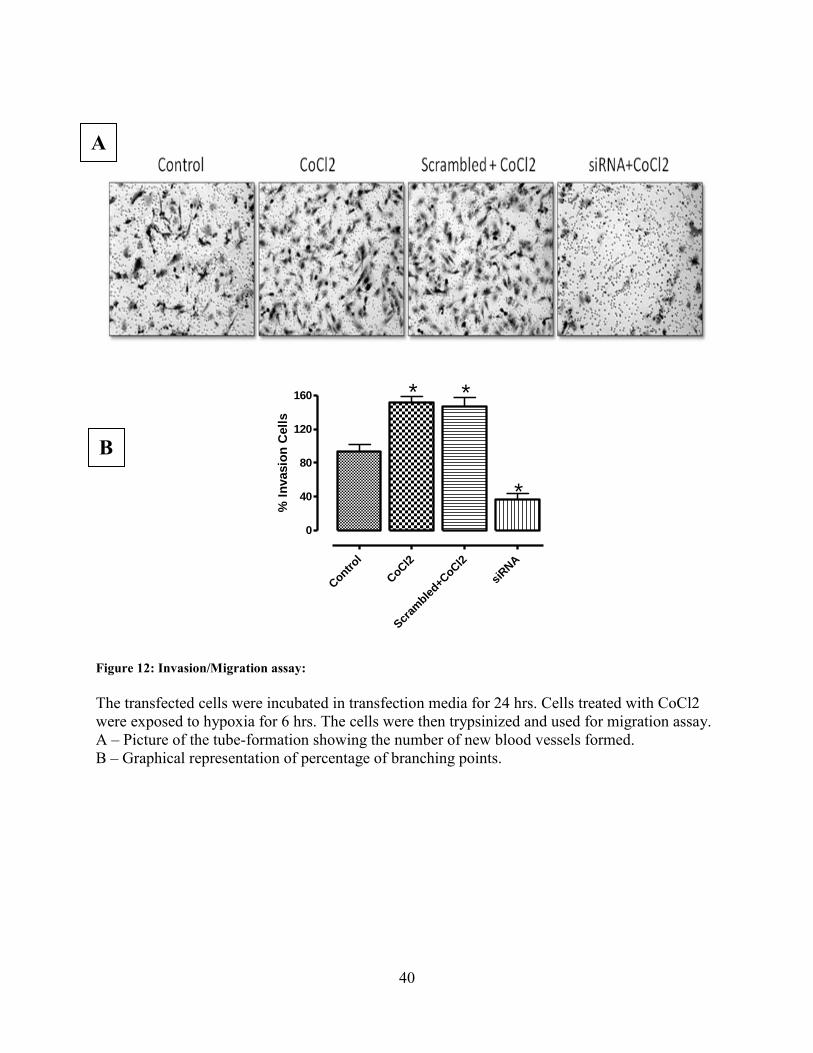
Figure 14: MTT assay
The transfected cells were incubated in transfection media for 24 hrs. Cells treated with CoCl2
were exposed to hypoxia for 6 hrs. The cells were then trypsinized and used for MTT assay. For
MTT assay the cells were incubated for 1, 2, or 3 days.
A – Graphical representation of OD readings from MTT assay which corresponds to the number
of live, proliferating cells.
A

43
Contr
ol
CoC
l2
Scr
amble
d+CoC
l2
siRNA+C
oCl2
0
25
50
75
100* *
*%
Brd
u p
os
itiv
e c
ell
s
Figure 15: Brdu-incorporation assay
U373 cells were transfected with siRNA and maintained in transfection media for 24 hrs. Then
they were exposed to hypoxia for 6 hrs by treating with CoCl2. During the last 3 hrs of
incubation with CoCl2, the cells were treated with Brdu. Then the cells were fixed with 4%
paraformaldehyde and stained.
A – Immunocytochemistry for Brdu-incorporation assay. Blue represents the nucleus of Brdu-
negative cells and pink represents Brdu-positive cells.
B – Graphical representation of average percentage of Brdu-positive cells which corresponds to
the number of proliferating cells.
A
B
44
Con
trol
CoC
l2
Scr
ambled+C
oCl2
siRNA+C
oCl2
0
20
40
60
80
100
120
* *
*Nu
mb
er o
f co
lon
ies
Control
CoCl2
Scr
ambled+C
oCl2
siRNA+C
oCl2
0
25
50
75
100
125
150
175 * *
*Averag
e C
olo
ny
Dia
mete
r (
um
)
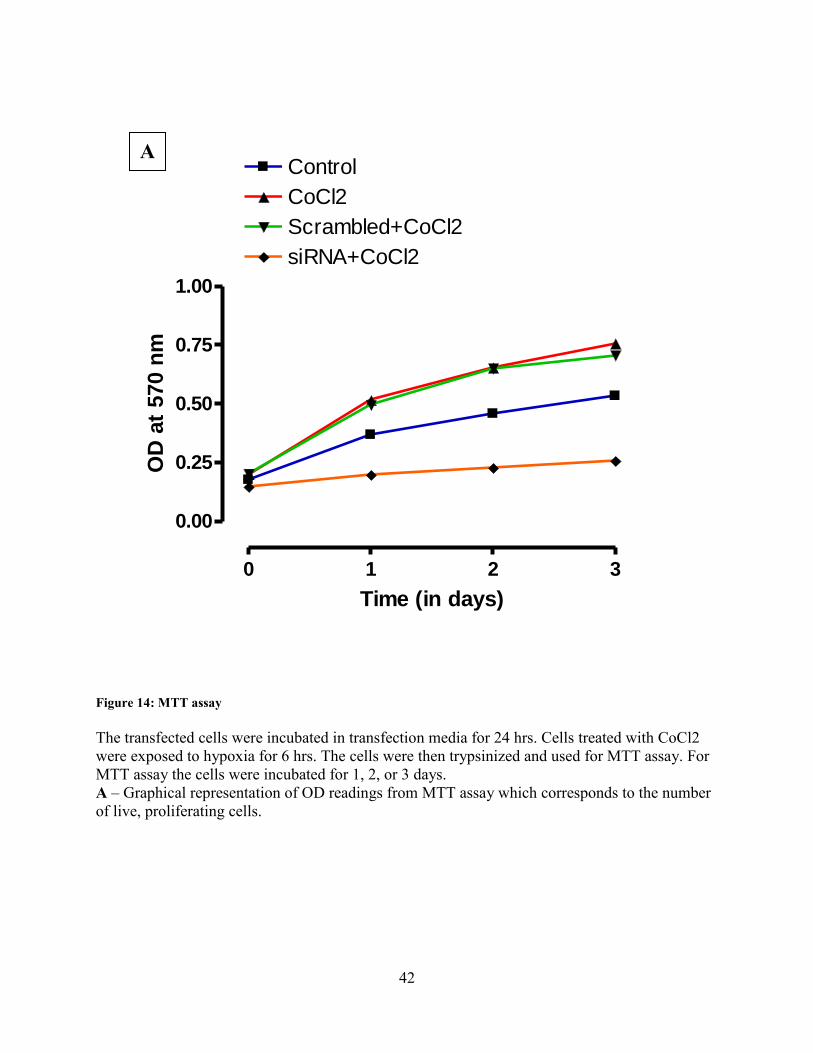
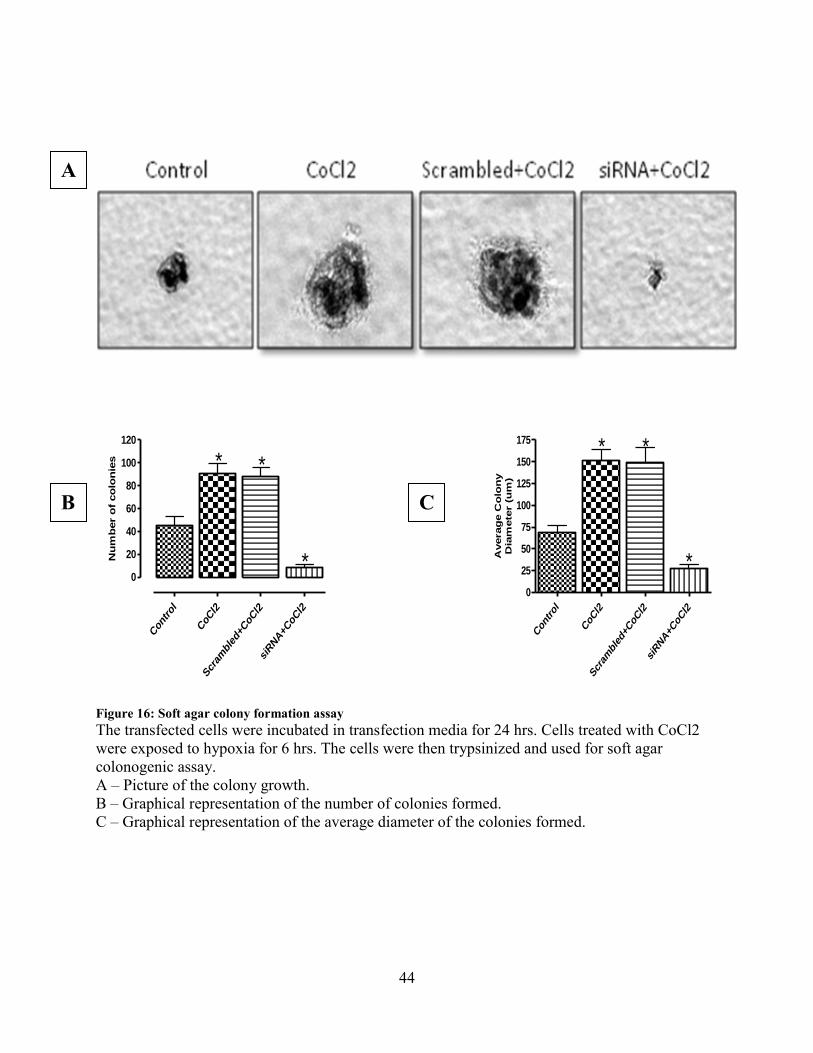
Figure 16: Soft agar colony formation assay
The transfected cells were incubated in transfection media for 24 hrs. Cells treated with CoCl2
were exposed to hypoxia for 6 hrs. The cells were then trypsinized and used for soft agar
colonogenic assay.
A – Picture of the colony growth.
B – Graphical representation of the number of colonies formed.
C – Graphical representation of the average diameter of the colonies formed.
A
B C
45
CONCLUSIONS
A schematic representation of the projected pathway based on our findings is shown in Fig 16.
The main hypothesis and aim of our project is to establish and provide evidence for the role of
TrpC6 channels in metastasis of glioblastoma. Increased expression of NICD, HIF1-alpha and
TrpC6 and also the knowledge that we have from the literature lead us to deduce that Notch,
HIF1 and TRPC6 are required for cellular response to hypoxia and these can induce malignancy
in tumor cells. Therefore we set out to establish a link between these three proteins. Dependence
of HIF1-alpha expression on Notch activity explains how Notch and HIF1 pathways are
integrated as a response to hypoxia. Reduced expression of TrpC6 upon inhibition with either
DAPT or HIF1-inhibitor proved that both NICD and HIF1-alpha cooperate and act via TrpC6.
Knocking down of TrpC6 resulted in considerable reduction in various steps of metastasis
including migration, angiogenesis, cell proliferation and tumorigenesis, This perfectly fits in our
puzzle proving that it is indeed the downstream mediator of hypoxia-induced metastasis of
Glioblastoma. This role of TrpC6 in metastasis of cancer cells opens up new horizons in cancer
research and can act as a target for pharmacological intervention. We are further extending our
study by looking at the downstream of TrpC6. Evidences show the involvement of NFAT in
TrpC6-mediated pathways. Thus we are trying to confirm if NFAT is involved in this role of
TrpC6 in metastasis of Glioblastoma as well.

46
Figure 17: Schematic representation of projected pathway for notch response to hypoxia in cancer cells

47
References
1. George J. Augustine, David Fitzpatrick, William C. Hall, Miguel Nicolelis, Anthony-
Samuel LaMantia, Larry Katz & Dale Purves. (2001) Neuroscience. .
2. [Anonymous]. (2007) United States Cancer Statistics: 2004 Incidence and
Mortality, Publication Year 2007. PB2008107612, 684. .
3. Davis F. G., McCarthy B. J. & Berger M. S. (1999) Centralized databases available
for describing primary brain tumor incidence, survival, and treatment: Central Brain
Tumor Registry of the United States; Surveillance, Epidemiology, and End Results;
and National Cancer Data Base. Neuro-Oncology 1, 205-211. .
4. Mayo Foundation for Medical Education and Research. Information on Brain
tumors. .
5. Brain tumor research center. (2008) Information about brain tumors - Non-gliomas.
.
6. International Radiosurgery Association. Understanding brain tumors. 2008, .
7. Jemal A., Murray T., Samuels A., Ghafoor A., Ward E. & Thun M. J. (2003) Cancer
statistics, 2003. CA: A. Cancer. Journal for. Clinicians 53, 5-26. .
8. Holland E. C. (2000) Glioblastoma multiforme: the terminator. Proceedings of the
National Academy of Sciences of the United. States of America 97, 6242-6244. .
9. John W. Henson. Glioblastoma multiforme and anaplastic gliomas- MGH Brain
Tumor Center. 2008, .
10. Benjamin R., Capparella J. & Brown A. (2003) Classification of glioblastoma
multiforme in adults by molecular genetics. Cancer. Journal (Sudbury, Mass. ) 9, 82-
90. .
11. Answers.com. Metastasis:definition from answers.com. .
12. Bruce J. N. Glioblastoma multiforme review. .
48
13. Yarbro, C. H., Frogge, M. H. & Goodman, M. (2005). Cancer nursing: Principles
and practice. Sudbury, Mass. : Jones and Bartlett Publishers, c2005., .
14. Höckel M., Vaupel P. (2001) Tumor hypoxia: definitions and current clinical,
biologic, and molecular aspects. Journal of the National Cancer. Institute 93, 266-
276. .
15. Duffy J. P., Eibl G., Reber H. A. & Hines O. J. (2003) Influence of hypoxia and
neoangiogenesis on the growth of pancreatic cancer. Mol. Cancer. 2, 12. .
16. Hockel M, Schlenger K, Aral B, Mitze M, Schaffer U, Vaupel P. (1996)
Association between tumor hypoxia and malignant progression in advanced
cancer of the uterine cervix.. Cancer Res 56, 4509–15. .
17. David M. Brizel2, Sean P. Scully, John M. Harrelson, Lester J. Layfield, Joseph
M. Bean, Leonard R. Prosnitz and Mark W. Dewhirst. (1996) Tumor Oxygenation
Predicts for the Likelihood of Distant Metastases in Human Soft Tissue Sarcoma 56
(5): 941 -- Cancer Research. Cancer Research 56, 941-943. .
18. Sundfør K., Lyng H. & Rofstad E. K. (1998) Tumour hypoxia and vascular density
as predictors of metastasis in squamous cell carcinoma of the uterine cervix. British
Journal of Cancer. 78, 822-827. .
19. Höckel M., Schlenger K., Höckel S., Aral B., Schäffer U. & Vaupel P. (1998)
Tumor hypoxia in pelvic recurrences of cervical cancer. International Journal of
Cancer. Journal International Du Cancer. 79, 365-369. .
20. Stefan Walenta, Michael Wetterling, Michael Lehrke, Georg Schwickert, Kolbein
Sundfør, Einar K. Rofstad and Wolfgang Mueller-Klieser. (2000) High Lactate Levels
Predict Likelihood of Metastases, Tumor Recurrence, and Restricted Patient Survival
in Human Cervical Cancers. Cancer Research 60, 916-921. .
21. Cuvier C., Jang A. & Hill R. P. (1997) Exposure to hypoxia, glucose starvation
and acidosis: effect on invasive capacity of murine tumor cells and correlation with
cathepsin (L + B) secretion. Clin. Exp. Metastasis 15, 19-25. .
49
22. Graham C. H., Forsdike J., Fitzgerald C. J. & Macdonald-Goodfellow S. (1999)
Hypoxia-mediated stimulation of carcinoma cell invasiveness via upregulation of
urokinase receptor expression. Int. J. Cancer 80, 617-623. .
23. Young S. D., Marshall R. S. & Hill R. P. (1988) Hypoxia induces DNA
overreplication and enhances metastatic potential of murine tumor cells. Proc. Natl.
Acad. Sci. U. S. A. 85, 9533-9537. .
24. Brizel D. M., Sibley G. S., Prosnitz L. R., Scher R. L. & Dewhirst M. W. (1997)
Tumor hypoxia adversely affects the prognosis of carcinoma of the head and neck.
Int. J. Radiat. Oncol. Biol. Phys. 38, 285-289. .
25. Jang A., Hill R. P. (1997) An examination of the effects of hypoxia, acidosis, and
glucose starvation on the expression of metastasis-associated genes in murine
tumor cells. Clin. Exp. Metastasis 15, 469-483. .
26. Michael Höckel2, Karlheinz Schlenger, Susanne Höckel and Peter Vaupel. (1999)
Hypoxic Cervical Cancers with Low Apoptotic Index Are Highly Aggressive 59 (18):
4525 --. Cancer Research 59, 4525-4528. .
27. Graeber T. G., Osmanian C., Jacks T., Housman D. E., Koch C. J., Lowe S. W. &
Giaccia A. J. (1996) Hypoxia-mediated selection of cells with diminished apoptotic
potential in solid tumours. Nature 379, 88-91. 10.1038/379088a0.
28. Charlotte Y. Kim, Mitchell H. Tsai, Cynthia Osmanian, Thomas G. Graeber, Jong
Eun Lee, Rona G. Giffard, Joseph A. DiPaolo, Donna M. Peehl and Amato J.
Giaccia. (1997) Selection of Human Cervical Epithelial Cells That Possess Reduced
Apoptotic Potential to Low-Oxygen Conditions. Cancer Research 57, 4200-4204. .
29. Samali A., Cotter T. G. (1996) Heat shock proteins increase resistance to
apoptosis. Exp. Cell Res. 223, 163-170. 10.1006/excr.1996.0070.
30. Zhivotovsky B., Joseph B. & Orrenius S. (1999) Tumor radiosensitivity and
apoptosis. Exp. Cell Res. 248, 10-17. 10.1006/excr.1999.4452.
31. D. Alan Anthoney, Amanda J. McIlwrath, William M. Gallagher, Angela R. M.
Edlin, Robert Brown. (1996) Microsatellite Instability, Apoptosis, and Loss of p53
Function in Drug-resistant Tumor Cells. Cancer Research 56, 1374-1381. .

50
32. Sethi T., Rintoul R. C., Moore S. M., MacKinnon A. C., Salter D., Choo C.,
Chilvers E. R., Dransfield I., Donnelly S. C., Strieter R. & Haslett C. (1999)
Extracellular matrix proteins protect small cell lung cancer cells against apoptosis: a
mechanism for small cell lung cancer growth and drug resistance in vivo. Nat. Med.
5, 662-668. 10.1038/9511.
33. Hickman J. A., Potten C. S., Merritt A. J. & Fisher T. C. (1994) Apoptosis and
cancer chemotherapy. Philos. Trans. R. Soc. Lond. B. Biol. Sci. 345, 319-325.
10.1098/rstb.1994.0112.
34. Rice G. C., Hoy C. & Schimke R. T. (1986) Transient hypoxia enhances the
frequency of dihydrofolate reductase gene amplification in Chinese hamster ovary
cells. Proc. Natl. Acad. Sci. U. S. A. 83, 5978-5982. .
35. Pouyssegur J., Dayan F. & Mazure N. M. (2006) Hypoxia signalling in cancer and
approaches to enforce tumour regression. Nature 441, 437-443.
10.1038/nature04871.
36. Bolós V., Grego-Bessa J. & de la Pompa,José Luis. (2007) Notch signaling in
development and cancer. Endocrine Reviews 28, 339-363. .
37. Biocarta. Signaling pathway of notch. .
38. Purow B. W., Haque R. M., Noel M. W., Su Q., Burdick M. J., Lee J., Sundaresan
T., Pastorino S., Park J. K., Mikolaenko I., Maric D., Eberhart C. G. & Fine H. A.
(2005) Expression of Notch-1 and Its Ligands, Delta-Like-1 and Jagged-1, Is Critical
for Glioma Cell Survival and Proliferation. Cancer Res. 65, 2353-2363. .
39. Zhang X., Zheng G., Zou L., Liu H., Hou L., Zhou P., Yin D., Zheng Q., Liang L.,
Zhang S., Feng L., Yao L., Yang A., Han H. & Chen J. (2008) Notch activation
promotes cell proliferation and the formation of neural stem cell-like colonies in
human glioma cells. Mol. Cell. Biochem. 307, 101-108. 10.1007/s11010-007-9589-0.
40. Sahlgren C., Gustafsson M. V., Jin S., Poellinger L. & Lendahl U. (2008) Notch
signaling mediates hypoxia-induced tumor cell migration and invasion. Proc. Natl.
Acad. Sci. USA 105, 6392-6397. .
51
41. Soares R., Balogh G., Guo S., Gaertner F., Russo J. & Schmitt F. (2004)
Evidence for the Notch Signaling Pathway on the Role of Estrogen in Angiogenesis.
Mol. Endocrinol. 18, 2333-2343. .
42. Gustafsson M. V., Zheng X., Pereira T., Gradin K., Jin S., Lundkvist J., Ruas J.
L., Poellinger L., Lendahl U. & Bondesson M. (2005) Hypoxia requires notch
signaling to maintain the undifferentiated cell state. Developmental Cell. 9, 617-628. .
43. Zheng X., Linke S., Dias J. M., Zheng X., Gradin K., Wallis T. P., Hamilton B. R.,
Gustafsson M., Ruas J. L., Wilkins S., Bilton R. L., Brismar K., Whitelaw M. L.,
Pereira T., Gorman J. J., Ericson J., Peet D. J., Lendahl U. & Poellinger L. (2008)
Interaction with factor inhibiting HIF-1 defines an additional mode of cross-coupling
between the Notch and hypoxia signaling pathways. Proc. Natl. Acad. Sci. USA 105,
3368-3373. .
44. Clapham D. E., Runnels L. W. & Struebing C. (2001) The TRP ion channel family.
Nat. Rev. Neurosci. 2, 387-396. .
45. Dietrich A., Gudermann T. (2007) Trpc6. Handbook of Experimental
Pharmacology 125-141. .
46. Bomben V. C., Sontheimer H. W. (2008) Inhibition of transient receptor potential
canonical channels impairs cytokinesis in human malignant gliomas. Cell.
Proliferation 41, 98-121. .
47. Guilbert A., Dhennin-Duthille I., Hiani Y. E., Haren N., Khorsi H., Sevestre H.,
Ahidouch A. & Ouadid-Ahidouch H. (2008) Expression of TRPC6 channels in human
epithelial breast cancer cells. BMC Cancer 8, 125-125. .
48. Yao X., Garland C. J. (2005) Recent developments in vascular endothelial cell
transient receptor potential channels. Circulation Research 97, 853-863. .
49. Wang J., Weigand L., Lu W., Sylvester J. T., Semenza G. L. & Shimoda L. A.
(2006) Hypoxia inducible factor 1 mediates hypoxia-induced TRPC expression and
elevated intracellular Ca2+ in pulmonary arterial smooth muscle cells. Circulation
Research 98, 1528-1537. .

52
50. El Boustany C., Bidaux G., Enfissi A., Delcourt P., Prevarskaya N. & Capiod T.
(2008) Capacitative calcium entry and transient receptor potential canonical 6
expression control human hepatoma cell proliferation. Hepatology (Baltimore, Md. )
47, 2068-2077. .
51. Schneider B. P., Radovich M., Sledge G. W., Robarge J. D., Li L., Storniolo A. M.,
Lemler S., Nguyen A. T., Hancock B. A., Stout M., Skaar T. & Flockhart D. A. (2008)
Association of polymorphisms of angiogenesis genes with breast cancer. Breast
Cancer Res. Treat. 111, 157-163. 10.1007/s10549-007-9755-9.
52. Hayashi H., Nakagami H., Takami Y., Sato N., Saito Y., Nishikawa T., Mori M.,
Koriyama H., Tamai K., Morishita R. & Kaneda Y. (2007) Involvement of gamma-
secretase in postnatal angiogenesis. Biochemical and Biophysical Research
Communications 363, 584-590. .
53. Roy M., Pear W. S. & Aster J. C. (2007) The multifaceted role of Notch in cancer.
Curr. Opin. Genet. Dev. 17, 52-59. 10.1016/j.gde.2006.12.001.
54. Thebault S., Flourakis M., Vanoverberghe K., Vandermoere F., Roudbaraki M.,
Lehen'kyi V., Slomianny C., Beck B., Mariot P., Bonnal J., Mauroy B., Shuba Y.,
Capiod T., Skryma R. & Prevarskaya N. (2006) Differential role of transient receptor
potential channels in Ca2+ entry and proliferation of prostate cancer epithelial cells.
Cancer Res. 66, 2038-2047. .
55. Fowler M. A., Sidiropoulou K., Ozkan E. D., Phillips C. W. & Cooper D. C. (2007)
Corticolimbic expression of TRPC4 and TRPC5 channels in the rodent brain. PLoS
ONE 2, e573. .
56. Soboloff J., Spassova M., Xu W., He L., Cuesta N. & Gill D. L. (2005) Role of
Endogenous TRPC6 Channels in Ca super(2+) Signal Generation in A7r5 Smooth
Muscle Cells. J. Biol. Chem. 280, 39786-39794. .
57. [Anonymous]. Calculations of real-time PCR. .
58. Chigurupati S., Arumugam T. V., Son T. G., Lathia J. D., Jameel S., Mughal M.
R., Tang S., Jo D., Camandola S., Giunta M., Rakova I., McDonnell N., Miele L.,
Mattson M. P. & Poosala S. (2007) Involvement of notch signaling in wound healing.
PLoS ONE 2, e1167. .

53
59. Chigurupati S., Kulkarni T., Thomas S. & Shah G. (2005) Calcitonin stimulates
multiple stages of angiogenesis by directly acting on endothelial cells. Cancer.
Research 65, 8519-8529. .
60. Thomas S., Chigurupati S., Anbalagan M. & Shah G. (2006) Calcitonin increases
tumorigenicity of prostate cancer cells: evidence for the role of protein kinase A
and urokinase-type plasminogen receptor. Molecular Endocrinology (Baltimore,
Md. ) 20, 1894-1911. .