Embed Size (px)
Citation preview
University of Tennessee, Knoxville University of Tennessee, Knoxville
TRACE: Tennessee Research and Creative TRACE: Tennessee Research and Creative
Exchange Exchange
Masters Theses Graduate School
8-2016
Role of Sorting on the Composition of Siliciclastic Sediment: Role of Sorting on the Composition of Siliciclastic Sediment:
Implications for Interpreting Provenance after Limited Transport Implications for Interpreting Provenance after Limited Transport
in an Arid Climate in an Arid Climate
Forrest Christopher Driscoll University of Tennessee, Knoxville, [email protected]
Follow this and additional works at: https://trace.tennessee.edu/utk_gradthes
Part of the Geochemistry Commons, Geology Commons, and the Sedimentology Commons
Recommended Citation Recommended Citation Driscoll, Forrest Christopher, "Role of Sorting on the Composition of Siliciclastic Sediment: Implications for Interpreting Provenance after Limited Transport in an Arid Climate. " Master's Thesis, University of Tennessee, 2016. https://trace.tennessee.edu/utk_gradthes/4032
This Thesis is brought to you for free and open access by the Graduate School at TRACE: Tennessee Research and Creative Exchange. It has been accepted for inclusion in Masters Theses by an authorized administrator of TRACE: Tennessee Research and Creative Exchange. For more information, please contact [email protected].

To the Graduate Council:
I am submitting herewith a thesis written by Forrest Christopher Driscoll entitled "Role of Sorting
on the Composition of Siliciclastic Sediment: Implications for Interpreting Provenance after
Limited Transport in an Arid Climate." I have examined the final electronic copy of this thesis for
form and content and recommend that it be accepted in partial fulfillment of the requirements
for the degree of Master of Science, with a major in Geology.
Christopher M. Fedo, Major Professor
We have read this thesis and recommend its acceptance:
Annette S. Engel, Robert D. Hatcher
Accepted for the Council:
Carolyn R. Hodges
Vice Provost and Dean of the Graduate School
(Original signatures are on file with official student records.)
Role of Sorting on the Composition of Siliciclastic
Sediment: Implications for Interpreting Provenance
after Limited Transport in an Arid Climate
A Thesis Presented for the
Master of Science
Degree
The University of Tennessee, Knoxville
Forrest Christopher Driscoll
August 2016
ii
Copyright © 2016 by Forrest Christopher Driscoll
All rights reserved.
iii
ACKNOWLEDGEMENTS
Completion of this work was made possible through the assistance of many
people. Dr. Chris Fedo provided constant guidance, feedback, and fruitful discussion as
an advisor. Committee members Dr. Bob Hatcher and Dr. Annette Engel helped to
review my work and progress. Drs. Scott Samson and Mariana Bonich helped during a
field season in the Mojave Desert by providing on-site discussion. Dr. Jeff Moersch
operated the drone used to obtain high resolution aerial photographs of the field site.
Graduate students at the University of Tennessee, friends, and family offered tremendous
guidance and support during the completion of my degree. A grant awarded from the
Geological Society of America was used to fund the petrography, geochemistry, and
travel expenses for this study.
iv
ABSTRACT
This study tested whether transport distances (< 500 m) have the capacity to shape
the geochemistry of sediments across multiple grain-size populations due to sorting
derived from a single source. In the Stepladder Mountains, Mojave Desert, CA, a < 1 km2
[square kilometers] watershed allows for a controlled study to understand how modern
sediments acquire their composition from a single granodioritic source in an arid climate
where there is no chemical weathering. Sediments are naturally sorted into distinct grain-
size populations, with modes ranging from very fine sand to gravel within a single,
alluvial channel. Sediment samples representative of each population were
petrographically and geochemically analyzed in order to test the effectiveness of
commonly used discrimination diagrams. Sediments became proportionally enriched in
plagioclase and biotite and depleted in K-feldspar and quartz with decreasing grain size.
Major elements were plotted in Al2O3 [aluminum oxide]–CaO*+Na2O [sodium oxide]–
K2O [potassium oxide] and Al2O3–CaO*+Na2O+K2O–FeO+MgO compositional space
and indicate that a negligible degree of chemical weathering was involved in sediment
production. Trace-element plots normalized to average granodiorite bedrock show strong
enrichments in elements thought to be immobile during sedimentary processing (Cr, Co,
and Sc) across nearly all sediment samples. Using any of these elements as ratios (Th/Co,
La/Sc, Th/Sc, Cr/Th, Zr/Sc) in provenance discriminating plots reveal that sediment was
formed source mixing, as sediments in these plots considerably deviate from bedrock
composition due to the control grain size has on geochemistry. Sediment rare-earth
element (REE) contents also deviate from source composition and show an increase in
total REE content, decrease in fractionation of light REEs and heavy REEs, and an

v
increase in the magnitude of the negative Eu anomaly with decreasing grain size.
Variations in sediment composition and thus geochemical ratios result from mineral
sorting during transport, no matter how short. Thus, strong caution must be used when
using discrimination diagrams to interpret sediment and sedimentary rock provenance.
vi
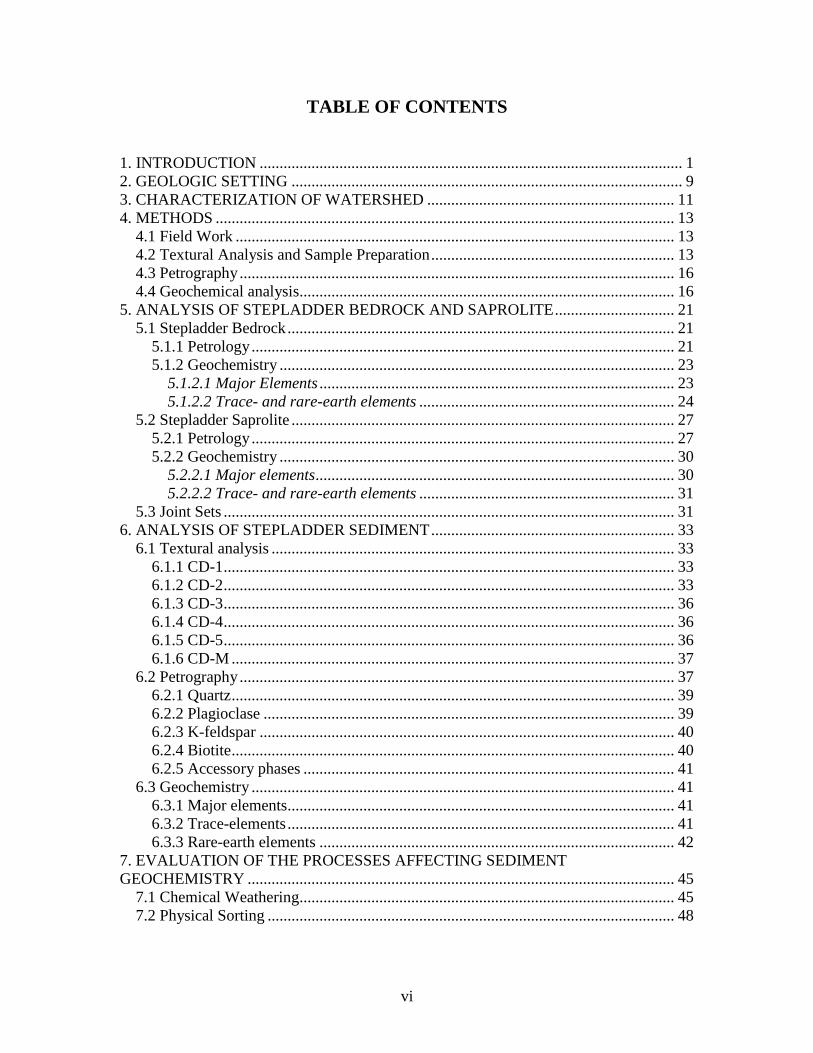
TABLE OF CONTENTS
1. INTRODUCTION .......................................................................................................... 1 2. GEOLOGIC SETTING .................................................................................................. 9 3. CHARACTERIZATION OF WATERSHED .............................................................. 11
4. METHODS ................................................................................................................... 13 4.1 Field Work .............................................................................................................. 13 4.2 Textural Analysis and Sample Preparation ............................................................. 13 4.3 Petrography ............................................................................................................. 16 4.4 Geochemical analysis.............................................................................................. 16
5. ANALYSIS OF STEPLADDER BEDROCK AND SAPROLITE .............................. 21 5.1 Stepladder Bedrock ................................................................................................. 21
5.1.1 Petrology .......................................................................................................... 21 5.1.2 Geochemistry ................................................................................................... 23
5.1.2.1 Major Elements ......................................................................................... 23 5.1.2.2 Trace- and rare-earth elements ................................................................ 24
5.2 Stepladder Saprolite ................................................................................................ 27 5.2.1 Petrology .......................................................................................................... 27 5.2.2 Geochemistry ................................................................................................... 30
5.2.2.1 Major elements.......................................................................................... 30 5.2.2.2 Trace- and rare-earth elements ................................................................ 31
5.3 Joint Sets ................................................................................................................. 31 6. ANALYSIS OF STEPLADDER SEDIMENT ............................................................. 33
6.1 Textural analysis ..................................................................................................... 33
6.1.1 CD-1 ................................................................................................................. 33
6.1.2 CD-2 ................................................................................................................. 33 6.1.3 CD-3 ................................................................................................................. 36 6.1.4 CD-4 ................................................................................................................. 36
6.1.5 CD-5 ................................................................................................................. 36 6.1.6 CD-M ............................................................................................................... 37
6.2 Petrography ............................................................................................................. 37 6.2.1 Quartz ............................................................................................................... 39 6.2.2 Plagioclase ....................................................................................................... 39 6.2.3 K-feldspar ........................................................................................................ 40
6.2.4 Biotite ............................................................................................................... 40 6.2.5 Accessory phases ............................................................................................. 41
6.3 Geochemistry .......................................................................................................... 41
6.3.1 Major elements................................................................................................. 41 6.3.2 Trace-elements ................................................................................................. 41 6.3.3 Rare-earth elements ......................................................................................... 42
7. EVALUATION OF THE PROCESSES AFFECTING SEDIMENT
GEOCHEMISTRY ........................................................................................................... 45 7.1 Chemical Weathering.............................................................................................. 45 7.2 Physical Sorting ...................................................................................................... 48
vii
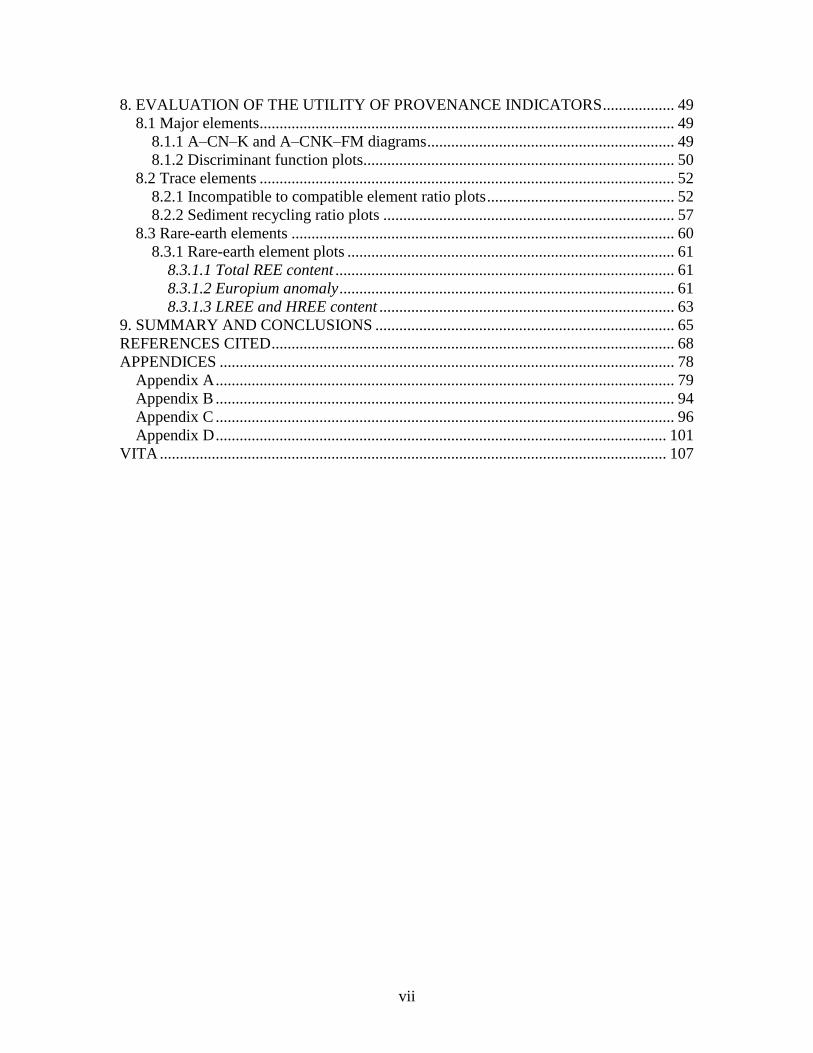
8. EVALUATION OF THE UTILITY OF PROVENANCE INDICATORS .................. 49 8.1 Major elements........................................................................................................ 49
8.1.1 A–CN–K and A–CNK–FM diagrams .............................................................. 49 8.1.2 Discriminant function plots.............................................................................. 50
8.2 Trace elements ........................................................................................................ 52 8.2.1 Incompatible to compatible element ratio plots ............................................... 52 8.2.2 Sediment recycling ratio plots ......................................................................... 57
8.3 Rare-earth elements ................................................................................................ 60 8.3.1 Rare-earth element plots .................................................................................. 61
8.3.1.1 Total REE content ..................................................................................... 61 8.3.1.2 Europium anomaly .................................................................................... 61 8.3.1.3 LREE and HREE content .......................................................................... 63
9. SUMMARY AND CONCLUSIONS ........................................................................... 65
REFERENCES CITED ..................................................................................................... 68 APPENDICES .................................................................................................................. 78
Appendix A ................................................................................................................... 79 Appendix B ................................................................................................................... 94
Appendix C ................................................................................................................... 96 Appendix D ................................................................................................................. 101
VITA ............................................................................................................................... 107
viii
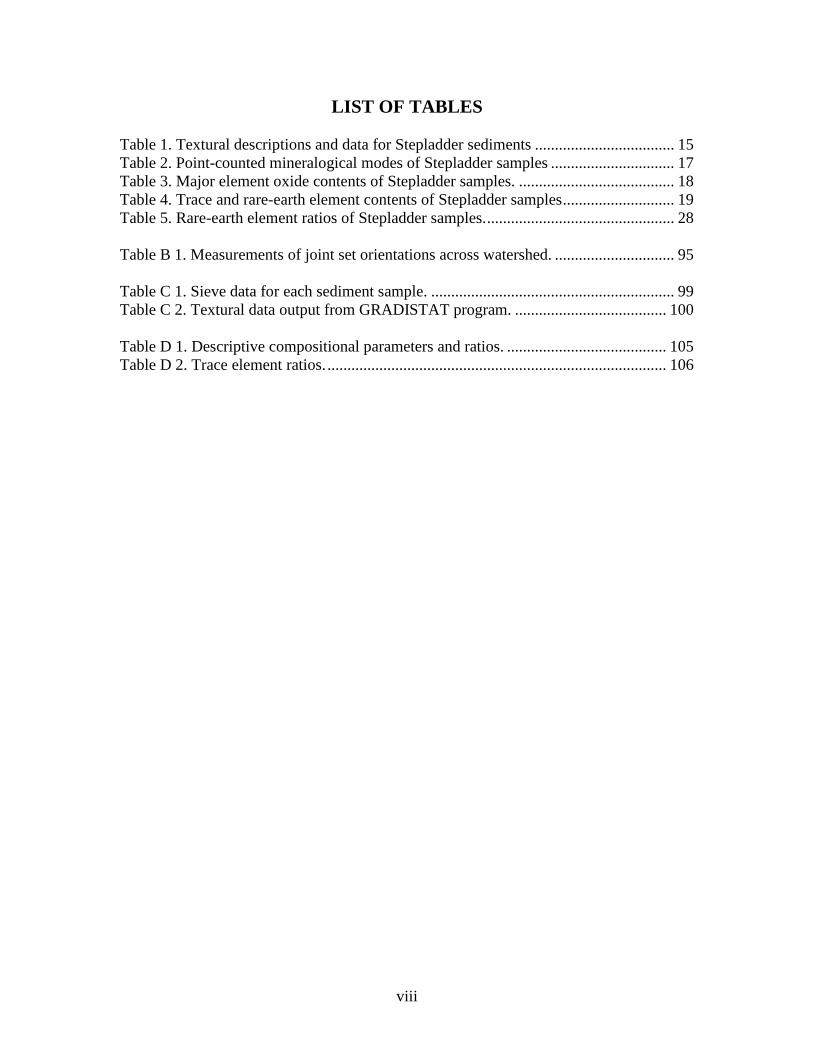
LIST OF TABLES
Table 1. Textural descriptions and data for Stepladder sediments ................................... 15 Table 2. Point-counted mineralogical modes of Stepladder samples ............................... 17 Table 3. Major element oxide contents of Stepladder samples. ....................................... 18 Table 4. Trace and rare-earth element contents of Stepladder samples ............................ 19
Table 5. Rare-earth element ratios of Stepladder samples. ............................................... 28
Table B 1. Measurements of joint set orientations across watershed. .............................. 95
Table C 1. Sieve data for each sediment sample. ............................................................. 99
Table C 2. Textural data output from GRADISTAT program. ...................................... 100
Table D 1. Descriptive compositional parameters and ratios. ........................................ 105 Table D 2. Trace element ratios. ..................................................................................... 106
ix
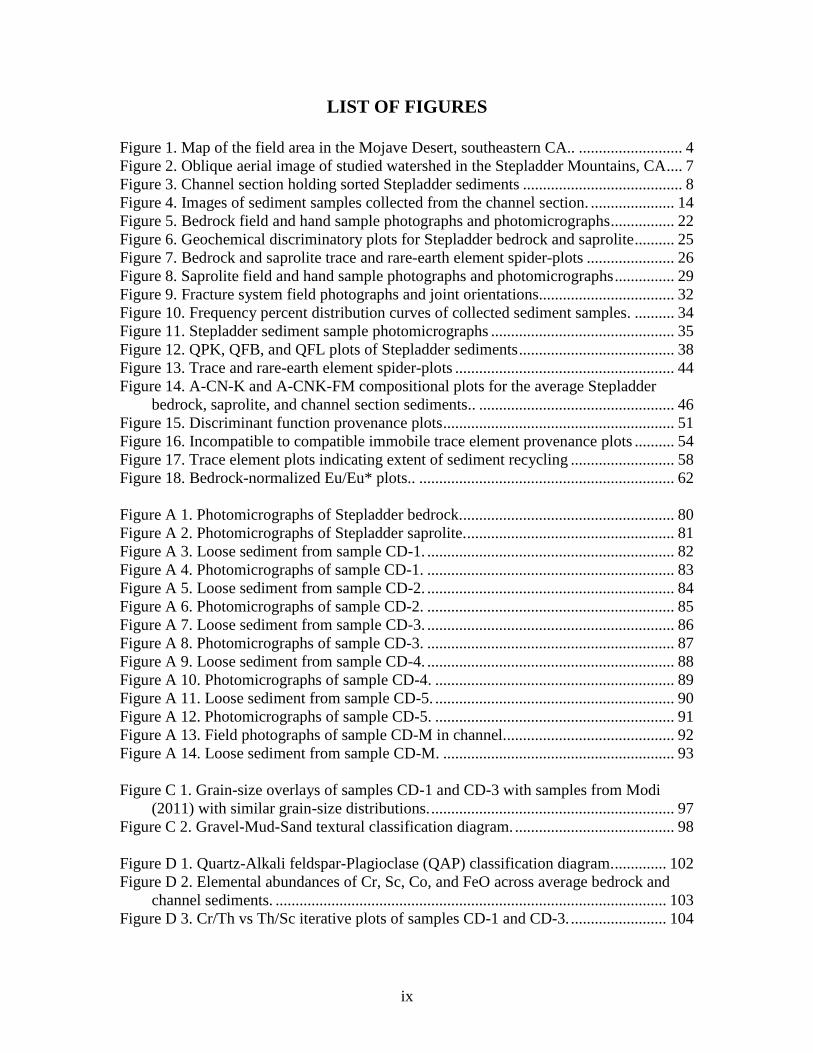
LIST OF FIGURES
Figure 1. Map of the field area in the Mojave Desert, southeastern CA.. .......................... 4
Figure 2. Oblique aerial image of studied watershed in the Stepladder Mountains, CA .... 7 Figure 3. Channel section holding sorted Stepladder sediments ........................................ 8 Figure 4. Images of sediment samples collected from the channel section. ..................... 14 Figure 5. Bedrock field and hand sample photographs and photomicrographs ................ 22 Figure 6. Geochemical discriminatory plots for Stepladder bedrock and saprolite .......... 25
Figure 7. Bedrock and saprolite trace and rare-earth element spider-plots ...................... 26 Figure 8. Saprolite field and hand sample photographs and photomicrographs ............... 29 Figure 9. Fracture system field photographs and joint orientations.................................. 32 Figure 10. Frequency percent distribution curves of collected sediment samples. .......... 34 Figure 11. Stepladder sediment sample photomicrographs .............................................. 35
Figure 12. QPK, QFB, and QFL plots of Stepladder sediments ....................................... 38 Figure 13. Trace and rare-earth element spider-plots ....................................................... 44
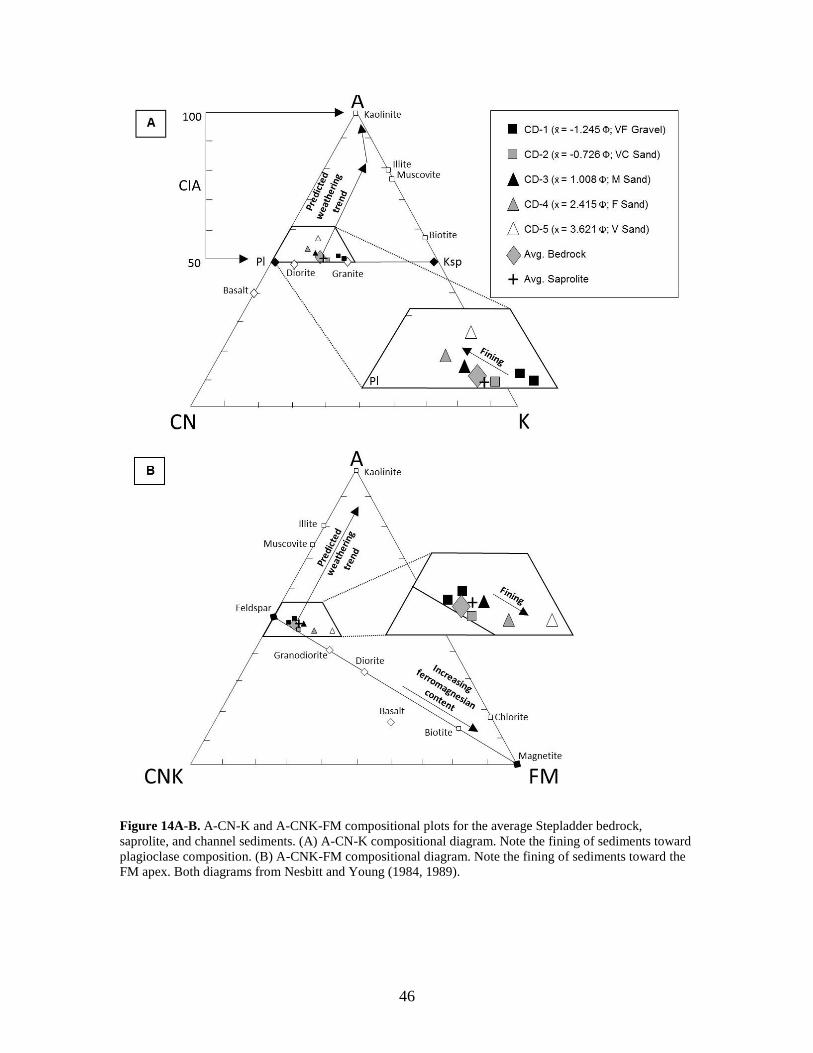
Figure 14. A-CN-K and A-CNK-FM compositional plots for the average Stepladder
bedrock, saprolite, and channel section sediments.. ................................................. 46
Figure 15. Discriminant function provenance plots .......................................................... 51 Figure 16. Incompatible to compatible immobile trace element provenance plots .......... 54 Figure 17. Trace element plots indicating extent of sediment recycling .......................... 58
Figure 18. Bedrock-normalized Eu/Eu* plots.. ................................................................ 62
Figure A 1. Photomicrographs of Stepladder bedrock. ..................................................... 80 Figure A 2. Photomicrographs of Stepladder saprolite. .................................................... 81 Figure A 3. Loose sediment from sample CD-1. .............................................................. 82
Figure A 4. Photomicrographs of sample CD-1. .............................................................. 83
Figure A 5. Loose sediment from sample CD-2. .............................................................. 84 Figure A 6. Photomicrographs of sample CD-2. .............................................................. 85 Figure A 7. Loose sediment from sample CD-3. .............................................................. 86
Figure A 8. Photomicrographs of sample CD-3. .............................................................. 87 Figure A 9. Loose sediment from sample CD-4. .............................................................. 88 Figure A 10. Photomicrographs of sample CD-4. ............................................................ 89
Figure A 11. Loose sediment from sample CD-5. ............................................................ 90 Figure A 12. Photomicrographs of sample CD-5. ............................................................ 91 Figure A 13. Field photographs of sample CD-M in channel........................................... 92 Figure A 14. Loose sediment from sample CD-M. .......................................................... 93
Figure C 1. Grain-size overlays of samples CD-1 and CD-3 with samples from Modi
(2011) with similar grain-size distributions. ............................................................. 97
Figure C 2. Gravel-Mud-Sand textural classification diagram. ........................................ 98
Figure D 1. Quartz-Alkali feldspar-Plagioclase (QAP) classification diagram. ............. 102 Figure D 2. Elemental abundances of Cr, Sc, Co, and FeO across average bedrock and
channel sediments. .................................................................................................. 103 Figure D 3. Cr/Th vs Th/Sc iterative plots of samples CD-1 and CD-3. ........................ 104
1
1. INTRODUCTION
Unravelling the petrologic origin of sediment requires an approach that addresses
the processes that control detrital composition from source to sink. Beyond original
provenance compositions, sedimentary processes, such as chemical weathering, source
mixing, mineral sorting during transport, and diagenesis, are all capable of affecting the
composition of sediment after being released from source (Johnsson, 1993). Thus, the
ability to reconstruct provenance (i.e., deciphering source rock characteristics from
sediment) is limited to how well each step is understood.
For decades, numerous studies have used petrography and geochemistry as a way
to reconstruct sediment provenance under the premise that source is the dominant control
on sediment composition. Petrographic applications used the mineralogical modes to
interpret tectonic settings of source terrains (Dickinson, 1970; Dickinson and Suczek,
1979; Dickinson and Valloni, 1980; Bhatia, 1983; Dickinson et al., 1983; Ingersoll et al.,
1984) and to decipher paleoclimates (Basu, 1976; Suttner et al., 1981; Basu, 1985). With
the advent of methods capable of extracting whole-rock geochemical information, major
oxides have been used to observe the relationships between feldspar destruction and clay
production (Nesbitt and Young, 1982) as a way to understand the role chemical
weathering has on sediment composition (Nesbitt and Markovics, 1980; Roser and
Korsch, 1988; Nesbitt and Young, 1996; Young and Nesbitt, 1998). As the understanding
of the types of compositional changes that occur during soil formation improved, major-
element compositions of sediments were used to interpret source rock compositions
(Roser and Korsch, 1988; Fedo et al., 1995).
2
Groundbreaking geochemical work by Taylor and McLennan (1985) used trace-
element patterns from sedimentary rocks to determine the average composition of the
upper continental crust and its evolution, which subsequently broadened the application
of using trace elements and rare-earth elements (REE) for provenance interpretation. Key
findings presented in Taylor and McLennan (1985) suggested that certain trace elements
with low solubility values (e.g. Zr, Hf, Sc, Cr, Th, Co and the REEs), and thus low
residence times in water, are quantitatively transferred to the sedimentary record from
source, regardless of denundational processes. Under this principle, many studies have
expressed trace element compositions of sediment and sedimentary rocks as derived
ratios (e.g. Th/Sc, La/Sc, Cr/Th, Th/Co) to interpret sources with similar geochemical
characteristics (e.g. Bhatia and Crook, 1986; Wronkiewicz and Condie, 1987; McLennan,
1989; Feng and Kerrich, 1990; McLennan and Taylor, 1991; Condie et al., 1992;
McLennan et al., 1993; Cullers, 1994; Fedo et al., 1996; Fralick and Kronberg, 1997;
Holail and Moghazi, 1998; Armstrong-Altrin et al., 2004; Cullers, 2002; Oni et al., 2014;
Eizenhöfer et al., 2015; Xiang et al., 2015).
Caution must be taken when using provenance discriminating techniques whose
basis is the transfer of major or trace elements to the sedimentary record via chemical
weathering, because such approaches disregard the notion that sediment may partly
acquire its composition by mechanical processes during transport. In particular, mineral
fractionation (i.e., sorting) causes concern in evaluating provenance (Cullers et al., 1987;
Cullers, 1988; Nesbitt and Young, 1996; Fedo et al., 2015) because sorting is governed
by how different minerals behave in water flow based upon their textural properties (e.g.
density, shape, and crystal structure) that commonly result in the preferential
3
concentration of certain minerals into different grain-size fractions. This means that
sorting introduces the possibility that some sediment fractions will become enriched in
accessory minerals abundant in specific trace elements. Because trace elements and the
minerals that they are incorporated in are linked to each other, elemental ratios commonly
used to infer source composition may reveal geochemical values that are disproportionate
to those of the actual provenance if minerals holding trace elements have become either
concentrated or depleted in a fraction of sediment. As a result, it should be expected that
some elemental ratios used for revealing source compositions may be impacted by
sorting.
Despite the effects that sorting could impose on the composition of sediment,
source-discriminating ratios are still extensively used to interpret provenance under the
assumption that the chosen elements behave as a closed system during weathering and
are quantitatively transferred to the sedimentary record. Recent studies (e.g. Singh, 2009;
Schoenborn et al., 2012; Tang et al., 2012) use either trace-element signatures, elemental
ratios, or REE patterns to infer the possible sources of sediment without accounting for
the possible effects of sorting. In light of this situation, and following on the approach in
Nesbitt and Young (1996) and Nesbitt et al. (1997), a controlled study is needed that aims
to understand how siliciclastic sediment directly receives its composition from a single,
simple geologic system with a known sediment source. Such a study can be conducted by
going to a location that eliminates, minimizes, or controls the intensity of all other
processes capable of modifying sediment composition.
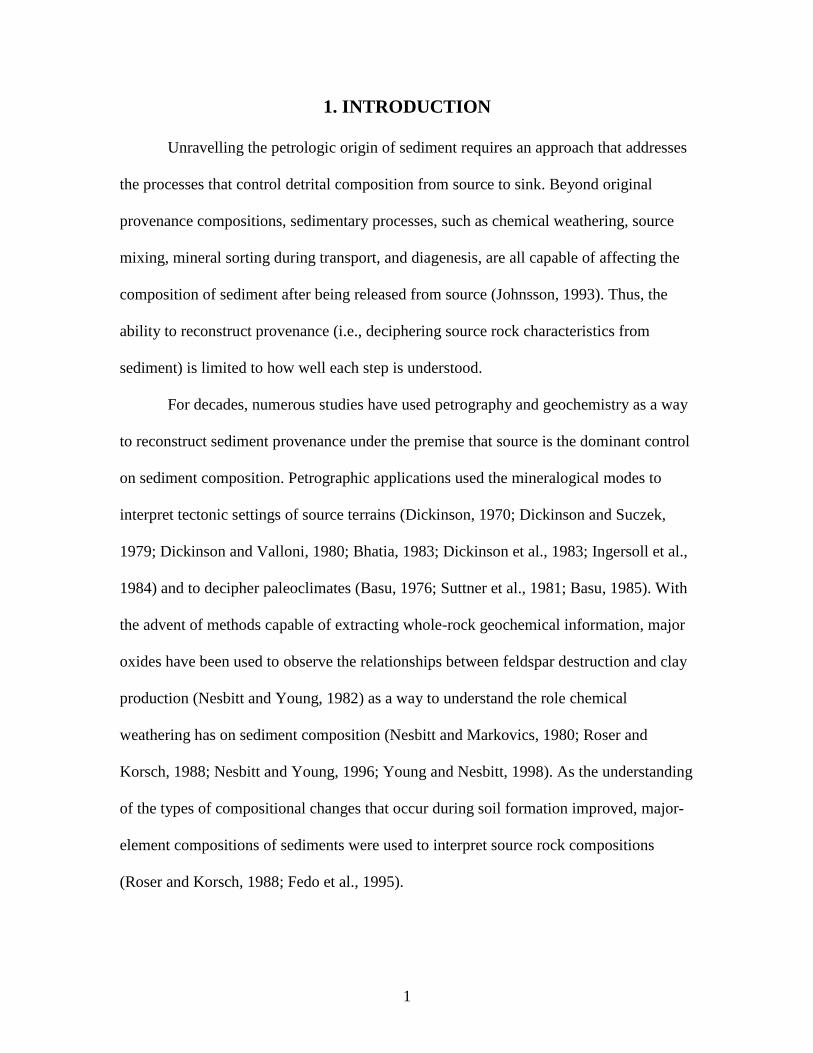
Modi (2011) conducted such a study in the Stepladder Mountains in the Mojave
Desert, CA (Fig. 1). The work was designed to test whether a mineralogical and
4
Figure 1. Map of the field area in the Mojave Desert, southeastern CA. The watershed site lies in the
northern tip of the granitic Stepladder pluton (Ksp). Other exposed lithological units are marked. The red
line marks the path in which sediment samples were collected across the pediment dome by Modi (2011).
5
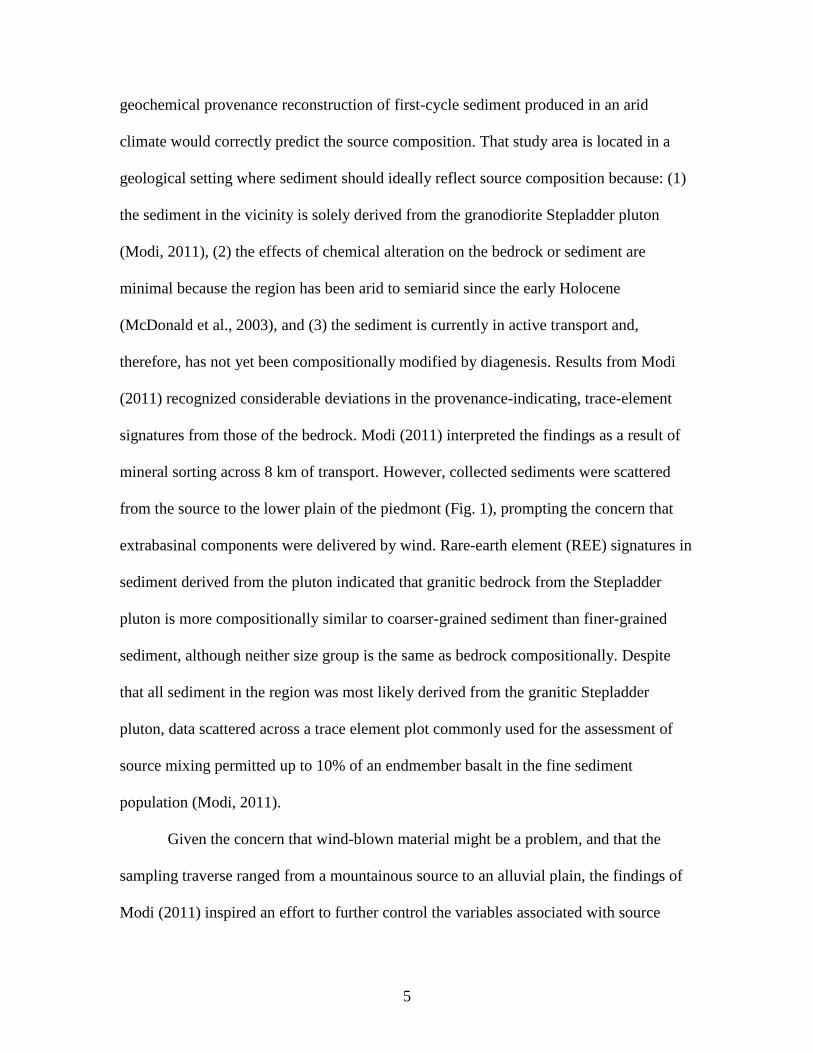
geochemical provenance reconstruction of first-cycle sediment produced in an arid
climate would correctly predict the source composition. That study area is located in a
geological setting where sediment should ideally reflect source composition because: (1)
the sediment in the vicinity is solely derived from the granodiorite Stepladder pluton
(Modi, 2011), (2) the effects of chemical alteration on the bedrock or sediment are
minimal because the region has been arid to semiarid since the early Holocene
(McDonald et al., 2003), and (3) the sediment is currently in active transport and,
therefore, has not yet been compositionally modified by diagenesis. Results from Modi
(2011) recognized considerable deviations in the provenance-indicating, trace-element
signatures from those of the bedrock. Modi (2011) interpreted the findings as a result of
mineral sorting across 8 km of transport. However, collected sediments were scattered
from the source to the lower plain of the piedmont (Fig. 1), prompting the concern that
extrabasinal components were delivered by wind. Rare-earth element (REE) signatures in
sediment derived from the pluton indicated that granitic bedrock from the Stepladder
pluton is more compositionally similar to coarser-grained sediment than finer-grained
sediment, although neither size group is the same as bedrock compositionally. Despite
that all sediment in the region was most likely derived from the granitic Stepladder
pluton, data scattered across a trace element plot commonly used for the assessment of
source mixing permitted up to 10% of an endmember basalt in the fine sediment
population (Modi, 2011).
Given the concern that wind-blown material might be a problem, and that the
sampling traverse ranged from a mountainous source to an alluvial plain, the findings of
Modi (2011) inspired an effort to further control the variables associated with source
6
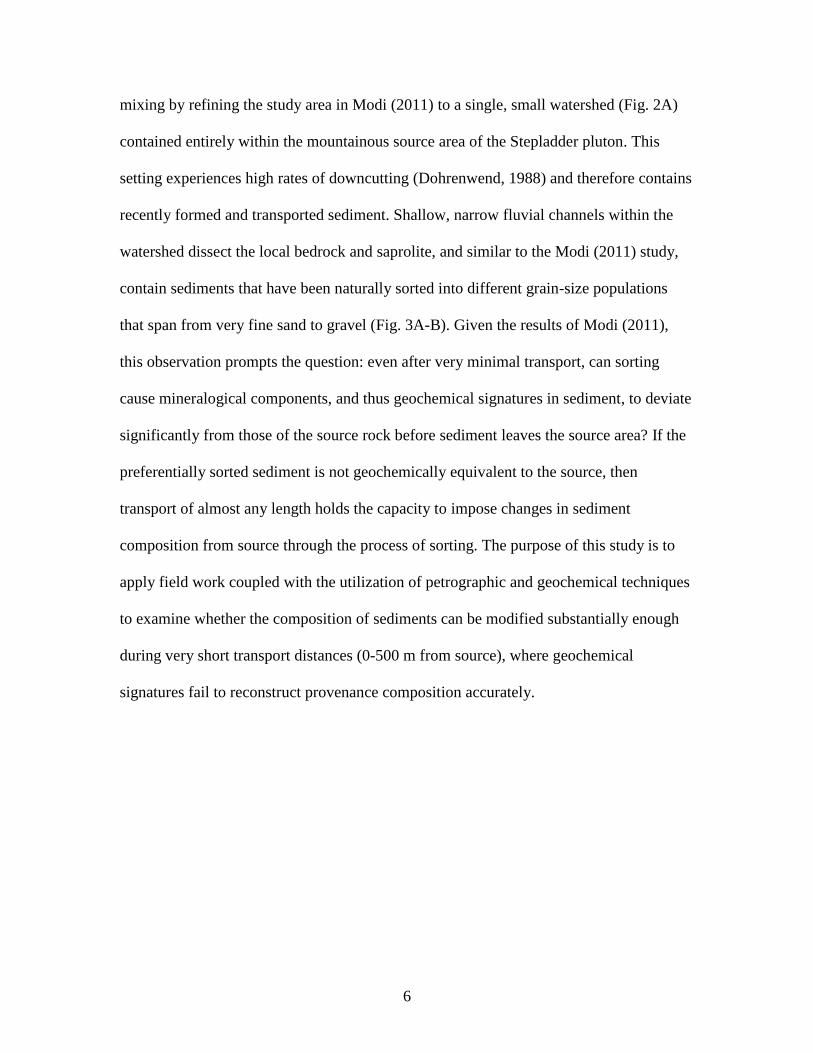
mixing by refining the study area in Modi (2011) to a single, small watershed (Fig. 2A)
contained entirely within the mountainous source area of the Stepladder pluton. This
setting experiences high rates of downcutting (Dohrenwend, 1988) and therefore contains
recently formed and transported sediment. Shallow, narrow fluvial channels within the
watershed dissect the local bedrock and saprolite, and similar to the Modi (2011) study,
contain sediments that have been naturally sorted into different grain-size populations
that span from very fine sand to gravel (Fig. 3A-B). Given the results of Modi (2011),
this observation prompts the question: even after very minimal transport, can sorting
cause mineralogical components, and thus geochemical signatures in sediment, to deviate
significantly from those of the source rock before sediment leaves the source area? If the
preferentially sorted sediment is not geochemically equivalent to the source, then
transport of almost any length holds the capacity to impose changes in sediment
composition from source through the process of sorting. The purpose of this study is to
apply field work coupled with the utilization of petrographic and geochemical techniques
to examine whether the composition of sediments can be modified substantially enough
during very short transport distances (0-500 m from source), where geochemical
signatures fail to reconstruct provenance composition accurately.
7
Figure 2A-D. Oblique low altitude aerial image looking west into studied watershed in the Stepladder
Mountains, CA. (A) Boundary of watershed used in this study. Watershed margin is delineated in red. Two
main channels are marked in white, with smaller feeding channels in blue. Black box indicates location of
channel confluence where sediment samples were collected. (B) Topographic profile of the dotted white
cross section line from A to A’. (C) Topographic profile of the south channel. (D) Topographic profile of
north channel.
8
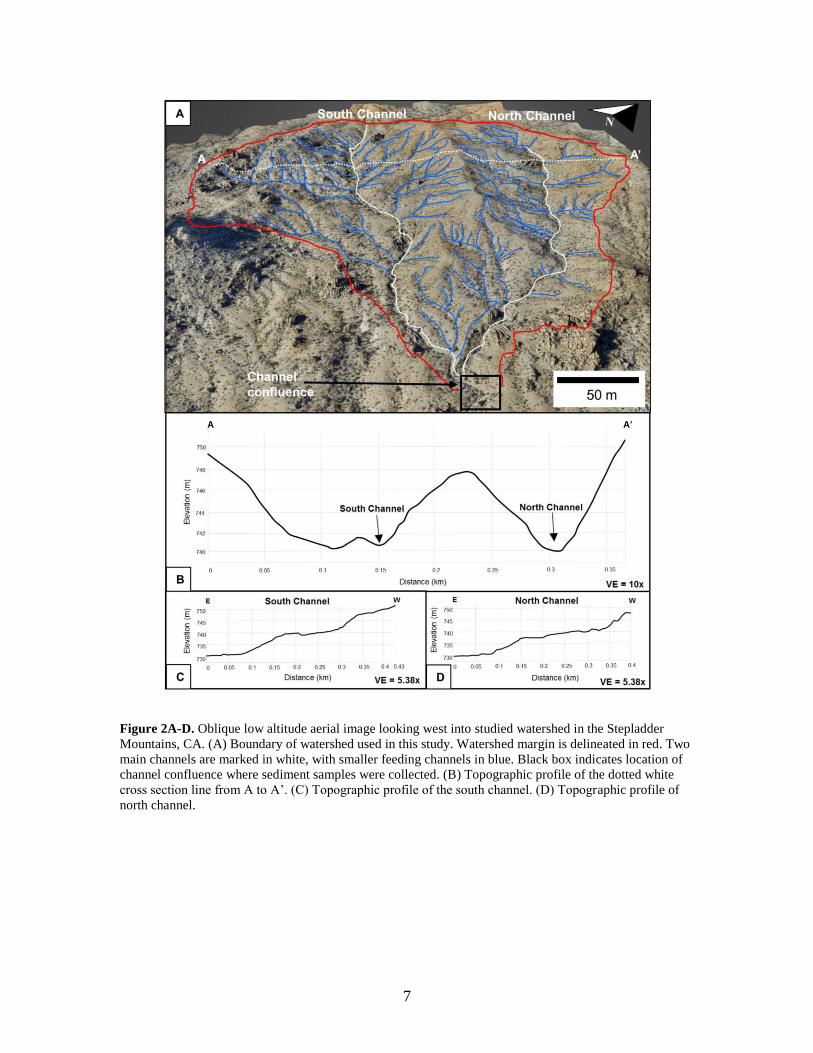
Figure 3A-B. Channel area holding sorted Stepladder sediments. (A) Direct overhead image of bending
channel. White arrow denotes the direction of sediment transport. (B) Outline of the channel field site with
general locations of grain-size populations. White arrow denotes the direction of sediment transport.
Coordinates for channel area: 34°40’18.5’’N, 114°50’22.3’’W.
9
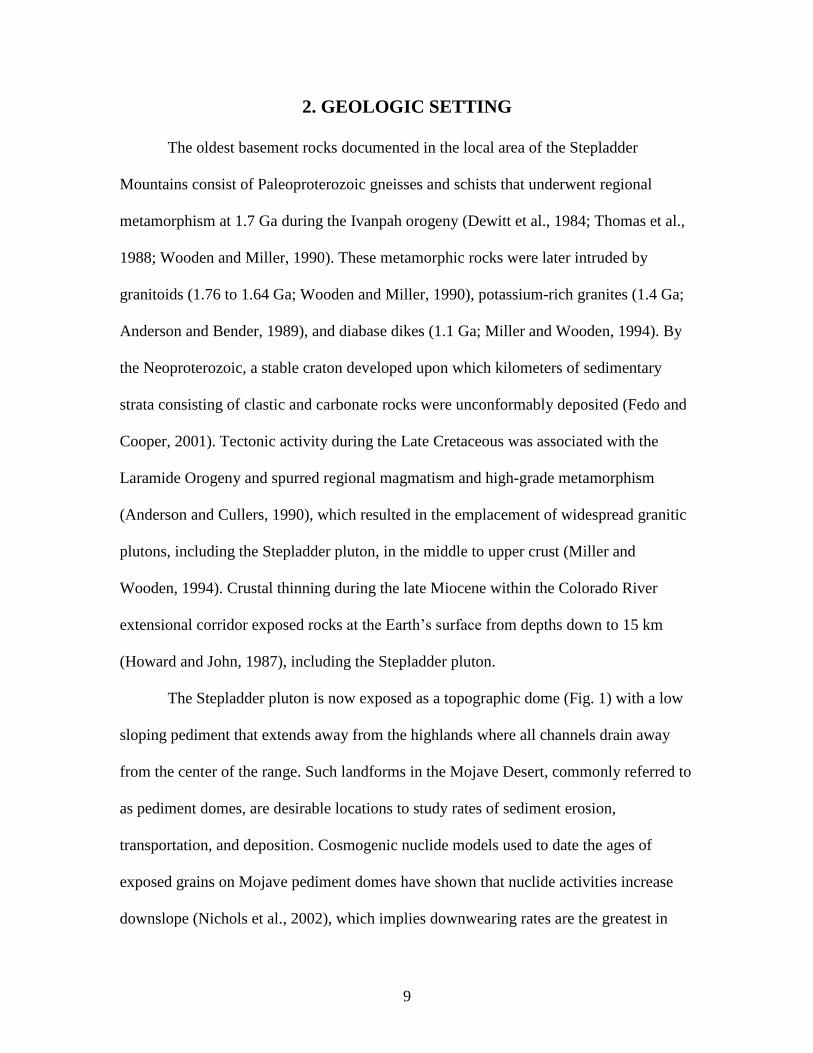
2. GEOLOGIC SETTING
The oldest basement rocks documented in the local area of the Stepladder
Mountains consist of Paleoproterozoic gneisses and schists that underwent regional
metamorphism at 1.7 Ga during the Ivanpah orogeny (Dewitt et al., 1984; Thomas et al.,
1988; Wooden and Miller, 1990). These metamorphic rocks were later intruded by
granitoids (1.76 to 1.64 Ga; Wooden and Miller, 1990), potassium-rich granites (1.4 Ga;
Anderson and Bender, 1989), and diabase dikes (1.1 Ga; Miller and Wooden, 1994). By
the Neoproterozoic, a stable craton developed upon which kilometers of sedimentary
strata consisting of clastic and carbonate rocks were unconformably deposited (Fedo and
Cooper, 2001). Tectonic activity during the Late Cretaceous was associated with the
Laramide Orogeny and spurred regional magmatism and high-grade metamorphism
(Anderson and Cullers, 1990), which resulted in the emplacement of widespread granitic
plutons, including the Stepladder pluton, in the middle to upper crust (Miller and
Wooden, 1994). Crustal thinning during the late Miocene within the Colorado River
extensional corridor exposed rocks at the Earth’s surface from depths down to 15 km
(Howard and John, 1987), including the Stepladder pluton.
The Stepladder pluton is now exposed as a topographic dome (Fig. 1) with a low
sloping pediment that extends away from the highlands where all channels drain away
from the center of the range. Such landforms in the Mojave Desert, commonly referred to
as pediment domes, are desirable locations to study rates of sediment erosion,
transportation, and deposition. Cosmogenic nuclide models used to date the ages of
exposed grains on Mojave pediment domes have shown that nuclide activities increase
downslope (Nichols et al., 2002), which implies downwearing rates are the greatest in
10
mountainous areas with the steepest topography. Depositional rates of piedmont
sediments in the Mojave Desert increase between 18 to 39 mm/ky throughout the
Pleistocene (Nichols et al., 2005), until the early Holocene when the climate shifted to
arid conditions. Due to the low annual rainfall in the Mojave Desert (12 cm/year; Stoffer,
2004), sediments are transported only decimeters per year across piedmonts (Nichols et
al., 2002; Nichols et al., 2005). Greatest lengths of sediment transport occur within
channel systems, where sediments can be transported several meters per year (Nichols et
al., 2005) during strong rain events.
11
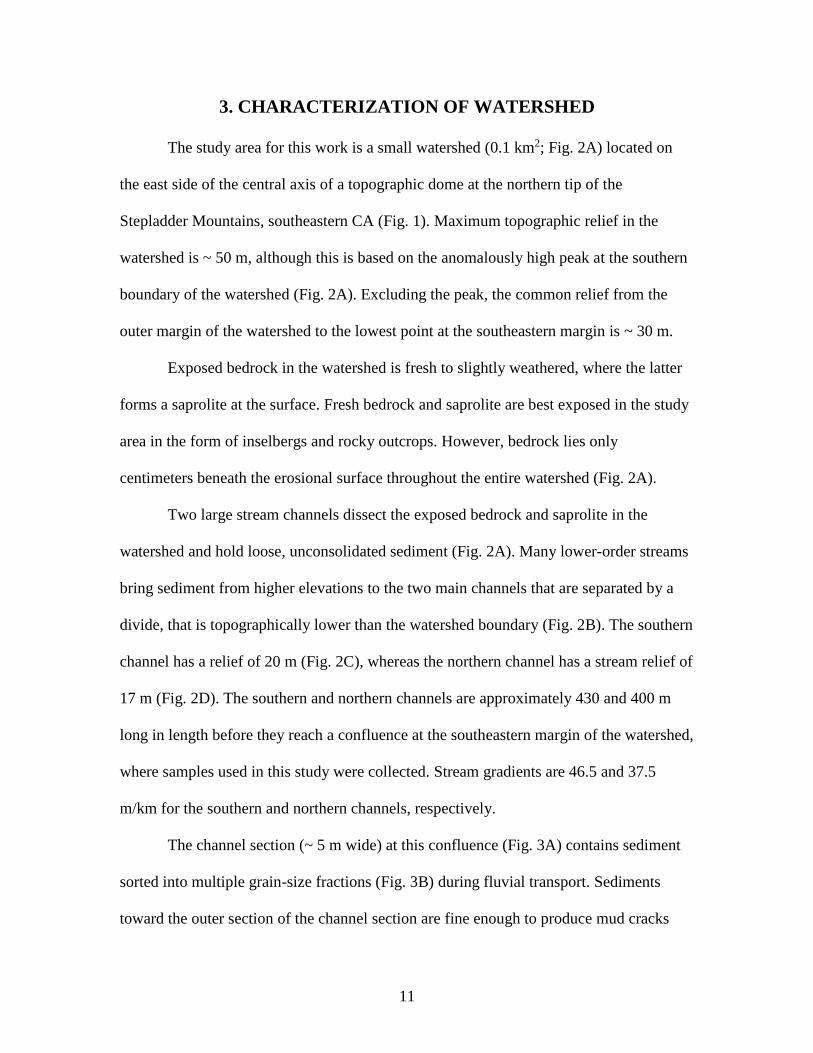
3. CHARACTERIZATION OF WATERSHED
The study area for this work is a small watershed (0.1 km2; Fig. 2A) located on
the east side of the central axis of a topographic dome at the northern tip of the
Stepladder Mountains, southeastern CA (Fig. 1). Maximum topographic relief in the
watershed is ~ 50 m, although this is based on the anomalously high peak at the southern
boundary of the watershed (Fig. 2A). Excluding the peak, the common relief from the
outer margin of the watershed to the lowest point at the southeastern margin is ~ 30 m.
Exposed bedrock in the watershed is fresh to slightly weathered, where the latter
forms a saprolite at the surface. Fresh bedrock and saprolite are best exposed in the study
area in the form of inselbergs and rocky outcrops. However, bedrock lies only
centimeters beneath the erosional surface throughout the entire watershed (Fig. 2A).
Two large stream channels dissect the exposed bedrock and saprolite in the
watershed and hold loose, unconsolidated sediment (Fig. 2A). Many lower-order streams
bring sediment from higher elevations to the two main channels that are separated by a
divide, that is topographically lower than the watershed boundary (Fig. 2B). The southern
channel has a relief of 20 m (Fig. 2C), whereas the northern channel has a stream relief of
17 m (Fig. 2D). The southern and northern channels are approximately 430 and 400 m
long in length before they reach a confluence at the southeastern margin of the watershed,
where samples used in this study were collected. Stream gradients are 46.5 and 37.5
m/km for the southern and northern channels, respectively.
The channel section (~ 5 m wide) at this confluence (Fig. 3A) contains sediment
sorted into multiple grain-size fractions (Fig. 3B) during fluvial transport. Sediments
toward the outer section of the channel section are fine enough to produce mud cracks

12
during desiccation. Local small patches of accessory mineral deposits that contain
distinctively darker grains are located in the main channels.
13
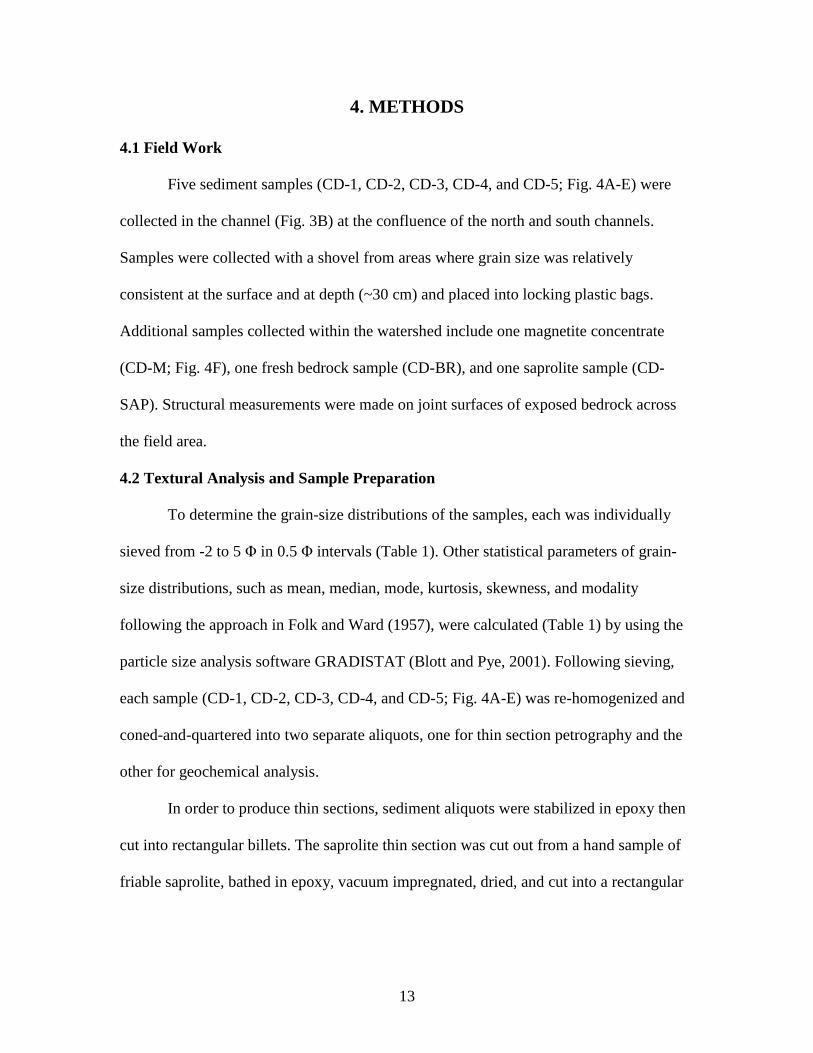
4. METHODS
4.1 Field Work
Five sediment samples (CD-1, CD-2, CD-3, CD-4, and CD-5; Fig. 4A-E) were
collected in the channel (Fig. 3B) at the confluence of the north and south channels.
Samples were collected with a shovel from areas where grain size was relatively
consistent at the surface and at depth (~30 cm) and placed into locking plastic bags.
Additional samples collected within the watershed include one magnetite concentrate
(CD-M; Fig. 4F), one fresh bedrock sample (CD-BR), and one saprolite sample (CD-
SAP). Structural measurements were made on joint surfaces of exposed bedrock across
the field area.
4.2 Textural Analysis and Sample Preparation
To determine the grain-size distributions of the samples, each was individually
sieved from -2 to 5 Φ in 0.5 Φ intervals (Table 1). Other statistical parameters of grain-
size distributions, such as mean, median, mode, kurtosis, skewness, and modality
following the approach in Folk and Ward (1957), were calculated (Table 1) by using the
particle size analysis software GRADISTAT (Blott and Pye, 2001). Following sieving,
each sample (CD-1, CD-2, CD-3, CD-4, and CD-5; Fig. 4A-E) was re-homogenized and
coned-and-quartered into two separate aliquots, one for thin section petrography and the
other for geochemical analysis.
In order to produce thin sections, sediment aliquots were stabilized in epoxy then
cut into rectangular billets. The saprolite thin section was cut out from a hand sample of
friable saprolite, bathed in epoxy, vacuum impregnated, dried, and cut into a rectangular
14
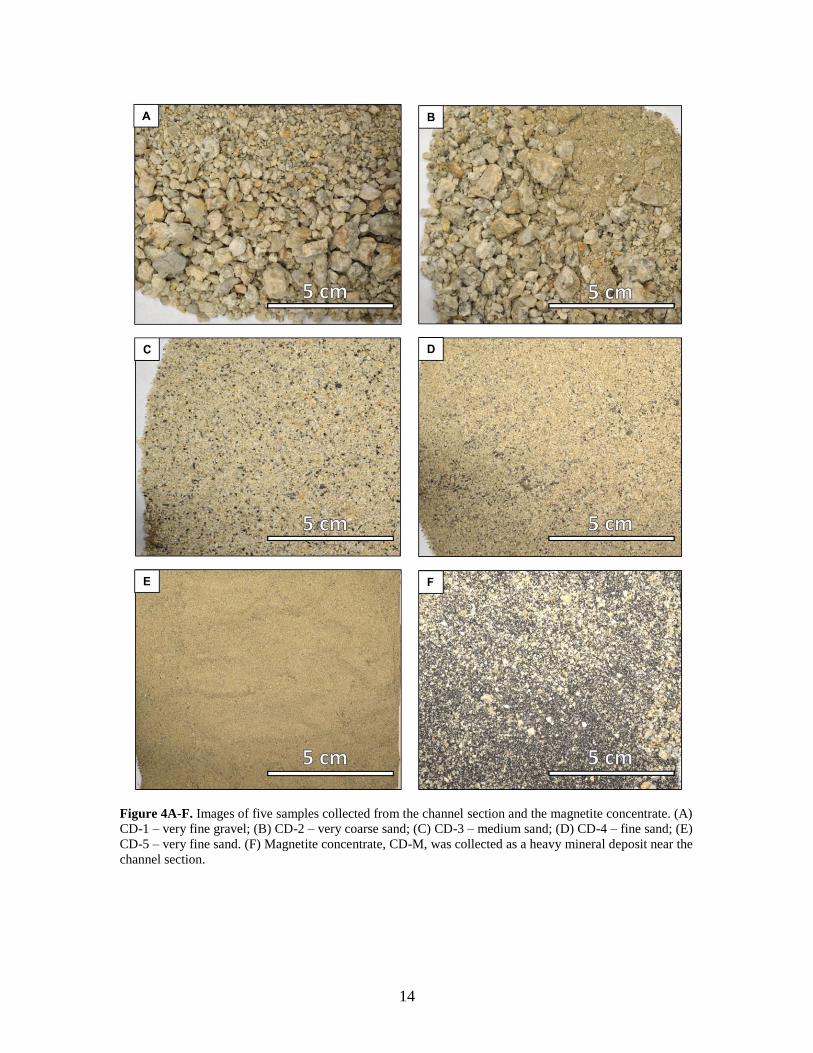
Figure 4A-F. Images of five samples collected from the channel section and the magnetite concentrate. (A)
CD-1 – very fine gravel; (B) CD-2 – very coarse sand; (C) CD-3 – medium sand; (D) CD-4 – fine sand; (E)
CD-5 – very fine sand. (F) Magnetite concentrate, CD-M, was collected as a heavy mineral deposit near the
channel section.
15
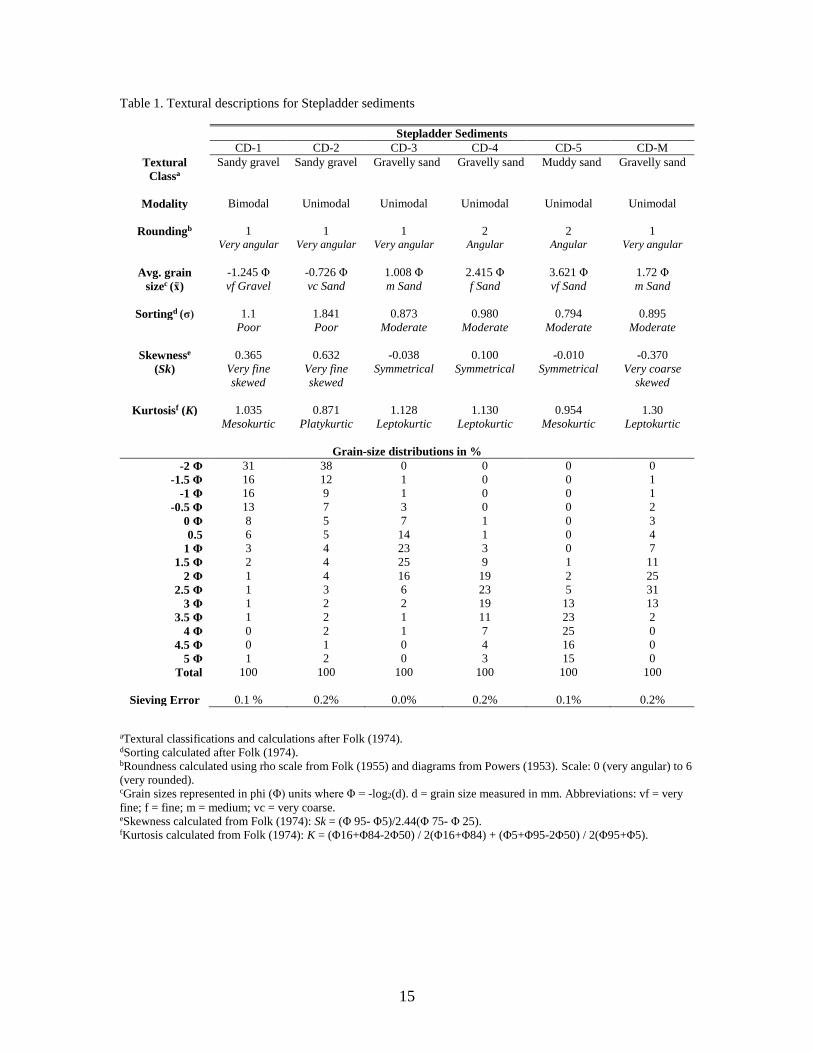
Table 1. Textural descriptions for Stepladder sediments
aTextural classifications and calculations after Folk (1974). dSorting calculated after Folk (1974). bRoundness calculated using rho scale from Folk (1955) and diagrams from Powers (1953). Scale: 0 (very angular) to 6
(very rounded). cGrain sizes represented in phi (Φ) units where Φ = -log2(d). d = grain size measured in mm. Abbreviations: vf = very
fine; f = fine; m = medium; vc = very coarse. eSkewness calculated from Folk (1974): Sk = (Φ 95- Φ5)/2.44(Φ 75- Φ 25). fKurtosis calculated from Folk (1974): K = (Φ16+Φ84-2Φ50) / 2(Φ16+Φ84) + (Φ5+Φ95-2Φ50) / 2(Φ95+Φ5).
Stepladder Sediments
CD-1 CD-2 CD-3 CD-4 CD-5 CD-M
Textural
Classa
Sandy gravel Sandy gravel Gravelly sand Gravelly sand Muddy sand Gravelly sand
Modality Bimodal Unimodal Unimodal Unimodal Unimodal Unimodal
Roundingb 1 1 1 2 2 1
Very angular Very angular Very angular Angular Angular Very angular
Avg. grain
sizec (x̄)
-1.245 Φ
vf Gravel
-0.726 Φ
vc Sand
1.008 Φ
m Sand
2.415 Φ
f Sand
3.621 Φ
vf Sand
1.72 Φ
m Sand
Sortingd (σ) 1.1 1.841 0.873 0.980 0.794 0.895
Poor Poor Moderate Moderate Moderate Moderate
Skewnesse
(Sk)
0.365
Very fine
skewed
0.632
Very fine
skewed
-0.038
Symmetrical
0.100
Symmetrical
-0.010
Symmetrical
-0.370
Very coarse
skewed
Kurtosisf (K) 1.035 0.871 1.128 1.130 0.954 1.30
Mesokurtic Platykurtic Leptokurtic Leptokurtic Mesokurtic Leptokurtic
Grain-size distributions in %
-2 Φ 31 38 0 0 0 0
-1.5 Φ 16 12 1 0 0 1
-1 Φ 16 9 1 0 0 1
-0.5 Φ 13 7 3 0 0 2
0 Φ 8 5 7 1 0 3
0.5 6 5 14 1 0 4
1 Φ 3 4 23 3 0 7
1.5 Φ 2 4 25 9 1 11
2 Φ 1 4 16 19 2 25
2.5 Φ 1 3 6 23 5 31
3 Φ 1 2 2 19 13 13
3.5 Φ 1 2 1 11 23 2
4 Φ 0 2 1 7 25 0
4.5 Φ 0 1 0 4 16 0
5 Φ 1 2 0 3 15 0
Total 100 100 100 100 100 100
Sieving Error 0.1 % 0.2% 0.0% 0.2% 0.1% 0.2%
16
billet. Two bedrock thin sections were made by cutting sample CD-BR into two
rectangular billets, referred to as CD-BR1 and CD-BR2. All billets were made into
conventional 25 x 46 mm polished thin sections.
Aliquots of sediment samples reserved for geochemical analysis were pulverized
in a ceramic shatterbox dish. Two aliquots of the coarsest sample (CD-1; Fig. 3A) were
powdered separately and treated as individual samples during geochemical analysis to
test for reproducibility in the dissolution process.
4.3 Petrography
Petrographic work was performed on thin sections using a Nikon LV100D POL
microscope with a Conwy Valley Systems automated point counter attached to a
computer. The program PETROG was used to create a grid of points for counting across
the thin section space. Modal compositions of each sample were determined by point
counting procedures using the Gazzi-Dickinson (Dickinson, 1970; Ingersoll et al., 1984)
approach, where the mineralogical composition at 500 to 600 points across each thin
section was identified (Table 2). For comparison with the Gazzi-Dickinson point
counting technique, the Folk approach (Folk, 1974) was also employed that involves
counting any polymineralic grains as lithic fragments regardless if the mineral under the
cross hair is identifiable. General observations of clast roundness and shape were
accomplished using a Nikon SMZ-800 incident light microscope (Table 1).
4.4 Geochemical analysis
Geochemical analyses were conducted by using powdered aliquots of the five
collected sediment samples and the magnetite concentrate. Major (Table 3) and trace-
element (Table 4) contents were determined by inductively coupled mass spectrometry
17
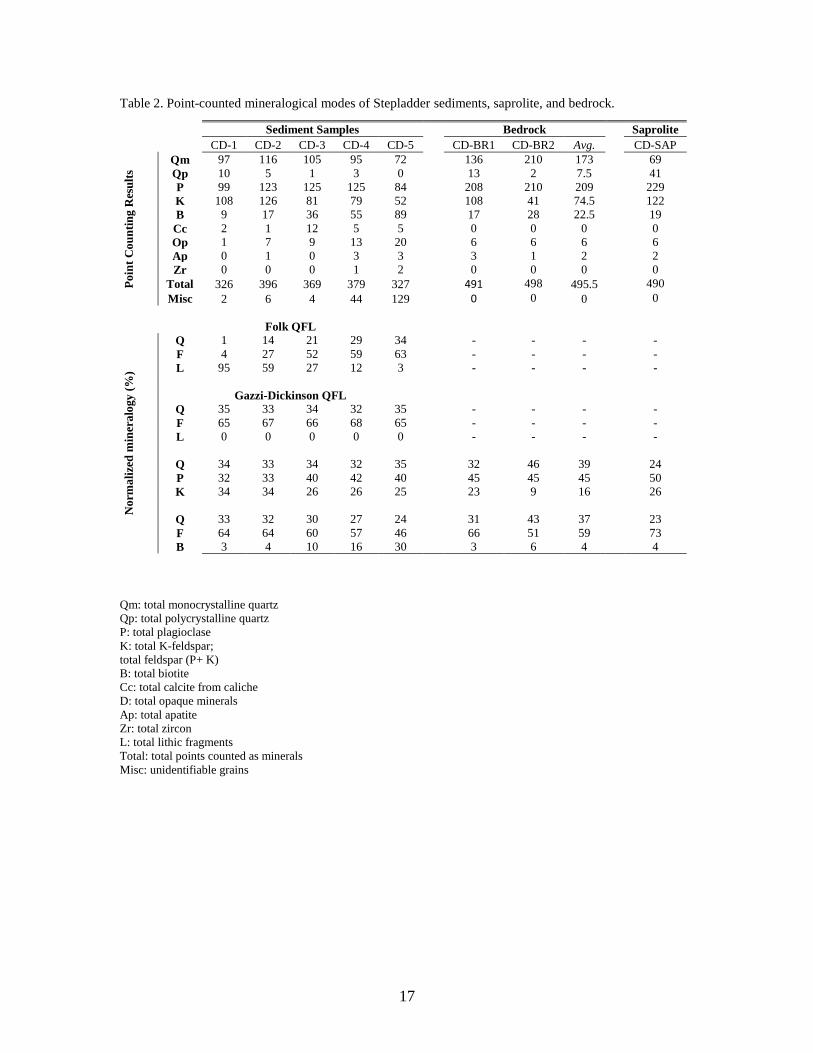
Table 2. Point-counted mineralogical modes of Stepladder sediments, saprolite, and bedrock.
Qm: total monocrystalline quartz
Qp: total polycrystalline quartz
P: total plagioclase
K: total K-feldspar;
total feldspar (P+ K)
B: total biotite
Cc: total calcite from caliche
D: total opaque minerals
Ap: total apatite
Zr: total zircon
L: total lithic fragments
Total: total points counted as minerals
Misc: unidentifiable grains
n: total points counte
Sediment Samples Bedrock Saprolite
CD-1 CD-2 CD-3 CD-4 CD-5 CD-BR1 CD-BR2 Avg. CD-SAP
Po
int
Co
un
tin
g R
esu
lts
Qm 97 116 105 95 72 136 210 173 69
Qp 10 5 1 3 0 13 2 7.5 41
P 99 123 125 125 84 208 210 209 229
K 108 126 81 79 52 108 41 74.5 122
B 9 17 36 55 89 17 28 22.5 19
Cc 2 1 12 5 5 0 0 0 0
Op 1 7 9 13 20 6 6 6 6
Ap 0 1 0 3 3 3 1 2 2
Zr 0 0 0 1 2 0 0 0 0
Total 326 396 369 379 327 491 498 495.5 490
Misc 2 6 4 44 129 0 0 0 0
Folk QFL
No
rma
lize
d m
iner
alo
gy
(%
)
Q 1 14 21 29 34 - - - -
F 4 27 52 59 63 - - - -
L 95 59 27 12 3 - - - -
Gazzi-Dickinson QFL
Q 35 33 34 32 35 - - - -
F 65 67 66 68 65 - - - -
L 0 0 0 0 0 - - - -
Q 34 33 34 32 35 32 46 39 24
P 32 33 40 42 40 45 45 45 50
K 34 34 26 26 25 23 9 16 26
Q 33 32 30 27 24 31 43 37 23
F 64 64 60 57 46 66 51 59 73
B 3 4 10 16 30 3 6 4 4
18
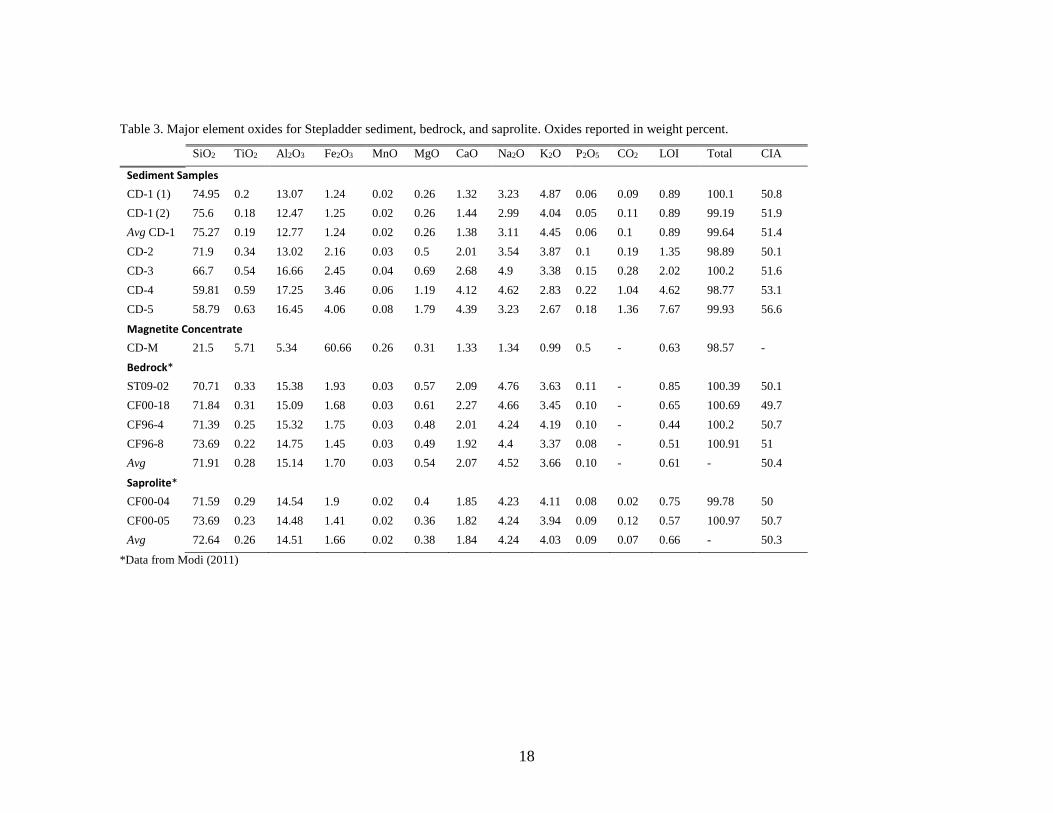
Table 3. Major element oxides for Stepladder sediment, bedrock, and saprolite. Oxides reported in weight percent.
SiO2 TiO2 Al2O3 Fe2O3 MnO MgO CaO Na2O K2O P2O5 CO2 LOI Total CIA
Sediment Samples
CD-1 (1) 74.95 0.2 13.07 1.24 0.02 0.26 1.32 3.23 4.87 0.06 0.09 0.89 100.1 50.8
CD-1 (2) 75.6 0.18 12.47 1.25 0.02 0.26 1.44 2.99 4.04 0.05 0.11 0.89 99.19 51.9
Avg CD-1 75.27 0.19 12.77 1.24 0.02 0.26 1.38 3.11 4.45 0.06 0.1 0.89 99.64 51.4
CD-2 71.9 0.34 13.02 2.16 0.03 0.5 2.01 3.54 3.87 0.1 0.19 1.35 98.89 50.1
CD-3 66.7 0.54 16.66 2.45 0.04 0.69 2.68 4.9 3.38 0.15 0.28 2.02 100.2 51.6
CD-4 59.81 0.59 17.25 3.46 0.06 1.19 4.12 4.62 2.83 0.22 1.04 4.62 98.77 53.1
CD-5 58.79 0.63 16.45 4.06 0.08 1.79 4.39 3.23 2.67 0.18 1.36 7.67 99.93 56.6
Magnetite Concentrate
CD-M 21.5 5.71 5.34 60.66 0.26 0.31 1.33 1.34 0.99 0.5 - 0.63 98.57 -
Bedrock*
ST09-02 70.71 0.33 15.38 1.93 0.03 0.57 2.09 4.76 3.63 0.11 - 0.85 100.39 50.1
CF00-18 71.84 0.31 15.09 1.68 0.03 0.61 2.27 4.66 3.45 0.10 - 0.65 100.69 49.7
CF96-4 71.39 0.25 15.32 1.75 0.03 0.48 2.01 4.24 4.19 0.10 - 0.44 100.2 50.7
CF96-8 73.69 0.22 14.75 1.45 0.03 0.49 1.92 4.4 3.37 0.08 - 0.51 100.91 51
Avg 71.91 0.28 15.14 1.70 0.03 0.54 2.07 4.52 3.66 0.10 - 0.61 - 50.4
Saprolite*
CF00-04 71.59 0.29 14.54 1.9 0.02 0.4 1.85 4.23 4.11 0.08 0.02 0.75 99.78 50
CF00-05 73.69 0.23 14.48 1.41 0.02 0.36 1.82 4.24 3.94 0.09 0.12 0.57 100.97 50.7
Avg 72.64 0.26 14.51 1.66 0.02 0.38 1.84 4.24 4.03 0.09 0.07 0.66 - 50.3
*Data from Modi (2011)
19
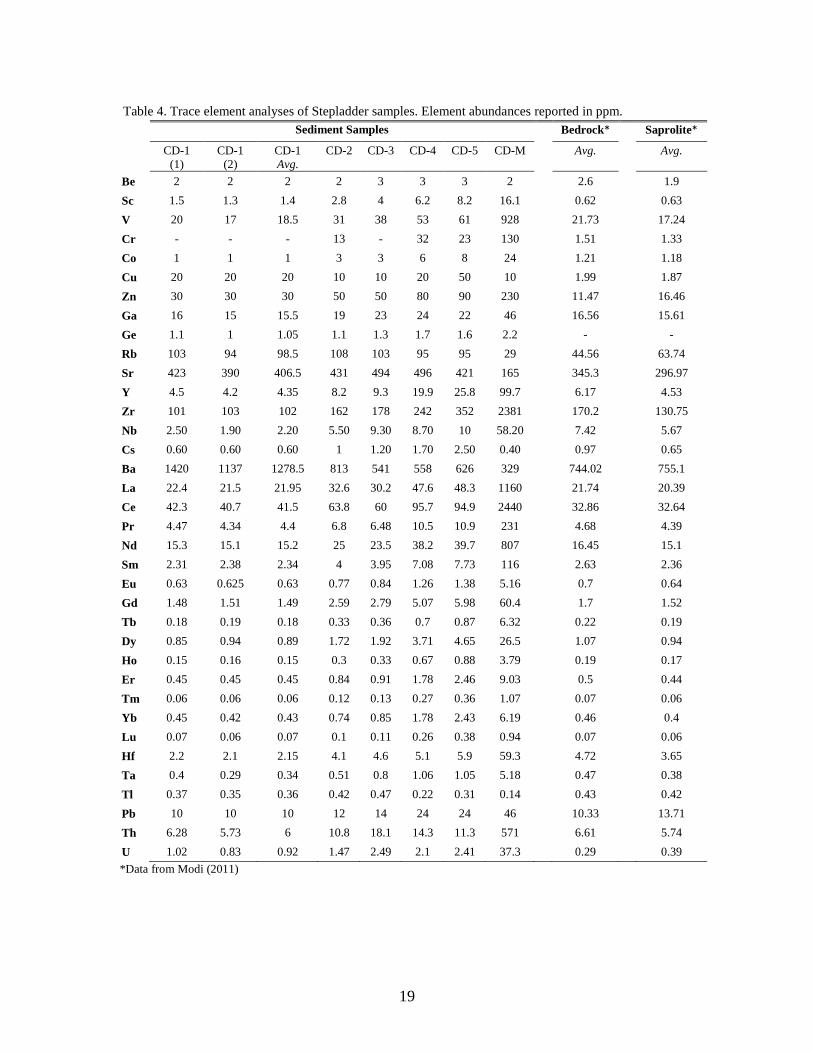
Table 4. Trace element analyses of Stepladder samples. Element abundances reported in ppm.
*Data from Modi (2011)
Sediment Samples Bedrock* Saprolite*
CD-1
(1)
CD-1
(2)
CD-1
Avg.
CD-2 CD-3 CD-4 CD-5 CD-M Avg. Avg.
Be 2 2 2 2 3 3 3 2 2.6 1.9
Sc 1.5 1.3 1.4 2.8 4 6.2 8.2 16.1 0.62 0.63
V 20 17 18.5 31 38 53 61 928 21.73 17.24
Cr - - - 13 - 32 23 130 1.51 1.33
Co 1 1 1 3 3 6 8 24 1.21 1.18
Cu 20 20 20 10 10 20 50 10 1.99 1.87
Zn 30 30 30 50 50 80 90 230 11.47 16.46
Ga 16 15 15.5 19 23 24 22 46 16.56 15.61
Ge 1.1 1 1.05 1.1 1.3 1.7 1.6 2.2 - -
Rb 103 94 98.5 108 103 95 95 29 44.56 63.74
Sr 423 390 406.5 431 494 496 421 165 345.3 296.97
Y 4.5 4.2 4.35 8.2 9.3 19.9 25.8 99.7 6.17 4.53
Zr 101 103 102 162 178 242 352 2381 170.2 130.75
Nb 2.50 1.90 2.20 5.50 9.30 8.70 10 58.20 7.42 5.67
Cs 0.60 0.60 0.60 1 1.20 1.70 2.50 0.40 0.97 0.65
Ba 1420 1137 1278.5 813 541 558 626 329 744.02 755.1
La 22.4 21.5 21.95 32.6 30.2 47.6 48.3 1160 21.74 20.39
Ce 42.3 40.7 41.5 63.8 60 95.7 94.9 2440 32.86 32.64
Pr 4.47 4.34 4.4 6.8 6.48 10.5 10.9 231 4.68 4.39
Nd 15.3 15.1 15.2 25 23.5 38.2 39.7 807 16.45 15.1
Sm 2.31 2.38 2.34 4 3.95 7.08 7.73 116 2.63 2.36
Eu 0.63 0.625 0.63 0.77 0.84 1.26 1.38 5.16 0.7 0.64
Gd 1.48 1.51 1.49 2.59 2.79 5.07 5.98 60.4 1.7 1.52
Tb 0.18 0.19 0.18 0.33 0.36 0.7 0.87 6.32 0.22 0.19
Dy 0.85 0.94 0.89 1.72 1.92 3.71 4.65 26.5 1.07 0.94
Ho 0.15 0.16 0.15 0.3 0.33 0.67 0.88 3.79 0.19 0.17
Er 0.45 0.45 0.45 0.84 0.91 1.78 2.46 9.03 0.5 0.44
Tm 0.06 0.06 0.06 0.12 0.13 0.27 0.36 1.07 0.07 0.06
Yb 0.45 0.42 0.43 0.74 0.85 1.78 2.43 6.19 0.46 0.4
Lu 0.07 0.06 0.07 0.1 0.11 0.26 0.38 0.94 0.07 0.06
Hf 2.2 2.1 2.15 4.1 4.6 5.1 5.9 59.3 4.72 3.65
Ta 0.4 0.29 0.34 0.51 0.8 1.06 1.05 5.18 0.47 0.38
Tl 0.37 0.35 0.36 0.42 0.47 0.22 0.31 0.14 0.43 0.42
Pb 10 10 10 12 14 24 24 46 10.33 13.71
Th 6.28 5.73 6 10.8 18.1 14.3 11.3 571 6.61 5.74
U 1.02 0.83 0.92 1.47 2.49 2.1 2.41 37.3 0.29 0.39
20
and instrumental neutron activation analysis (FUS-ICP/MS; INAA) through Activation
Laboratories Ltd. under the Lithogeochemistry Research Package. Detection limits of
most major oxides were at 0.01 wt. %, with the exception of Mn and Ti that had detection
limits of 0.001 wt. %. A total of 45 trace elements were analyzed in parts per million with
detection limits that varied per element.
Approximately 10 mg of each powdered sample was used to determine total
carbon and carbonate CO2 by coulometry with combustion and acid evolution techniques,
respectively. Results were corrected for carbonate and phosphate content by subtracting
CaO and P2O5 from total CaO to obtain the CaO contents in the silicate fraction only.
Precision for analytical uncertainty for coulometry was better than 1% for all samples.
21
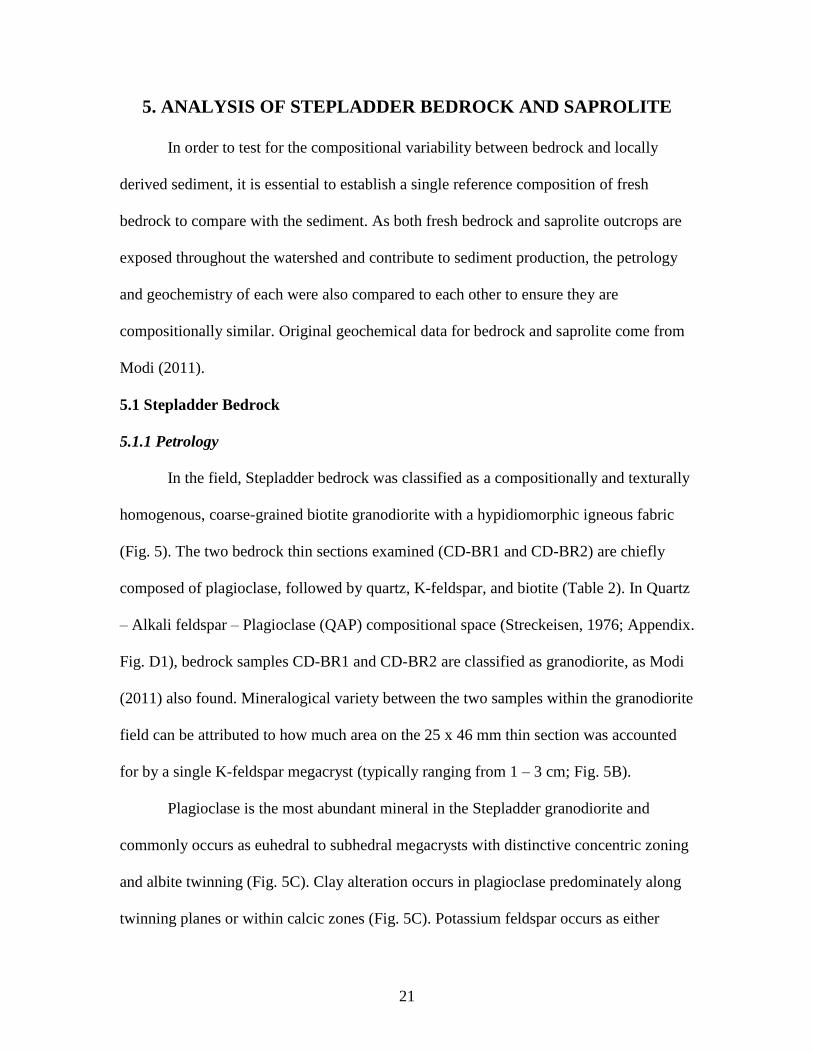
5. ANALYSIS OF STEPLADDER BEDROCK AND SAPROLITE
In order to test for the compositional variability between bedrock and locally
derived sediment, it is essential to establish a single reference composition of fresh
bedrock to compare with the sediment. As both fresh bedrock and saprolite outcrops are
exposed throughout the watershed and contribute to sediment production, the petrology
and geochemistry of each were also compared to each other to ensure they are
compositionally similar. Original geochemical data for bedrock and saprolite come from
Modi (2011).
5.1 Stepladder Bedrock
5.1.1 Petrology
In the field, Stepladder bedrock was classified as a compositionally and texturally
homogenous, coarse-grained biotite granodiorite with a hypidiomorphic igneous fabric
(Fig. 5). The two bedrock thin sections examined (CD-BR1 and CD-BR2) are chiefly
composed of plagioclase, followed by quartz, K-feldspar, and biotite (Table 2). In Quartz
– Alkali feldspar – Plagioclase (QAP) compositional space (Streckeisen, 1976; Appendix.
Fig. D1), bedrock samples CD-BR1 and CD-BR2 are classified as granodiorite, as Modi
(2011) also found. Mineralogical variety between the two samples within the granodiorite
field can be attributed to how much area on the 25 x 46 mm thin section was accounted
for by a single K-feldspar megacryst (typically ranging from 1 – 3 cm; Fig. 5B).
Plagioclase is the most abundant mineral in the Stepladder granodiorite and
commonly occurs as euhedral to subhedral megacrysts with distinctive concentric zoning
and albite twinning (Fig. 5C). Clay alteration occurs in plagioclase predominately along
twinning planes or within calcic zones (Fig. 5C). Potassium feldspar occurs as either
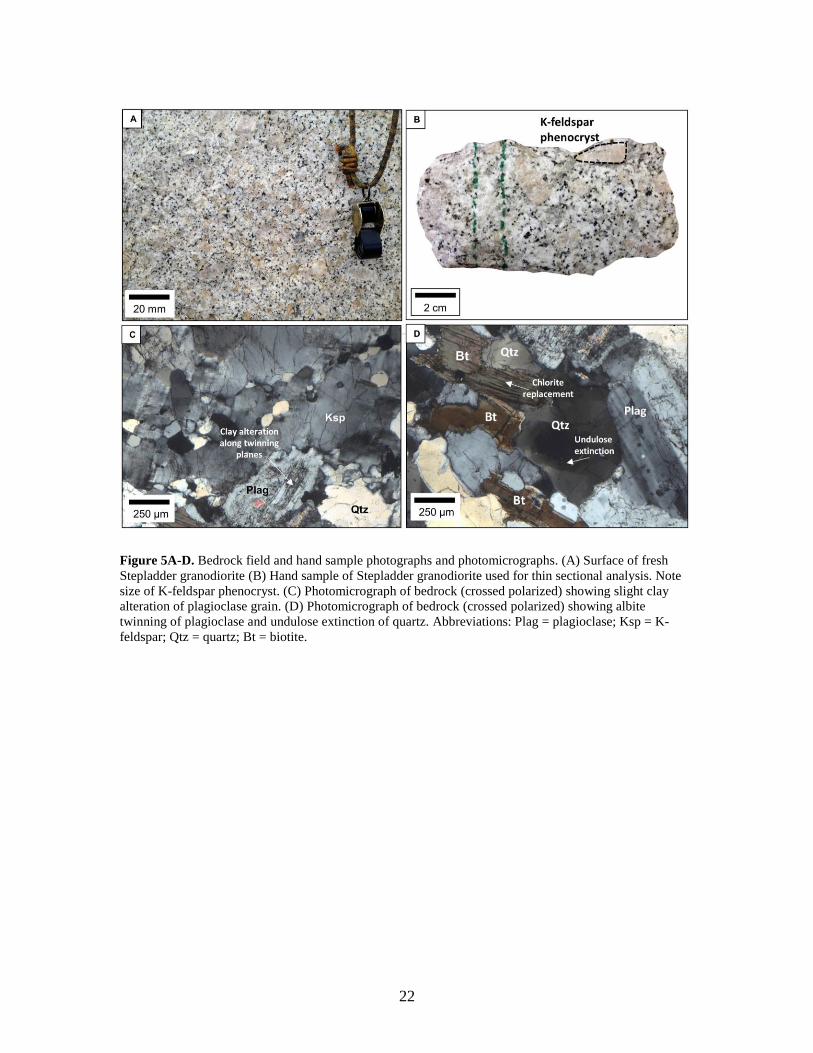
22
Figure 5A-D. Bedrock field and hand sample photographs and photomicrographs. (A) Surface of fresh
Stepladder granodiorite (B) Hand sample of Stepladder granodiorite used for thin sectional analysis. Note
size of K-feldspar phenocryst. (C) Photomicrograph of bedrock (crossed polarized) showing slight clay
alteration of plagioclase grain. (D) Photomicrograph of bedrock (crossed polarized) showing albite
twinning of plagioclase and undulose extinction of quartz. Abbreviations: Plag = plagioclase; Ksp = K-
feldspar; Qtz = quartz; Bt = biotite.
23
subhedral to euhedral perthitic megacrysts or microcline with inclusions of quartz,
plagioclase, biotite, and accessory minerals (Fig. 5C). Quartz mostly occurs as subhedral
interstitial crystals that commonly exhibit undulatory extinction (Fig. 5D), but also occurs
as polycrystalline aggregates. Biotite, the dominant mafic mineral, occurs predominately
as elongated interstitial grains (Fig. 5D) or poikilitically included in plagioclase and K-
feldspar megacrysts. Minor chlorite replaces biotite crystals along grain boundaries and
cleavage planes (Fig. 5D). Accessory phases, such as apatite, zircon, and magnetite,
occur either as interstitial grains or as poikilitic inclusions.
5.1.2 Geochemistry
All geochemical data of the Stepladder pluton summarized here come from Modi
(2011), where four samples of bedrock were analyzed for major-, trace-, and rare-earth
element contents. For this study, the average geochemical composition of the four
Stepladder bedrock samples was calculated in order to have a single set of geochemical
data to compare with sediment (Tables 3-4).
5.1.2.1 Major Elements
Other than normalized mineralogy, numerous compositional variables and plots
can be used to characterize the bedrock. The SiO2 content of the Stepladder bedrock
ranges from 70.7 to 73.7 wt. % with an average of 71.9 % (Table 3). Ratio values of
A/CNK (Al2O3/CaO+Na2O+K2O; Shand, 1943) and A/NK (Al2O3/ Na2O+K2O; Shand,
1943) ranges from 0.97 to 1.03 and 1.30 to 1.35, respectively (Appendix Table D1). The
Aluminum Saturation Index (ASI = Al/Ca – 1.67P + Na + K; Shand, 1943) ranges from
1.48 to 1.54, with an average of 1.50 (Appendix Table D1). The Fe-number (Fe* =
FeOtot/ FeOtot + MgO; Miyashiro, 1970) across bedrock samples ranges from 0.71 to 0.76
24
with an average value of 0.74 (Appendix Table D1). Alkali-lime indices of the bedrock
(Na2O + K2O – CaO; Peacock, 1931) range from 5.84 to 6.42, with an average of 6.11
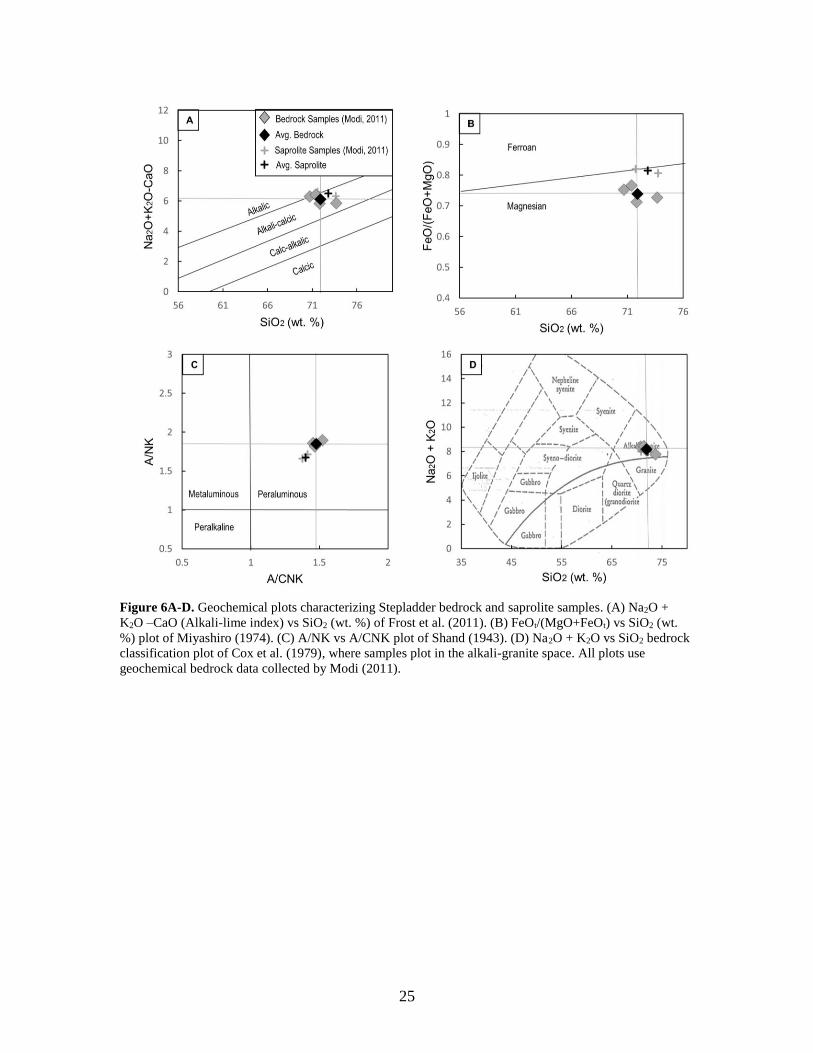
(Appendix Table D1). Bulk geochemical compositions across all bedrock samples show
little variation between each other and are classified as alkali-calcic (Fig. 6A), magnesian
(Fig. 6B), peraluminous (Fig. 6C), and alkali granites (Fig. 6D) on different
discrimination plots.
5.1.2.2 Trace- and rare-earth elements
When discussing trace-element compositions used in provenance research,
elements are commonly divided into the following categories based upon groups of
elements with similar geochemical properties: large ion lithophile elements (LILEs; Rb,
Ba, Cs, Sr), transition metals (V, Co, Cr), and high field strength elements (HFSEs; Sc,
Y, Th, U, Pb, Zr, Hf, Nb, Ti), and rare-earth elements. Trace-element patterns of two
bedrock samples normalized to average Upper Continental Crust (UCC; McLennan,
2001) show considerable depletions in Rb, Cs, and U, and are strongly depleted in the
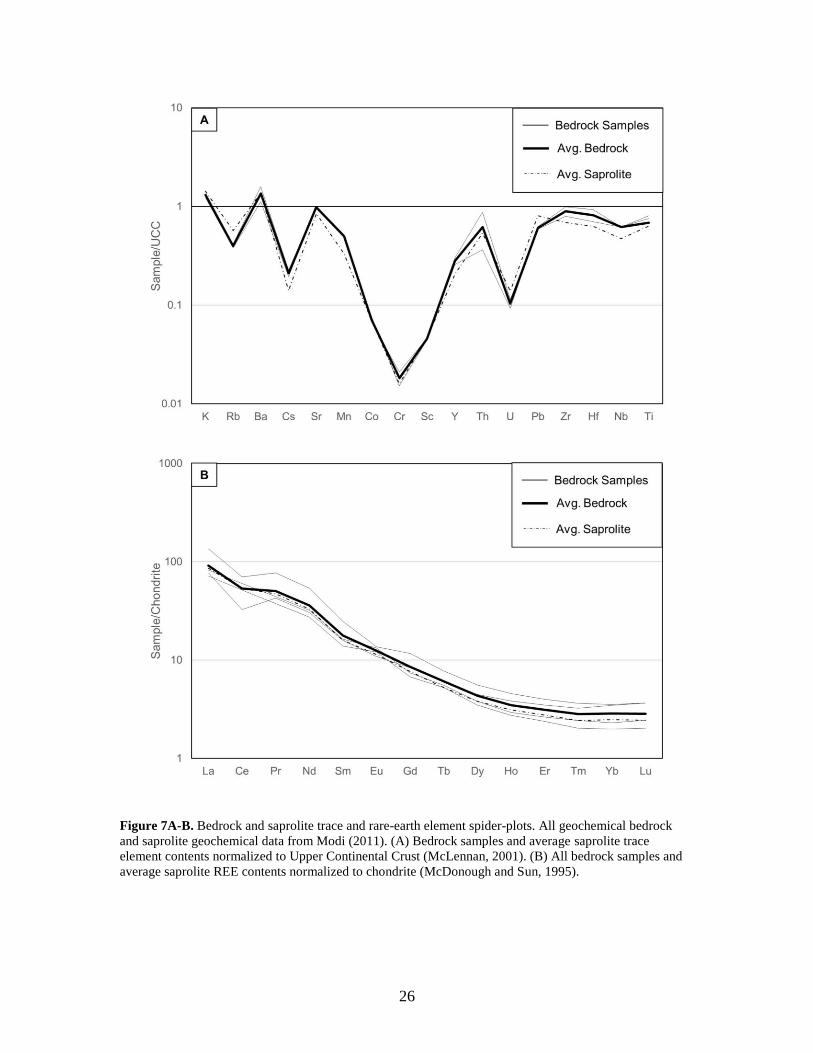
transition metals Co, Cr, and Sc (Fig. 7A).
Chondrite-normalized patterns of REEs are conventionally used in provenance
work describe the behavior of the LREEs (La, Ce, Pr, Nd, and Sm), HREEs (Gd, Tb, Dy,
Ho, Er, Tm, Yb, and Lu), total REE content, and Eu anomaly. Chondrite-normalized REE
contents of average Stepladder bedrock generate sub-parallel patterns with little
compositional variation between each sample (Fig. 7B). Chondrite-normalized ratios
between end-member LREEs, lanthanum and samarium (LaCN/SmCN = 5.16), indicate
that the LREEs are more fractionated than the HREEs (GdCN/YbCN = 2.98), with an
overall fractionation of (LaCN/YbCN) of 32.1.
25
Figure 6A-D. Geochemical plots characterizing Stepladder bedrock and saprolite samples. (A) Na2O +
K2O –CaO (Alkali-lime index) vs SiO2 (wt. %) of Frost et al. (2011). (B) FeOt/(MgO+FeOt) vs SiO2 (wt.
%) plot of Miyashiro (1974). (C) A/NK vs A/CNK plot of Shand (1943). (D) Na2O + K2O vs SiO2 bedrock
classification plot of Cox et al. (1979), where samples plot in the alkali-granite space. All plots use
geochemical bedrock data collected by Modi (2011).
26
Figure 7A-B. Bedrock and saprolite trace and rare-earth element spider-plots. All geochemical bedrock
and saprolite geochemical data from Modi (2011). (A) Bedrock samples and average saprolite trace
element contents normalized to Upper Continental Crust (McLennan, 2001). (B) All bedrock samples and
average saprolite REE contents normalized to chondrite (McDonough and Sun, 1995).
27
Europium anomalies are calculated by the geometric average of the ratio of
neighboring rare-earth elements Sm and Gd, assuming that the ratio between the
neighboring element concentrations remains constant (Eu*CN = (SmCN – GdCN)1/2;
McLennan, 1989). Ratios with values < 1 are considered negative anomalies, whereas
ratios > 1 are considered positive anomalies. Average Stepladder bedrock has a negligible
Eu anomaly (0.99; Table 5).
Cerium anomalies are calculated by the differences in concentration between
neighboring elements Pr and Nd, assuming that the difference in the neighboring
elements is constant (Ce*CN = 2 * PrCN – NdCN; Lawrence and Kamber, 2006). Average
Stepladder bedrock has a slightly negative chondrite-normalized Ce anomaly (0.83; Table
5).
5.2 Stepladder Saprolite
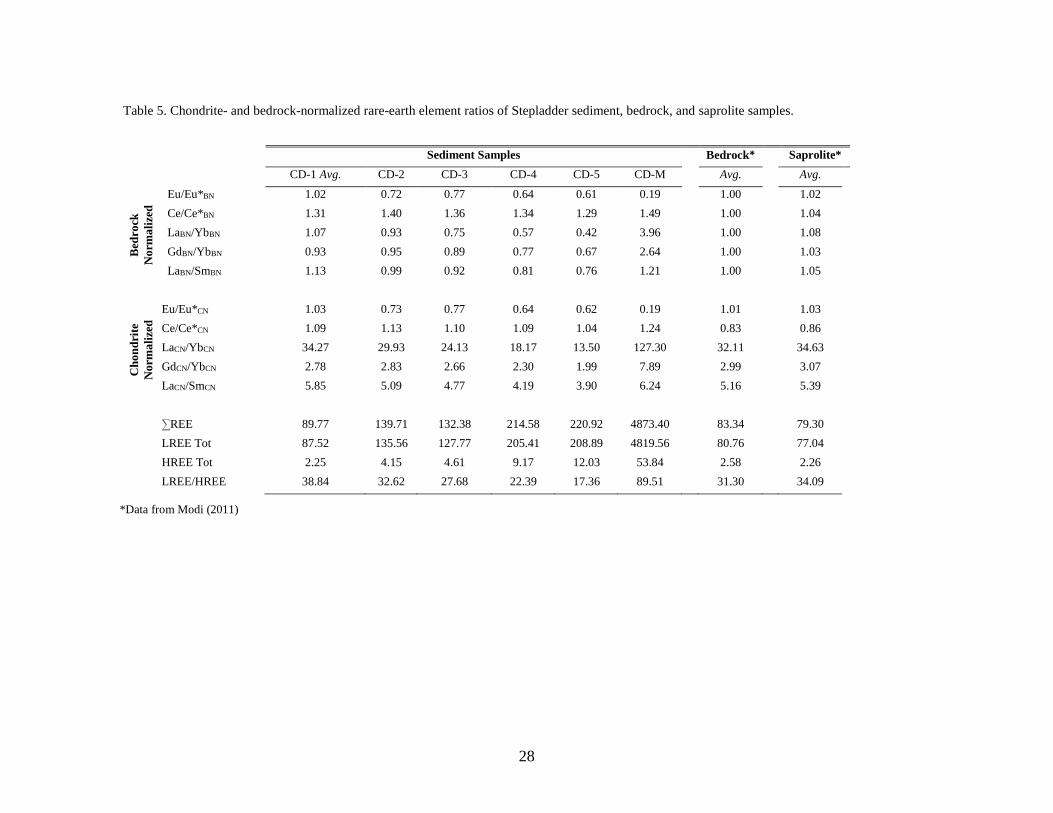
Saprolite is fractured at all scales throughout the watershed and is easily
decomposed into sand (Fig. 8A). In contrast to fresh bedrock, saprolite had a brown
varnish and a friable texture (Fig. 8B). The following section demonstrates that the
saprolite resembles fresh bedrock in terms of both petrology and geochemistry.
5.2.1 Petrology
Despite being fractured, Stepladder saprolite is mineralogically similar to fresh
bedrock. In QAP ternary space (Streckeisen, 1976; Appendix Fig. D1), the saprolite
sample CD-SAP plots within the granodiorite compositional field with comparable K-
feldspar contents observed in the bedrock sample CD-1. The saprolite sample is
composed of primarily plagioclase (46%), followed by quartz (22%), orthoclase (25%),
and biotite (4%) (Table 2). Observed accessory minerals include magnetite, apatite, and
28
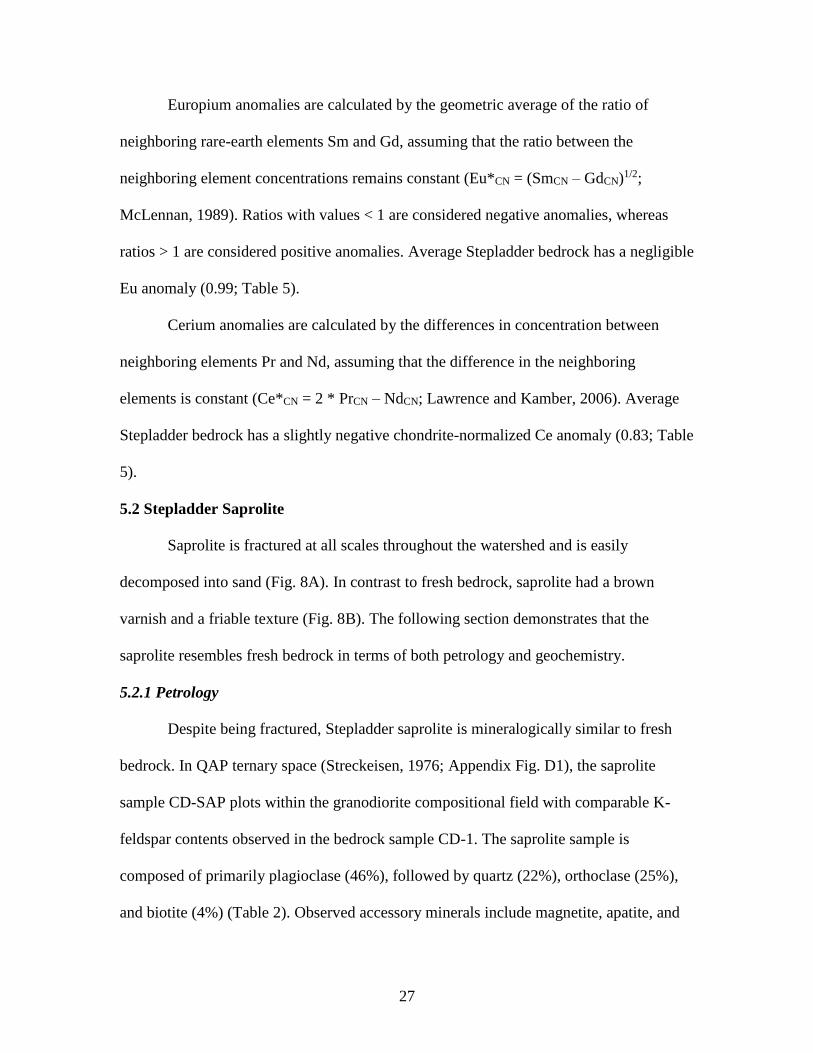
Table 5. Chondrite- and bedrock-normalized rare-earth element ratios of Stepladder sediment, bedrock, and saprolite samples.
*Data from Modi (2011)
Sediment Samples Bedrock* Saprolite*
CD-1 Avg. CD-2 CD-3 CD-4 CD-5 CD-M Avg. Avg.
Bed
rock
No
rma
lize
d
Eu/Eu*BN 1.02 0.72 0.77 0.64 0.61 0.19 1.00 1.02
Ce/Ce*BN 1.31 1.40 1.36 1.34 1.29 1.49 1.00 1.04
LaBN/YbBN 1.07 0.93 0.75 0.57 0.42 3.96 1.00 1.08
GdBN/YbBN 0.93 0.95 0.89 0.77 0.67 2.64 1.00 1.03
LaBN/SmBN 1.13 0.99 0.92 0.81 0.76 1.21 1.00 1.05
Ch
on
dri
te
No
rma
lize
d
Eu/Eu*CN 1.03 0.73 0.77 0.64 0.62 0.19 1.01 1.03
Ce/Ce*CN 1.09 1.13 1.10 1.09 1.04 1.24 0.83 0.86
LaCN/YbCN 34.27 29.93 24.13 18.17 13.50 127.30 32.11 34.63
GdCN/YbCN 2.78 2.83 2.66 2.30 1.99 7.89 2.99 3.07
LaCN/SmCN 5.85 5.09 4.77 4.19 3.90 6.24 5.16 5.39
∑REE 89.77 139.71 132.38 214.58 220.92 4873.40 83.34 79.30
LREE Tot 87.52 135.56 127.77 205.41 208.89 4819.56 80.76 77.04
HREE Tot 2.25 4.15 4.61 9.17 12.03 53.84 2.58 2.26
LREE/HREE 38.84 32.62 27.68 22.39 17.36 89.51 31.30 34.09
29
Figure 8A-D. Saprolite field and hand sample photographs and photomicrographs. (A) Weathered field
saprolite. Note sediment directly below saprolite. (B) Hand sample of saprolite. Note friable texture. (C)
Photomicrograph of saprolite sample under cross polarized light showing condition of mineral surfaces. (D)
Photomicrograph of saprolite sample under cross polarized light showing fracture dissecting biotite and K-
feldspar. Abbreviations: Plag = plagioclase; Ksp = K-feldspar; Qtz = quartz; Bt = biotite.
30
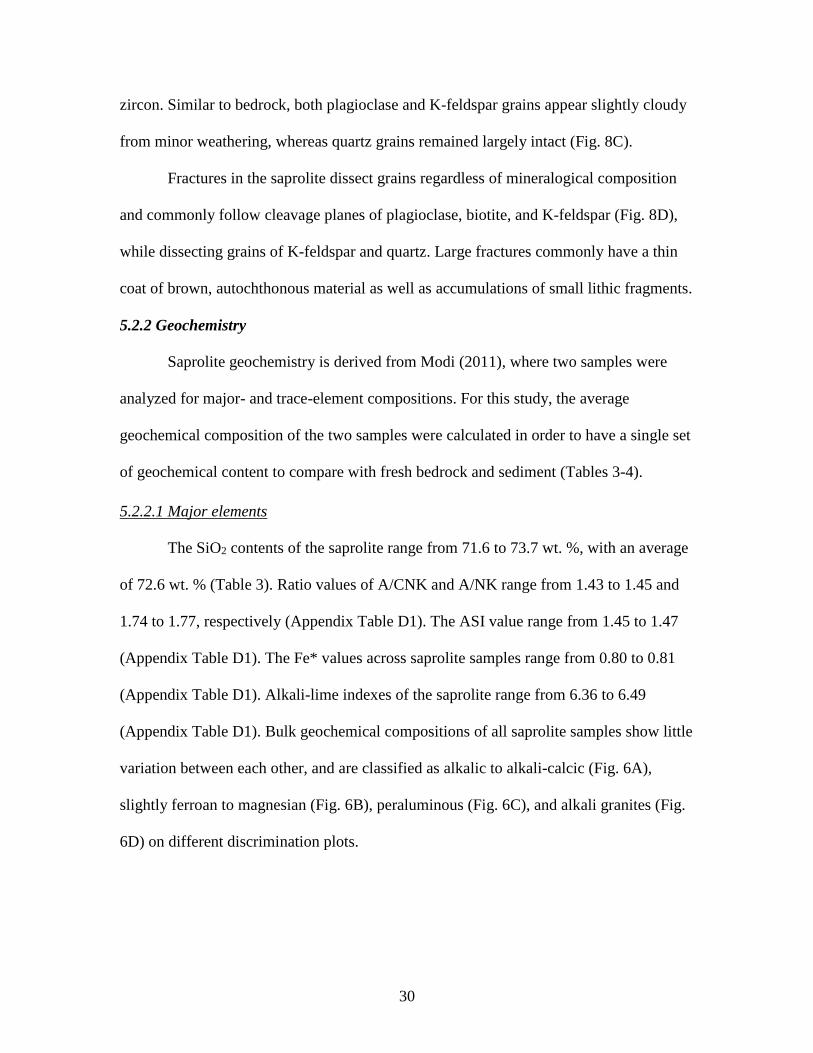
zircon. Similar to bedrock, both plagioclase and K-feldspar grains appear slightly cloudy
from minor weathering, whereas quartz grains remained largely intact (Fig. 8C).
Fractures in the saprolite dissect grains regardless of mineralogical composition
and commonly follow cleavage planes of plagioclase, biotite, and K-feldspar (Fig. 8D),
while dissecting grains of K-feldspar and quartz. Large fractures commonly have a thin
coat of brown, autochthonous material as well as accumulations of small lithic fragments.
5.2.2 Geochemistry
Saprolite geochemistry is derived from Modi (2011), where two samples were
analyzed for major- and trace-element compositions. For this study, the average
geochemical composition of the two samples were calculated in order to have a single set
of geochemical content to compare with fresh bedrock and sediment (Tables 3-4).
5.2.2.1 Major elements
The SiO2 contents of the saprolite range from 71.6 to 73.7 wt. %, with an average
of 72.6 wt. % (Table 3). Ratio values of A/CNK and A/NK range from 1.43 to 1.45 and
1.74 to 1.77, respectively (Appendix Table D1). The ASI value range from 1.45 to 1.47
(Appendix Table D1). The Fe* values across saprolite samples range from 0.80 to 0.81
(Appendix Table D1). Alkali-lime indexes of the saprolite range from 6.36 to 6.49
(Appendix Table D1). Bulk geochemical compositions of all saprolite samples show little
variation between each other, and are classified as alkalic to alkali-calcic (Fig. 6A),
slightly ferroan to magnesian (Fig. 6B), peraluminous (Fig. 6C), and alkali granites (Fig.
6D) on different discrimination plots.
31
5.2.2.2 Trace- and rare-earth elements
The UCC-normalized trace-element pattern of average saprolite closely followed
the composition of average bedrock that displayed considerable depletions in Rb, Cs, and
U and was heavily depleted in Co, Cr, and Sc (Fig. 7A). Average saprolite chondrite-
normalized REE contents possessed a pattern similar to average bedrock with steeply
fractionated LREEs (LaCN/SmCN = 5.39; Table 5) relative to HREEs (GdCN/YbCN = 3.07;
Table 5) (Fig. 7B). Average saprolite had a slightly negative Ce anomaly (0.86; Table 5)
and a negligible Eu anomaly (1.03; Table 5).
5.3 Joint Sets
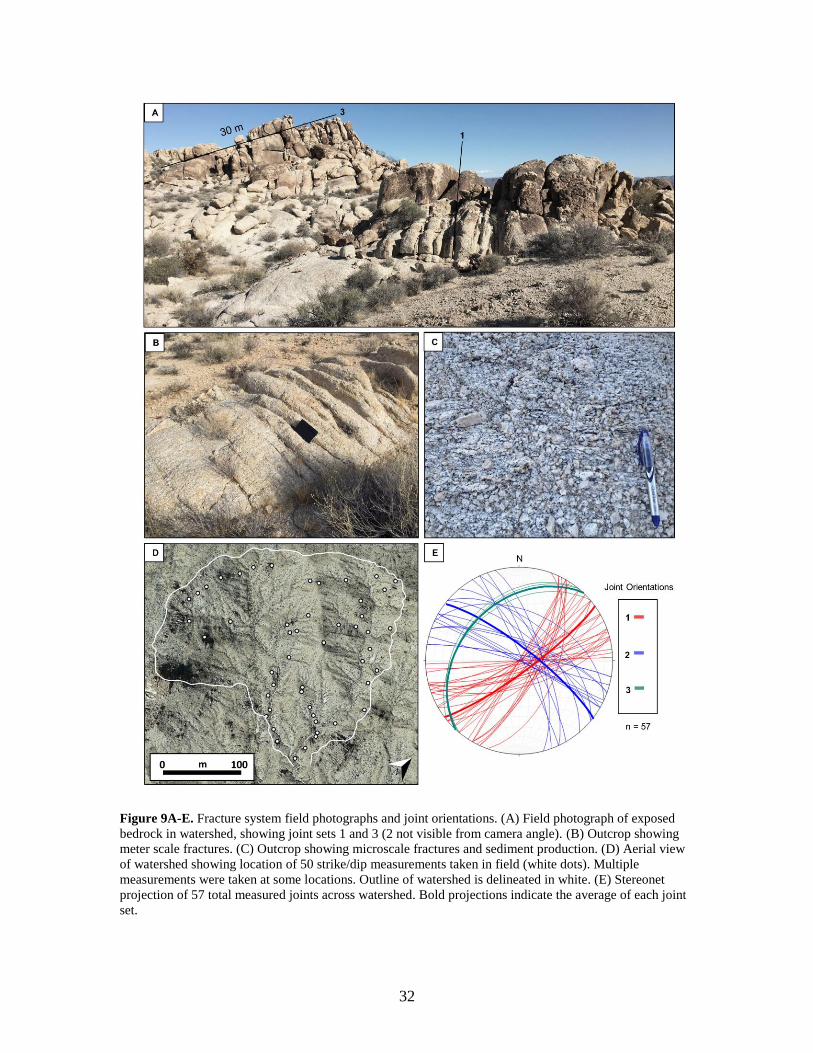
Exposed outcrops of granodioritic bedrock are crosscut by three distinct joint sets,
which were observed in outcrops throughout the watershed (Fig. 9). Fracture spacing
varied from meter scale (Fig. 9B) to millimeter scale (Fig. 9C). A total of 57 strike-and-
dip measurements were taken across the watershed (Fig. 9D; Appendix Table B1) and the
orientations plotted on a lower hemisphere equal-area stereonet (Fig. 9E). Out of the
three joint sets, the dominant fracture system strikes NE, with a steep vertical-to-SE dip
(Fig. 9E). In lesser prevalence, but still readily seen was the NW striking joint set with a
steep vertical-to-NE dip (Fig. 9E). The least common joint set strikes NE, with a shallow
westward dip (Fig. 9E).
32
Figure 9A-E. Fracture system field photographs and joint orientations. (A) Field photograph of exposed
bedrock in watershed, showing joint sets 1 and 3 (2 not visible from camera angle). (B) Outcrop showing
meter scale fractures. (C) Outcrop showing microscale fractures and sediment production. (D) Aerial view
of watershed showing location of 50 strike/dip measurements taken in field (white dots). Multiple
measurements were taken at some locations. Outline of watershed is delineated in white. (E) Stereonet
projection of 57 total measured joints across watershed. Bold projections indicate the average of each joint
set.
33
6. ANALYSIS OF STEPLADDER SEDIMENT
6.1 Textural analysis
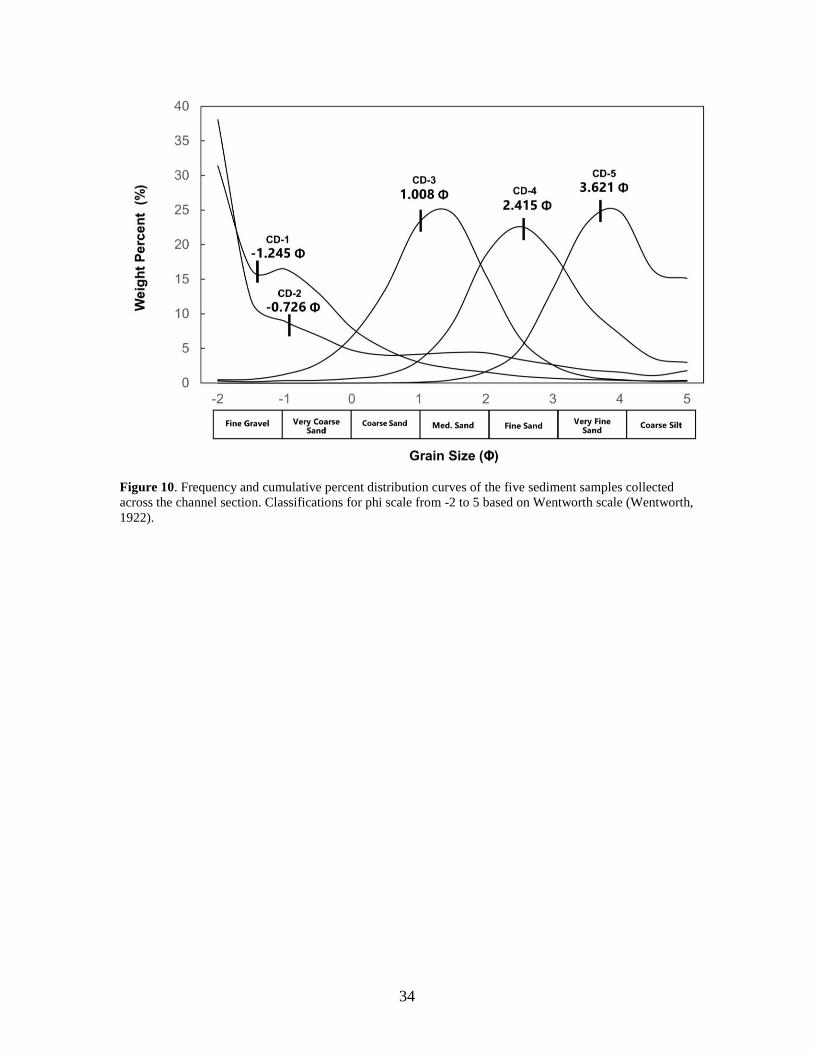
All sediment samples were sieved to determine grain-size distribution of each
sample. Each sample has an average mean grain size that falls into a unique Φ bin (Fig.
10) based upon the Wentworth grain-size classification scale (Wentworth, 1922). The
collective average grain-size distributions of all sediment samples range from very fine
gravel to very fine sand (x̄ = -1.2 Φ to 3.6 Φ; Table 1). Standard deviation values for each
curve do not deviate considerably between samples (σ = 0.7 to 1.8; Table 1). Skewness
values of curve shapes between samples range between 0.3 and -0.03 (very fine skewed
to symmetrical; Table 1). Kurtosis values range from 1.1 and 0.8 (Table 1).
6.1.1 CD-1
Sediment sample CD-1 is a very fine gravel with a mean grain size of -1.245 Φ
(Table 1; Fig. 10), across a range from fine gravel to very coarse silt, with the most
abundant clast size being very fine gravel. The sample is a poorly sorted (σ = 1.123),
bimodal, sandy gravel, with a fine skewed (Sk = 0.365), mesokurtic (K = 1.035) grain-
size distribution. In terms of grain shape, lithic fragments and monomineralic grains of
quartz, plagioclase, and K-feldspar are compact-bladed to compact-elongate, while biotite
is platy (Fig. 11A). On average, all grains are angular to sub-angular.
6.1.2 CD-2
Sediment sample CD-2 is a very coarse sand with a mean grain size of -0.726 Φ
(Table 1; Fig. 10), across a range from fine gravel to very coarse silt, which is similar to
CD-1 with very fine gravel being the most abundant clast size. The sample is a poorly
34
Figure 10. Frequency and cumulative percent distribution curves of the five sediment samples collected
across the channel section. Classifications for phi scale from -2 to 5 based on Wentworth scale (Wentworth,
1922).
35
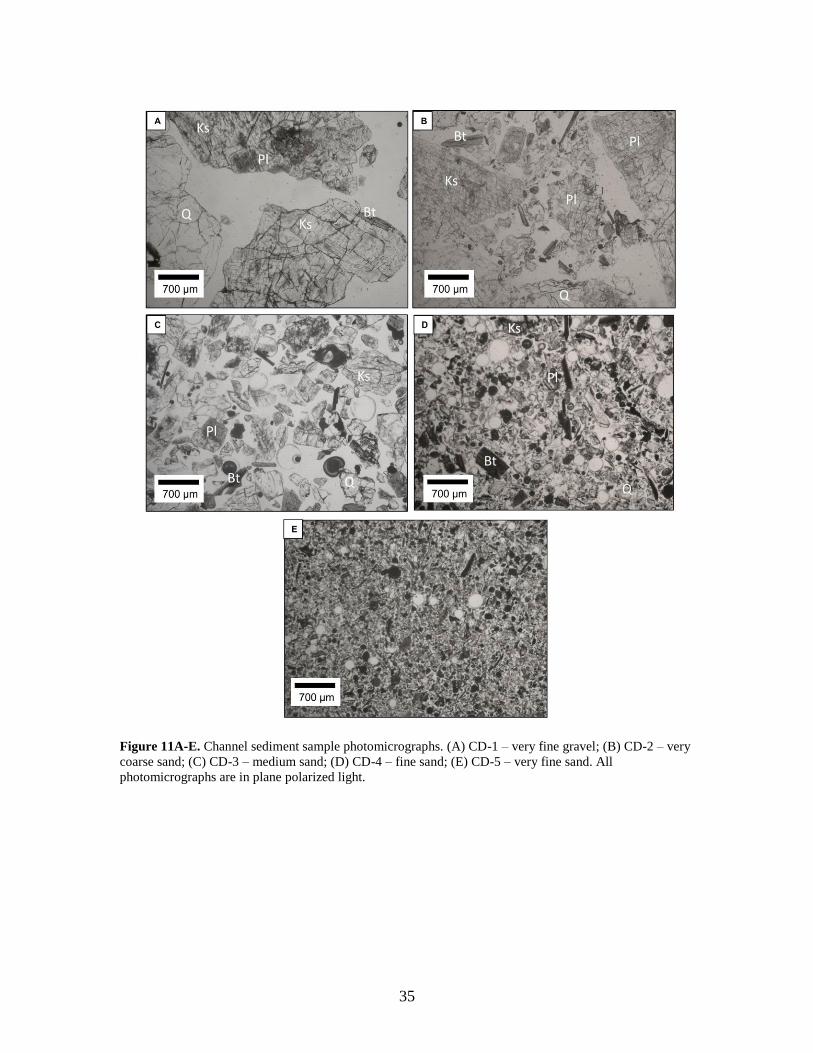
Figure 11A-E. Channel sediment sample photomicrographs. (A) CD-1 – very fine gravel; (B) CD-2 – very
coarse sand; (C) CD-3 – medium sand; (D) CD-4 – fine sand; (E) CD-5 – very fine sand. All
photomicrographs are in plane polarized light.
36
sorted (σ = 1.841), unimodal, sandy gravel, with a fine skewed (Sk = 0.632), platykurtic
(K = 0.871), grain-size distribution. In terms of grain shape, lithic fragments and
monomineralic quartz, plagioclase, and K-feldspar grains are compact-bladed to
compact-elongate, while biotite is platy (Fig. 11B). On average, most grains are angular.
6.1.3 CD-3
Sediment sample CD-3 is a medium sand with a mean grain size of 1.008 Φ
(Table 1; Fig. 10), across a range from gravel to very coarse silt. The sample is a
moderately sorted (σ = 0.873), unimodal, slightly gravelly sand, with a symmetrical (Sk =
-0.038), leptokurtic (K = 1.128) grain-size distribution. In terms of grain shape, lithic
fragments and monomineralic quartz, plagioclase, and K-feldspar grains are compact-
bladed, while biotite is platy (Fig. 11C). On average, most grains are sub-angular, while
others are angular.
6.1.4 CD-4
Sediment sample CD-4 is a fine sand with a mean grain size of 2.415 Φ (Table 1;
Fig. 10), across a range from fine gravel to very coarse silt. The sample is a moderately
sorted (σ = 0.980), unimodal, slightly gravelly sand, with a symmetrical (Sk = 0.100),
leptokurtic (K = 1.130) grain-size distribution. In terms of grain shape, lithic fragments
and monomineralic quartz, plagioclase, and K-feldspar grains are compact-bladed to
compact-elongate, while biotite is platy to bladed (Fig. 11D). On average, most grains are
sub-angular, while others are angular.
6.1.5 CD-5
Sediment sample CD-5 is a very fine sand with a mean grain size of 3.621 Φ
(Table 1; Fig. 10), across a range from coarse sand to very coarse silt. The sample is a
37
moderately sorted (σ = 0.794), unimodal, muddy sand, with a symmetrical (Sk = -0.010),
mesokurtic (K = 0.954) grain-size distribution. In terms of grain shape, lithic fragments
and monomineralic quartz, plagioclase, and K-feldspar grains are compact-bladed, while
biotite is platy (Fig. 11E). On average, most grains are sub-angular, while few are
angular.
6.1.6 CD-M
The magnetite concentrate was collected from near the vicinity of the other
samples, but in a different channel. Sediment sample CD-M is a medium sand with a
mean grain size of 1.729 Φ (Appendix. Table C2), across a range from fine gravel to very
coarse silt. The sample is classified as a moderately sorted (σ = 0.895), unimodal, slightly
gravelly sand, with a very coarse skewed (Sk = -0.370), leptokurtic (K = 1.305) grain-size
distribution. The sample is largely composed of sub-angular, compact magnetite grains,
with some interspersed quartz, feldspar, and biotite.
6.2 Petrography
The mineralogical components of the sediment samples include plagioclase,
quartz, K-feldspar, biotite, magnetite, apatite, and zircon. Although the descriptive
characteristics of individual minerals (i.e., cloudy surfaces, twinning, chemical zoning,
crystal shape, etc.) remain the same between samples, average modal abundances of these
minerals vary across samples (Table 2). In particular, there is a systematic depletion of
quartz and K-feldspar and an enrichment of plagioclase (Fig. 12A) and biotite (Fig. 12B)
from fine to coarse samples.
All counted lithic fragments in sediment samples are amalgamations of the same
mineralogical components as found in the Stepladder bedrock. Using the Gazzi-
38
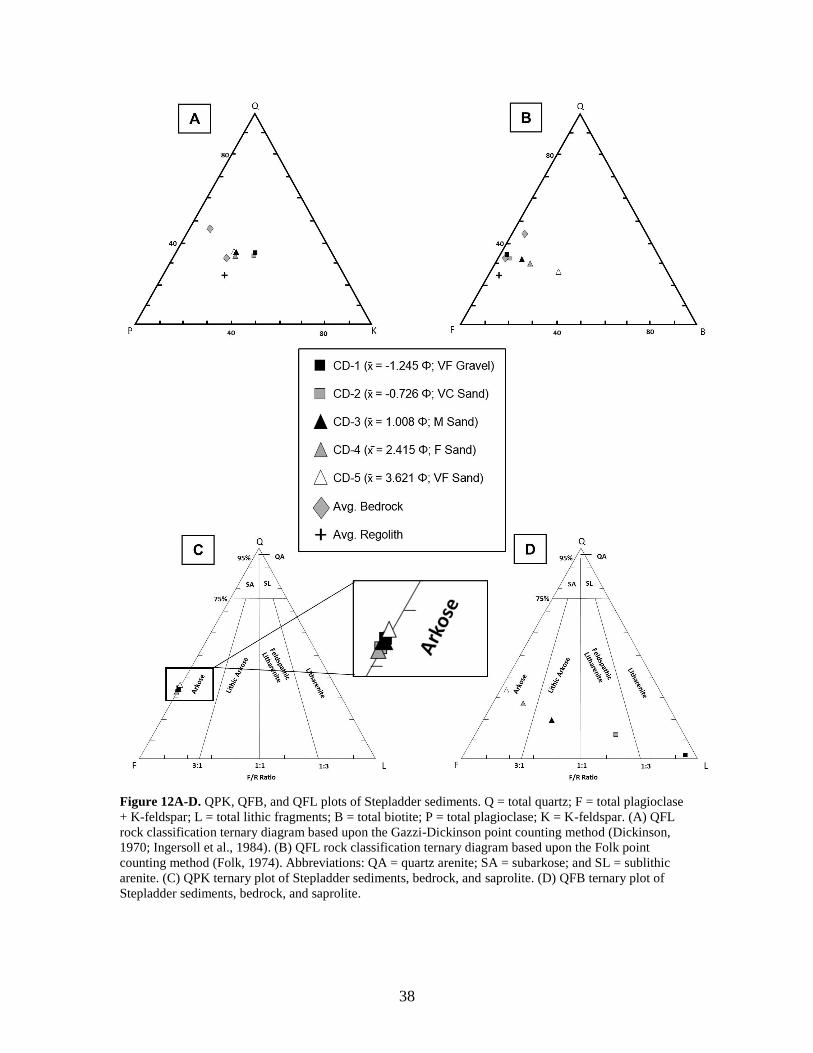
Figure 12A-D. QPK, QFB, and QFL plots of Stepladder sediments. Q = total quartz; F = total plagioclase
+ K-feldspar; L = total lithic fragments; B = total biotite; P = total plagioclase; K = K-feldspar. (A) QFL
rock classification ternary diagram based upon the Gazzi-Dickinson point counting method (Dickinson,
1970; Ingersoll et al., 1984). (B) QFL rock classification ternary diagram based upon the Folk point
counting method (Folk, 1974). Abbreviations: QA = quartz arenite; SA = subarkose; and SL = sublithic
arenite. (C) QPK ternary plot of Stepladder sediments, bedrock, and saprolite. (D) QFB ternary plot of
Stepladder sediments, bedrock, and saprolite.
39
Dickinson point-counting approach, all sediment samples plot as arkoses in Quartz –
Feldspar – Lithic (QFL) space (Fig. 12C). Using the Folk (1974) point-counting
approach, sediments plot across litharenite, feldspathic litharenite, lithic arkose, and
arkose classifications in QFL space (Fig. 12D). Abundances of lithic fragments
systematically decrease from coarser to fine-grained samples (Fig. 12D).
Caliche coats bedrock and fill fractures in saprolite in the Stepladder vicinity
(Modi, 2011), and occurs as clasts in the sediment samples. Caliche grains proportionally
account for less than 1% of all thin section mineralogy, except for sample CD-3 in which
it accounts for 3% of the sample (Table 2).
6.2.1 Quartz
In all samples, quartz occurs as sub-angular to sub-rounded, monocrystalline
grains or less commonly as polycrystalline aggregates (Fig. 11A-C). Both straight and
undulose extinction is present. As quartz is resistant to alteration, no clay minerals were
observed on grains. Quartz is abundant in all collected sediment samples and has a modal
abundance that ranges between 32 to 15%. Both monomineralic quartz and quartz
incorporated into lithic fragments was found to be more prevalent in coarser-sized
samples (CD-1 and CD-2).
6.2.2 Plagioclase
Plagioclase occurs as angular to sub-angular grains. Well-defined albite twinning
and oscillatory zoning are distinctive features in nearly all plagioclase grains, which both
locally occur in a single grain. As expected (e.g. Nesbitt and Markovics, 1997), the
occurrence of minor chemical weathering is more evident in plagioclase than any other
mineral in Stepladder sediment, as secondary clays gave grains a cloudy appearance
40
along twinning planes and the more calcic oscillatory zones. Plagioclase is abundant in
all sediment samples, and has a modal abundance that ranges between 18 to 33%.
Monomineralic plagioclase grains are particularly prevalent in the finer samples (CD-3,
CD-4, and CD-5), whereas lithic fragments containing plagioclase are more common in
coarser samples (CD-1 and CD-2). Using the Michel Levy method for determining
plagioclase composition, all measured grains across all samples are classified as
oligoclase (An22 and An30).
6.2.3 K-feldspar
Potassium feldspar in sediment most commonly occurs as perthitic megacrysts,
which locally display a slightly cloudy appearance, and suggests that clays have replaced
the exsolved plagioclase zones during hydrolysis. In addition to perthite, microcline
occurs as angular grains that locally exhibit minor alteration. Both perthite and
microcline contain poikilitically included grains of plagioclase, quartz, and accessory
minerals. Potassium feldspar increases in modal abundance from fine to coarser sediment
samples, and ranges from 11 to 33% (Table 2), respectively. Potassium feldspar grains, as
both monomineralic and within lithic fragments, are more prevalent in the coarser
sediment samples (CD-1 and CD-2).
6.2.4 Biotite
Biotite grains commonly have a platy shape with frayed edges. Alteration affects
many biotite grains through partial replacement by chlorite and Fe-oxides. Biotite
increases in modal abundance from coarser to finer grained samples with a range between
3 to 19%. Most commonly, biotite occurs as an monomineralic grain across all samples,
except for CD-1, in which it was mostly incorporated in a lithic fragment.
41
6.2.5 Accessory phases
As with the bedrock, magnetite, apatite, and zircon comprise the dominant
accessory phases within the sediment samples. In coarser samples (CD-1, CD-2, and CD-
3), accessory phases occur mostly as inclusions in biotite and plagioclase, whereas in
finer grained samples (CD-4 and CD-5), magnetite and apatite commonly occur as
monomineralic grains. All accessory phases increased in abundance from coarser to finer-
grained samples (Table 2).
6.3 Geochemistry
6.3.1 Major elements
There is a decrease in SiO2 content with decreasing grain size, ranging from 75.2
to 58.8 % from coarser to finer-grained samples (Table 3). Contents of K2O also decrease
with decreasing grain size. An opposite relationship is exhibited by the contents of TiO2,
Fe2O3, MgO, CaO, Na2O, and P2O5, all of which are systematically enriched with
decreasing grain size (Table 3). Coarser samples CD-1 and CD-2 are considerably
depleted in Al2O3 relative to finer-grained samples CD-3, CD-4, and CD-5 (Table 3).
6.3.2 Trace-elements
Trace-element contents of all sediment samples were normalized to the average
bedrock composition to illustrate differences in sediment composition relative to the
known source (Fig. 13A). Elements K, Ba, Sr, Hf, and Nb do not appreciably depart from
bedrock composition (less than 5x the average bedrock composition), whereas elements
Rb, Cs, Mn, Th, Pb, and Zr are highly variable between sediment samples (Fig. 13A).
The greatest departures from average bedrock composition are exhibited by elements Co,
Cr, Sc, Y, and U (Fig. 12A) for all samples. As expected for an accessory mineral
42
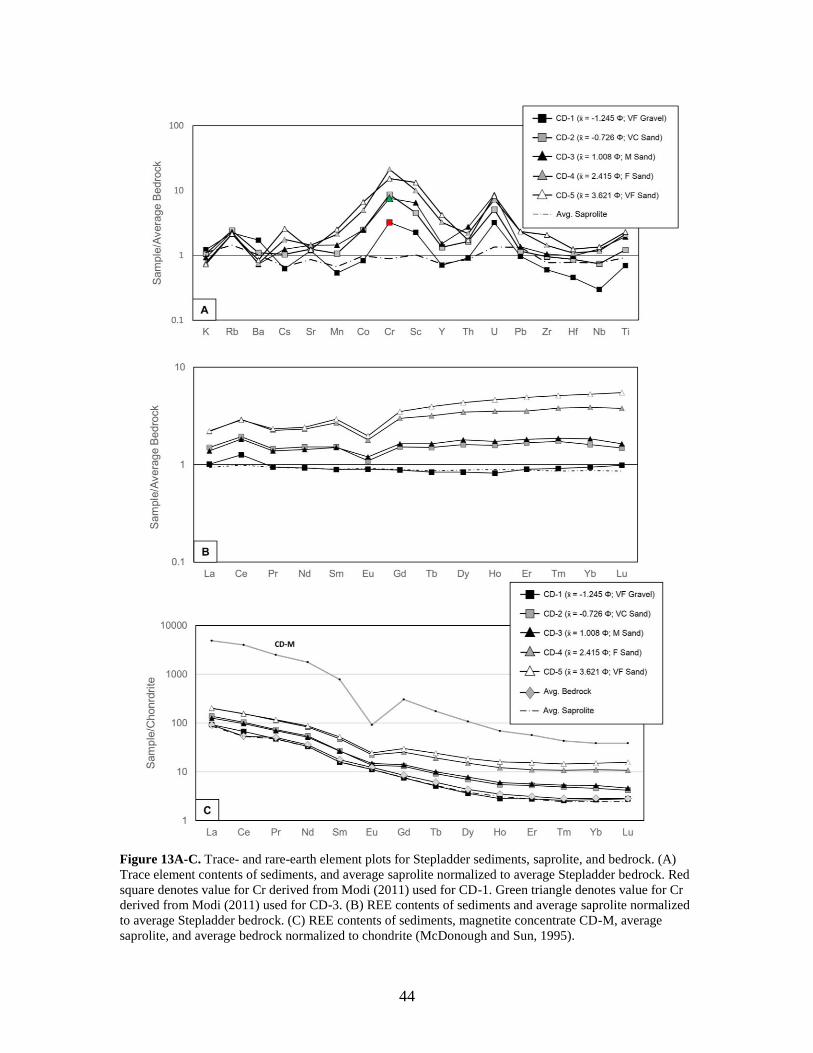
concentrate, sample CD-M is enriched with most trace elements, in particular V, Cr, Co,
Zr, and the REEs (Table 4).
Samples CD-1 and CD-3 have Cr values below detection limits (< 5 ppm). Values
of other elements mineralogically associated with Cr (i.e. Sc, Co, Fe) increase in
abundance from coarse to fine-grained samples (Appendix. Fig. D2), suggesting that an
analytical anomaly may have caused sample CD-3 to report Cr values below detection
limits; by contrast, the actual abundance of Cr in CD-1 is most likely below 5 ppm
because bedrock values are < 5 ppm. To determine what the Cr abundances of these two
samples may actually be, elemental abundances of Cr in two samples collected by Modi
(2011) with similar grain-size distribution curve shapes to CD-1 and CD-3 (Appendix.
Fig. C1) were used in an iterative analysis (Appendix. Fig. D3). Here, the Cr abundances
of the samples from Modi (2011) were used in conjunction with the Th and Sc
abundances collected in this study to be plotted in Cr/Th vs Th/Sc compositional space
against values of Cr ranging from 1 to 5. It is clear from this approach that Cr values for
CD-1 are actually below detection limits, whereas the low Cr value for CD-3 is most
likely an analytical error. Thus, the Cr values from the respective samples from Modi
(2011) will be used as proxy abundances for Cr values for samples CD-1 and CD-3 in
spider-plots and discrimination diagrams.
6.3.3 Rare-earth elements
In general, the total REE content of each sediment sample increases with
decreasing grain size (∑REE = 89.77 to 220.92 ppm; Table 5), as well as total LREE
(LREEtot = 87.52 to 208.89 ppm; Table 5) and HREEs (HREEtot = 2.25 to 12.03 ppm;
Table 5), which is typical in sedimentary deposits. Values of LREE/HREE decreased
43
with decreasing grain size (LREE/HREE = 38.84 to 17.36; Table 5), which confirms that
finer sediments are enriched with HREEs relative to LREEs.
Although the REE pattern of sample CD-1 most closely resembles the
composition of average bedrock (Fig. 13B), fine-grained samples progressively deviate
from bedrock composition. Chondrite-normalized REE contents of sediments generate
patterns with compositional variations between each sample (Fig. 13C). Chondrite-
normalized ratios indicate that the LREEs (LaCN/SmCN = 5.85 to 3.90; Table 5) are
overall more fractionated than the HREEs (GdCN/YbCN = 2.83 to 1.99; Table 5). Negative
Eu anomalies occur in nearly all sediment samples (the exception being sample CD-1;
Fig. 13B), where Eu/Eu*CN values became increasingly more negative with decreasing
grain size (Eu/Eu*CN = 1.03 to 0.62; Table 5).
Sample CD-M is strongly enriched in all REEs (∑REE = 4873.40 ppm, LREEtot =
4819.56 ppm, HREEtot = 53.84 ppm; Table 5) and like the channel sediments, exhibits
highly fractionated LREEs (LaCN/SmCN = 6.24; Table 5). However, CD-M exhibits a
much steeper slope for HREEs (GdCN/YbCN = 7.89; Table 5) than any other sediments.
The europium anomaly in sample CD-M is much more negative than any of the other
samples (Eu/Eu*CN = 0.19; Table 5).
Positive Ce anomalies occur in all sediment samples with Ce/Ce*BN, ranging from
1.29 to 1.49 (Table 5). Positive Ce anomalies have been interpreted to be the result of
weathering as Ce3+ oxidizes to insoluble Ce4+ (Braun and Pagel, 1994). In the case of
Stepladder sediments, a positive Ce anomaly is seen across all grain-size populations,
which does not considerably change between samples (Fig. 13B). This suggests the Ce
anomaly is likely a result of redox processes occurring during weathering.
44
Figure 13A-C. Trace- and rare-earth element plots for Stepladder sediments, saprolite, and bedrock. (A)
Trace element contents of sediments, and average saprolite normalized to average Stepladder bedrock. Red
square denotes value for Cr derived from Modi (2011) used for CD-1. Green triangle denotes value for Cr
derived from Modi (2011) used for CD-3. (B) REE contents of sediments and average saprolite normalized
to average Stepladder bedrock. (C) REE contents of sediments, magnetite concentrate CD-M, average
saprolite, and average bedrock normalized to chondrite (McDonough and Sun, 1995).
45
7. EVALUATION OF THE PROCESSES AFFECTING SEDIMENT
GEOCHEMISTRY
7.1 Chemical Weathering
The present climate of the Mojave Desert is arid (Stoffer, 2004). Consequently, it
is unlikely that compositional and geochemical variations in the modern channel
sediments were produced from extensive chemical weathering of Stepladder pluton
bedrock. However, to isolate mechanical sorting as the sole cause of compositional
variability amongst the collected samples, an examination of the extent of chemical
alteration in the studied sediments is needed.
The Al2O3–CaO*+Na2O–K2O (A–CN–K) compositional ternary diagram (Fig.
14A; Nesbitt and Young, 1984, 1989; Fedo et al., 1995) has been widely used to evaluate
chemical weathering trends. Early stages of chemical weathering begin with the
hydrolysis of plagioclase that results in the production of kaolinite, which plots directly
on the A apex (Fig. 14A). Thus, samples that endured chemical weathering should have
larger proportions of aluminous weathering products and follow a predictable trend
towards the A-apex parallel to the A-CN boundary (Nesbitt and Young 1984, 1989; Fig.
14A).
The Chemical Index of Alteration (CIA) is a numerical value between 50 and 100
used as an intensity scale for chemical weathering (Nesbitt and Young, 1982) and is
calculated as follows:
CIA = (Al2O3 / Al2O3 + CaO* + Na2O + K2O) * 100 (Eq. 1)
where the oxide values are in molecular proportions, and CaO* is representative of CaO
content in silicates only by subtracting apatite and carbonate components
46
Figure 14A-B. A-CN-K and A-CNK-FM compositional plots for the average Stepladder bedrock,
saprolite, and channel sediments. (A) A-CN-K compositional diagram. Note the fining of sediments toward
plagioclase composition. (B) A-CNK-FM compositional diagram. Note the fining of sediments toward the
FM apex. Both diagrams from Nesbitt and Young (1984, 1989).
47
(CaO* = CaOtot– (10/3)P2O5 – CO2; Nesbitt and Young, 1982, 1989). The CIA values of
individual samples represent the A values in A–CN–K space (Fig. 14A). Fresh granitic
bedrock and unweathered samples have CIA values of 50, whereas values greater than 80
indicate intense weathering (Fedo et al., 1995).
The four fresh Stepladder bedrock samples have an average CIA value of 50.3
(Table 3), indicating that bedrock has experienced negligible chemical weathering.
Similarly, the CIA value of saprolite is also 50.3 (Table 3), demonstrating a lack of
geochemical evidence for the chemical weathering of the saprolite. Thus, two possible
weathering histories are envisioned for the origin of the saprolite: (1) it formed under
wetter climatic conditions prior to the last glacial maximum and is a remnant of the
incipient zone of a weathering profile, or (2) it formed in equilibrium with the modern,
arid climate of the Mojave Desert. Regardless of either possibility, the saprolite releases
modern sediment identical in mineralogical composition to the fresh bedrock.
All sediment samples group along the feldspar join (Fig. 14A), and have CIA
values ranging from 50.1 to 56.6 (Table 3). These values indicate that chemical
weathering has had some, but overall a very minor effect on sediment composition.
Sample CD-5 had the highest CIA value, most likely because any small amount of
weathering products being produced from very minor plagioclase dissolution is
concentrated in finer grain-size populations during transport. Similar to the A–CN–K
diagram is the Al2O3–CaO*+Na2O+K2O–FeO+MgO (A–CNK–FM) diagram (Nesbitt and
Young, 1989; Fig. 14B), which includes Fe and Mg content. All sediments plot as a
group on the feldspar-FM tie line, which implies that no chemical weathering has
occurred to the sediment.
48
7.2 Physical Sorting
There is evidence to suggest that the compositional heterogeneity among samples
plotting along the feldspar tie line (Fig. 14A) is controlled by physical sorting. Samples
with larger average mean grain sizes (CD-1 and CD-2) plot to the right of average
bedrock and contain larger proportions of K-feldspar, whereas samples with smaller
average mean grain sizes (CD-3, CD-4, and CD-5) plot left of average bedrock and
contain larger proportions of plagioclase, which is similar to findings in Modi (2011). In
A–CNK–FM space (Fig. 14B), samples (CD-4 and CD-5) plot preferentially towards the
FM apex, which suggests that biotite and magnetite have become depleted in coarser
samples and are enriched in fine grained samples. These observations are supported by
point-counting data (Table 2), that demonstrate preferential concentration of biotite and
magnetite in fine-grained samples.
An explanation for this can be attributed to the differences in textural properties
of minerals in the Stepladder bedrock. The hydrodynamic shape of biotite allows it to
float in water during transport which increases the likelihood of biotite being sorted apart
from quartz and feldpsar during fluvial transport. Magnetite, conversely, has a greater
density (~5.15 g/cm3) than other minerals in the Stepladder bedrock (quartz ~ 2.65 g/cm3;
plagioclase ~ 2.68 g/cm3; and K-feldspar ~ 2.56 g/cm3), thus allowing it to become
preferentially sorted and concentrated. Considering that biotite and magnetite are both
minerals that possibly contain greater proportions of compatible trace elements than
quartz or feldspars, it is possible that physical sorting has distorted the immobile element
provenance signatures from source composition.
49
8. EVALUATION OF THE UTILITY OF PROVENANCE
INDICATORS
The overarching purpose of this research was to evaluate whether first-cycle
sediment that has travelled no further than a few hundred meters from its bedrock source,
that experienced no quantifiable chemical weathering, can predict the provenance
composition by using conventional geochemical discrimination plots. This becomes a test
to determine the extent to which, if at all, physical sorting impacts the geochemical
composition of naturally sorted clastic sediment.
More directly, this work questions whether commonly used discriminative plots
are representative of actual source compositions, and how accurate past studies that have
used bulk geochemistry to interpret the provenance of sandstones (Roser and Korsch,
1999; Armstrong-Altrin et al., 2004; Bakkiaraj et al., 2010) and mudrocks (Cullers, 2000;
Bhat and Ghosh, 2001; Lee, 2002; Hofmann et al., 2003) may be. In this study, clastic
sediments were collected from a single location in a fluvial channel where the source
composition is known. Samples span the types of grain sizes (fine pebbles to coarse silt)
that comprise the sedimentary record, and that are commonly used in provenance work. If
these samples fail to reconstruct the same, known source composition regardless of grain
size, the accuracy of using whole-rock geochemistry to interpret provenance may be
more limited by physical sorting than previously thought.
8.1 Major elements
8.1.1 A–CN–K and A–CNK–FM diagrams
In addition to evaluating chemical weathering trends, A–CN–K (Fig. 14A) and
A–CNK–FM (Fig. 14B) diagrams can also be used to infer provenance composition by
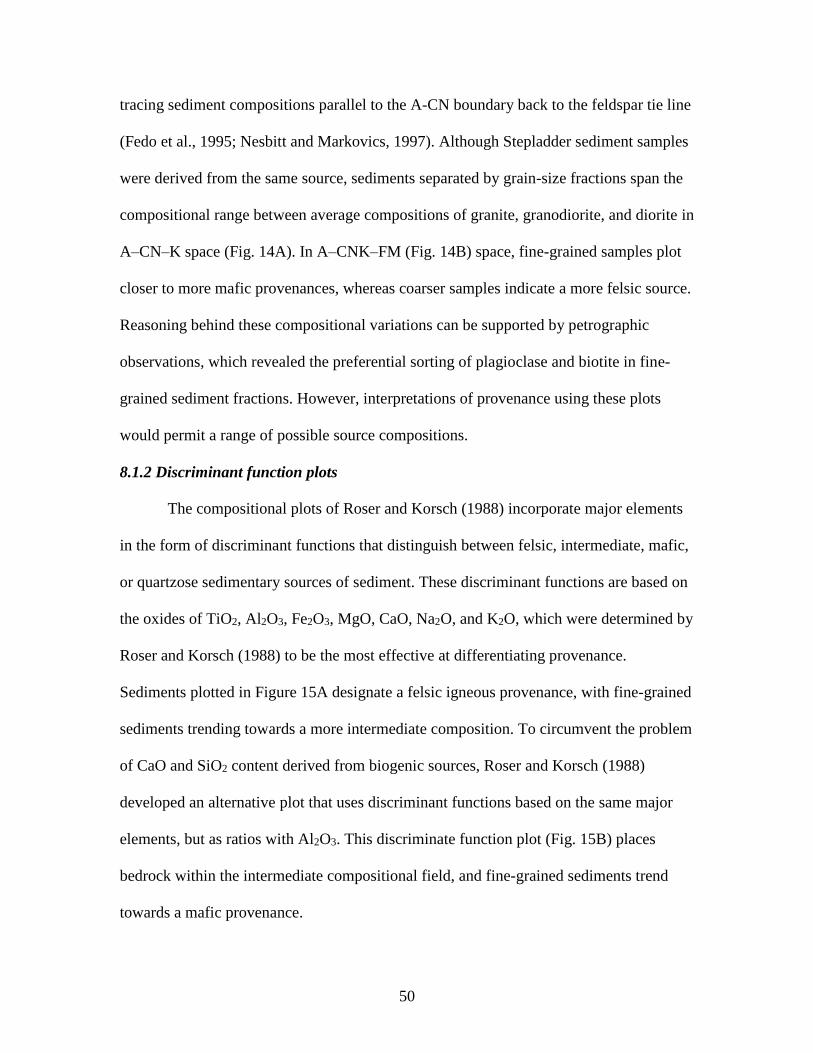
50
tracing sediment compositions parallel to the A-CN boundary back to the feldspar tie line
(Fedo et al., 1995; Nesbitt and Markovics, 1997). Although Stepladder sediment samples
were derived from the same source, sediments separated by grain-size fractions span the
compositional range between average compositions of granite, granodiorite, and diorite in
A–CN–K space (Fig. 14A). In A–CNK–FM (Fig. 14B) space, fine-grained samples plot
closer to more mafic provenances, whereas coarser samples indicate a more felsic source.
Reasoning behind these compositional variations can be supported by petrographic
observations, which revealed the preferential sorting of plagioclase and biotite in fine-
grained sediment fractions. However, interpretations of provenance using these plots
would permit a range of possible source compositions.
8.1.2 Discriminant function plots
The compositional plots of Roser and Korsch (1988) incorporate major elements
in the form of discriminant functions that distinguish between felsic, intermediate, mafic,
or quartzose sedimentary sources of sediment. These discriminant functions are based on
the oxides of TiO2, Al2O3, Fe2O3, MgO, CaO, Na2O, and K2O, which were determined by
Roser and Korsch (1988) to be the most effective at differentiating provenance.
Sediments plotted in Figure 15A designate a felsic igneous provenance, with fine-grained
sediments trending towards a more intermediate composition. To circumvent the problem
of CaO and SiO2 content derived from biogenic sources, Roser and Korsch (1988)
developed an alternative plot that uses discriminant functions based on the same major
elements, but as ratios with Al2O3. This discriminate function plot (Fig. 15B) places
bedrock within the intermediate compositional field, and fine-grained sediments trend
towards a mafic provenance.
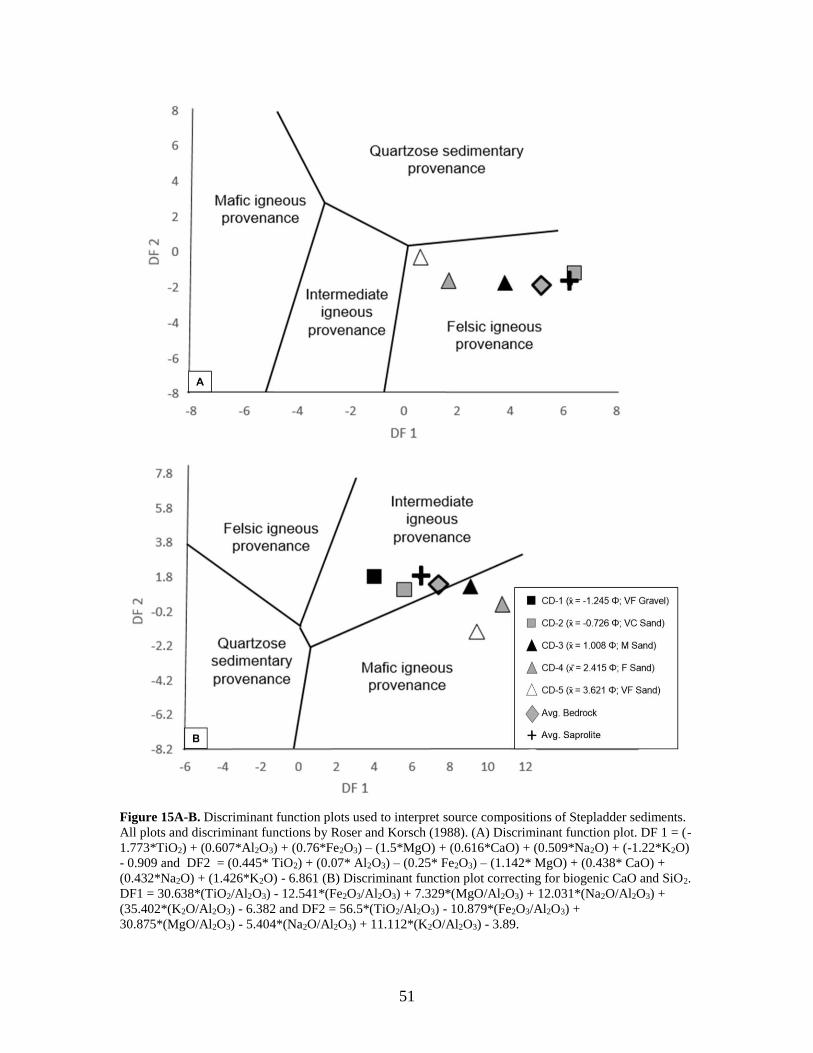
51
Figure 15A-B. Discriminant function plots used to interpret source compositions of Stepladder sediments.
All plots and discriminant functions by Roser and Korsch (1988). (A) Discriminant function plot. DF 1 = (-
1.773*TiO2) + (0.607*Al2O3) + (0.76*Fe2O3) – (1.5*MgO) + (0.616*CaO) + (0.509*Na2O) + (-1.22*K2O)
- 0.909 and DF2 = (0.445* TiO2) + (0.07* Al2O3) – (0.25* Fe2O3) – (1.142* MgO) + (0.438* CaO) +
(0.432*Na2O) + (1.426*K2O) - 6.861 (B) Discriminant function plot correcting for biogenic CaO and SiO2.
DF1 = 30.638*(TiO2/Al2O3) - 12.541*(Fe2O3/Al2O3) + 7.329*(MgO/Al2O3) + 12.031*(Na2O/Al2O3) +
(35.402*(K2O/Al2O3) - 6.382 and DF2 = 56.5*(TiO2/Al2O3) - 10.879*(Fe2O3/Al2O3) +
30.875*(MgO/Al2O3) - 5.404*(Na2O/Al2O3) + 11.112*(K2O/Al2O3) - 3.89.
52
As sorting is likely causing these compositional variations across grain-size
populations, the utility of these plots in correctly predicting the provenance of sorted
sediments from an unknown source composition may be problematic. Despite the
compositional variations between samples, the first discriminant plot (Fig. 15A) was
successful at predicting a felsic provenance for all sediments, as well as average bedrock.
In the case of the alternative discriminative function plot (Fig. 15B), two different
igneous provenances can be interpreted across the spectrum of samples derived from the
same source. As several studies have used these plots to interpret the source composition
of transported sediments (Roser et al., 1996; Bahlburg, 1998; Roser and Korsch, 1999;
Oni et al., 2014; Armstrong-Altrin et al., 2015; Eizenhöfer et al., 2015), it should be
noted that only coarser-sized sediment fractions (between fine gravel and medium sand)
may plot near the actual source composition within an appropriate provenance field.
8.2 Trace elements
8.2.1 Incompatible to compatible element ratio plots
Trace elements are suitable for provenance interpretation in the form of ratios of
incompatible and compatible elements. To discriminate between felsic and mafic sources,
incompatible elements (La, Th, Hf, Zr) that are abundant in felsic minerals are compared
with compatible elements (Sc, Cr, Co) abundant in mafic minerals (Cullers et al., 1988).
Thus, when these trace elements of sand-sized sediments are represented as incompatible
to compatible element ratios (Th/Sc, La/Sc, Th/Co, La/Co, Cr/Th), they can indicate
provenance composition (Taylor and McLennan, 1985; Bhatia and Crook, 1986; Condie
and Wronkiewicz, 1990), and more specifically, uncover the relative contribution of
felsic to mafic inputs. However, because mineral fractionation can occur during transport
53
(Fralick and Kronberg, 1997), the use of these ratios and elements to make interpretations
of provenance are potentially only valid for locally derived sediments. In order to test if
first-cycle sediments from a known source would predict provenance, sediments were
plotted in Th/Sc vs Sc ppm, Cr/Th vs Th/Sc, and Th/Co vs La/Sc diagrams along with
Stepladder pluton and saprolite reference compositions, probable sources of Meso-
Cenozoic basalt, Phanerozoic granite, Meso-Cenozoic andesite, and tonalite-
trondhjemite-granodiorite (TTG) (Condie, 1993). All plots include reference lines on
average bedrock composition, which forms an end member mixing model with basalt.
In the Th/Sc vs Sc ppm plot (McLennan and Taylor, 1991; Fedo et al., 1996; Fig.
16A), average bedrock has a relatively high Th/Sc value of 10.66, whereas sediment
samples exhibit immediately lower Th/Sc values that range from 4.29 to 1.37 from coarse
to fine populations. The systematic decrease in Th/Sc values with decreasing grain size
occurs because the Sc contents in sediment become enriched up to thirteen times the
original bedrock Sc values, whereas Th values in sediment are only enriched up to 1.7
times the original bedrock Th values (Fig. 13A). The coarsest sample, CD-1, even
exhibits a considerably low Th/Sc ratio of 4.29, which demonstrates that small, overall
contribution of fine-grained sediment in a sample composed of mostly gravel can still
distort immobile element signatures. Despite the fact that sediment collected for this
study was sourced from a single pluton, the data scatter supports source mixing of the
average bedrock and a basaltic end member (Fig. 16A) to produce the ranges of possible
sediment compositions observed.
On the Cr/Th vs Th/Sc plot (Condie and Wronkiewicz, 1990; Condie et al., 2001;
Fig. 16B), sediments display increasing Cr/Th values with decreasing grain size. This is
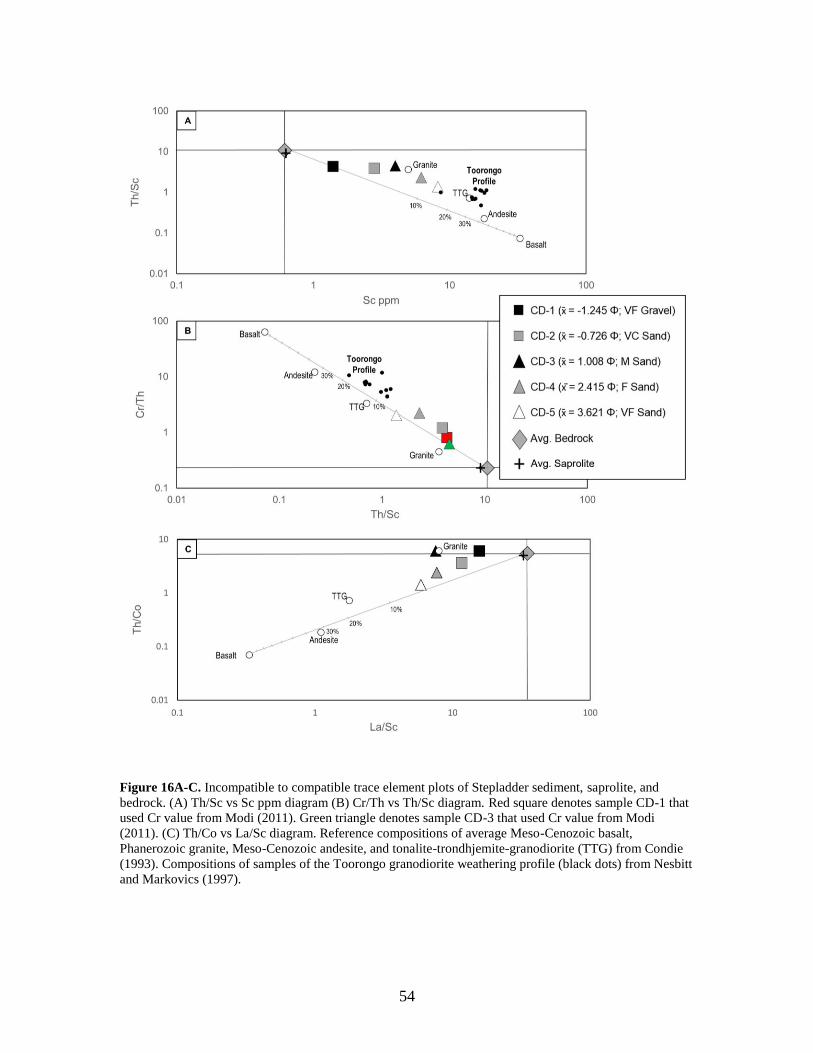
54
Figure 16A-C. Incompatible to compatible trace element plots of Stepladder sediment, saprolite, and
bedrock. (A) Th/Sc vs Sc ppm diagram (B) Cr/Th vs Th/Sc diagram. Red square denotes sample CD-1 that
used Cr value from Modi (2011). Green triangle denotes sample CD-3 that used Cr value from Modi
(2011). (C) Th/Co vs La/Sc diagram. Reference compositions of average Meso-Cenozoic basalt,
Phanerozoic granite, Meso-Cenozoic andesite, and tonalite-trondhjemite-granodiorite (TTG) from Condie
(1993). Compositions of samples of the Toorongo granodiorite weathering profile (black dots) from Nesbitt
and Markovics (1997).
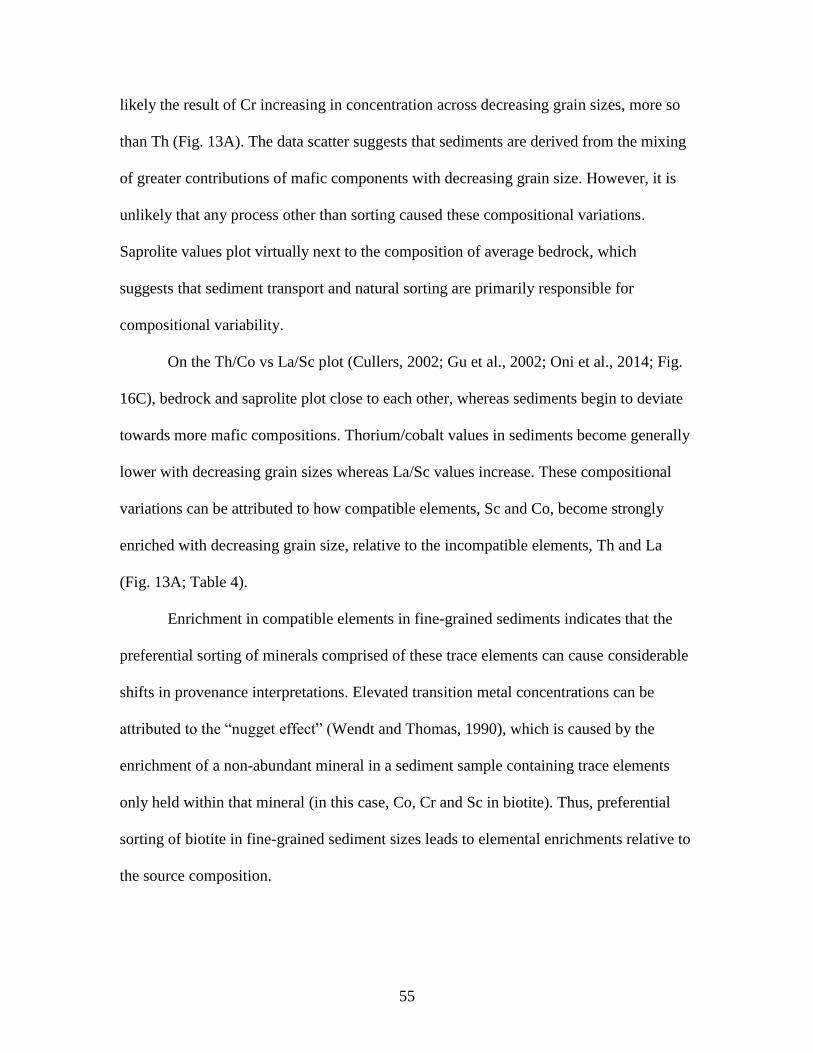
55
likely the result of Cr increasing in concentration across decreasing grain sizes, more so
than Th (Fig. 13A). The data scatter suggests that sediments are derived from the mixing
of greater contributions of mafic components with decreasing grain size. However, it is
unlikely that any process other than sorting caused these compositional variations.
Saprolite values plot virtually next to the composition of average bedrock, which
suggests that sediment transport and natural sorting are primarily responsible for
compositional variability.
On the Th/Co vs La/Sc plot (Cullers, 2002; Gu et al., 2002; Oni et al., 2014; Fig.
16C), bedrock and saprolite plot close to each other, whereas sediments begin to deviate
towards more mafic compositions. Thorium/cobalt values in sediments become generally
lower with decreasing grain sizes whereas La/Sc values increase. These compositional
variations can be attributed to how compatible elements, Sc and Co, become strongly
enriched with decreasing grain size, relative to the incompatible elements, Th and La
(Fig. 13A; Table 4).
Enrichment in compatible elements in fine-grained sediments indicates that the
preferential sorting of minerals comprised of these trace elements can cause considerable
shifts in provenance interpretations. Elevated transition metal concentrations can be
attributed to the “nugget effect” (Wendt and Thomas, 1990), which is caused by the
enrichment of a non-abundant mineral in a sediment sample containing trace elements
only held within that mineral (in this case, Co, Cr and Sc in biotite). Thus, preferential
sorting of biotite in fine-grained sediment sizes leads to elemental enrichments relative to
the source composition.
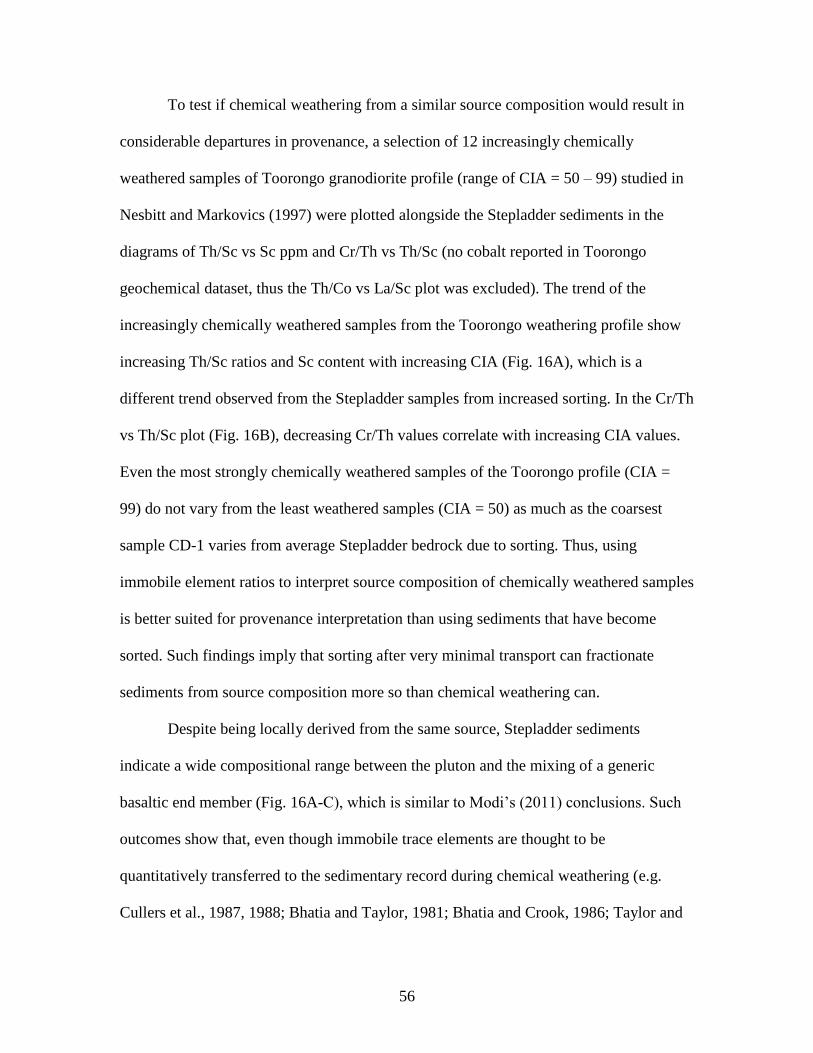
56
To test if chemical weathering from a similar source composition would result in
considerable departures in provenance, a selection of 12 increasingly chemically
weathered samples of Toorongo granodiorite profile (range of CIA = 50 – 99) studied in
Nesbitt and Markovics (1997) were plotted alongside the Stepladder sediments in the
diagrams of Th/Sc vs Sc ppm and Cr/Th vs Th/Sc (no cobalt reported in Toorongo
geochemical dataset, thus the Th/Co vs La/Sc plot was excluded). The trend of the
increasingly chemically weathered samples from the Toorongo weathering profile show
increasing Th/Sc ratios and Sc content with increasing CIA (Fig. 16A), which is a
different trend observed from the Stepladder samples from increased sorting. In the Cr/Th
vs Th/Sc plot (Fig. 16B), decreasing Cr/Th values correlate with increasing CIA values.
Even the most strongly chemically weathered samples of the Toorongo profile (CIA =
99) do not vary from the least weathered samples (CIA = 50) as much as the coarsest
sample CD-1 varies from average Stepladder bedrock due to sorting. Thus, using
immobile element ratios to interpret source composition of chemically weathered samples
is better suited for provenance interpretation than using sediments that have become
sorted. Such findings imply that sorting after very minimal transport can fractionate
sediments from source composition more so than chemical weathering can.
Despite being locally derived from the same source, Stepladder sediments
indicate a wide compositional range between the pluton and the mixing of a generic
basaltic end member (Fig. 16A-C), which is similar to Modi’s (2011) conclusions. Such
outcomes show that, even though immobile trace elements are thought to be
quantitatively transferred to the sedimentary record during chemical weathering (e.g.
Cullers et al., 1987, 1988; Bhatia and Taylor, 1981; Bhatia and Crook, 1986; Taylor and
57
McLennan, 1985; Cullers and Stone, 1991; McLennan et al., 1993), mineral sorting, even
after minimal transport, can cause these elements to differ from the source material. Of
important note, is that the greatest compositional deviations occur in the finest-grained
material, which challenges the accuracy of provenance work using these immobile
elements to interpret the source of mudstones (Cullers, 2000; Bhat and Ghosh, 2001; Lee,
2002; Hofmann et al., 2003). Furthermore, even the coarsest samples that most closely
should resemble bedrock composition contain enough fine-material with mafic trace
elements to cause compositional deviations from bedrock. Thus, any work using
immobile elements to interpret provenance may be strongly limited by physical sorting
regardless of what grain-size population is considered. Bearing in mind that sorting is a
process that occurs in all cases of bedload transport, and that many studies have
interpreted the provenance of sedimentary rocks or sediments that have travelled further
distances than those studied here (Cullers et al., 1988; Slack and Stevens, 1994;
Bahlburg, 1998; Bauluz et al., 2000; Roser and Korsch, 1999; Cullers and Podkovyrov,
2000; Condie et al., 2001; Gu et al., 2002; Zimmerman and Bahlburg, 2003; Oni et al.,
2014; Eizenhöfer et al., 2015; Xiang et al., 2015), the conventionally accepted notion that
certain immobile elements behave as a closed system throughout sedimentary processing
is rejected.
8.2.2 Sediment recycling ratio plots
Other trace element ratio plots, such as Th/Sc vs Zr/Sc (McLennan et al., 1993;
Fig. 17A), have been used to infer zircon enrichment by sediment recycling over a range
of compositions (Bahlburg, 1998; Roser and Korsch, 1999; Zimmerman and Bahlburg,
2003; Oni et al., 2014; Xiang et al., 2015; Moradi et al., 2016). The distribution of
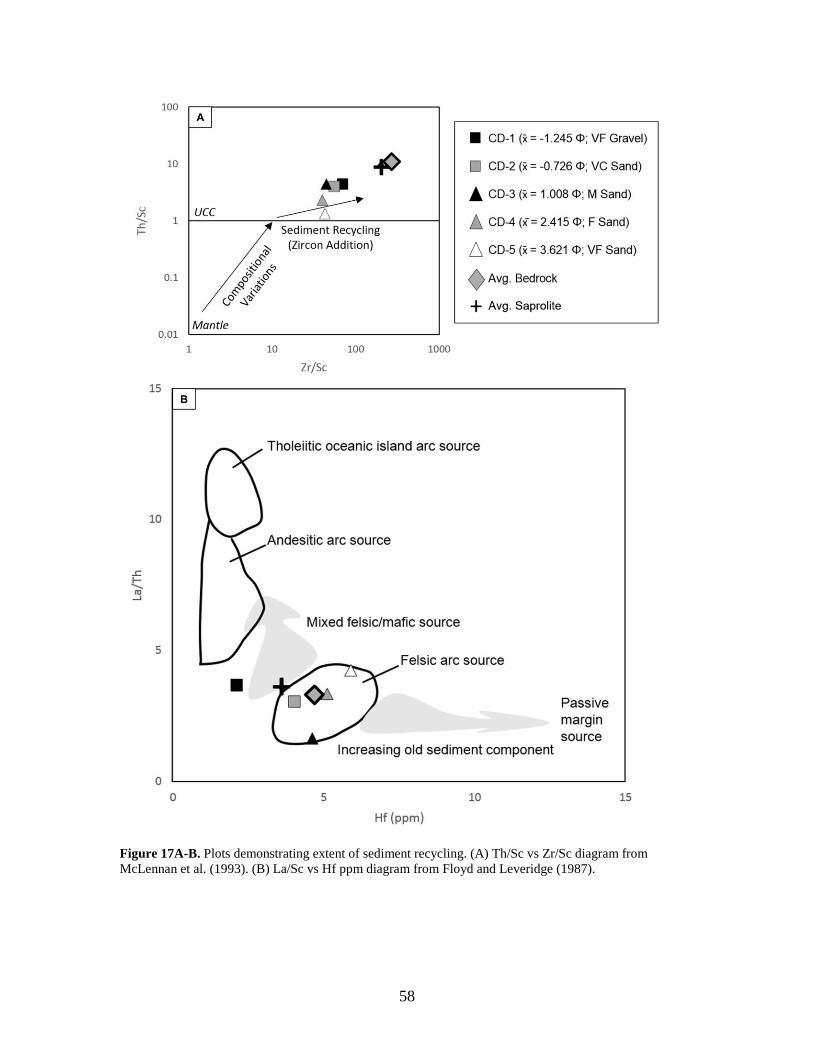
58
Figure 17A-B. Plots demonstrating extent of sediment recycling. (A) Th/Sc vs Zr/Sc diagram from
McLennan et al. (1993). (B) La/Sc vs Hf ppm diagram from Floyd and Leveridge (1987).
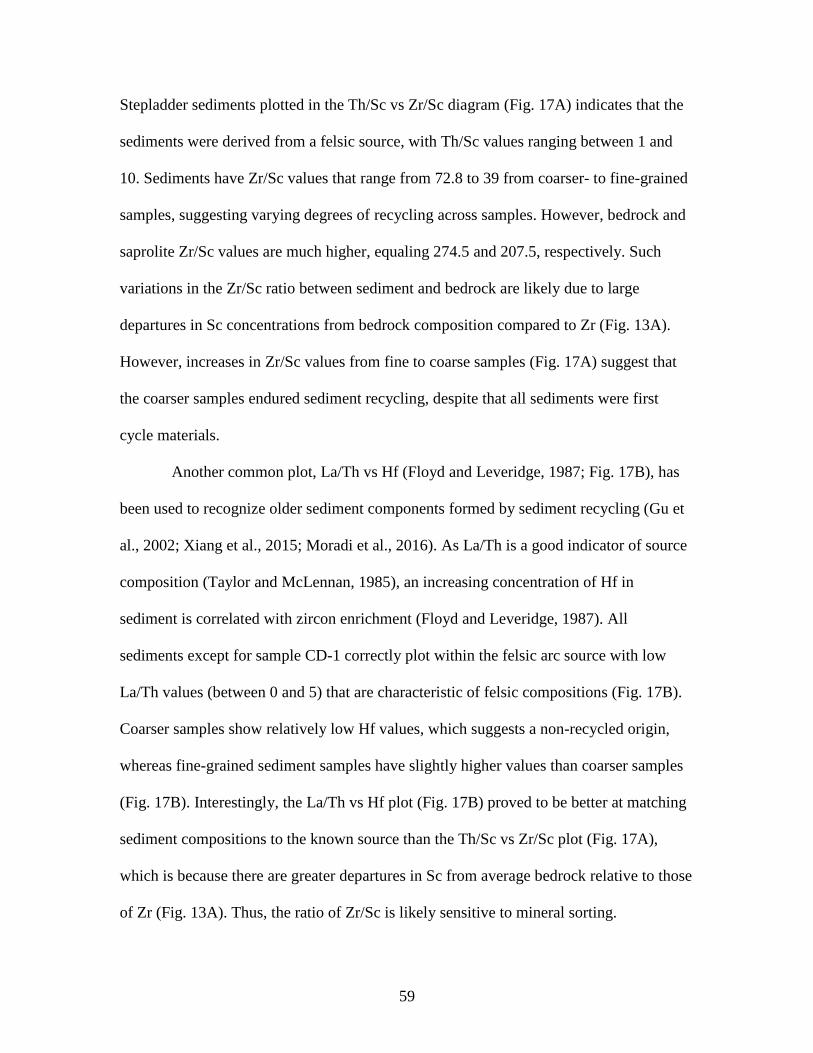
59
Stepladder sediments plotted in the Th/Sc vs Zr/Sc diagram (Fig. 17A) indicates that the
sediments were derived from a felsic source, with Th/Sc values ranging between 1 and
10. Sediments have Zr/Sc values that range from 72.8 to 39 from coarser- to fine-grained
samples, suggesting varying degrees of recycling across samples. However, bedrock and
saprolite Zr/Sc values are much higher, equaling 274.5 and 207.5, respectively. Such
variations in the Zr/Sc ratio between sediment and bedrock are likely due to large
departures in Sc concentrations from bedrock composition compared to Zr (Fig. 13A).
However, increases in Zr/Sc values from fine to coarse samples (Fig. 17A) suggest that
the coarser samples endured sediment recycling, despite that all sediments were first
cycle materials.
Another common plot, La/Th vs Hf (Floyd and Leveridge, 1987; Fig. 17B), has
been used to recognize older sediment components formed by sediment recycling (Gu et
al., 2002; Xiang et al., 2015; Moradi et al., 2016). As La/Th is a good indicator of source
composition (Taylor and McLennan, 1985), an increasing concentration of Hf in
sediment is correlated with zircon enrichment (Floyd and Leveridge, 1987). All
sediments except for sample CD-1 correctly plot within the felsic arc source with low
La/Th values (between 0 and 5) that are characteristic of felsic compositions (Fig. 17B).
Coarser samples show relatively low Hf values, which suggests a non-recycled origin,
whereas fine-grained sediment samples have slightly higher values than coarser samples
(Fig. 17B). Interestingly, the La/Th vs Hf plot (Fig. 17B) proved to be better at matching
sediment compositions to the known source than the Th/Sc vs Zr/Sc plot (Fig. 17A),
which is because there are greater departures in Sc from average bedrock relative to those
of Zr (Fig. 13A). Thus, the ratio of Zr/Sc is likely sensitive to mineral sorting.
60
While interpretations of different source compositions and degrees of sediment
recycling can be made for the Stepladder samples, all compositional variations can likely
be attributed to mostly to physical sorting. Variations in abundances of Zr and Hf across
all the Stepladder sediments do not necessarily imply that these sediments had endured
varying degrees of recycling, but rather that zircon had become preferentially
concentrated in finer grain-size populations during minimal transport. Therefore, it must
be understood that sorting does not only hold the capacity to influence the concentrations
of transition metals in sediment, but also certain elements held within weathering-
resistant minerals.
8.3 Rare-earth elements
Rare-earth elements have been widely considered very useful indicators of
provenance under the premise that they are not easily fractionated between sediment and
source, and that sources ranging from felsic to ultramafic have distinct REE patterns
(Taylor and McLennan, 1985; Cullers, 1988; McLennan and Taylor, 1991).
Characteristics of these patterns that describe the slopes of LREEs and HREEs, as well as
the magnitude of the Eu anomaly, can be displayed as ratios (La/Sm, Gd/Yb, La/Yb,
Eu/Eu*) and have been used as indicators of provenance (Cullers and Podkovyrov, 2000;
Slack and Stevens, 1994; Bauluz et al., 2000; Condie et al., 2001; Gu et al., 2002;
Zimmerman and Bahlburg, 2003; Oni et al., 2014; Xiang et al., 2015; Armstrong-Altrin
et al., 2015; Moradi et al., 2016). Although the Stepladder sediment samples have broadly
similar bedrock-normalized REE patterns (Fig. 13B), these ratios, as well as total REE
content, depart from bedrock composition with decreasing grain size. To examine the role
61
of sorting on REE composition, each feature (∑REE, LaBN/SmBN, GdBN/YbBN) can be
comparatively discussed with Eu/Eu*BN values (Fig. 18A-C).
8.3.1 Rare-earth element plots
8.3.1.1 Total REE content
Total REE contents of Stepladder sediments increase with decreasing grain size,
resulting in sediments plotting between a range of reference compositions, with most
samples differing in composition from average bedrock (Fig. 18A). Finer-grained
samples, CD-4 and CD-5, most closely resemble the more felsic reference composition of
Meso-Cenozoic granite than the known source (Fig. 18A). Coarser-grained samples CD-2
and CD-3 most closely resemble the composition of TTG, but with marginally higher
total REE content (Fig. 18A).
Variations in REE content across grain sizes can occur as finer fractions are more
likely to be dominated by heavy minerals (Cullers et al., 1987; Cullers et al., 1988). In the
case of the Stepladder sediments, increasing total REE content with decreasing grain size
may be a result of accessory minerals concentrating in fine-grained sediment populations,
as the magnetite concentrate, CD-M, has vastly more REE content (∑REE = 4873.4 ppm)
than any other sample. Zircon concentration may also be a factor, as abundances of both
Zr and Hf increase from coarse to fine samples (Fig. 13A).
8.3.1.2 Europium anomaly
Four of the sediment samples have a negative Eu anomaly, with Eu/Eu*BN values
that range from 0.72 to 0.61 (CD-2 through CD-5; Table 5). The coarsest sediment
sample, CD-1, exhibits a slightly positive Eu/Eu*BN value of 1.02. Bedrock and saprolite
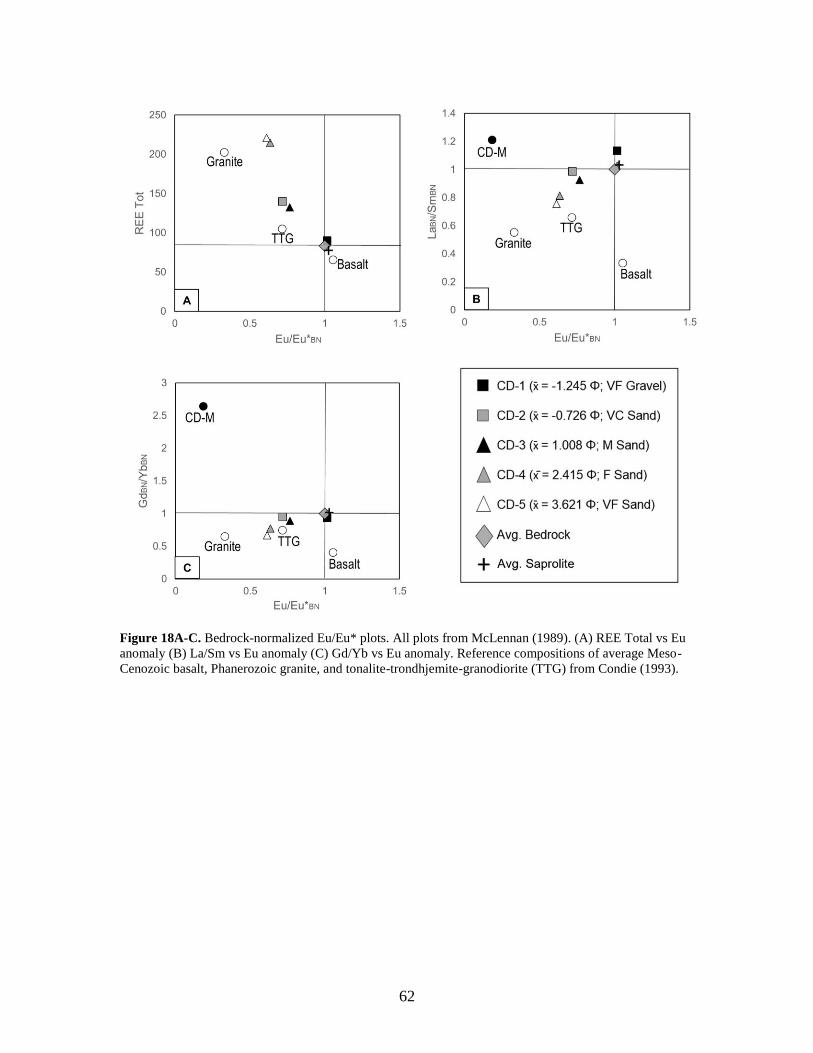
62
Figure 18A-C. Bedrock-normalized Eu/Eu* plots. All plots from McLennan (1989). (A) REE Total vs Eu
anomaly (B) La/Sm vs Eu anomaly (C) Gd/Yb vs Eu anomaly. Reference compositions of average Meso-
Cenozoic basalt, Phanerozoic granite, and tonalite-trondhjemite-granodiorite (TTG) from Condie (1993).
63
Eu/Eu*BN values are 1.00 and 1.03, respectively, illustrating that a negative europium
signature is developed as soon as sediment becomes sorted as coarse sand.
As the magnetite concentrate, sample CD-M, has a strongly negative Eu/Eu*BN
value (Fig. 18B-C), it can be suggested that the preferential sorting of magnetite in finer
grain sizes may partly influence the europium signature. It is also possible that zircon
enrichment in finer grain-size fractions somewhat controls the Eu anomaly as zircons
commonly have depleted Eu signatures relative to Sm and Gd (Trail et al., 2012). This is
problematic, however, as pioneering provenance work considers the negative Eu
signature to be inherited from a more felsic source than granodiorite (McLennan et al.,
1993). As sediments collected in this study range from having no Eu anomaly to a
negative one, the value of Eu/Eu* in sorted sediment fractions finer than coarse sand may
not necessarily reflect true source composition.
8.3.1.3 LREE and HREE content
Fractionation of LREEs decreases with decreasing grain size (Fig. 18B;
LaBN/SmBN = 1.13 for CD-1 to 0.76 for CD-5). Heavy REE fractionation also decreases
from coarse to fine sediments (Fig. 18C; GdBN/YbBN = 0.93 for CD-1 to 0.67 for CD-5).
Decreasing fractionations of both LREEs and HREEs may be due to an enrichment of
certain accessory minerals across all samples. However, it is unclear if magnetite may
control fractionation behavior, as sample CD-M does not exhibit similar slopes for
LREEs and HREEs (Fig. 13C), nor does it have LaBN/SmBN (Fig. 18B) or GdBN/YbBN
(Fig. 18C) values that show a correlation with decreasing grain size. Conversely, zircon,
which increases in abundance with decreasing grain-size fractions (Table 2), may be
64
responsible for the behavior of increasing HREE slopes as it commonly has high HREE
content (Borges et al. 2008; Mahjoor et al., 2009).
For both LREEs and HREEs, finer-grained sediments trend toward more felsic
compositions (Fig. 18B-C). Interestingly, this opposes the data scatter in the incompatible
to compatible trace element plots (Fig. 16A-C), which indicated finer-grained sediments
trend toward more mafic compositions. Such a finding illustrates that there are
inconsistencies between interpretations of source composition that can be made,
depending on which elements are considered. Consequently, the utility of trace and rare-
earth elements as reliable indicators of provenance may be strongly challenged by the
impact physical sorting has on sediment composition.
65
9. SUMMARY AND CONCLUSIONS
1. The goal of this study was to test the effectiveness of commonly used
geochemical and petrographic techniques applied to provenance interpretations
for sediment produced from a known source and subsequently sorted during
minimal fluvial transport. The Stepladder Mountains in the Mojave Desert, CA,
reside in an arid setting where modern sediments within an enclosed drainage
basin should ideally resemble the single, known source because of essentially
minimal chemical weathering and transport. Previous work by Modi (2011) has
shown that sediments are naturally sorted by grain size in fluvial channels that
dissect the source region. The hypothesis tested was that if sediments could be
substantially sorted by grain size after only meters of transport in an arid climate,
then they would exhibit mineralogical and thus, geochemical deviations from the
known source.
2. Within the watershed, five sediment samples were collected across a single
channel and had become sorted into five distinct grain-size populations. Every
sediment sample, despite mean grain size differences, comprised the same
mineralogy as the granitic bedrock, which consisted of plagioclase, K-feldspar,
quartz, and biotite. Accessory minerals include magnetite, apatite, and zircon.
Coarser sediments (CD-1 and CD-2) were enriched in quartz, whereas fine-grain
sediments (CD-3, CD-4, and CD-5) were enriched in plagioclase, biotite, and
magnetite.
3. The low CIA values in both sediment and bedrock indicate that the degree of
chemical weathering influencing sediment composition is negligible. However,
66
data suggest that if a small amount weathering products were present, they are
concentrated in finer grain sizes. Fractionation of FeO and MgO from Al2O3,
CaO, Na2O, and K2O occurs during transport, and biotite and magnetite were
concentrated in fine-grained samples.
4. Trace-element plots normalized to average bedrock show strong departures in Cr,
Co, and Sc which are thought to be immobile during sedimentary processing, and
thus are commonly used as components in provenance discriminating ratios.
Sediment ratios successfully interpret the felsic source composition of the
bedrock. However, fine-grained samples reveal preferential trends toward mafic
compositions. Several trace-element ratios, La/Sc, Th/Sc, Th/Co reveal that
sediment may have acquired its composition from the mixing of a basaltic
compositional end member with the actual source to produce the composition of
the fine-grained sediment. Samples of the fresh and chemically weathered
components of a weathering profile indicated that sorting has a greater effect on
distorting the expected outcomes of ratios using immobile elements than chemical
weathering does. Particular diagrams, Th/Sc vs Zr/Sc and La/Th vs Hf ppm,
successfully indicate that appreciable sediment recycling has not occurred, but
demonstrate any ratios using supposedly immobile elements, such as Sc, cause
sediments to deviate from source composition. Coarser samples had greater Zr/Sc
ratios, and thus appeared to have undergone greater sediment recycling than fine-
grained samples.
5. Rare-earth element patterns normalized to average bedrock show that sediments
with decreasing grain sizes have increasingly greater total REE content, negative
67
Eu anomalies, and fractionated LREE and HREE slopes. High rare-earth element
contents of the magnetite concentrate, sample CD-M, suggest that increasing
proportions of magnetite in fine-grained samples may control total REE content.
Variations in the strength of the Eu anomaly, as well as the LREE and HREE
contents across samples, may be controlled by accessory mineral concentration as
magnetite, zircon, and apatite increase in modal abundance in the finer grain
sizes.
6. Despite that the diagrams used in this study are thought to be insensitive to
sedimentary processing, the only factor responsible for causing the composition
of these sediment samples to deviate from another or bedrock is mineral sorting
during less than 0.1 km of transport. This work shows that sediment sorting is
capable of inducing compositional and geochemical changes between source and
sediment, even within trace elements, and that these changes begin to take effect
immediately within the source terrain. Therefore, the ability to accurately
reconstruct provenance from sediment deposited at any distance from the source
rock may be more problematic than previously recognized. Henceforth,
provenance evaluation should consider the influence of fluvial sorting on
sediment composition.

68
REFERENCES CITED
69
Anderson, J.L. and Bender, E.E., 1989. Nature and origin of Proterozoic A-type granitic
magmatism in the southwestern United States of America. Lithos, v. 23, no. 1, p. 19-52.
Anderson, J.L. and Cullers, R.L., 1990. Middle to upper crustal plutonic construction of a
magmatic arc; an example from the Whipple Mountains metamorphic core
complex. Geological Society of America Memoirs, v. 174, p. 47-70.
Armstrong-Altrin, J. S., Lee, Y. I., Verma, S. P., and Ramasamy, S., 2004. Geochemistry
of sandstones from the upper Miocene Kudankulam Formation, southern India:
Implications for provenance, weathering, and tectonic setting. Journal of Sedimentary
Research, v. 74, no. 2, p. 285-297.
Armstrong-Altrin, J.S., Machain-Castillo, M.L., Rosales-Hoz, L., Carranza-Edwards, A.,
Sanchez-Cabeza, J.A. and Ruíz-Fernández, A.C., 2015. Provenance and depositional
history of continental slope sediments in the Southwestern Gulf of Mexico unraveled by
geochemical analysis. Continental Shelf Research, v. 95, p. 15-26.
Bahlburg, H., 1998. The geochemistry and provenance of Ordovician turbidites in the
Argentine Puna. Geological Society, London, Special Publications, v. 142, no. 1, p. 127-
142.
Bakkiaraj, D., Nagendra, R., Nagarajan, R. and Armstrong-Altrin, J.S., 2010.
Geochemistry of sandstones from the Upper Cretaceous Sillakkudi Formation, Cauvery
Basin, southern India: implication for provenance. Journal of the Geological Society of
India, v. 76, no. 5, p. 453-467.
Basu, A.R., 1976. Petrology of Holocene fluvial sand derived from plutonic source rocks;
implications to paleoclimatic interpretation. Journal of Sedimentary Research, v. 46, p.
694–709.
Basu, A., 1985. Influence of climate and relief on compositions of sands released at
source areas. In Provenance of Arenites, Springer Netherlands, v. C-148, p. 1-18.
Bauluz, B., Mayayo, M.J., Fernandez-Nieto, C. and Lopez, J.M.G., 2000. Geochemistry
of Precambrian and Paleozoic siliciclastic rocks from the Iberian Range (NE Spain):
implications for source-area weathering, sorting, provenance, and tectonic
setting. Chemical Geology, v. 168, no. 1, p. 135-150.
Bhat, M.I. and Ghosh, S.K., 2001. Geochemistry of the 2.51 Ga old Rampur Group
pelites, western Himalayas: implications for their provenance and weathering.
Precambrian Research., v. 108, p. 1-16.
Bhatia, M.R., 1983. Plate tectonics and geochemical composition of sandstones. The
Journal of Geology, v. 91, p. 611-627.
70
Bhatia, M. R., and Crook, K. A., 1986. Trace element characteristics of graywackes and
tectonic setting discrimination of sedimentary basins. Contributions to mineralogy and
petrology, v. 92, no. 2, p. 181-193.
Blott, S.J. and Pye, K., 2001. GRADISTAT: a grain size distribution and statistics
package for the analysis of unconsolidated sediments. Earth Surface Processes and
Landforms, v. 26, p. 1237-1248.
Borges, J.B., Huh, Y., Moon, S. and Noh, H., 2008. Provenance and weathering control
on river bed sediments of the eastern Tibetan Plateau and the Russian Far East. Chemical
Geology, v. 254, no. 1, p.52-72.
Braun, J.J. and Pagel, M., 1994. Geochemical and mineralogical behavior of REE, Th
and U in the Akongo lateritic profile (SW Cameroon). Catena, v. 21, no. 2, p.173-177.
Condie, K.C., Noll, P.D. and Conway, C.M., 1992. Geochemical and detrital mode
evidence for two sources of Early Proterozoic sedimentary rocks from the Tonto Basin
Supergroup, central Arizona. Sedimentary Geology, v. 77, no. 1, p. 51-76.
Condie, K.C., Lee, D. and Farmer, G.L., 2001. Tectonic setting and provenance of the
Neoproterozoic Uinta Mountain and Big Cottonwood groups, northern Utah: constraints
from geochemistry, Nd isotopes, and detrital modes. Sedimentary Geology, v. 141, p.
443-464.
Condie, K.C. and Wronkiewicz, D.J., 1990. The Cr/Th ratio in Precambrian pelites from
the Kaapvaal Craton as an index of craton evolution. Earth and Planetary Science Letters
v. 97, p. 256–267.
Condie, K.C., 1993. Chemical composition and evolution of the upper continental crust:
contrasting results from surface samples and shales. Chemical geology, v. 104, no. 1, p.
1-37.
Cox, K.G., Bell, J.D. and Pankhurst, R.J., 1979. The Interpretation of Igneous Rocks,
Springer Netherlands, p. 42-82.
Cullers, R., 1988. Mineralogical and chemical changes of soil and stream sediment
formed by intense weathering of the Danburg granite, Georgia, USA. Lithos, v. 21, no. 4,
p. 301-314.
Cullers, R. L., 1994. The chemical signature of source rocks in size fractions of Holocene
stream sediment derived from metamorphic rocks in the wet mountains region, Colorado,
USA. Chemical Geology, v. 113, no. 3, p. 327-343.
Cullers, R.L., 2000. The geochemistry of shales, siltstones and sandstones of
Pennsylvanian– Permian age, Colorado, USA: implications for provenance and
metamorphic studies. Lithos, v. 51, p. 181– 203.
71
Cullers, R. L., 2002. Implications of elemental concentrations for provenance, redox
conditions, and metamorphic studies of shales and limestones near Pueblo, CO,
USA. Chemical Geology, v. 191, no. 4, p. 305-327.
Cullers, R.L., Barrett, T., Carlson, R. and Robinson, B., 1987. Rare-earth element and
mineralogic changes in Holocene soil and stream sediment: a case study in the Wet
Mountains, Colorado, USA. Chemical geology, v. 63, no. 3, p. 275-297.
Cullers, R.L., Basu, A. and Suttner, L.J., 1988. Geochemical signature of provenance in
sand-size material in soils and stream sediments near the Tobacco Root batholith,
Montana, USA. Chemical Geology, v. 70, no. 4, p. 335-348.
Cullers, R.L. and Podkovyrov, V.N., 2000. Geochemistry of the Mesoproterozoic
Lakhanda shales in southeastern Yakutia, Russia: implications for mineralogical and
provenance control, and recycling. Precambrian Research, v. 104, no. 1, p. 77-93.
Cullers, R.L. and Stone, J., 1991. Chemical and mineralogical comparison of the
Pennsylvanian Fountain Formation, Colorado, USA (an uplifted continental block) to
sedimentary rocks from other tectonic environments. Lithos, v. 27. no. 2, p. 115-131.
DeWitt, E.D., Armstrong, R.L., Sutter, J.F. and Zartman, R.E., 1984. U-Th-Pb, Rb-Sr,
and Ar-Ar mineral and whole-rock isotopic systematics in a metamorphosed granitic
terrane, southeastern California. Geological Society of America Bulletin, v. 95, no. 6, p.
723-739.
Dickinson, W.R., 1970. Interpreting detrital modes of graywacke and arkose. Journal of
Sedimentary Petrology, v. 40, p. 695–707.
Dickinson, W.R., Beard, L.S., Brakenridge, G.R., Erjavec, J.L., Ferguson, R.C., Inman,
K.F., Knepp, R.A., Lindberg, F.A. and Ryberg, P.T., 1983. Provenance of North
American Phanerozoic sandstones in relation to tectonic setting. Geological Society of
America Bulletin, v. 94, no. 2, p. 222-235.
Dickinson, W.R. and Suczek, C.A., 1979. Plate tectonics and sandstone compositions.
The American Association of Petroleum Geologists Bulletin, v. 63, p. 2164–2182.
Dickinson, W. R., and Valloni, R., 1980. Plate settings and provenance of sands in
modern ocean basins. Geology, v. 8, no. 2, p. 82-86.
Dickinson, W. R., Beard, L. S., Brakenridge, G. R., Erjavec, J. L., Ferguson, R. C.,
Inman, K. F., and Ryberg, P. T., 1983. Provenance of North American Phanerozoic
sandstones in relation to tectonic setting. Geological Society of America Bulletin, v. 94,
no. 2, p. 222-235.
72
Dohrenwend, J. C., 1988. Age of the formation and evolution of pediment domes in the
area of the Cima volcanic field, Mojave Desert, California. In This extended land:
geological journeys in the Southern Basin and Range: field trip guidebook, Geological
Society of America, Cordilleran Section Meeting, Las Vegas, Nevada, 1988, p. 214.
Eizenhöfer, P.R., Zhao, G., Zhang, J., Han, Y., Hou, W., Liu, D. and Wang, B., 2015.
Geochemical characteristics of the Permian basins and their provenances across the
Solonker Suture Zone: assessment of net crustal growth during the closure of the Palaeo-
Asian Ocean. Lithos, v. 224, p. 240-255.
Fedo, C.M., Nesbitt, H.W. and Young, G.M., 1995. Unraveling the effects of potassium
metasomatism in sedimentary rocks and paleosols, with implications for paleoweathering
conditions and provenance. Geology, v. 23, no. 10, p. 921-924.
Fedo, C.M., Eriksson, K.A. and Krogstad, E.J., 1996. Geochemistry of shales from the
Archean (~ 3.0 Ga) Buhwa Greenstone Belt, Zimbabwe: implications for provenance and
source-area weathering. Geochimica et Cosmochimica Acta, v. 60, no. 10, p. 1751-1763.
Fedo, C.M. and Cooper, J.D., 2001. Sedimentology and sequence stratigraphy of
Neoproterozoic and Cambrian units across a craton-margin hinge zone, southeastern
California, and implications for the early evolution of the Cordilleran
margin. Sedimentary Geology, v. 141, p. 501-522.
Fedo, C.M., McGlynn, I.O. and McSween, H.Y., 2015. Grain size and hydrodynamic
sorting controls on the composition of basaltic sediments: Implications for interpreting
martian soils. Earth and Planetary Science Letters, v. 423, p. 67-77.
Feng, R. and Kerrich, R., 1990. Geochemistry of fine-grained clastic sediments in the
Archean Abitibi greenstone belt, Canada: implications for provenance and tectonic
setting. Geochimica et Cosmochimica Acta, v. 54, no. 4, p. 1061-1081.
Floyd, P.A. and Leveridge, B.E., 1987. Tectonic environment of the Devonian
Gramscatho basin, south Cornwall: framework mode and geochemical evidence from
turbiditic sandstones. Journal of the Geological Society, v. 144, no. 4, p. 531-542.
Folk, R.L., 1955. Student operator error in determination of roundness, sphericity, and
grain size. Journal of Sedimentary Research, v. 25, no. 4, p. 297-301.
Folk, R.L., 1974. Petrology of sedimentary rocks. Texas (Hemphill Publishing Co.). 182
p.
Folk, R.L. and Ward, W.C., 1957. Brazos River bar: a study in the significance of grain-
size parameters. Journal of Sedimentary Research, v. 27, no. 1, p. 3-32.
Fralick, P. W., and Kronberg, B. I. 1997. Geochemical discrimination of clastic
sedimentary rock sources. Sedimentary Geology, v. 113, no. 1, p. 111-124.
73
Gu, X.X., Liu, J.M., Zheng, M.H., Tang, J.X. and Qi, L., 2002. Provenance and tectonic
setting of the Proterozoic turbidites in Hunan, South China: geochemical
evidence. Journal of sedimentary Research, v. 72, no. 3, p. 393-407.
Hofmann, A., Bolhar, R., Dirks, P. and Jelsma, H., 2003. The Geochemistry of Archean
shales derived from a mafic volcanic sequence, Belingwe greenstone belt, Zimbabwe:
Provenance, source area unroofing and submarine versus subaerial weathering. Geochim.
Cosmochim. Acta, v. 67, p. 421-440.
Holail, H.M. and Moghazi, A.K.M., 1998. Provenance, tectonic setting and geochemistry
of greywackes and siltstones of the Late Precambrian Hammamat Group,
Egypt. Sedimentary Geology, v. 116, no. 3, p. 227-250.
Howard, K.A. and John, B.E., 1987. Crustal extension along a rooted system of imbricate
low-angle faults: Colorado River extensional corridor, California and
Arizona. Geological Society, London, Special Publications, v. 28, no. 1, p. 299-311.
Ingersoll, R. V., Bullard, T. F., Ford, R. L., Grimm, J. P., Pickle, J. D., and Sares, S. W.,
1984. The effect of grain size on detrital modes: a test of the Gazzi-Dickinson point-
counting method. Journal of Sedimentary Research, v. 54, no. 1, p. 103-116.
Johnsson, M. J., 1993. The system controlling the composition of clastic
sediments. Geological Society of America Special Papers, v. 284, p. 1-20.
Lawrence, M.G. and Kamber, B.S., 2006. The behaviour of the rare earth elements
during estuarine mixing—revisited. Marine Chemistry, v. 100, no. 1, p. 147-161.
Lee, Y., II., 2002. Provenance derived from the geochemistry of the Palaeozoic-early
Mesozoic mudrocks of the Pyeongan Supergroup, Korea. Sedimentary Geol., v. 149, p.
219- 235
Mahjoor, A.S., Karimi, M. and Rastegarlari, A., 2009. Mineralogical and geochemical
characteristics of clay deposits from South Abarkouh district of clay deposit (Central
Iran) and their applications. Journal of Applied Sciences, v. 9, no. 4, p. 601-614.
McDonald, E. V., McFadden, L. D., and Wells, S. G., 2003. Regional response of alluvial
fans to the Pleistocene-Holocene climatic transition, Mojave Desert, California. Special
papers – Geological Society of America, v. 368, p. 189-206.
McDonough, W.F. and Sun, S.S., 1995. The composition of the Earth. Chemical
geology, v. 120, no. 3, p. 223-253.
McLennan, S. M., 1989. Rare earth elements in sedimentary rocks; influence of
provenance and sedimentary processes. Reviews in Mineralogy and Geochemistry, v. 21,
no. 1, p. 169-200.
74
McLennan, S.M., 2001. Relationships between the trace element composition of
sedimentary rocks and upper continental crust. Geochemistry, Geophysics,
Geosystems, v. 2, doi:10.1029/2000GC000109.
McLennan, S. M. and Taylor, S. R., 1991. Sedimentary rocks and crustal evolution:
tectonic setting and secular trends. The Journal of Geology, v. 99, p. 1-21.
McLennan, S. M., Hemming, S., McDaniel, D. K., and Hanson, G. N., 1993.
Geochemical approaches to sedimentation, provenance, and tectonics. Geological Society
of America Special Papers, v. 284, p. 21-40.
Miller, C.F. and Wooden, J.L., 1994. Anatexis, hybridization and the modification of
ancient crust: Mesozoic plutonism in the Old Woman Mountains area,
California. Lithos, v. 32, no. 1, p. 111-133.
Miyashiro, A., 1974. Volcanic rock series in island arcs and active continental
margins. American Journal of Science, v. 274, no. 4, p. 321-355.
Modi, A. L., 2011. Processes controlling the composition of first-cycle sediments
deposited in an arid-climate, with implications for provenance reconstruction studies.
Moradi, A.V., Sarı, A. and Akkaya, P., 2016. Geochemistry of the Miocene oil shale
(Hançili Formation) in the Çankırı-Çorum Basin, Central Turkey: Implications for
Paleoclimate conditions, source–area weathering, provenance and tectonic
setting. Sedimentary Geology. v. 341, p. 289-303.
Nesbitt, H. W., and Markovics, G., 1980. Chemical processes affecting alkalis and
alkaline earths during continental weathering. Geochimica et Cosmochimica Acta, v. 44,
no. 11, p. 1659-1666.
Nesbitt, H.W. and Markovics, G., 1997. Weathering of granodioritic crust, long-term
storage of elements in weathering profiles, and petrogenesis of siliciclastic
sediments. Geochimica et Cosmochimica Acta, v. 61, no. 8, p. 1653-1670.
Nesbitt, H.W. and Young, G.M., 1982. Early Proterozoic climates and plate motions
inferred from major element chemistry of lutites. Nature, v. 299, no. 5885, p. 715-717.
Nesbitt, H.W. and Young, G.M., 1984. Prediction of some weathering trends of plutonic
and volcanic rocks based on thermodynamic and kinetic considerations. Geochimica et
Cosmochimica Acta, v. 48, no. 7, p. 1523-1534.
Nesbitt, H.W. and Young, G.M., 1989. Formation and diagenesis of weathering
profiles. The Journal of Geology, v. 97, p. 129-147.
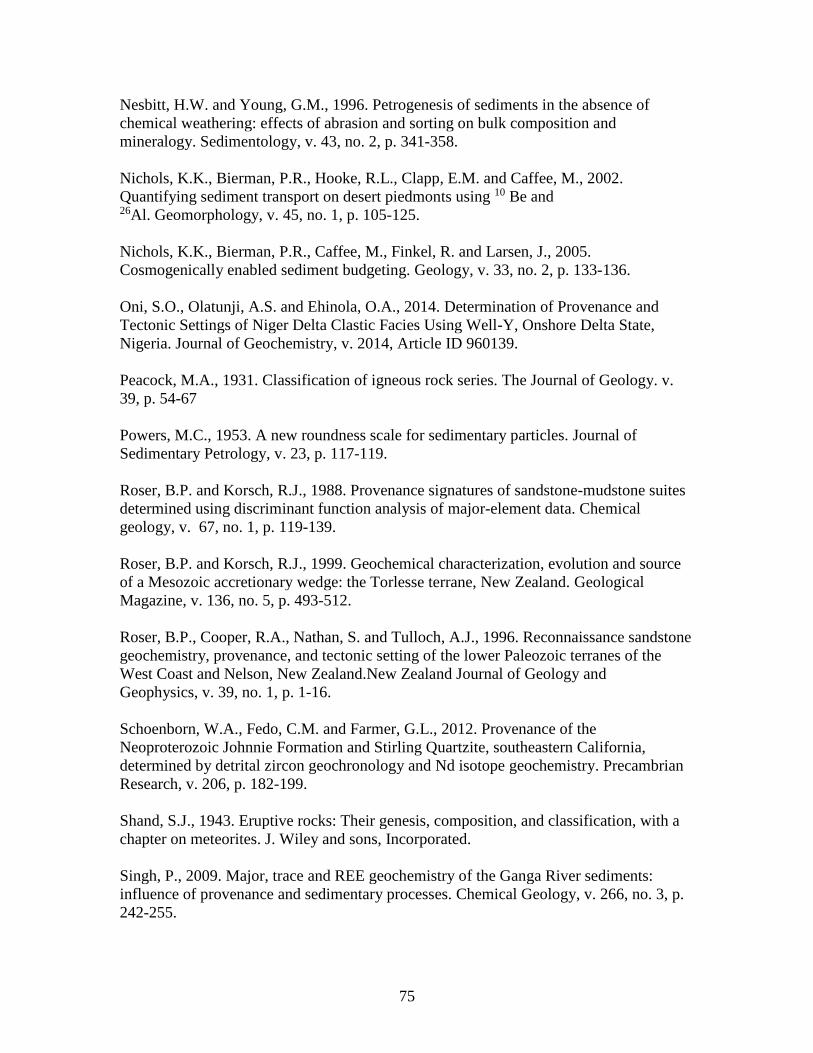
75
Nesbitt, H.W. and Young, G.M., 1996. Petrogenesis of sediments in the absence of
chemical weathering: effects of abrasion and sorting on bulk composition and
mineralogy. Sedimentology, v. 43, no. 2, p. 341-358.
Nichols, K.K., Bierman, P.R., Hooke, R.L., Clapp, E.M. and Caffee, M., 2002.
Quantifying sediment transport on desert piedmonts using 10 Be and 26Al. Geomorphology, v. 45, no. 1, p. 105-125.
Nichols, K.K., Bierman, P.R., Caffee, M., Finkel, R. and Larsen, J., 2005.
Cosmogenically enabled sediment budgeting. Geology, v. 33, no. 2, p. 133-136.
Oni, S.O., Olatunji, A.S. and Ehinola, O.A., 2014. Determination of Provenance and
Tectonic Settings of Niger Delta Clastic Facies Using Well-Y, Onshore Delta State,
Nigeria. Journal of Geochemistry, v. 2014, Article ID 960139.
Peacock, M.A., 1931. Classification of igneous rock series. The Journal of Geology. v.
39, p. 54-67
Powers, M.C., 1953. A new roundness scale for sedimentary particles. Journal of
Sedimentary Petrology, v. 23, p. 117-119.
Roser, B.P. and Korsch, R.J., 1988. Provenance signatures of sandstone-mudstone suites
determined using discriminant function analysis of major-element data. Chemical
geology, v. 67, no. 1, p. 119-139.
Roser, B.P. and Korsch, R.J., 1999. Geochemical characterization, evolution and source
of a Mesozoic accretionary wedge: the Torlesse terrane, New Zealand. Geological
Magazine, v. 136, no. 5, p. 493-512.
Roser, B.P., Cooper, R.A., Nathan, S. and Tulloch, A.J., 1996. Reconnaissance sandstone
geochemistry, provenance, and tectonic setting of the lower Paleozoic terranes of the
West Coast and Nelson, New Zealand.New Zealand Journal of Geology and
Geophysics, v. 39, no. 1, p. 1-16.
Schoenborn, W.A., Fedo, C.M. and Farmer, G.L., 2012. Provenance of the
Neoproterozoic Johnnie Formation and Stirling Quartzite, southeastern California,
determined by detrital zircon geochronology and Nd isotope geochemistry. Precambrian
Research, v. 206, p. 182-199.
Shand, S.J., 1943. Eruptive rocks: Their genesis, composition, and classification, with a
chapter on meteorites. J. Wiley and sons, Incorporated.
Singh, P., 2009. Major, trace and REE geochemistry of the Ganga River sediments:
influence of provenance and sedimentary processes. Chemical Geology, v. 266, no. 3, p.
242-255.
76
Slack, J.F. and Stevens, B.P., 1994. Clastic metasediments of the early Proterozoic
Broken Hill Group, New South Wales, Australia: geochemistry, provenance, and
metallogenic significance. Geochimica et Cosmochimica Acta, v. 58, no. 17, p. 3633-
3652.
Stoffer, P.W., 2004. Desert landforms and surface processes in the Mojave National
Preserve and Vicinity, no. 2004-1007.
Streckeisen, A., 1976. To each plutonic rock its proper name. Earth-science reviews, v.
12, no. 1, p. 1-33.
Suttner, L. J., Basu, A., and Mack, G. H., 1981. Climate and the origin of quartz
arenites. Journal of Sedimentary Research, v. 51, no. 4, p. 1235-1246.
Tang, Y., Sang, L., Yuan, Y., Zhang, Y. and Yang, Y., 2012. Geochemistry of Late
Triassic pelitic rocks in the NE part of Songpan-Ganzi Basin, western China:
Implications for source weathering, provenance and tectonic setting. Geoscience
Frontiers, v. 3, no. 5, p. 647-660.
Taylor, S. R., and McLennan, S. M., 1985. The continental crust: its composition and
evolution. Blackwell, Oxford, p. 312.
Thomas, W.M., Clark, H.S., Young, E.D., Orrell, S.E. and Anderson, J.L., 1988.
Proterozoic high-grade metamorphism in the Colorado River region, Nevada, Arizona,
and California. Metamorphism and crustal evolution of the western United States,
Rubey, v. 7, p. 526-537.
Trail, D., Watson, E.B. and Tailby, N.D., 2012. Ce and Eu anomalies in zircon as proxies
for the oxidation state of magmas. Geochimica et Cosmochimica Acta, v. 97, p.70-87.
Wendt, C.J., and Thomas, S.W., 1990. Placer sampling and reserve estimation, in
Kennedy, B.A., ed., Surface mining (2d ed.): Littleton, Colo., Society for Mining,
Metallurgy, and Exploration, Inc., p. 1194.
Wentworth, C.K., 1922. A scale of grade and class terms for clastic sediments. The
Journal of Geology, v. 30, no. 5, p.377-392.
Wooden, J.L. and Miller, D.M., 1990. Chronologic and isotopic framework for Early
Proterozoic crustal evolution in the eastern Mojave Desert region, SE California. Journal
of Geophysical Research: Solid Earth, v. 95, no. B12, p. 20133-20146.
Wronkiewicz, D.J. and Condie, K.C., 1987. Geochemistry of Archean shales from the
Witwatersrand Supergroup, South Africa: source-area weathering and
provenance. Geochimica et Cosmochimica Acta, v. 51, no. 9, p. 2401-2416.
77
Xiang, Z., Yan, Q., White, J.D., Song, B. and Wang, Z., 2015. Geochemical constraints
on the provenance and depositional setting of Neoproterozoic volcaniclastic rocks on the
northern margin of the Yangtze Block, China: implications for the tectonic evolution of
the northern margin of the Yangtze Block. Precambrian Research, v. 264, p. 140-155.
Young, G. M., and Nesbitt, H. W., 1998. Processes controlling the distribution of Ti and
Al in weathering profiles, siliciclastic sediments and sedimentary rocks. Journal of
Sedimentary Research, v. 68, no. 3, p. 448-455.
Zimmermann, U. and Bahlburg, H., 2003. Provenance analysis and tectonic setting of the
Ordovician clastic deposits in the southern Puna Basin, NW
Argentina. Sedimentology, v. 50, no. 6, p. 1079-1104.

78
APPENDICES

79
Appendix A
Sample Images
80
Figure A 1. Photomicrographs of Stepladder bedrock.
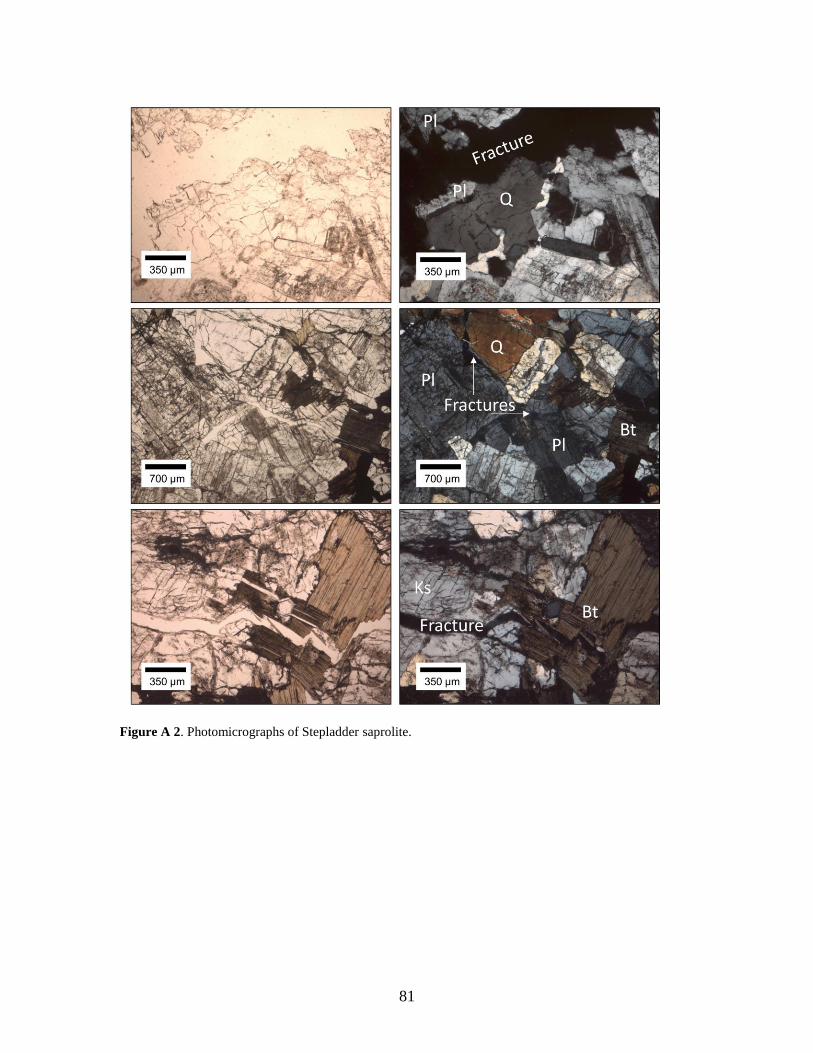
81
Figure A 2. Photomicrographs of Stepladder saprolite.
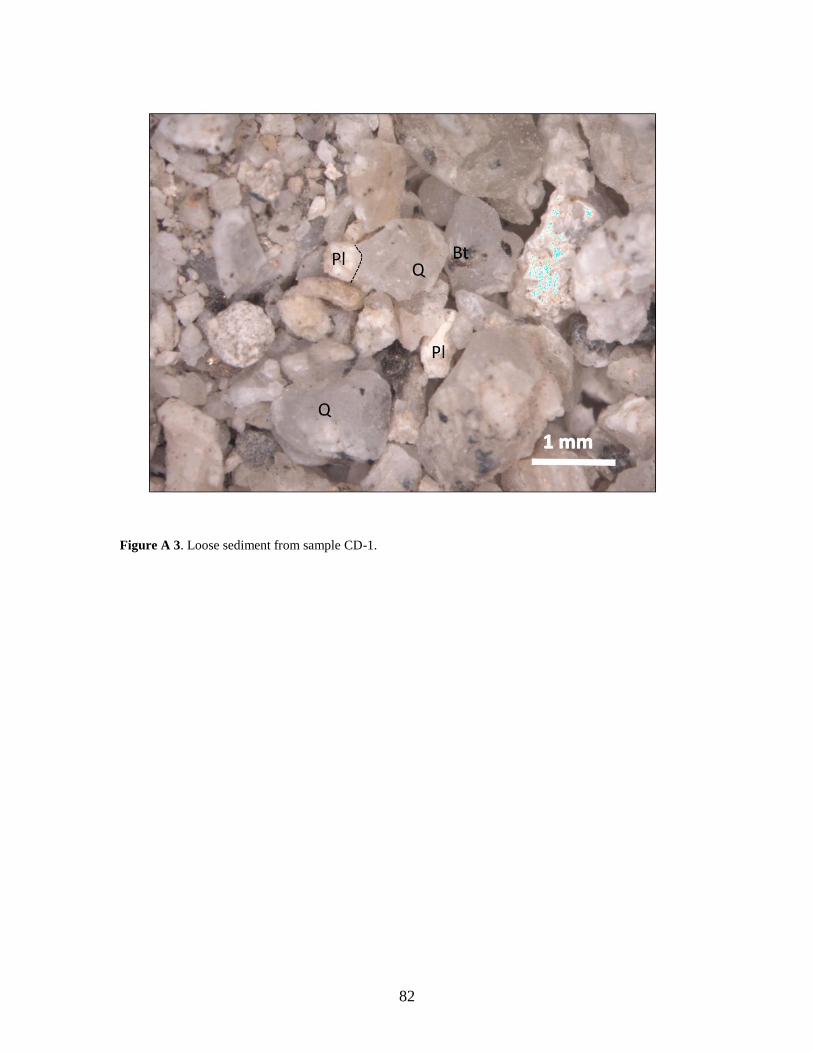
82
Figure A 3. Loose sediment from sample CD-1.
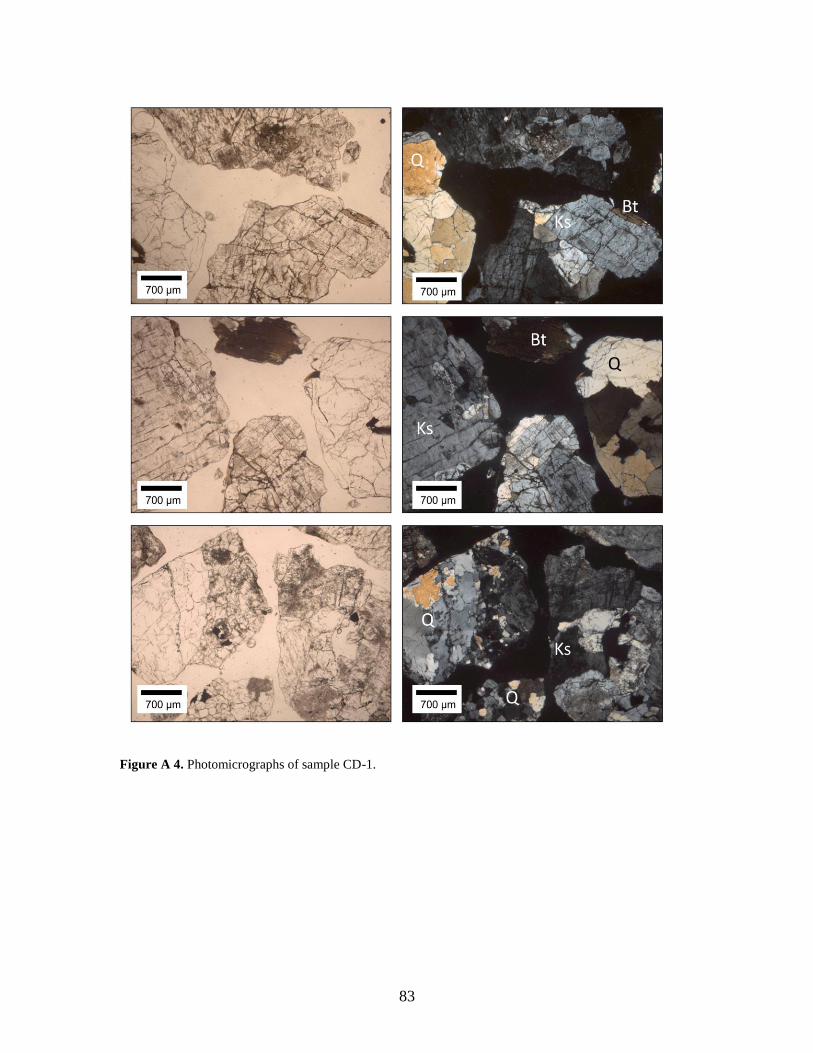
83
Figure A 4. Photomicrographs of sample CD-1.
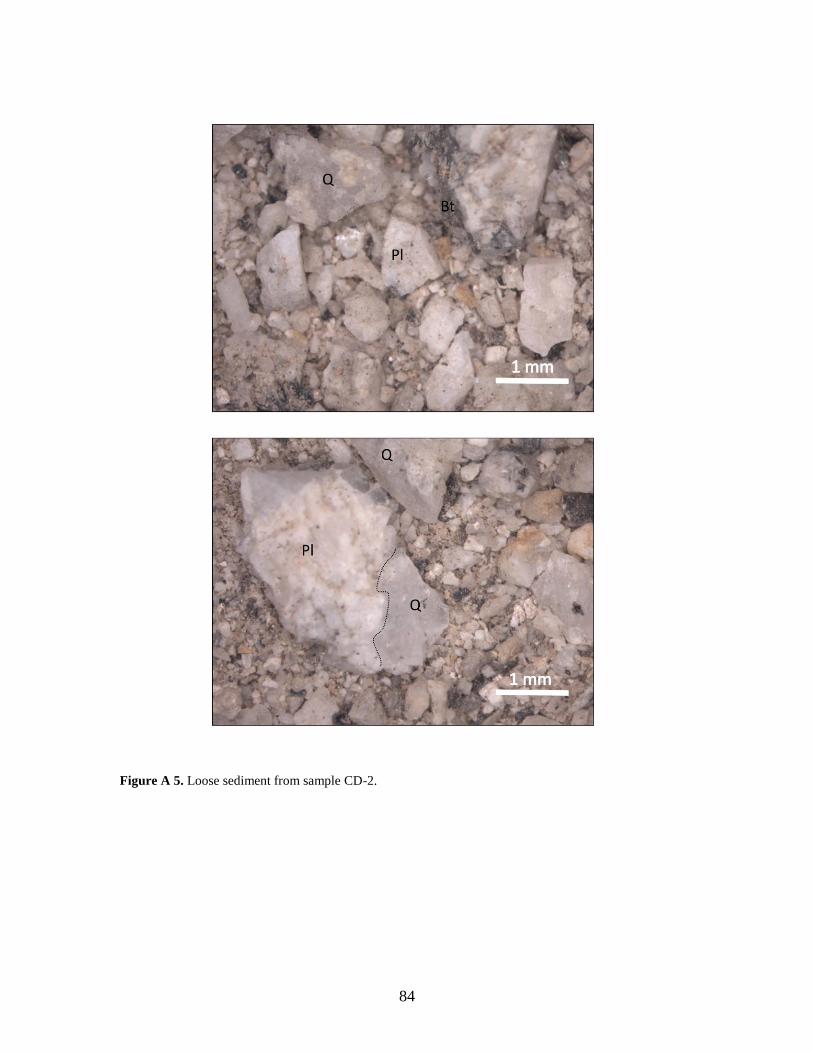
84
Figure A 5. Loose sediment from sample CD-2.
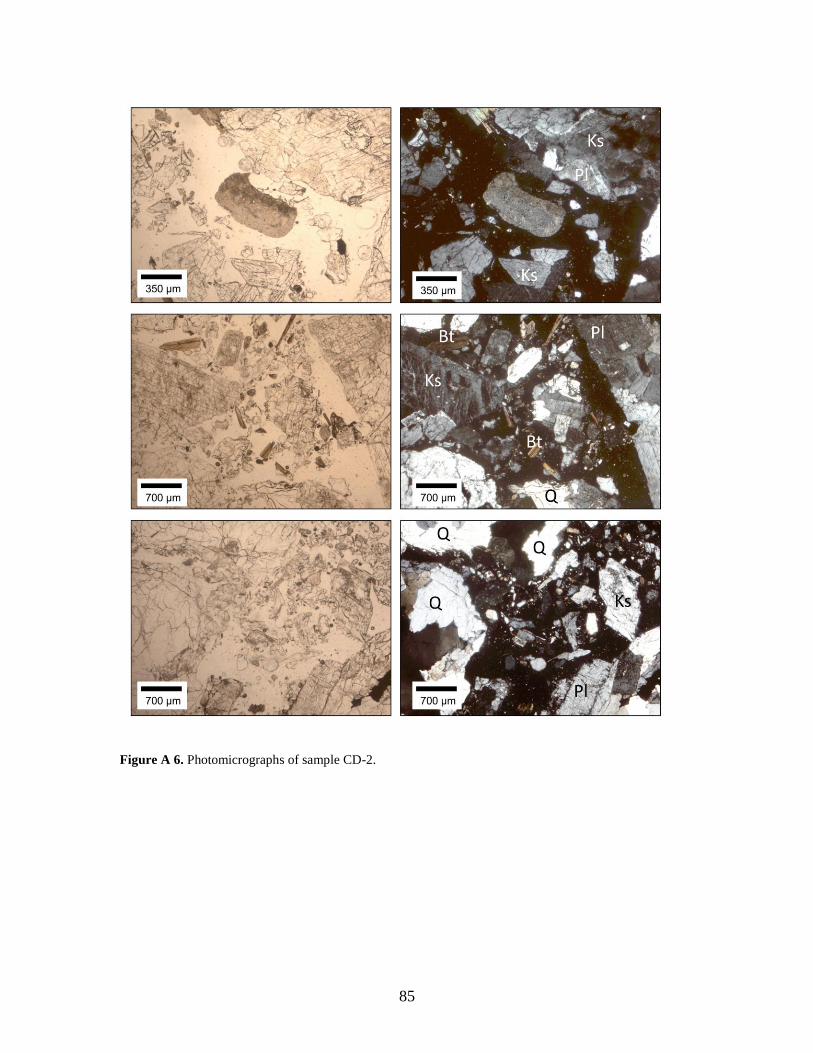
85
Figure A 6. Photomicrographs of sample CD-2.
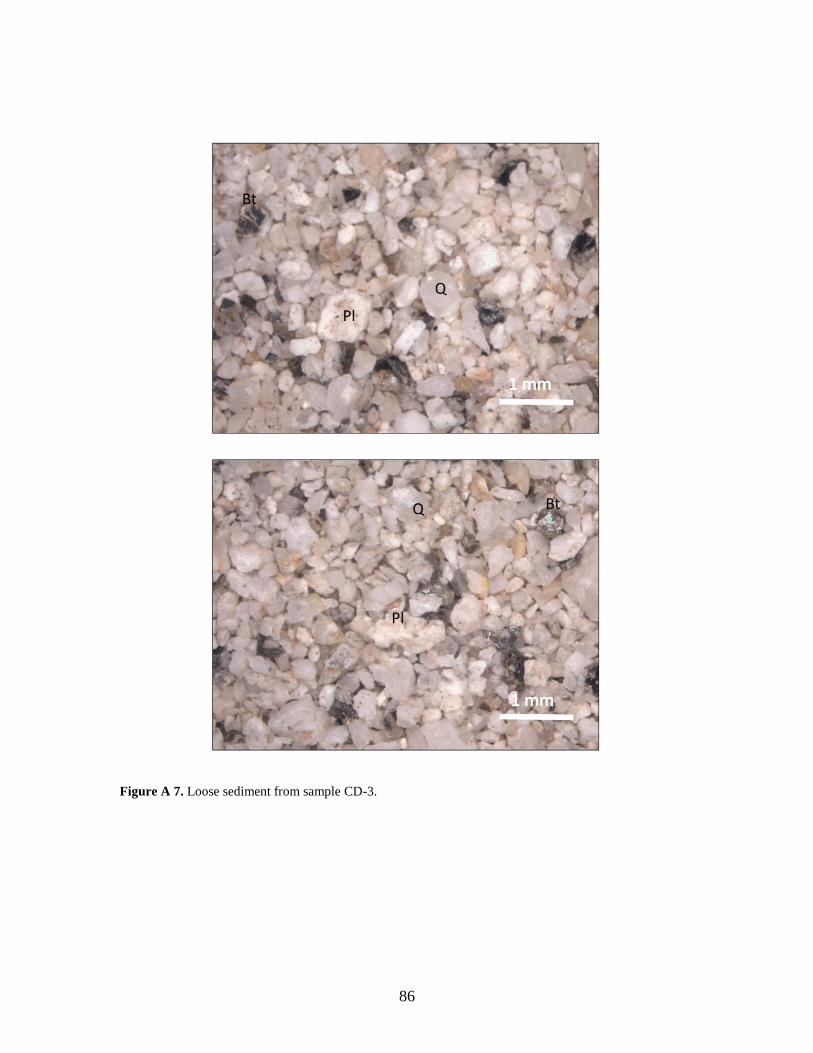
86
Figure A 7. Loose sediment from sample CD-3.
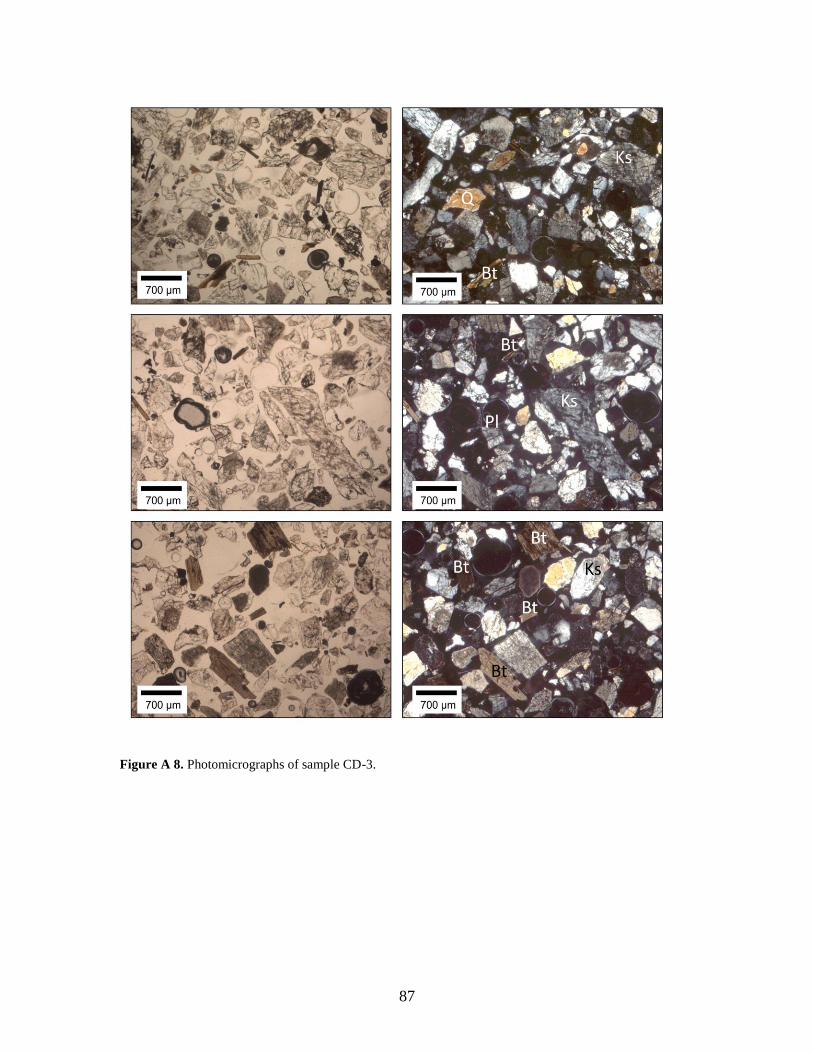
87
Figure A 8. Photomicrographs of sample CD-3.
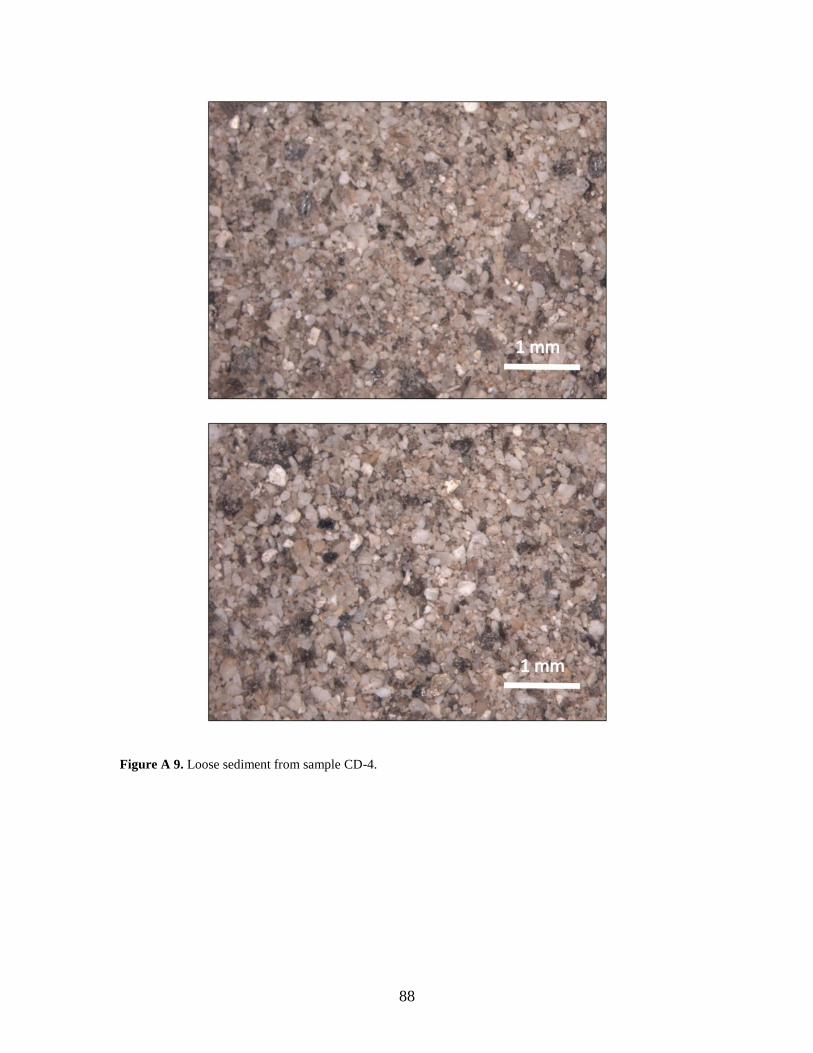
88
Figure A 9. Loose sediment from sample CD-4.
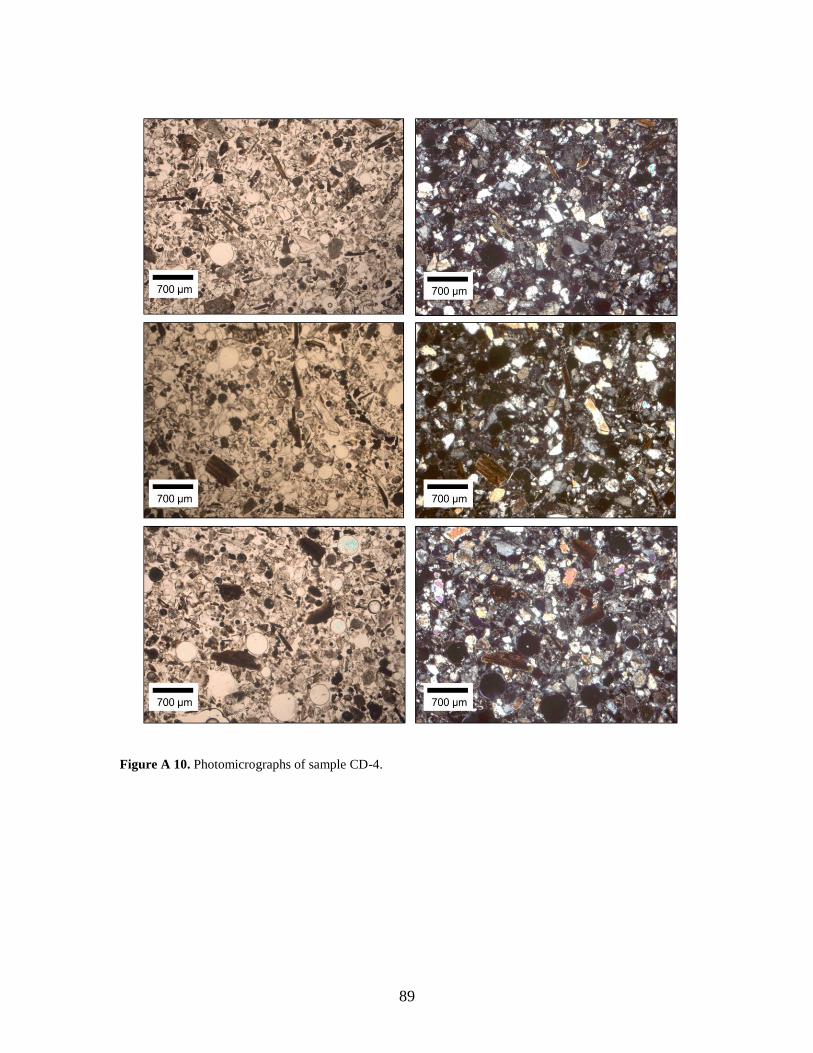
89
Figure A 10. Photomicrographs of sample CD-4.
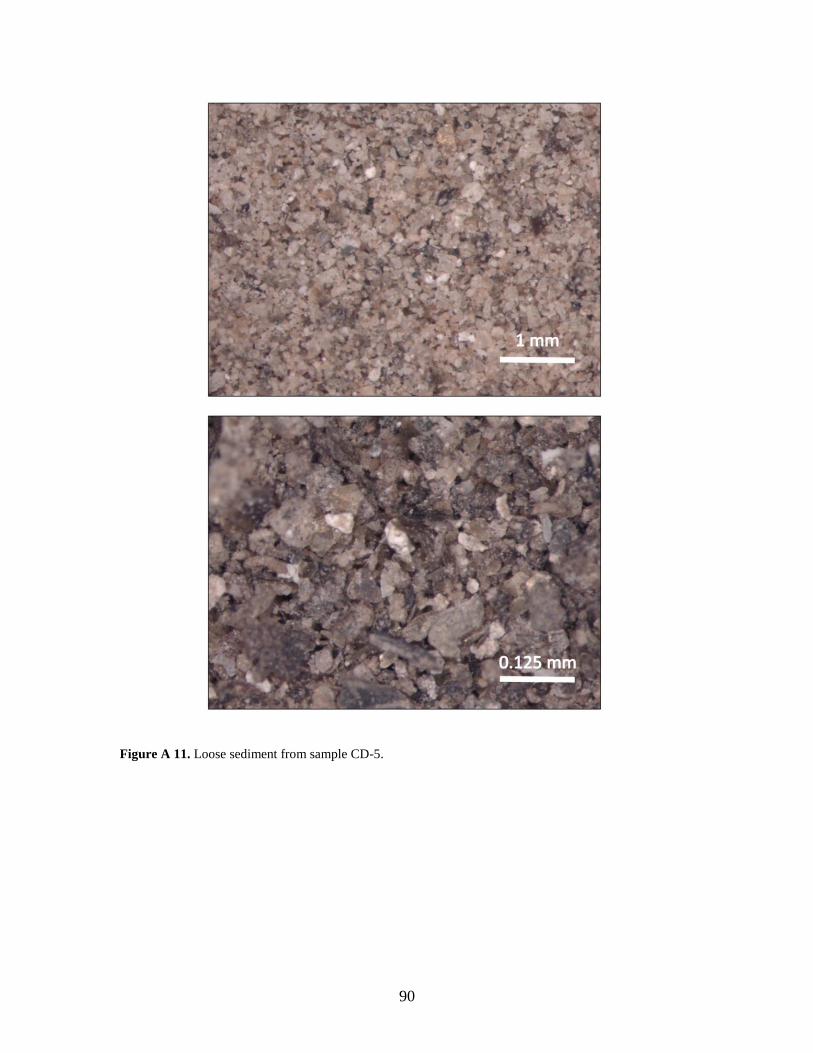
90
Figure A 11. Loose sediment from sample CD-5.
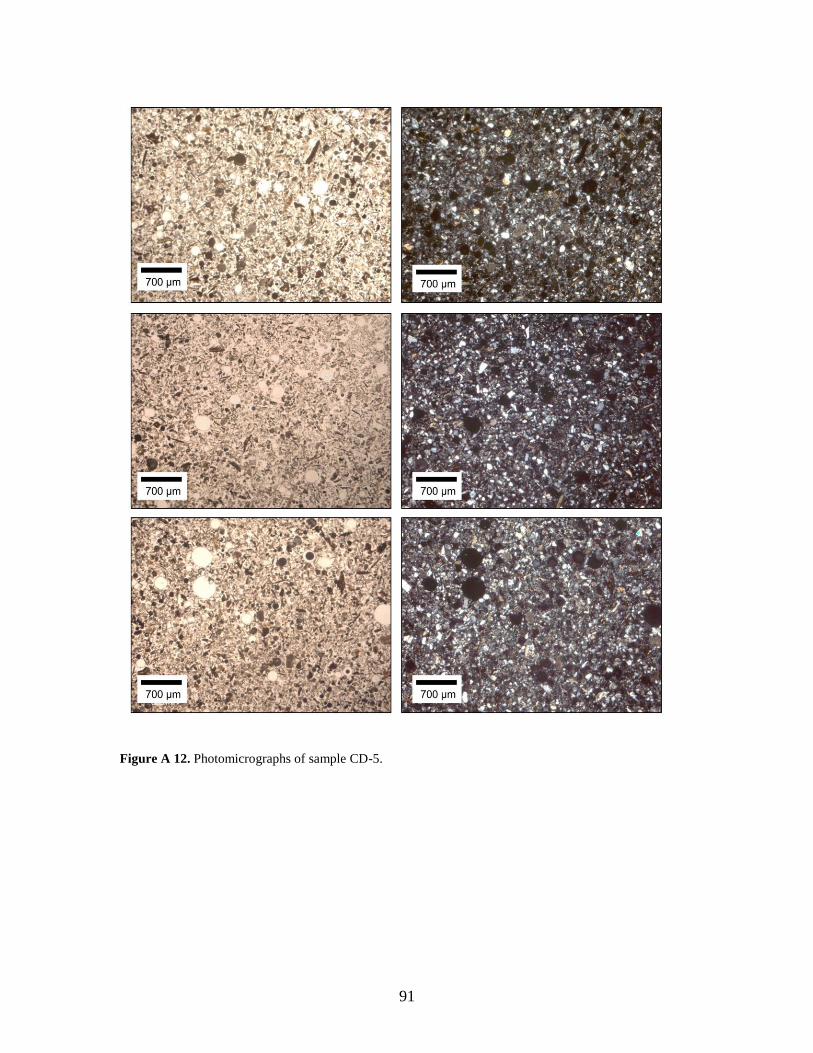
91
Figure A 12. Photomicrographs of sample CD-5.
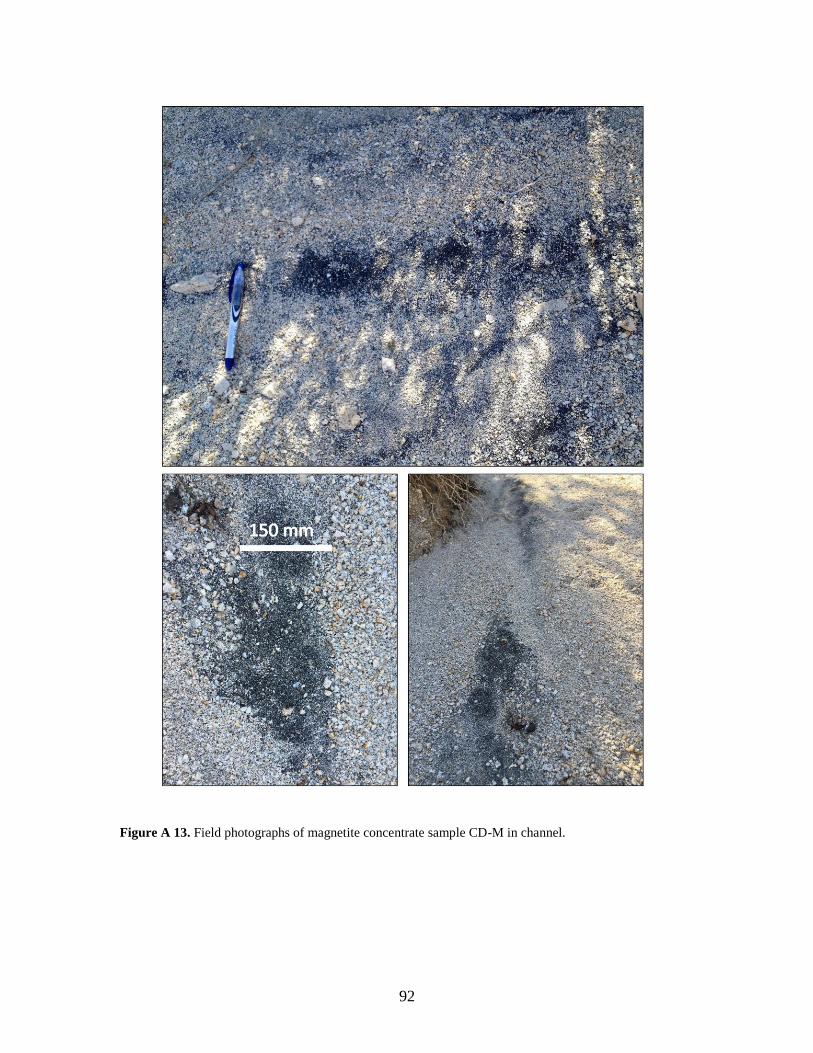
92
Figure A 13. Field photographs of magnetite concentrate sample CD-M in channel.

93
Figure A 14. Loose sediment from sample CD-M.

94
Appendix B
Joint Measurements
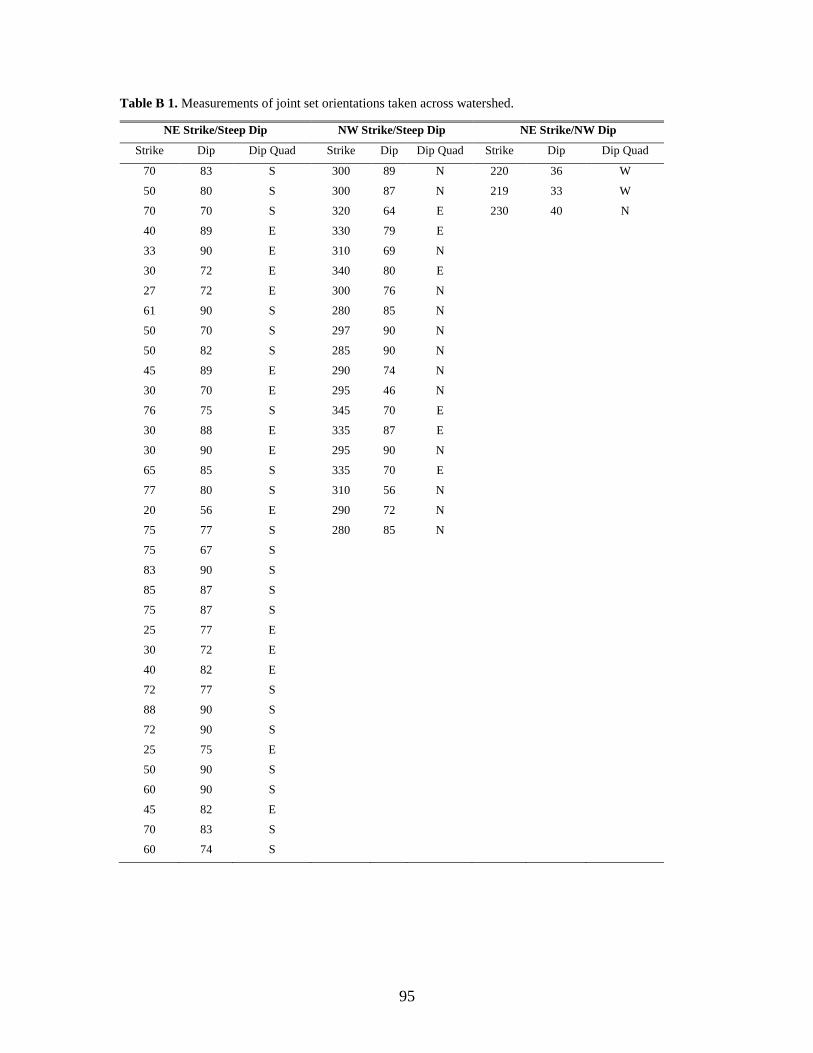
95
Table B 1. Measurements of joint set orientations taken across watershed.
NE Strike/Steep Dip NW Strike/Steep Dip NE Strike/NW Dip
Strike Dip Dip Quad Strike Dip Dip Quad Strike Dip Dip Quad
70 83 S 300 89 N 220 36 W
50 80 S 300 87 N 219 33 W
70 70 S 320 64 E 230 40 N
40 89 E 330 79 E
33 90 E 310 69 N
30 72 E 340 80 E
27 72 E 300 76 N
61 90 S 280 85 N
50 70 S 297 90 N
50 82 S 285 90 N
45 89 E 290 74 N
30 70 E 295 46 N
76 75 S 345 70 E
30 88 E 335 87 E
30 90 E 295 90 N
65 85 S 335 70 E
77 80 S 310 56 N
20 56 E 290 72 N
75 77 S 280 85 N
75 67 S
83 90 S
85 87 S
75 87 S
25 77 E
30 72 E
40 82 E
72 77 S
88 90 S
72 90 S
25 75 E
50 90 S
60 90 S
45 82 E
70 83 S
60 74 S

96
Appendix C
Sieving Data
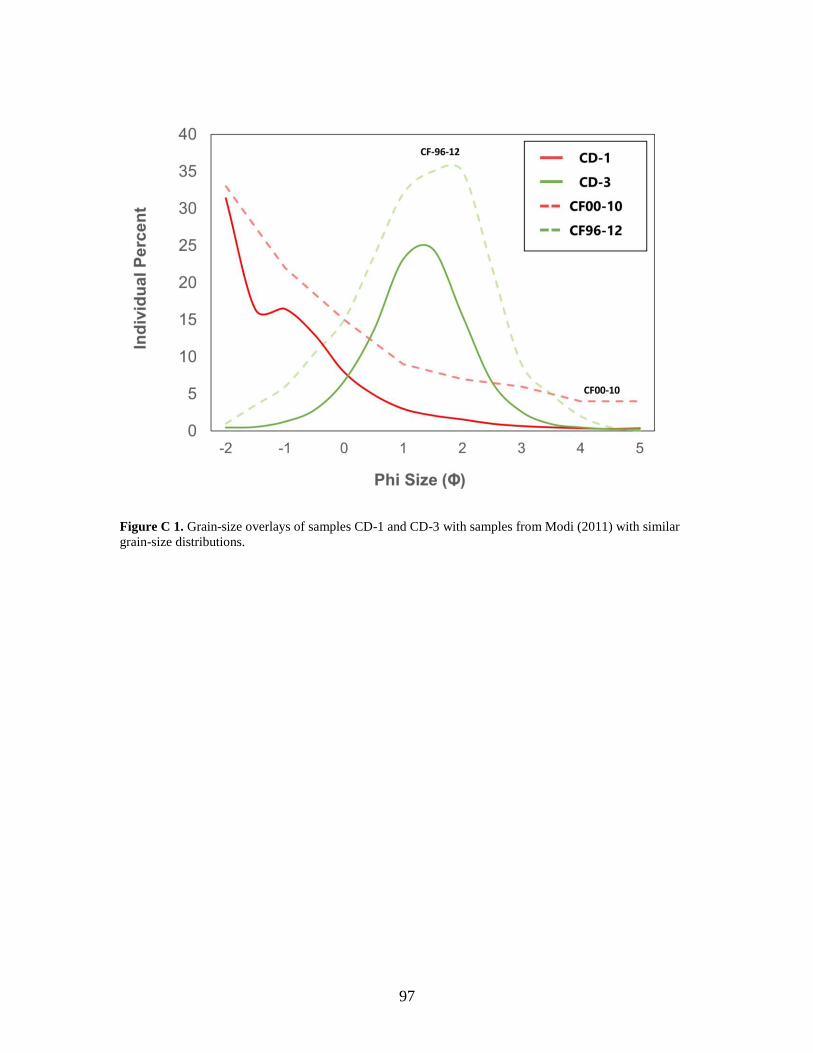
97
Figure C 1. Grain-size overlays of samples CD-1 and CD-3 with samples from Modi (2011) with similar
grain-size distributions.
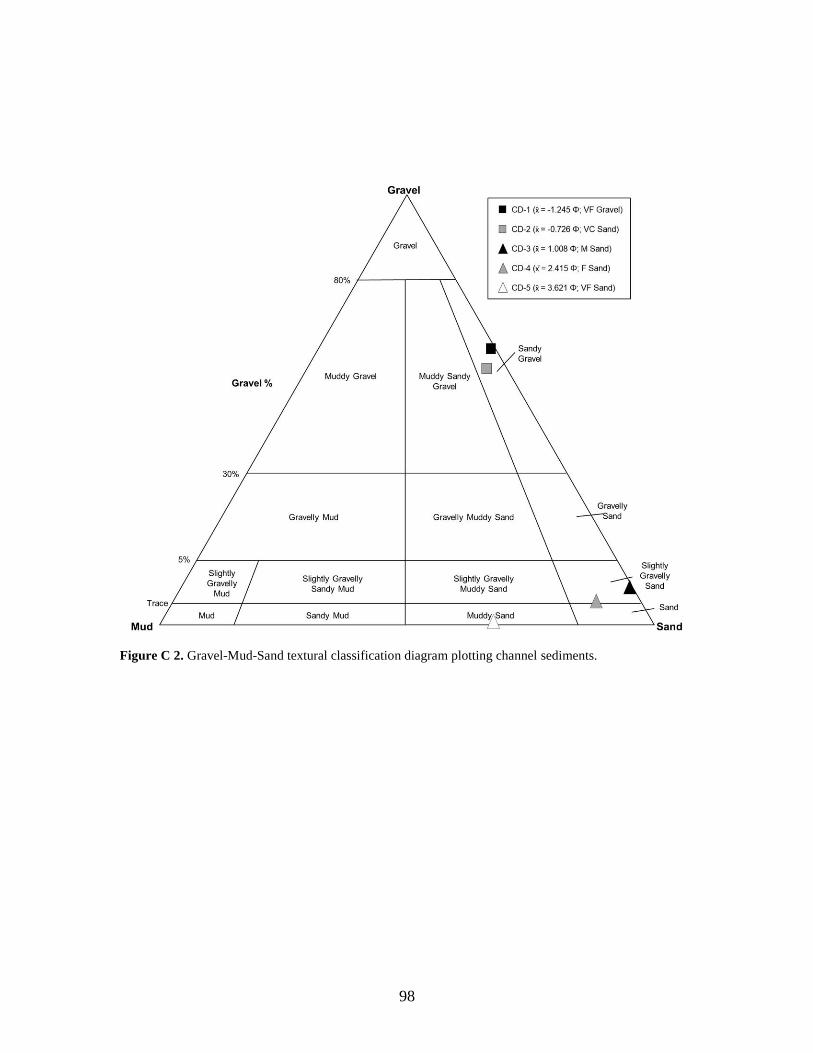
98
Figure C 2. Gravel-Mud-Sand textural classification diagram plotting channel sediments.
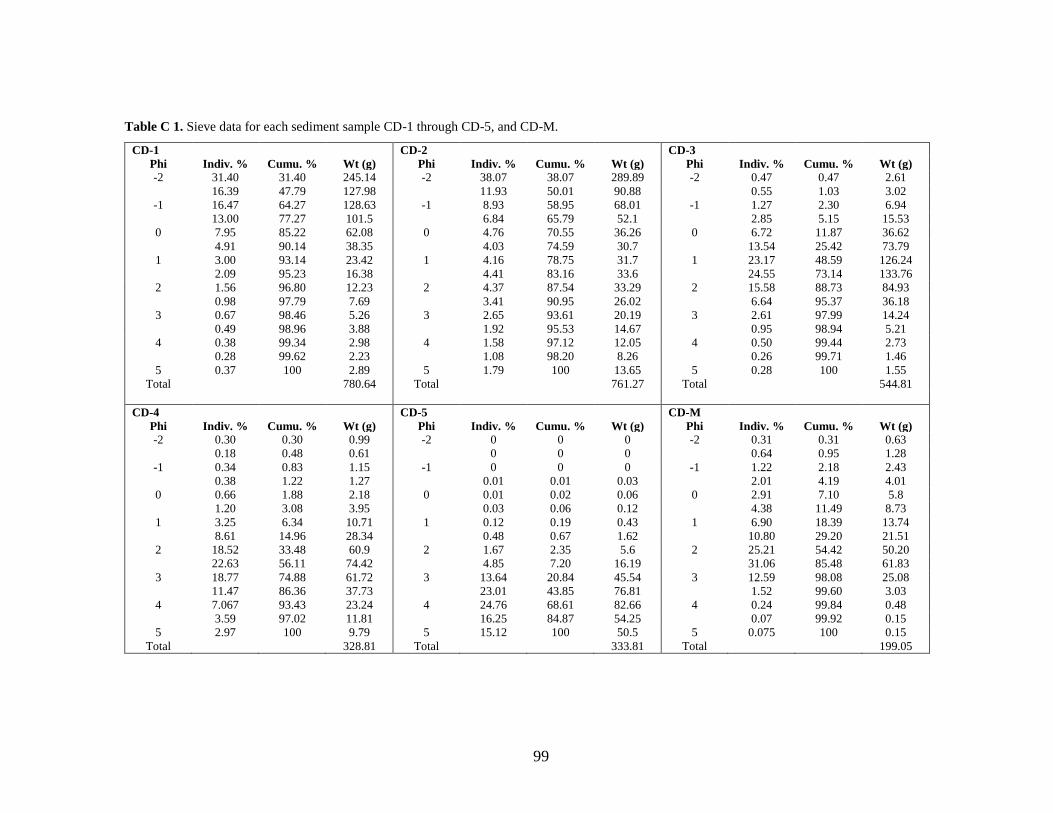
99
Table C 1. Sieve data for each sediment sample CD-1 through CD-5, and CD-M.
CD-1 CD-2 CD-3
Phi Indiv. % Cumu. % Wt (g) Phi Indiv. % Cumu. % Wt (g) Phi Indiv. % Cumu. % Wt (g)
-2 31.40 31.40 245.14 -2 38.07 38.07 289.89 -2 0.47 0.47 2.61
16.39 47.79 127.98 11.93 50.01 90.88 0.55 1.03 3.02
-1 16.47 64.27 128.63 -1 8.93 58.95 68.01 -1 1.27 2.30 6.94
13.00 77.27 101.5 6.84 65.79 52.1 2.85 5.15 15.53
0 7.95 85.22 62.08 0 4.76 70.55 36.26 0 6.72 11.87 36.62
4.91 90.14 38.35 4.03 74.59 30.7 13.54 25.42 73.79
1 3.00 93.14 23.42 1 4.16 78.75 31.7 1 23.17 48.59 126.24
2.09 95.23 16.38 4.41 83.16 33.6 24.55 73.14 133.76
2 1.56 96.80 12.23 2 4.37 87.54 33.29 2 15.58 88.73 84.93
0.98 97.79 7.69 3.41 90.95 26.02 6.64 95.37 36.18
3 0.67 98.46 5.26 3 2.65 93.61 20.19 3 2.61 97.99 14.24
0.49 98.96 3.88 1.92 95.53 14.67 0.95 98.94 5.21
4 0.38 99.34 2.98 4 1.58 97.12 12.05 4 0.50 99.44 2.73
0.28 99.62 2.23 1.08 98.20 8.26 0.26 99.71 1.46
5 0.37 100 2.89 5 1.79 100 13.65 5 0.28 100 1.55
Total 780.64 Total 761.27 Total 544.81
CD-4 CD-5 CD-M
Phi Indiv. % Cumu. % Wt (g) Phi Indiv. % Cumu. % Wt (g) Phi Indiv. % Cumu. % Wt (g)
-2 0.30 0.30 0.99 -2 0 0 0 -2 0.31 0.31 0.63
0.18 0.48 0.61 0 0 0 0.64 0.95 1.28
-1 0.34 0.83 1.15 -1 0 0 0 -1 1.22 2.18 2.43
0.38 1.22 1.27 0.01 0.01 0.03 2.01 4.19 4.01
0 0.66 1.88 2.18 0 0.01 0.02 0.06 0 2.91 7.10 5.8
1.20 3.08 3.95 0.03 0.06 0.12 4.38 11.49 8.73
1 3.25 6.34 10.71 1 0.12 0.19 0.43 1 6.90 18.39 13.74
8.61 14.96 28.34 0.48 0.67 1.62 10.80 29.20 21.51
2 18.52 33.48 60.9 2 1.67 2.35 5.6 2 25.21 54.42 50.20
22.63 56.11 74.42 4.85 7.20 16.19 31.06 85.48 61.83
3 18.77 74.88 61.72 3 13.64 20.84 45.54 3 12.59 98.08 25.08
11.47 86.36 37.73 23.01 43.85 76.81 1.52 99.60 3.03
4 7.067 93.43 23.24 4 24.76 68.61 82.66 4 0.24 99.84 0.48
3.59 97.02 11.81 16.25 84.87 54.25 0.07 99.92 0.15
5 2.97 100 9.79 5 15.12 100 50.5 5 0.075 100 0.15
Total 328.81 Total 333.81 Total 199.05
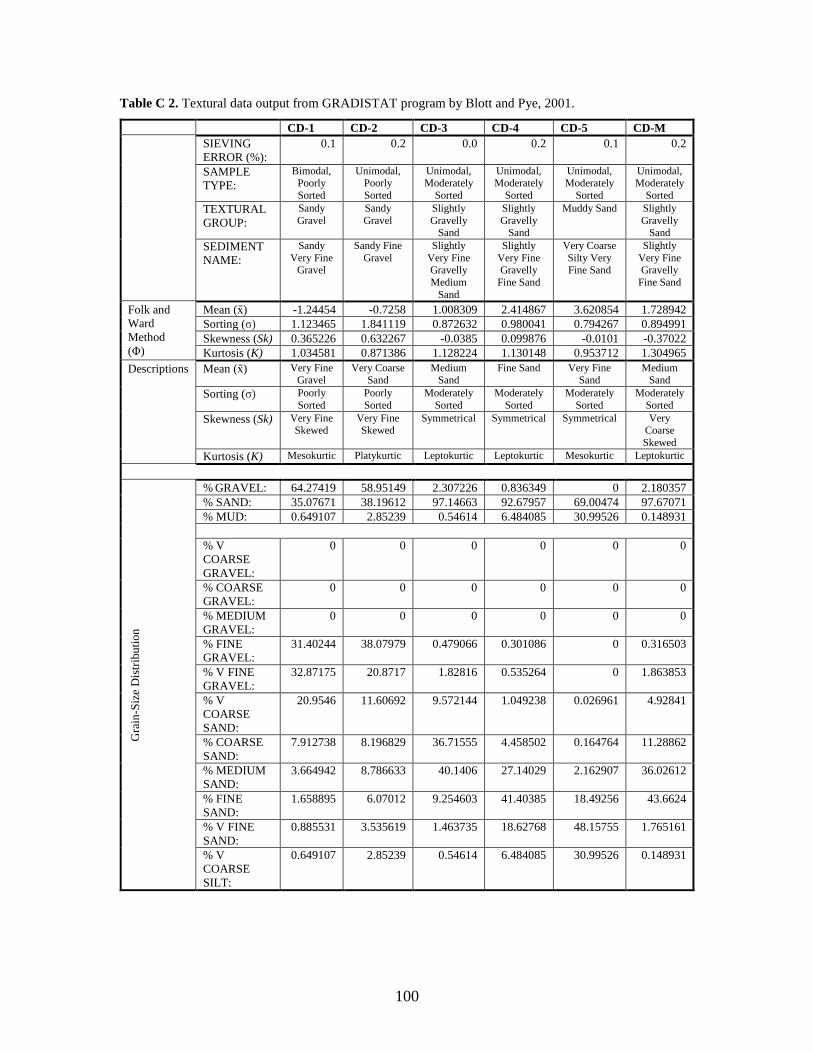
100
Table C 2. Textural data output from GRADISTAT program by Blott and Pye, 2001.
CD-1 CD-2 CD-3 CD-4 CD-5 CD-M
SIEVING
ERROR (%):
0.1 0.2 0.0 0.2 0.1 0.2
SAMPLE
TYPE:
Bimodal, Poorly
Sorted
Unimodal, Poorly
Sorted
Unimodal, Moderately
Sorted
Unimodal, Moderately
Sorted
Unimodal, Moderately
Sorted
Unimodal, Moderately
Sorted
TEXTURAL
GROUP:
Sandy
Gravel
Sandy
Gravel
Slightly
Gravelly Sand
Slightly
Gravelly Sand
Muddy Sand Slightly
Gravelly Sand
SEDIMENT
NAME:
Sandy
Very Fine Gravel
Sandy Fine
Gravel
Slightly
Very Fine Gravelly
Medium
Sand
Slightly
Very Fine Gravelly
Fine Sand
Very Coarse
Silty Very Fine Sand
Slightly
Very Fine Gravelly
Fine Sand
Folk and
Ward
Method
(Φ)
Mean (x̄) -1.24454 -0.7258 1.008309 2.414867 3.620854 1.728942
Sorting (σ) 1.123465 1.841119 0.872632 0.980041 0.794267 0.894991
Skewness (Sk) 0.365226 0.632267 -0.0385 0.099876 -0.0101 -0.37022
Kurtosis (K) 1.034581 0.871386 1.128224 1.130148 0.953712 1.304965
Descriptions Mean (x̄) Very Fine Gravel
Very Coarse Sand
Medium Sand
Fine Sand Very Fine Sand
Medium Sand
Sorting (σ) Poorly
Sorted
Poorly
Sorted
Moderately
Sorted
Moderately
Sorted
Moderately
Sorted
Moderately
Sorted
Skewness (Sk) Very Fine Skewed
Very Fine Skewed
Symmetrical Symmetrical Symmetrical Very Coarse
Skewed
Kurtosis (K) Mesokurtic Platykurtic Leptokurtic Leptokurtic Mesokurtic Leptokurtic
Gra
in-S
ize
Dis
trib
uti
on
% GRAVEL: 64.27419 58.95149 2.307226 0.836349 0 2.180357
% SAND: 35.07671 38.19612 97.14663 92.67957 69.00474 97.67071
% MUD: 0.649107 2.85239 0.54614 6.484085 30.99526 0.148931
% V
COARSE
GRAVEL:
0 0 0 0 0 0
% COARSE
GRAVEL:
0 0 0 0 0 0
% MEDIUM
GRAVEL:
0 0 0 0 0 0
% FINE
GRAVEL:
31.40244 38.07979 0.479066 0.301086 0 0.316503
% V FINE
GRAVEL:
32.87175 20.8717 1.82816 0.535264 0 1.863853
% V
COARSE
SAND:
20.9546 11.60692 9.572144 1.049238 0.026961 4.92841
% COARSE
SAND:
7.912738 8.196829 36.71555 4.458502 0.164764 11.28862
% MEDIUM
SAND:
3.664942 8.786633 40.1406 27.14029 2.162907 36.02612
% FINE
SAND:
1.658895 6.07012 9.254603 41.40385 18.49256 43.6624
% V FINE
SAND:
0.885531 3.535619 1.463735 18.62768 48.15755 1.765161
% V
COARSE
SILT:
0.649107 2.85239 0.54614 6.484085 30.99526 0.148931

101
Appendix D
Petrographic and Geochemical Figures/Tables
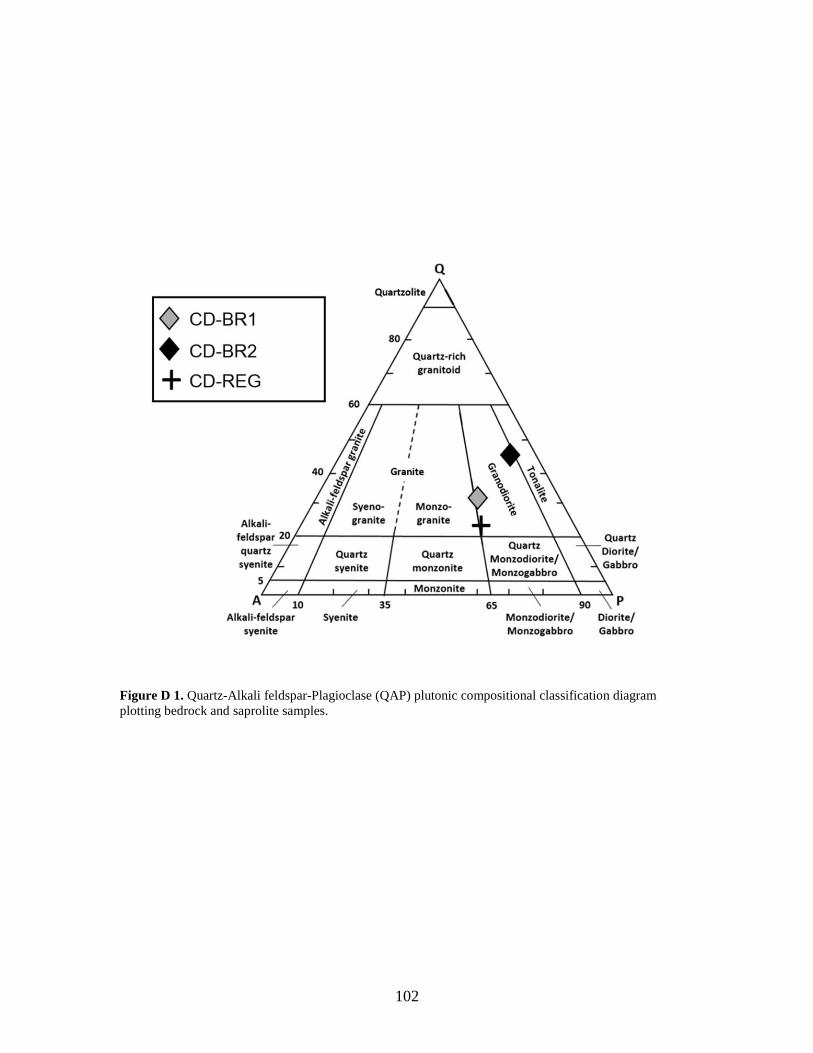
102
Figure D 1. Quartz-Alkali feldspar-Plagioclase (QAP) plutonic compositional classification diagram
plotting bedrock and saprolite samples.
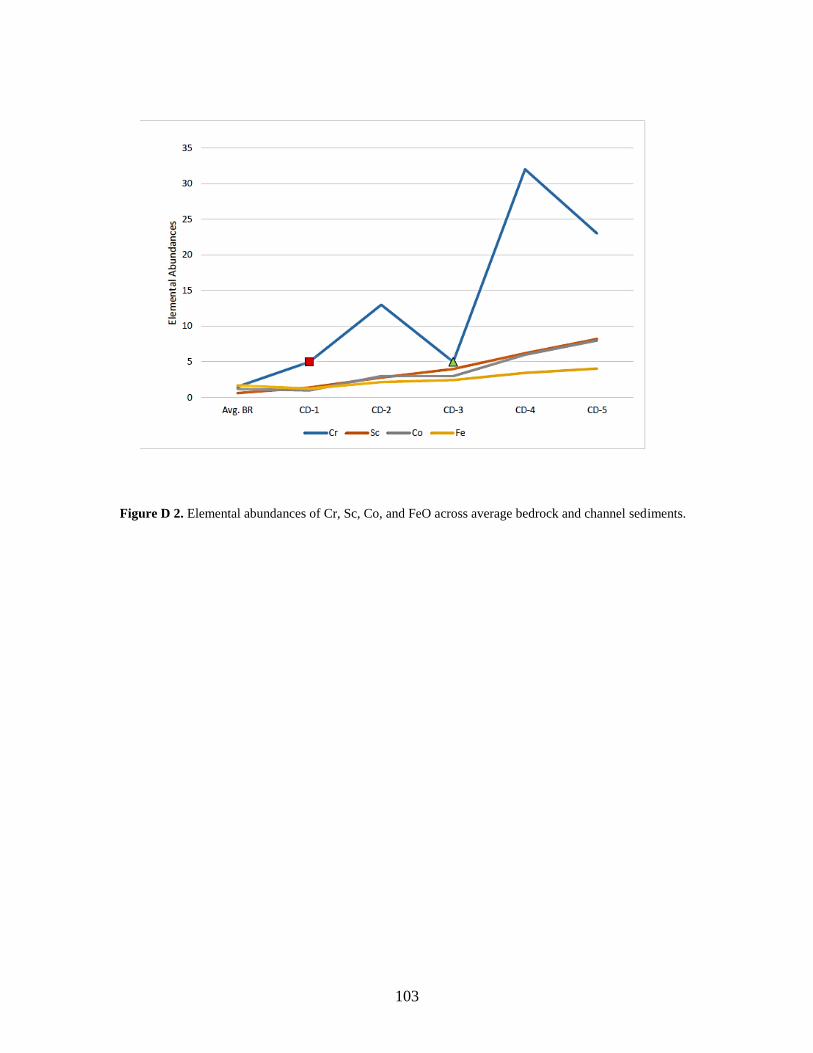
103
Figure D 2. Elemental abundances of Cr, Sc, Co, and FeO across average bedrock and channel sediments.
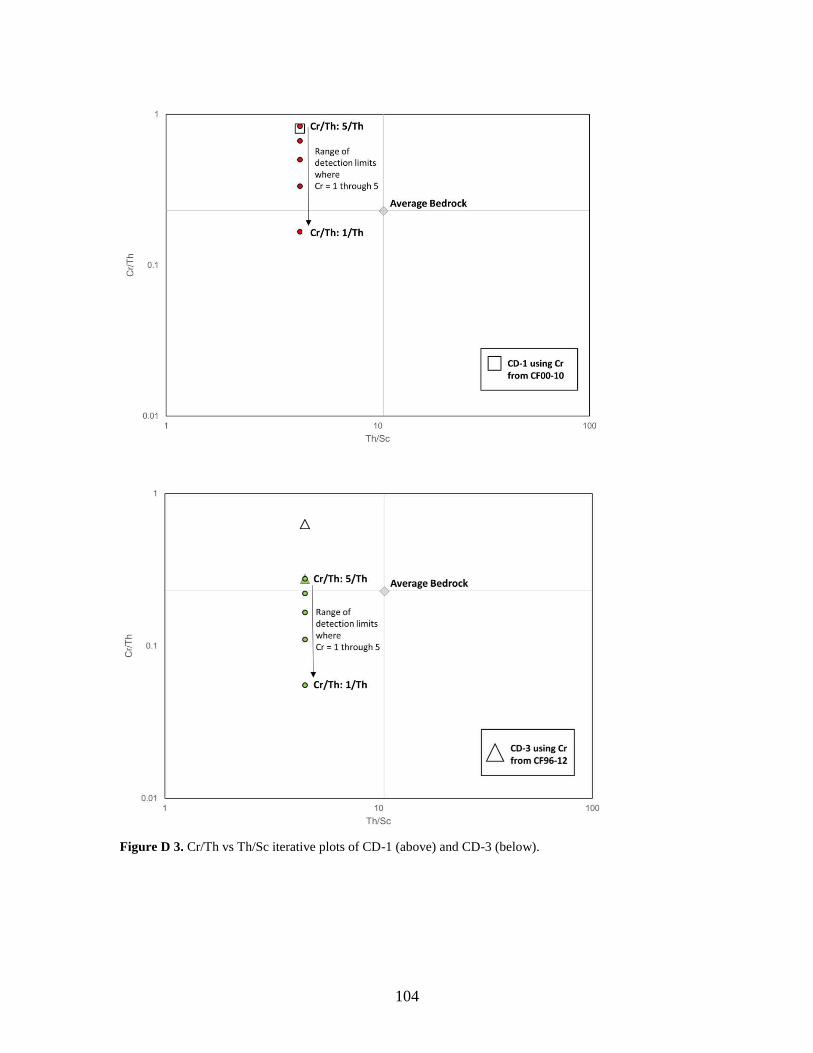
104
Figure D 3. Cr/Th vs Th/Sc iterative plots of CD-1 (above) and CD-3 (below).
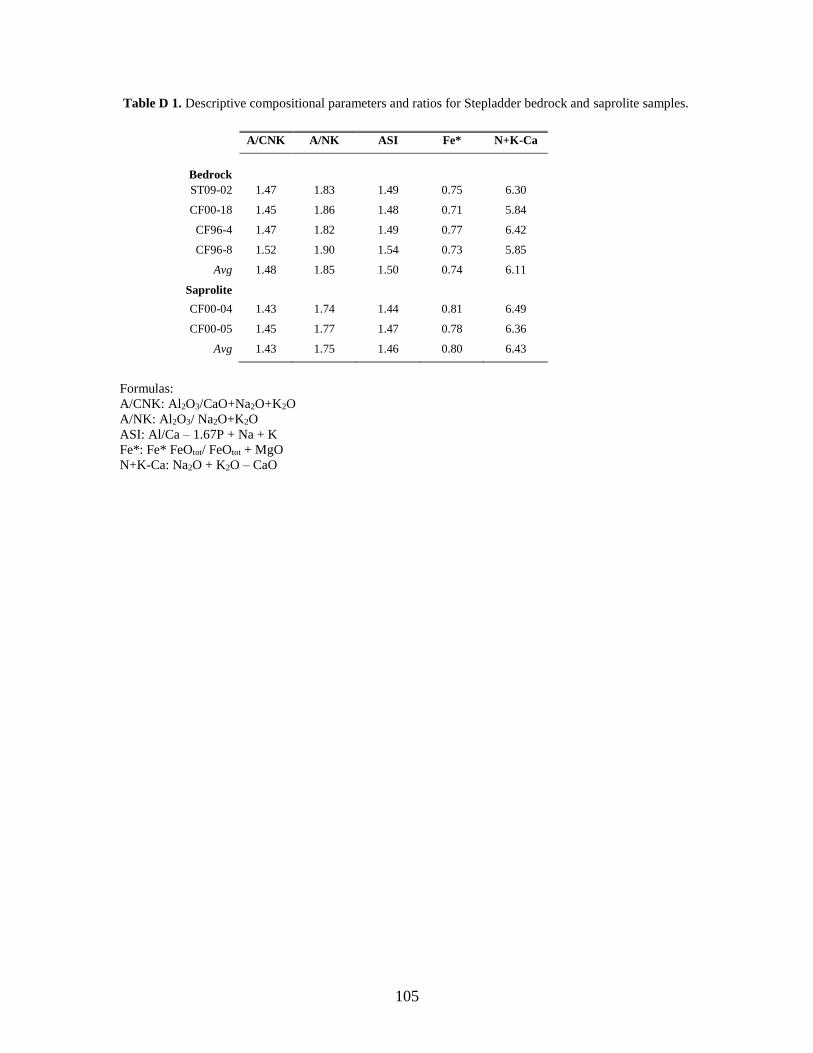
105
Table D 1. Descriptive compositional parameters and ratios for Stepladder bedrock and saprolite samples.
A/CNK A/NK ASI Fe* N+K-Ca
Bedrock
ST09-02 1.47 1.83 1.49 0.75 6.30
CF00-18 1.45 1.86 1.48 0.71 5.84
CF96-4 1.47 1.82 1.49 0.77 6.42
CF96-8 1.52 1.90 1.54 0.73 5.85
Avg 1.48 1.85 1.50 0.74 6.11
Saprolite
CF00-04 1.43 1.74 1.44 0.81 6.49
CF00-05 1.45 1.77 1.47 0.78 6.36
Avg 1.43 1.75 1.46 0.80 6.43
Formulas:
A/CNK: Al2O3/CaO+Na2O+K2O
A/NK: Al2O3/ Na2O+K2O
ASI: Al/Ca – 1.67P + Na + K
Fe*: Fe* FeOtot/ FeOtot + MgO
N+K-Ca: Na2O + K2O – CaO
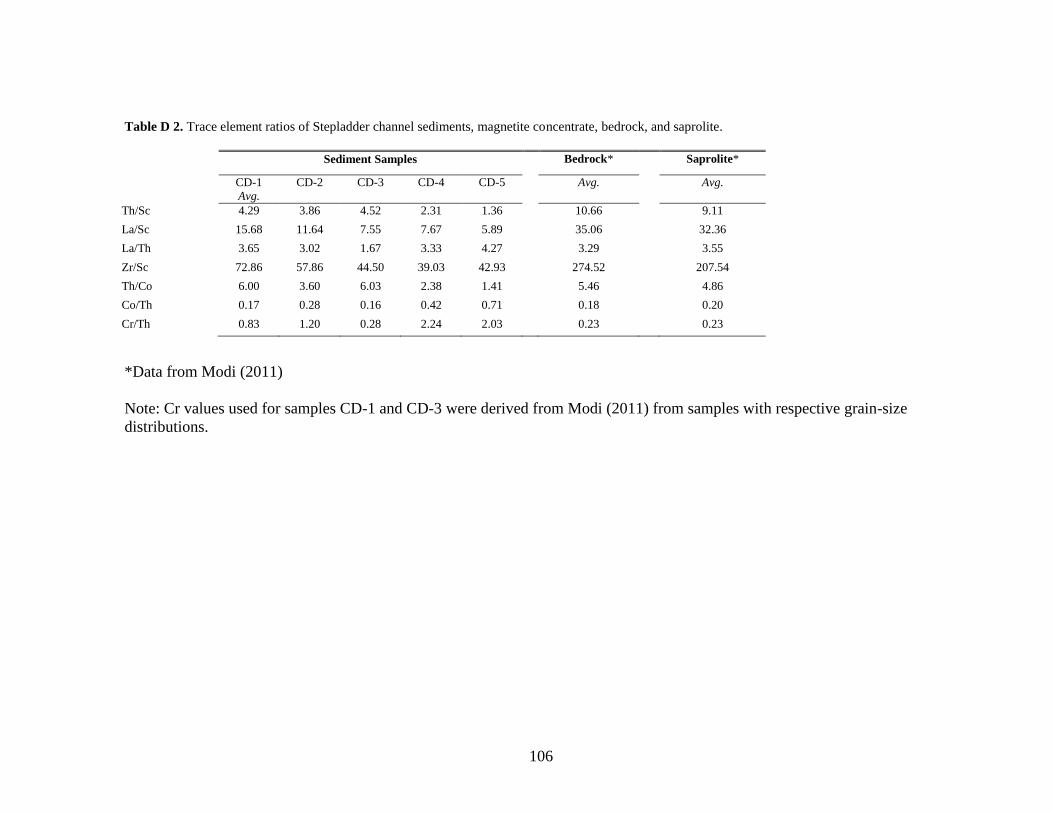
106
Table D 2. Trace element ratios of Stepladder channel sediments, magnetite concentrate, bedrock, and saprolite.
*Data from Modi (2011)
Note: Cr values used for samples CD-1 and CD-3 were derived from Modi (2011) from samples with respective grain-size
distributions.
Sediment Samples Bedrock* Saprolite*
CD-1
Avg.
CD-2 CD-3 CD-4 CD-5 Avg. Avg.
Th/Sc 4.29 3.86 4.52 2.31 1.36 10.66 9.11
La/Sc 15.68 11.64 7.55 7.67 5.89 35.06 32.36
La/Th 3.65 3.02 1.67 3.33 4.27 3.29 3.55
Zr/Sc 72.86 57.86 44.50 39.03 42.93 274.52 207.54
Th/Co 6.00 3.60 6.03 2.38 1.41 5.46 4.86
Co/Th 0.17 0.28 0.16 0.42 0.71 0.18 0.20
Cr/Th 0.83 1.20 0.28 2.24 2.03 0.23 0.23
107
VITA
Forrest Christopher Driscoll was born on July 17th, 1992 in Radford, Virginia.
During high school, he attended the Southwest Virginia Governor’s School for Science,
Mathematics, and Technology. In 2010, he enrolled at Virginia Tech to pursue his
interest in geology. While at Virginia Tech, he was an active research assistant for other
graduate students. In 2014, he graduated from Virginia Tech with a B.S. in geology.
Because of his positive experience doing research, he enrolled as a graduate student in
the Department Earth and Planetary Sciences at the University of Tennessee, Knoxville
to work with advisor Dr. Chris Fedo. He defended his thesis on July 8th, 2016 to receive
his M.S. in Geology.