Embed Size (px)
Citation preview

80
Stroke is the second leading cause of death worldwide.1 Many patients die in the acute phase after stroke,2 but the
risk of death remains high for years, particularly because of car-diovascular deaths.3–6 Accumulation of cardiovascular pathol-ogy is a slow process spanning many years, and it is likely that such pathology does not only cause stroke7 but also plays a role in mortality after stroke. This could mean that preventive and therapeutic measures for cardiovascular health, which are often implemented after a stroke,8 may be starting too late.
Most studies investigating risk factors for mortality after stroke were performed in clinical settings among patients with stroke.9–16 In such settings, the influence of reverse causality cannot be disentangled from the true effect of these risk fac-tors. In other words, a stroke itself induces changes in risk
factors, such as blood pressure, cholesterol, and diabetes mel-litus, which then are not a true reflection of their status before the stroke.17–19
Therefore, the aim of our study was to examine the role of prestroke cardiovascular risk factors in mortality after stroke. We first calculated mortality rates in people with and without stroke. Subsequently, we estimated the impact of prestroke car-diovascular risk factors on the risk of mortality after stroke using the population attributable risk (PAR). This shows the maxi-mum proportion of deaths that can theoretically be prevented with complete elimination of the cardiovascular risk factors, assuming that risk factors are causally linked and completely modifiable.20 Furthermore, we compared this with the PAR in stroke-free participants.
Background and Purpose—Mortality after stroke remains high for years, mostly because of cardiovascular causes. Given that cardiovascular pathology plays an important role in causing the initial stroke, such prestroke pathology might also influence the prognosis after stroke. Within the population-based Rotterdam Study, we examined the proportion of deaths after stroke that are attributable to pre-existent cardiovascular risk factors before stroke (the population attributable risk).
Methods—We examined 1237 patients with first-ever stroke and 4928 stroke-free participants (between 1990 and 2012), matched on age, sex, examination round, and stroke date (index date). Cardiovascular risk factors measured on ≈4 years before index date were used as determinants. Participants were continuously followed up for mortality (≈6 years) after the index date. We calculated separate and combined population attributable risk of hypertension, total cholesterol, high-density lipoprotein-cholesterol, body mass index, diabetes mellitus, smoking, transient ischemic attack, and atrial fibrillation.
Results—Nine hundred and nineteen patients with stroke and 2654 stroke-free participants died. The combined population attributable risk in patients with stroke was 27% (95% confidence interval, 14%–45%) and in stroke-free participants was 19% (95% confidence interval, 12%–29%). Population attributable risks of diabetes mellitus, smoking, and atrial fibrillation were higher in patients with stroke than in the reference group because of a higher prevalence of risk factors. In addition, people with atrial fibrillation and stroke had a higher hazard ratio for death than those with only atrial fibrillation.
Conclusions—One quarter of deaths after stroke could theoretically be prevented with rigorous cardiovascular prevention and treatment, but this should preferably start before stroke occurrence. In addition, research into factors explaining the remaining deaths needs to be encouraged. (Stroke. 2016;47:80-87. DOI: 10.1161/STROKEAHA.115.011256.)
Key Words: epidemiology ◼ mortality ◼ prognosis ◼ risk factors ◼ stroke
Role of Prestroke Vascular Pathology in Long-Term Prognosis After Stroke
The Rotterdam Study
Marileen L.P. Portegies, MD, MSc; Michiel J. Bos, MD, PhD; Albert Hofman, MD, PhD; Jan Heeringa, MD, PhD; Oscar H. Franco, MD, PhD; Peter J. Koudstaal, MD, PhD;
M. Arfan Ikram, MD, PhD
Received August 20, 2015; final revision received October 6, 2015; accepted October 27, 2015.From the Department of Epidemiology (M.L.P.P., M.J.B., A.H., J.H., O.H.F., M.A.I.), Neurology (M.L.P.P., P.J.K., M.A.I.), and Radiology (M.A.I.),
Erasmus MC University Medical Center, Rotterdam, The Netherlands.The online-only Data Supplement is available with this article at http://stroke.ahajournals.org/lookup/suppl/doi:10.1161/STROKEAHA.
115.011256/-/DC1.Correspondence to M. Arfan Ikram, MD, PhD, Department of Epidemiology, Erasmus MC University Medical Center, PO Box 2040, 3000CA Rotterdam,
The Netherlands. E-mail [email protected]© 2015 American Heart Association, Inc.
Stroke is available at http://stroke.ahajournals.org DOI: 10.1161/STROKEAHA.115.011256
by guest on August 3, 2017
http://stroke.ahajournals.org/D
ownloaded from
by guest on A
ugust 3, 2017http://stroke.ahajournals.org/
Dow
nloaded from
by guest on August 3, 2017
http://stroke.ahajournals.org/D
ownloaded from
by guest on A
ugust 3, 2017http://stroke.ahajournals.org/
Dow
nloaded from
by guest on August 3, 2017
http://stroke.ahajournals.org/D
ownloaded from
by guest on A
ugust 3, 2017http://stroke.ahajournals.org/
Dow
nloaded from
by guest on August 3, 2017
http://stroke.ahajournals.org/D
ownloaded from

Portegies et al Vascular Pathology and Risk of Death After Stroke 81
Materials and MethodsSettingThis study was conducted within the prospective, population-based Rotterdam Study. Details on the objectives and design of the study have been described elsewhere.21 In brief, baseline examinations started in 1990 among 7983 participants of ≥55 years residing in Ommoord, a suburb of Rotterdam, the Netherlands. Examinations took place ev-ery 3 to 4 years, which means participants were invited for a visit in 1990 to 1993, 1993 to 1995, 1997 to 1999, 2002 to 2004, and 2009 to 2011. In 2000, the cohort was extended with 3011 participants that had become 55 since the start of the study or moved into the research area. They were invited for a visit in 2000 to 2001, 2004 to 2005, and 2011 to 2012. In 2006, another 3932 subjects were included, aged ≥45 years. These participants visited the center in 2006 to 2008.
For the current study, participants with prevalent stroke (n=453) or who did not give informed consent for collection of follow-up in-formation (n=238) were excluded. Consequently, 14 235 participants were at risk for stroke. The Rotterdam Study has been approved by the Medical Ethics Committee of the Erasmus MC and by the Ministry of Health, Welfare and Sport of the Netherlands, implement-ing the Wet Bevolkingsonderzoek: ERGO (Population Studies Act: Rotterdam Study). All participants provided written informed con-sent to participate in the study and to obtain information from their treating physicians.
Assessment of Stroke and MortalityHistory of stroke was assessed during the home interview at baseline and confirmed by reviewing medical records.22 Strokes were defined according to World Health Organization criteria.23 From baseline onward, participants were continuously followed up for stroke and death by automatic linkage of general practitioners’ medical records with the study database. In addition, nursing home physicians’ medi-cal records, municipal records, and medical records from general practitioners of participants who moved out of the Ommoord district were examined on a regular basis. Potential strokes were reviewed by research physicians and verified by an experienced vascular neurologist.
Follow-up for stroke was complete for 96.3% of potential person-years and for vital status for 99.2% of potential person-years.
Assessment of Cardiovascular Risk FactorsHistory of smoking and medication use were assessed during the home interview. Smoking status was categorized as current, former, and never smoking. Physical examinations were performed during the visits at the study center.24 Body mass index was calculated as weight divided by length squared. Underweight was defined as a body mass index <18.5. Hypertension was defined as a systolic blood pressure ≥140 mm Hg, a diastolic blood pressure ≥90 mm Hg, and the use of blood pressure–lowering medication with the indication hyperten-sion.25 Hypercholesterolemia was defined as a total cholesterol >6.2 mmol/L.26 A low high-density lipoprotein-cholesterol (HDL-C) was defined as a HDL-C ≤1.0 mmol/L.26 Diabetes mellitus was defined as a fasting glucose level ≥7.0 mmol/L, nonfasting glucose level ≥11.0 mmol/L, or the use of antidiabetic medication.27
Occurrence of transient ischemic attacks and atrial fibrillation was assessed through active follow-up and verified using standard-ized definitions similar to the follow-up for stroke.28,29 However, follow-up for atrial fibrillation was only complete until 2010, which means that people with atrial fibrillation after 2010 were missed.
Statistical AnalysisCardiovascular risk factors obtained during the closest available ex-amination preceding the stroke were used for the analyses. In every visit, we had information about body mass index and smoking status. Cholesterol and glucose (necessary for diabetes mellitus status) were measured in each visit, except from the second center visit (1993–1995) of the first cohort. Blood pressure was also measured in each
visit, but the hypertension variable including blood pressure medica-tion with the indication of hypertension is not available for the fifth visit of the first cohort (2009–2011) and the third visit of the second cohort (2011–2012). Therefore, information on these missing vari-ables was obtained from a visit earlier. Participants were continuously followed up for the occurrence of transient ischemic attack and atrial fibrillation. Hence, the presence of transient ischemic attack or atrial fibrillation at any moment before stroke was used in the analysis.
To compare risks and risk factors of death between participants with stroke and a stroke-free group, we first defined an exposed group: all participants who had an incident stroke. For this exposed group, the at-risk time for mortality started at the stroke date. Then, we defined a nonexposed or stroke-free group. This nonexposed group consisted of 4 participants per stroke case, randomly matched to this case on age (within 1 year), sex, and visiting the same exami-nation round, using an incidence density sampling approach.30 This nonexposed group was free of stroke until the stroke date of their matched case (index date) and their at-risk time for mortality started at the index date. Note that participants could be included as nonex-posed several times and could become exposed later on. Further of note, this is different from a case–control design.
We used Poisson regression to calculate age- and sex-adjusted mortality rates and rate ratios for people with and without stroke, starting at the index date. As sensitivity analysis we also calculated cardiovascular and noncardiovascular mortality rates separately.
Associations between prestroke cardiovascular risk factors and mortality after stroke were calculated using the Interactive Risk Attributable Program.31 This program calculates hazard ratios (HRs) with 95% confidence intervals (CI) based on a Poisson model and enables the calculation of PARs with 95% CI. We provide logit trans-formed 95% CI accompanying the PARs as these are more easily interpretable and more stringent with regard to our combined PAR estimate.32 The PAR is estimated adjusting for confounding using the following formulas:
PAR = − ∑ =−
=∑1 11
1
li ij i jj
JRρ | (1)
where
Ri jpr D X xi C cj
pr D X x C cj|
( | , )
( | , )=
= = == = =
1
1 1 (2)
and
ρij i jX x C c D= = = =Pr( , | )1 (3)
with D=1 denoting presence of disease, X denoting exposure with i levels, and C denoting a confounder with j levels. We calculated the PAR for each risk factor separately and calculated the combined PAR. The combined PAR included the PARs that were associated with mortality in the expected direction, meaning that the HR was >1. PARs cannot be calculated for an HR <1 because this will result in a PAR that cannot be interpreted.33
We checked the proportional hazards assumption by inspecting log minus log plots. Follow-up started at the index date. Information on the investigated cardiovascular risk factors was missing up to a maximum of 9.7% and was imputed based on the other covariates using multiple imputation with 5 imputation sets. The mean of these 5 imputation sets was used to implement in the Interactive Risk Attributable Program. In each model, we adjusted for age, sex, time between center date and index date, and for the categories of hypertension, cholesterol, HDL-C, body mass index, diabetes mellitus, smoking, and atrial fibrillation, if appropriate. As sensitivity analysis we also calculated the PARs for cardiovascular and noncardiovascular mortality. We explored potential effect modification by the presence of stroke by using an interaction term of the stroke status with the potential risk factor. Differences in prevalence of risk factors between participants with stroke and stroke-free participants and between men and women were calculated using the χ2 test. Interactions with sex were tested adding an interaction term of the dependent variable with sex.
All analyses were performed using Interactive Risk Attributable Program version 2.2 (US National Cancer Institute), IBM SPSS
by guest on August 3, 2017
http://stroke.ahajournals.org/D
ownloaded from
82 Stroke January 2016
Statistics version 21.0 (IBM Corp., Armonk, NY) and SAS version 9.3 (SAS Institute Inc., Cary, NC).
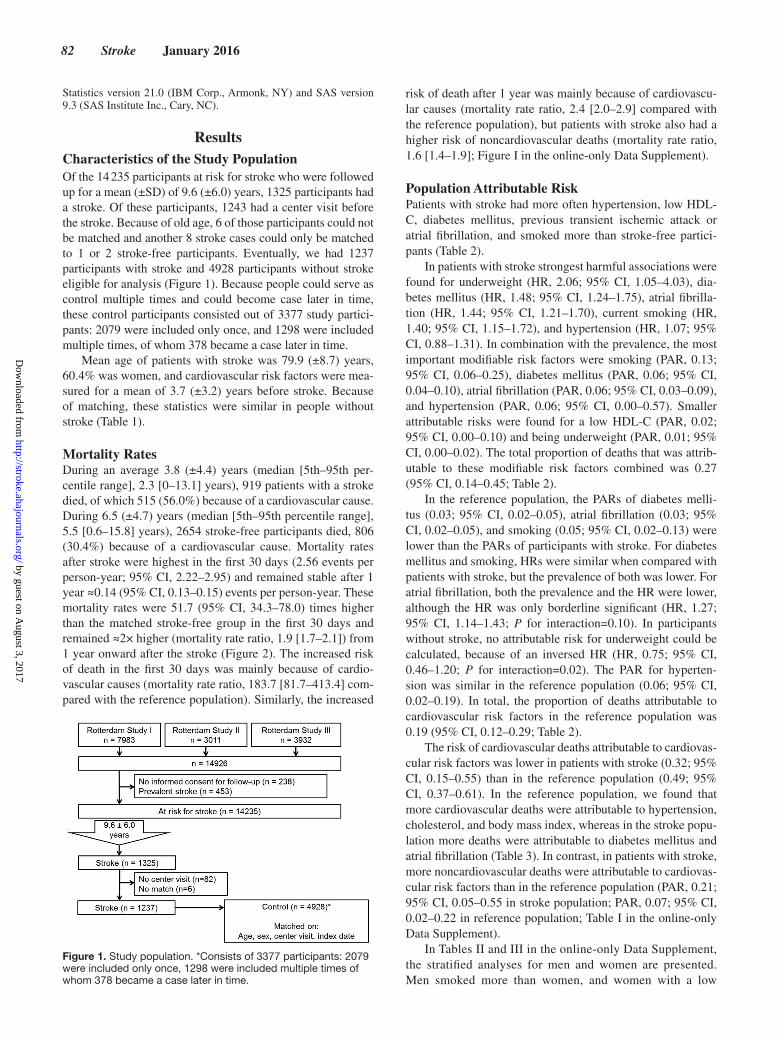
ResultsCharacteristics of the Study PopulationOf the 14 235 participants at risk for stroke who were followed up for a mean (±SD) of 9.6 (±6.0) years, 1325 participants had a stroke. Of these participants, 1243 had a center visit before the stroke. Because of old age, 6 of those participants could not be matched and another 8 stroke cases could only be matched to 1 or 2 stroke-free participants. Eventually, we had 1237 participants with stroke and 4928 participants without stroke eligible for analysis (Figure 1). Because people could serve as control multiple times and could become case later in time, these control participants consisted out of 3377 study partici-pants: 2079 were included only once, and 1298 were included multiple times, of whom 378 became a case later in time.
Mean age of patients with stroke was 79.9 (±8.7) years, 60.4% was women, and cardiovascular risk factors were mea-sured for a mean of 3.7 (±3.2) years before stroke. Because of matching, these statistics were similar in people without stroke (Table 1).
Mortality RatesDuring an average 3.8 (±4.4) years (median [5th–95th per-centile range], 2.3 [0–13.1] years), 919 patients with a stroke died, of which 515 (56.0%) because of a cardiovascular cause. During 6.5 (±4.7) years (median [5th–95th percentile range], 5.5 [0.6–15.8] years), 2654 stroke-free participants died, 806 (30.4%) because of a cardiovascular cause. Mortality rates after stroke were highest in the first 30 days (2.56 events per person-year; 95% CI, 2.22–2.95) and remained stable after 1 year ≈0.14 (95% CI, 0.13–0.15) events per person-year. These mortality rates were 51.7 (95% CI, 34.3–78.0) times higher than the matched stroke-free group in the first 30 days and remained ≈2× higher (mortality rate ratio, 1.9 [1.7–2.1]) from 1 year onward after the stroke (Figure 2). The increased risk of death in the first 30 days was mainly because of cardio-vascular causes (mortality rate ratio, 183.7 [81.7–413.4] com-pared with the reference population). Similarly, the increased
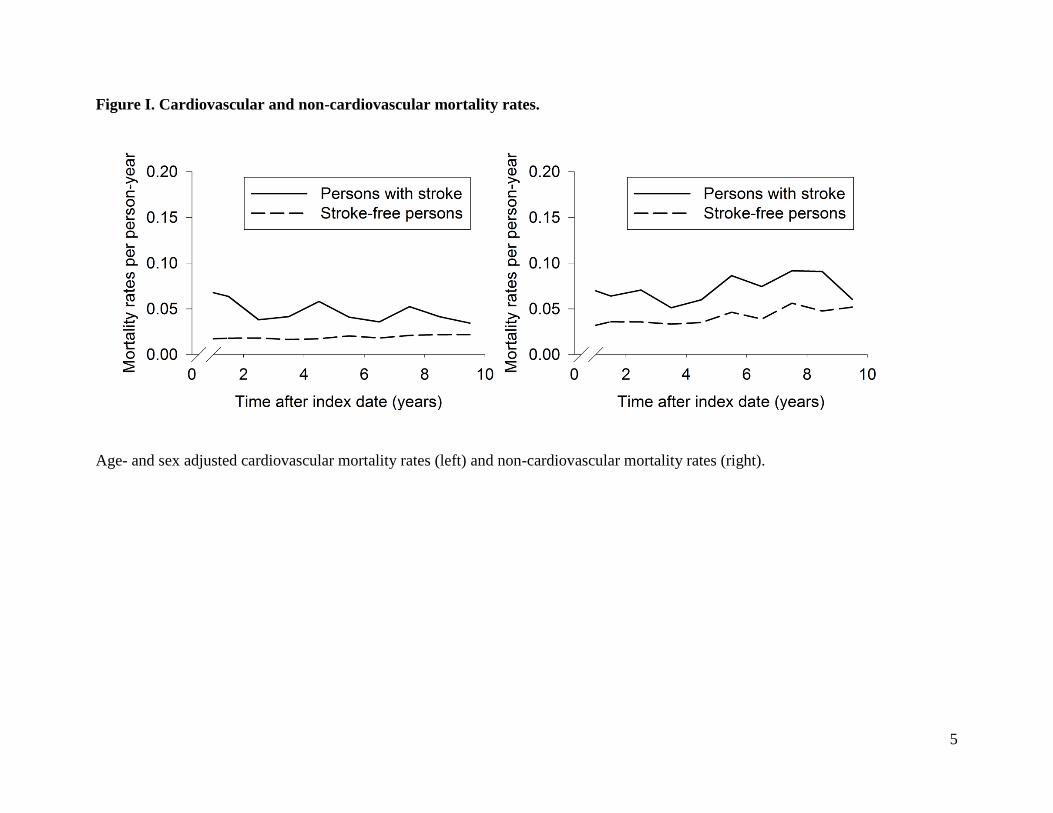
risk of death after 1 year was mainly because of cardiovascu-lar causes (mortality rate ratio, 2.4 [2.0–2.9] compared with the reference population), but patients with stroke also had a higher risk of noncardiovascular deaths (mortality rate ratio, 1.6 [1.4–1.9]; Figure I in the online-only Data Supplement).
Population Attributable RiskPatients with stroke had more often hypertension, low HDL-C, diabetes mellitus, previous transient ischemic attack or atrial fibrillation, and smoked more than stroke-free partici-pants (Table 2).
In patients with stroke strongest harmful associations were found for underweight (HR, 2.06; 95% CI, 1.05–4.03), dia-betes mellitus (HR, 1.48; 95% CI, 1.24–1.75), atrial fibrilla-tion (HR, 1.44; 95% CI, 1.21–1.70), current smoking (HR, 1.40; 95% CI, 1.15–1.72), and hypertension (HR, 1.07; 95% CI, 0.88–1.31). In combination with the prevalence, the most important modifiable risk factors were smoking (PAR, 0.13; 95% CI, 0.06–0.25), diabetes mellitus (PAR, 0.06; 95% CI, 0.04–0.10), atrial fibrillation (PAR, 0.06; 95% CI, 0.03–0.09), and hypertension (PAR, 0.06; 95% CI, 0.00–0.57). Smaller attributable risks were found for a low HDL-C (PAR, 0.02; 95% CI, 0.00–0.10) and being underweight (PAR, 0.01; 95% CI, 0.00–0.02). The total proportion of deaths that was attrib-utable to these modifiable risk factors combined was 0.27 (95% CI, 0.14–0.45; Table 2).
In the reference population, the PARs of diabetes melli-tus (0.03; 95% CI, 0.02–0.05), atrial fibrillation (0.03; 95% CI, 0.02–0.05), and smoking (0.05; 95% CI, 0.02–0.13) were lower than the PARs of participants with stroke. For diabetes mellitus and smoking, HRs were similar when compared with patients with stroke, but the prevalence of both was lower. For atrial fibrillation, both the prevalence and the HR were lower, although the HR was only borderline significant (HR, 1.27; 95% CI, 1.14–1.43; P for interaction=0.10). In participants without stroke, no attributable risk for underweight could be calculated, because of an inversed HR (HR, 0.75; 95% CI, 0.46–1.20; P for interaction=0.02). The PAR for hyperten-sion was similar in the reference population (0.06; 95% CI, 0.02–0.19). In total, the proportion of deaths attributable to cardiovascular risk factors in the reference population was 0.19 (95% CI, 0.12–0.29; Table 2).
The risk of cardiovascular deaths attributable to cardiovas-cular risk factors was lower in patients with stroke (0.32; 95% CI, 0.15–0.55) than in the reference population (0.49; 95% CI, 0.37–0.61). In the reference population, we found that more cardiovascular deaths were attributable to hypertension, cholesterol, and body mass index, whereas in the stroke popu-lation more deaths were attributable to diabetes mellitus and atrial fibrillation (Table 3). In contrast, in patients with stroke, more noncardiovascular deaths were attributable to cardiovas-cular risk factors than in the reference population (PAR, 0.21; 95% CI, 0.05–0.55 in stroke population; PAR, 0.07; 95% CI, 0.02–0.22 in reference population; Table I in the online-only Data Supplement).
In Tables II and III in the online-only Data Supplement, the stratified analyses for men and women are presented. Men smoked more than women, and women with a low
Figure 1. Study population. *Consists of 3377 participants: 2079 were included only once, 1298 were included multiple times of whom 378 became a case later in time.
by guest on August 3, 2017
http://stroke.ahajournals.org/D
ownloaded from

Portegies et al Vascular Pathology and Risk of Death After Stroke 83
HDL-C had a higher risk of death after stroke than men. In total, the proportion of deaths attributable to cardiovascu-lar risk factors was 0.29 (95% CI, 0.13–0.53) in men with stroke, 0.42 (95% CI, 0.29–0.57) in men without stroke, 0.25 (95% CI, 0.18–0.34) in women with stroke, and 0.14 (95% CI, 0.06–0.29) in women without stroke. Largest dif-ferences between men and women were found for hyperten-sion. In men with stroke, more deaths were attributable to hypertension (PAR, 0.22; 95% CI, 0.07–0.52) than in men without stroke (PAR, 0.07; 95% CI, 0.01–0.28). In women with stroke, no deaths were attributable to hypertension, whereas in women without stroke, we found a PAR of 0.05 (95% CI, 0.01–0.29). In women, we found stronger PARs
for diabetes mellitus, smoking, and a low HDL-C than in men, but only a low HDL-C had a significantly higher HR in women than in men.
DiscussionWe found that participants with stroke had a long-term mor-tality rate that was 2-fold higher than stroke-free participants. This is partly because of cardiovascular risk factors already present before stroke because 27% deaths after stroke were attributable to these factors. In total, this was only 8% higher than in people without stroke. Deaths after stroke were mainly cardiovascular, but only 32% of those deaths were attributable to cardiovascular risk factors before stroke, compared with 49% in stroke-free participants. Nevertheless, attributable risks of diabetes mellitus and atrial fibrillation were almost twice as high in patients with stroke when compared with stroke-free participants for both all-cause and cardiovascular mortality.
Despite the changes in stroke treatment over the past decades with improvement of incidence and mortality rates,22,34–36 the 2-fold higher mortality rate in patients with stroke than in stroke-free participants is similar to what was found a decade earlier3–5,12 and in young adults.6 In other words, the improvement in healthcare of patients with stroke has not exceeded the improvement in healthcare experienced in the general population. Hence, the room for improving long-term prognosis after stroke remains substantial. An important contribution of our study is that we investigated and quantified to what extent pre-existent cardiovascular risk fac-tors can contribute to poststroke survival.
Main risk factors for death after stroke in our study were smoking, diabetes mellitus, atrial fibrillation, and in men hypertension. Smoking and diabetes mellitus were previously also identified as risk factors, in a study examining factors before stroke,37 as well as in studies that started at stroke onset and might be influenced by reversed causality.10,13,14 Results with respect to atrial fibrillation were conflicting, some stud-ies did find an increased risk of death,11,13,16 other studies did not.10,14 Differences might be because of adjustments for severity, which could actually be a mediator in the pathway although 1 study found an effect independent from severity.13 Hypertension was previously not found as an important risk factor, but the studies did not stratify for sex.10,13,15,16
A novelty of our study is that we measured PAR and com-pared this with a reference population. Although cardiovas-cular risk factor management is an important cornerstone of
Table 1. Baseline Characteristics
Participants With Stroke
(n=1237)Matched Participants
Without Stroke (n=4928)
Age at index date, y 79.9 (8.7) 79.8 (8.7)
Time-interval between center visit and index date, y
3.7 (3.2) 3.7 (3.4)
Women 747 (60.4%) 2978 (60.4%)
Hypertension 1007 (85.2%) 3653 (76.2%)
Blood pressure–lowering medication
575 (47.7%) 1989 (41.3%)
Cholesterol
Hypercholesterolemia 443 (39.6%) 1913 (41.6%)
Lipid-lowering medication 107 (9.6%) 486 (10.6%)
Low HDL-C 225 (19.9%) 771 (16.7%)
Body mass index
<18.5 9 (0.8%) 35 (0.8%)
18.5–25 327 (30.1%) 1455 (32.5%)
≥25 751 (69.1%) 2992 (66.8%)
Diabetes mellitus 212 (18.7%) 525 (11.4%)
Smoking
Never 328 (29.3%) 1651 (36.3%)
Past 515 (46.0%) 2197 (48.3%)
Current 276 (24.7%) 698 (15.4%)
TIA 194 (15.7%) 407 (8.3%)
Atrial fibrillation 203 (18.4%) 484 (10.6%)
Data are presented as mean (SDs) or counts (percentages). Percentages are calculated without missing values. HDL-C indicates high-density lipoprotein cholesterol; n, number of participants at risk; and TIA, transient ischemic attack.
Figure 2. Mortality rates. Age- and sex-adjusted mortality rates in the first year (left) or 1 y after baseline (right).
by guest on August 3, 2017
http://stroke.ahajournals.org/D
ownloaded from

84 Stroke January 2016
treatment after stroke,8 we found that one quarter of deaths after stroke is attributable to cardiovascular risk factors. An explanation might be that pathological changes leading to those deaths were already present before the stroke, which is
supported by the fact that the risk factors were measured years before the stroke. Aggressive risk factor control after stroke might, therefore, be too late. Yet, the proportion of cardio-vascular deaths attributable to cardiovascular risk factors was
Table 2. Cardiovascular Risk Factors and Risk of Mortality After Stroke
Risk of Mortality People With Stroke (n/N=919/1237) People Without Stroke (n/N=2654/4928)
Risk Factors Prevalence, % HR (95% CI) PAR (95% CI) Prevalence, % HR (95% CI) PAR (95% CI)
Hypertension 84.8* 1.07 (0.88–1.31) 0.06 (0.00–0.57) 76.2* 1.09 (0.99–1.20) 0.06 (0.02–0.19)
Cholesterol
Hypercholesterolemia 39.9 0.88 (0.77–1.02) NA 41.8 1.03 (0.95–1.12) 0.001 (0.00–1.00)
Treated 8.6 0.60 (0.44–0.81)* 9.9 0.83 (0.70–0.98)*
Low HDL-C 18.5* 1.12 (0.94–1.33) 0.02 (0.00–0.10) 15.9* 1.17 (1.06–1.29) 0.03 (0.01–0.05)
BMI
<18.5 0.7 1.84 (0.93–3.63)* NA 0.7 0.72 (0.45–1.17)* NA
≥25 70.7 0.84 (0.73–0.97) 68.5 0.95 (0.88–1.04)
Underweight 0.7 2.06 (1.05–4.03)* 0.01 (0.00–0.02) 0.7 0.74 (0.46–1.20)* NA
Diabetes mellitus 17.3* 1.48 (1.24–1.75) 0.06 (0.04–0.10) 10.8* 1.35 (1.20–1.52) 0.03 (0.02–0.05)
Smoking
Past 47.7 1.16 (0.98–1.37) 0.13 (0.06–0.25) 49.1 1.02 (0.93–1.12) 0.05 (0.02–0.13)
Current 22.5* 1.40 (1.15–1.72) 14.4* 1.41 (1.24–1.60)
TIA 15.7* 0.93 (0.78–1.12) NA 8.3* 1.00 (0.87–1.13) NA
Atrial fibrillation 16.8* 1.44 (1.21–1.70) 0.06 (0.03–0.09) 10.1* 1.27 (1.14–1.43) 0.03 (0.02–0.05)
Total 0.27 (0.14–0.45) 0.19 (0.12–0.29)
Values are HRs (95% CIs) or population attributable risks (95% CIs). Adjusted for age, sex, time between center visit and index date, and for the categories of hypertension, cholesterol, HDL-C, BMI, diabetes mellitus, smoking, and atrial fibrillation, if appropriate. BMI indicates body mass index; CI, confidence interval; HDL-C, high-density lipoprotein cholesterol; HR, hazard ratio; n, number of deaths; N, number at risk; NA, not applicable because the HR is <1; PAR, population attributable risk; and TIA, transient ischemic attack.
*Statistically different between people with and without stroke (P<0.05).
Table 3. Cardiovascular Risk Factors and Risk of Cardiovascular Mortality After Stroke
Risk of Mortality People With Stroke (n/N=515/1237) People Without Stroke (n/N=806/4928)
Risk Factors Prevalence, % HR (95% CI) PAR (95% CI) Prevalence, % HR (95% CI) PAR (95% CI)
Hypertension 84.8* 1.02 (0.79–1.34) 0.02 (0.00–1.00) 76.2* 1.29 (1.07–1.56) 0.19 (0.09–0.35)
Cholesterol
Hypercholesterolemia 39.9 0.97 (0.80–1.16) NA 41.8 1.12 (0.96–1.29) 0.05 (0.01–0.21)
Treated 8.6 0.65 (0.44–0.96) 9.9 0.95 (0.71–1.27)
Low HDL-C 18.5* 1.12 (0.88–1.42) 0.02 (0.00–0.18) 15.9* 1.25 (1.04–1.49) 0.04 (0.02–0.09)
BMI
<18.5 0.7 1.61 (0.65–4.00) NA 0.7 0.88 (0.36–2.14) 0.08 (0.02–0.26)
≥25 70.7 0.83 (0.68–1.00)* 68.5 1.13 (0.97–1.32)*
Underweight 0.7 1.82 (0.74–4.49) 0.004 (0.00–0.03) 0.7 0.81 (0.34–1.97) NA
Diabetes mellitus 17.3* 1.77 (1.42–2.20) 0.09 (0.06–0.14) 10.8* 1.55 (1.27–1.90) 0.05 (0.03–0.08)
Smoking
Past 47.7 1.16 (0.93–1.45)* 0.14 (0.06–0.31) 49.1 1.30 (1.09–1.53)* 0.17 (0.10–0.27)
Current 22.5* 1.55 (1.19–2.02) 14.4* 1.61 (1.27–2.05)
TIA 15.7* 1.08 (0.86–1.36) 0.01 (0.00–0.25) 8.3* 0.89 (0.70–1.13) NA
Atrial fibrillation 16.8* 1.78 (1.45–2.20) 0.10 (0.06–0.15) 10.1* 1.54 (1.27–1.87) 0.06 (0.03–0.09)
Total 0.32 (0.15–0.55) 0.49 (0.37–0.61)
Values are HRs (95% CIs) or population attributable risks (95% CIs). Adjusted for age, sex, time between center visit and index date, and for the categories of hypertension, cholesterol, HDL cholesterol, BMI, diabetes mellitus, smoking, and atrial fibrillation, if appropriate. BMI indicates body mass index; CI, confidence interval; HDL-C, high-density lipoprotein cholesterol; HR, hazard ratio; n, number of deaths; N, number at risk; NA, not applicable because the HR is <1; PAR, population attributable risk; and TIA, transient ischemic attack.
*Statistically different between people with and without stroke (P<0.05).
by guest on August 3, 2017
http://stroke.ahajournals.org/D
ownloaded from

Portegies et al Vascular Pathology and Risk of Death After Stroke 85
lower in the stroke population than in the reference population. To properly interpret these results, a few considerations need to be taken into account. First, the stroke population had many more cardiovascular deaths than the reference population, which is obvious because stroke itself is a cardiovascular dis-ease. Second, this larger number also means that the absolute number of cardiovascular deaths in patients with stroke caused by cardiovascular risk factors is higher than the reference population, even though the relative proportions (attributable risks) were inversed. Similar reasoning holds for the opposite difference in attributable risks for noncardiovascular mortal-ity. A third consideration to properly interpret our findings on cardiovascular mortality is that patients with stroke are more aggressively treated after the index date compared with the ref-erence population. That might have reduced some of the harm-ful effect of cardiovascular risk factors. More importantly, our findings emphasize that other factors too should be explored to understand the causes of death after stroke. This is further emphasized by the 73% of deaths that remain unexplained. Such novel factors may include other prestroke risk factors, for example, genetic factors; poststroke factors, for example, proper medical care, response to treatment, or frailty caused by the stroke; and characteristics of the stroke itself, for example hemorrhagic transformation or size of the stroke.11,38,39
At the same time, we have to consider that the PAR for diabetes mellitus, smoking, and atrial fibrillation was almost twice as high in people with stroke than in stroke-free people. Differences in PAR can be caused by a difference in effect size or a difference in prevalence.33 The PAR in our study was mostly driven by the higher prevalence of diabetes mellitus, smoking, and atrial fibrillation in people with stroke, probably because these factors are also important risk factors for the stroke itself.40
Interestingly, we found effect modification of stroke for the effect of atrial fibrillation and underweight with stronger effect sizes for death in people with stroke than in people with-out stroke. This might be because of more severe strokes and more complications after stroke in people with atrial fibril-lation.41 For people with underweight, the increased risk of death after stroke might be because of frailty in combination with dysphagia.37,42 Underweight participants might be more vulnerable to undernutrition. Furthermore, they may reflect people with a high morbidity and increased risk of both stroke and death, for example, patients with cancer. This is supported by the finding that especially noncardiovascular deaths are attributable to underweight. However, because of low num-bers these results have to be interpreted with caution.
Strengths of this study are the long follow-up, the avail-ability of cardiovascular risk factors measured before stroke occurrence, which avoids reversed causality, and that we could compare people with stroke to a reference population from the same study population. This study also has some lim-itations. For instance, the PAR might be an overestimation of the amount of deaths that could be prevented, as for some risk factors optimal treatment cannot completely reduce the harm-ful effect.40,43 Irreversible damage might already have occurred before starting of the optimal treatment. Moreover, we only used a single measurement of the cardiovascular risk factor before stroke, while the long-term pattern (ie, trajectory) of
a risk factor before and after stroke might further influence the risk of dying. However, we were interested in the effect of prestroke risk factors on death after stroke and adding post-stroke information might obscure this effect. We also missed information about physical activity, which is an important risk factor for stroke44 and possibly for stroke mortality.37 So our estimates might be an underestimation of the effect of car-diovascular risk factors. Another limitation is that we did not measure severity of stroke, which is an important risk factor for mortality.11 This could have led to some residual confound-ing. However, severity is likely to be an intermediate as well in the causal pathway and adjusting might in fact lead to overad-justment. Furthermore, not all participants with stroke (6.2%) had visited our research center before the stroke occurred. This could have led to selection bias if patients who did come to the center were more healthy. A final consideration is that we had missing values ≤9.7% per variable. We imputed these missing values to prevent selection bias, but this might have led to some misclassification. Furthermore, atrial fibrillation follow-up was only complete until 2010. This could have led to misclassification in participants with an index date after 2010 because their atrial fibrillation status was outdated.
SummaryThe long-term risk of mortality after stroke remains increased and is almost twice as high when compared with people without stroke. One quarter of stroke deaths might be pre-vented with optimal cardiovascular prevention and treatment of mainly diabetes, atrial fibrillation, and smoking, starting before stroke. These findings underline the importance of primary prevention because it does reduce not only the risk of stroke but also its long-term prognosis. At the same time, equally important, our findings indicate the need of finding factors that explain the remaining three quarter of deaths and doubled the risk of death in people with stroke when com-pared with those without stroke because it cannot be explained by cardiovascular risk factors only.
AcknowledgmentsAll authors have made substantial intellectual contributions to con-ception and design (Drs Hofman, Heeringa, Franco, and Ikram), or acquisition of data (Drs Portegies and Bos), or analysis and inter-pretation of data (Drs Portegies, Koudstaal, and Ikram), drafting the article or revising it critically for important intellectual content (Drs Portegies, Bos, Hofman, Heeringa, Franco, Koudstaal, and Ikram), and gave final approval of the version to be published (Drs Portegies, Bos, Hofman, Heeringa, Franco, Koudstaal, and Ikram). Dr Ikram has full access to all the data in the study and takes responsibility for the integrity of the data and the accuracy of the data analysis.
Sources of FundingThe Rotterdam Study is supported by the Erasmus MC University Medical Center and Erasmus University Rotterdam; the Netherlands Organisation for Scientific Research; The Netherlands Organisation for Health Research and Development (ZonMW); the Research Institute for Diseases in the Elderly; the Netherlands Genomics Initiative; the Ministry of Education, Culture and Science; the Ministry of Health, Welfare and Sports; the European Commission; and the Municipality of Rotterdam. Further support was obtained from the Netherlands Consortium for Healthy Ageing and by a grant from the Netherlands Heart Foundation 2012T008, and Erasmus MC Fellowship 2013.
by guest on August 3, 2017
http://stroke.ahajournals.org/D
ownloaded from
86 Stroke January 2016
DisclosuresDr Franco works in ErasmusAGE, a center for aging research across the life course funded by Nestlé Nutrition (Nestec Ltd.), Metagenics Inc, and AXA. Nestlé Nutrition (Nestec Ltd.), Metagenics Inc, and AXA had no role in design and conduct of the study and preparation, review, or approval of the article. With regard to potential conflicts of interest, there is nothing to disclose. The other authors report no conflicts.
References 1. Lozano R, Naghavi M, Foreman K, Lim S, Shibuya K, Aboyans V, et
al. Global and regional mortality from 235 causes of death for 20 age groups in 1990 and 2010: a systematic analysis for the Global Burden of Disease Study 2010. Lancet. 2012;380:2095–2128. doi: 10.1016/S0140-6736(12)61728-0.
2. Feigin VL, Lawes CM, Bennett DA, Barker-Collo SL, Parag V. Worldwide stroke incidence and early case fatality reported in 56 popula-tion-based studies: a systematic review. Lancet Neurol. 2009;8:355–369. doi: 10.1016/S1474-4422(09)70025-0.
3. Dennis MS, Burn JP, Sandercock PA, Bamford JM, Wade DT, Warlow CP. Long-term survival after first-ever stroke: the Oxfordshire Community Stroke Project. Stroke. 1993;24:796–800.
4. Brønnum-Hansen H, Davidsen M, Thorvaldsen P; Danish MONICA Study Group. Long-term survival and causes of death after stroke. Stroke. 2001;32:2131–2136.
5. Katzenellenbogen JM, Vos T, Somerford P, Begg S, Semmens JB, Codde JP. Excess mortality rates for estimating the non-fatal burden of stroke in Western Australia: a data linkage study. Cerebrovasc Dis. 2010;30:57–64. doi: 10.1159/000314621.
6. Rutten-Jacobs LC, Arntz RM, Maaijwee NA, Schoonderwaldt HC, Dorresteijn LD, van Dijk EJ, et al. Cardiovascular disease is the main cause of long-term excess mortality after ischemic stroke in young adults. Hypertension. 2015;65:670–675. doi: 10.1161/HYPERTENSIONAHA.114.04895.
7. Go AS, Mozaffarian D, Roger VL, Benjamin EJ, Berry JD, Blaha MJ, et al; American Heart Association Statistics Committee and Stroke Statistics Subcommittee. Heart disease and stroke statistics–2014 update: a report from the American Heart Association. Circulation. 2014;129:e28–e292. doi: 10.1161/01.cir.0000441139.02102.80.
8. Davis SM, Donnan GA. Clinical practice. Secondary prevention after ischemic stroke or transient ischemic attack. N Engl J Med. 2012;366:1914–1922. doi: 10.1056/NEJMcp1107281.
9. Engstad T, Viitanen M, Arnesen E. Predictors of death among long-term stroke survivors. Stroke. 2003;34:2876–2880. doi: 10.1161/01.STR.0000101751.20118.C1.
10. Rønning OM, Stavem K. Predictors of mortality following acute stroke: a cohort study with 12 years of follow-up. J Stroke Cerebrovasc Dis. 2012;21:369–372. doi: 10.1016/j.jstrokecerebrovasdis.2010.09.012.
11. Hankey GJ. Long-term outcome after ischaemic stroke/transient isch-aemic attack. Cerebrovasc Dis. 2003;16(suppl 1):14–19. doi: 69936.
12. Hankey GJ, Jamrozik K, Broadhurst RJ, Forbes S, Burvill PW, Anderson CS, et al. Five-year survival after first-ever stroke and related prognostic factors in the Perth Community Stroke Study. Stroke. 2000;31:2080–2086.
13. Kammersgaard LP, Olsen TS. Cardiovascular risk factors and 5-year mor-tality in the Copenhagen Stroke Study. Cerebrovasc Dis. 2006;21:187–193. doi: 10.1159/000090531.
14. Eriksson SE, Olsson JE. Survival and recurrent strokes in patients with different subtypes of stroke: a fourteen-year follow-up study. Cerebrovasc Dis. 2001;12:171–180. doi: 47700.
15. Petty GW, Brown RD Jr, Whisnant JP, Sicks JD, O’Fallon WM, Wiebers DO. Survival and recurrence after first cerebral infarction: a population-based study in Rochester, Minnesota, 1975 through 1989. Neurology. 1998;50:208–216.
16. Carter AM, Catto AJ, Mansfield MW, Bamford JM, Grant PJ. Predictive variables for mortality after acute ischemic stroke. Stroke. 2007;38:1873–1880. doi: 10.1161/STROKEAHA.106.474569.
17. Barron SA, Rogovski Z, Hemli J. Autonomic consequences of cerebral hemisphere infarction. Stroke. 1994;25:113–116.
18. Fassbender K, Schmidt R, Mössner R, Daffertshofer M, Hennerici M. Pattern of activation of the hypothalamic-pituitary-adrenal axis in acute stroke. Relation to acute confusional state, extent of brain damage, and clinical outcome. Stroke. 1994;25:1105–1108.
19. Rosenson RS. Myocardial injury: the acute phase response and lipopro-tein metabolism. J Am Coll Cardiol. 1993;22:933–940.
20. Rothman KJ, Greenland S, Lash TL Modern Epidemiology. 3rd ed. Philadelphia, PA: Lippincott, Williams & Wilkins; 2008.
21. Hofman A, Brusselle GG, Darwish Murad S, van Duijn CM, Franco OH, Goedegebure A, et al. The Rotterdam Study: 2016 objectives and design update. Eur J Epidemiol. 2015;30:661–708. doi: 10.1007/s10654-015-0082-x.
22. Wieberdink RG, Ikram MA, Hofman A, Koudstaal PJ, Breteler MM. Trends in stroke incidence rates and stroke risk factors in Rotterdam, the Netherlands from 1990 to 2008. Eur J Epidemiol. 2012;27:287–295. doi: 10.1007/s10654-012-9673-y.
23. Hatano S. Experience from a multicentre stroke register: a preliminary report. Bull World Health Organ. 1976;54:541–553.
24. Kavousi M, Elias-Smale S, Rutten JH, Leening MJ, Vliegenthart R, Verwoert GC, et al. Evaluation of newer risk markers for coronary heart disease risk classification: a cohort study. Ann Intern Med. 2012;156:438–444. doi: 10.7326/0003-4819-156-6- 201203200-00006.
25. Mancia G, Fagard R, Narkiewicz K, Redon J, Zanchetti A, Böhm M, et al. 2013 ESH/ESC guidelines for the management of arterial hyper-tension: the Task Force for the Management of Arterial Hypertension of the European Society of Hypertension (ESH) and of the European Society of Cardiology (ESC). Eur Heart J. 2013;34:2159–2219. doi: 10.1093/eurheartj/eht151.
26. Expert Panel on Detection, Evaluation, and Treatment of High Blood Cholesterol in Adults. Executive Summary of The Third Report of The National Cholesterol Education Program (NCEP) Expert Panel on Detection, Evaluation, And Treatment of High Blood Cholesterol In Adults (Adult Treatment Panel III). JAMA. 2001;285:2486–2497
27. American Diabetes Association. Standards of Medical Care in Diabetes—2013. Diabetes Care. 2013;36(suppl 1):S11–S66. doi: 10.2337/dc13-S011.
28. Bos MJ, van Rijn MJ, Witteman JC, Hofman A, Koudstaal PJ, Breteler MM. Incidence and prognosis of transient neurological attacks. JAMA. 2007;298:2877–2885. doi: 10.1001/jama.298.24.2877.
29. Leening MJ, Kavousi M, Heeringa J, van Rooij FJ, Verkroost-van Heemst J, Deckers JW, et al. Methods of data collection and definitions of cardiac outcomes in the Rotterdam Study. Eur J Epidemiol. 2012;27:173–185. doi: 10.1007/s10654-012-9668-8.
30. Kiri VA. Programming challenges of sampling controls to cases from the dynamic risk sets in nested case control studies. http://www.thehealth-well.info/node/685397. Accessed November 14, 2014.
31. Interactive risk attributable program, version 2.2. http://dceg.cancer.gov/tools/risk-assessment/irap. Accessed March 28, 2014.
32. Leung HM, Kupper LL. Comparisons of confidence intervals for attrib-utable risk. Biometrics. 1981;37:293–302.
33. Benichou J. Biostatistics and epidemiology: measuring the risk attribut-able to an environmental or genetic factor. C R Biol. 2007;330:281–298. doi: 10.1016/j.crvi.2007.02.015.
34. Goldstein LB, Bushnell CD, Adams RJ, Appel LJ, Braun LT, Chaturvedi S, et al; American Heart Association Stroke Council; Council on Cardiovascular Nursing; Council on Epidemiology and Prevention; Council for High Blood Pressure Research, Council on Peripheral Vascular Disease, and Interdisciplinary Council on Quality of Care and Outcomes Research. Guidelines for the primary prevention of stroke: a guideline for healthcare professionals from the American Heart Association/American Stroke Association. Stroke. 2011;42:517–584. doi: 10.1161/STR.0b013e3181fcb238.
35. Koton S, Schneider AL, Rosamond WD, Shahar E, Sang Y, Gottesman RF, et al. Stroke incidence and mortality trends in US communities, 1987 to 2011. JAMA. 2014;312:259–268. doi: 10.1001/jama.2014.7692.
36. Feigin VL, Forouzanfar MH, Krishnamurthi R, Mensah GA, Connor M, Bennett DA, et al; Global Burden of Diseases, Injuries, and Risk Factors Study 2010 (GBD 2010) and the GBD Stroke Experts Group. Global and regional burden of stroke during 1990-2010: findings from the Global Burden of Disease Study 2010. Lancet. 2014;383:245–254.
37. Bell CL, LaCroix A, Masaki K, Hade EM, Manini T, Mysiw WJ, et al. Prestroke factors associated with poststroke mortality and recovery in older women in the Women’s Health Initiative. J Am Geriatr Soc. 2013;61:1324–1330. doi: 10.1111/jgs.12361.
38. D’Amelio M, Terruso V, Famoso G, Di Benedetto N, Realmuto S, Valentino F, et al. Early and late mortality of spontaneous hemor-rhagic transformation of ischemic stroke. J Stroke Cerebrovasc Dis. 2014;23:649–654. doi: 10.1016/j.jstrokecerebrovasdis.2013.06.005.
by guest on August 3, 2017
http://stroke.ahajournals.org/D
ownloaded from

Portegies et al Vascular Pathology and Risk of Death After Stroke 87
39. Hsieh YC, Seshadri S, Chung WT, Hsieh FI, Hsu YH, Lin HJ, et al; Formosa Stroke Genetic Consortium (FSGC). Association between genetic variant on chromosome 12p13 and stroke survival and recur-rence: a one year prospective study in Taiwan. J Biomed Sci. 2012;19:1. doi: 10.1186/1423-0127-19-1.
40. Bos MJ, Koudstaal PJ, Hofman A, Ikram MA. Modifiable etiological factors and the burden of stroke from the Rotterdam study: a population-based cohort study. PLoS Med. 2014;11:e1001634. doi: 10.1371/journal.pmed.1001634.
41. McGrath ER, Kapral MK, Fang J, Eikelboom JW, O’Conghaile A, Canavan M, et al; Investigators of the Ontario Stroke Registry. Association of atrial fibrillation with mortality and disability after
ischemic stroke. Neurology. 2013;81:825–832. doi: 10.1212/WNL.0b013e3182a2cc15.
42. Kumar S, Selim MH, Caplan LR. Medical complications after stroke. Lancet Neurol. 2010;9:105–118. doi: 10.1016/S1474-4422(09)70266-2.
43. Dehghan A, van Hoek M, Sijbrands EJ, Stijnen T, Hofman A, Witteman JC. Risk of type 2 diabetes attributable to C-reactive protein and other risk factors. Diabetes Care. 2007;30:2695–2699. doi: 10.2337/dc07-0348.
44. O’Donnell MJ, Xavier D, Liu L, Zhang H, Chin SL, Rao-Melacini P, et al; INTERSTROKE Investigators. Risk factors for ischaemic and intracerebral haemorrhagic stroke in 22 countries (the INTERSTROKE study): a case-control study. Lancet. 2010;376:112–123. doi: 10.1016/S0140-6736(10)60834-3.
by guest on August 3, 2017
http://stroke.ahajournals.org/D
ownloaded from

Koudstaal and M. Arfan IkramMarileen L.P. Portegies, Michiel J. Bos, Albert Hofman, Jan Heeringa, Oscar H. Franco, Peter J.
Rotterdam StudyRole of Prestroke Vascular Pathology in Long-Term Prognosis After Stroke: The
Print ISSN: 0039-2499. Online ISSN: 1524-4628 Copyright © 2015 American Heart Association, Inc. All rights reserved.
is published by the American Heart Association, 7272 Greenville Avenue, Dallas, TX 75231Stroke doi: 10.1161/STROKEAHA.115.011256
2016;47:80-87; originally published online November 24, 2015;Stroke.
http://stroke.ahajournals.org/content/47/1/80World Wide Web at:
The online version of this article, along with updated information and services, is located on the
http://stroke.ahajournals.org/content/suppl/2015/11/24/STROKEAHA.115.011256.DC1Data Supplement (unedited) at:
http://stroke.ahajournals.org//subscriptions/
is online at: Stroke Information about subscribing to Subscriptions:
http://www.lww.com/reprints Information about reprints can be found online at: Reprints:
document. Permissions and Rights Question and Answer process is available in the
Request Permissions in the middle column of the Web page under Services. Further information about thisOnce the online version of the published article for which permission is being requested is located, click
can be obtained via RightsLink, a service of the Copyright Clearance Center, not the Editorial Office.Strokein Requests for permissions to reproduce figures, tables, or portions of articles originally publishedPermissions:
by guest on August 3, 2017
http://stroke.ahajournals.org/D
ownloaded from
1
ONLINE SUPPLEMENT
The role of pre-stroke vascular pathology in long-term prognosis after stroke
the Rotterdam Study
Marileen L.P. Portegies MD MSc1,2
, Michiel J. Bos MD PhD1, Albert Hofman MD PhD
1, Jan
Heeringa MD PhD1, Oscar H. Franco MD PhD
1, Peter J. Koudstaal MD PhD
2, M. Arfan Ikram
MD PhD1,2,3
Department of Epidemiology1, Neurology
2, and Radiology
3, Erasmus MC University Medical
Center, Rotterdam, the Netherlands
Corresponding author: M. Arfan Ikram, MD PhD
Department of Epidemiology, Erasmus MC University Medical Center,
PO Box 2040, 3000CA Rotterdam, the Netherlands
Tel: +31107043489 / Fax: +31107044657
E-mail address: [email protected]
Supplemental Appendix
Table I Cardiovascular risk factors and non-cardiovascular mortality after stroke. Page 2
Table II. Cardiovascular risk factors and risk of mortality after stroke, men. Page 3
Table III. Cardiovascular risk factors and risk of mortality after stroke, women. Page 4
Figure I. Cardiovascular and non-cardiovascular mortality rates. Page 5

2
Table I. Cardiovascular risk factors and non-cardiovascular mortality after stroke.
Risk of mortality Persons with stroke
n/N = 404/1237
Persons without stroke
n/N = 1848/4928
Risk factors Prevalence
(%)
HR (95% CI) PAR (95%CI) Prevalence
(%)
HR (95% CI) PAR (95%CI)
Hypertension 84.8%*
1.13 (0.84; 1.51) 0.10 (0.01; 0.63) 76.2%* 1.02 (0.91; 1.14) 0.01 (0.00; 0.85)
Cholesterol
Hypercholesterolemia 39.9% 0.80 (0.64; 0.98) NA 41.8% 1.00 (0.90; 1.09) NA
Treated 8.6% 0.54 (0.34; 0.86) 9.9% 0.78 (0.63; 0.96)
Low HDL cholesterol 18.5%*
1.12 (0.87; 1.45) 0.02 (0.00; 0.19) 15.9%* 1.14 (1.01; 1.28) 0.02 (0.01; 0.06)
BMI
<18.5 0.7% 2.18 (0.79; 6.03) NA 0.7% 0.67 (0.38; 1.19) NA
>=25 70.7% 0.86 (0.69; 1.07) 68.5% 0.89 (0.81; 0.98)
Underweight 0.7% 2.40 (0.88; 6.56) 0.01 (0.001; 0.03) 0.7% 0.72 (0.41; 1.27) NA
Diabetes mellitus 17.3%*
1.14 (0.87; 1.51) 0.02 (0.002; 0.15) 10.8%* 1.26 (1.09; 1.46) 0.02 (0.01; 0.05)
Smoking
Past 47.7% 1.14 (0.88; 1.48) 0.10 (0.02; 0.37) 49.1% 0.92 (0.82; 1.03) NA
Current 22.5%*
1.23 (0.90; 1.68) 14.4%* 1.32 (1.14; 1.54)
TIA 15.7%*
0.76 (0.57; 1.01) NA 8.3%* 1.04 (0.89; 1.22) 0.004 (0.00; 0.18)
Atrial fibrillation 16.8%*
1.02 (0.76; 1.36) 0.003 (0.00; 1.00) 10.1%* 1.16 (1.00; 1.33) 0.02 (0.01; 0.05)
Total 0.21 (0.05; 0.55) 0.07 (0.02; 0.22)
Abbreviations: n = number of deaths, N = number at risk; HR = hazard ratio; PAR = population attributable risk; HDL = high-density
lipoprotein; BMI = body mass index; TIA = transient ischemic attack; NA = not applicable because the HR is smaller than 1.
Values are hazard ratios (95% confidence intervals) or population attributable risks (95% confidence intervals).
Adjusted for age, sex, time between center visit and index date, and for the categories of hypertension, cholesterol, HDL cholesterol,
BMI, diabetes mellitus, smoking, and atrial fibrillation, if appropriate.
*Statistically different between persons with and without stroke (p<0.05).

3
Table II. Cardiovascular risk factors and risk of mortality after stroke, men.
Risk of mortality Men with stroke
n/N = 351/490
Men without stroke
n/N = 1003/1950
Risk factors Prevalence
(%)
HR (95% CI) PAR (95%CI) Prevalence
(%)
HR (95% CI) PAR (95%CI)
Hypertension 82.4%*
1.35 (0.99; 1.86) 0.22 (0.07; 0.52) 71.8%*†
1.10 (0.95; 1.28) 0.07 (0.01; 0.28)
Cholesterol
Hypercholesterolemia 26.9%†
0.69 (0.54; 0.88)*†
NA 29.4%†
1.00 (0.87; 1.15)*
NA
Treated 9.8% 0.53 (0.33; 0.83) 12.6%†
0.85 (0.67; 1.08)
Low HDL cholesterol 29.2%*†
0.90 (0.71; 1.14)*†
NA 24.7%*†
1.25 (1.09; 1.43)*
0.06 (0.03; 0.11)
BMI
<18.5 0.4%
1.57 (0.38; 6.43) NA 0.5%
0.50 (0.21; 1.22) NA
>=25 70.0% 0.81 (0.64; 1.02) 67.0% 0.94 (0.82; 1.08)
Underweight 0.4%
1.74 (0.43; 7.09) 0.002 (0.00; 0.06) 0.5%
0.51 (0.21; 1.25) NA
Diabetes mellitus 17.3%*
1.31 (0.99; 1.75) 0.04 (0.01; 0.13) 10.5%*
1.41 (1.16; 1.72) 0.03 (0.02; 0.06)
Smoking
Past 64.5%*†
0.92 (0.57; 1.50)
NA 69.6%*†
1.38 (1.09; 1.76)†
0.31 (0.18; 0.48)
Current 30.2%*†
1.17 (0.71; 1.93) 20.4%*†
1.99 (1.53; 2.60)†
TIA 16.7%*
1.10 (0.83; 1.46) 0.02 (0.00; 0.27) 7.3%*
0.89 (0.70; 1.12) NA
Atrial fibrillation 15.3%*
1.72 (1.30; 2.28)*
0.07 (0.04; 0.13) 11.0%*
1.16 (0.96; 1.39)*
0.02 (0.00; 0.07)
Total 0.29 (0.13; 0.53) 0.42 (0.29; 0.57)
Abbreviations: n = number of deaths, N = number at risk; HR = hazard ratio; PAR = population attributable risk; HDL = high-density
lipoprotein; BMI = body mass index; TIA = transient ischemic attack; NA = not applicable because the HR is smaller than 1.
Values are hazard ratios (95% confidence intervals) or population attributable risks (95% confidence intervals).
Adjusted for age, sex, time between center visit and index date, and for the categories of hypertension, cholesterol, HDL cholesterol,
BMI, diabetes mellitus, smoking, and atrial fibrillation, if appropriate.
*Statistically different between persons with and without stroke (p<0.05).
†Statistically different between men and women (p<0.05).

4
Table III. Cardiovascular risk factors and risk of mortality after stroke, women.
Risk of mortality Women with stroke
n/N = 568/747
Women without stroke
n/N = 1651/2978
Risk factors Prevalence
(%)
HR (95% CI) PAR (95%CI) Prevalence
(%)
HR (95% CI) PAR (95%CI)
Hypertension 86.3%*
0.89 (0.69; 1.15) NA 79.0%*†
1.07 (0.94; 1.21) 0.05 (0.01; 0.29)
Cholesterol
Hypercholesterolemia 48.3%†
1.04 (0.87; 1.24)†
NA 50.0%†
1.04 (0.94; 1.15) 0.01 (0.00; 0.84)
Treated 7.9% 0.69 (0.46; 1.03) 8.1%† 0.80 (0.63; 1.02)
Low HDL cholesterol 11.5%†
1.55 (1.20; 1.99)*†
0.05 (0.02; 0.09) 10.1%†
1.10 (0.95; 1.27)*
0.01 (0.00; 0.06)
BMI
<18.5 0.9% 1.92 (0.86; 4.26) NA 0.9% 0.86 (0.48; 1.52) NA
>=25 71.2% 0.84 (0.70; 1.01) 69.5% 0.95 (0.86; 1.06)
Underweight 0.9% 2.17 (0.99; 4.77)
0.01 (0.00; 0.03) 0.9% 0.89 (0.50; 1.57)
NA
Diabetes mellitus 17.3%*
1.69 (1.36; 2.11)
0.08 (0.05; 0.13) 11.0%*
1.31 (1.13; 1.53)
0.03 (0.02; 0.05)
Smoking
Past 36.7%† 1.21 (1.00; 1.45) 0.11 (0.06; 0.22) 35.7%† 0.98 (0.88; 1.09)†
0.01 (0.00; 0.19)
Current 17.4%*†
1.48 (1.13; 1.92) 10.4%*†
1.29 (1.08; 1.53)†
TIA 15.0%*
0.84 (0.66; 1.06) NA 8.9%*
1.05 (0.89; 1.24) 0.00 (0.00; 0.13)
Atrial fibrillation 17.8%*
1.32 (1.07; 1.63) 0.05 (0.02; 0.10) 9.5%*
1.36 (1.18; 1.58) 0.03 (0.02; 0.06)
Total 0.25 (0.18; 0.34) 0.14 (0.06; 0.29)
Abbreviations: n = number of deaths, N = number at risk; HR = hazard ratio; PAR = population attributable risk; HDL = high-density
lipoprotein; BMI = body mass index; TIA = transient ischemic attack; NA = not applicable because the HR is smaller than 1.
Values are hazard ratios (95% confidence intervals) or population attributable risks (95% confidence intervals).
Adjusted for age, sex, time between center visit and index date, and for the categories of hypertension, cholesterol, HDL cholesterol,
BMI, diabetes mellitus, smoking, and atrial fibrillation, if appropriate.
*Statistically different between persons with and without stroke (p<0.05).
†Statistically different between men and women (p<0.05).
5
Figure I. Cardiovascular and non-cardiovascular mortality rates.
Age- and sex adjusted cardiovascular mortality rates (left) and non-cardiovascular mortality rates (right).