Embed Size (px)
Citation preview
Role of plankton in the cycling of trace elements & isotopes
Ben TwiningBigelow Laboratory for Ocean Sciences
GEOTRACES Data-ModelSynthesis WorkshopNovember 15, 2011
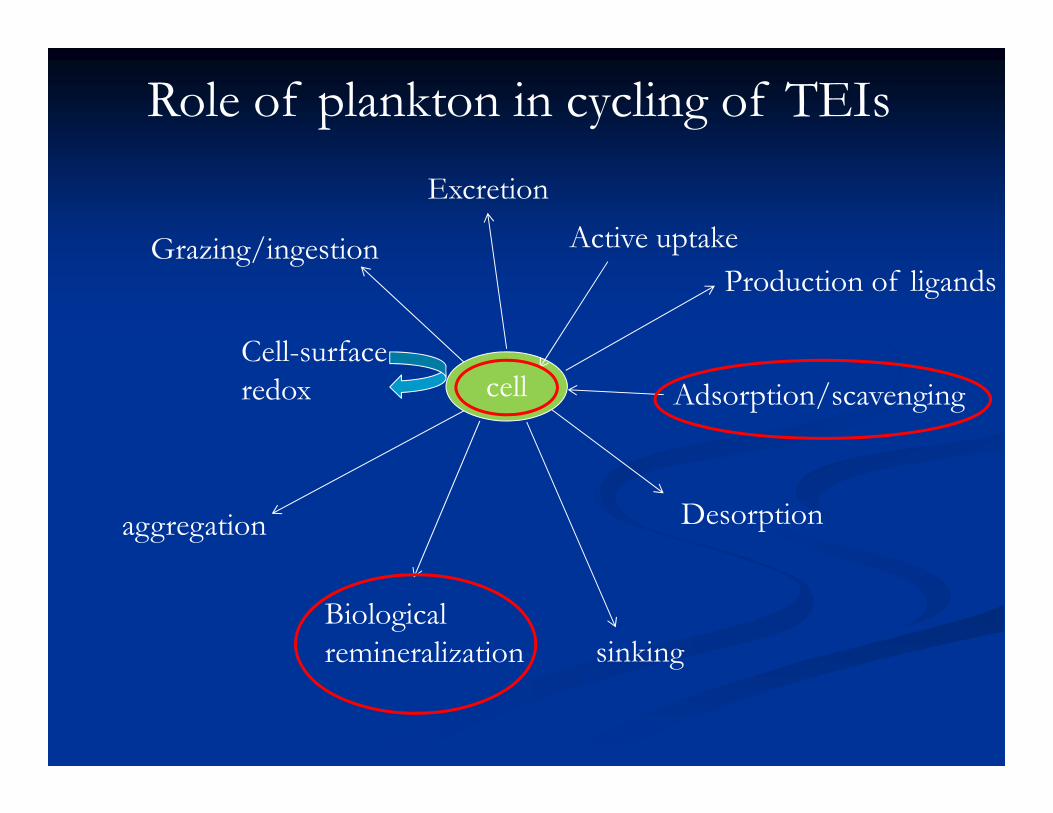
cell
Active uptake
Adsorption/scavenging
Grazing/ingestion
aggregation
sinking
Role of plankton in cycling of TEIs
Desorption
Biologicalremineralization
Cell-surfaceredox
Production of ligands
Excretion
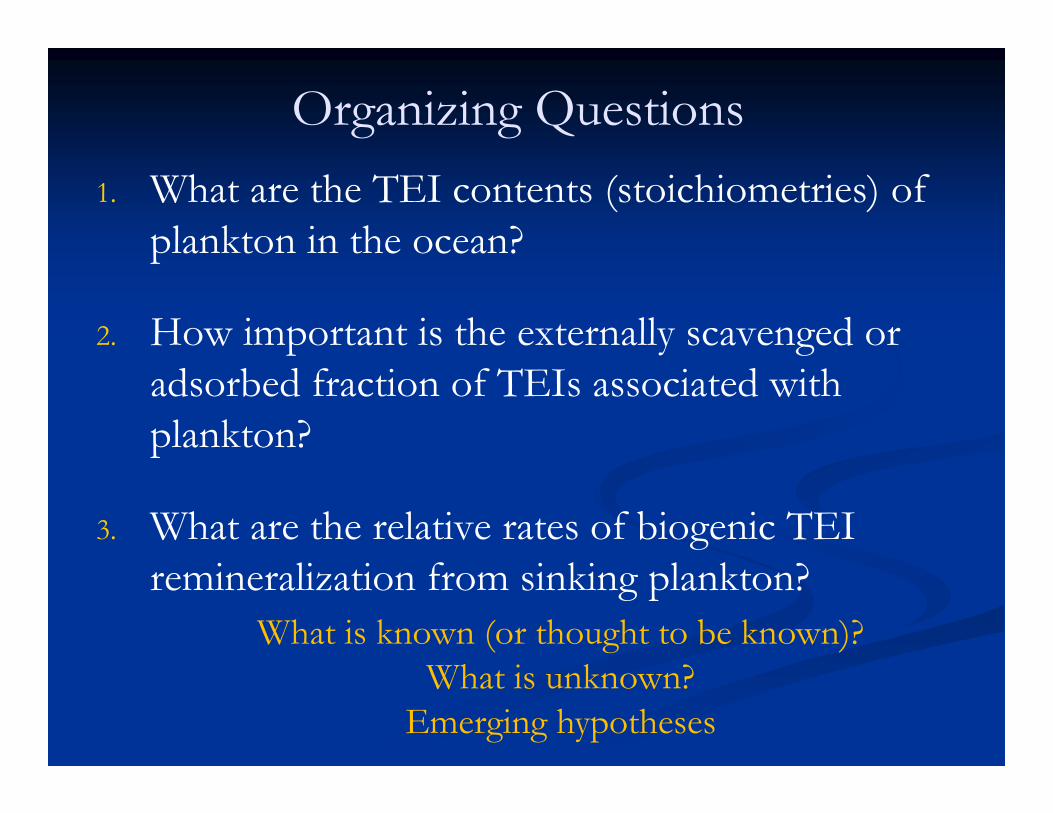
Organizing Questions1. What are the TEI contents (stoichiometries) of
plankton in the ocean?
2. How important is the externally scavenged or adsorbed fraction of TEIs associated with plankton?
3. What are the relative rates of biogenic TEI remineralization from sinking plankton?
What is known (or thought to be known)?What is unknown?
Emerging hypotheses

1. TEI content of plankton in the ocean Importance: TEI cycling, micronutrient limitation Challenge: how to isolate plankton from
abiotic/lithogenic particles?
(Cullen & Sherrell, 1999)(Kuss & Kremling 1999)
(Ho e al. 2007)
(Collier & Edmond 1984)
(Twining et al. 2003)
Single-cell x-ray (SXRF) fluorescence
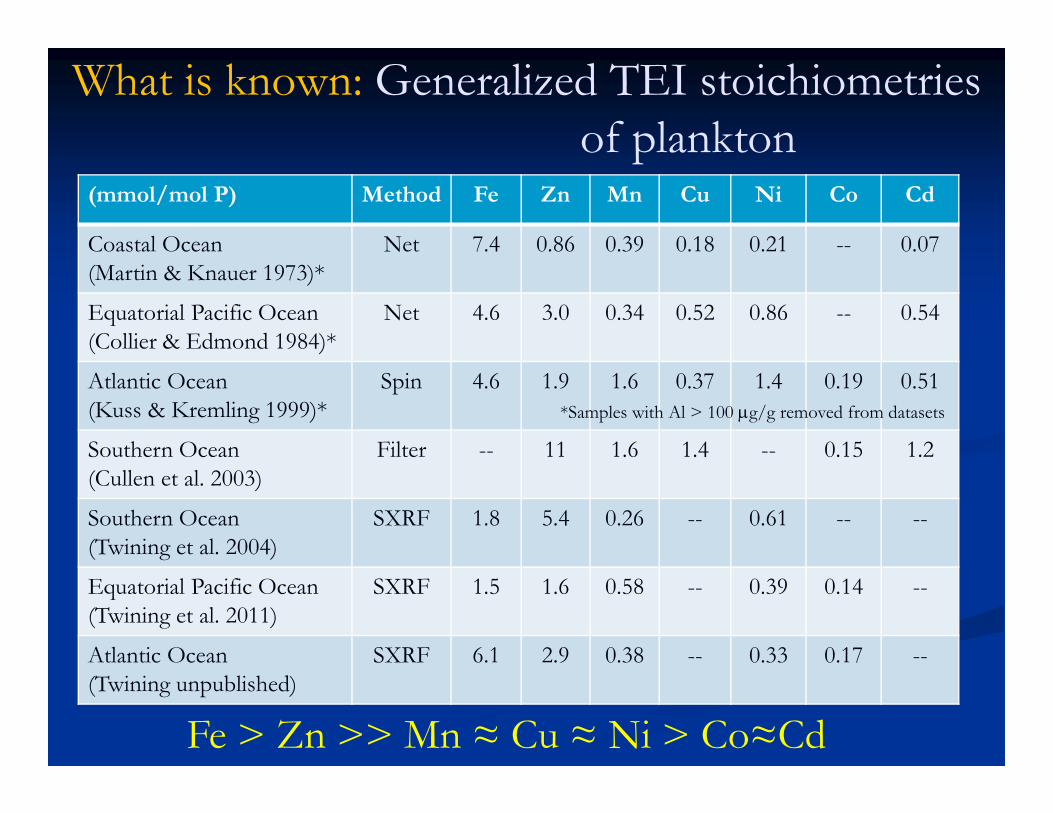
What is known: Generalized TEI stoichiometries of plankton
(mmol/mol P) Method Fe Zn Mn Cu Ni Co Cd
Coastal Ocean(Martin & Knauer 1973)*
Net 7.4 0.86 0.39 0.18 0.21 -- 0.07
Equatorial Pacific Ocean(Collier & Edmond 1984)*
Net 4.6 3.0 0.34 0.52 0.86 -- 0.54
Atlantic Ocean(Kuss & Kremling 1999)*
Spin 4.6 1.9 1.6 0.37 1.4 0.19 0.51
Southern Ocean(Cullen et al. 2003)
Filter -- 11 1.6 1.4 -- 0.15 1.2
Southern Ocean(Twining et al. 2004)
SXRF 1.8 5.4 0.26 -- 0.61 -- --
Equatorial Pacific Ocean(Twining et al. 2011)
SXRF 1.5 1.6 0.58 -- 0.39 0.14 --
Atlantic Ocean(Twining unpublished)
SXRF 6.1 2.9 0.38 -- 0.33 0.17 --
*Samples with Al > 100 g/g removed from datasets
Fe > Zn >> Mn ≈ Cu ≈ Ni > Co≈Cd
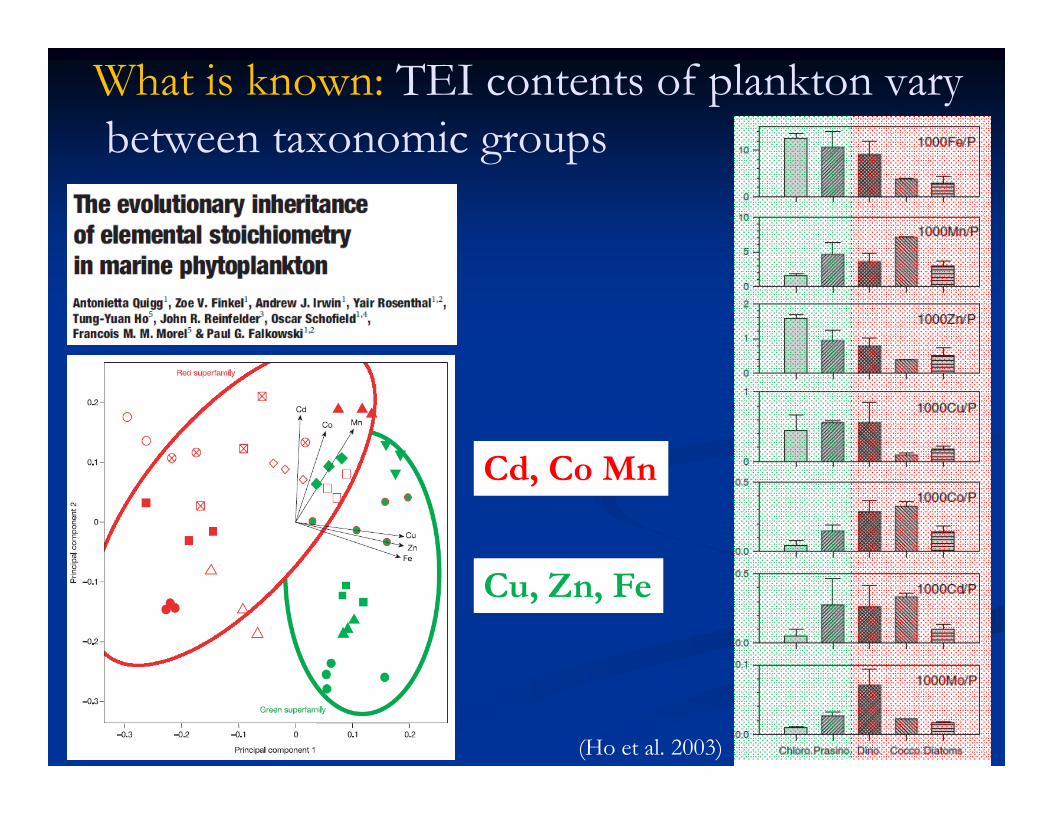
What is known: TEI contents of plankton vary between taxonomic groups
(Ho et al. 2003)
Cd, Co Mn
Cu, Zn, Fe

Mn Fe Co Ni Zn
mm
ol:m
ol P
0
1
2
3
4
5
6
7
8EEP SXRFEEP ICP-MSSOFeXBruland et al.Kuss and KremlingHo, Quigg et al.
• Choice of media composition significantly influences results:• High Mn in media high Mn and low Zn in cells• High Fe in media high Fe in cells
(Twining et al. 2011)
What is unknown: How applicable are TEI stoichiometries from cultures to the ocean?
Factors affecting TEIs• Taxonomy• Effects of light• Dissolved TEI
concentration and speciation
• Macronutrient availability
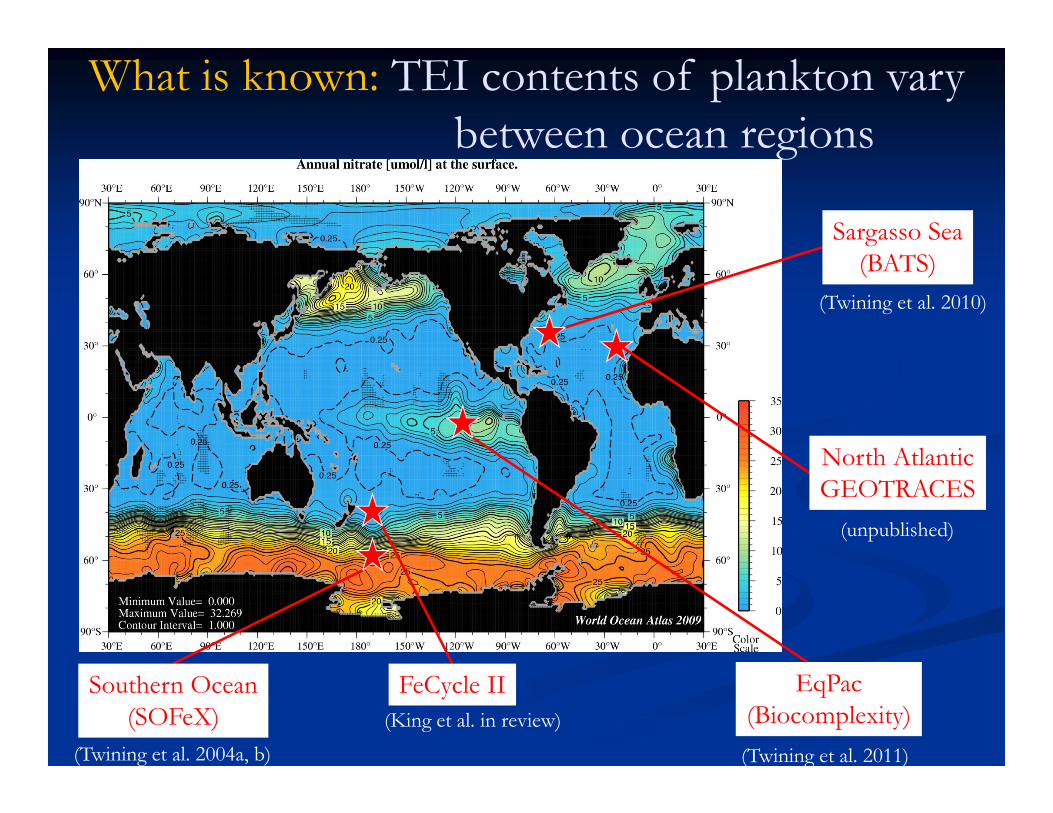
Sargasso Sea(BATS)
North AtlanticGEOTRACES
EqPac(Biocomplexity)
FeCycle IISouthern Ocean(SOFeX)
(Twining et al. 2010)
(unpublished)
(Twining et al. 2011)
(King et al. in review)(Twining et al. 2004a, b)
What is known: TEI contents of plankton vary between ocean regions
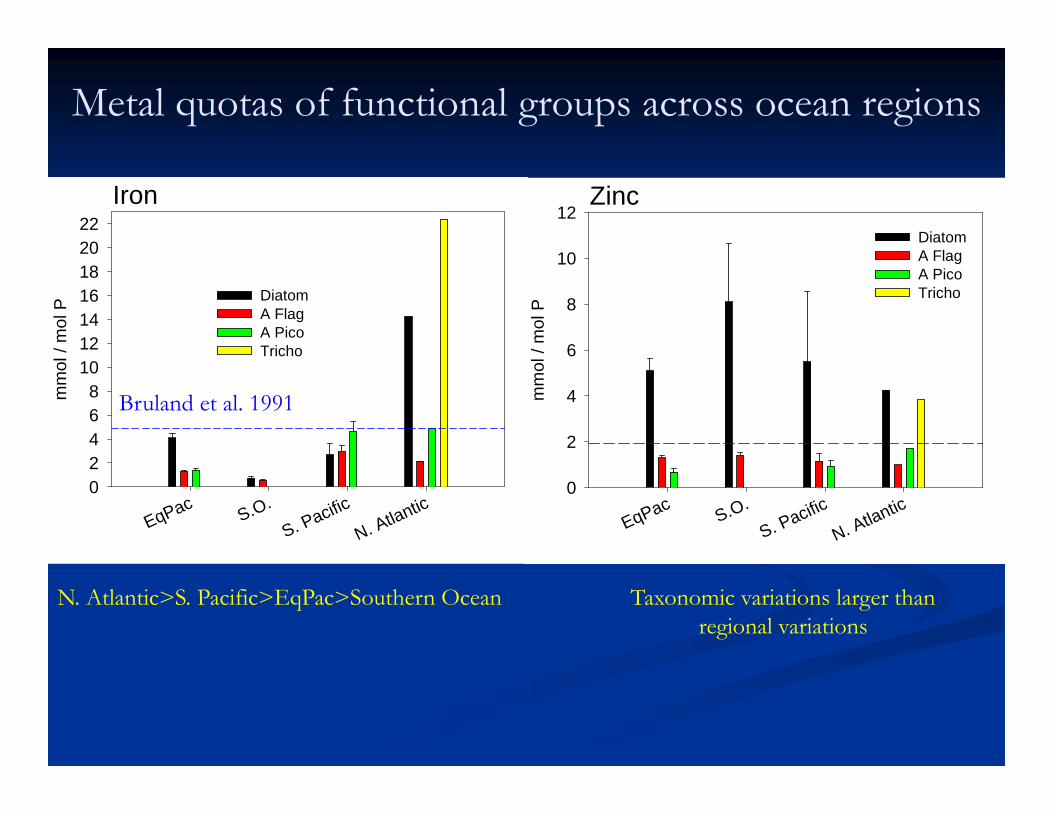
Iron
EqPac S.O.S. Pacific
N. Atlantic
mm
ol /
mol
P
02468
10121416182022
Diatom A Flag A Pico Tricho
Metal quotas of functional groups across ocean regions
N. Atlantic>S. Pacific>EqPac>Southern Ocean
Bruland et al. 1991
Zinc
EqPac S.O.S. Pacific
N. Atlantic
mm
ol /
mol
P
0
2
4
6
8
10
12Diatom A Flag A Pico Tricho
Taxonomic variations larger than regional variations
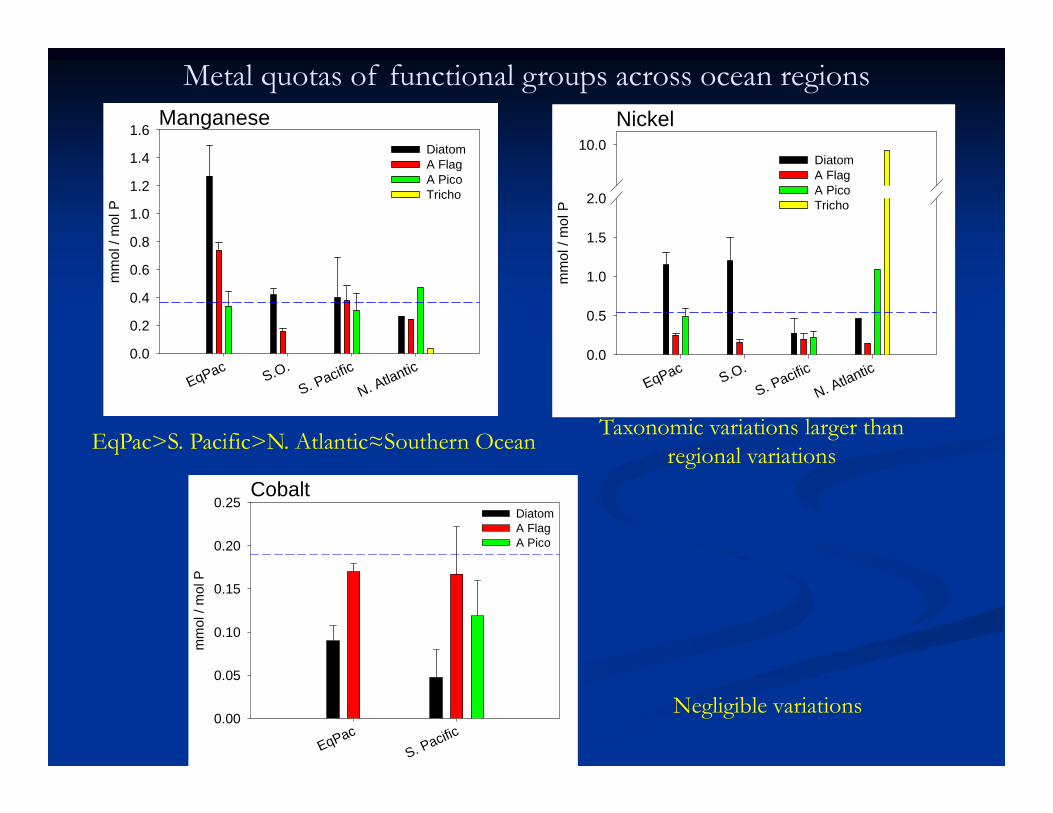
Metal quotas of functional groups across ocean regionsManganese
EqPac S.O.S. Pacific
N. Atlantic
mm
ol /
mol
P
0.0
0.2
0.4
0.6
0.8
1.0
1.2
1.4
1.6Diatom A Flag A Pico Tricho
EqPac>S. Pacific>N. Atlantic≈Southern Ocean
Nickel
EqPac S.O.S. Pacific
N. Atlantic
mm
ol /
mol
P
0.0
0.5
1.0
1.5
2.0
10.0Diatom A Flag A Pico Tricho
Taxonomic variations larger than regional variations
Cobalt
EqPacS. Pacific
mm
ol /
mol
P
0.00
0.05
0.10
0.15
0.20
0.25Diatom A Flag A Pico
Negligible variations
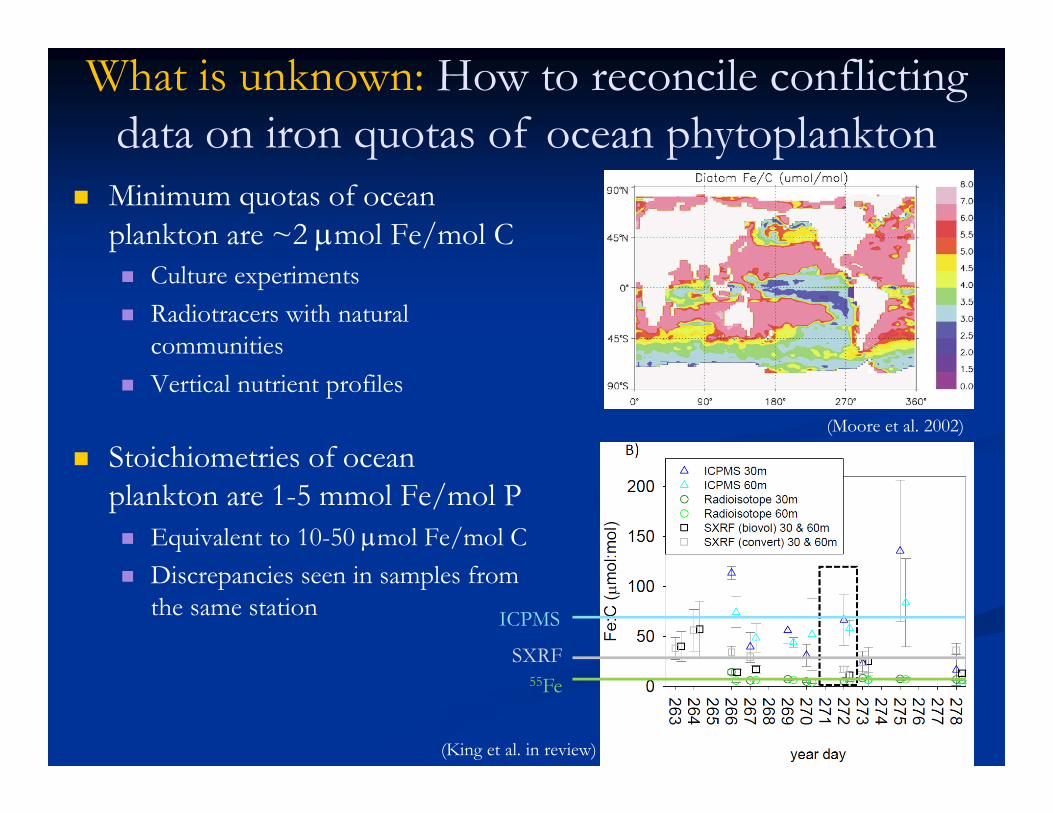
Minimum quotas of ocean plankton are ~2 mol Fe/mol C Culture experiments Radiotracers with natural
communities Vertical nutrient profiles
What is unknown: How to reconcile conflicting data on iron quotas of ocean phytoplankton
(Moore et al. 2002)
(King et al. in review)
ICPMS
SXRF55Fe
Stoichiometries of ocean plankton are 1-5 mmol Fe/mol P Equivalent to 10-50 mol Fe/mol C Discrepancies seen in samples from
the same station
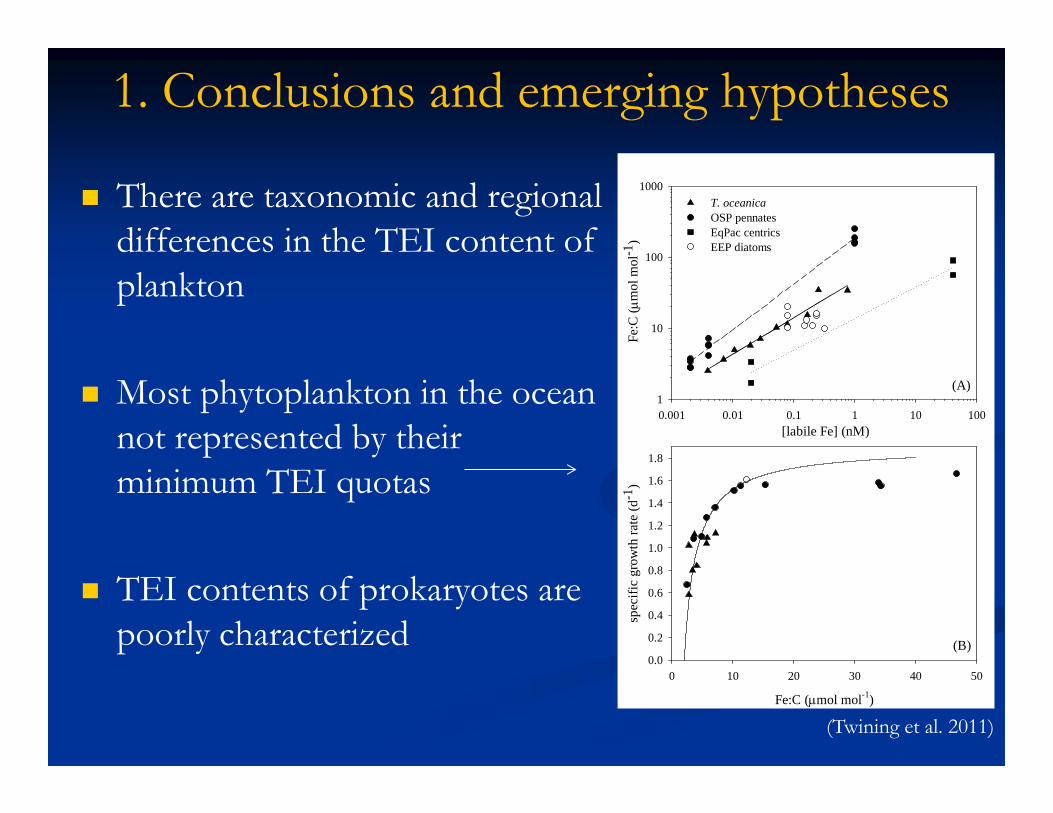
1. Conclusions and emerging hypotheses
There are taxonomic and regional differences in the TEI content of plankton
Most phytoplankton in the ocean not represented by their minimum TEI quotas
TEI contents of prokaryotes are poorly characterized
Fe:C (mol mol-1)
0 10 20 30 40 50
spec
ific
grow
th ra
te (d
-1)
0.0
0.2
0.4
0.6
0.8
1.0
1.2
1.4
1.6
1.8
[labile Fe] (nM)0.001 0.01 0.1 1 10 100
Fe:C
( m
ol m
ol-1
)
1
10
100
1000T. oceanicaOSP pennatesEqPac centricsEEP diatoms
(A)
(B)
(Twining et al. 2011)
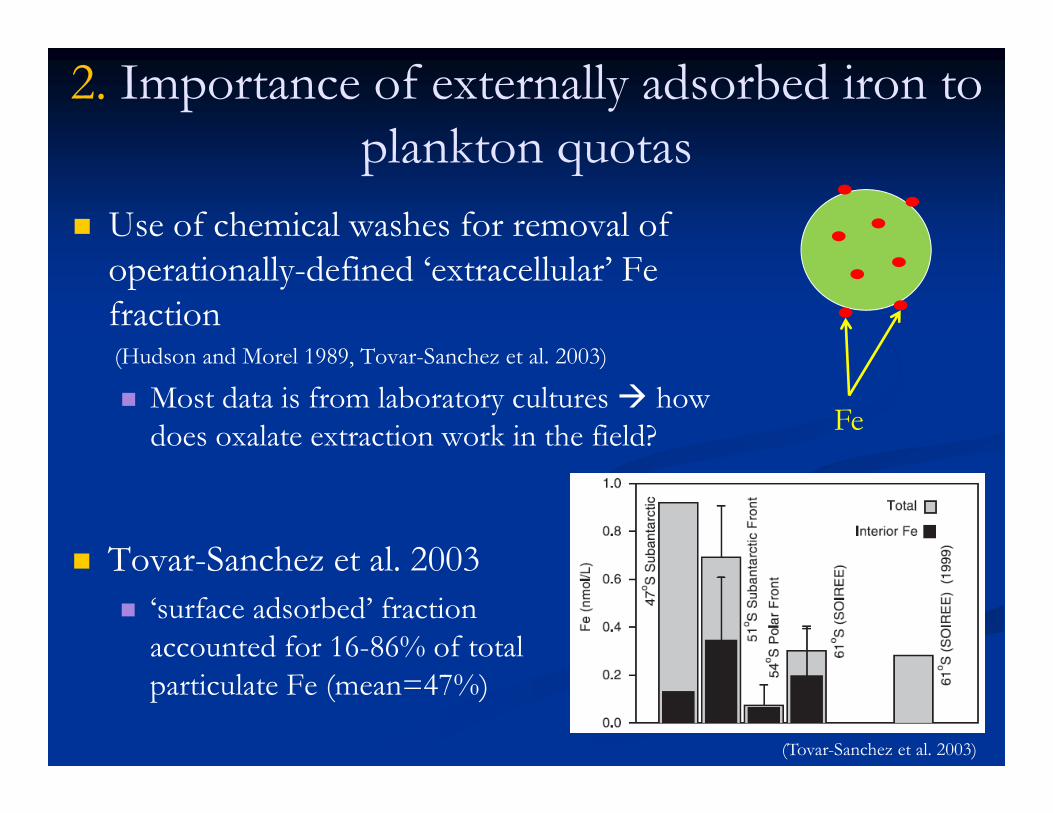
2. Importance of externally adsorbed iron to plankton quotas
Use of chemical washes for removal of operationally-defined ‘extracellular’ Fe fraction (Hudson and Morel 1989, Tovar-Sanchez et al. 2003)
Most data is from laboratory cultures how does oxalate extraction work in the field? Fe
Tovar-Sanchez et al. 2003 ‘surface adsorbed’ fraction
accounted for 16-86% of total particulate Fe (mean=47%)
(Tovar-Sanchez et al. 2003)
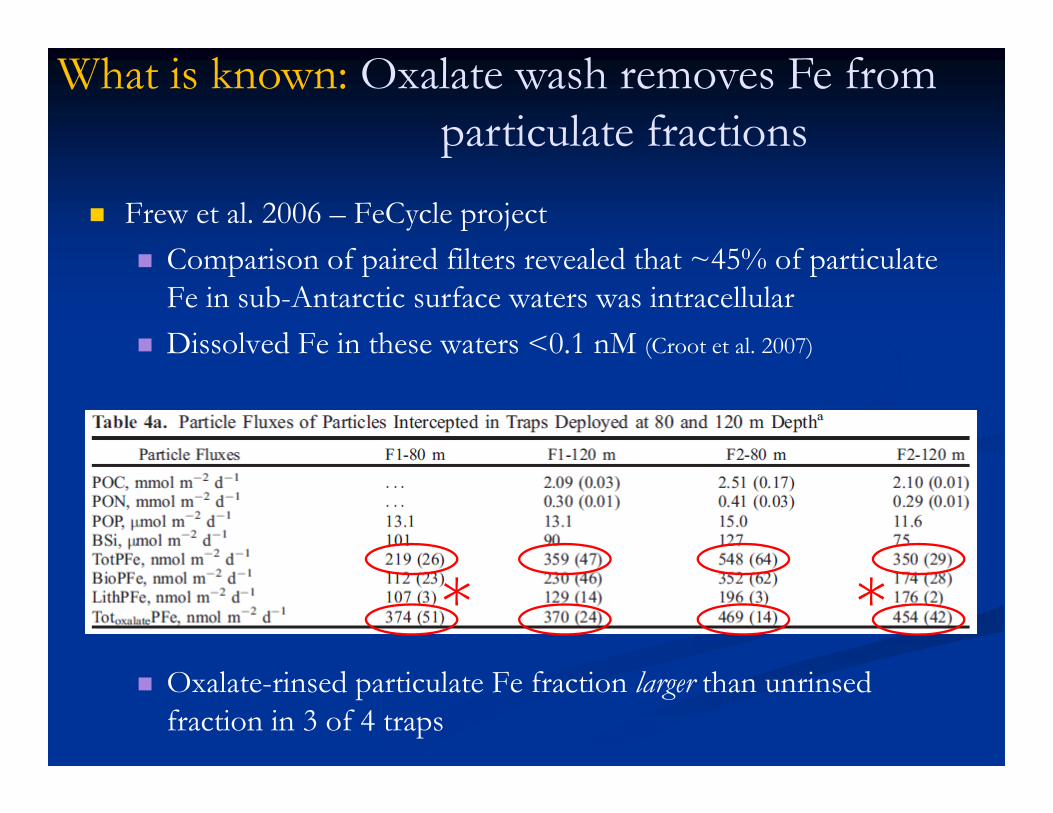
Frew et al. 2006 – FeCycle project Comparison of paired filters revealed that ~45% of particulate
Fe in sub-Antarctic surface waters was intracellular Dissolved Fe in these waters <0.1 nM (Croot et al. 2007)
Oxalate-rinsed particulate Fe fraction larger than unrinsedfraction in 3 of 4 traps
What is known: Oxalate wash removes Fe from particulate fractions
* *
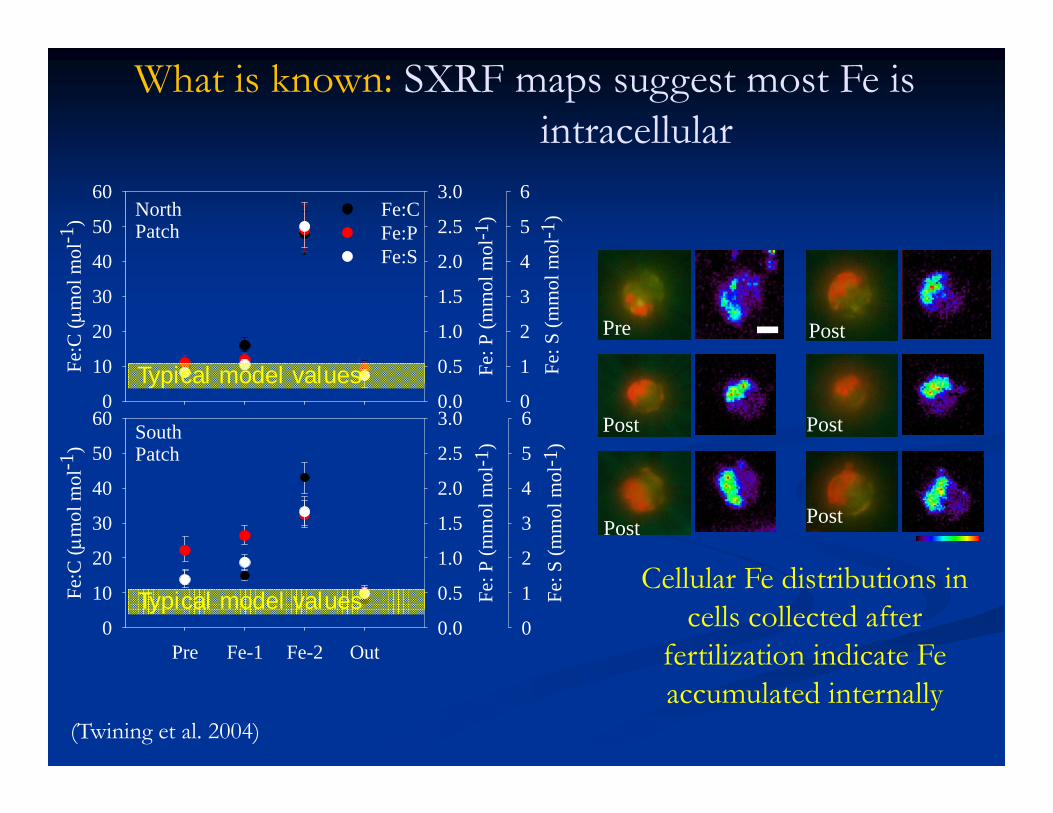
What is known: SXRF maps suggest most Fe is intracellular
SouthPatch
Pre Fe-1 Fe-2 Out
Fe:C
(m
ol m
ol-1
)
0
10
20
30
40
50
60
Fe: P
(mm
ol m
ol-1
)
0.0
0.5
1.0
1.5
2.0
2.5
3.0
Fe: S
(mm
ol m
ol-1
)
0
1
2
3
4
5
6
NorthPatch
Fe:C
(m
ol m
ol-1
)
0
10
20
30
40
50
60
Fe: P
(mm
ol m
ol-1
)
0.0
0.5
1.0
1.5
2.0
2.5
3.0
Fe: S
(mm
ol m
ol-1
)
0
1
2
3
4
5
6Fe:CFe:PFe:S
Typical model values
Typical model values
Pre Post
Post
Post Post
Post
Cellular Fe distributions in cells collected after
fertilization indicate Fe accumulated internally
(Twining et al. 2004)
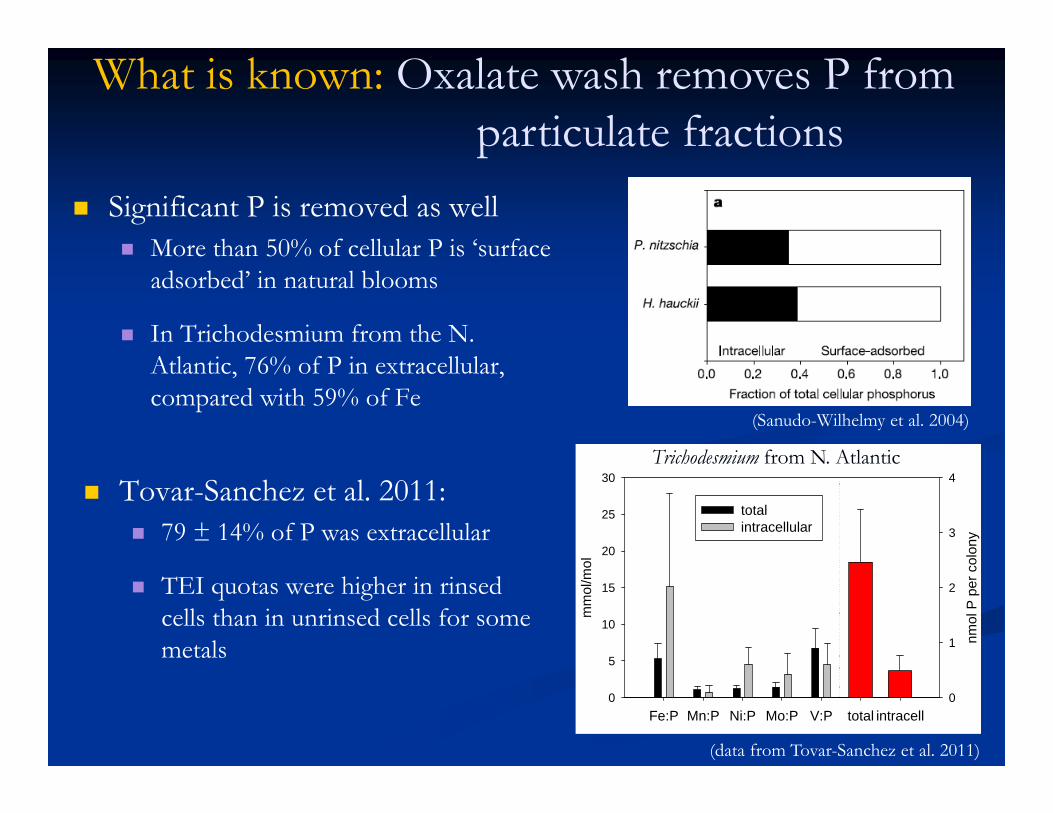
What is known: Oxalate wash removes P from particulate fractions
Significant P is removed as well More than 50% of cellular P is ‘surface
adsorbed’ in natural blooms
In Trichodesmium from the N. Atlantic, 76% of P in extracellular, compared with 59% of Fe
(Sanudo-Wilhelmy et al. 2004)
Fe:P Mn:P Ni:P Mo:P V:P total intracell
mm
ol/m
ol
0
5
10
15
20
25
30
nmol
P p
er c
olon
y
0
1
2
3
4
total intracellular
Trichodesmium from N. Atlantic
Tovar-Sanchez et al. 2011: 79 ± 14% of P was extracellular
TEI quotas were higher in rinsed cells than in unrinsed cells for some metals
(data from Tovar-Sanchez et al. 2011)
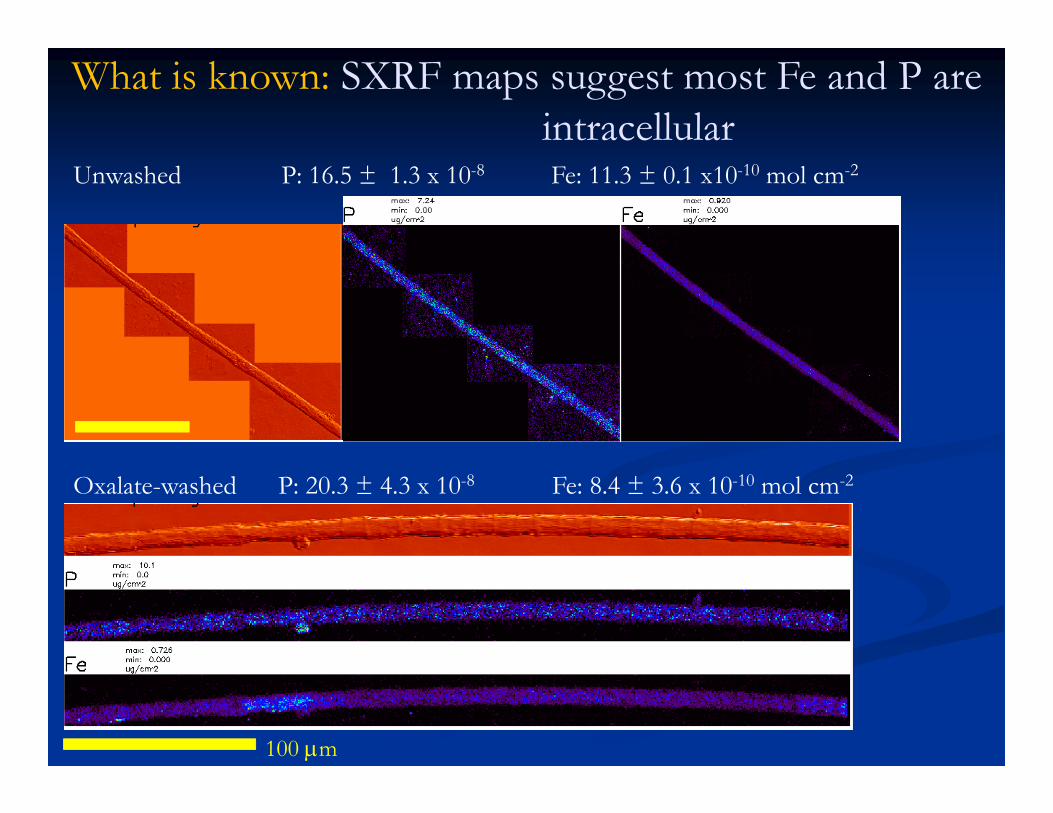
Oxalate-washed P: 20.3 ± 4.3 x 10⁻⁸ Fe: 8.4 ± 3.6 x 10⁻¹⁰ mol cm-2
Unwashed P: 16.5 ± 1.3 x 10⁻⁸ Fe: 11.3 ± 0.1 x10⁻¹⁰ mol cm-2
100 m
What is known: SXRF maps suggest most Fe and P are intracellular
2. Conclusions and emerging hypotheses
There are contradictory data regarding the cellular partitioning of Fe (and P) in plankton
The quantitative importance and chemical form of extracellular Fe requires more study Does extracellular fraction vary between ocean regions? How exchangeable is extracellular fraction?
Is the partitioning of extracellular Fe dependent upon DFe and ligand concentrations?
Unknown importance of frustule fraction
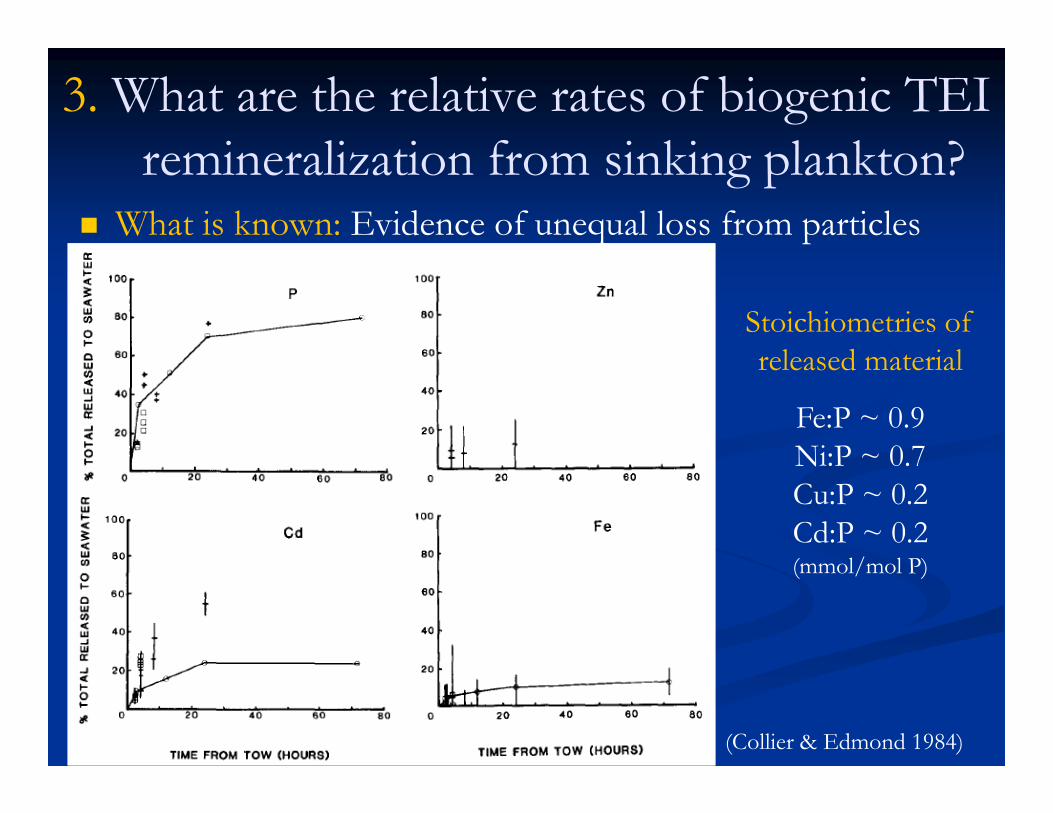
3. What are the relative rates of biogenic TEI remineralization from sinking plankton?
What is known: Evidence of unequal loss from particles
(Collier & Edmond 1984)
Stoichiometries of released material
Fe:P ~ 0.9Ni:P ~ 0.7Cu:P ~ 0.2Cd:P ~ 0.2(mmol/mol P)
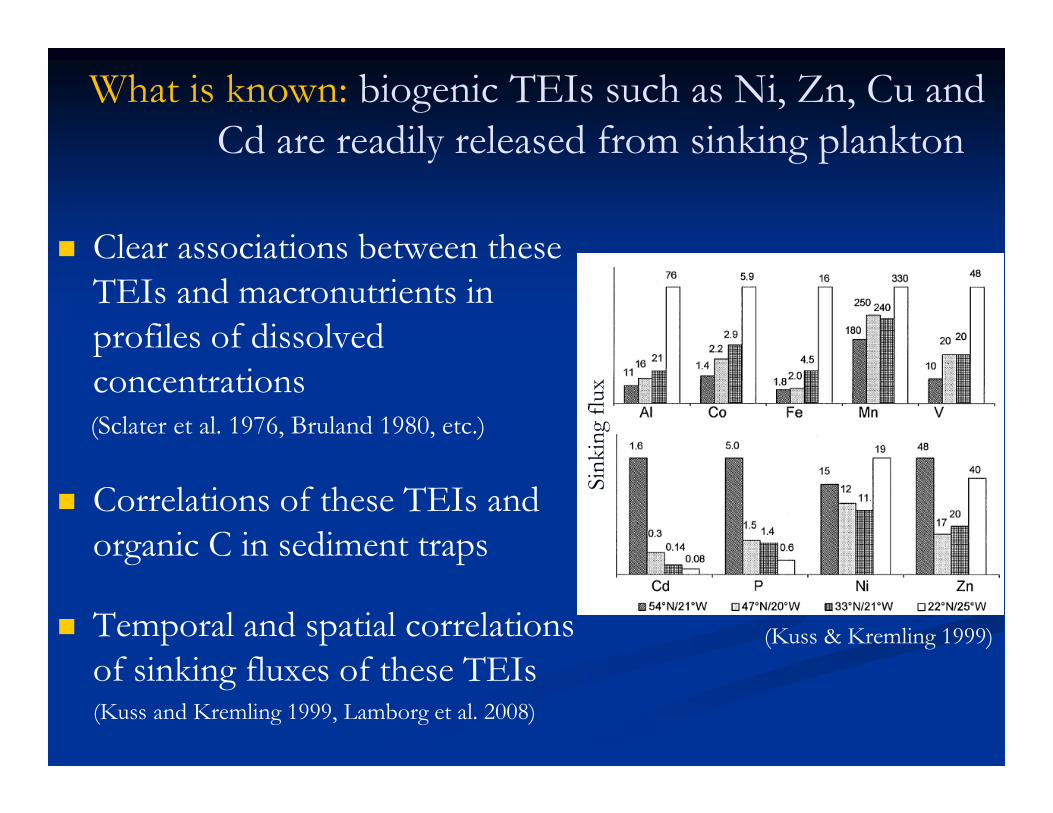
What is known: biogenic TEIs such as Ni, Zn, Cu and Cd are readily released from sinking plankton
Clear associations between these TEIs and macronutrients in profiles of dissolved concentrations(Sclater et al. 1976, Bruland 1980, etc.)
Correlations of these TEIs and organic C in sediment traps
Temporal and spatial correlations of sinking fluxes of these TEIs(Kuss and Kremling 1999, Lamborg et al. 2008)
(Kuss & Kremling 1999)
Sink
ing
flux
(Lamborg et al. 2008)
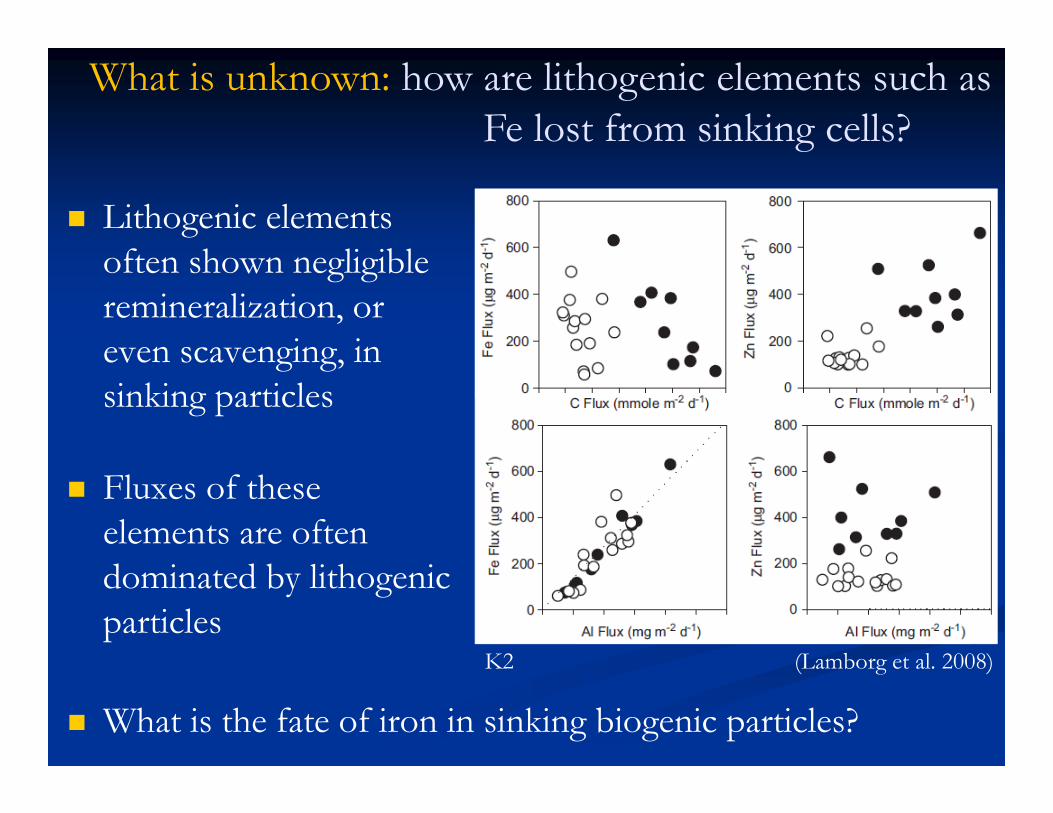
What is unknown: how are lithogenic elements such as Fe lost from sinking cells?
Lithogenic elements often shown negligible remineralization, or even scavenging, in sinking particles
Fluxes of these elements are often dominated by lithogenic particles
K2
What is the fate of iron in sinking biogenic particles?
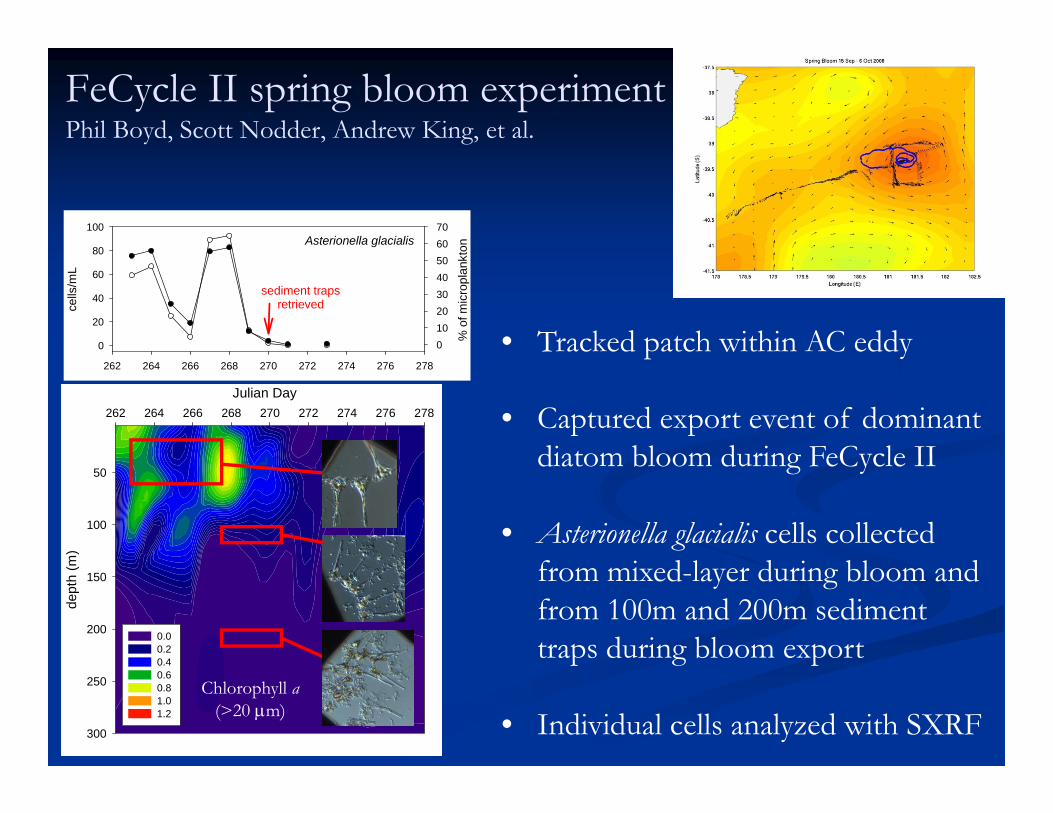
FeCycle II spring bloom experimentPhil Boyd, Scott Nodder, Andrew King, et al.
262 264 266 268 270 272 274 276 278
dept
h (m
)
50
100
150
200
250
300
0.0 0.2 0.4 0.6 0.8 1.0 1.2
Julian Day
A
B
Chlorophyll a(>20 m)
Asterionella glacialis
262 264 266 268 270 272 274 276 278
cells
/mL
0
20
40
60
80
100
% o
f mic
ropl
ankt
on
010203040506070
sediment trapsretrieved
A
• Tracked patch within AC eddy
• Captured export event of dominant diatom bloom during FeCycle II
• Asterionella glacialis cells collected from mixed-layer during bloom and from 100m and 200m sediment traps during bloom export
• Individual cells analyzed with SXRF
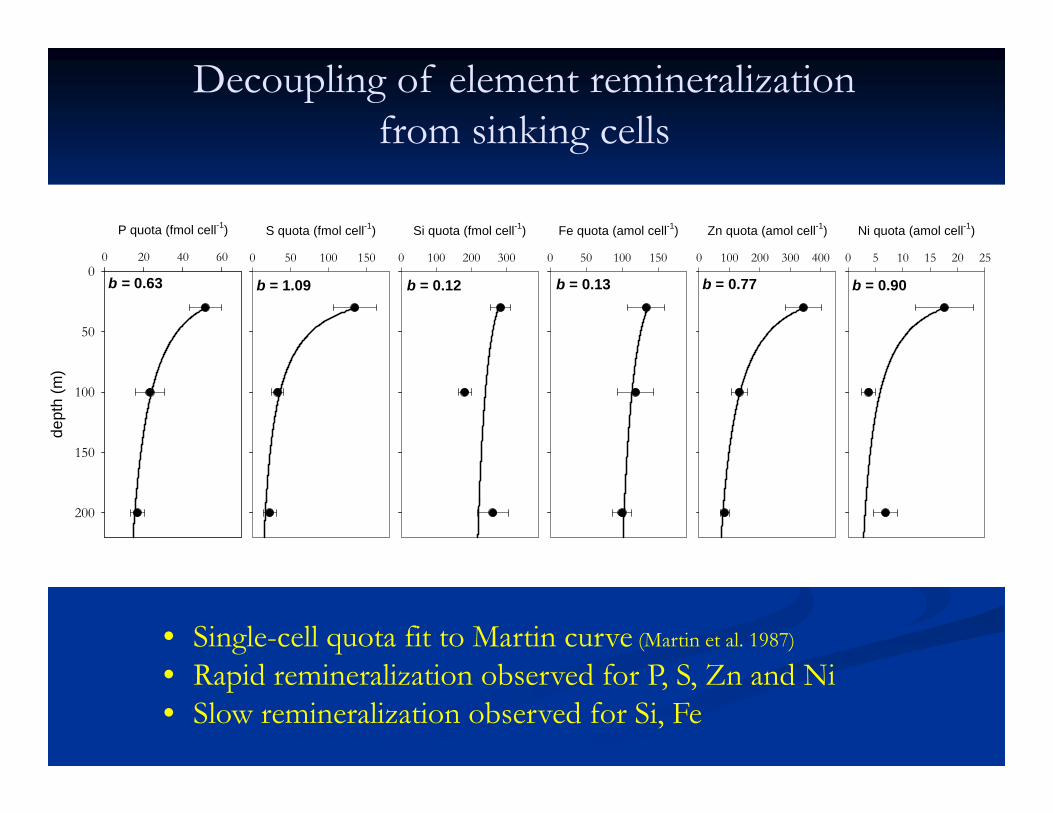
Decoupling of element remineralization from sinking cells
• Single-cell quota fit to Martin curve (Martin et al. 1987)
• Rapid remineralization observed for P, S, Zn and Ni• Slow remineralization observed for Si, Fe
P quota (fmol cell-1)
0 20 40 60
dept
h (m
)
0
50
100
150
200
Fe quota (amol cell-1)
0 50 100 150
S quota (fmol cell-1)
0 50 100 150
Zn quota (amol cell-1)
0 100 200 300 400
b = 0.63 b = 0.13 b = 0.77b = 1.09
Si quota (fmol cell-1)
0 100 200 300
b = 0.12
Ni quota (amol cell-1)
0 5 10 15 20 25
b = 0.90
Fe (
g/cm
2 )
0.000
0.005
0.010
0.015
0.020
0.025
0.030
S (g/cm2)
0 1 2 3 4 5 6
Fe (
g/cm
2 )
0.000
0.005
0.010
0.015
0.020
0.025
0.030r2 = 0.23
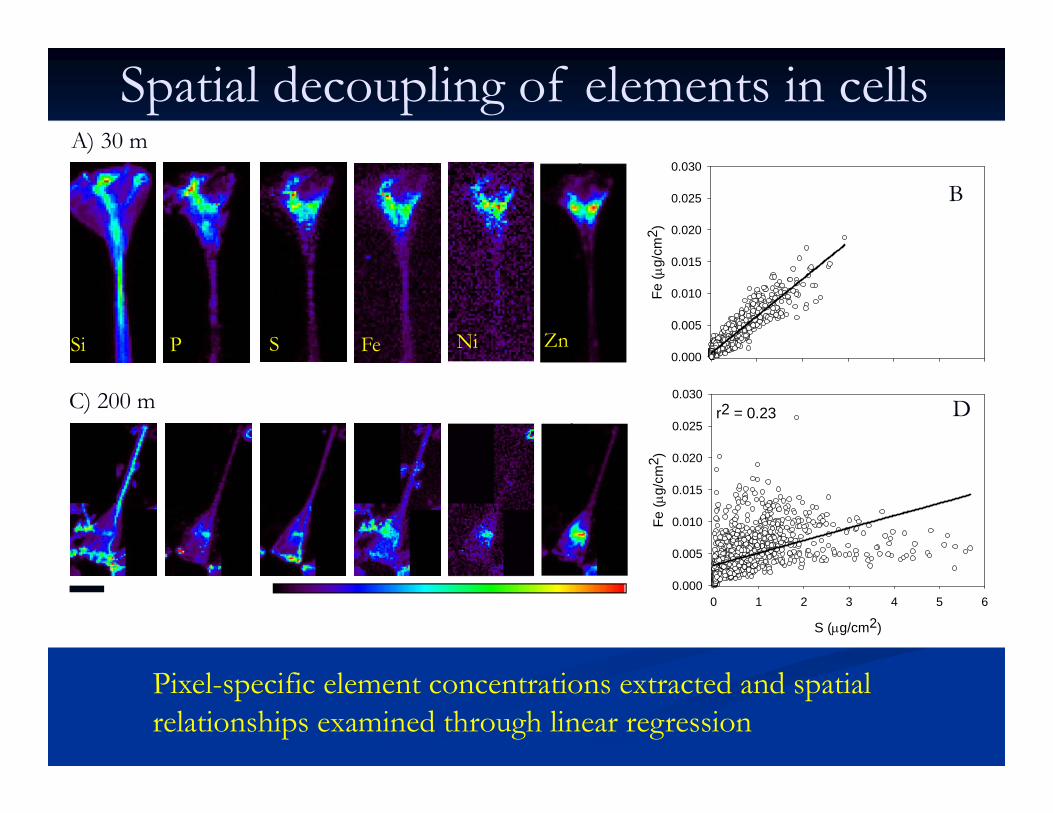
A) 30 m
ZnFePSi S Ni
B
DC) 200 m
Spatial decoupling of elements in cells
Pixel-specific element concentrations extracted and spatial relationships examined through linear regression
Metal / Si
Metal / S
Metal / P
coefficient of determination (r2)
0.0 0.2 0.4 0.6 0.8
FeZnNiFeZnNiFeZnNi
surface
100m
200m
FeZnNiFeZnNiFeZnNi
surface
100m
200m
FeZnNiFeZnNiFeZnNi
surface
100m
200m
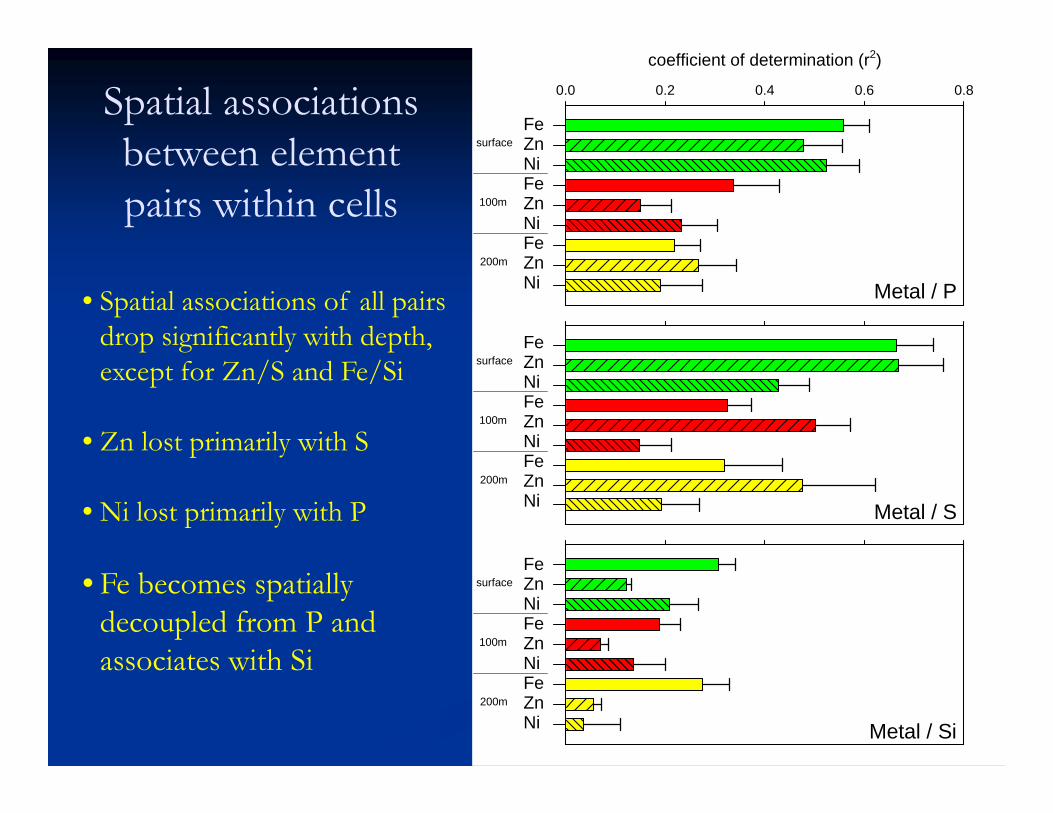
Spatial associations between element pairs within cells
• Spatial associations of all pairs drop significantly with depth, except for Zn/S and Fe/Si
• Zn lost primarily with S
• Ni lost primarily with P
• Fe becomes spatially decoupled from P and associates with Si
3. Conclusions and emerging hypotheses Biogenic material appears to dominate fluxes of certain
TEIs (Cd, Zn, Cu, Ni) in some settings
Most of these biogenic TEIs (e.g, Cd, Zn, Cu, Ni) are also lost rapidly from sinking cells
Iron is lost more slowly from cells and appears to be re-scavenged onto cell surfaces (e.g., diatom frustules)
The TEI content and fate of other sinking biogenic materials (e.g., fecal pellets) is poorly constrained
AcknowledgementsSynchrotron analyses Stefan Vogt, Stephen Baines
Field samplingMike Landry, Pete Sedwick, Dave Nelson, Phil Boyd, Sara Rauschenberg
Trichodesmium Sediment trapsJochen Nuester, Adam Kustka Scott Nodder, Andrew King
FundingNational Science Foundation
Department of Energy