Embed Size (px)
Citation preview

Role of HFR1 in Shade Avoidance
and Phytochrome A Signaling
By Serdar Abidin Gurses
A Thesis submitted to the Faculty of the
Worcester Polytechnic Institute
In partial fulfillment of the requirements for the
Degree of Master of Science
In
Biochemistry
By
_______________________________
January 14, 2004
Approved: _______________________________ Dr. Craig D. Fairchild, Advisor _______________________________ Dr. James P. Dittami, Department Head

1
TABLE OF CONTENTS TABLE OF CONTENTS………..………………………………………………1 ABSTRACT…………...…………………………………………….………...3 INTRODUCTION…...………………………………………………………..4 DETECTION OF LIGHT IN PLANTS……………………………………..4 PHYTOCHROMES…………………………………………………………4 PHYTOCHROME SIGNALING…………………………………………...7 SHADE AVOIDANCE…………………………………………………….10 HFR1……………………………………………………………………….11 INTERACTION OF HFR1 WITH OTHER PROTEINS………………….13 HFR1 IN CRYPTOCHROME SIGNALING……………………………...14 MATERIALS AND METHODS…………………………….……………..16 PLANT MATERIAL………………………………………………………16 Seedling Growth ………………………………………………………..16 Growing Plants on Soil………………………………………………….16 Physiological Analysis…………………………………………………..17 DNA Extraction from A. thaliana Leaves………………………………17 Polymerase Chain Reaction (PCR)……………………………………...18 Restriction Enzyme Digestion…………………………………………..19 RNA METHODS…………………………………………………………..20 RNA Isolation and Northern Blots………………………………………20 RT-PCRs………………………………………………………………...20 DETECTING HFR1……………………………………………………….21 IgY Isolation from Egg Yolks…………………………………………...21 Bradford Assay………………………………………………………….24 Total Protein Isolation from Seedlings………………………………….24 Nuclear Protein Isolation from Seedlings……………………………….25 Detecting HFR1…………………………………………………………26 MICROARRAY EXPERIMENTS………………………………………...26 Post-processing of Microarray Slides…………………………………...26 Microarray Experiments………………………………………………...27 RESULTS……………………………………………………...…………….30 DETECTING HFR1……………………………………………………….30 IgY Isolation from Egg Yolks…………………………………………...30 Testing Primary Rabbit Antibodies……………………………………...33 HFR1 Detection…………………………………………………………34 ROLE OF HFR1 IN SHADE AVOIDANCE……………………………...35 Northern Blots…………………………………………………………...35 RT-PCRs………………………………………………………………...37

2
Involvement of Auxin in hfr1 Phenotype……………………………….39 FINDING HFR1 REGULATED GENES………………………………….42 Genotyping Arabidopsis Plants for hfr1-2………………………………42 Analyzing the Phenotype of hfr1-2 Seedlings…………………………..43 Microarray Experiments………………………………………………...44 GENOTYPING ARABIDOPSIS LINES FOR hfr1-3...................................47 DISCUSSION………………………………………………...……………...49 REFERENCES……………………………………………..………………..51

3
ABSTRACT
Phytochromes are the pho toreceptors mainly responsible for the detection of red and
far-red (FR) light and the following responses. HFR1 is a basic helix- loop-helix type putative
transcription factor involved in Phytochrome A signaling pathway. First we look at the early
phenotype of mutant seedlings lacking a functional HFR1 gene and we show that auxin is
involved in the increased hypocotyl phenotype of these seedlings. Northern blots and RT-PCRs
showed that ATHB-2, a gene involved in shade avoidance is regulated by HFR1 under FR light.
Microarray experiments were performed to find the genes that are early targets of regulation by
HFR1.

4
INTRODUCTION DETECTION OF LIGHT IN PLANTS
Organisms have to adapt to their environment in order to increase the survival chance
of themselves and their progeny. This depends on getting information from the environment
and responding to the environment. Plants do not posses the sensory organs the animals have.
Therefore they have to rely on other mechanisms to detect environmental stimuli. The way
plants detect the properties of light depends on the molecules called photoreceptors.
Photoreceptors are classified into three groups: Cryptochromes (Cashmore et al. 1999),
phototropins (Briggs et al. 2001), and phytochromes (Neff et al. 2000). Cryptochromes and
phototropins are responsible for the detection of blue/ultraviolet light. Phytochromes are
mainly responsible for the detection of red and far-red light.
PHYTOCHROMES
Phytochromes are chromoproteins; they are composed of two parts: the chromophore
part is able to absorb specific wavelengths of light while the polypeptide part causes the
downstream reactions (Butler et al. 1959, 1964, Quail 1997). Phytochromes exist as
homodimers containing two polypeptides with a molecular weight around 125 kDa. The
chromophore of the phytochromes is phytochromobilin. Phytochromobilin binds to a cysteine
residue present in a conserved domain in the amino terminal of phytochromes. The amino
terminal domain is necessary and sufficient for chromophore binding and normal spectral
properties while the carboxy terminal domain mediates dimerization and is essential for
signaling (Fankhauser 2000, Quail 1997). Light can cause isomerization between rings C and
D of phytochromobilin giving phytochromes an ability to be present in two forms. The role of

5
phytochromes to act as photosensors depends on their ability to cycle in these two
photoconvertible forms. Phytochromes are synthesized in their inactive Pr form (λmax: 665
nm). This form has the ability to be converted to the active Pfr form (λmax: 730 nm) upon
exposure to red light. Pfr form can be converted to Pr form by far-red light. Absorption spectra
of the two forms of phytochromes are shown in figure 1 (Smith 2000).
There are 5 phytochromes in Arabidopsis, phytochrome A (phyA) to phytochrome E
(phyE) (Sharrock and Quail. 1989, Clack et al. 1994). PhyA is the most abundant phytochrome
in the dark grown tissues, while its level may decrease 100 fold upon light exposure (Clough et
al. 1999). PhyB is the most abundant phytochrome in light grown tissues, phyC to phyE are
less abundant light-stable phytochromes (Clack et al. 1994, Hirschfield et al. 1998).
To better understand the functions of the phytochromes it is necessary to know a few
stages of development in the Arabidopsis life cycle. When seeds are germinated in dark, they
develop long hypocotyls, closed apical hook and light yellow colored appressed cotyledons.
This phenomenon is called etiolation or skotomorphogenesis. Light-grown seedlings have
shorter, thicker hypocotyls, no apical hook and open, green, expanded cotyledons. The growth
of seedlings under light is called de-etiolation or photomorphogenesis.

6
Figure 1: The absorption spectra of the two forms of phytochromes and the daylight spectra
(Smith 2000).
There are three physiologically distinct modes of phytochrome action that have been
found to date. These modes can be classified according to the amount of light required. In
very- low-fluence responses (VLFR), plants respond to between 0.1 and 1 µmole.m-2 of light,
low fluence responses (LFR) occur between 1 and 1000 µmole.m-2 of light. In high- irradiance
responses (HIR), plants respond to > 1000 µmole.m-2 of light (Neff et al. 2000, Mancinelli
1994).

7
PhyA is the phytochrome that is mainly responsible for the detection of far-red light
and de-etiolation by far-red light while phyB is mainly responsible for the detection of red light
(Whitelam and Devlin 1997). PhyA is also involved in the very- low-fluence responses of blue
and red light (Neff et al. 2000). Overexpression studies that were done indicate a role for phyC
in primary leaf expansion (Halliday et al. 1997, Qin et al. 1997).
Originally it was thought that phytochromes are cytoplasmic molecules that effect the
transcription of other genes through other molecules, but it was recently shown that although
phyA and phyB are cytoplasmic in the dark, they are transported to the nucleus after exposure
to light (Kircher et al. 1999; Yamaguchi et al. 1999). These studies were done using jellyfish
green fluorescent protein (GFP) fused to phytochrome molecules, which were able to rescue
the null mutants, showing that they were functional. An important observation in these studies
was the formation of speckles in the nucleus upon the transportation of the GFP fused
phytochromes to the nucleus (Kircher et al. 1999, Yamaguchi et al. 1999). Speckled structures
were previously found in animal cells and they contained molecules involved in RNA
transcription and processing, like snRNPs (Lamond and Earnshaw, 1998).
PHYTOCHROME SIGNALING
Among the efforts to solve the phytochrome-signaling network, phytochrome
interacting molecules were found using yeast two-hybrid screens. Also mutagenesis studies
enabled the finding of light signaling mutants, which were analyzed to find the components
that are defective. The possible roles of these components were then investigated.
The components that were identified using the yeast two-hybrid screen were PKS1
(phytochrome kinase substrate) (Fankhauser et al. 1999), NDPK2 (nucleoside diphosphate

8
kinase 2) (Choi et al. 1999) and PIF3 (phytochrome interacting factor 3) (Ni et al. 1998). PKS1
was identified in attempts to find the proteins that interact with the carboxyl-terminus of phyA.
In addition to its interaction with carboxyl-terminus of phyA PKS1 also interacts with the
carboxyl-terminus of phyB. Phosphorylation of PKS1 increases under red light vs. dark but not
under far-red light. This evidence together with the finding that Arabidopsis seedlings
overexpressing PKS1 have a reduced sensitivity to red light suggests that PKS1 is a negative
regulator of phyB signaling (Fankhauser et al. 1999).
NDPK2 was also identified in a screen for phyA carboxyl- terminus interacting proteins.
NDPK2 interacts with both Pr and Pfr form of phyA but more with the Pfr form. The γ-
phosphate-exchange activity of NDPK2 is greater when it interacts with the Pfr form of phyA
than when it interacts with the Pr form. A loss-of- function allele of NDPK2 was shown to have
reduction in cotyledon greening and apical hook opening under both red and far-red light.
According to these results NDPK2 seems to be involved in phyA and phyB signaling as a
positive regulator (Choi et al. 1999).
PIF3 was identified in a yeast two-hybrid screen where carboxyl- terminus of phyB was
used as bait. PIF3 also interacts with the carboxyl- terminus of phyA. Analysis of PIF3 showed
that it was a bHLH (basic helix- loop-helix) protein containing a bipartite nuclear localization
signal (NLS), and has a region with some similarity to a PAS (Per-Arnt-Sim-like) domain.
Overexpressing sense PIF3 resulted in decreased responsiveness to continuous red and far-red
light leading to longer hypocotyls and smaller cotyledons under red light and reduced
cotyledon opening under both red and far-red light. The pif3 mutant had the opposite
phenotypes. The amount of anthocyanin increased while the amount of chlorophyll decreased
in the sense PIF3 overexpressers. The pif3 mutant had lower chlorophyll content (Kim et al.,

9
2003). PIF3: GUS fusion protein was used to study the nuclear localization of PIF3 in onion
epidermal cells and the fusion protein was localized to the nucleus (Ni et al. 1998). Further
experiments showed that PIF3 was only bound to the Pfr form of phyB and this binding could
be reversed converting phyB to the Pr form by far-red light. It was also shown that both
carboxyl and amino-terminus of phyB were involved in PIF3 binding (Ni et al. 1999).
The experiments done to compare the binding of PIF3 to phyA and phyB showed that,
as for phyB, PIF3 bound to the Pfr form of phyA but not the Pr form. PIF3 had more affinity
for phyB than for phyA. It was shown that PIF3 bound to phyB stoichiometrically at an
equimolar ratio (Zhu et al. 2000). The experiments that were done to find the domains of PIF3
and phyB that were required for binding showed that a 37-aa part at the amino-terminus of
phyB was required for the high affinity binding of phyB to PIF3. This 37-aa part is not present
in phyA, which may explain the higher affinity of phyB. For PIF3, the PAS domain was
identified as the main domain involved in the interaction (Zhu et al. 2000).
Two classes of genes functioning downstream of phytochrome signaling have been
found. Mutants of one class includes have altered photomorphogenetic responses under light
conditions, like long hypocotyls. Eid1, far1, fhy1, fhy3, fin2, fin219, hfr1, laf1, pat1, spa1 and
vlf are such mutants that have altered phyA dependent responses (Whitelam et al., 1993; Soh
et al., 1998; Hoecker et al., 1999; Hudson et al., 1999; Bolle et al., 2000; Büche et al., 2000;
Fairchild et al., 2000; Fankhauser and Chory, 2000; Hsieh et al., 2000). The hy5 mutant has
long hypocotyl under blue, R and FR light, which suggests that HY5, a bZIP transcription
factor, acts as a positive regulator downstream of the photoreceptors phyA, phyB, and cry1
(Koorneef et al., 1980; Oyama et al., 1997).

10
Mutants of the other class have photomorphogenic development in the absence of light,
like shorter hypocotyls and expanded cotyledons. These mutants are collectively named
cop/det/fus mutants (Chory et al., 1989; Deng et al., 1991; Kwok et al., 1996). COP1 is a
RING-finger protein that has WD40 repeats and its nuclear localization is negatively regulated
by light (Deng et al., 1992; von Arnim and Deng, 1994). It was shown that COP1 targets HY5
(a positive regulator) to proteasome-mediated destabilization, which suggests a mechanism for
COP1 for repressing photomorphogenesis (Ang et al., 1998; Hrdtke et al., 2000; Osterlund et
al., 2000).
SHADE AVOIDANCE
When plants grow in close proximity, they appear to attempt to outgrow one another in
competition for light. Plants sense neighbors by analyzing the red to far-red light ratio. Under
normal light conditions this ratio is around 1.2, while under canopy, or even with nearby green
plants, it decreases (Smith 2000). When a plant senses a low red to far-red light ratio the first
strategy is to grow longer than the other plants. If this strategy fails, the plant flowers early and
produces seeds early to increase the chance of survival of the progeny (Smith, 2000, Smith and
Whitelam, 1997). This is called shade avoidance. PhyB, phyD and phyE are responsible for the
shade avoidance syndrome in Arabidopsis (Aukerman et al. 1997, Devlin et al. 1998, 1999).
ATHB-2 and ATHB-4 were the first genes that were found to be specifically and
reversibly regulated by R: FR ratio in green plants (Carabelli et al. 1993 and 1996); ATHB-2
has been more extensively studied than ATHB-4. ATHB-2 is present at high levels in etiolated
seedlings and upon exposure of the seedlings to R or FR light the levels decline. When young
seedlings and mature plants are grown under light with high R: FR ratio ATHB-2 levels are low
11
but they increase rapidly when the ratio decreases (higher FR in the light). The process is
reversible, ATHB-2 levels decrease rapidly when R: FR ratio increases (Carabelli et al. 1993).
It has been shown that when wild type seedlings grown under low R:FR ratio are
treated with auxin polar transport inhibitor naphthylphthalamic acid (NPA) they grow like wild
type seedlings grown under high R:FR ratio without NPA. When ATHB-2 overexpressing
seedlings were grown under high R:FR ratio they behaved very much like wild type seedlings
grown under low R:FR ratio, with or without NPA (Steindler et al. 1999).These results indicate
an involvement of auxin and ATHB-2 in shade avoidance.
HFR1
This work involves a gene that is involved in phyA signaling network. Fairchild et al.
performed screening experiments for mutants using a continuous far-red light (FRc) fluence
rate below saturation for the de-etiolation, to find the mutants less responsive to FRc. The idea
of using a FRc fluence rate below saturation was to identify the genes whose loss-of-function
mutants give weak phenotypes that are unidentifiable under saturating FRc. Among the
mutants that had a FRc specific long hypocotyl phenotype, one had an incomplete linkage to
phyA and did not correspond to any of the other mutants that had a FRc specific long
hypocotyl phenotype. This mutant was named hfr1 (long hypocotyl in far-red). Wild type and
mutant phyA and hfr1 seedlings have a normal etiolated phenotype when grown in dark. FRc
suppresses hypocotyl elongation in wild type and hfr1 mutants, but hfr1 mutants have longer
hypocotyls in moderate or strong FRc. The decreased response of hfr1 mutants is FRc specific
since hypocotyl lengths of hfr1 mutants are quite similar to wild type ones in Rc (Fairchild et
al., 2000).

12
HFR1 was identified at the same time by two other groups and was given the names
REP1(reduced phytochrome signaling) and RSF1(reduced sensitivity to FR light) (Soh et al.,
2000; Fankhauser and Chory, 2000).
Another response to FRc that is affected in hfr1 mutants is the suppression of hypocotyl
negative gravitropism. When seedlings are grown in darkness, their hypocotyls extend
vertically against gravity. Although this response is highly suppressed in wild type seedlings in
moderate FRc, hfr1 mutants, like phyA mutants have hypocotyls showing negative
gravitropism under moderate FRc. This deficiency is FRc specific; Rc causes suppression of
hypocotyl negative gravitropism in hfr1 mutants (Fairchild et al., 2000).
After the cloning of HFR1 locus, the alleles hfr1-2 and hfr1-3 were sequenced and it
was found that both of them had point mutations in the transcribed region of HFR1. The hfr1-2
allele had two base changes in the transcribed region of HFR1. One, at residue 159, results in a
nonsense codon that causes the truncation of the predicted HFR1 protein in the loop between
the helices of the bHLH domain. This truncation causes the size of the protein to become less
than half of the normal one and inactivation of the bHLH domain. The only base change in the
transcribed region of hfr1-3 is in the 5’ untranslated region. Northern blots have shown that
size and amount of hfr1-3 mRNA is similar to that of wild type in dark-grown seedlings. This
result suggests that hfr1-3 mutation may be causing a decrease in HFR1 protein levels and
thereby leading to its phenotype (Fairchild et al., 2000).
The search of GenBank for proteins similar to HFR1 showed that the two closest
homologs were two Arabidopsis bHLH proteins, PIF3 (Ni et al., 1998) and AAD2380, a
protein predicted from genomic sequence. The HLH region of these proteins has the highest
homology. HFR1 does not have the PAS domain of PIF3. Amino-terminal part of the HLH in

13
HFR1 has a basic character. This part includes some residues that are often basic in DNA
binding bHLH proteins but not in the ones that do not bind DNA (Fairchild et al., 2000).
Following the finding that the predicted HFR1 protein had two potential monopartite
nuclear localization signals and its similarity to DNA-binding proteins, it was hypothesized
that HFR1 might be functioning in the nucleus. To test this possibility the coding region of
HFR1 was fused to the reporter ß-glucuronidase (GUS) in a plant expression construct and
particle bombardment was used to deliver the construct into peels of onion epidermis. While
the GUS control localized to the cytoplasm, GUS-HFR1 was mostly present in nuclei, whether
the peels were kept in darkness or in FRc (Fairchild et al., 2000).
Fairchild et al. performed northern blots to find the HFR1 mRNA levels in seedlings
grown in darkness, FRc, or Rc for 3 days. These experiments showed that HFR1 mRNA level
was two times more in wild type seedlings grown in FRc and 14 times less in Rc grown
seedlings when compared to those grown in darkness. This means that there is approximately
30 times more HFR1 mRNA in seedlings when grown in FRc than in Rc (Fairchild et al.,
2000). ATHB-2 and ATHB-4 are the first genes that were shown to be regulated in a similar
fashion (Carabelli et al. 1993, 1996).
INTERACTION OF HFR1 WITH OTHER PROTEINS
The possibility of binding of HFR1 to phyA, which could explain the FRc specific
action of HFR1, was tested using yeast two-hybrid assay and coimmunoprecipitation assays.
No direct interaction between HFR1 and phyA or phyB was found after these assays. Since
HLH proteins can form homodimers and heterodimers with other HLH proteins, and PIF3 is
the closest homolog of HFR1 and acts in phytochrome signaling by binding to phyA, it was

14
thought that HFR1 can interact with PIF3 and in that way act in phyA signaling. Yeast two-
hybrid assays done to check for this possibility showed an interaction between HFR1 and PIF3.
This result led to another experiment to test for the binding of an HFR1/PIF3 complex to phyA
or phyB. Coimmunoprecipitation experiments showed that like the PIF3 homodimer, the
HFR1/PIF3 complex binds preferentially to the Pfr forms of phyA and phyB (Fairchild et al.,
2000).
To investigate the role of HFR1 in light signaling Kim et al. made double and triple
mutants of HFR1, HY5 and COP1 using the mutants hfr1-201(previously rep1-1), hy5-1 and
cop1-6. Using these mutants they were able to show additive interactions between hfr1-201
and hy5-1 in the inhibition of hypocotyl elongation under FR light. This supports the
hypothesis of HFR1 and HY5 functioning in different branches of phyA signaling. The
analysis of the cop1-6hfr1-201 double mutant showed that HFR1 is partially required for the
shortened hypocotyl and expanded cotyledon phenotypes of cop1-6 in darkness and FR light. It
was also shown using the same double mutant that HFR1 is required for randomized hypocotyl
growth of cop1-6 mutants in darkness. HFR1 transcript levels were found to be increased in the
cop1-6 mutant, compared to wild type in seedlings grown in the dark. These results suggest
that HFR1 acts downstream of COP1 to mediate photomorphogenic development in darkness
and that HFR1 is negatively regulated by COP1 (Kim et al., 2002).
HFR1 IN CRYPTOCHROME SIGNALLING
It was shown that hfr1-101( previously rsf1) mutants had a reduced sensitivity to blue
light in addition to FR light (Fankhauser and Chory, 2000). When the other hfr1 mutants (hfr1-
2, hfr1-201) were investigated, a similar reduction in sensitivity to blue light was observed.

15
Analysis of phyAhfr1-101 double mutant showed that HFR1 had some phyA independent
functions under blue light but HFR1 and phyA acted in together in some pathways under
certain fluence rates of blue light. Analysis of other double mutants of hfr1 suggested that
HFR1 acted mainly in the cry1 pathway (Duek and Fankhauser, 2003).
In this work we use the hfr1-2 mutant that was obtained by ethylmethanesulfonate
(EMS) mutagenesis (This mutant was three times backcrossed to eliminate other mutations).
We have done northern blots, RT-PCRs and microarray experiments using hfr1-2
mutants and the corresponding wild type plants to search for early HFR1-regulated genes.
Also, we made unsuccessful attempts to detect endogenous HFR1 protein using anti-HFR1
polyclonal antibodies.

16
MATERIALS AND METHODS
PLANT MATERIAL
SEEDLING GROWTH
Seeds were surface sterilized for 10 min in 1% commercial bleach with 0.1% SDS,
rinsed at least five times with sterile water, and sown onto Murashige and Skoog (MS)
(Murashige and Skoog, 1962) plates with 0.9% agar. 1% sucrose was included in the medium
for NPA (Chem Service, West Chester, PA) experiments. NPA stock solution (10mM) was
made with 100% ethanol and added to the tempered autoclaved medium to get the appropriate
concentrations. Ethanol was added to the negative control plates. Plates were wrapped with
aluminum foil to prevent the exposure of seeds to light. Plates were kept at 4oC for 4 days,
transferred to white light for 6 hr at 23oC, transferred to dark for 1 day for hypocotyl length
measurement and NPA experiments or 2 days for RNA isolation experiments, and transferred
to FR light (3.4 µmol.m-2s-1). If the seeds did not germinate well after 1 day in the dark, another
protocol was applied for those. In this protocol after the seeds were placed on the trays the
seeds were exposed to 15 min of high FR light and then transferred to 4oC. The plates were
transferred to dark for two days after 4oC and then to white light for 6 hr. The rest of the
protocol is the same.
GROWING PLANTS ON SOIL
To grow the plants on soil first the trays with wet soil were prepared. The trays (25.5cm
wide, 52cm long) can accommodate 8 square pots (12.5cm wide, 12.5cm long and 6cm height).
Pots were placed in the trays. Soil (Premier Pro-Mix BX) and water were mixed in a 4 l

17
container until soil was completely wet. The wet soil was placed in each pot and pressed to
make it tight. The seeds to be sown were placed in a microfuge tube and water was added into
tubes. Using a Pasteur pipette 2-3 seeds or more were placed on specific spots of 5 or 9 on each
pot. After all the seeds were sown the tray was covered with plastic wrap and put in the cold
room (4oC) for four days. After that they were transferred to the growth chamber. The growth
chamber was adjusted to 23oC for a 18 hours day period and to 21oC for a 6 hours night period.
The plants were watered once in a week. Fertilizer (Miracle-Gro) was included in the water
after two weeks of growth in the growth chamber at a concentration of 0.35g/l. Watering was
stopped when most of the plants were dry. After the plants were completely dry, seeds were
collected from them. The seeds were put in microfuge tubes and the tubes were left in the
dessicator for two weeks to further dry the seeds.
PHYSIOLOGICAL ANALYSIS
For hypocotyl length measurement experiments seeds were sown in a grid pattern, 1 or
2 seeds per spot, 40 seeds for wild type and hfr1-2 on each plate. Plates were grown vertically;
photographs were taken under FR light using the night mode of a digital camera and the
seedling hypocotyl lengths were measured using the Image J 1.27 program (NIH). For NPA
experiments seeds were sown the same way, plates were kept under FR light (1 µmol.m-2.s-1)
for 10 days and photographs were taken under white light.
DNA EXTRACTION FROM A.thaliana LEAVES
DNA extraction from the A.thaliana leaves was done as described in Edwards et al. A
round piece of leaf was collected from each plant by capping the lid of a sterile microfuge tube.

18
The collected tissues were grind using blue pelet pestle from Nalge Nunc in the tube until no
ungrinded tissue was visible. 400µl extraction buffer (200mM Tris HCl pH 7.5, 250mM NaCl,
25mM EDTA, 0.5 % SDS) was added onto the grinded samples and they were vortexed for 5
minutes. Samples in the buffer were centrifuged in a microfuge at 13000 rpm for 1 minute and
300 µl of the supernatant was transferred to a new microfuge tube. 300 µl isopropanol was
mixed with each supernatant and the samples were left at room temperature for 2 minutes.
Samples were centrifuged at 13000 rpm for 5 minutes and the supernatant was emptied into a
waste bottle. The microfuge tubes were inverted on a tissue paper to dry the pellets. After no
liquid was visible to the eye, the pellets were dissolved in 100 µl 1X TE.
POLYMERASE CHAIN REACTION (PCR)
For PCRs the user manuals for the DNA polymerases were followed. The polymerase
buffer (usually 10X) was diluted to give a final concentration of 1X. Primers (10µM) were
diluted to give a concentration of 0.4µM. dNTP mix (10mM) was diluted to give a
concentration of 0.4mM. 1.25 unit of DNA polymerase was included to each reaction. A
master mix that contained water, the polymerase buffer, the primers, dNTP mix and the
polymerase for all the PCRs was prepared in a single tube and aliquoted into the tubes where
the reactions were going to be performed. To amplify the certain fragments from the DNA
isolates from the leaves, 2.5µl out of 100µl DNA solution was used for each 50µl reaction
volume. No DNA was put into the negative control reaction. The PCR machine was
programmed according to the user manuals of the polymerases and the melting temperatures
(Tm) of the primers. Primers CO10 and CO20 were used for hfr1-2 and CO12 and CO14 were
used for hfr1-3 PCRs.

19
Name of Primer Sequence TM (oC)
CO10 5’-ATCGATGATCTGATCTCTCTGAAAAATC-3’ 63.9
CO12 5’-TGATCTTTCACAGCAAGTGATCCGA-3’ 67.2
CO14 5’-TGTTCATGTGTCAAAGTGGTAGTGAATC-3’ 64.2
CO20 5’-CGGACAAAGCTGAAATCCCTAAAGA-3’ 65.6
eIF2a-F 5’-ATTGCTTGCTGAGCACATG-3’ 62.7
eIF2a-R 5’-CTACTAACCATGTTTGGGGTCA-3’ 62.4
ATHB-2-L 5’-GCCCCCAGCTAGTCACATAC-3’ 61.4
ATHB-2-R 5’-TTGAGCCTTGTGGATCTGTG-3’
57.3
Table 1: Primers used for PCRs. RESTRICTION ENZYME DIGESTION
To cut the DNA fragments with a restriction enzyme a 2X concentrated master mix of
enzyme was prepared. The master mix contained 2X enzyme buffer (usually 1:5 diluted 10X
buffer), 0.2µg/µl acetylated BSA and the necessary amount of the restriction enzyme as written
in the product sheet supplied with the enzyme. For each DNA fragment to be digested 10µl of
master mix was prepared and mixed with 10µl of the solution containing the DNA fragment.
The reaction mix was incubated at the specific temperature for the specific time in a water
bath. At the end of the reaction the enzyme was heat inactivated, if necessary. For the cases
when the digestion was incomplete the amount of the restriction enzyme was increased and/or
the length of the incubation was increased.

20
RNA METHODS
RNA ISOLATIONS AND NORTHERN BLOTS
For RNA isolation, seeds were sown on sterile Whatman filter paper placed on the
medium in the plates. After seedlings were collected from the plates they were placed on a
standard testing sieve (# 30) and the ungerminated seeds were washed away with sterile water.
Seedling samples were dried, weighed and ~ 1 g from each sample was wrapped with
aluminum foil and frozen in liquid nitrogen and kept at -80oC. These steps were done in dark
with a green LED light. RNeasy Midiprep kit (Qiagen) was used for RNA isolation. 1:9
volume of Plant RNA Isolation Aid (Ambion) was included in the extraction buffer. Tissue
Tearor (Biospec Products, Inc.) was used for homogenization. After homogenization samples
were filtered through Miracloth (Calbiochem, La Jolla, CA) placed in a 50 ml polypropylene
conical tube, by centrifuging at 3000 g for 4 min. The supernatant was put in 50 ml Oak Ridge
tubes and centrifuged at 20000 g for 10 min. The rest of the protocol was done as described in
the protocol supplied with the RNeasy Midiprep Kit. Northern blots were done as described in
Molecular Cloning (2001). 20 µg total RNA from each sample was used. 522 bp long 5’ end of
Athb-2 cDNA (between 2nd and 523rd base pairs) was randomly labeled with a-32P-dATP using
Strip-EZ DNA Kit (Ambion) and used as the probe.
RT-PCRs
For RT-PCRs Superscript III (Invitrogen) was used and the supplied protocol was
followed, volumes of RTs and PCRs were 25 µl, 5 µg total RNA, 1 µg oligo dT primer and 70
units of Superscript III was included in the RT together with 0.05 µl a-32P dATP (0.25 mCi,
3000 Ci/mmol) per reaction. RTs were done at 50oC for 3 hr and 5 µl of samples were run on a

21
4% denaturing polyacrylamide gel for 2 hr at 80 volts as described [18], gel was dried and
exposed to imaging plate for 15 hr and scanned with a phosphoimager (Fujix Bas 1000). The
program MacBas v1.01 was used to analyze and quantify the bands on the gels. cDNA
amounts were normalized for all samples and control PCR was done using primers for eIF2a
with 0.5 µl a-32P dATP and 1.25 units of Hotmaster Taq DNA polymerase (Eppendorf) per
reaction for 25 cycles. PCR samples were run on the same type of gel and exposure was done
in the same way. cDNA amounts were normalized again using the values for the bands in the
control PCR gel. PCR was done using primers for Athb-2 with 0.5 µl a-32P dATP per reaction
for 25 cycles. Gel running and exposure were the same as before. Primers used for eIf2a were
eIf2a-F and eIf2a-R. Primers used for ATHB-2 were ATHB-2-L and ATHB-2-R.
DETECTING HFR1
IGY ISOLATION FROM EGG YOLKS
Isolation of IgY from egg yolks was done using 5 protocols. For the first protocol a
funnel was placed over a 50 ml conical screw cap polypropylene tube. Eggs were washed with
warm water and the yolk was separated from the white by keeping the yolk in the shell while
getting rid of the white. The yolk was put in the funnel and passed into the tube. The volume of
the yolk was written down. An equal volume of dilution buffer (10mM NaPO4, 100mM NaCl,
pH 7.5) was added in the tube and the tube was vortexed. The mixture was centrifuged at
3000g for 30 minutes at room temperature and the supernatant containing the IgY was
recovered.
The second and the third protocols were done as described in Polson (1990) with some
modifications. For the second protocol the steps until recovering the first supernatant are the

22
same as protocol 1. The supernatant was then mixed with an equal volume of chloroform and
centrifuged at 10000g for 30 minutes at room temperature. The upper phase was transferred to
another tube and solid PEG (Polyethylene Glycol) 8000 was added to reach a 12% (w/v)
concentration. The mixture was vortexed, left at 4oC for 30 minutes and centrifuged at 14000g
for 10 minutes. The supernatant was removed and the pellet was washed with water and
resuspended in 0.5 volume of dilution buffer.
For the third protocol supernatant was prepared as in protocol 1 and PEG 8000 was
added to reach a 3.5% (w/v) concentration. The mixture was vortexed, left at 4oC for 30
minutes and centrifuged at 14000g for 10 minutes. The middle clear supernatant was recovered
and PEG 8000 was added to reach a 12% (w/v) concentration. The mixture was vortexed, left
at 4oC for 30 minutes and centrifuged at 14000g for 10 minutes. The supernatant was removed
and the pellet was washed with water and resuspended in 0.5 volume of dilution buffer.
The fourth protocol was done according to Polson et al. (1980), modified by Sturmer et
al. (1992). The isolated egg yolk was mixed with 2 volumes of phosphate buffered saline (PBS,
137 mM NaCl, 2.7 mM KCl, 10 mM Na2HPO4, 2 mM KH2PO4, pH 7.4) and PEG 8000 was
added to reach a 3.5% (w/v) concentration. The mixture was vortexed, left at 4oC for 30
minutes and centrifuged at 14000g for 10 minutes. All further centrifugations were done in the
same conditions. The supernatant was filtered with a gauze plug and PEG 8000 was added to
reach a 12% (w/v) concentration. After the samples were centrifuged at the pellet was
dissolved in ½ volume of yolk and centrifuged again. 2 M ammonium sulfate was added to the
recovered supernatant (1:2 v/v) and the solution was stirred at 4oC for 30 min and centrifuged.
The pellet was dissolved in sterile water and dialyzed against PBS with 0.01% sodium azide
and stored at -80oC.

23
The fifth protocol was done according to Sun et al. (2001). The isolated egg yolk was
diluted with four volumes of sterile water and kept at 4oC for 6 hr and centrifuged at 3500 g for
25 min. Sodium sulfate was added to the recovered supernatant to reach a 19% concentration
and the samples were centrifuged at 3500 g for 10 min and the precipitate was dissolved in
sterile water. Sodium sulfate was added to reach a 14% concentration and after another
centrifugation at 3500 g for 10 min the precipitate was dissolved in sterile water.
After the concentration of proteins in the IgY samples were calculated, equal amounts
from each sample (highest volume from the lowest concentrated sample being 22.5 µl) was
mixed with an equal volume of 2X SDS loading buffer (50 mM Tris-Cl (pH 6.8), 100 mM
DTT, 2% (w/v) SDS, 0.1% bromophenol, 10% (v/v) glycerol). The rest of the protocol is done
as described in Molecular Cloning. Immunoblotting was done as described in Molecular
Cloning, using Protran nitrocellulose membrane (Schleicher & Schuell) the transfer apparatus
from Idea Scientific. 5% nonfat dry milk was used in the blocking buffer. Goat anti-chicken
IgG coupled to horseradish peroxidase was used to detect IgY antibodies on the membrane.
PBS was used to wash the membrane after incubating the membrane with the buffer containing
the antibody. Detection of secondary antibodies was done using 1-Step TMB-Blotting reagent
(Pierce).
For dot-blot IgY samples were diluted 1/10 and 1/100 and equal amounts in 10 µl
volume were spotted on Protran nitrocellulose membrane (Schleicher & Schuell). The blocking
of the membrane the detection was done as previously described.

24
BRADFORD ASSAY
Bradford Assay was used for protein concentration determination. Bradford’s Reagent
(Bradford, 1976) was made by dissolving 100mg of Coomassie Brilliant Blue G-250 in 50ml
95% ethanol, adding 100ml 85% Phosphoric acid and adjusting the volume to 1 liter with
distilled water. The final concentrations of constituents are: 0.01% w/v Coomassie Brilliant
Blue G-250, 4.7% ethanol, and 8.5% Phosphoric acid. The solution was filtered through
Whatman paper after a day passed. 0.5mg/ml BSA stock was made. The BSA stock was
diluted 1:5, 1:6.25, 1:8.33 (100/12), 1:10, 1:12.5, 1:20 fold with water to a final volume of
100µl. Protein samples were diluted 1:5 or 1:10 as default with water to a final volume of
100µl. 1ml Bradford’s Reagent was added to all of the standard solutions and the samples.
After 5 minutes the absorption of all the solutions at 595nm were measured using the
spectrophotometer. Using the absorptions of the standard samples a plot of amount of protein
vs. the absorption was made using the Excel program. The best fitting line passing through 0
was drawn and the slope was calculated. Using the slope, the amount of protein in the samples
and the concentrations of the samples were calculated.
TOTAL PROTEIN ISOLATION FROM SEEDLINGS
For total protein isolation from the seedlings, the seedlings were scraped from the plate
and dried on paper towels. The mass of the seedlings was determined. The seedlings were
enclosed with aluminum foil and frozen in liquid nitrogen until the next step. All these steps
were done in the dark using green LED light. Next steps were performed in normal laboratory
conditions. The frozen seedlings were placed in a mortar and ground for 20-30 seconds with
the pestle. Liquid nitrogen was added into the mortar and the grinding step was repeated two

25
more times. After a fine powder was isolated after grinding, liquid nitrogen was added into the
mortar and the powder was transferred with liquid nitrogen to a polypropylene conical tube
with an appropriate volume. After liquid nitrogen evaporated ten volumes of ice-cold
extraction buffer (8M Urea, 20mM MOPS (3-(N-Morpholino) Propane Sulfonic Acid), 20mM
2-Mercaptoethanol, 2mM EDTA (Ethylenediaminetetraacetic acid), 2mM AEBSF (4-(2-
Aminoethyl) benzenesulfonyl fluoride hydrochloride), and 1% SDS (Sodium dodecyl sulfate))
was added into the tube and the powder was resuspended. The solution was aliquoted, frozen in
liquid nitrogen and kept at –20oC.
NUCLEAR PROTEIN ISOLATION FROM SEEDLINGS
We thought that using nuclear protein extracts could help us detect HFR1 easier since
HFR1 is localized in the nucleus. For nuclear protein extraction the protocol from Busk and
Pagès (1997) was used with some adjustments. The beginning of the protocol is the same as
the one done for total protein isolation until the transfer of the powdered seedlings with liquid
nitrogen to the 50 ml polypropylene conical tube. After liquid nitrogen evaporated ten volumes
of ice-cold extraction buffer (10 mM HEPES (pH 7.8), 10 mM KCl, 10 mM MgCl2, 5 mM
EDTA, 1 mM DTT, 2 mM AEBSF, 1:300 diluted plant protease inhibitor complex (Sigma),
250 mM sucrose, 0.5% Triton X-100) was added into the tube. The sample was vortexed and
filtered through Miracloth placed in a 50 ml polypropylene conical tube, by centrifuging at
3000 g for 15 min. The pellet was resuspended in four volumes of extraction buffer and
centrifuged at 2000 g for 10 min. The pellet was resuspended in 0.1 volume of low salt buffer
(20 mM HEPES (pH 7.8), 20 mM KCl, 0.2 mM EDTA, 2 mM AEBSF, 1:300 diluted plant
protease inhibitor complex, 1.5 mM MgCl2, 0.5 mM DTT, 25% glycerol) and stored at -80oC.

26
DETECTING HFR1
After the concentration of proteins in the nuclear protein extracts were calculated, equal
amounts from each sample (highest volume from the lowest concentrated sample being 22.5
µl) was mixed with an equal volume of 2X SDS loading buffer (50 mM Tris-Cl (ph 6.8), 100
mM DTT, 2% (w/v) SDS, 0.1% bromophenol, 10% (v/v) glycerol). The rest of the protocol is
done as described in Molecular Cloning. Immunoblotting was done as described in Molecular
Cloning, us ing Protran nitrocellulose membrane (Schleicher & Schuell) the transfer apparatus
from Idea Scientific. 5% nonfat dry milk was used in the blocking buffer. The primary
antibody that was used was either rabbit affinity purified anti-HFR1 (Kasia Galecka,
unpublished) or chicken anti-HFR1. The secondary antibody was either goat anti-rabbit IgG
(Sigma) or goat anti-chicken IgG, both coupled with horseradish peroxidase. PBS was used to
wash the membrane after incubating the membrane with the buffer containing the antibody.
Detection of secondary antibodies was done using SuperSignal West Substrates (Pierce). The
exposure time of the membranes was adjusted according to the signal received after a short
exposure (15 sec or 1 min).
MICROARRAY EXPERIMENTS
POST-PROCESSING OF MICROARRAY SLIDES
cDNA microarray slides were supplied from Keck Foundation Biotechnology Resource
Laboratory, Molecular Biotechnology Services, Yale University, New Haven, Connecticut.
Oligonucleotide arrays were supplied from Dr. David Galbraith, Department of Plant Sciences,
University of Arizona, Tucson, Arizona. Rehydration and fixing of the spots of
oligonucleotide arrays was done as in the supplied protocol. Boundaries of the arrays were

27
marked with a diamond scriber. Slides were kept over 50oC water bath face down for 10
seconds and snap-dried on 65oC heating block for 5 seconds. This was repeated 4 more times
for each slide. Slides were placed on the floor of the chamber of Fisher Scientific UV
Crosslinker FB-UVXL-1000. DNA on the slides was crosslinked to the slide by delivering 150
mJ of UV light from the crosslinker. Slides were washed with 1% SDS for 5 minutes, SDS was
removed by keeping the slides in 100% ethanol for 30 seconds with gentle shaking and the
slides were placed in 50 ml falcon tubes and dried by spinning them in a centrifuge for 2 min at
1000 rpm. For blocking oligonucleotide slides 6g succinic anhydride was dissolved in 350 ml
1-methyl-2-pyrrolidinone, 15 ml sodium borate was added into the solution and the solution
was poured into an empty slide chamber. Slide rack with the slides was plunged into the
solution and after a few seconds of vigorous shaking the chamber was shaken on an orbital
shaker for 20 min. Slides were washed with distilled water for 2 min and with 95% ethanol
briefly and spun in a centrifuge for 2 minutes at 1000 rpm.
MICROARRAY EXPERIMENTS
The protocol supplied by the Keck Foundation Biotechnology Resource Laboratory
was used for all of the experiments. For each labeling reaction 5-6µg mRNA with 30µl volume
was mixed with 8µg oligo dT and 10 µg random hexamers. The volume was adjusted to 40 µl
and the samples were kept at 65o for 5 minutes and transferred to ice for at least 2 minutes. 16
µl 5X first strand buffer, 8 µl 0.1M DTT, 1.2 µl 33.3 mM dACG (33.3 mM of each dATP,
dCTP, dGTP), 0.8 µl 20 mM dTTP, 8 µl 2 mM aa-dUTP, 1 µl SUPERase.In RNase inhibitor
(Ambion) and 6 µl Superscript III (Invitrogen) was added to the reaction mix and the samples
were kept at 50oC for 3 hr. 10 µl 0.5 M EDTA and 20 µl 1 M NaOH was added to each

28
reaction to degrade RNA and the tubes were incubated at 65oC for 20 min. 5 µl 1 M HCl and
10 µl Tris (pH 7.5) were added to neutralize the reaction mix. 1 volume phenol and 1 volume
chloroform: isoamylalcohol (25:1) were added, samples were vortexed, spun at maximum
speed for 2 min and the upper layer in each sample was recovered. To remove unincorporated
nucleotides sample volumes were adjusted to 400 µl; samples were added to Microcon YM-30
columns (Millipore) and spun for 10 minutes at 14000g. This was repeated for 3 times and
after the last centrifugation remaining sample volume on the membrane was adjusted to less
than 18 µl. Samples were recovered by spinning the columns upside down in a clean microfuge
tube for 2 minutes at 8000 rpm. Sample volumes were adjusted to 18 µl, 2 µl 1 M sodium
bicarbonate (pH 8.0) was added to each sample and 10 µl of each sample was added into a tube
of Cy3 mono NHS ester dye and remaining 10 µl was added to a tube of Cy5 mono NHS ester
dye (Amersham Biosciences) and samples were kept at room temperature (RT) for an hour in
the dark.
To prehybridize the microarray slides thick lifter cover slips (25X60I-M-5439) (Erie
Scientific) were placed on the slides and 65 µl prehybridization buffer (48% formamide, 3.2X
SSPE, 0.4% SDS, 2X Denhardt’s Reagent, 0.177 mg/ml single strand salmon sperm DNA) was
added under each cover slip. Slides were put into hybridization chamber containing 55 µl
hybridization chamber buffer (3.2X SSC, 23% formamide). The chamber was kept in 50oC
water bath for an hour. Slides were than washed with distilled water, 70% and 100% ethanol
respectively for 2 min each and air dried. Dye coupling reaction was stopped by adding 1 µl 2
M ethanolamine to each reaction and incubating the samples at RT for 5 minutes. For removal
of unincorporated dyes Microcon YM-30 columns were used as previously described, the
centrifugation step was repeated until no color was observed in the flow throughs (usually 3
29
times). Alternatively, CyScribe GFX Purification Kit (Amersham Biosciences) was used as
described by the supplier to remove the unincorporated dyes. Microcon YM-30 columns were
used afterwards to remove the contents of the elution buffer and to concentrate the samples (2
centrifugations). Wild type Cy3 labeled cDNA was mixed with mutant Cy5 labeled cDNA and
vice versa in the columns. The end volumes of the samples were adjusted to 12.5 µl. 2.5 µl 20X
SSPE, 15 µl poly-A and 32.5 µl hybridization buffer (62.8% formamide, 0.8% SDS, 4X
Denhardt’s Reagent, 5X SSPE) was added to the samples, samples were heated to 90oC for 2
min and kept in 42oC water bath until placed on the array. Thick cover slips were placed on the
slides and the samples at 42oC water bath were added under the cover slips and the slides were
put into hybridization chamber containing 55 µl hybridization chamber buffer and incubated in
42oC water bath for 18-20 hours. Slides were washed with 250 ml of 2X SSC, 0.1% SDS for
few minutes and 10 min in the same solution, 2 times with 250 ml of 0.2XSSC, 0.1% SDS for
10 min and lastly 2 times with 250 ml of 0.2X SSC for 10 min and spun to dryness for 2 min at
1000 rpm. Slides were vacuum packaged, wrapped with aluminum foil and sent to Keck
Foundation Biotechnology Resource Laboratory for scanning and the images were analyzed
using Scanalyze Program.

30
RESULTS DETECTING HFR1 IGY ISOLATION FROM EGG YOLKS
Five procedures were tested for purifying IgY from egg yolk. Normal commercially
available eggs were used for this purpose. The total amount of protein detected using
Bradford’s reagent in the IgY isolations was compared for the five procedures (Table 2).
Coomassie staining of the SDS-PAGE of the samples and the western did not reveal a clear
result (Figure 2 and 3).
Table 2: The total protein amount and volume of IgY isolations for the protocols. Mar P1 P2 P3 P4 P5 P4BD P4S4 P4S3 P4S2 P5S2 P5S1 Figure 2: Coomassie staining of the SDS PAGE done for the IgY isolation protocols. Mar: Protein Marker (BRL, MD, USA), P: Protocol, BD: Before Dialysis, S: Supernatant. Heavy chain of IgY is 65 Kda.
Total Protein Amount (mg) Volume (ml) Protocol 1 365.4 14.5 Protocol 2 80.16 12 Protocol 3 64.92 12 Protocol 4 7.776 9 Protocol 5 13.412 56
70 KDaà
110 KDa
44 KDaà
28 KDaà
18 KDaà

31
Mar P1 P2 P3 P4 P5 P4BD P4S4 P4S3 P4S2 P5S2 P5S1
Figure 3: The western blot of the IgY isolations done with the five different procedures. Goat anti-chicken IgG was used to detect IgY.
A dot blot was performed to investigate the highest dilution of the IgY (from each of
the five procedures) that can be detected with the secondary antibody. Among the 1/10 IgY
dilutions, the detection of IgY from protocol 2 and 4 were quite similar but 1/100 dilution from
protocol 2 was better. This may be a result of saturation of spots due to lack of TMB reagent or
high amount of IgY on the spots of 1/10 diluted IgY of 2 and 4 (Figure 4).
70 KDaà
110 KDaà
44 KDaà
28 KDaà

32
1/10 1/100 1/1000
Yolk Dilutions
1/10 IgY dilutions
1/100 IgY dilutions
Figure 4: Dot-blot of diluted egg yolk and IgY samples. Numbers on the image are protocol numbers.
The next step was to isolate IgY from an egg that contains anti-HFR1 IgY and find if
the isolated IgY was capable of detecting crude and purified MBP-HFR1. For this purpose a
western blot was performed using undiluted and diluted crude and purified MBP-HFR1
samples (Figure 5). The result showed that 1/1000 diluted purified IgY (isolated using protocol
2) could detect 1/10 times diluted purified MBP-HFR1. After IgY was isolated from all of the
12 eggs using protocol we had ~ 73 ml of IgY.
1 2 3 4 5

33
Mar Cru Pur1 Pur2 Cru Cru Cru Pur1 Pur1 Pur1 Pur2 Pur2
Dilutions: 1/10 1/50 1/100 1/10 1/50 1/100 1/10 1/50
Figure 5: Detection of crude and purified MBP-HFR1 using purified IgY diluted 1/1000. Mar: Protein Marker, Cru: Crude, Pur: Purified. Detection was done using 1-Step TMB-Blotting reagent.
TESTING PRIMARY RABBIT ANTIBODIES
Several elutions produced during an affinity purification of primary rabbit antibodies
developed against HFR1 (Kasia Galecka, unpublished) were tested to find the ones that have
the highest amount of antibody. The detection of the primary antibodies on the dot blot with
the anti- rabbit antibody (from goat) showed that the highest amount of antibody was present in
tubes labeled # 20 and 21 (Figure 6, table 3).
110 KDaà
70 KDaà
44 KDaà
28 KDaà

34
1 4 5 8 9 12 13 16 17 20 21 + control (unpurified)
Figure 6: Film after detection of rabbit primary antibodies using goat anti-rabbit antibody. Purified anti-HFR1 rabbit antibodies were spotted on small strips of nitrocellulose membrane. Detection was done as previously described. Each box is a strip with four spots, From left to right they are 1/10, 1/100, 1/500 and 1/1000 diluted antibody samples.
Amount Highest High Low Lower
Elution number
20
21
23
19
8
6, 5
2, 22 3
Table 3: The amount of anti-HFR1 rabbit antibodies in different elutions.
HFR1 DETECTION
Unfortunately all the HFR1 detection efforts failed. We were not able to observe a band
that was present only in the protein isolations from wild type but not from mutant hfr1
seedlings. An example is shown in figure 7, sample # 21 of rabbit anti-HFR1 antibody was
used as the primary antibody. IgY sample isolated from egg yolks was also used in other
experiments but those failed too.

35
Mar W1 M1 T + W2 M2
Figure 7: Film after exposure to the membrane. Mar: Protein Marker, W1: wild type 24 hr nuclear protein sample, M1: hfr1-2 mutant 24 hr nuclear protein sample, T: In vitro translated HFR1 (using TNT/T7 Quick Coupled Transcription Translation System (Promega)), W2: wild type 6 hr nuclear protein sample, M2: hfr1-2 mutant 6 hr nuclear protein sample.
ROLE OF HFR1 IN SHADE AVOIDANCE
NORTHERN BLOTS
After we made the observation that the wild-type and hfr1-2 seedlings showed a
hypocotyl length difference as early as 24 hours, we decided to perform the northern blot
experiments using total RNA isolated after the seedlings were grown under far-red light for 24
hours.
The first candidate to check the mRNA level for was ATHB-2. ATHB-2 gene encodes a
homeodomain- leucine zipper protein. The mRNA level of ATHB-2 increases upon exposure of
plants to far-red light or after a decrease of red to far-red light ratio (Carabelli et al. 1993).
Since ATHB-2 is proposed to be involved in shade avoidance during which plants increase
their length, we thought ATHB-2 might be involved in the long hypocotyl phenotype of hfr1-2
36
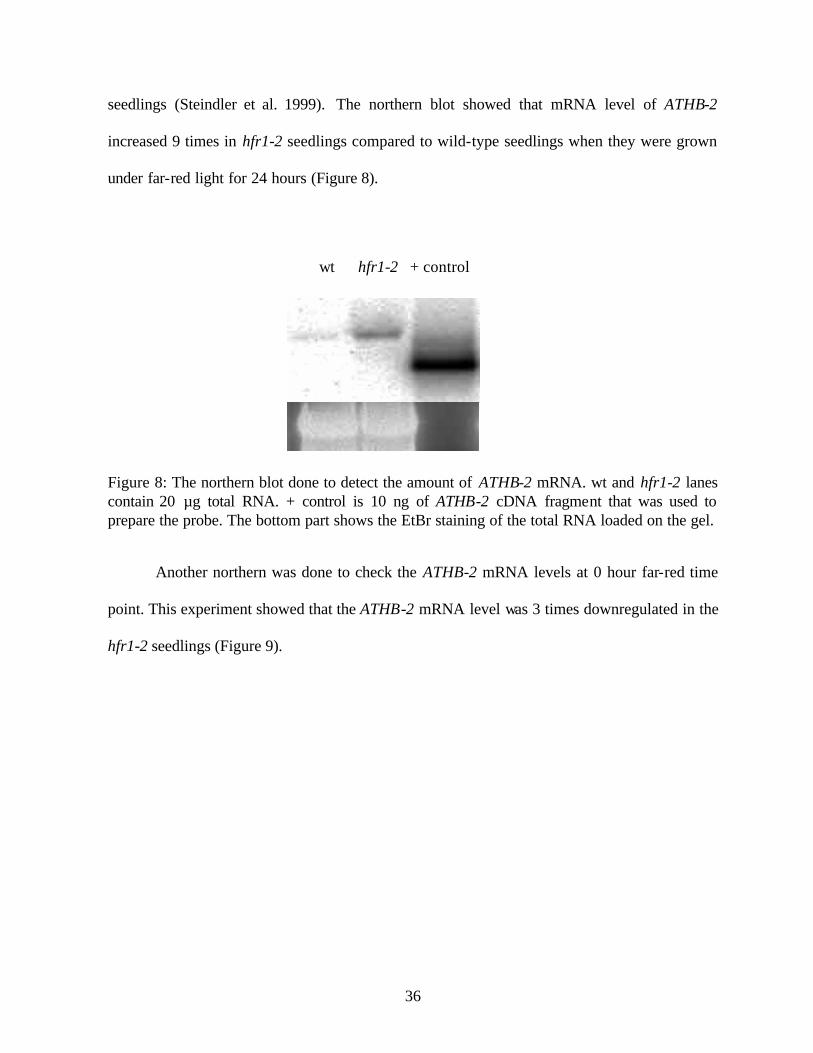
seedlings (Steindler et al. 1999). The northern blot showed that mRNA level of ATHB-2
increased 9 times in hfr1-2 seedlings compared to wild-type seedlings when they were grown
under far-red light for 24 hours (Figure 8).
wt hfr1-2 + control
Figure 8: The northern blot done to detect the amount of ATHB-2 mRNA. wt and hfr1-2 lanes contain 20 µg total RNA. + control is 10 ng of ATHB-2 cDNA fragment that was used to prepare the probe. The bottom part shows the EtBr staining of the total RNA loaded on the gel.
Another northern was done to check the ATHB-2 mRNA levels at 0 hour far-red time
point. This experiment showed that the ATHB-2 mRNA level was 3 times downregulated in the
hfr1-2 seedlings (Figure 9).

37
wt hfr1-2 + control
Figure 9: The northern blot showing the ATHB-2 mRNA levels in wild-type and hfr1-2 seedlings at 0 hour far-red time point. wt and hfr1-2 lanes contain 20 µg total RNA. + control is 1 ng of ATHB-2 cDNA fragment that was used to prepare the probe. The lower part shows the EtBr staining of the RNA loaded on the gel.
Next step was to look at another gene ATHB-4, which also gets upregulated by far-red
rich light like ATHB-2 (Carabelli et al. 1993).Unfortunately until this time we were not
successful to get a result from this experiment. The blots showed two bands in both lanes for
wild-type and hfr1-2. These bands probably correspond to ribosomal RNA. The appropriate
way to pursue this northern would be probably by using mRNA instead of total RNA, which
should eliminate the cross-hybridization.
RT-PCRS
To confirm the northern blot results for ATHB-2 and look for the expression levels of
ATHB-4, we performed RT-PCR experiments using RNA isolated from wild-type and hfr1-2
seedlings. The PCR result for ATHB-2 confirmed its upregulation in hfr1-2 seedlings. A 5-fold
difference in ATHB-2 mRNA amount is observed between wild type and hfr1-2 at 24 hr time
point, 6 and 7-fold differences at 1 hr and 6 hr time points respectively, while little difference

38
0
20
40
60
80
100
120
0 1 6 24
was found at 0 hr (Figure 10). These and northern results show that HFR1 is required for
downregulation of ATHB-2 and thus that ATHB-2 may be to some extent responsible for the
long hypocotyl phenotype of hfr1-2 mutants. ATHB-4 also turned out to be upregulated in
hfr1-2 seedlings but by a similar ratio (Figure 11).
A.
+ control - control wt hfr1-2 wt hfr1-2 wt hfr1-2 wt hfr1-2 O hr 1 hr 6 hr 24 hr B.
Figure 10: The result of RT-PCR done for ATHB-2. A) The bands corresponding to the amplified part of cDNA. + control is the PCR product from a previous experiment where the size of the band (520 bp) was confirmed with a radioactively labeled DNA ladder that was run together with the sample. Genotypes and time points are indicated. B) Graph showing relative amounts of ATHB-2 mRNA. Solid bars are wild type, dashed bars are hfr1-2. ATHB-2 mRNA amount in hfr1-2 seedlings at 24 hr time point is taken as 100.

39
A.
cont - cont wt hfr1-2 wt hfr1-2 wt hfr1-2 wt hfr1-2
0 hr 1 hr 6 hr 24 hr
B.
020406080
100120
0 1 6 24
Figure 11: The result of RT-PCR done for ATHB-4. A) The bands corresponding to the amplified part of cDNA. + control is the PCR product ATHB-2 from a previous experiment where the size of the band (520 bp) was confirmed with a radioactively labeled DNA ladder that was run together with the sample. Genotypes and time points are indicated. B) Graph showing relative amounts of ATHB-4 mRNA. Solid bars are wild type, dashed bars are hfr1-2. ATHB-4 mRNA amount in hfr1-2 seedlings at 24 hr time point is taken as 100.
INVOLVEMENT OF AUXIN IN HFR1 PHENOTYPE
NPA experiments were done to find out if auxin was involved in the hypocotyl
phenotype of hfr1-2 mutants, since it was shown that NPA could decrease hypocotyl lengths of
ATHB-2 overexpressers by blocking the polar transport of auxin, and we have seen that hfr1-2

40
mutants have higher levels of ATHB-2 than wild type seedlings (Steindler et al., 1999). The
first experiment done using NPA gave the result as in table 4.
Average hypocotyl length (mm) Standard error Number of
seedlings hfr1-2 - NPA 10.432 0.242 51
wt - NPA 4.309 0.220 31 hfr1-2 1 µM NPA 6.715 0.182 57
wt 1 µM NPA 2.459 0.112 31
Table 4 : The result of the first NPA experiment. Far-red light intensity was 0.6 µmoles.m-2.s-1.
The result of this experiment was interpreted in two ways. Since the average hypocotyl
length of hfr1-2 seedlings is still not close to that of wild-type (It is 2.51 times more, compare
with 2.42 without NPA) in the presence of 1 µM NPA, either auxin is not involved in hfr1-2
phenotype or 1 µM NPA was not enough to block the effect of auxin. To test the latter idea we
performed another NPA experiment by increasing the concentration of NPA to 2 and 20 µM.
The results are shown in table 5 and figure 12. The effect of NPA is evident when its
concentration is 2 µM but there is still a large difference between the hypocotyl lengths of wild
type and hfr1-2 seedlings. However at 20 µM concentration of NPA the difference is largely
eliminated. These results suggest that auxin is involved in the long hypocotyl phenotype of
hfr1-2 mutants, together with ATHB-2 and probably because of high levels of ATHB-2
protein.

41
0
1
2
3
4
5
6
7
8
9
Average hypocotyl length (mm)
Standard Error
Number of seedlings
wt - NPA 4.223 0.226 18
hfr1-2 - NPA 7.991 0.246 8 wt 2µM NPA 2.061 0.07 22
hfr1-2 2µM NPA 3.715 0.257 8 wt 20µM NPA 1.425 0.06 21
hfr1-2 20µM NPA 1.807 0.144 6
Table 5: The result of the second NPA experiment. The intensity of far-red light was 1 µmol.m-
2.s-1.
wt hfr1-2 wt hfr1-2 wt hfr1-2
- NPA 2 µM NPA 20 µM NPA
Figure 12: The result of the second NPA experiment in figure form.

42
FINDING HFR1 REGULATED GENES
Our aim was to find the genes regulated by HFR1 since HFR1 is a transcription factor.
We also want to find the early genes targeted by HFR1 rather than the late ones. Since the hfr1-
2 mutant we are using is obtained by EMS mutagenesis it also contains other mutations in
other genes that can effect the expression of those and other genes. That’s why first we wanted
to have two populations, one wild type and other hfr1-2 containing the same extra mutations so
that the differences would not come up as HFR1 regulated in experiments like microarray
experiments. To do this we had to genotype plants grown from the seeds from a plant
heterozygote for HFR1 as described in the following results. After that we went on to find out
at which earliest time-point we could see a hypocotyl length difference between wild type and
hfr1-2 seedlings. After finding that out we planned our experiments accordingly.
GENOTYPING ARABIDOPSIS ADULT PLANTS FOR HFR1-2
209 plants were grown from seeds isolated from a two times backcrossed plant
heterozygote for HFR1 with a genotype of HFR1 x hfr1-2 and with a Col-5 background. PCRs
were done to amplify the part of the hfr1 gene, which included the mutation in the hfr1-2
plants. The PCRs worked for all of the plants (Figure 13). After the restriction enzyme
digestions were performed using the enzyme BsmAI (Figure 14), we found that there were 53
hfr1-2 homozygous plants and an equal number of segregated wild-type plants. Each of these
groups was present as 25.4 % of the segregating population. This result was very close to the
perfect expected percentage of 25.

43
Mar
Figure 13: A part of the gel run to check the PCRs done to amplify the part of hfr1, which had a mutation in hfr1-2 plants. Mar: 100 bp DNA marker.
Mar
Figure 14: A part of the gel run to see the restriction enzyme digestion pattern of the part of hfr1 amplified with PCR. Of the three bands that can be present in a lane the uppermost band is 510 bp (No enzyme cutting, observed either in hfr1-2 homozygous or heterozygous plants.), the lower band is 435 bp (The larger fragment formed after enzyme cutting, observed either in hfr1-2 heterozygous or wild-type plants.), the lowest band is 65 bp and is present together with 435 bp fragment.
ANALYZING THE PHENOTYPE OF HFR1-2 SEEDLINGS
After the hypocotyl phenotypes of wild-type and hfr1-2 seedlings were investigated, it
was seen that the hypocotyl lengths of wild-type and hfr1-2 seedlings were different after 24
hours under far-red light following growth in dark for two days (Table 6, figure 15).
500 à bp
ß510 bp
500 à bp
100 à bp
65 bp ß

44
Hours wt hfr1-2 wt St Error hfr1-2 St Error 24 1.005 1.229 0.088 0.099 30 1.132 1.629 0.110 0.117 43 1.524 3.007 0.044 0.240 50 1.638 3.202 0.146 0.159 56 1.722 3.529 0.107 0.132 70 1.997 3.833 0.109 0.146 96 1.876 4.108 0.061 0.218
Table 6: The result of the analysis of the phenotypes of the wild-type Col-5 and hfr1-2 seedlings grown under far-red light.
Figure 15: Average hypocotyl lengths of wild type (blue bars) and hfr1-2 (red bars) seedlings grown under far-red light. Error bars show the standard error.
MICROARRAY EXPERIMENTS
The first microarray experiment was done using a spotted cDNA microarray, which
contained 9216 spots representing more than 6000 genes. The slide had 16 blocks arranged 4
by 4, and each block normally has 24 rows and 24 columns. The image of a block (23 rows and
24 columns in our array) is shown in figure 16.
00.5
11.5
22.5
33.5
44.5
5
24 30 43 50 56 70 96
Hours under far-red light
Average Hypocotyl length (mm)

45
Figure 16: A block of the cDNA microarray hybridized with Cy3 and Cy5 labeled cDNA samples. Green spots are the genes down regulated in hfr1-2 seedlings while the red spots are the upregulated ones. Yellow spots show the cDNAs that have the same level in both of the samples.
A publicly available program, ScanAlyze 2.50, developed by Michael Eisen’s lab was
used to analyze the images (http://rana.lbl.gov/). The analysis program gave us the ratios of
colors of each spot representing the ratios of transcripts of genes in hfr1-2 mutants versus the
wild type. After the analysis 77 genes were found to have more than 1.5 fold differential
expression in both of the experiments (the two replicates). Among these 77 genes 61 were
downregulated in hfr1-2 seedlings while the remaining 16 were upregulated. Some examples
are given in table 7.

46
GenBank Name
Expression Ratio
5 days FR* 24 hr FR Function
N65145 0.382 0.623 Serine/threonine protein kinase
W43222 2.162 2.467 Putative CHP-rich zinc finger protein
N65533 1.510 1.584 Chloroplast ribosomal protein
Table 7: Comparison of expression ratios of some of the genes, which were found by Wang et al. and me. The mutant allele used by Wang et al. was Rep1. * Wang H, Ma L, Habashi J, Li J, Zhao H, Deng XW. (2002). Analysis of far-red light-regulated genome expression profiles of phytochrome A pathway mutants in Arabidopsis. Plant J.Dec;32(5):723-33
After the cDNA microarray experiment we wanted to do the next experiments using the
newly available 70mer oligonucleotide microarrays representing 26090 genes. These
microarrays would let us look at the expression of more than 4 times more genes than cDNA
microarrays. 0 hr and 1 hr time point experiments were done to find the earliest genes that were
regulated by HFR1. GenePix Pro 5.0 was used to analyze the images. The results are shown in
table 8.
Table 8: The number of genes upregulated or downregulated in hfr1-2 mutants after indicated hours of FR light.
Upregulated in hfr1-2 mutants
Downregulated in hfr1-2 mutants
0 hr FR light 92 66
1 hr FR light 21 191

47
We then looked at the ratios of transcripts for ATHB-2. The results are shown in table 7.
0 hr 0 hr 1 hr 1 hr
ATHB-2 0.394 0.454 2.691 2.638
Table 7: Gene transcript ratios for ATHB-2 shown for duplicate experiments for 0 and 1 hr time points. Ratios are hfr1-2/wild type.
GENOTYPING ARABIDOPSIS LINES FOR HFR1-3
PCR was performed followed by restriction digestion to identify the genotype of 2
Arabidopsis lines for hfr1-3. Figure 17 shows the PCR result, figure 18 shows the restriction
enzyme reaction result. Line number 4 was identified as hfr1-3 homozygous while number 12
was heterozygous.
- ct wt 4 12 Mar
Figure 17: Result of the PCR done to amplify the part of hfr1 containing the mutation for hfr1-3. – ct: negative control, wt: wild-type, Mar: 100 bp DNA marker.
ß 500 bp

48
wt 4 12 Mar
Figure 18: The restriction enzyme reaction of the PCR results. Line 4 is missing the RsaI cutting site in both copies of the hfr1 gene while line 12 is missing in one copy.
ß 200 bp
ß 400 bp
ß 600 bp

49
DISCUSSION
IgY samples were successfully isolated from egg yolks but we were not able to detect
HFR1 using these antibodies or by using affinity purified rabbit anti-HFR1 antibodies.
Purification of nuclear proteins from transgenic plants overexpressing HFR1, which
presumably have higher HFR1 levels may lead to the detection of HFR1.
We were able to show that hypocotyl length difference between wild type and hfr1-2
seedlings could be observed after 24 hr of FR but we believe that with the use of more
sensitive imaging and measuring techniques this difference can be observed at earlier time
points.
The 9-fold ATHB-2 mRNA difference between wild type and hfr1-2 seedlings observed
at 24 hr in northern blot shows that ATHB-2 is regulated by HFR1. We did the RNA isolations
and RT-PCRs for time points earlier than 24 hr because we thought that the physiological
difference observed at this point is a result of earlier changes in gene and protein levels, since
HFR1 encodes a transcription factor. We wanted to see if it was possible to observe a
difference in ATHB-2 mRNA levels at an earlier time point which would indicate that it is an
early target of HFR1 protein. As seen in figure 10 the difference in ATHB-2 mRNA levels
between wild type and hfr1-2 at 1 and 6 hr time points indicates that ATHB-2 is an early target
of HFR1. The decrease of ATHB-2 mRNA during early hours of FR treatment has not been
reported before and northern blots have to be done to confirm the results obtained by RT-PCRs
for the amounts of ATHB-2 in wild type and hfr1-2 seedlings at 1 and 6 hr time points.

50
Although the result of the northern for ATHB-2 for 0 hr time point conflicts with the
RT-PCR result the oligonucleotide microarray result is in accordance with the northern.
Additional northern experiments for 0 hr time point would probably resolve this conflict.
NPA experiments showed the involvement of auxin in the increased hypocotyl length
of hfr1-2 seedlings. As for the other factors involved there are two current possible
explanations: Either increased ATHB-2 level is causing this shade avoidance- like phenotype
through a path other than auxin or the lack of HFR1 is leading to changes in the levels of other
proteins that are causing the phenotype.
The results of our microarrays experiments are not very conclusive at the moment but
we believe that by doing more microarray experiments for the time points we did using a salk
line, salk_037727 which has a T-DNA insertion in HFR1 that causes a hfr1 phenotype, we will
be able to get more conclusive results and find the genes regulated by HFR1.

51
REFERENCES
Ang, L.H., Chattopadhyay, S., Wei, N., Oyama, T., Okada, K., Batschauer, A., Deng, X.W. (1998). Molecular interaction between COP1 and HY5 defines a regulatory switch for light control of Arabidopsis development. Mol. Cell. 1: 213–222 von Arnim, A.G., Deng, X.W. (1994). Light inactivation of Arabidopsis photomorphogenic repressor COP1 involves a cell-specific regulation of its nucleocytoplasmic partitioning. Cell. 79:1035–1045 Aukerman, M.J., Hirschfeld, M., Wester, L.,Weaver, M.,Clack, T., Amasino, R. M., Sharrock, R.A.. (1997). A deletion in the PHYD gene of the Arabidopsis Wassilewskija ecotype defines a role for phytochrome D in red/far-red light sensing. Plant Cell. 9: 1317-1326 Bolle, C., Koncz, C., Chua, N.H. (2000). PAT1, a new member of the GRAS family, is involved in phytochrome A signal transduction. Genes Dev. 14: 1269–1278 Bradford, M.M. (1976). A rapid and sensitive method for the quantitation of microgram quantities of protein utilizing the principle of protein-dye binding. Anal. Biochem.72:248-54 Briggs, W.R., Beck, C.F., Cashmore, A.R., Christie, J.M., Hughes, J., Jarillo, J.A., Kagawa, T., Kanegae, H., Liscum, E., Nagatani, A., Okada, K., Salomon, M., Rudiger, W., Sakai, T., Takano, M., Wada, M., Watson, J.C. (2001). The phototropin family of photoreceptors. Plant Cell. 13: 993-997 Busk, P.K., Pagès, M. (1997). Microextraction of Nuclear Proteins from Single Maize Embryos. Plant Molecular Biology Reporter. 15: 371-376 Butler, W.L., K.H. Norris, H.W. Siegelman, S.B. Hendricks. (1959). Detection, assay, and preliminary purification of the pigment controlling photoresponsive development of plants. Proc. Natl. Acad. Sci. 45: 1703-1708
Butler, W.L., S.B. Hendricks, H.W. Siegelman. (1964). Action spectra of phytochrome in vitro. Photochem. Photobio l. 3: 521-528
Büche, C., Poppe, C., Schäfer, E., Kretsch, T. (2000). eid1: a new Arabidopsis mutant hypersensitive in phytochrome A-dependent high- irradiance responses. Plant Cell. 12: 547–558 Carabelli, M., Sessa, G., Baima, S., Morelli, G., Ruberti, I. ( 1993 ) The Arabidopsis Athb-2 and -4 genes are strongly induced by far-red rich light. Plant J. 4(3):469-79 Carabelli, M., Morelli, G., Whitelam, G., Ruberti, I. (1996). Twilight-zone and canopy shade induction of the Athb-2 homeobox gene in green plants. Proc Natl Acad Sci U S A. 93(8):3530-5

52
Cashmore, A. R., Jarillo, J. A., Wu, Y. J. Liu, D. (1999). Cryptochromes: blue light receptors for plants and animals. Science. 284: 760-765 Choi, G., H. Yi, J. Lee, Y.K. Kwon, M.S. Soh, B. Shin, Z. Luka, T.R. Hahn, and P.S. Song. (1999). Phytochrome signalling is mediated through nucleoside diphosphate kinase 2. Nature. 401: 610-613 Chory, J., Peto, C., Feinbaum, R., Pratt, L., Ausubel, F. (1989). Arabidopsis thaliana mutant that develops as a light-grown plant in the absence of light. Cell. 58: 991–999 Clack, T., Mathews, S. and Sharrock, R. A. (1994). The phytochrome apoprotein family in Arabidopsis is encoded by five genes: the sequences and expression of PHYD and PHYE. Plant Mol. Biol. 25: 413-427 Clack, T., S. Mathews, and R.A. Sharrock. (1994). The phytochrome apoprotein family in Arabidopsis is encoded by five genes: The sequences and expression of PHYD and PHYE. Plant Mol. Biol. 25: 413-427 Clough, R.C., E.T. Jordan-Beebe, K.N. Lohman, J.M. Marita, J.M. Walker, C. Gatz, R.D. Vierstra. (1999). Sequences within both the N- and C-terminal domains of phytochrome A are required for Pfr ubiquitination and degradation. Plant J. 17: 155-167 Deng, X.W., Caspar, T., Quail, P.H. (1991) cop1: a regulatory locus involved in light-controlled development and gene expression in Arabidopsis. Genes Dev. 5: 1172–1182 Deng, X.W., Matsui, M., Wei, N., Wagner, D., Chu, A.M., Feldmann, K.A., Quail, P.H. (1992). COP1, an Arabidopsis regulatory gene, encodes a protein with both a zinc-binding motif and a Gbeta homologous domain. Cell. 71: 791–801 Devlin, P.F., S.R. Patel, G.C. Whitelam. (1998). Phytochrome E influences internode elongation and flowering time in Arabidopsis. Plant Cell. 10: 1479-1488 Devlin, P.F., P.R. Robson, S.R. Patel, L. Goosey, R.A. Sharrock, G.C. Whitelam. (1999). Phytochrome D acts in the shade-avoidance syndrome in Arabidopsis by controlling elongation growth and flowering time. Plant Physiol. 119: 909-915 Edwards, K., Johnstone, C., Thompson C. (1991). A simple and rapid method for preparation of plant genomic DNA for PCR analysis. Nucleic Acids Research 19(6):1349 Fairchild, C.D., Schumaker, M.A., Quail, P.H. (2000). HFR1 encodes an atypical bHLH protein that acts in phytochrome A signal transduction. Genes Dev. 14: 2377–2391 Fankhauser, C., Chory, J. (2000). RSF1, an Arabidopsis locus implicated in phytochrome A signaling. Plant Physiol. 124: 39–46

53
Fankhauser, C., K.C. Yeh, J.C. Lagarias, H. Zhang, T.D. Elich, J. Chory. (1999). PKS1, a substrate phosphorylated by phytochrome that modulates light signaling in Arabidopsis. Science. 284: 1539-1541 Fankhauser, C. (2000). Phytochromes as light-modulated protein kinases. Semin. Cell Dev. Biol. 11(6): 467-73 Duek, P.D., Fankhauser, C. (2003). HFR1, a putative bHLH transcription factor, mediates both phytochrome A and cryptochrome signalling. Plant J. 34(6):827-36 Halliday, K.J., B. Thomas, G.C. Whitelam. (1997). Expression of heterologous phytochromes A, B or C in transgenic tobacco plants alters vegetative development and flowering time. Plant J. 12: 1079-1090 Hardtke, C.S., Gohda, K., Osterlund, M.T., Oyama, T., Okada, K., Deng, X.W. (2000). HY5 stability and activity in Arabidopsis is regulated by phosphorylation in its COP1 binding domain. EMBO J. 19: 4997–5006 Hirschfeld, M., J.M. Tepperman, T. Clack, P.H. Quail, R.A. Sharrock. (1998). Coordination of phytochrome levels in phyB mutants of Arabidopsis as revealed by apoprotein-specific monoclonal antibodies. Genetics. 149: 523-535 Hoecker, U., Tepperman, J.M., Quail, P.H. (1999). SPA1, a WD-repeat protein specific to phytochrome A signal transduction. Science. 284: 496–499 Hsieh, H.L., Okamoto. H., Wang, M., Ang, L.H., Matsui, M., Goodman, H., Deng, X.W. (2000). FIN219, an auxin-regulated gene, defines a link between phytochrome A and the downstream regulator COP1 in light control of Arabidopsis development. Genes Dev. 14: 1958–1970 Hudson, M., Ringli, C., Boylan, M.T., Quail, P.H. (1999). The FAR1 locus encodes a novel nuclear protein specific to phytochrome A signaling. Genes Dev. 13: 2017–2027 Kim, Y.M., Woo, J.C., Song, P.S., Soh, M.S. (2002) HFR1, a phytochrome A-signalling component, acts in a separate pathway from HY5, downstream of COP1 in Arabidopsis thaliana. Plant J. 30(6):711-719 Kim, J., Yi, H., Choi, G., Shin, B., Song, P.S., Choi, G. (2003). Functional characterization of phytochrome interacting factor 3 in phytochrome-mediated light signal transduction. Plant Cell. 15(10):2399-2407 Kircher, S., Kozma-Bognar, L., Kim, L., Adam, E., Harter, K., Schafer, E., Nagy, F. (1999). Light quality-dependent nuclear import of the plant photoreceptors phytochrome A and B. Plant Cell. 11: 1445-1456

54
Koornneef, M., Rolff, E., Spruit, C.J.P. (1980). Genetic control of light- inhibited hypocotyl elongation in Arabidopsis thaliana (L) Heynh. Z Pflanzenphysiol. 100: 147–160 Kwok, S.F., Piekos, B., Misera, S., Deng, X.W. (1996). A complement of ten essential and pleiotropic Arabidopsis COP/DET/FUS genes is necessary for repression of photomor-phogenesis in darkness. Plant Physiol. 110: 731–742 Lamond, A.I. and W.C. Earnshaw. (1998). Structure and function in the nucleus. Science. 280: 547-553 Mancinelli, A.L. (1994). The physiology of phytochrome actions. In Photomorphogenesis in plants, 2nd ed. (ed. R.E. Kendrick and G.H.M. Kronenberg), pp. 211-270. Kluwer Academic Publishers, Dordrecht, The Netherlands. Murashige, T., and Skoog, F. (1962) A revised medium for rapid growth and bioassays with tobacco tissue. Plant Physiol. 15: 473-197 Neff, M. M., Fankhauser, C. Chory, J. (2000). Light: an indicator of time and place. Genes Dev. 14: 257-271 Ni, M., J.M. Tepperman, and P.H. Quail. (1998). PIF3, a phytochrome-interacting factor necessary for normal photoinduced signal transduction, is a novel basic helix- loop-helix protein. Cell. 95: 657-667 Ni, M., J.M. Tepperman, and P.H. Quail. (1999). Binding of phytochrome B to its nuclear signalling partner PIF3 is reversibly induced by light. Nature. 400: 781-784 Osterlund, M.T., Hardtke, C.S., Wei, N., Deng, X.W. (2000). Targeted destabilization of HY5 during light-regulated development of Arabidopsis. Nature. 405: 462–466 Oyama, T., Shimura, Y., Okada, K (1997) The Arabidopsis HY5 gene encodes a bZIP protein that regulates stimulus- induced development of root and hypocotyl. Genes Dev. 11: 2983–2995 Polson, A., von Wechmar, M.B., van Regenmortel, M.H. (1980) Isolation of viral IgY antibodies from yolks of immunized hens. Immunol Commun. 9(5):475-93
Polson A. (1990) Isolation of IgY from the yolks of eggs by a chloroform polyethylene glycol procedure. Immunol Invest. 19(3): 253-258
Quail, P. H. (1997). An emerging molecular map of the phytochromes. Plant Cell Environ. 20: 657-665
Qin, M., Kuhn, R., Moran, S., P.H. Quail. (1997). Overexpressed phytochrome C has similar photosensory specificity to phytochrome B but a distinctive capacity to enhance primary leaf expansion. Plant J. 12: 1163-1172
Sambrook, J., and Russell, D.W. (2001) Molecular Cloning: A Laboratory Manual, 3rd Ed. Cold Spring Harbor Laboratory Press, Cold Spring Harbor, NY

55
Sharrock, R.A. and P.H. Quail. (1989). Novel phytochrome sequences in Arabidopsis thaliana: Structure, evolution, and differential expression of a plant regulatory photoreceptor family. Gene & Dev. 3: 1745-1757 Smith, H. (2000). Phytochromes and light signal perception by plants -- an emerging synthesis. Nature. 407: 585-591 Smith, H. and G.C. Whitelam. (1997). The shade avoidance syndrome: Multiple responses mediated by multiple phytochromes. Plant Cell Environ. 20: 840-844 Soh, M.S., Hong, S.H., Hanzawa, H., Furuya, M., Nam, H.G. (1998). Genetic identification of FIN2, a far red light-specific signaling component of Arabidopsis thaliana. Plant J. 1998 16(4):411-9 Soh, M. S., Kim, Y. M., Han, S. J., Song, P. S. (2000). REP1, a basic helix- loop-helix protein, is required for a branch pathway of phytochrome A signalling in Arabidopsis. Plant Cell 12: 2061–2073 Steindler, C., Matteucci, A., Sessa, G., Weimar, T., Ohgishi, M., Aoyama, T., Morelli, G. Ruberti, I. (1999). Shade avoidance responses are mediated by the ATHB-2 HD-zip protein, a negative regulator of gene expression. Development. 126(19):4235-45 Sturmer, A.M., Driscoll, D.P., Jackson-Matthews, D.E. (1992) A quantitative immunoassay using chicken antibodies for detection of native and recombinant -amidating enzyme. J. immunol. Methods.146: 105-110 Sun, S., Mo, W., Ji, Y., Liu, S. (2001). Preparation and mass spectrometric study of egg yolk antibody (IgY) against rabies virus. Rapid Commun. Mass Spectrom. 15(9):708-12. Whitelam, G.C., Johnson, E., Peng, J., Carol, P., Anderson, M.L., Cowl, J.S., Harberd, N.P. (1993). Phytochrome A null mutants of Arabidopsis display a wild-type phenotype in white light. Plant Cell 5: 757–76 Whitelam, G.C. and P.F. Devlin. (1997). Roles of different phytochromes in Arabidopsis photomorphogenesis. Plant Cell Environ. 20: 752-758 Yamaguchi, R., Nakamura, M., Mochizuki, N., Kay, S. A. & Nagatani, A. (1999) Light-dependent translocation of a phytochrome B-GFP fusion protein to the nucleus in transgenic Arabidopsis. J. Cell Biol. 145: 437-445 Zhu, Y., Tepperman, J.M., Fairchild, C.D., Quail, P.H. (2000) Phytochrome B binds with greater apparent affinity than phytochrome A to the basic helix- loop-helix factor PIF3 in a reaction requiring the PAS domain of PIF3. Proc Natl Acad Sci U S A. 97(24):13419-24
![Phytochrome Regulation of Branching in Arabidopsis1[W][OA] · Phytochrome Regulation of Branching in Arabidopsis1[W][OA] Scott A. Finlayson*, Srirama R. Krishnareddy, Tesfamichael](https://img.pdfslide.us/doc/110x75/6023406ffe62ec706a5b173d/phytochrome-regulation-of-branching-in-arabidopsis1woa-phytochrome-regulation.jpg)


![Phytochrome, Carbon Sensing, Metabolism, and …...Phytochrome, Carbon Sensing, Metabolism, and Plant Growth Plasticity1[CC-BY] Johanna Krahmer, Ashwin Ganpudi, Ammad Abbas, Andrés](https://img.pdfslide.us/doc/110x75/5e52046a46d25750920125b7/phytochrome-carbon-sensing-metabolism-and-phytochrome-carbon-sensing-metabolism.jpg)


![Phytochromes and Phytochrome Interacting Factors1[OPEN] · Update on Phytochromes and Phytochrome Interacting Factors Phytochromes and Phytochrome Interacting Factors1[OPEN] Vinh](https://img.pdfslide.us/doc/110x75/5e9224c5cbd0a85457462c45/phytochromes-and-phytochrome-interacting-factors1open-update-on-phytochromes-and.jpg)