Embed Size (px)
Citation preview
Role of Fertilizers in Trace Metal (Specifically Cadmium) Contamination of Groundwater
Report to the Water Research Commission
by
Umvoto Africa
WRC Report No. KV 334/14
September 2014
Trace Metal (Cadmium) Contamination of South African Aquifers
This report is available on-line only at www.wrc.org.za The publication of this report emanates frorm a project titled Non-point Source Trace Metal Contamination of South African Aquifers (WRC Project K8/1031/1).
DISCLAIMER This report has been reviewed by the Water Research Commission (WRC) and approved for
publication. Approval does not signify that the contents necessarily reflect the views and policies of the WRC nor does mention of trade names or commercial products constitute
endorsement or recommendation for use.
ISBN 978-1-4312-0586-8 © Water Research Commission
i
EXECUTIVE SUMMARY
INTRODUCTION
This document reports on “Water Research Commission (WRC) Project K8/1031/1: Non-point Source Trace Metal Contamination of South African Aquifers”.
This project aims to review cadmium contamination of South African aquifer groundwater systems via phosphate fertilizer – from fertilizer composition to trace metal mobilisation and bioavailability in soils and groundwater. Topics reviewed included fertilizer composition and types, metal speciation, metal mobility in soil and groundwater systems, metal bioavailability, health and environmental effects, and local contamination case studies. A preliminary study site, namely the greater Hermanus region (including the Hemel en Aarde Valley), was identified for trace metal and groundwater quality studies (which incorporated urban and agricultural areas in various hydrogeological settings). Hermanus was selected due to the discovery of cadmium concentrations of 20 micrograms per litre (µg/l) in a golf estate irrigation borehole (LV01), during drilling and test-pumping of the borehole at the end of 2012. Due to the absence of industrial or landfill site point sources, the only other currently known, possible local source for trace metal (and specifically cadmium) contamination of groundwater in the estate borehole was phosphate fertilizer (applied over a minimum period of at least 70 years) and treated wastewater application (over the past 6 years) to the adjacent, century-old golf course, or within the estate itself. The local aquifers are also not known to be naturally mineralised with respects to high concentrations of cadmium and other trace metals, other than iron and manganese.
As part of this study, groundwater samples from seven borehole sites (analysed for macrochemistry and trace metals) and eleven soil sites (analysed for trace metals) were collected, in order to determine whether there was a potential link between trace metals present within the upper soil surface and trace metal concentrations observed in groundwater samples through leaching. The results of the study site hydrochemical and soil analyses is used in association with the literature review to provide recommendations for a large-scale non-point source trace metal (focusing on cadmium) groundwater pollution study within South Africa.
LITERATURE REVIEW
Natural (from the weathering of cadmium-bearing lithologies and volcanoes) and anthropogenic sourced cadmium is released into the atmosphere, aquatic environments (fresh surface and groundwater, estuaries and the ocean) and terrestrial environments (soil and biota). There are noticeable fluxes between all compartments, with long term sinks including deep ocean sediment and controlled landfill sites. Total flows of anthropogenic sourced cadmium within society and the environment is not of the same magnitude as other trace metals such as chromium, lead and mercury. However, even in relatively small
Trace Metal (Cadmium) Contamination of South African Aquifers
ii
anthropogenic amounts, the mobility of cadmium within the environment is a current (and future, as a result of ongoing acidification) environmental issue.
Anthropogenic cadmium emissions exceed natural sources by an order of magnitude, and anthropogenic release of cadmium into the environment occurs via two main mechanisms:
1) Mobilisation of cadmium impurities in raw materials such as phosphate minerals, fossil fuels and other extracted metals, through mining, smelting and refining. Mine atmospheric emissions, drainage water, wastewater, tailing pond overflow and rainwater runoff are also processes by which cadmium contamination can occur in the surrounding mine environment.
2) Manufacturing, application, release and/or disposal/incineration of cadmium bearing products e.g. batteries, pigments, alloys, fertilizer (currently dominant cadmium bearing product), pesticide/fungicide and sewage sludge/treated wastewater.
Cadmium is a non-essential element and is toxic to plants, animals and humans. Cadmium is persistent in the environment due to it being an element, is carcinogenic by inhalation (although not by ingestion) and affects the kidneys and bones in vertebrates. Since the late-1970s the effects of cadmium on the environment have become an issue of concern for the European Union, and since the mid-1980s countries have conducted evaluations on the exposure of their populations to cadmium in fertilizer. Cadmium’s toxicity, bioavailability, water solubility and soil mobility is highly dependent on the specific cadmium complexes/species present, as well as the water hydrochemistry and soil geochemistry – cadmium sulphate (CdSO4) and cadmium chloride (CdCl2) are water soluble, whereas cadmium metal (Cd), cadmium oxide (CdO), cadmium hydroxide [Cd(OH)2], cadmium carbonate (CdCO3), cadmium phosphate [Cd3(PO4)2] and cadmium sulphide (CdS) are almost water insoluble. Cadmium metal and cadmium oxide are less toxic than ionic cadmium (Cd2+, formed from the dissolution of cadmium complexes), but they transform to Cd2+ in the environment.
When cadmium is deposited onto the soil surface (either as a result of atmospheric deposition or phosphate fertilizer/sludge application), it is partitioned between the solid and liquid phases of the soil. Cadmium will then either be immobilised within the soil profile, leach from the soil solution away from the plough layer into the groundwater system, or be taken up from the soil solution by vegetation (which is then ultimately consumed by animals or humans). The concentration of partitioned cadmium within the soil profile (solid soil phase and liquid soil solution cadmium) is governed my interrelated and interactive factors and processes that effect cadmium speciation (and hence cadmium mobility and solubility). Cadmium is generally more mobile and bioavailable in non-saline, acidic, sandy, non-calcareous soils with a low clay and organic matter content (as cadmium tends to form immobile inorganic and organic cadmium complexes and adsorb to clays in silty to clayey and alkali, calcareous soils). This also results in more cadmium being present in the soil solution and ultimately groundwater. Neutral to alkaline soils are therefore able to accept a greater cadmium load than acidic soils.
Cadmium chemistry within water is similar to that of zinc, although it is more mobile in the aquatic environment than most other trace metals and has a relatively long residence time of 5-10 years. In unpolluted fresh water cadmium generally has a background concentration of
Trace Metal (Cadmium) Contamination of South African Aquifers
iii
0.01-1 µg/l. Precipitation and adsorption to mineral surfaces, hydrous metal oxides and organic material (especially humic acid) are the most important processes for removal of cadmium from the water column to bed sediments, with adsorption generally increasing with an increase in pH. Cadmium mobility in water is therefore enhanced by low pH, low hardness, low salinity, and low organic matter, suspended matter, iron/manganese oxide/hydroxide and clay content. Generally, in water with an acidic pH, cadmium solubility and mobility is controlled by organic matter and iron/manganese oxide/hydroxide content, whereas in water with an alkaline pH, cadmium solubility and mobility is controlled by the precipitation/co-precipitation of cadmium minerals. Cadmium hydroxide and cadmium carbonate are usually the dominate species under alkaline pH, while ionic cadmium, cadmium sulphate and cadmium chloride dominate in acidic water conditions.
Eight regional clusters (namely the Cape Town-West Coast, Springbok, Southern Cape, De Aar, Rustenburg, Witwatersrand, Limpopo-Olifants and Phalaborwa clusters) of cadmium groundwater contamination can be observed within South Africa, present possibly as a result of natural lithological (e.g. phosphates within the Sandveld and Bredasdorp Groups, and metal sulphides within the Namaqua Metamorphic Province and Bushveld Complex) and/or anthropological (e.g. mining operations, phosphate fertilizer and treated wastewater/sludge use for agriculture, unlined landfill sites and wastewater treatment works etc.) contamination. A variety of localised trace metal studies (including ecotoxicology assessments and surface/groundwater contamination studies) have also shown that cadmium contamination occurs within South African water systems, and the environment as a whole. The Eastern Cape mid-2000s pineapple cadmium contamination disaster provides a sobering local case study of the potential economic impact of using cadmium-contaminated phosphate fertilizer.
There are a range of options that can be implemented to reduce, remove, remediate or regulate cadmium within the environment e.g. developing environmental quality standards; development of actions, processes and regulations that control, reduce or eliminate the release of cadmium into the environment via raw materials, products and manufacturing/disposal processes; changing to best management farming practices that optimise crop production and minimise environmental impact; the use of phytoremediation and other trace metal treatment options for environmental remediation; and the undertaking of risk assessments. The main conflicting pressure will be maintaining or increasing agricultural input from infertile soil, which will require the addition of fertilizer (possibly containing cadmium).
STUDY SITE
The greater Hermanus region (including the Hemel en Aarde valley) study site incorporates the fractured Peninsula and Nardouw Aquifers, and the primary Bredasdorp Group Quaternary Aquifer. The Overstrand Local Municipality has embarked on a major groundwater development to augment the surface water supply in the greater Hermanus region since 2001, through the development of the Gateway and Hemel en Aarde Wellfields. The Skurweberg and Rietvlei Formation fractured quartzites and sandstones are also an effective aquifer (known as the Nardouw Aquifer), but it is not targeted for larger scale municipal groundwater development. Along with the thin overlying primary Bredasdorp Group Quaternary Aquifer, the Nardouw Aquifer has begun to be used extensively for private
Trace Metal (Cadmium) Contamination of South African Aquifers
iv
Schedule 1 use wellpoints and boreholes respectively by residents in Hermanus. Groundwater quality of both the Peninsula and Nardouw Aquifers is good (i.e. fresh and potable), with low electrical conductivity (EC), low solute content, acidic pH, and high iron and manganese concentrations being characteristic.
Groundwater samples were collected from seven boreholes in the Hermanus and Hemel en Aarde region, for hydrochemical (macro and trace metal [dissolved and total]) analysis. End of winter/early spring (early October 2013, after the last of the winter rains in September) and summer (early February 2014) groundwater samples were collected for all boreholes (except LV WP), in order to determine whether there was any seasonal effect on macrochemical or trace metal hydrochemistry. Two additional samples were collected during the test-pumping of LV01 during October 2012. Borehole samples were collected by either using a mobile submersible pump or from a previously installed borehole pump, with the borehole being purged three times its volume before the sample was collected (in order to sample fresh, non-stagnant groundwater). Groundwater samples were collected in new, clean, clear, 1 litre plastic sample bottles (washed three times with the sampled groundwater prior to sample collection), which were then stored in a cooler box with ice and refrigerated, before being transported to SANAS accredited analytical labs within 48 hours of sampling.
Elevated concentrations of arsenic (up to 25 µg/l), cadmium (up to 20 µg/l), chromium (up to 60 µg/l), cobalt (up to 20 µg/l), lead (up to 20 µg/l), nickel (up to 120 µg/l) and selenium (up to 27 µg/l) were observed. Elevated cadmium (and other trace metal) concentrations within the Nardouw and Quaternary Aquifers are possibly present as a result of phosphate fertilizer, treated wastewater/sludge or organic manure/compost application to the local golf course fairways and greens, or local/estate gardens in the Fernkloof area. Cadmium is highly mobile in non-saline, acidic, sandy, non-calcareous soils with a low clay and organic matter content, and fresh, acidic groundwater, both of which occur within the Peninsula, Nardouw and Quaternary Aquifers and overlying soil and sediment in the greater Hermanus region. The significant decline in total cadmium at LV01 from 20 µg/l in October 2012 to <1 µg/l and 4 µg/l in September 2013 and February 2014 respectively, might be due to pumping of LV01 for irrigation, removing cadmium material that had been hydraulically concentrated in fracture zones within the Nardouw Aquifer. The GWE08 and GWE10 February 2014 cadmium concentrations of 3 µg/l and 6 µg/l respectively, could possibly indicate down-gradient and cross-aquifer contamination of the Nardouw and Peninsula Aquifers, and further monitoring is required to determine if this contamination is occurring. The low (<1 µg/l) dissolved cadmium concentrations, where high associated total cadmium concentrations were present, may be due to either: a) cadmium being immobilised within the soil system by being adsorbed onto aluminium/iron/manganese oxides/hydroxides within the soil, with strong rainfall events transporting this precipitated particulate matter into the groundwater system through sandy, well-drained soils; or b) dissolved cadmium being adsorbed onto organic matter (at low pH organic matter is the only solid phase able to retain cadmium) or hydrated aluminium/iron/manganese precipitates.
Eleven soil samples were collected from various sites within the greater Hermanus and Hemel en Aarde region on the 13th February 2014 for trace metal analysis. The trace metals analysed, namely antimony, arsenic, cadmium, chromium, cobalt, lead, nickel and selenium, were selected based on the concentrations observed within the various previously collected hydrochemical samples (with the exception of iron and manganese, which are known to
Trace Metal (Cadmium) Contamination of South African Aquifers
v
naturally occur within the Table Mountain Group and associated weathered sediments). Samples of ~1 kg in weight were collected from the upper 30 cm of soil (where trace metals tend to accumulate) using a hand shovel, placed in a clear, unused plastic sample bag, and stored in temperatures below 35°C prior to submission to a SANAS accredited analytical laboratory within 48 hours of sampling.
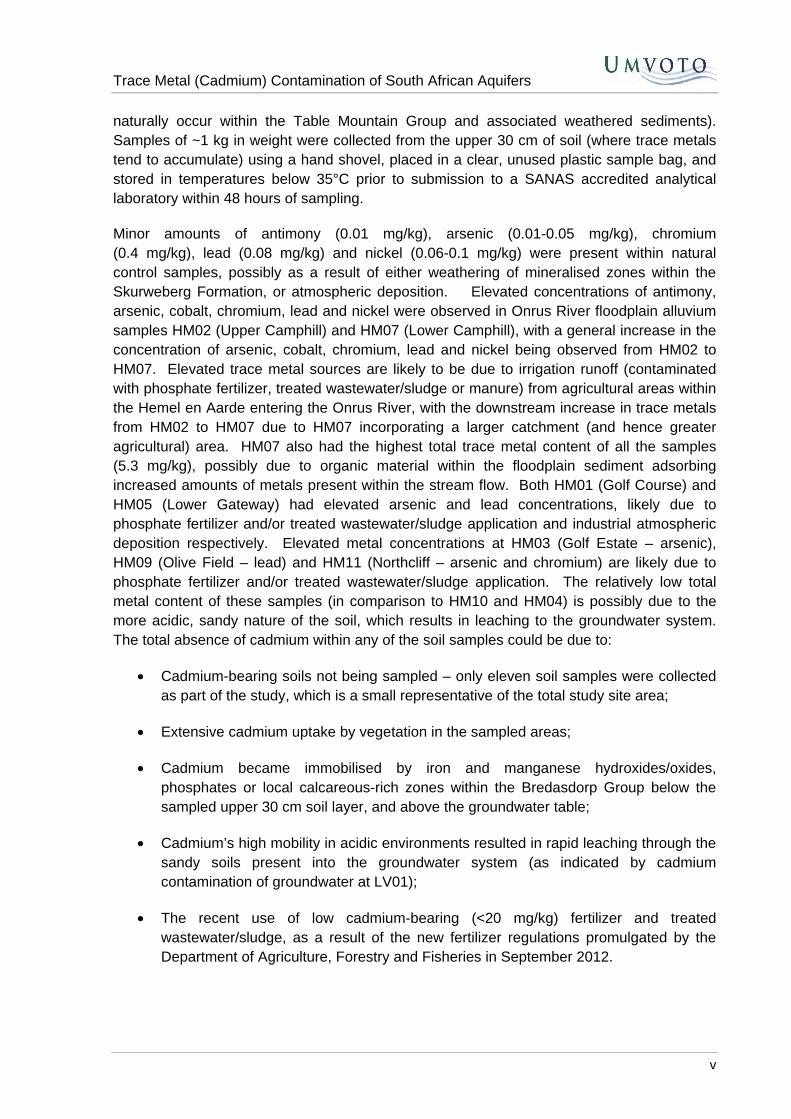
Minor amounts of antimony (0.01 mg/kg), arsenic (0.01-0.05 mg/kg), chromium (0.4 mg/kg), lead (0.08 mg/kg) and nickel (0.06-0.1 mg/kg) were present within natural control samples, possibly as a result of either weathering of mineralised zones within the Skurweberg Formation, or atmospheric deposition. Elevated concentrations of antimony, arsenic, cobalt, chromium, lead and nickel were observed in Onrus River floodplain alluvium samples HM02 (Upper Camphill) and HM07 (Lower Camphill), with a general increase in the concentration of arsenic, cobalt, chromium, lead and nickel being observed from HM02 to HM07. Elevated trace metal sources are likely to be due to irrigation runoff (contaminated with phosphate fertilizer, treated wastewater/sludge or manure) from agricultural areas within the Hemel en Aarde entering the Onrus River, with the downstream increase in trace metals from HM02 to HM07 due to HM07 incorporating a larger catchment (and hence greater agricultural) area. HM07 also had the highest total trace metal content of all the samples (5.3 mg/kg), possibly due to organic material within the floodplain sediment adsorbing increased amounts of metals present within the stream flow. Both HM01 (Golf Course) and HM05 (Lower Gateway) had elevated arsenic and lead concentrations, likely due to phosphate fertilizer and/or treated wastewater/sludge application and industrial atmospheric deposition respectively. Elevated metal concentrations at HM03 (Golf Estate – arsenic), HM09 (Olive Field – lead) and HM11 (Northcliff – arsenic and chromium) are likely due to phosphate fertilizer and/or treated wastewater/sludge application. The relatively low total metal content of these samples (in comparison to HM10 and HM04) is possibly due to the more acidic, sandy nature of the soil, which results in leaching to the groundwater system. The total absence of cadmium within any of the soil samples could be due to:
• Cadmium-bearing soils not being sampled – only eleven soil samples were collected as part of the study, which is a small representative of the total study site area;
• Extensive cadmium uptake by vegetation in the sampled areas;
• Cadmium became immobilised by iron and manganese hydroxides/oxides, phosphates or local calcareous-rich zones within the Bredasdorp Group below the sampled upper 30 cm soil layer, and above the groundwater table;
• Cadmium’s high mobility in acidic environments resulted in rapid leaching through the sandy soils present into the groundwater system (as indicated by cadmium contamination of groundwater at LV01);
• The recent use of low cadmium-bearing (<20 mg/kg) fertilizer and treated wastewater/sludge, as a result of the new fertilizer regulations promulgated by the Department of Agriculture, Forestry and Fisheries in September 2012.
Trace Metal (Cadmium) Contamination of South African Aquifers
vi
CONCLUSION, RECOMMENDATIONS AND FUTURE STUDIES
Cadmium is a highly mobile, bioavailable and potentially toxic trace metal, especially in environments such as acidic, sandy, non-calcareous soils (with low clay and organic matter contents) and acidic groundwater (with low salinity and hardness, and a low organic matter, suspended matter, clay and iron/manganese oxide/hydroxide content). Although at relatively low concentrations within the product itself, continuous application of phosphate fertilizer and treated sludge/wastewater with cadmium impurities can cause long term cadmium contamination of soil and ultimately (through leaching) groundwater systems. The observed cadmium (among other trace metals such as arsenic, lead, nickel and selenium) contamination within the unconfined Nardouw and Quaternary Aquifers in the greater Hermanus region (and specifically the eastern Fernkloof residential area), could possibly be a result of the application of phosphate fertilizer and treated wastewater/sludge in local recreational, residential and agricultural areas in association with acidic Table Mountain and Bredasdorp Group soil/sediment and groundwater. The following is recommended (incorporating potential future studies):
Local recommendations and studies
• Undertaking of additional detailed studies to supplement the results from the current project, due to the small sample size analysed for both groundwater and soils. This could include:
o Detailed analysis of fertilizer/wastewater composition and use (i.e. life cycle flows) in the greater Hermanus region.
o Further sampling of private Nardouw Aquifer boreholes in the vicinity of the Northcliff and Fernkloof residential areas, to determine the extent of possible Nardouw Aquifer contamination.
o Further sampling of Peninsula Aquifer production boreholes, in order to determine if cross contamination between aquifers is occurring.
o Detailed species analysis of cadmium found within groundwater (and soil, if present).
o Detailed soil and sediment analyses, including full trace and macrochemical analysis of soil constituents from 5 m deep auger samples through the entire soil and Bredasdorp Group unconsolidated sediment cover, in order to try isolate specific cadmium-soil interactions (if present).
o Botanical and biochemical studies of fynbos in the Hermanus region, to determine the extent to which indigenous vegetation absorbs cadmium from the soil and air.
• Updating or developing monitoring protocols for utilised aquifer systems to include seasonal trace metal (and specifically cadmium) sampling, especially with regards to vulnerable aquifers (i.e. unconfined primary and fractured aquifers with acidic groundwater) in the vicinity of agricultural/residential/industrials areas or golf courses.
Trace Metal (Cadmium) Contamination of South African Aquifers
vii
• Detailed hydrochemical and geochemical studies of barium, boron, lithium and strontium in TMG lithology and groundwater, in order to determine reasons for variations of these trace elements in the Peninsula and Nardouw Aquifers, as well as what the provenance and source (marine shales versus basement rocks) of these elements are.
Regional and national recommendations and studies
• Undertaking of detailed geological, hydrogeological, hydrochemical and contamination studies on each of the eight clusters of cadmium groundwater pollution within South Africa (Cape Town-West Coast, Springbok, Southern Cape, De Aar, Rustenburg, Witwatersrand, Limpopo-Olifants and Phalaborwa clusters), in order to determine the source and mechanisms of cadmium contamination in these regions. Although not within any of the clusters, a detailed surface and groundwater, hydrochemical and contamination study should be undertaken in the Eastern Cape in the vicinity of the mid-2000s cadmium contamination event.
• Development of a GIS (and possibly web based) cadmium groundwater contamination risk assessment model for South Africa (using the eight identified clusters as baseline data input areas), incorporating hazard analysis (i.e. point and non-point sources of pollution, cadmium flow assessments), an environmental vulnerability assessment (e.g. geochemical characteristics of each area, soil properties, hydrogeology etc.), and coping capacity review (the extent to which cadmium regulation, reduction, removal and remediation has occurred within each area and the country as a whole).
Trace Metal (Cadmium) Contamination of South African Aquifers
viii
TABLE OF CONTENTS
Chapter Description Page
EXECUTIVE SUMMARY .......................................................................................................... I
1. INTRODUCTION ................................................................................................ 1
1.1 Scope of Work ....................................................................................................... 1
2. LITERATURE REVIEW ...................................................................................... 3
2.1 General Cadmium Properties ................................................................................ 3
2.2 Sources of Cadmium ............................................................................................. 4 2.2.1 Natural Sources....................................................................................... 4 2.2.2 Anthropogenic Sources ........................................................................... 5 2.2.3 Cadmium in Fertilizer .............................................................................. 6
2.3 Cadmium Contamination in the Environment ........................................................ 8 2.3.1 Soil .......................................................................................................... 8 2.3.2 Surface and Groundwater ..................................................................... 10
2.4 Ecological and Human Health Effects of Cadmium Contamination .................... 13 2.4.1 Phytotoxicity .......................................................................................... 13 2.4.2 Ecotoxicity ............................................................................................. 14 2.4.3 Human Health ....................................................................................... 14
2.5 Cadmium in South African Water Systems ......................................................... 17
2.6 Cadmium Reduction, Removal, Remediation and Regulation ............................ 24
3. STUDY SITE ..................................................................................................... 27
3.1 Site Overview ...................................................................................................... 27 3.1.1 Locality and Topography ....................................................................... 27 3.1.2 Hydrology and Climatology ................................................................... 28 3.1.3 Geology and Hydrogeology ................................................................... 28
3.2 Sampling ............................................................................................................. 31 3.2.1 Hydrochemical Sampling....................................................................... 31 3.2.2 Soil Sampling ........................................................................................ 34
3.3 Results and Analysis ........................................................................................... 41 3.3.1 Hydrochemical Samples........................................................................ 41 3.3.2 Soil Samples ......................................................................................... 49
4. CONCLUSION, RECOMMENDATIONS AND FUTURE STUDIES ................. 55
5. REFERENCES ................................................................................................. 57
Trace Metal (Cadmium) Contamination of South African Aquifers
ix
LIST OF TABLES Table 3-1 Summary table of sampled boreholes within the greater Hermanus
region (including Hemel en Aarde). ................................................................. 34 Table 3-2 Summary of soil sample sites within the Hermanus region (including
Hemel en Aarde). ............................................................................................ 36 Table 3-3 Macrochemical analysis results from boreholes sampled in the greater
Hermanus region (including Hemel en Aarde). Red highlighted blocks indicate chemical constituents that do not meet the SANS 241-1:2011 Standard Limit for Health. ................................................................................ 51
Table 3-4 Total metal analysis results from boreholes sampled in the greater Hermanus region (including Hemel en Aarde). Red highlighted blocks indicate chemical constituents that do not meet the SANS 241-1:2011 Standard Limit for Health. ................................................................................ 52
Table 3-5 Dissolved metal analysis results from boreholes sampled in the greater Hermanus region (including Hemel en Aarde). Red highlighted blocks indicate chemical constituents that do not meet the SANS 241-1:2011 Standard Limit for Health. ................................................................................ 53
Table 3-6 Metal analysis results from soil samples taken in the greater Hermanus region (including Hemel en Aarde). Yellow highlighted blocks indicate metal concentrations that are relatively greater in comparison to the “natural” soil state within Fernkloof Nature Reserve (HM06) and Rotary Drive (HM08) (red highlighted sample IDs). .................................................... 54
Trace Metal (Cadmium) Contamination of South African Aquifers
x
LIST OF FIGURES
Figure 2-1 Cadmium groundwater quality map of South Africa (from Baker and Murray, 2013). Highlighted regional contamination clusters (this report) include: 1) Cape Town-West Coast cluster (red rectangle); 2) Springbok cluster (black square); 3) Southern Cape cluster (yellow rectangle); 4) De Aar cluster (white rectangle); 5) Rustenburg cluster (green rectangle); 6) Witwatersrand cluster (blue rectangle); 7) Olifants-Limpopo cluster (purple rectangle); 8) Phalaborwa cluster (dark blue square). ........................ 19
Figure 3-1 Examples of borehole hydrochemical and soil sampling sites within the greater Hermanus and Hemel en Aarde region: a) LV01 and HM03 at the private golf course estate; b) GWE08 and HM05 within the Hermanus industrial area, south of Gateway Shopping Centre; c) HM06 within Fernkloof Nature Reserve; d) HM07 within the Onrus River floodplain alluvium; e) GWE10 and HM10 within the Hermanus WWTW; f) WP4 and HM11 within Northcliff residential area, Hermanus. ................................. 33
Figure 3-2 Hydrochemical sampling points in the greater Hermanus region (including Hemel en Aarde). ............................................................................ 37
Figure 3-3 Hydrochemical sampling points in the greater Hermanus region (including Hemel en Aarde), in association with the local geology. ................. 38
Figure 3-4 Soil sampling points in the greater Hermanus region (including Hemel en Aarde). ............................................................................................................. 39
Figure 3-5 Soil sampling points in the greater Hermanus region (including Hemel en Aarde), in association with the local geology. ................................................. 40
Figure 3-6 Piper diagram plot for sampled Peninsula Aquifer (GWE10), Nardouw Aquifer (ABE01, GWE08, HAV7M and LV01) and Quaternary Aquifer (WP4) boreholes. Additional Peninsula Aquifer boreholes added to the plot for comparison include GWE06, FK01, HAV01, GWP01 and T4/2. ......... 44
Trace Metal (Cadmium) Contamination of South African Aquifers
xi
LIST OF ABBREVIATIONS ~ - approximately a - annum Alk - alkalinity AMD - acid mine drainage BIF - banded iron formation Cd - cadmium Cl - chloride cm - centimetre CEC - cation exchange capacity DOC - dissolved organic carbon DAP - di-ammonium phosphate DWA - Department of Water Affairs DWAF - Department of Water Affairs and Forestry EC - electrical conductivity EU - European Union hm3 - cubic hectometre (million cubic metres) IARC - International Agency for Research on Cancer ICP-MS - inductively coupled plasma mass spectrometry ICP-OES - inductively coupled plasma optical emission spectrometry kg - kilogram km - kilometre l - litre LM - Local Municipality Ma - millions of years m - metre m3 - cubic metres mg - milligram mm - millimetre mS - milliSiemens MAE - mean annual evaporation MAP - mono-ammonium phosphate / mean annual precipitation mbgl - metres below ground level mamsl - meters above mean sea level Na - sodium ng - nanogram NPK - nitrogen-phosphorous-potassium NHMRC - National Health and Medical Research Council NRMMC - National Resource Management Ministerial Council PVC - polyvinyl chloride REE - rare earth element SABS - South African Bureau of Standards SANS - South African National Standards SANAS - South African National Accreditation System TMG - Table Mountain Group TSP - triple superphosphate
Trace Metal (Cadmium) Contamination of South African Aquifers
xii
TWQR - Target Water Quality Range µg - microgram USA - United States of America UNEP - United Nations Environment Programme WHO - World Health Organisation WMA - Water Management Area WRC - Water Research Commission WWTW - wastewater treatment works
Trace Metal (Cadmium) Contamination of South African Aquifers
1
1. INTRODUCTION
1.1 SCOPE OF WORK
This document reports on “Water Research Commission (WRC) Project K8/1031/1: Non-point Source Trace Metal Contamination of South African Aquifers”.
This project aims to review cadmium contamination of South African aquifer groundwater systems via phosphate fertilizer – from fertilizer composition to trace metal mobilisation and bioavailability in soils and groundwater. International and local literature sources were collected and evaluated, in order to provide a thorough review of non-point source trace metal contamination through the application of phosphate fertilizer for agriculture and recreation e.g. golf courses (focusing on cadmium). Topics reviewed included fertilizer composition and types, metal speciation, metal mobility in soil and groundwater systems, metal bioavailability, health and environmental effects, and local contamination case studies.
A preliminary study site, namely the greater Hermanus region (including the Hemel en Aarde Valley), was identified for trace metal and groundwater quality studies (which incorporated urban and agricultural areas in various hydrogeological settings). Hermanus was selected due to the discovery of cadmium concentrations of 20 micrograms per litre (µg/l) in a golf estate irrigation borehole, during drilling and test-pumping of the borehole at the end of 2012. Cadmium is not usually found in water in concentrations above 1 µg/l, and higher concentrations are indicative of contamination (natural or anthropogenic). Chromium, cobalt, nickel, lead, selenium and antimony concentrations were also elevated and above 10 µg/l (the general concentration limits of these trace metals in unpolluted or non-mineralised aquifers). Due to the absence of industrial or landfill site point sources, the only other currently known, possible local source for trace metal (and specifically cadmium) contamination of groundwater in the estate borehole was phosphate fertilizer (applied over a minimum period of at least 70 years) and treated wastewater application (over the past 6 years) to the adjacent, century-old golf course or within the estate itself. The local aquifers are also not known to be naturally mineralised with respects to high concentrations of cadmium and other trace metals, other than iron and manganese.
As part of this study, groundwater samples from seven borehole sites (including the estate borehole in question) in primary and secondary (fractured) aquifers (in the vicinity of recreational and agricultural irrigation, as well as urban/industrial areas) were collected at the end of winter/early spring (early October 2013, after the last of the winter rains in September) and summer (early February 2014). These groundwater samples were analysed for macrochemistry and trace metal concentrations. Eleven soil samples were also collected from urban and natural areas in the region (as well as in the vicinity of each borehole sample site) for trace metal analysis, in order to determine whether there was a potential link between trace metals present within the upper soil surface and trace metal concentrations observed in groundwater samples through leaching.
Trace Metal (Cadmium) Contamination of South African Aquifers
2
The results of the study site hydrochemical and soil analyses is used in association with the literature review to provide recommendations for a large-scale non-point source trace metal (focusing on cadmium) groundwater pollution study within South Africa, provided a distinct contamination hazard is identified.
Trace Metal (Cadmium) Contamination of South African Aquifers
3
2. LITERATURE REVIEW
2.1 GENERAL CADMIUM PROPERTIES
Cadmium falls within Group 12 of the periodic table and in its elemental form is a soft, ductile, silver to bluish white divalent metal (chemically similar to zinc), which has no recognisable taste or odour. Cadmium does not occur in the environment in its pure elemental metal form, but as complex oxides, sulphides and carbonates in zinc, lead and copper ores (United Nations Environment Programme [UNEP], 2010). Cadmium is also rarely found in minerals such as greenockite (CdS), cadmoisite (CdSe), monteponite (CdO), otavite (CdCO3) and hawlegite (UNEP, 2010). Despite being a relatively rare element (67th element in order of abundance), it is widely distributed within the Earth’s crust at average concentrations of 0.1-0.2 milligrams per kilogram (mg/kg) (McLean and Bledsoe, 1992). In the absence of anthropogenic sources, base levels of cadmium in the environment are controlled by the original lithology and weathering processes (Krishnamurti et al., 2005):
• Igneous and metamorphic rocks (and associated soils) tend to have cadmium concentrations in the range of 0.01-0.3 mg/kg (indicating relatively low crustal abundance).
• Sedimentary rocks can have cadmium levels ranging from 0.01-1000 mg/kg. Limestones and sandstones generally have low cadmium concentrations, whereas organic-rich rocks of estuarine/marine origin e.g. black shales (>200 mg/kg) and phosphorites (10-1000 mg/kg) have much higher cadmium concentrations due to cadmium being a natural constituent of sea water (<5-10 ng/l).
• Zinc sulphide ores (composed of minerals such as sphalerite/wurtzite [(Zn,Fe)S]) form the most abundant natural source of cadmium, with concentrations ranging from 100s-1000s mg/kg. Cadmium is unique in the metal industry in that no known specific cadmium ore bodies exist or are exploited solely for cadmium production, as the metal is usually produced as a by-product of other metal ores such as zinc and nickel sulphides.
Natural and anthropogenic sourced cadmium is released into the atmosphere, aquatic environments (fresh surface and groundwater, estuaries and the ocean) and terrestrial environments (soil and biota). There are noticeable fluxes between all compartments, with long term sinks including deep ocean sediment (where cadmium has a residence time of 7 000-230 000 years, in comparison to a few days to years within the atmosphere) and controlled landfill sites (provided cadmium is immobilised and undisturbed) (Bennet-Chambers et al. [1999] and UNEP [2010]). Humans have used trace metals for thousands of years (especially lead and silver), although cadmium has a relatively short history of use – it was only discovered in Sweden in the 19th century, and used sparingly before World War II (Bergback et al., 1994). Total flows of anthropogenic sourced cadmium within society and the environment is not of the same magnitude as other trace metals such as chromium, lead and mercury. However, even in relatively small anthropogenic amounts, the mobility of
Trace Metal (Cadmium) Contamination of South African Aquifers
4
cadmium within the environment is a current (and future, as a result of ongoing acidification) environmental issue (Bergback et al., 1994).
Cadmium is a non-essential element and is toxic to plants, animals and humans. Cadmium is persistent in the environment due to it being an element (i.e. it cannot be broken down to a less toxic substance), is carcinogenic by inhalation (although not by ingestion) and affects the kidneys and bones in vertebrates (UNEP, 2010). Since the late-1970s the effects of cadmium on the environment have become an issue of concern for the European Union (EU), and since the mid-1980s countries have conducted evaluations on the exposure of their populations to cadmium in fertilizer (de Meeus et al., 2002). Cadmium’s toxicity, bioavailability, water solubility and soil mobility is highly dependent on the specific cadmium complexes/species present, as well as the water hydrochemistry and soil geochemistry – cadmium sulphate (CdSO4) and cadmium chloride (CdCl2) are water soluble, whereas cadmium metal (Cd), cadmium oxide (CdO), cadmium hydroxide [Cd(OH)2], cadmium carbonate (CdCO3), cadmium phosphate [Cd3(PO4)2] and cadmium sulphide (CdS) are almost water insoluble (UNEP, 2010). Cadmium metal and cadmium oxide are less toxic than ionic cadmium (Cd2+, formed from the dissolution of cadmium complexes), but they transform to Cd2+ in the environment (UNEP, 2010). Cd2+ complexes and cadmium metal are all stable and do not evaporate, although they are found as small particles in the air.
2.2 SOURCES OF CADMIUM
2.2.1 Natural Sources
Natural release of cadmium into the environment is due to the mobilisation of natural cadmium in the Earth’s crust and mantle (present in varying amounts according to lithology, as described in Section 2.1) by volcanoes, or weathering and erosion. Weathering and erosion releases ~15 000 tonnes of cadmium into the ocean via rivers annually, and plays an important role in the global cadmium cycle i.e. cadmium in rock released into soil and water via weathering and erosion, which is then absorbed by biota (UNEP, 2010). Natural atmospheric cadmium emissions (approximately 40 000 tonnes/year) from volcanoes (~1 600 tonnes/year), airborne soil/dust/clay particles (~24 000 tonnes/year), sea salt spray (~2 000 tonnes/year) and natural forest fires (~13 000 tonnes/year), is the most important mechanism for natural long-range cadmium transport in the environment (UNEP, 2010). Cadmium complexed particulate matter with sizes of <10 micrometres (µm) can travel hundreds to thousands of kilometres, and have an atmospheric residence time of 1-10 days before deposition (in comparison to thousands of years for oceanic cadmium residence times) (UNEP, 2010). Travel range and deposition is dependent on cadmium speciation and particle size, as well as meteorological factors. Cadmium levels in ambient, uncontaminated rural air generally range from 0.1-5 nanograms per cubic metre (ng/m3). The main cadmium compounds in air include cadmium oxide, cadmium chloride and cadmium sulphate, which are stable complexes in the atmosphere that do not undergo photochemical transformation (UNEP, 2010). Natural cadmium in soil and sediment sinks can also be remobilised as a result of natural processes e.g. submarine or surface landslides, natural acidification etc.
Trace Metal (Cadmium) Contamination of South African Aquifers
5
2.2.2 Anthropogenic Sources
Anthropogenic cadmium emissions exceed natural sources by an order of magnitude, and anthropogenic release of cadmium into the environment (air, soil, water and biota) occurs via two main mechanisms (UNEP, 2010):
3) Mobilisation of cadmium impurities in raw materials such as phosphate minerals, fossil fuels and other extracted metals (predominantly zinc, but including copper, lead and nickel), through mining, smelting and refining. Mine atmospheric emissions, drainage water, wastewater, tailing pond overflow and rainwater runoff are also processes by which cadmium contamination can occur in the surrounding mine environment.
4) Manufacturing, application, release and/or disposal/incineration of cadmium bearing products e.g. batteries, pigments, alloys, fertilizer (currently dominant cadmium bearing product), pesticide/fungicide and sewage sludge/treated wastewater.
Anthropogenic cadmium atmosphere emissions (in the form of cadmium oxide particles or gaseous elemental cadmium) are due to non-ferrous metal/iron/steel production, fossil fuel combustion, waste incineration and cement production (if cadmium carbonate or cadmium-bearing phosphates are present within cement-grade limestones) (UNEP, 2010). Cadmium concentrations from Greenland ice cores extracted in the 1960s/1970s show that cadmium concentrations at the time exceeded pre-industrial concentrations by eight (UNEP, 2010). Current ice cores have shown however that there has been a decline in cadmium atmospheric emissions since the 1970s, with a 50% decrease from 1990-2003 and a 90% decrease over the last 50 years (despite cadmium production between 1950-1990 remaining relatively constant) – this reduction is a result of improving smelting, refining and pollution technology (e.g. agglomeration, electrostatic purification of gas exhausts and exhaust filtration) (UNEP, 2010). Smelter emission particles are generally larger than natural atmospheric emission particles, and therefore settle relatively short distances downwards of the source (higher stacks and higher emission temperatures might increase transport range however) (UNEP, 2010). Cadmium air quality can range from 2-15 ng/m3 to 15-150 ng/m3 for industrial areas, depending on the level of contamination (UNEP, 2010).
Cadmium was used in a variety of products prior to the 1980s/1990s, after which its toxic health effects were recognised and cadmium use was significantly decreased. These uses included (Bergback et al. [1994] and UNEP [2010]):
• Pigments in plastics, ceramics and enamels. Cadmium sulphide was used in pigments, due to the colours it could produce (very light yellow, to orange and light red, to deep maroon) on its own or with varying amounts of cadmium selenide (CdSe). 90% of cadmium pigments was used in plastics (polyvinyl chloride [PVC], polythene and polystyrene), with the remaining 10% used in ceramics and glass.
• Iron/steel/non-ferrous metal electroplating. Cadmium was added as a coated electroplate due to its resistance to erosion by alkalis, water and the atmosphere. Electroplating formed 30-40% of the cadmium metal market prior to the 1980s.
Trace Metal (Cadmium) Contamination of South African Aquifers
6
• Plastic stabilisers. Organic cadmium salts (e.g. cadmium stearate and cadmium benzoate) were used as stabilisers in clear PVC, to protect the PVC from heat and light degradation.
• Copper, lead, zinc and tin alloys. Cadmium was added as an alloy due to its ductile nature to improve strength and wear resistance in objects such as car radiators. Cadmium can also be found as impurities in galvanized zinc drinking water pipes and solder, which can cause drinking water quality issues in acidic water.
The current major non-fertilizer use of cadmium is in nickel-cadmium batteries (both pocket and sintered-plate types) (Bergback et al., 1994). Other minor current product/industry uses include aerospace/vehicle industry alloys, communications and electronics, and power generation (Bester et al., 2013). Cadmium is also present within phosphate fertilizers (see Section 2.2.3) manure, household/solid waste compost, and sewage sludge. The presence of cadmium in sludge is due to industrial and domestic sewage containing trace amounts of cadmium, which is then formed into a concentrated residue (ranging from 1-3650 mg/kg) during the production of sludge. Soil (and possibly groundwater) contamination may occur If cadmium concentrations are high enough within the sludge, and continuous application occurs (since large amounts of sludge have to be used to meet nitrogen requirements).
2.2.3 Cadmium in Fertilizer
Phosphate rock (P2O5), which is the predominant component of phosphate fertilizer and is mined all over the world, is the general term for rock with natural phosphorous and calcium (and sometimes fluoride and chloride) deposits composed of minerals of the apatite group – Ca(PO4)3(F,OH,Cl) (Mar and Okazaki, 2012). Cadmium is a natural contaminant in all phosphate rock, but concentrations vary considerably depending on geological origin. Phosphate minerals include (Mar and Okazaki, 2012):
• Fluorapatite Ca5(PO4)3F – 15-20% of global phosphate deposits, and present within igneous and metamorphic rocks such as carbonatites and mica-pyroxenites. Magmatic phosphates usually have low cadmium concentrations of <1 mg Cd/kg P2O5. Carbonatite phosphates usually contain higher concentrations of rare earth elements (REE), strontium, barium and thorium in comparison to cadmium (Otero et al., 2005). Deposits are present within the former Soviet Union regions, Finland, South America, and Phalaborwa in South Africa.
• Hydroxyapatite Ca5(PO4)3OH – found in igneous and metamorphic rocks, as well as biogenic deposits e.g. bone deposits.
• Carbonate hydroxyapatites Ca5(PO4,CO3)3OH – 2-3% of global phosphate deposits, and present within guano on islands and in caves.
• Carbonate hydroxyapatites Ca5(PO4,CO3)3F – 75% of global phosphate deposits (and responsible for 80-90% of global phosphate production) and present within sedimentary rocks (e.g. phosphorites), of which 70% is found within the sedimentary marine deposits of the Late Cretaceous to Eocene (~100-30 million year old [Ma]) Mediterranean Tethyan Phosphogenic Province that straddles North Africa and the
Trace Metal (Cadmium) Contamination of South African Aquifers
7
Middle East. Other sedimentary phosphate deposits are present within the western United States of America (USA), Russia, China and West Africa. Cadmium concentrations can range from <20-200 mg Cd/kg P2O5 (although as high as 300 mg Cd/kg P2O5 in Senegalese deposits), with additional trace metal impurities including uranium, arsenic, chromium, lead, selenium, cobalt, mercury and nickel (all of which may be 10-50 times the concentration of cadmium) (Otero et al., 2005).
More than forty countries globally produce phosphate fertilizer, with the USA being the largest producer, exporter and consumer, and South Africa the 10th largest producer (Mar and Okazaki, 2012). 95% of the 150 million annually mined tonnes of phosphate rock is used in the production of phosphate fertilizer, producing 30 million tonnes of phosphate nutrients (Mar and Okazaki, 2012). Phosphate fertilizer types (in both dry and liquid form) include raw mined rock phosphate, and processed superphosphate, nitrogen-phosphorous-potassium (NPK) blends, mono-ammonium phosphate (MAP), di-ammonium phosphate (DAP), triple superphosphate (TSP) and micro-nutrient fertilizers (Jiao et al., 2012). MAP, DAP and TSP are generally low cadmium bearing fertilizers, whereas micro-nutrient (iron-manganese-zinc blend) fertilizers can have extremely high levels of cadmium in some cases (275-500 mg/kg cadmium) (Mar and Okazaki, 2012).
Most phosphate rock has to be processed to produce phosphate fertilizer, as soils often cannot break down raw rock phosphate into phosphoric acid and in essence elemental phosphorous. The major phosphate production method is known as the “Wet Process” of fertilizer production, where phosphate rock is added to sulphuric acid (often resulting in a residual gypsum waste with high concentrations of trace metals, especially cadmium) (Al-Shawi and Dahl, 1999). The “Odda Process”, which uses nitric acid on phosphate rock and generally results in decreased trace metal and cadmium concentrations, is used in China, northern and eastern Europe and former Soviet Union territories, although it is generally not a commercially viable process for naturally high-cadmium phosphate rock (Al-Shawi and Dahl, 1999). At present there is no economically viable means (at current fertilizer prices) to remove cadmium totally from phosphate fertilizer during the production phase (Mar and Okazaki, 2012), although laboratory pilot decadmiation processes are currently being studied.
The application of phosphate fertilizers, in association with atmospheric deposition, is the current major contributor of increased anthropogenic cadmium in agricultural soil, and ultimately the environment (through possible surface water and groundwater pollution) (UNEP, 2010). 55% and 40% of anthropogenic cadmium in the environment in Europe is present as a result of phosphate fertilizer application and atmospheric deposition respectively, while this ratio is 50/50 in the USA (Jiao et al., 2012). Phosphate fertilizer is only responsible for 8% of anthropogenic cadmium in China however, with atmospheric deposition playing a much larger contamination role (Jiao et al., 2012).
The amount of fertilizer added in a single application may be insignificant versus the volume of the receiving soil – 500 kg/hectare of phosphate fertilizer containing 20 mg/kg of cadmium will result in 0.0033 mg/kg of cadmium in the top 20 centimetre (cm) of topsoil over one hectare (de Meeus et al. [2002] and Jiao et al. [2012]). However, continuous application of fertilizer with higher cadmium concentrations over an extended period of time will result in a gradual build-up of soil cadmium (as observed in Europe and Australia) (de Meeus et al.,
Trace Metal (Cadmium) Contamination of South African Aquifers
8
2002). Cadmium contamination is also a relatively long lasting form of pollution due to the long natural half-life of cadmium in the terrestrial environment and biota, as well as the cadmium uptake of plants long after contamination ceases (Krishnamurti et al., 2005). The type, amount, method and timing of application is therefore critical in the use of phosphate fertilizers (Jiao et al., 2012). Conflicting issues arise when fertilizer essential to the provision of nutrients for crop growth and successful harvests (especially in common, nutrient deficient sandy soils), in combination with an ever increasing human population, is going to result in an increasing food demand. This will in turn result in an increased demand for phosphate fertilizer, against the declining availability of relatively clean and cadmium free phosphate rock.
Although outside the scope of this report, increased phosphate application can also have the same nutrient load effects on the environment as nitrogen-based fertilizers i.e. increased nutrient levels and the eutrophication of rivers and estuaries (Bennet-Chambers et al., 1999).
2.3 CADMIUM CONTAMINATION IN THE ENVIRONMENT
It must be noted that with both soil and water systems, the fate of metals is influenced by a range of dynamic, interactive, interrelated and simultaneous processes, which include:
• Input from various natural and anthropogenic sources;
• Hydrochemical and geochemical properties and variations in water and soil media respectively; and
• Chemical reactions between various metal species/complexes and other inorganic/organic components within the solution and solid phases.
The concentration of a contaminant (except in extreme cases) within a media therefore does not necessarily provide information on its chemical behavior, indicate a pollution/toxicological risk or its presence in food supply. Only an understanding of all these interrelated factors will allow for the ecological consequences of trace metal contamination, such as the leaching of metals to groundwater and bioavailability/toxicity of trace metals such as cadmium to microbes, plants, animals and humans, to be determined (Krishnamurti et al., 2005).
2.3.1 Soil
Natural soil cadmium background concentrations generally range between 0.05-0.2 mg/kg (depending on the geological substrate), with the naturally highest soil cadmium concentrations occurring on black shales (10-25 mg/kg) (Krishnamurti et al., 2005). The significance of decades of cadmium-bearing phosphate fertilizer application to soils can be observed in European and Australian soils. European agricultural soils generally have a soil cadmium concentration range of 0.1-2 mg/kg (increasing up to as much as 14 mg/kg in the presence of point sources of contamination), while dissolved cadmium within Australian agricultural soil solutions ranges from 0.2-20 µg/l (UNEP [2010] and de Vries and McLaughlin
Trace Metal (Cadmium) Contamination of South African Aquifers
9
[2013]). 90% of cadmium in soils is found within the top 15 cm (the plough layer), with this upper topsoil also generally having double the cadmium concentration of the lower subsoil (UNEP, 2010).
When cadmium is deposited onto the soil surface (either as a result of atmospheric deposition or phosphate fertilizer/sludge application), it is partitioned between the solid and liquid phases of the soil. Cadmium will then either be immobilised within the soil profile, leach from the soil solution away from the plough layer into the groundwater system, or be taken up from the soil solution by vegetation (which is then ultimately consumed by animals or humans) (McLean and Bledsoe, 1992). The concentration of partitioned cadmium within the soil profile (solid soil phase and liquid soil solution cadmium) is governed my interrelated and interactive factors and processes that effect cadmium speciation (and hence cadmium mobility and solubility), namely (McLean and Bledsoe [1992], Krishnamurti et al. [2005] and UNEP, 2010):
• pH conditions – the chemistry of cadmium in soil is predominantly controlled by pH, with cadmium solubility and mobility increasing greatly under acidic conditions (pH <6). Cadmium is one of the most mobile trace metals in acidic soils, and little adsorption of cadmium by soil colloids, clays, hydrous oxides and organic matter occurs under these conditions.
• Inorganic/organic complexation, precipitation/dissolution reactions, adsorption/ desorption reactions, reincorporation/mineralisation and redox (oxidation-reduction) reactions – cadmium can be immobilised in soil by being adsorbed onto clay minerals, carbonates, hydrous iron/manganese oxides and organic matter, or precipitated as cadmium carbonate (CdCO3), cadmium hydroxide [Cd(OH)2] or cadmium phosphate [Cd3(PO4)2] (especially under neutral to alkaline conditions). These reactions and processes form the primary mechanism of cadmium immobilisation and removal from soils, thus preventing the movement of cadmium into the groundwater system. Metal-soil interactions at the soil surface usually means that downward transport of cadmium does not occur to a great extent, unless the metal retention capacity of the soil is overloaded or there are significant changes to the pH.
o Calcium carbonate forms a site for the adsorption of ionic cadmium (Cd2+) at low cadmium concentrations, while cadmium carbonate will precipitate at higher cadmium concentrations.
o Hydrous iron and manganese oxides play a principal role in the retention of cadmium in soil, causing the co-precipitation of cadmium in neutral or alkaline conditions. The solubility of iron and manganese is also pH related however, with the oxides and hydroxides of iron and manganese dissolving below a pH of 6, releasing any adsorbed or co-precipitated cadmium into solution.
o Organic matter is more effective in immobilising cadmium in comparison to inorganic material. Organic matter content decreases with depth however, therefore the mineral constitute of the soil (hydrous iron/manganese oxides,

Trace Metal (Cadmium) Contamination of South African Aquifers
10
carbonates etc.) plays a greater role in the mobilisation of cadmium with depth.
o Cadmium can form soluble complexes with both inorganic and organic material, particularly chlorides, which increase cadmium mobility within soils.
• Cation exchange capacity (CEC) – the larger the soil’s CEC (which is determined by the clay content and clay mineralogy), the greater the amount of cadmium that can be adsorbed onto clay particles and immobilised.
• Soil texture and moisture content - increased soil particle size and high soil moisture content increases the mobility of cadmium. Heavily textured soils (i.e. clayey soils) tend to attenuate cadmium in the soil profile.
• Plant uptake/residue – cadmium behaves chemically similar to zinc, nickel, lead and copper within soil. The similarity between zinc and cadmium can be problematic, as zinc is an important micronutrient for plants and animals. An increase in soil zinc concentrations can reduce cadmium availability to plants, as zinc and cadmium compete at root uptake sites. Higher zinc concentrations in fertilizer also results in zinc occupying the majority of adsorption sites within the soil This reduces the bioavailability of cadmium to plants, however it may result in an increased amount of cadmium being available within the soil solution, which in turn may be leached into the groundwater system.
• Agrochemical factors – the timing and rate of fertilizer application, application of lime, crop types used, plant removal etc. all can have an impact on the amount of cadmium entering the soil system, as well as the soil properties and hence cadmium speciation itself.
Cadmium is therefore more mobile and bioavailable in non-saline, acidic, sandy, non-calcareous soils with a low clay and organic matter content (as cadmium tends to form immobile inorganic and organic cadmium complexes and adsorb to clays in silty to clayey and alkali, calcareous soils). This also results in more cadmium being present in the soil solution and ultimately groundwater. The liming of soil to increase pH to >6 will increase cadmium precipitation or adsorption by soil, thereby decreasing the concentration of dissolved and bioavailable cadmium within the soil solution. Neutral to alkaline soils will also be able to accept a greater cadmium load than acidic soils.
2.3.2 Surface and Groundwater
Cadmium chemistry within water is similar to that of zinc (and to a lesser extent copper), although it is more mobile in the aquatic environment than most other trace metals and has a relatively long residence time of 5-10 years. In unpolluted fresh water cadmium generally has a background concentration of 0.01-1 µg/l, with most cadmium occurring within the water column either in a (UNEP, 2010):
Trace Metal (Cadmium) Contamination of South African Aquifers
11
• dissolved state as a hydrated ion [Cd(H2O)62+], or
• in an ionic complex with other inorganic or organic substances (e.g. CdSO4, Cd(OH)2, CdCO3, Cd3(PO4)2 or cadmium-humate from interacting with humic acid);
with minor cadmium amounts being transported as coarse particulate and colloid matter. Cadmium is only mobile in its soluble form (namely ionic cadmium, Cd2+), otherwise it is non-mobile and is adsorbed to sediment or present as a settled precipitate. Precipitation and adsorption to mineral surfaces, hydrous metal oxides and organic material (especially humic acid) are the most important processes for removal of cadmium from the water column to bed sediments, with adsorption generally increasing with an increase in pH (UNEP, 2010). Cadmium that is precipitated as a stable solid of carbonate, or co-precipitated with hydrous iron/manganese oxides, is less likely to be remobilised by re-suspension of sediment through sedimentary or biological activity (with the opposite being true to cadmium adsorbed onto mineral surfaces such as clay or organic material) (UNEP, 2010). Cadmium concentration in sediments is therefore generally at least one order of magnitude greater than in the overlying water, especially in neutral to alkaline water systems.
Characteristics influencing the leaching of cadmium from soil to groundwater (and in essence surface water) are similar and intimately related to those affecting the cadmium mobility and solubility within soil, and include (Mann and Ritchie [1993], Krishnamurti et al. [2005], Usman and Dosumu [2007] and UNEP [2010]):
• Recharge i.e. rainfall amount – increased, continuous recharge will result in increased leaching of cadmium to groundwater.
• Infiltration rate i.e. soil drainage, which is a function of soil type – sandy, more permeable soils will result in increased leaching of cadmium to groundwater.
• Mobility and solubility of the metal – affected by cadmium speciation, as well as the hydrochemistry and geochemistry of the groundwater/soil solution and soil respectively.
o Cadmium sulphate (CdSO4) and cadmium chloride (CdCl2) are water soluble, whereas cadmium sulphide (CdS), cadmium oxide (CdO), cadmium hydroxide [Cd(OH)2], cadmium phosphate [Cd3(PO4)2], cadmium carbonate (CdCO3) and elemental cadmium (Cd) are almost insoluble in water. Cadmium complexation with chloride ions also increases with salinity (CdCl+, CdCl2, CdCl3-), while cadmium sulphide/oxide/phosphate/carbonate can become soluble through the interaction with acids, light or oxygen (i.e. can photo-oxidise to ionic cadmium – Cd2+). The toxicity of cadmium species varies according to organism type, although soluble ionic cadmium and cadmium chloride are generally more bioavailable and toxic, in comparison to organic cadmium complexes (e.g. cadmium-humate and cadmium-citrate is not absorbed by plants).
o Cadmium mobility in water is enhanced by low pH (i.e. below 6.5, and especially between 4.5-5.5, with a decrease in pH of 0.2 units or more
Trace Metal (Cadmium) Contamination of South African Aquifers
12
bringing about significant solubilisation and mobilisation of inorganic and organic cadmium complexes), low hardness (cadmium is adsorbed strongly onto or exchanges with calcium in carbonates), low salinity, and low organic matter, suspended matter, iron/manganese oxide/hydroxide and clay content. It must be noted though that although cadmium mobility increases with decreasing pH, cadmium toxicity is reduced in low pH due to H+/Cd2+ competition at organism membranes.
o At low pH organic matter is the only solid phase component able to retain cadmium (and trace metal cations in general), thereby reducing soluble forms. Soluble organics might increase the cadmium concentration within water however, if soluble organic cadmium complexes are formed.
o Generally, in water with an acidic pH, cadmium solubility and mobility is controlled by organic matter and iron/manganese oxide/hydroxide content, whereas in water with an alkaline pH, cadmium solubility and mobility is controlled by the precipitation/co-precipitation of cadmium minerals. Cadmium hydroxide and cadmium carbonate are usually the dominate species under alkaline pH, while ionic cadmium, cadmium sulphate and cadmium chloride dominate in acidic water conditions.
• Depth of the groundwater table below the unsaturated soil/surface – because cadmium only exists in the 2+ oxidation state in water, aqueous cadmium is not strongly affected by the redox potential of water. Cadmium is however more soluble and mobile, and leaching occurs to a greater extent in oxidising conditions, in comparison to flooded (i.e. high groundwater level) reducing conditions e.g. cadmium sulphide is a common precipitate in reducing environments. Wetlands can play an important role in trapping cadmium – up to half of cadmium inflow into a wetland can be removed and stored in sediment as cadmium sulphide, reducing cadmium’s bioavailability. That said, higher groundwater tables in aerated aquifers can enhance leaching of cadmium, due to reduced transport distances from the unsaturated to saturated zones.
• Agrochemical factors – for example, timing and rate of fertilizer application, application of lime, crop types used and plant removal.
Usman and Dosumu (2007) showed that at study sites in Dass (Bauchi State, northeastern Nigeria) phosphate fertilizer application over three decades had led to cadmium groundwater contamination in surrounding boreholes and wells – boreholes neighbouring 25-30 year old cultivated land had groundwater cadmium concentrations of 70 µg/l (versus the control site of 1.5 µg/l), while boreholes neighbouring younger cultivated land had reduced cadmium levels (40 µg/l, 10 µg/l and 5 µg/l for 15-25 year old, 10-20 year old and 5-10 year old cultivated land respectively). Bergback et al. (1994) showed that it takes 6 years at a soil/soil solution pH of 4.2 to cause a 10% decrease in cadmium concentration within the soil horizon, while it only takes 3 years to remove 10% soil cadmium at a pH of 3.2 (equivalent of transporting 30% of soil cadmium into the groundwater system in a single decade). Modelling also indicated that calculated amounts of cadmium in soil and sediment in Sweden was probably overestimated, and that a significant proportion of cadmium had leached into the
Trace Metal (Cadmium) Contamination of South African Aquifers
13
groundwater system (Bergback et al., 1994). Acidic soils with a low buffering capacity could therefore form a major future groundwater pollution problem if arable land is abandoned and liming is discontinued, as any sudden decline in pH could trigger soil cadmium release into the groundwater system (Bergback et al., 1994). If soils are naturally alkaline or amended using lime, then the leaching of cadmium through the soil profile into groundwater, even in highly polluted soils, is not likely to occur to an appreciable extent (Krishnamurti et al., 2005). Even a small amount of mobile pollutant may have an effect on the quality of groundwater though.
2.4 ECOLOGICAL AND HUMAN HEALTH EFFECTS OF CADMIUM CONTAMINATION
2.4.1 Phytotoxicity
Although cadmium is not an essential nutrient required for plant life (background cadmium levels within plants are generally <1 mg/kg), it is still readily taken up by plants (UNEP, 2010). Plants can generally absorb much larger concentrations of and tolerate cadmium better than animals and humans before toxic effects are noticed, and mutations can allow some species to accumulate even larger amounts of the metal (Cabrera et al., 1994). Bioaccumulator plants, whose genetic and physiological characteristics allow them to absorb large amounts of cadmium, include the tobacco plant, sunflowers (especially in sunflower kernels), aquatic plants such as water hyacinth, and willow plants (Satarug et al. [2003] and Lambert et al. [2007]). The mechanism of cadmium uptake in plants is generally through the roots, although cadmium accumulation within plants is a very complex process dependent on soil, plant and environmental factors (Bester et al., 2013).
Increased cadmium uptake by plants usually occurs when cadmium concentrations are high within the soil and soil solution (which is in turn dependent on the type of phosphate fertilizer/sludge applied and type of application), high temperature and salinity, and when pH, clay content/CEC, organic matter content, iron/manganese/aluminium oxide/hydroxide content, and zinc concentrations are low (Bester et al., 2013). Ionic cadmium (Cd2+) and mobile inorganic cadmium complexes (e.g. cadmium chloride) are generally more bioavailable to and absorbed more by plants, in comparison to organic cadmium complexes (Department of Water Affairs and Forestry [DWAF], 1996a). Plant factors also affect the rate and amount of cadmium accumulation, including root activity and root uptake, direct foliar uptake, cadmium movement within plant tissue types, plant species and plant age (Bester et al., 2013).
Cadmium usually accumulates in the leaves of plants to a greater extent than roots and seeds (although some plants do contain large concentrations of cadmium in these plant portions), and therefore dicotyledonous plants (including leafy vegetables such as lettuce and spinach) usually have higher concentrations of cadmium when compared to monocotyledonous plants (grains and grasses) (Krishnamurti et al., 2005). Cadmium is chemically similar to zinc, and can therefore interfere with plant metabolic processes that use zinc at high enough cadmium concentrations (DWAF, 1996a). At toxic concentrations (usually 5-30 mg/kg in soil, but highly dependent on plant species) cadmium reduces the quality and yield of crops – nutrient solution concentrations of 100 µg/l and 1000 µg/l reduced the yields of bean/beets/turnips and cabbage/barley by 25% and 20-50% respectively
Trace Metal (Cadmium) Contamination of South African Aquifers
14
(DWAF, 1996a). A 25% reduction in yield was observed in spinach and rice grown in soil with cadmium concentrations of 4 mg/kg and 640 mg/kg respectively (DWAF, 1996a).
2.4.2 Ecotoxicity
As with plants, cadmium is not an essential nutrient for animal life, although it accumulates steadily within all trophic levels of the environment (from macrophytes and phyto/zooplankton all the way to humans). Cadmium concentrations within organisms are usually dependent on species, temperature/season, environmental hydro/geochemistry, ambient cadmium levels and cadmium speciation, diet, age and the sex of the organism. Marine biota (whether vertebrate or invertebrate, including dugongs, turtles, molluscs, phyto/zooplankton etc.) generally have much higher cadmium concentrations (tens to thousands of times greater than sea water concentrations) than their fresh or terrestrial counterparts due to cadmium being persistent within the ocean, while relatively naturally high cadmium levels can also be found in older, terrestrial carnivores (i.e. bioaccumulators who graze on either soil invertebrates or herbivores) (UNEP, 2010). Excessive cadmium levels in organisms are almost always associated with proximity to industrial or urban areas, and point source discharge points such as mines or smelters (UNEP, 2010). In grazing ruminants such as cows, increased cadmium levels may be present due to grazing on soils treated with phosphate fertilizers or sludge.
Cadmium bioaccumulates in the kidney and liver (rather than muscle tissues) of vertebrates, and can persist in body tissue over relatively long periods of time compared to other trace metals, causing delayed toxicity (UNEP, 2010). Cadmium toxicity is not often observed in animals even though it is highly toxic, due to cadmium having a low intestinal absorption and combining with proteins (e.g. metallothionein in mammals, see Klaassen et al. [2010]) that reduces its toxicity. Chronic and acute cadmium exposure in animals can however have a variety of health effects similar to those seen in humans, and are often related to interference with calcium metabolism and the replacement of zinc in some enzymes due to their chemical similarity. These effects include anaemia, abortions/stillbirths, immune system deficiency, reduced feed intake and milk production in stock, reduced growth, enlargement of joints and skeletal damage, liver and kidney damage, scaly skin and increased mortality (DWAF, 1996b and UNEP, 2010).
2.4.3 Human Health
In the general (i.e. non-occupational exposure) non-smoking human population, >90% of cadmium enters the body via dietary intake, with the remaining <10% due to the inhalation of particulate matter from the ambient air/second-hand smoke or from drinking water (UNEP, 2010). Only in exceptionally polluted areas will intake from air, soil (in the case of geophagy) or water be greater within the general population. Importantly, in the context of this report, cadmium is absorbed in the body to a greater extent through water in comparison to food. For smokers the major source of cadmium exposure is the inhalation of cigarette smoke. As with plants and animals, cadmium is a non-essential element, and is mutagenic (induces
Trace Metal (Cadmium) Contamination of South African Aquifers
15
mutation), carcinogenic (cancer causing) and teratogenic (interference with the development of a foetus). Cadmium pollution is a potential source of exposure for future generations in both developed and developing countries, due to its persistence and contamination throughout the entire trophic system (Krishnamurti et al., 2005).
The first description of the health effects of cadmium was lung damage after acute inhalation in the 1930s in Sweden, followed by the identification of itai-itai disease (ouch-ouch disease) in Japan after World War II (UNEP, 2010). Symptoms of itai-itai disease included fractures and severe bone pains followed by renal dysfunction as the critical effect (i.e. death from kidney failure), which was linked to local Japanese communities with a low calcium diet consuming cadmium-contaminated rice (UNEP, 2010). This rice that had been grown on fields whose soil and irrigation water had been contaminated by a nearby lead-zinc mine (Krishnamurti et al., 2005). Other countries where cadmium-related renal failure has been reported in industrial and agricultural workers include Belgium, Thailand, Spain, Sri Lanka, Russia, Czech Republic and Canada (Bandara et al., 2010). International warnings with respect to cadmium toxicity were issued in the 1970s, and in 1992 the World Health Organisation (WHO) identified renal dysfunction as the critical effect of cadmium poisoning (UNEP, 2010). The International Agency for Research on Cancer (IARC) classifies cadmium and cadmium compounds in Group I, that is elements or compounds carcinogenic to humans (IARC, 1997). The recommended dietary intake by the WHO is 0.8 µg/kg body weight per day, or about 25 µg/kg body weight per month (WHO, 2011). Non-smokers in the USA usually consume ~0.35 µg/kg/day and ~0.30 µg/kg/day for males and females respectively (UNEP, 2010).
The kidney is the critical target organ in humans (i.e. nephrotoxicity), both as a result of acute and chronic cadmium exposure, in the occupational exposed and general (smoking and non-smoking) population (UNEP, 2010). Acute cadmium poisoning can also cause irritation of the respiratory tract, leading to pneumonitis and emphysema (UNEP, 2010). Renal dysfunction via proteinuria (loss of proteins through urine), followed by often irreversible nephropathy (kidney disease) are the main effects of cadmium exposure on the renal system (UNEP, 2010). Nephrotoxicity severity depends on the duration and magnitude of cadmium exposure, although cadmium has a very long biological half-life within the human body (10-20 years in the kidney, 5-10 years in the liver, 30 years in the kidney cortex and body overall), therefore mid to long term exposure via bioaccumulation within the body can occur (Bennet-Chambers et al., 1999).
Skeletal damage (low bone mineralisation, increased rate of fractures, intense bone pain) and osteoporosis is often a secondary response to kidney damage or a direct action of cadmium on bone cells, often at concentrations higher than those that cause nephrotoxicity (due to cadmium altering calcium metabolism) (UNEP, 2010). Skeletal and nephrotoxicity are the effects usually observed in populations exposed to cadmium contaminated food or drinking water, while lung and renal dysfunction are the effects experienced by industrial workers exposed to airborne cadmium (Krishnamurti et al., 2005). As with animals, cadmium toxicity may not be observed in some humans even though it is highly toxic. This is due to cadmium having a low intestinal absorption (5% of ingested cadmium is absorbed, of which a third of this is transported to the kidney) and the presence of the protein metallothionein (which can have reduced levels or be absent in some specific populations – see Klaassen et
Trace Metal (Cadmium) Contamination of South African Aquifers
16
al. [2010]). Blood cadmium levels usually reflect recent, acute cadmium exposure, while urinary cadmium levels reflect chronic cadmium exposure and cadmium concentrations within the kidneys themselves (UNEP, 2010).
Cadmium is a carcinogen by inhalation, with the lungs being the primary target organ (IARC, 1997). Some research has suggested a link between cadmium exposure and leukemia, renal, urinary, pancreatic, stomach, liver, prostate and breast cancer, however results have been inconclusive. This is due to the difference in human susceptibility and a lack of knowledge of dietary components (e.g. foods from different areas, methods of food preparation) making unequivocal links between cadmium ingestion and adverse health effects difficult (de Meeus et al., 2002), and therefore cadmium has not been declared a carcinogen by ingestion as of yet (UNEP, 2010). Other health effects cadmium exposure has been linked to include heart disease, hypertension, endocrine disruption, reproductive effects if maternal exposure occurs (low birth weights and spontaneous abortion), and impediment of motor skills, learning difficulties and behavioral issues in children (UNEP, 2010).
Vulnerable population groups or individuals to cadmium exposure include (UNEP, 2010):
• Populations or individuals with cadmium-rich diets, namely vegetarians, vegans, high cereal/pulse/legume eaters, shellfish eaters (2-30 mg/kg cadmium in shellfish meat) and organ meat (kidney and liver) eaters. Cereal fibre may inhibit the absorption of iron, resulting in low iron stores and increased cadmium absorption. Women eating shellfish at least once a week have a cadmium intake double that of women who have a mixed diet, while oyster fishermen in New Zealand had two to three times elevated cadmium concentrations compared to non-oyster eaters.
• Smokers, who receive a double exposure of cadmium, and have blood cadmium levels four to five times higher and kidney cadmium concentrations two to three times higher than non-smokers. Tobacco plants are known bioaccumulators, and cadmium oxide formed during the burning of cigarettes is highly absorbable. 50% of inhaled cadmium is absorbed into the circulation system of smokers, which is the equivalent of 1-3 µg/day from a single cigarette pack (a single cigarette can have 0.5-2 µg of cadmium).
• Populations or individuals with nutritional deficiencies (e.g. low iron stores, zinc and calcium), which may result in increased cadmium uptake.
• Older individuals with reduced renal efficiency, and individuals with diabetes and other kidney diseases.
• Women – higher concentrations of cadmium in blood, urine and the kidney are present in women in comparison to men, possibly due to differences in the kinetics of cadmium.
• Foetuses and children.
Trace Metal (Cadmium) Contamination of South African Aquifers
17
• Individuals or population groups living in the close vicinity of industrial plants, smelters, mines, and areas with corrosive drinking water in combination with cadmium-plated zinc plumbing.
• Occupational workers, who experience acute exposure of cadmium via the respiratory tract.
2.5 CADMIUM IN SOUTH AFRICAN WATER SYSTEMS
Cadmium contamination-specific studies are relatively scarce in South Africa, due to:
1) Trace metal contamination of groundwater in South Africa generally thought of being the result of industrial or landfill site point sources. Although fertilizers and sludge/wastewater use have been acknowledged as potential non-point sources of trace metal contamination (see Conrad et al. [1999] and Usher et al. [2004]), the majority of agricultural pollution studies in South Africa have focused on organic pesticide, nitrate and phosphate groundwater contamination e.g. London et al. (2000) and Jovanovic et al. (2012). This is despite the mid-2000s pineapple cadmium contamination disaster within the Eastern Cape, which was caused by using cadmium-contaminated phosphate fertilizer (Hill et al., 2012).
2) The majority of current non-agricultural geochemical studies in the country focusing predominantly on the acidification and salinisation caused by acid mine drainage (AMD) from the Witwatersrand Basin goldfields in Gauteng and Mpumalanga coalfields (e.g. Nengovhela et al. [2006], McCarthy [2010] and McCarthy [2011], among many others), and the introduction of uranium (e.g. Coetzee et al. [2006]) into the environment from AMD. This is despite Coetzee et al. (2006) highlighting that very high levels of cadmium (700 times background levels) were identified within parts of the Wonderfonteinspruit Catchment in Gauteng/North West (although the presence of these high cadmium levels were not expanded upon, due to the study’s terms of reference focusing on uranium contamination), and Hodgson and Krantz (1998) identifying cadmium as being a possible contaminant from opencast coal mining in the Olifants River (above Loskop Dam).
Regional and national groundwater studies have identified and/or acknowledged the presence and/or risk of cadmium however. Usher et al. (2004), in identifying and prioritising contaminants within South Africa’s urban catchments, identified the current urban practices and industries where cadmium could be used and released as a potential contaminant (as described in Section 2.2.2). Usher et al. (2004) ranked cadmium as number 39 out of a total of 121 contaminants on a national prioritisation contaminant list for South Africa, and the 12th, 13th, 10th and 9th most important contaminant in Gauteng, Durban, Cape Town and Port Elizabeth respectively. Conrad et al. (1999) assessed the impact of agricultural practices (namely the use of nitrate fertilizers, intensive animal husbandry, sewage sludge application and pesticide use) on the quality of groundwater resources in South Africa, and identified that cadmium is a possible pollution risk from phosphate fertilizers and sludge application. Cadmium concentrations of ~100 µg/l were detected in groundwater at the selected sludge
Trace Metal (Cadmium) Contamination of South African Aquifers
18
application test site (only metal present at levels higher than regulatory limits), and Conrad et al. (1999) stated it was likely linked to sludge application. The other agricultural test sites made use of nitrate fertilizers, and hence no cadmium contamination was observed.
Groundwater Africa is currently undertaking a study for the WRC (Project No. K5/2254) to characterise and distinguish the chemical composition of shallow and deep groundwater within the shale gas exploration areas of the Karoo Basin (Baker and Murray, 2013). Deliverable 4 of the study produced hydrochemical groundwater quality maps using the Department of Water Affair’s (DWA) Water Management System for a range of constituents (including cadmium) over the whole of South Africa (Baker and Murray, 2013). The national cadmium map (showing cadmium concentrations of greater than 0.003 milligrams per litre (mg/l) or 3 µg/l – contamination in terms of the SANS 241-1:2011 Standard Limit for Health [SABS, 2011]) indicate eight interesting regional clusters of cadmium groundwater contamination (identified in this report, see Figure 2-1):
1) Cape Town-West Coast cluster – Cadmium groundwater contamination might be a result of both natural and anthropogenic factors. The Varswater and Velddrif Formations of the Sandveld Group are sedimentary formations rich in phosphates (which were once mined in the Langebaanweg area on the West Coast), and occur extensively in the Cape Town (Cape Flats) and West Coast (Sandveld) area. Therefore, natural cadmium contamination of groundwater may occur (high cadmium concentrations are generally present in sedimentary phosphates), if groundwater from the primary Sandveld Group aquifer interacts with these formations. The Table Mountain Group (TMG) in the southwestern Cape is also anomalously enriched in phosphorous (whose source is still unknown), therefore there might be a minor natural source of cadmium from TMG sandstones and shales if cadmium-bearing phosphates are the source of phosphorous. Use of this groundwater for irrigation, in association with possible phosphate fertilizer or sludge use for agriculture in the Cape Flats and Sandveld areas, may further increase cadmium concentrations. Other urban anthropogenic groundwater contamination in Cape Town might be in the form of unlined landfill site leakage, various atmospheric emissions and industrial cadmium use. Smelting of iron ore at Saldanha may lead to atmospheric cadmium emissions contaminating land surfaces and hence groundwater in the West Coast area.
2) Springbok cluster – Cadmium groundwater contamination may be due to base metal mining operations in the area, or natural contamination due to groundwater interacting with metal sulphides within the Namaqua Metamorphic Province granite-gneisses.
3) Southern Cape cluster – This cluster is similar to the Cape Town-West Coast cluster, in that cadmium groundwater contamination might be a result of both the same natural hydrogeological and anthropogenic factors. The De Hoopvlei and Klein Brak Formations of the Bredasdorp Group are the southern Cape (sometimes phosphate bearing) marine gravel analogues to the Varswater and Velddrif Formations respectively. Therefore, natural cadmium contamination of groundwater may occur, as these gravels usually form good primary aquifers. Use of this groundwater for irrigation, in association with possible phosphate fertilizer or treated sludge use for agriculture in the southern Cape area, may further increase cadmium concentrations.
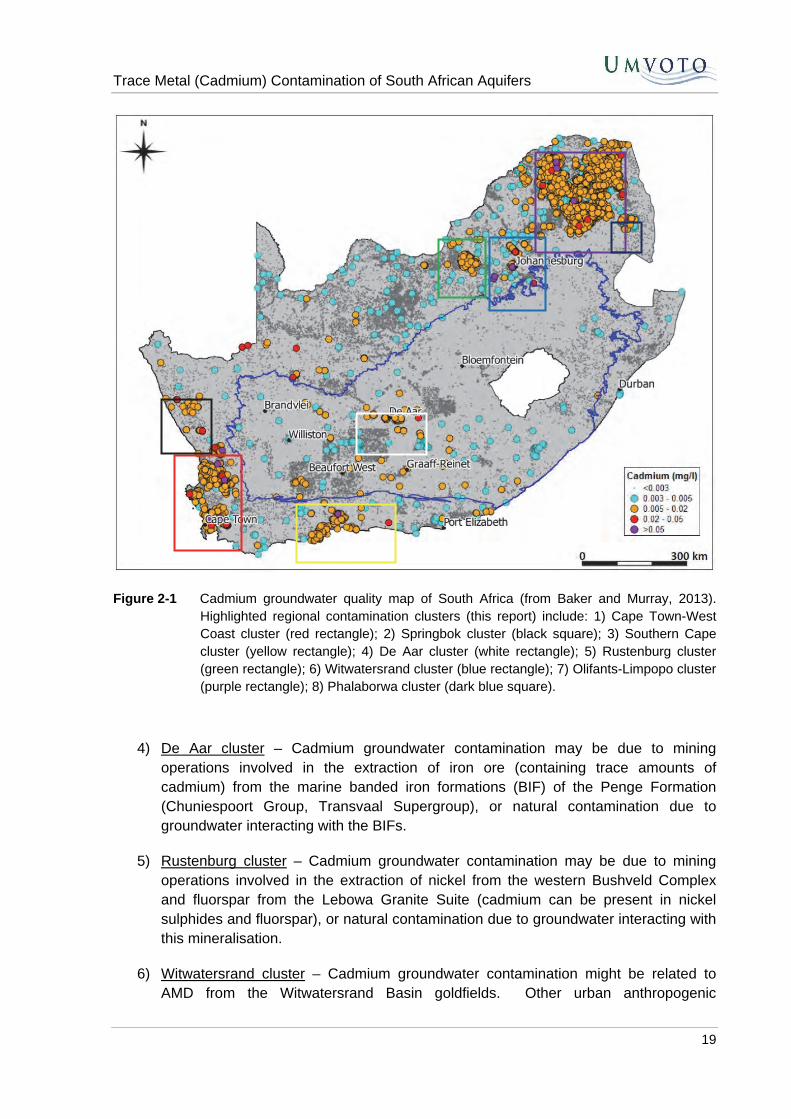
Trace Metal (Cadmium) Contamination of South African Aquifers
19
Figure 2-1 Cadmium groundwater quality map of South Africa (from Baker and Murray, 2013). Highlighted regional contamination clusters (this report) include: 1) Cape Town-West Coast cluster (red rectangle); 2) Springbok cluster (black square); 3) Southern Cape cluster (yellow rectangle); 4) De Aar cluster (white rectangle); 5) Rustenburg cluster (green rectangle); 6) Witwatersrand cluster (blue rectangle); 7) Olifants-Limpopo cluster (purple rectangle); 8) Phalaborwa cluster (dark blue square).
4) De Aar cluster – Cadmium groundwater contamination may be due to mining operations involved in the extraction of iron ore (containing trace amounts of cadmium) from the marine banded iron formations (BIF) of the Penge Formation (Chuniespoort Group, Transvaal Supergroup), or natural contamination due to groundwater interacting with the BIFs.
5) Rustenburg cluster – Cadmium groundwater contamination may be due to mining operations involved in the extraction of nickel from the western Bushveld Complex and fluorspar from the Lebowa Granite Suite (cadmium can be present in nickel sulphides and fluorspar), or natural contamination due to groundwater interacting with this mineralisation.
6) Witwatersrand cluster – Cadmium groundwater contamination might be related to AMD from the Witwatersrand Basin goldfields. Other urban anthropogenic
Trace Metal (Cadmium) Contamination of South African Aquifers
20
groundwater contamination might be in the form of unlined landfill site leakage, various atmospheric emissions and industrial cadmium use.
7) Olifants-Limpopo cluster – The Olifants-Limpopo cluster forms the largest cadmium groundwater contamination cluster in the country. Contamination may be either due to mining operations involved in the extraction of: a) nickel from the eastern and central Bushveld Complex; b) fluorspar from the Lebowa Granite Suite; or c) coal from the Mpumalanga Karoo Supergroup coalfields (Emalahleni, Middelburg and Bethal area) in the source area of the Olifants River; causing contamination of the Olifants and Limpopo Rivers (which are then further used for extensive agriculture). Natural contamination may occur due to groundwater interacting with this mineralisation, as well as fluorapatite within the Ecca Group (Karoo Supergroup) in the Springbok Flats.
8) Phalaborwa cluster – Fluorapatite (within phoscorite) is mined from the Phalaborwa Complex (an igneous alkali complex), and is the most important source of phosphate in South Africa. Although at relatively low concentrations in comparison to sedimentary phosphates, cadmium is present within igneous-derived fluorapatite. Cadmium groundwater contamination in the Phalaborwa area may either be a result of mining operations, or natural contamination due to groundwater interacting with phoscorite.
Scattered 3-20 µg/l cadmium containing boreholes (light blue and light orange points on Figure 2-1) in the Karoo and Northern Cape might be a result of local agricultural fertilizer or sludge/manure use coupled with extensive groundwater irrigation on semi-arid infertile soils, or local contamination from rural unlined landfill sites/wastewater treatment works. Natural contamination due to groundwater interacting either with a) metal sulphides within the Namaqua Metamorphic Province granite-gneisses in the northwestern portion of the Northern Cape, or b) thin phosphorite layers within the Dwyka and Ecca Groups of the Karoo Supergroup in the Eastern and Northern Cape, might also occur. Cadmium containing boreholes with concentrations of 20-50 µg/l (red points on Figure 2-1) in the Northern Cape northeast of the Springbok cluster might be related to base metal mining operations, or natural metal sulphide contamination. The relative minor occurrence of cadmium contamination in the eastern portion of South Africa (most of KwaZulu-Natal, northeastern Eastern Cape, eastern Free State and southern Mpumalanga) might be due to well developed, fertile soil profiles requiring minor nutrient application coupled with minor groundwater use due to relatively high rainfall.
A variety of localised trace metal studies have shown that cadmium contamination occurs within South African water systems, and the environment as a whole. These include:
• Schoonbee et al. (1995) – Three species of wetland bird found at the Natalspruit River wetland in Gauteng (a system known to be polluted by metals from mine and industrial waste) were studied to determine the cadmium, copper, lead and nickel concentrations in the blood, bone, kidney and liver of each species. Cadmium was found to have the lowest concentrations of all four metals analysed, with the highest concentrations expectedly occurring within the kidney (3-5 µg/l). The study indicated
Trace Metal (Cadmium) Contamination of South African Aquifers
21
that dietary preference was important in the bioaccumulation of trace metals within the birds, including cadmium.
• Sanders et al. (1999) – Cadmium and zinc concentrations were measured in water, sediment and freshwater crab (specifically Potamonautes warreni) samples from the Germiston (polluted) and Potchefstroom (relatively unpolluted) Lakes in the Gauteng/North West area, to determine whether P. warreni could be used as a cadmium and/or zinc accumulation bioindicator. Cadmium levels ranged between ~2-5 µg/l and ~50-140 mg/kg for water and sediment within both lakes, while an average cadmium concentration of 3 mg/kg was present for crab samples from both lakes (i.e. little to no difference between polluted and unpolluted systems). The relatively low cadmium concentrations within the freshwater crab samples were likely a result of the relatively low cadmium concentrations within the lake waters (despite being higher than target water quality ranges for aquatic systems; see Section 2.6 below), as well as the low bioavailability of cadmium within the lake sediments.
• Henning et al. (2001) – The use of treated sewage/wastewater sludge (containing cadmium, copper, lead and zinc) as organic fertilizer, and the possible bioaccumulation of metals within maize seeds, was tested on clayey, loamy and sandy soils. The study found that the background concentrations of cadmium remained low in all three soil types, even after the application of sludge. The bioavailability of cadmium was lowest in the clayey soil, due to the increased CEC causing the formation of stable, immobile cadmium complexes. The sandy soil had the highest bioavailability after sludge treatment however, possibly due to the dissolution of cadmium organic complexes and the formation of inorganic cadmium complexes that were taken up more readily by the maize.
• Meyer and Casey (2004) – Groundwater utilised by goats and local communities in three areas around the Bushveld Complex was analysed for a range of metals (including arsenic, cadmium, lead, mercury, molybdenum and selenium). The Jericho area (Bojanala District Municipality) within the central Bushveld Complex had groundwater with high cadmium concentrations ranging up to 186 µg/l (with a mean of 38 µg/l), indicating possible cadmium contamination and risk to livestock and human health.
• Okonkow and Mothiba (2004) – Trace metal (cadmium, copper, lead and zinc) analysis of surface water from rivers in Thohoyandou (Limpopo) was undertaken. Cadmium concentrations of 1.6-4.6 µg/l and 3.3-9.3 µg/l were reported for the dry (winter) and wet (summer) seasons respectively, with the seasonal variation likely due to runoff from summer rains flushing fertilizer-rich agricultural soils in the area. The study states that relatively high cadmium concentrations pose a possible risk to both human (untreated water is used for domestic consumption) and river ecological health.
• van Aardt and Erdmann (2004) – Sediment and mudfish tissue from three dams along the Mooi River catchment, which drains gold mining areas in Gauteng and the North West, was analysed for cadmium, copper, lead and zinc. High cadmium concentrations of up to 400 mg/kg were found in the various dam sediments, however

Trace Metal (Cadmium) Contamination of South African Aquifers
22
fish kidney tissue reported relatively low cadmium concentrations of 1-3.5 µg/l. The study suggested that the high pH, hardness and alkalinity of the various dam waters immobilised cadmium within the sediment, making it unavailable to organisms in large concentrations. A drop in pH below 6.5 and any disturbance to river or dam sediments might remobilise cadmium however, putting the river ecology (and any users) at risk of contamination.
• Fatoki et al. (2002), Fatoki and Awofolu (2003), Fatoki et al. (2004) and Awofolu et al. (2005) – All four studies focused on trace metals within rivers of the Eastern Cape. Fatoki et al. (2002) found cadmium concentrations varied between 10-260 µg/l within the Umtata River, while Fatoki and Awofolu (2003) found cadmium concentrations of 8-11 µg/l, 7-9 µg/l, 3-17 µg/l, 3-7 µg/l, 3-15 µg/l and 0-7 µg/l for the Buffalo, Keiskamma and Tyhume Rivers, and Sandile and Umtata Dams respectively. Cadmium concentrations of 0.005-0.06 mg/kg were also observed within sediment from the rivers and dams. Fatoki et al. (2004) found reduced cadmium concentrations of ~1-7 µg/l in the Umtata River. The studies identify possible contamination sources as being runoff from agricultural soils using phosphate fertilizers, sewage works, urban runoff, natural weathering of cadmium bearing lithology (such as the Ecca Group), as well as unlined rural landfill sites (possibly with nickel-cadmium batteries). The decrease in cadmium concentrations in the Umtata River across the various studies is suggested by the authors to be the result of intervention programmes being implemented. These included the monitoring and removal of wastes close to river banks, controlling the use of pesticides and fertilizers, obtaining of permits by sewage works, development and implementation of education programmes, and workshops with all stakeholders (Fatoki et al., 2004). The majority of the rivers are used for untreated domestic consumption and agricultural irrigation, which is problematic considering the SANS 241-1:2011 Standard Limit for Health (3 µg/l) is generally exceeded for all the sampled rivers and dams. Awofolu et al. (2005) also showed that vegetables irrigated with water from the Tyhume River were contaminated with cadmium. The potential human health impacts of cadmium exposure in/from the Umtata River via drinking water ingestion, dermal exposure and fish/shellfish consumption were significantly reduced as a result of the intervention programmes implemented (Fatoki et al., 2004).
• Street et al. (2009) – Analysis of Merwilla plumbea, a plant whose bulbs are used extensively for traditional medicine, shows that it is a strong cadmium bioaccumulator. This could be a human health issue, where cadmium-rich fertilizer, treated sludge or irrigation water is used.
• Mason-Jones and von Blottnitz (2010) – The use and disposal of nickel-cadmium cells (the basic components of nickel-cadmium batteries) within the City of Cape Town was investigated, in order to determine the associated cadmium flows. The authors contend that there may be large amounts of cadmium within the city, possibly in municipal waste streams or landfill site material.
• Samie et al. (2012) – Household surveys, water and wastewater samples were collected from 22 villages within the Limpopo Province, in order to determine a) the
Trace Metal (Cadmium) Contamination of South African Aquifers
23
hydrochemical profile of drinking water within homes as well as the sources (boreholes, rivers and dams) of this drinking water; and b) the level of parasitic contamination within these sources and wastewater from sewage treatment plants. The study found high concentrations of nitrate, phosphate, lead and cadmium within the water samples. Cadmium had a range of 0-49 µg/l from 42 samples with a mean of 7.7 µg/l, with <5 µg/l samples having a frequency of ~50%, 5-10 µg/l a frequency of ~30%, and >10 µg/l a frequency of ~20% across all Limpopo districts. The highest cadmium levels were found in the Waterberg District Municipality however, and it was noted that “in the region where samples were collected some residents indicated that the presence of the mine has been of concern to the population as the mine often dumped the used water in the local river.” The study indicated that dumped mine waste, along with agriculture, animal waste, human waste (through poor hygiene and sanitation standards), underground chemistry and waste disposal could be sources of cadmium contamination, although further studies would be required to determine this.
• Meerkotter (2012) – The presence of cadmium, lead and zinc within local agricultural systems in the Kraaifontein/Philippi areas of Cape Town was investigated, with respect to possible source inputs (fertilizers, agrochemicals, sludge/manure and groundwater irrigation), as well as the crops themselves. The study found that there was excess cadmium in most vegetables from both areas (as well as within groundwater in Philippi area), possibly as a result of using untreated animal manure.
The Eastern Cape mid-2000s pineapple cadmium contamination disaster provides a sobering local case study of the potential economic impact of using cadmium-contaminated phosphate fertilizer. From 2004 to 2006 pineapple growers and producers (i.e. Summerpride Foods Ltd., South Africa’s only pineapple processing plant and the largest in the southern hemisphere) in the Eastern Cape unwittingly used cadmium-contaminated zinc-phosphate fertilizer (sourced in China and sold by a local listed supplier), resulting in 2000 hectares of pineapples being infected with higher than permissible levels of cadmium (South Africa had no regulations dealing with trace metals in fertilizer or agricultural products at the time) (Hill et al., 2012). The contamination was first identified in export pineapples to Switzerland in November 2006, when canned pineapples exceeded the EU permissible cadmium level of 0.05 mg/kg (after which the fertilizer was identified as the contaminant source) (Hill et al., 2012). EU certification was withdrawn and canned pineapples for export were rejected, resulting in a loss of credibility in a sensitive market (Hill et al., 2012). Because other export markets could not be found, the crops were left to rot – these large crop losses:
• affected 40 farmers and shut down farms;
• caused the loss of 500 jobs and placed 2 700 direct jobs at risk;
• affected 35 000 other jobs dependent on the industry (processors, transporters and distributors); and
• resulted in Summerpride Food Ltd. losing most of its 3% world canned pineapple market share, and 90% of South Africa’s canned pineapple market (with canned pineapples now being imported to South Africa from Swaziland) (Hill et al., 2012).
Trace Metal (Cadmium) Contamination of South African Aquifers
24
The loss of 2000 hectares of pineapples was worth R80 million, with rehabilitation likely to cost R60 million and take over five years (Hill et al., 2012). The Eastern Cape economy was also strongly affected, as Summerpride Foods Ltd. was a major contributor. No studies have been undertaken yet to determine whether there was any associated groundwater or surface water cadmium contamination.
2.6 CADMIUM REDUCTION, REMOVAL, REMEDIATION AND REGULATION
There are a range of options that can be implemented to reduce, remove, remediate or regulate cadmium within the environment. The main conflicting pressure will be maintaining or increasing agricultural input from infertile soil, which will require the addition of fertilizer (possibly containing cadmium) (Bennet-Chambers et al., 1999). These options include:
1) Developing environmental quality standards that specify the maximum acceptable cadmium concentrations for media such as potable water, surface/groundwater (i.e. ecological health), air, soil and foodstuffs (UNEP, 2010).
• Drinking water quality limits for cadmium include 2 µg/l for the Australian Drinking Water Guidelines (NHMRC/NRMMC, 2011), and 3 µg/l for the WHO Guidelines for Drinking-water Quality (WHO, 2011) and South African SANS 241-1:2011 Standard Limit for Health (SABS, 2011). The South African Water Quality Guidelines Target Water Quality Range (TWQR) for cadmium for irrigation and livestock watering (DWAF, 1996a and 1996b) is <10 µg/l, while the TWQR for cadmium for aquatic ecosystems (DWAF, 1996c) ranges from <0.15 µg/l to <0.4 µg/l (depending on water hardness). The maximum permissible cadmium content in soil is set at 3 mg/kg for South African sludge amended soils (Snyman and Herselman, 2006).
• Cadmium in foodstuffs is regulated in South Africa by the Foodstuffs, Cosmetics and Disinfectants Act (No. 54 of 1972), specifically the “Regulations relating to maximum levels for metals in foodstuffs No. R. 500 30 April 2004”. Fruit, vegetables, meat and processed meat have a limit of 0.05 mg/kg, fish and processed fish a limit of 1 mg/kg, cereals, pulses and legumes a limit of 0.1 mg/kg, shellfish and shellfish products a limit of 3 mg/kg, and natural mineral water a limit of 3 µg/l (Department of Health, 2004). Enforcing these limits can prove difficult however (especially in developing countries), as shown in Australia where high cadmium levels exceeding regulations have been found in foodstuffs (Bennet-Chambers et al., 1999).
2) Development of actions, processes (using best available technologies) and regulations that control, reduce or eliminate the release of cadmium into the environment via raw materials, products (fertilizers, sludge, batteries, pesticides etc.) and manufacturing/disposal processes (low emission process technologies, cleaning of off-gases/wastewater/sludge, detailed waste management systems) (UNEP, 2010).
Trace Metal (Cadmium) Contamination of South African Aquifers
25
• Limiting the amount of cadmium present as impurities in high volume materials (fertilizer, sludge, organic waste products) through regulation or economic incentives/taxes/restrictions. Regulation can be phased, as in the EU where limits of cadmium in fertilizer have been set at 40 mg Cd/per kg P2O5 by 2010 and 20 mg Cd/per kg P2O5 by 2015 (Cupit et al., 2002). Cadmium charges or taxes could be applied on fertilizer exceeding a certain cadmium concentration (based on the cost of decadmiation), or products from cadmium vulnerable/risk zones could be identified using branding (forcing producers to change their farming methods or processing technology if at fault, in order to retain consumers) (Cupit et al., 2002). The Department of Agriculture, Forestry and Fisheries in South Africa has just recently (September 2012) promulgated “Regulations regarding fertilizers No. R. 732” as part of the Fertilizers, Farm Feeds, Agricultural Remedies and Stock Remedies Act (No. 36 of 1947), which sets the limit of cadmium (amongst a suite of other trace metals) in sewage sludge and all fertilizer types at 20 mg/kg (in line with the EU 2015 limit).
• Replacement of nickel-cadmium batteries with lithium or nickel hydride varieties (Bergback et al., 1994).
• Use of potassium or nitrogen based fertilizers with naturally low cadmium, lead and arsenic concentrations, instead of phosphate fertilizers (Bennet-Chambers et al., 1999). This may trigger other environmental issues such as nitrate groundwater contamination, and the enhancement of climate change and ozone depletion (nitrous oxide is the third most important greenhouse gas, and causes coupled chemical ozone depletion) (Bennet-Chambers et al., 1999).
• Use of phosphate rock naturally low in cadmium, or removing cadmium during phosphate fertilizer manufacture (i.e. decadmiation). Current large scale processes of decadmiation include the Odda Process (attack of phosphate rock with nitric acid; Al-Shawi and Dahl, 1999), while lab pilot processes include co-crystallisation into a removable/treatable anhydrate, precipitation of cadmium with an organic sulfide, extraction of cadmium using organic solvents, or ion exchange using a resinous bed (Cupit et al., 2002). Issues include that there are insufficient reserves of low cadmium phosphate rock to meet the demand in Europe, there is a price premium (5% higher than the world average) on low cadmium phosphate rock from South Africa and Jordan, and that the removal of cadmium during the fertilizer manufacturing stage will increase the price of phosphate fertilizer (Bennet-Chambers et al. [1999] and Cupit et al. [2002]).
3) Change to best management farming practices, including using appropriate nutrient sources (fertilizer, sludge, other organic waste such as manure), irrigation with low salinity water, application rates and timing, crop cycling, and nutrient placement taking into consideration soil properties (Jiao et al., 2012). These practices will optimise crop production and minimise environmental impact.
• Development of low-cadmium content crops using genetic engineering will reduce the risk of cadmium consumption by humans and animals, but will not remove cadmium from the soil and environment (Bennet-Chambers et al., 1999).
Trace Metal (Cadmium) Contamination of South African Aquifers
26
• Addition of lime, low to non-cadmium bearing phosphate and zinc, low to non-cadmium bearing organic matter/wastes, mining waste (bauxite and synthetic rutile waste), iron/manganese hydroxides/oxides, aluminium, clays or other soils rich in these features (e.g. peaty sand or goethite-bearing yellow earth) to agricultural soil (especially sandy, acidic types), to stimulate the retention of cadmium in non-mobile forms (Mann and Ritchie, 1993).
• Provision of livestock with Vitamin C, calcium, iron, zinc and selenium dietary supplementations, in order to reduce the intake and internal absorption of cadmium (DWAF, 1996b).
4) Use of phytoremediation processes (phytoextraction, rhizofiltration and phytostabilisation) by natural cadmium hyperaccumulator plants (e.g. aquatic plants such as the water hyacinth) for environmental remediation (Bennet-Chambers et al., 1999), or use agricultural waste composed of specific hyperaccumulator plants as water treatment filters (Bandara et al., 2010). Remediation of irrigation or drinking water contaminated with cadmium (and possibly other trace metals) can also be undertaken by using a range of other chemical, physico-chemical and biological/biochemical/biosorptive technologies and processes (see Hashim et al. [2011] for a thorough review of these technologies).
5) Risk assessments (Risk [R] = Hazard [H] x Vulnerability [V] / Coping Capacity [C]) to identify high cadmium contamination risk areas, by undertaking a cadmium hazard analysis (i.e. point and non-point sources of pollution, cadmium flow assessments), an environmental vulnerability assessment (e.g. geochemical characteristics of the area, soil properties, hydrogeology etc.), and coping capacity review (using the priorities in the Hyogo Framework for Action [UN/ISDR, 2005], of which South Africa is a signatory).
Trace Metal (Cadmium) Contamination of South African Aquifers
27
3. STUDY SITE
3.1 SITE OVERVIEW
3.1.1 Locality and Topography
The greater Hermanus region (including the Hemel en Aarde valley) is situated along the Walker Bay shoreline ~100 kilometres (km) southeast of Cape Town, and falls within the Overstrand Local Municipality (LM) (Overberg District Municipality) of the Western Cape. Hermanus (extending from Sandbaai in the west to Fernkloof in the east, to Volmoed in the north for this study; see Figure 3-2 and Figure 3-4) was selected as the study site for this project for two reasons:
1. Cadmium concentrations of 20 µg/l were found in a golf estate irrigation borehole (LV01) within the Skurweberg Formation (Nardouw Aquifer), during drilling and test-pumping of the borehole at the end of 2012. Cadmium is not usually found in water in concentrations above 1 µg/l, and higher concentrations are indicative of contamination (natural or anthropogenic). Chromium, cobalt, nickel, lead, selenium and antimony concentrations were also elevated and above 10 µg/l (the general concentration limits of these trace metals in unpolluted or non-mineralised aquifers). Due to the absence of industrial or landfill site point sources, the only other currently known, possible local source for trace metal (and specifically cadmium) contamination of groundwater in the estate borehole was phosphate fertilizer (applied over a minimum period of at least 70 years) and treated wastewater application (over the past 6 years) to the adjacent, century-old golf course, or within the estate itself. The local aquifers are also not known to be naturally mineralised with respects to high concentrations of cadmium and other trace metals, other than iron and manganese.
2. The Overstrand LM has embarked on a major groundwater development to augment the surface water supply in the greater Hermanus region since 2001, through the development of the Gateway and Hemel en Aarde (Camphill and Volmoed) Wellfields. There are numerous monitoring boreholes present in a variety of natural and urban hydrogeological settings, allowing for hydrochemical sampling of a well-studied and understood (despite complex) geological and hydrogeological environment. Sampling of these aquifers in various natural and urban environments will therefore provide some sort of indication of the source of, and geochemical mechanisms for, relatively high trace metal (specifically cadmium) concentrations.
The topography of the Hermanus region is characterised by a relatively narrow (~1-2 km wide) coastal platform with an average elevation of ~10-40 metres above mean sea level (mamsl), along which the various urban suburbs are situated. This coastal platform forms the base of the west-east orientated Onrus, Fernkloof and Klein River Mountains (which reach elevations of ~400-800 mamsl). A central valley area known as Hemel en Aarde (with an elevation of ~70-300 mamsl) stretches in a northeast-southwest orientation between the Onrus and Fernkloof/Klein River Mountains, and between the Babilonstoring and Klein River Mountains.
Trace Metal (Cadmium) Contamination of South African Aquifers
28
Apart from the urban areas along the coastline, the majority of the region is covered by natural shrubland and low fynbos vegetation (especially in areas such as the Fernkloof and Vogelgat Nature Reserves), as well as thicket and bushland along river reaches and drainage lines. Agricultural land (predominantly viniculture and fruit farming) is found within the Hemel en Aarde valley.
3.1.2 Hydrology and Climatology
The study site falls entirely within the G40H (Onrus River) quaternary catchment of the Breede Water Management Area (WMA). The Onrus River originates in the Babilonstoring Mountains (along with tributaries from the Fernkloof Mountains), and flows southwestwards down the Hemel en Aarde valley, exiting at the Onrus River estuary. The river supports irrigation in the upper part of the Hemel en Aarde valley and water supply to Hermanus from the De Bos Dam (capacity of 6.3 million cubic metres [hm3]1, situated between the upper and lower portions of the Hemel en Aarde valley). Extensive development and population growth along the Hermanus coastline has required additional water supplies (namely groundwater – 1.6 hm3 licenced from Gateway Wellfield and 1.6 hm3 licenced from the Hemel en Aarde Wellfields) to be augmented to the stressed De Bos Dam supply (especially during low rainfall periods, such as the 2009-2011 Eden and Central Karoo 1:100 year drought).
Hermanus experiences a Mediterranean climate, with warm, dry summers and cool, wet winters (when Walker Bay is in the pathway of mid-latitude cyclones generated in the southern Atlantic Ocean). Mean annual precipitation (MAP) in the area ranges between ~500-550 millimetres/annum (mm/a) at SANSA Space Science (previously the Hermanus Magnetic Observatory) within Hermanus itself to ~1000-1200 mm/a at Vogelgat Nature Reserve in the Klein River Mountains, indicating a clear local orographic control on rainfall distribution. The whole G40H quaternary catchment has an average MAP of 700-750 mm/a, with the highest and lowest rainfall occurring in July/August and December/January respectively. The mean annual evaporation (MAE) in the area is ~1400 mm, indicating a potentially negative surface water availability budget. Mean annual winter and summer temperatures range between 16-25 °C during the day and 7-14 °C at night respectively.
3.1.3 Geology and Hydrogeology
The main stratigraphic units represented at surface in the study site belong to the Ordovician to Devonian (480-390 Ma) Table Mountain Group (TMG; which dominates the topography), Devonian (390-375 Ma) Bokkeveld Group and Quaternary (2.5 Ma to Recent) Bredasdorp Group (see Figure 3-3 and Figure 3-5, and Umvoto Africa [2007] for a detailed review of the geology of the Hermanus region). The TMG unconformably overlies the Cambrian (550-540 Ma) Hermanus Pluton (of the Cape Granite Suite basement, which outcrops north of De Bos Dam), and is composed of the following formations (oldest to youngest; see Thamm et al. [2006] for a more detailed regional description of the stratigraphy and lithology of the Table Mountain and Bokkeveld Groups):
1 A cubic hectometre, hm3, is the correct SI metric unit of volume for a million cubic metres, and not the commonly, incorrectly used Mm3.
Trace Metal (Cadmium) Contamination of South African Aquifers
29
• Peninsula Formation – ~1100 metre [m] thick, whitish-grey coloured, thick bedded fractured quartzite (quartzitic sandstone) resistant to erosion, which forms the large mountain ranges in the area (Onrus, Fernkloof, Klein River and Babilonstoring Mountains);
• Pakhuis Formation – ~10-40 m thick, greyish to maroon brown coloured tillite (glacial conglomerate);
• Cedarberg Formation - ~80-100 m thick, dark grey to black shale (Soom Member) and dark grey to grey siltstone and fine sandstone (Disa Member) that exhibits negative topography (i.e. easily weathered and relatively smooth), and forms a distinct vegetated strip in the mountain landscape;
• Goudini Formation - ~120-160 m thick, distinct reddish-brown weathering, grey coloured interbedded quartzitic sandstone, siltstone and shale;
• Skurweberg Formation - ~300 m thick, light grey to grey coloured, intensely cross-bedded, thick bedded fractured quartzite that is also resistant to erosion, forming the lower elevation, southwestwards extension of the Fernkloof Mountains above Hermanus town (as well as the coastal cliff areas between Sandbaai and Voelklip);
• Rietvlei Formation - ~150-200 m thick, whitish-grey weathering, feldspathic sandstone, siltstone and upper shale unit (Verlorenvalley Member, which forms a distinctive, dark-coloured band along the Bokkeveld Group contact). The Goudini, Skurweberg and Rietvlei Formations form the Nardouw Subgroup.
The erodible, undifferentiated shales, siltstones and siltstones of the Ceres Subgroup (Bokkeveld Group, ~200 m thick in the study site) overlie the TMG and form the Hemel en Aarde valley. Following extensive erosion of the coastal plain during the Late Cretaceous and Early Tertiary (~100-30 Ma), the Bredasdorp Group was deposited across the exposed marine terraces and forms the youngest formations within the study site. The Bredasdorp Group in the study site consists of a thin (5-20 m) layer of mainly aeolian, fine to medium grained quartz sand and scree that overlies the TMG coastal platform, while thicker (up to 150 m) aeolian, fluvial and marine deposits occur within Walker Bay (between the Klein River estuary and Gansbaai, and eastwards towards Stanford) (see Roberts et al. [2006] for a detailed regional description of the stratigraphy and lithology of the Bredasdorp Group).
The long hiatus and unconformity between the Table Mountain/Bokkeveld Group and overlying sediments of the Bredasdorp Group represents an interval of ~350 Ma, during which the TMG and later overlying Palaeozoic units were deformed by folding and transpressional (strike-slip and thrust) faulting during the Permo-Triassic (~ 280-230 Ma) Cape Orogeny, followed by transtensional (extensional and strike-slip) faulting and some igneous activity (e.g. dolerite dyke intrusion) during the Jurassic-Cretaceous (180-130 Ma) break-up of Gondwana. This led to the extensive fracturing, faulting and brecciation of the thick composite sandstone units of the Cape Supergroup (specifically the Peninsula and Skurweberg Formations of the TMG). Hermanus has a series of southeast dipping transtensional faults (predominantly normal movement with minor dextral [top to the right] strike-slip components) that separate the region into a series of discrete fault blocks,
Trace Metal (Cadmium) Contamination of South African Aquifers
30
including the northeast-southwest orientated Attakwaskloof and Hermanus Faults (and Diepgat, Babilonstoring and Karwyderskraal Faults outside of the immediate study site) and northwest-southeast orientated Fernkloof Faults. The Attakwaskloof Fault downthrows Bokkeveld Group to the southeast against the Peninsula Formation in the Hemel en Aarde valley, while the Hermanus Fault downthrows Skurweberg Formation to the southeast against Goudini Formation in the vicinity of Hermanus town (from Fernkloof to Schulphoek). The Fernkloof Faults downthrow Skurweberg Formation southwestwards against Peninsula Formation in the Fernkloof and Voelklip areas.
The fractured Peninsula Formation is hydrostratigraphically known as the Peninsula Aquifer, and forms the dominant aquifer in the Hermanus region where it is targeted by the Gateway and Hemel en Aarde Wellfields for groundwater development (see Umvoto Africa [2011], and Umvoto Africa [2014a] and [2014b]). The Peninsula Aquifer is hydraulically separated into various fault-bounded compartments in the Hermanus and Hemel en Aarde region, across which it is interpreted that there is little to no hydraulic connection due to the sealing nature of annealed fault core (provided younger faults do not break through the fault core, as in the case with the younger Hermanus Fault and older Fernkloof Faults, resulting in compartment connection). In some compartments the Peninsula Aquifer is overlain by confining units such as the Pakhuis, Cedarberg and Goudini Formations (known collectively as the Winterhoek Mega-aquitard; e.g. in the vicinity of Hermanus town) and Bokkeveld Group (Gydo Mega-aquitard; in the Hemel en Aarde valley). In other compartments the Peninsula Aquifer is broadly unconfined i.e. outcrops at surface, such as in the Fernkloof and Onrus Mountains, forming the recharge areas to the confined aquifer portions (with groundwater movement occurring along hydraulically conductive fault and fracture zones). The Gateway Wellfield targets the Peninsula Aquifer at depth (~80-190 metres below ground level [mbgl]) along the Hermanus Fault just north of Gateway Shopping Centre in Hermanus, while the Hemel en Aarde (Camphill and Volmoed) Wellfields target the Peninsula Aquifer at depth (~50-130 mbgl) and at surface along the Attakwaskloof Fault in the vicinity of Camphill and Volmoed within the Hemel en Aarde Valley.
The Skurweberg and Rietvlei Formation fractured quartzites and sandstones are also an effective aquifer (known as the Nardouw Aquifer), but it is not targeted for larger scale municipal groundwater development. Along with the thin overlying primary Bredasdorp Group Quaternary Aquifer, the Nardouw Aquifer has begun to be used extensively for private Schedule 1 use (e.g. garden watering) wellpoints and boreholes respectively by residents in Hermanus. The Winterhoek Mega-aquitard acts as a sufficient barrier between the Peninsula and Nardouw Aquifers, such that large-scale municipal abstraction from the Peninsula Aquifer does not affect small-scale private residential abstraction from the Nardouw and Quaternary Aquifers. Groundwater quality of both the Peninsula and Nardouw Aquifers is good (i.e. fresh and potable), with low electrical conductivity (EC), low solute content, acidic pH, and high iron and manganese concentrations being characteristic.
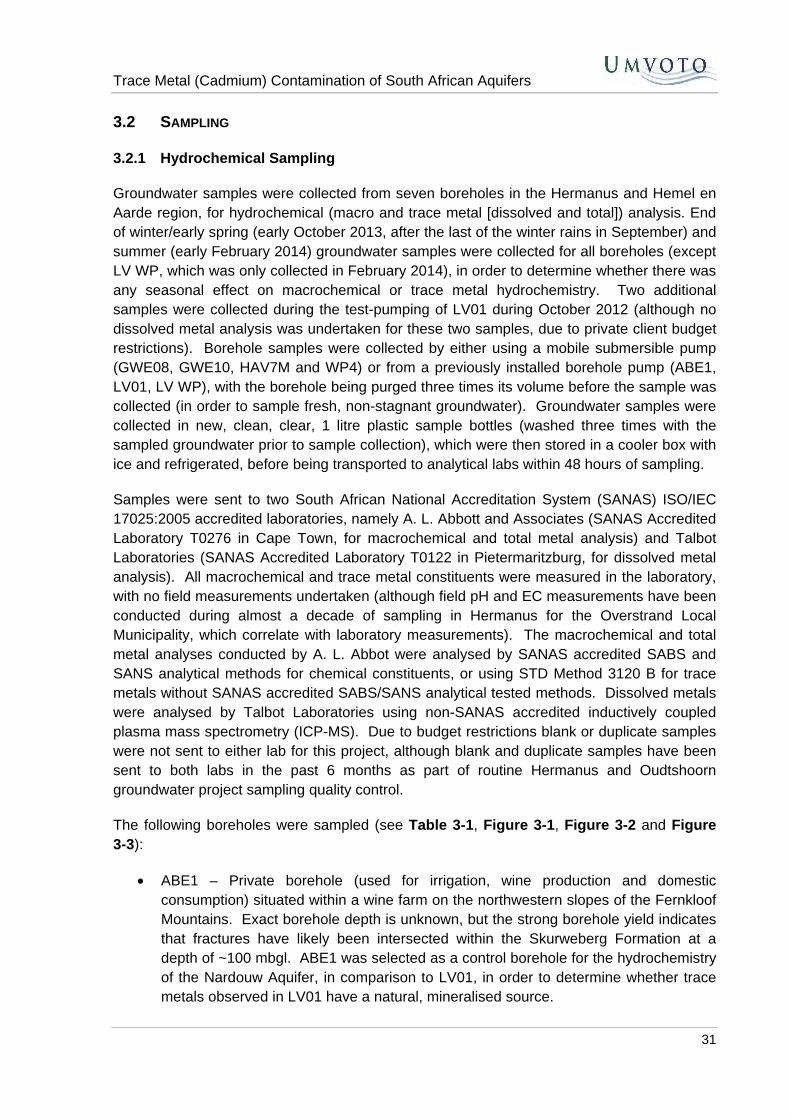
Trace Metal (Cadmium) Contamination of South African Aquifers
31
3.2 SAMPLING
3.2.1 Hydrochemical Sampling
Groundwater samples were collected from seven boreholes in the Hermanus and Hemel en Aarde region, for hydrochemical (macro and trace metal [dissolved and total]) analysis. End of winter/early spring (early October 2013, after the last of the winter rains in September) and summer (early February 2014) groundwater samples were collected for all boreholes (except LV WP, which was only collected in February 2014), in order to determine whether there was any seasonal effect on macrochemical or trace metal hydrochemistry. Two additional samples were collected during the test-pumping of LV01 during October 2012 (although no dissolved metal analysis was undertaken for these two samples, due to private client budget restrictions). Borehole samples were collected by either using a mobile submersible pump (GWE08, GWE10, HAV7M and WP4) or from a previously installed borehole pump (ABE1, LV01, LV WP), with the borehole being purged three times its volume before the sample was collected (in order to sample fresh, non-stagnant groundwater). Groundwater samples were collected in new, clean, clear, 1 litre plastic sample bottles (washed three times with the sampled groundwater prior to sample collection), which were then stored in a cooler box with ice and refrigerated, before being transported to analytical labs within 48 hours of sampling.
Samples were sent to two South African National Accreditation System (SANAS) ISO/IEC 17025:2005 accredited laboratories, namely A. L. Abbott and Associates (SANAS Accredited Laboratory T0276 in Cape Town, for macrochemical and total metal analysis) and Talbot Laboratories (SANAS Accredited Laboratory T0122 in Pietermaritzburg, for dissolved metal analysis). All macrochemical and trace metal constituents were measured in the laboratory, with no field measurements undertaken (although field pH and EC measurements have been conducted during almost a decade of sampling in Hermanus for the Overstrand Local Municipality, which correlate with laboratory measurements). The macrochemical and total metal analyses conducted by A. L. Abbot were analysed by SANAS accredited SABS and SANS analytical methods for chemical constituents, or using STD Method 3120 B for trace metals without SANAS accredited SABS/SANS analytical tested methods. Dissolved metals were analysed by Talbot Laboratories using non-SANAS accredited inductively coupled plasma mass spectrometry (ICP-MS). Due to budget restrictions blank or duplicate samples were not sent to either lab for this project, although blank and duplicate samples have been sent to both labs in the past 6 months as part of routine Hermanus and Oudtshoorn groundwater project sampling quality control.
The following boreholes were sampled (see Table 3-1, Figure 3-1, Figure 3-2 and Figure 3-3):
• ABE1 – Private borehole (used for irrigation, wine production and domestic consumption) situated within a wine farm on the northwestern slopes of the Fernkloof Mountains. Exact borehole depth is unknown, but the strong borehole yield indicates that fractures have likely been intersected within the Skurweberg Formation at a depth of ~100 mbgl. ABE1 was selected as a control borehole for the hydrochemistry of the Nardouw Aquifer, in comparison to LV01, in order to determine whether trace metals observed in LV01 have a natural, mineralised source.
Trace Metal (Cadmium) Contamination of South African Aquifers
32
• GWE08 – Gateway Wellfield Nardouw Aquifer (specifically the Skurweberg Formation) monitoring borehole to the south of Gateway Shopping Centre in the industrial portion of Hermanus town. GWE08 intersects ~15 m of dark grey to light grey, fine to medium grained, quartz-rich aeolian sand and weathered boulders of the Bredasdorp Group, followed by the fractured grey quartzites of the Skurweberg Formation. GWE08 was sampled in order to determine whether there was an industrial source (despite being down-gradient from LV01 with respects to groundwater flow) for trace metal contamination within the Nardouw Aquifer, as observed in LV01.
• GWE10 – Gateway Wellfield Peninsula Aquifer monitoring borehole within the Hermanus Waste Water Treatment Works (WWTW). GWE10 intersects ~60 m of sandstone, siltstone and shale of the Goudini and Cedarberg Formations, with strong water strikes occurring within the fractured quartzites of the Peninsula Formation from 60-64 mbgl. GWE10 was sampled in order to determine whether the WWTW could be a trace metal contamination source (despite being a different aquifer system and down-gradient from LV01 with respects to groundwater flow).
• HAV7M – Camphill Wellfield Quaternary and Nardouw Aquifer (specifically the Rietvlei Formation) monitoring borehole at the southwestern end of the Hemel en Aarde valley. HAV7M intersects 12 m of river floodplain alluvium and 3 m of Rietvlei Formation feldspathic sandstones. HAV7M was sampled in order to determine whether agricultural runoff could be a trace metal contamination source within the Nardouw Aquifer in the southern end of the Hemel en Aarde valley (despite being down-gradient from LV01 with respects to groundwater flow).
• LV01 – Private borehole situated within a private golf course estate in the Fernkloof residential area of Hermanus, which uses Nardouw Aquifer groundwater for estate garden irrigation. LV01 intersects 6 m of dark greyish brown to light grey, fine to medium grained, quartz sand (with quartzite gravel) of the Bredasdorp Group, followed by the fractured grey quartzites and reddish weathering sandstones of the Skurweberg and Goudini Formations respectively. LV01 was the initiator of this entire project, due to very high concentrations (20 µg/l) of cadmium (among other trace metals) being found in two groundwater samples collected during test-pumping of the borehole on the 22nd and 23rd October 2012.
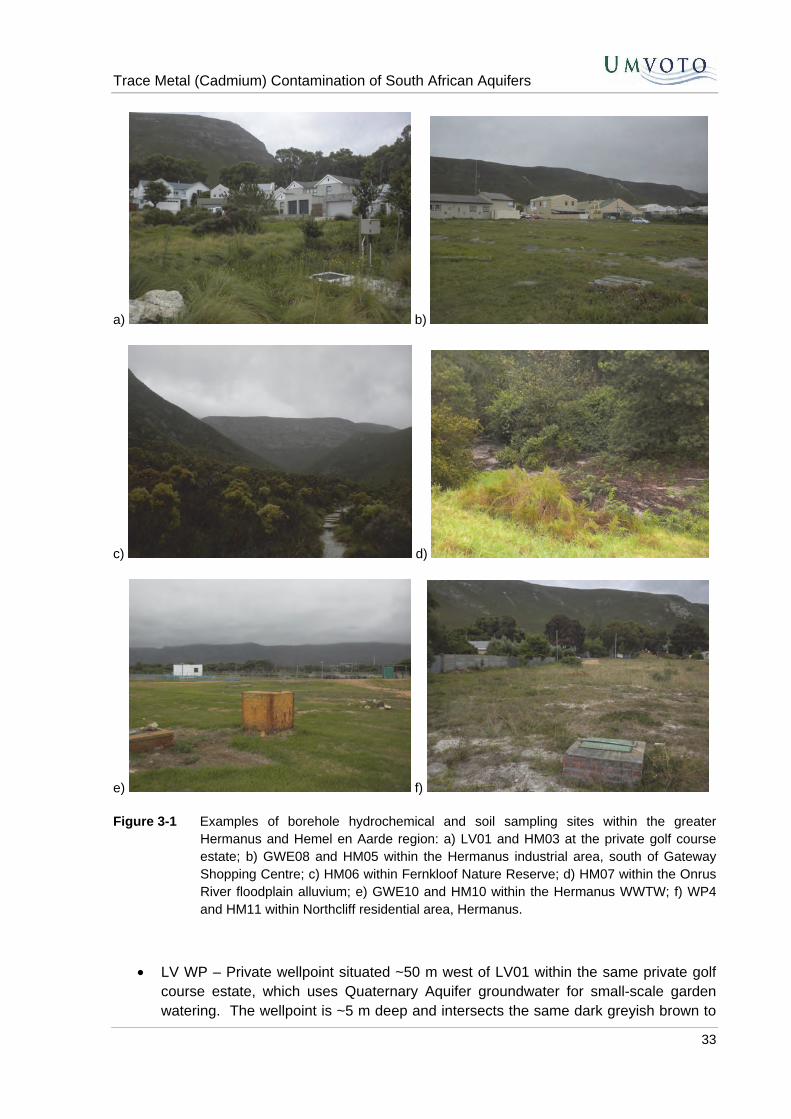
Trace Metal (Cadmium) Contamination of South African Aquifers
33
a) b)
c) d)
e) f)
Figure 3-1 Examples of borehole hydrochemical and soil sampling sites within the greater Hermanus and Hemel en Aarde region: a) LV01 and HM03 at the private golf course estate; b) GWE08 and HM05 within the Hermanus industrial area, south of Gateway Shopping Centre; c) HM06 within Fernkloof Nature Reserve; d) HM07 within the Onrus River floodplain alluvium; e) GWE10 and HM10 within the Hermanus WWTW; f) WP4 and HM11 within Northcliff residential area, Hermanus.
• LV WP – Private wellpoint situated ~50 m west of LV01 within the same private golf course estate, which uses Quaternary Aquifer groundwater for small-scale garden watering. The wellpoint is ~5 m deep and intersects the same dark greyish brown to
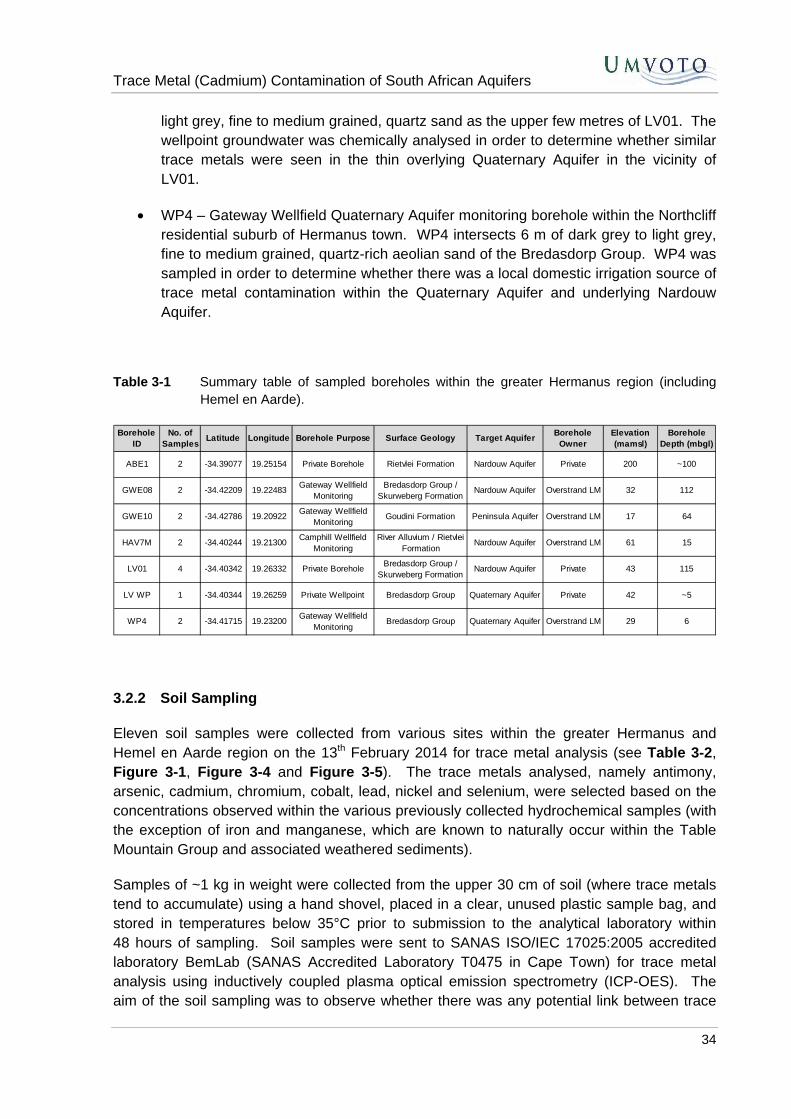
Trace Metal (Cadmium) Contamination of South African Aquifers
34
light grey, fine to medium grained, quartz sand as the upper few metres of LV01. The wellpoint groundwater was chemically analysed in order to determine whether similar trace metals were seen in the thin overlying Quaternary Aquifer in the vicinity of LV01.
• WP4 – Gateway Wellfield Quaternary Aquifer monitoring borehole within the Northcliff residential suburb of Hermanus town. WP4 intersects 6 m of dark grey to light grey, fine to medium grained, quartz-rich aeolian sand of the Bredasdorp Group. WP4 was sampled in order to determine whether there was a local domestic irrigation source of trace metal contamination within the Quaternary Aquifer and underlying Nardouw Aquifer.
Table 3-1 Summary table of sampled boreholes within the greater Hermanus region (including Hemel en Aarde).
Borehole ID
No. of Samples
Latitude Longitude Borehole Purpose Surface Geology Target AquiferBorehole
OwnerElevation (mamsl)
Borehole Depth (mbgl)
ABE1 2 -34.39077 19.25154 Private Borehole Rietvlei Formation Nardouw Aquifer Private 200 ~100
GWE08 2 -34.42209 19.22483Gateway Wellfield
MonitoringBredasdorp Group /
Skurweberg FormationNardouw Aquifer Overstrand LM 32 112
GWE10 2 -34.42786 19.20922Gateway Wellfield
MonitoringGoudini Formation Peninsula Aquifer Overstrand LM 17 64
HAV7M 2 -34.40244 19.21300Camphill Wellfield
MonitoringRiver Alluvium / Rietvlei
FormationNardouw Aquifer Overstrand LM 61 15
LV01 4 -34.40342 19.26332 Private BoreholeBredasdorp Group /
Skurweberg FormationNardouw Aquifer Private 43 115
LV WP 1 -34.40344 19.26259 Private Wellpoint Bredasdorp Group Quaternary Aquifer Private 42 ~5
WP4 2 -34.41715 19.23200Gateway Wellfield
MonitoringBredasdorp Group Quaternary Aquifer Overstrand LM 29 6
3.2.2 Soil Sampling
Eleven soil samples were collected from various sites within the greater Hermanus and Hemel en Aarde region on the 13th February 2014 for trace metal analysis (see Table 3-2, Figure 3-1, Figure 3-4 and Figure 3-5). The trace metals analysed, namely antimony, arsenic, cadmium, chromium, cobalt, lead, nickel and selenium, were selected based on the concentrations observed within the various previously collected hydrochemical samples (with the exception of iron and manganese, which are known to naturally occur within the Table Mountain Group and associated weathered sediments).
Samples of ~1 kg in weight were collected from the upper 30 cm of soil (where trace metals tend to accumulate) using a hand shovel, placed in a clear, unused plastic sample bag, and stored in temperatures below 35°C prior to submission to the analytical laboratory within 48 hours of sampling. Soil samples were sent to SANAS ISO/IEC 17025:2005 accredited laboratory BemLab (SANAS Accredited Laboratory T0475 in Cape Town) for trace metal analysis using inductively coupled plasma optical emission spectrometry (ICP-OES). The aim of the soil sampling was to observe whether there was any potential link between trace
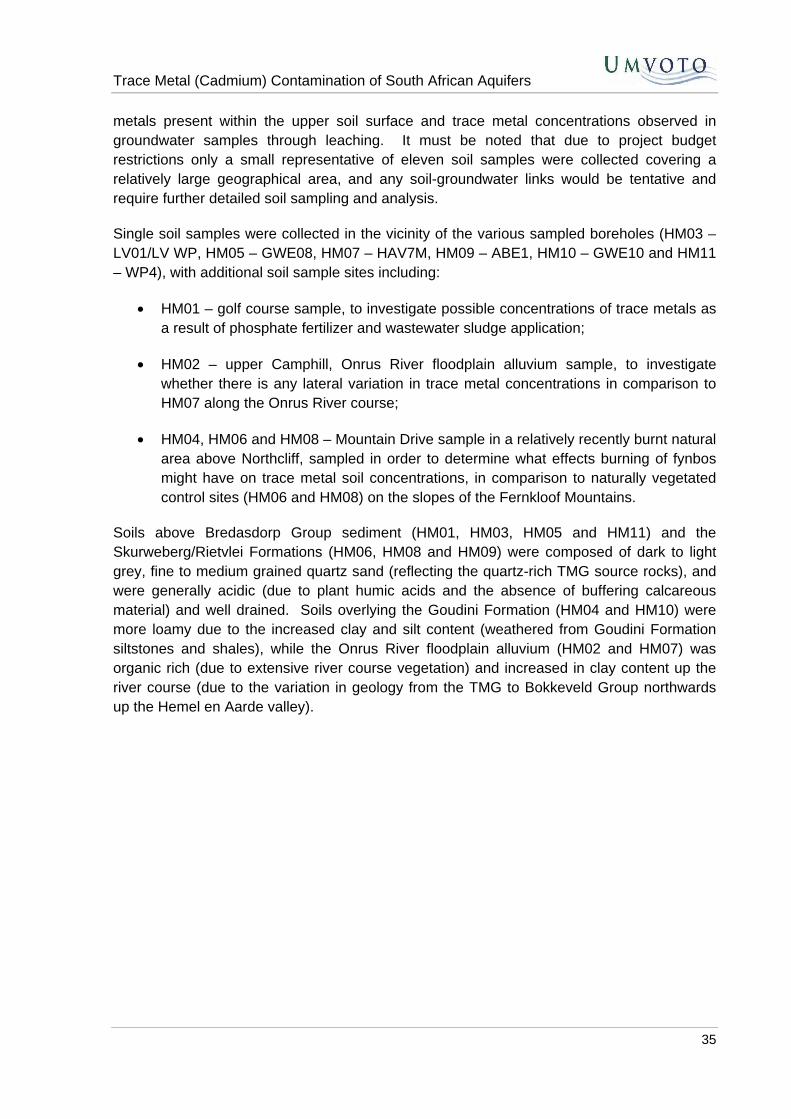
Trace Metal (Cadmium) Contamination of South African Aquifers
35
metals present within the upper soil surface and trace metal concentrations observed in groundwater samples through leaching. It must be noted that due to project budget restrictions only a small representative of eleven soil samples were collected covering a relatively large geographical area, and any soil-groundwater links would be tentative and require further detailed soil sampling and analysis.
Single soil samples were collected in the vicinity of the various sampled boreholes (HM03 – LV01/LV WP, HM05 – GWE08, HM07 – HAV7M, HM09 – ABE1, HM10 – GWE10 and HM11 – WP4), with additional soil sample sites including:
• HM01 – golf course sample, to investigate possible concentrations of trace metals as a result of phosphate fertilizer and wastewater sludge application;
• HM02 – upper Camphill, Onrus River floodplain alluvium sample, to investigate whether there is any lateral variation in trace metal concentrations in comparison to HM07 along the Onrus River course;
• HM04, HM06 and HM08 – Mountain Drive sample in a relatively recently burnt natural area above Northcliff, sampled in order to determine what effects burning of fynbos might have on trace metal soil concentrations, in comparison to naturally vegetated control sites (HM06 and HM08) on the slopes of the Fernkloof Mountains.
Soils above Bredasdorp Group sediment (HM01, HM03, HM05 and HM11) and the Skurweberg/Rietvlei Formations (HM06, HM08 and HM09) were composed of dark to light grey, fine to medium grained quartz sand (reflecting the quartz-rich TMG source rocks), and were generally acidic (due to plant humic acids and the absence of buffering calcareous material) and well drained. Soils overlying the Goudini Formation (HM04 and HM10) were more loamy due to the increased clay and silt content (weathered from Goudini Formation siltstones and shales), while the Onrus River floodplain alluvium (HM02 and HM07) was organic rich (due to extensive river course vegetation) and increased in clay content up the river course (due to the variation in geology from the TMG to Bokkeveld Group northwards up the Hemel en Aarde valley).
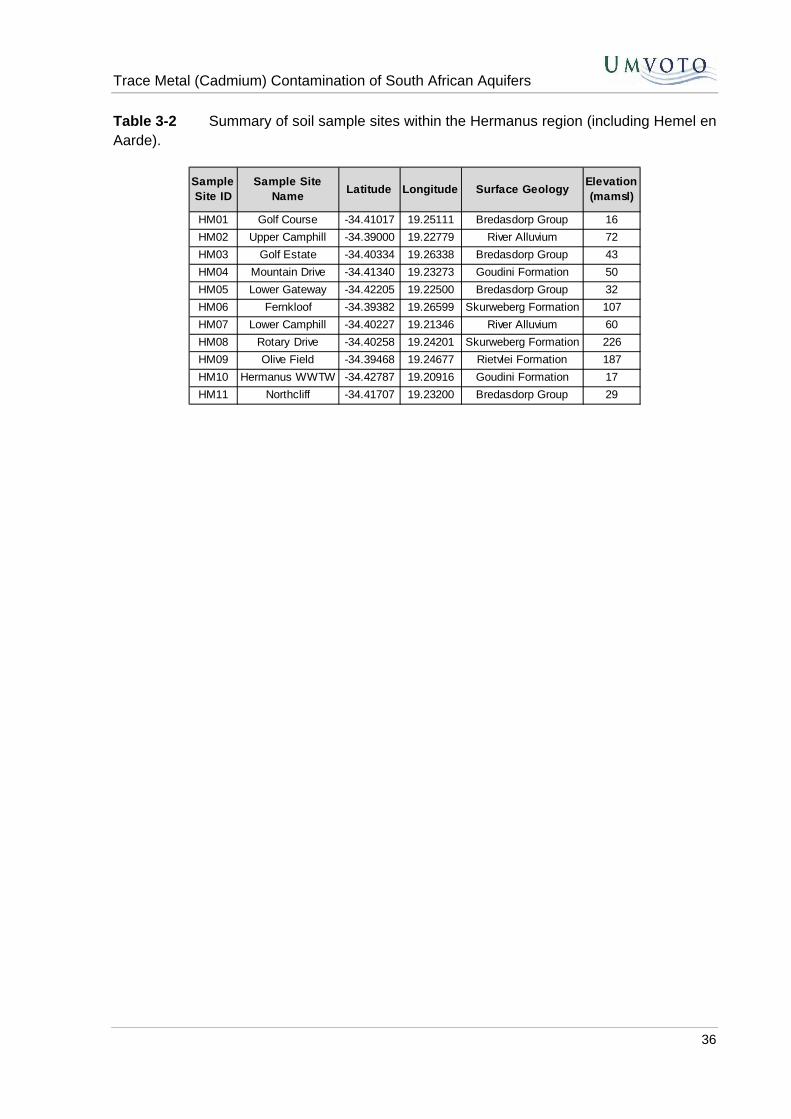
Trace Metal (Cadmium) Contamination of South African Aquifers
36
Table 3-2 Summary of soil sample sites within the Hermanus region (including Hemel en Aarde).
Sample Site ID
Sample Site Name
Latitude Longitude Surface GeologyElevation (mamsl)
HM01 Golf Course -34.41017 19.25111 Bredasdorp Group 16
HM02 Upper Camphill -34.39000 19.22779 River Alluvium 72
HM03 Golf Estate -34.40334 19.26338 Bredasdorp Group 43
HM04 Mountain Drive -34.41340 19.23273 Goudini Formation 50
HM05 Lower Gateway -34.42205 19.22500 Bredasdorp Group 32
HM06 Fernkloof -34.39382 19.26599 Skurweberg Formation 107
HM07 Lower Camphill -34.40227 19.21346 River Alluvium 60
HM08 Rotary Drive -34.40258 19.24201 Skurweberg Formation 226
HM09 Olive Field -34.39468 19.24677 Rietvlei Formation 187
HM10 Hermanus WWTW -34.42787 19.20916 Goudini Formation 17
HM11 Northcliff -34.41707 19.23200 Bredasdorp Group 29
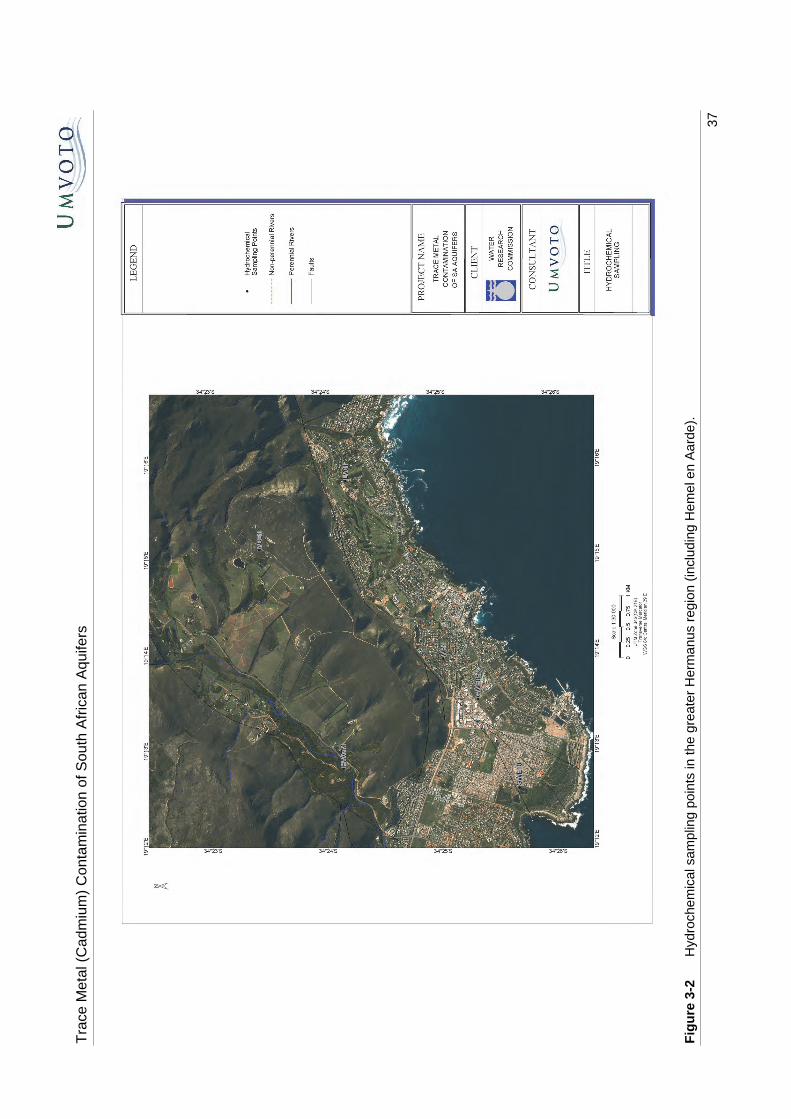
Tra
ce M
etal
(C
adm
ium
) C
onta
min
atio
n of
Sou
th A
fric
an A
quife
rs
37
Fig
ure
3-2
H
ydro
chem
ical
sam
plin
g po
ints
in th
e gr
eate
r H
erm
anus
reg
ion
(incl
udin
g H
emel
en
Aar
de).
Tra
ce M
etal
(C
adm
ium
) C
onta
min
atio
n of
Sou
th A
fric
an A
quife
rs
38
Fig
ure
3-3
H
ydro
chem
ical
sam
plin
g po
ints
in th
e gr
eate
r H
erm
anus
reg
ion
(inc
ludi
ng H
emel
en
Aar
de),
in a
ssoc
iatio
n w
ith th
e lo
cal g
eolo
gy.
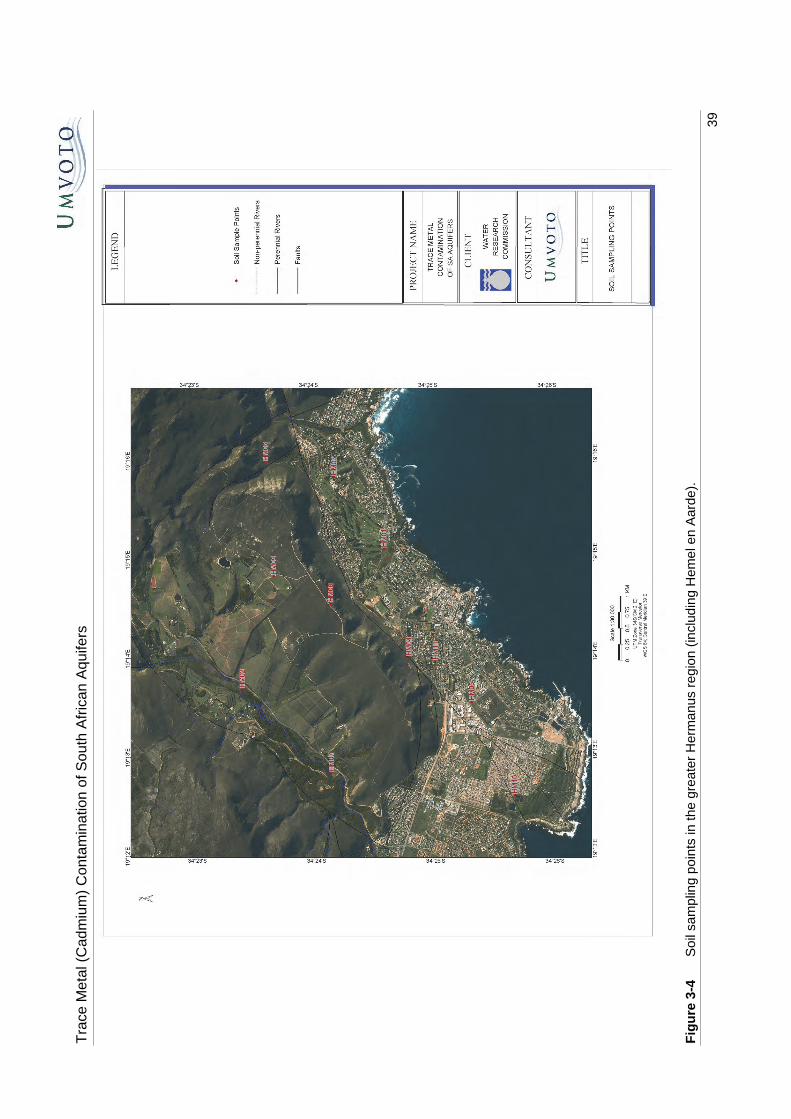
Tra
ce M
etal
(C
adm
ium
) C
onta
min
atio
n of
Sou
th A
fric
an A
quife
rs
39
Fig
ure
3-4
S
oil s
ampl
ing
poin
ts in
the
grea
ter
Her
man
us r
egio
n (in
clud
ing
Hem
el e
n A
arde
).
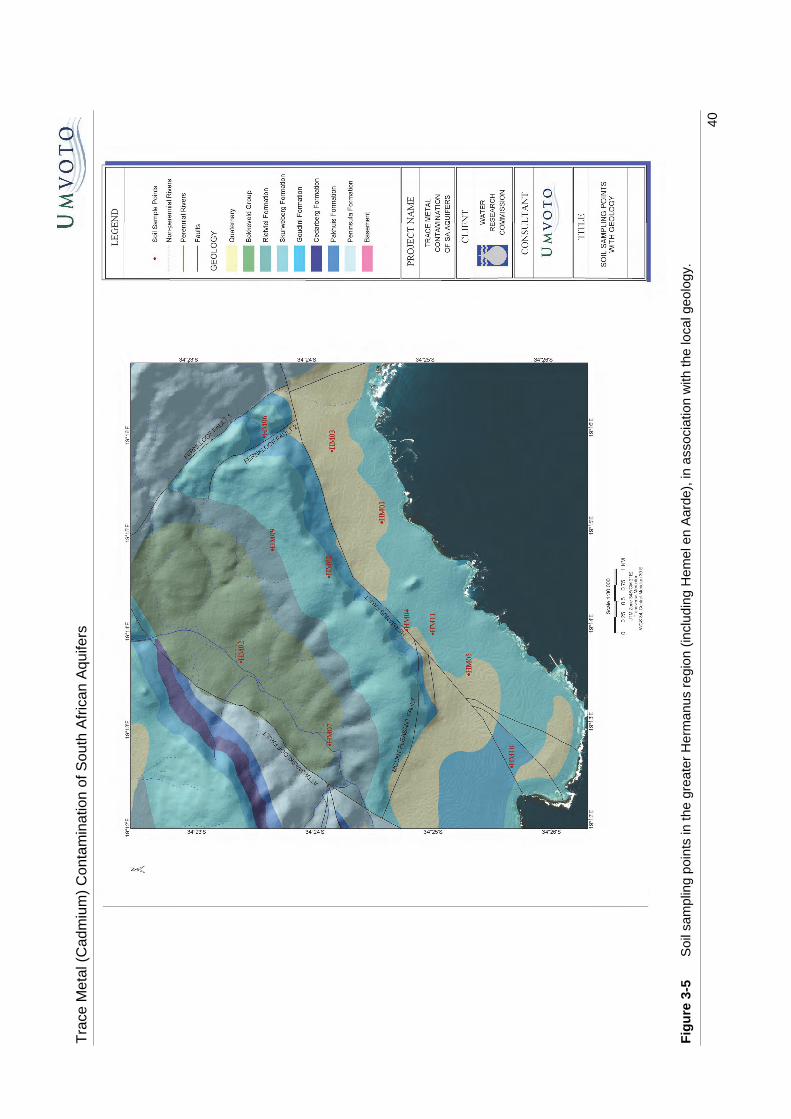
Tra
ce M
etal
(C
adm
ium
) C
onta
min
atio
n of
Sou
th A
fric
an A
quife
rs
40
Fig
ure
3-5
S
oil s
ampl
ing
poin
ts in
the
grea
ter
Her
man
us r
egio
n (in
clud
ing
Hem
el e
n A
arde
), in
ass
ocia
tion
with
the
loca
l geo
logy
.
Trace Metal (Cadmium) Contamination of South African Aquifers
41
3.3 RESULTS AND ANALYSIS
3.3.1 Hydrochemical Samples
3.3.1.1 Macrochemistry
Macrochemical results of sampled boreholes within the greater Hermanus region (including Hemel en Aarde) are tabulated in
Table 3-3. The following macrochemical characteristics were identified:
• Groundwater pH is generally slightly acidic across all three aquifers (Peninsula, Nardouw and Quaternary), ranging from 4.5-6.5. The low pH values are a result of these aquifers being very quartz rich (>95%), hence having a low buffering capacity against organic acids (tannins/humic acid) produced by fynbos in recharge zones. The precipitation of hydrated iron, manganese and aluminium oxides can also release hydrogen ions into the aqueous system, causing further acidification of the groundwater. The seasonality exhibited in LV01, ABE1 and HAV7M, i.e. more acidic water in the end of winter/spring samples compared to summer samples, could possibly be due to increased rainfall in winter flushing increase amounts of organic acids from the soil into the groundwater system, as well as oxygenated rainwater influx causing the precipitation of hydrated aluminium, iron and manganese oxide and the associated acidification of groundwater. The application of treated wastewater could also reduce aquifer and soil pH locally.
• The ECs across the sampled Nardouw and Quaternary Aquifer boreholes are low, ranging from ~15-50 mS/m, indicating very clean water. ECs tend to be slightly higher in winter in comparison to summer, due to winter rainfall flushing of salts (collected within the soil during summer) into the groundwater system (the Nardouw and Quaternary Aquifers are generally unconfined in the study site). The ECs in the only sampled Peninsula Aquifer borehole during the study was higher at ~100 mS/m, although this is an anomalous Peninsula Aquifer borehole in the greater Hermanus and Hemel en Aarde region, as shown by other Peninsula Aquifer production and monitoring boreholes that have lower ECs in the range of ~20-60 mS/m (Umvoto Africa, 2014a and 2014b). GWE10 also has a reduced water quality compared to other Peninsula Aquifer boreholes in the greater Hermanus region, with an elevated concentration of almost all ions (especially sodium, chloride and sulphate). It was initially thought that the lower water quality present was due to (Umvoto Africa, 2014a):
o Possible cross contamination between the overlying WWTW contaminated Quaternary Aquifer and Peninsula Aquifer had occurred, although the mechanism of contaminant movement against the upward hydraulic gradient (GWE10 is usually artesian) between the surface and deeper Peninsula Aquifer could not be explained (unless conservative constituents such as chloride and sodium travelled into the Peninsula Formation through diffusion against the hydraulic gradient); or
Trace Metal (Cadmium) Contamination of South African Aquifers
42
o The rising trend of EC and chloride raised the possibility of sea water intrusion along the Hermanus Fault, given the increased pumping during the 2009-2011 Eden 1:100 year drought (although not hydraulically possible given the water levels monitored).
It is now thought however that this lower water quality trend, observed within the Peninsula Aquifer at GWE10, could be due to the concentration of certain elements during several drier seasons combined with low recharge. This would be followed by the flushing of this concentrated, higher salinity water with lower salinity water after a freshwater influx (as indicated by longer term records of lower ECs at the end of winter and beginning of summer, and higher ECs at the beginning of winter [Umvoto Africa, 2014a]). There is also no evidence of sea water intrusion or cross-contamination between the Primary Aquifer and Peninsula Formation as previously thought – pumping at Gateway Wellfield does not cause a correlated variation in salinity at GWE10, which generally remains consistent between ~90-110 mS/m (Umvoto Africa, 2014a).
• Hardness and alkalinity tend to be generally low (~20-60 mg/l and ~0-50 mg/l), with associated low calcium (~2-10 mg/l) and magnesium (~3-10 mg/l) concentrations. This is expected due to the TMG in the southwestern Cape having minor carbonate material within the various formation lithologies. The exceptions in this study include GWE10 (for the same reasons described above), and GWE08 (possibly due to carbonate material present in the overlying Bredasdorp Group sediment).
• Sodium (~20-90 mg/l) and chloride (~50-120 mg/l) are relatively elevated compared to inland mountainous TMG groundwater, due to Hermanus being situated along the Walker Bay shoreline and rainwater being enriched in sodium and chloride from the ocean. Sulphate concentrations (usually indicative of contamination within the TMG aquifers due to the absence of excessive sulphide deposits) are low (~10-35 mg/l). The HAV7M end winter/spring (October 2013) and LV WP summer (February 2014) samples show elevated sulphate, sodium and chloride, likely caused by fertilizer contaminated irrigation runoff within the Onrus River catchment during winter flushing, and excessive garden watering during summer respectively.
• Ammonia and nitrate is present within most borehole samples, and especially high ammonia concentrations are present within the summer (February 2014) ABE1 (1.1 mg/l) and HAV7M (~3.1 mg/l) samples. This is indicative of groundwater contamination by nitrate and ammonia fertilizers, since there is no natural source of either within the TMG aquifers. Phosphate levels are generally below 0.2 mg/l, although high concentrations of ~6 mg/l are present in the end winter/spring (September 2013) samples for GWE08, GWE10, LV01 and WP4 – this is likely due to the winter flushing effect, as described above. No distinct seasonality trend can be observed in nitrate concentrations, and variations might be related to application dates and rates.
• Dissolved organic carbon (DOC) content generally ranges from ~3-7 mg/l, although higher DOC concentrations (~10-40 mg/l) are present at LV01, GWE08 and WP4. Natural DOC is possibly present due to acidic groundwater interacting with thin, organic-rich marine shale horizons within the Peninsula, Skurweberg and Rietvlei Formations, as well as organic plant material leaching into the groundwater system within recharge
Trace Metal (Cadmium) Contamination of South African Aquifers
43
zones. Elevated DOC concentrations are possibly related to the application of treated wastewater/sludge on the local golf course fairways and greens, or from the use of organic manure/compost on local gardens. Elevated DOC, nitrate and phosphate levels within the Nardouw and Quaternary Aquifers indicate the extent to which unconfined (and shallow in the case of the Quaternary Aquifer) and permeable aquifers are susceptible to contamination, especially when located in agricultural, residential and industrial areas.
The macrochemistry results are summarised in a Piper diagram, as shown in Figure 3-6. Results from the boreholes sampled during this study are plotted, along with additional Peninsula Aquifer boreholes monitored in the Hermanus region (GWE06, FK01, GWP01, HAV01 and T4/2). The Piper diagram shows clearly that although there are some differences in chemistry (as described above), the groundwater from different aquifers sampled during this study within the Hermanus region have similar characteristics, and have a Na-Cl (sodium to chloride) to Na-Alk (sodium to alkaline) character (similar to rain and surface water in the area). Water flowing through the Peninsula and Nardouw Aquifers experiences minor rock-water interactions due to the silicic nature of both aquifers and remains similar to rainfall. The shallow overlying Quaternary Aquifer boreholes are recharged directly by rainfall (and in some instances spring discharge by fractured TMG aquifers), and therefore have similar macrochemical characteristics to the Peninsula and Nardouw Aquifers.
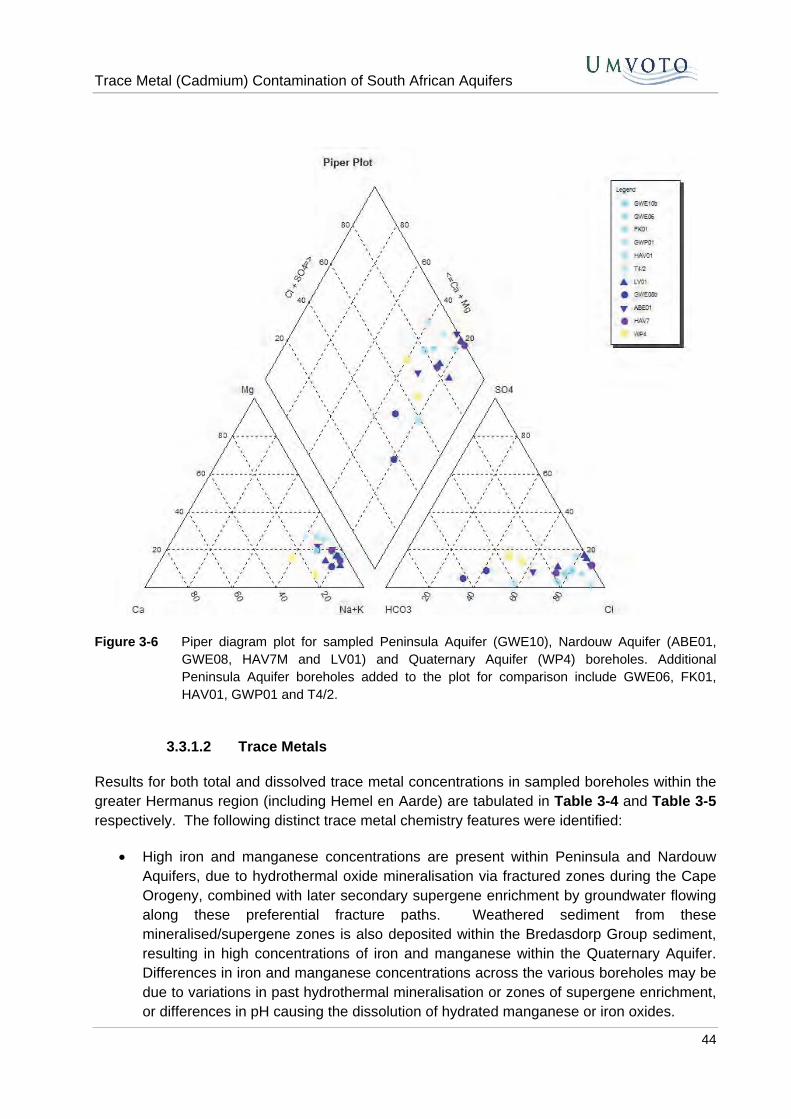
Trace Metal (Cadmium) Contamination of South African Aquifers
44
Figure 3-6 Piper diagram plot for sampled Peninsula Aquifer (GWE10), Nardouw Aquifer (ABE01, GWE08, HAV7M and LV01) and Quaternary Aquifer (WP4) boreholes. Additional Peninsula Aquifer boreholes added to the plot for comparison include GWE06, FK01, HAV01, GWP01 and T4/2.
3.3.1.2 Trace Metals
Results for both total and dissolved trace metal concentrations in sampled boreholes within the greater Hermanus region (including Hemel en Aarde) are tabulated in Table 3-4 and Table 3-5 respectively. The following distinct trace metal chemistry features were identified:
• High iron and manganese concentrations are present within Peninsula and Nardouw Aquifers, due to hydrothermal oxide mineralisation via fractured zones during the Cape Orogeny, combined with later secondary supergene enrichment by groundwater flowing along these preferential fracture paths. Weathered sediment from these mineralised/supergene zones is also deposited within the Bredasdorp Group sediment, resulting in high concentrations of iron and manganese within the Quaternary Aquifer. Differences in iron and manganese concentrations across the various boreholes may be due to variations in past hydrothermal mineralisation or zones of supergene enrichment, or differences in pH causing the dissolution of hydrated manganese or iron oxides.
Trace Metal (Cadmium) Contamination of South African Aquifers
45
Relatively deep aquifers such as Peninsula and Nardouw Aquifers usually have minimal dissolved oxygen, and in conjunction with the acidic nature of the groundwater this results in dissolved manganese and iron entering the groundwater system. Manganese is generally present in its dissolved form (Mn2+ versus precipitated Mn3+ or Mn4+ forms) across all samples, while iron remains in its dissolved form (Fe2+) in more acidic waters, precipitating out as Fe3+ as pH moves towards a more neutral pH (as observed in the differences between the total and dissolved iron concentrations from end of winter/spring and summer samples for both LV01 and HAV7M). There is also a distinct seasonality with regards to iron and manganese concentrations across all aquifer types, with end winter/spring (September and October) samples generally exhibiting lower total iron and manganese concentrations in comparison to the summer (February) samples. This is due to the influx of oxygenated water during winter rainfalls preventing the dissolving of, and causing the precipitation of, iron and manganese hydrated oxides. The precipitation of these hydrated oxides can also release hydrogen ions into the aqueous system, causing further acidification of the groundwater during winter (as observed in the sampled boreholes).
• Elevated aluminium concentrations in the Nardouw and Quaternary Aquifers are due to either:
o Dissolution of clays from thin marine shale horizons within the Skurweberg and Rietvlei Formations – aluminium is highly soluble at pH levels of below 4.5;
o Complex biogeochemical reactions and exchanges in the soil, caused by interactions with nitrates (i.e. nitrates from dead plant matter or fertilizer displacing aluminium from exchangeable cation sites).
The seasonal aluminium concentration increase observed in the summer (February 2014) samples is due to the same geochemical process described above for iron and manganese - the influx of oxygenated water during winter rainfalls prevents the dissolving of, and causes the precipitation of, hydrated aluminium oxides. As with iron and manganese, the precipitation of these hydrated oxides can also release hydrogen ions into the aqueous system, causing further acidification of the groundwater during winter (as observed in the sampled boreholes).
• A distinct, unique suite of likely related, naturally occurring trace metals, namely barium, boron, lithium and strontium, are present within the groundwater of all three aquifers:
o Barium occurs at concentrations of ~3-6 µg/l in the Nardouw and Quaternary Aquifers (with the exception of HAV7M, where concentrations of 45 µg/l are present), and ~17 µg/l in the Peninsula Aquifer.
o Boron occurs at concentrations of ~30-70 µg/l in the Nardouw and Quaternary Aquifers, and ~20-35 µg/l in the Peninsula Aquifer.
o Lithium occurs at concentrations of ~1.5-3.5 µg/l in the Nardouw and Quaternary Aquifers, and ~20-30 µg/l in the Peninsula Aquifer.
Trace Metal (Cadmium) Contamination of South African Aquifers
46
o Strontium occurs at concentrations of ~20-40 µg/l in the Nardouw aquifer (with the exception of GWE08, where concentrations of ~95 µg/l are present), and ~70-80 µg/l in the Peninsula and Quaternary Aquifers.
The presence of these four trace metals in groundwater is usually strongly controlled by the lithology encountered. There are two natural (and possibly interacting) sources of this trace metal suite within the TMG, namely:
1. Erosion of the Cape Granite Suite or Namaqua Metamorphic Province basement that provided sediment for the deposition of the sedimentary TMG - barium, boron, lithium and strontium are all common elements within felsic (i.e. granitic) igneous rocks (Salminen, 2005). Acidic groundwater therefore dissolves these trace metals from the quartzitic TMG rocks over time;
2. Groundwater interaction with thin marine shale horizons in the Peninsula, Skurweberg and Rietvlei Formations – boron and lithium are especially common in seawater, and therefore high concentrations are present in shales of marine origin (Salminen, 2005).
The variation of the concentrations of these trace metals in different aquifer systems requires further sampling and analysis.
• Elevated concentrations of the following trace metals are also observed:
o Arsenic – Total arsenic concentrations of 16 µg/l and 25 µg/l were observed in the LV01 and LV WP February 2014 samples (above the SANS 241-1:2011 drinking water quality limit of 10 µg/l for arsenic), however the remaining borehole samples had total arsenic concentrations of below 10 µg/l. Slight dissolved arsenic concentrations of just above 1 µg/l were observed in the LV01 September 2013 and February 2014 samples, while the remaining boreholes had dissolved arsenic concentrations of below 1 µg/l. Elevated arsenic concentrations are possibly present as a result of phosphate fertilizer, treated wastewater/sludge or organic manure/compost (of which arsenic is a common trace metal component) application to the local golf course fairways and greens, or local/estate gardens in the Fernkloof area. The low dissolved arsenic concentrations, where high associated total arsenic concentrations were present, may be due to either: a) arsenic being immobilised and precipitated within the soil system, with strong rainfall events transporting this precipitated particulate matter into the groundwater system; or b) dissolved arsenic being adsorbed onto organic matter or hydrated aluminium/iron/manganese precipitates. Minor amounts of arsenic may be present as a result of arsenic impurities within pyrite and other minor metal sulphides within the TMG.
o Cadmium – Total cadmium concentrations of 20 µg/l were observed in both LV01 October 2012 pumping test samples, 4 µg/l in the LV01 and LV WP February 2014 samples, 6 µg/l in the GWE10 February 2014 sample (all of which are above the SANS 241-1:2011 drinking water quality limit of 3 µg/l for cadmium), and 3 µg/l in the GWE08 February 2014 sample. The remaining borehole
Trace Metal (Cadmium) Contamination of South African Aquifers
47
samples had total and dissolved cadmium concentrations of less than 1 µg/l, indicating the likelihood of no natural source of cadmium contamination. As with arsenic, elevated cadmium concentrations within the Nardouw and Quaternary Aquifers are possibly present as a result of phosphate fertilizer, treated wastewater/sludge or organic manure/compost application to the local golf course fairways and greens, or local/estate gardens in the Fernkloof area. Cadmium is highly mobile in non-saline, acidic, sandy, non-calcareous soils with a low clay and organic matter content, and fresh, acidic groundwater, both of which occur within the Peninsula, Nardouw and Quaternary Aquifers and overlying soil and sediment in the greater Hermanus region. The significant decline in total cadmium at LV01 from 20 µg/l in October 2012 to <1 µg/l and 4 µg/l in September 2013 and February 2014 respectively, might be due to pumping of LV01 for irrigation, removing cadmium material that had been hydraulically concentrated in fracture zones within the Nardouw Aquifer. The GWE08 and GWE10 February 2014 cadmium concentrations of 3 µg/l and 6 µg/l respectively, could possibly indicate down-gradient and cross-aquifer contamination of the Nardouw and Peninsula Aquifers, and further monitoring is required to determine if this contamination is occurring. The low (<1 µg/l) dissolved cadmium concentrations, where high associated total cadmium concentrations were present, may be due to either: a) cadmium being immobilised within the soil system by being adsorbed onto aluminium/iron/manganese oxides/hydroxides within the soil, with strong rainfall events transporting this precipitated particulate matter into the groundwater system through sandy, well-drained soils; or b) dissolved cadmium being adsorbed onto organic matter (at low pH organic matter is the only solid phase able to retain cadmium) or hydrated aluminium/iron/manganese precipitates.
o Chromium – Total chromium concentrations of 60 µg/l were observed in both LV01 October 2012 pumping test samples (above the SANS 241-1:2011 drinking water quality limit of 50 µg/l for chromium), and 25 µg/l was present within the WP4 February 2014 sample. Total chromium concentrations of the remaining borehole samples was below 10 µg/l, and no dissolved chromium concentrations above 1 µg/l were observed in any of the boreholes. Chromium is present possibly due to the same anthropogenic, geochemical and hydrogeological processes as described for arsenic and cadmium above, although minor groundwater concentrations might be a result of chromium impurities within pyrite and other minor metal sulphides within the TMG.
o Cobalt – Total cobalt concentrations of 20 µg/l were observed in both LV01 October 2012 pumping test samples, however the remaining borehole samples had total cobalt concentrations of below 7 µg/l. Slight dissolved cobalt concentrations of ~2-2.5 µg/l and ~1-1.5 were observed in the LV01 and HAV7M September 2013 and February 2014 samples respectively, while the remaining boreholes had dissolved cobalt concentrations of below 1 µg/l. Cobalt is present possibly due to the same anthropogenic (including fertilizer, treated wastewater/sludge, and manure applications within the Hemel en Aarde valley
Trace Metal (Cadmium) Contamination of South African Aquifers
48
for HAV7M), geochemical and hydrogeological processes as described for arsenic and cadmium above.
o Copper – Total copper concentrations in all borehole samples was below 22 µg/l, although dissolved copper concentrations of 1.5-5 µg/l were observed in LV01, ABE1, HAV7M and WP4. Copper may be present naturally in small quantities within TMG aquifer groundwater due to impurities within pyrite and other minor metal sulphides, although it is also a common component in phosphate fertilizers and treated wastewater/sludge.
o Lead – A total lead concentration of 40 µg/l was observed in the first LV01 October 2012 pumping test sample (above the SANS 241-1:2011 drinking water quality limit of 10 µg/l for lead). The remaining borehole samples had total lead concentrations of below 8 µg/l however, and no dissolved lead concentrations above 1 µg/l were observed in any of the boreholes. Lead is present possibly due to the same anthropogenic, geochemical and hydrogeological processes as described for arsenic (i.e. highly immobile in soil environments) above.
o Nickel – Total nickel concentrations of 120 µg/l and 80 µg/l were observed in both LV01 October 2012 pumping test samples (above the SANS 241-1:2011 drinking water quality limit of 70 µg/l for nickel), however the remaining borehole samples had total nickel concentrations of below 8 µg/l. Slight dissolved nickel concentrations of 1-3 µg/l were observed in GWE10, LV01 (highest dissolved nickel concentrations), ABE1, HAV7M and WP4, with the remaining samples having dissolved nickel concentrations below 1 µg/l. Nickel is present possibly due to the same anthropogenic (including fertilizer, treated wastewater/sludge, and manure applications within the Hemel en Aarde valley for HAV7M), geochemical and hydrogeological processes as described for arsenic and cadmium above. Minor amounts of nickel may be present as a result of nickel impurities within pyrite and other minor metal sulphides within the TMG.
o Selenium – Total selenium concentrations of 24 µg/l and 27 µg/l were observed in both LV01 October 2012 pumping test samples (above the SANS 241-1:2011 drinking water quality limit of 10 µg/l for selenium), however the remaining borehole samples had total selenium concentrations of below 10 µg/l. No dissolved selenium concentrations above 1 µg/l were observed in any of the boreholes, with the exception of WP4 (~1.5-4 µg/l). Selenium is present possibly due to the same anthropogenic, geochemical and hydrogeological processes as described for arsenic and cadmium above.
o Zinc – Dissolved zinc concentrations ranged from ~1 µg/l for Peninsula Aquifer samples, to 6-12 µg/l for Nardouw and Quaternary Aquifer samples (with total zinc concentrations ranging from 20-40 µg/l for these two aquifers). Zinc is often naturally present within sedimentary rocks, with elevated zinc concentrations (although way below SANS 241-1:2011 drinking water quality limits) in the Nardouw and Quaternary Aquifer samples possibly due to fertilizer application on these unconfined aquifers.
Trace Metal (Cadmium) Contamination of South African Aquifers
49
3.3.2 Soil Samples
Trace metal concentrations of the eleven analysed soil samples within the greater Hermanus region (including Hemel en Aarde) are tabulated in Table 3-6. Due to their geographical location and geological/hydrogeological setting, the HM06 (Fernkloof) and HM08 sites (both soils situated on weathered Skurweberg Formation) were accepted as control sites with respect to natural concentrations of trace metals. Minor amounts of antimony (0.01 mg/kg), arsenic (0.01-0.05 mg/kg), chromium (0.4 mg/kg), lead (0.08 mg/kg) and nickel (0.06-0.1 mg/kg) were present within the control samples, possibly as a result of either weathering of mineralised zones within the Skurweberg Formation, or atmospheric deposition. The remaining nine samples were compared to these two control samples, to observe if there was any significant elevation in trace metal concentrations within the soil (see Table 3-6):
• Elevated concentrations of antimony, arsenic, cobalt, chromium, lead and nickel were observed in Onrus River floodplain alluvium samples HM02 (Upper Camphill) and HM07 (Lower Camphill), with a general increase in the concentration of arsenic, cobalt, chromium, lead and nickel being observed from HM02 to HM07. Elevated trace metal sources are likely to be due to irrigation runoff (contaminated with phosphate fertilizer, treated wastewater/sludge or manure) from agricultural areas within the Hemel en Aarde entering the Onrus River, with the downstream increase in trace metals from HM02 to HM07 due to HM07 incorporating a larger catchment (and hence greater agricultural) area. HM07 also had the highest total trace metal content of all the samples (5.3 mg/kg), possibly due to organic material within the floodplain sediment adsorbing increased amounts of metals present within the stream flow.
• HM10 (Hermanus WWTW) has elevated concentrations of antimony, arsenic, chromium, lead and nickel, likely due to contamination from leaking or spilt sludge and wastewater. HM10 also has a relatively high total metal content (4.9 mg/kg), possibly due the higher silt and clay content of the Goudini Formation soils adsorbing released metals from the WWTW. The relatively high total metal content at HM04 (Mountain Drive) of 3.8 mg/kg is also likely related to metal adsorption of silt and clay-rich Goudini Formation soils. The elevated concentrations of antimony, arsenic, chromium, lead and nickel at HM04 are likely due to burnt vegetation in the area releasing absorbed metals back into the soil profile.
• Both HM01 (Golf Course) and HM05 (Lower Gateway) had elevated arsenic and lead concentrations, likely due to phosphate fertilizer and/or treated wastewater/sludge application and industrial atmospheric deposition respectively. Elevated metal concentrations at HM03 (Golf Estate – arsenic), HM09 (Olive Field – lead) and HM11 (Northcliff – arsenic and chromium) are likely due to phosphate fertilizer and/or treated wastewater/sludge application. The relatively low total metal content of these samples (in comparison to HM10 and HM04) is possibly due to the more acidic, sandy nature of the soil, which results in leaching to the groundwater system.
• The total absence of cadmium within any of the soil samples could be due to:
Trace Metal (Cadmium) Contamination of South African Aquifers
50
o Cadmium-bearing soils not being sampled – only eleven soil samples were collected as part of the study, which is a small representative of the total study site area;
o Extensive cadmium uptake by vegetation in the sampled areas;
o Cadmium became immobilised by iron and manganese hydroxides/oxides, phosphates or local calcareous-rich zones within the Bredasdorp Group below the sampled upper 30 cm soil layer, and above the groundwater table;
o Cadmium’s high mobility in acidic environments resulted in rapid leaching through the sandy soils present into the groundwater system (as indicated by cadmium contamination of groundwater at LV01);
o The recent use of low cadmium-bearing (<20 mg/kg) fertilizer and treated wastewater/sludge, as a result of the new fertilizer regulations promulgated by the Department of Agriculture, Forestry and Fisheries in September 2012.
The absence of selenium could possibly be related to plant uptake, as selenium is generally mobile in alkaline soil environments (which are uncommon in the study site).
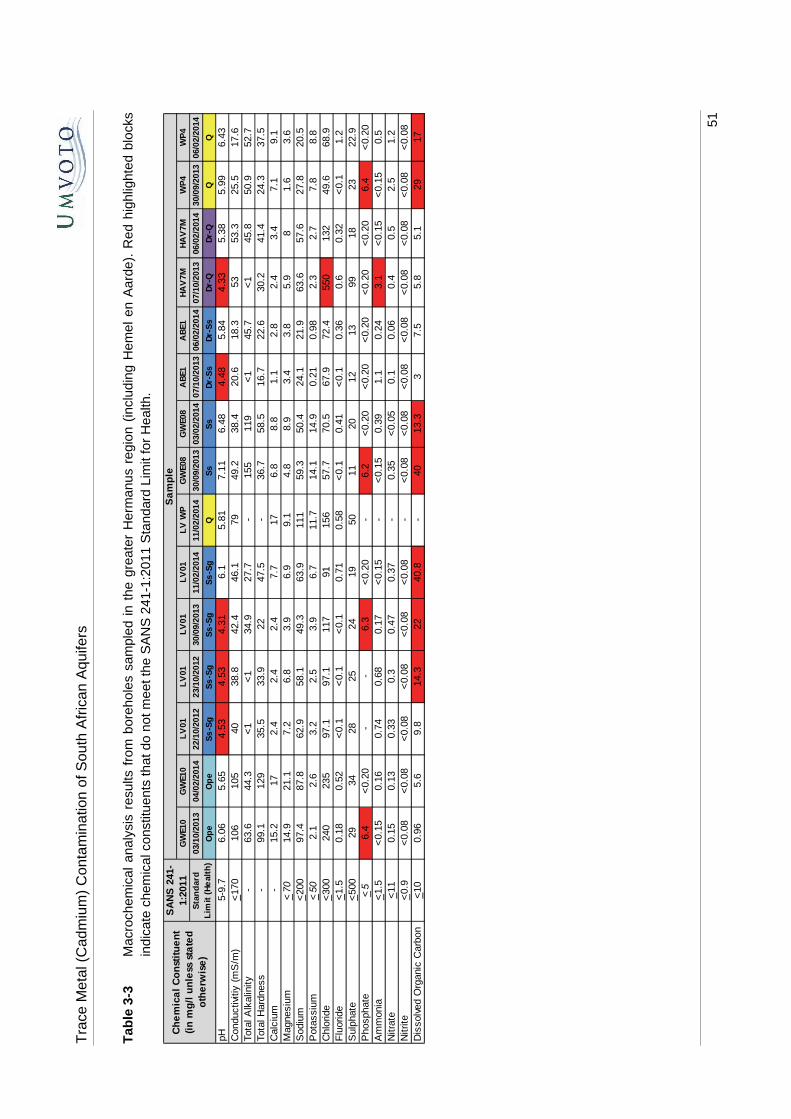
Tra
ce M
etal
(C
adm
ium
) C
onta
min
atio
n of
Sou
th A
fric
an A
quife
rs
51
Tab
le 3
-3
Mac
roch
emic
al a
naly
sis
resu
lts f
rom
bor
ehol
es s
ampl
ed i
n th
e gr
eate
r H
erm
anus
reg
ion
(incl
udin
g H
emel
en
Aar
de).
Red
hig
hlig
hted
blo
cks
indi
cate
che
mic
al c
onst
ituen
ts th
at d
o no
t mee
t the
SA
NS
241
-1:2
011
Sta
ndar
d Li
mit
for
Hea
lth.
GW
E10
GW
E10
LV
01L
V01
LV
01L
V01
LV
WP
GW
E08
GW
E08
AB
E1A
BE1
HA
V7M
HA
V7M
WP
4W
P4
03/1
0/20
1304
/02/
2014
22/1
0/20
1223
/10/
2012
30/0
9/20
1311
/02/
2014
11/0
2/20
1430
/09/
2013
03/0
2/20
1407
/10/
2013
06/0
2/20
1407
/10/
2013
06/0
2/20
1430
/09/
2013
06/0
2/20
14
Op
eO
pe
Ss
-Sg
Ss
-Sg
Ss
-Sg
Ss
-Sg
QS
sS
sD
r-S
sD
r-S
sD
r-Q
Dr-
Q
pH5-
9.7
6.06
5.65
4.53
4.53
4.31
6.1
5.81
7.11
6.48
4.48
5.84
4.33
5.38
5.99
6.43
Con
duct
iviti
y (m
S/m
)<
170
106
105
4038
.842
.446
.179
49.2
38.4
20.6
18.3
5353
.325
.517
.6To
tal A
lkal
inity
-63
.644
.3<
1<
134
.927
.7-
155
119
<1
45.7
<1
45.8
50.9
52.7
Tota
l Har
dnes
s-
99.1
129
35.5
33.9
2247
.5-
36.7
58.5
16.7
22.6
30.2
41.4
24.3
37.5
Cal
cium
-15
.217
2.4
2.4
2.4
7.7
176.
88.
81.
12.
82.
43.
47.
19.
1M
agne
sium
<70
14.9
21.1
7.2
6.8
3.9
6.9
9.1
4.8
8.9
3.4
3.8
5.9
81.
63.
6S
odiu
m<
200
97.4
87.8
62.9
58.1
49.3
63.9
111
59.3
50.4
24.1
21.9
63.6
57.6
27.8
20.5
Pot
assi
um<
502.
12.
63.
22.
53.
96.
711
.714
.114
.90.
210.
982.
32.
77.
88.
8C
hlor
ide
<30
024
023
597
.197
.111
791
156
57.7
70.5
67.9
72.4
550
132
49.6
68.9
Flu
orid
e<
1.5
0.18
0.52
<0.
1<
0.1
<0.
10.
710.
58<
0.1
0.41
<0.
10.
360.
60.
32<
0.1
1.2
Sul
phat
e<
500
2934
2825
2419
5011
2012
1399
1823
22.9
Pho
spha
te<
56.
4<
0.20
--
6.3
<0.
20-
6.2
<0.
20<
0.20
<0.
20<
0.20
<0.
206.
4<
0.20
Am
mon
ia<
1.5
<0.
150.
160.
740.
680.
17<
0.15
-<
0.15
0.39
1.1
0.24
3.1
<0.
15<
0.15
0.5
Nitr
ate
<11
0.15
0.13
0.33
0.3
0.47
0.37
-0.
35<
0.05
0.1
0.06
0.4
0.5
2.5
1.2
Nitr
ite<
0.9
<0.
08<
0.08
<0.
08<
0.08
<0.
08<
0.08
-<
0.08
<0.
08<
0.08
<0.
08<
0.08
<0.
08<
0.08
<0.
08D
isso
lved
Org
anic
Car
bon
<10
0.96
5.6
9.8
14.3
2240
.8-
4013
.33
7.5
5.8
5.1
2917
Ch
em
ica
l C
on
stit
ue
nt
(in
mg
/l u
nle
ss s
tate
d
oth
erw
ise
)
Sa
mp
le
Sta
nd
ard
L
imit
(H
eal
th)
SA
NS
241
-1:
2011
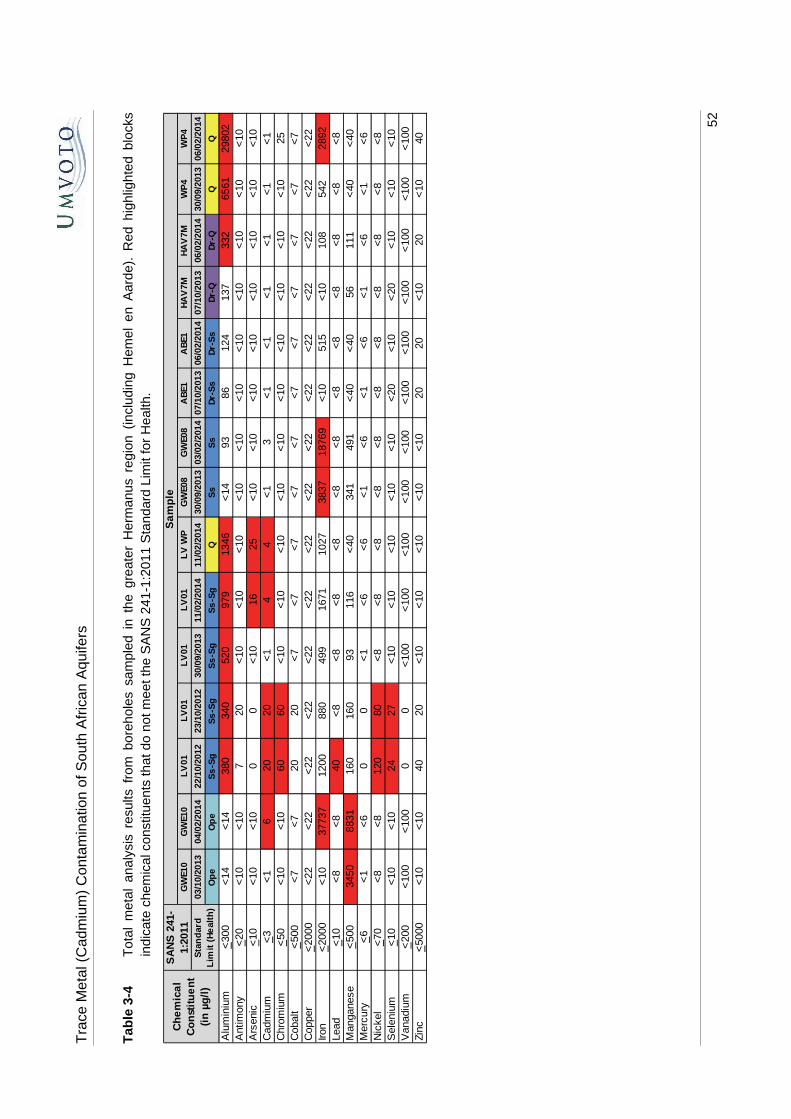
Tra
ce M
etal
(C
adm
ium
) C
onta
min
atio
n of
Sou
th A
fric
an A
quife
rs
52
Tab
le 3
-4
Tot
al m
etal
ana
lysi
s re
sults
fro
m b
oreh
oles
sam
pled
in
the
grea
ter
Her
man
us r
egio
n (in
clud
ing
Hem
el e
n A
arde
). R
ed h
ighl
ight
ed b
lock
s in
dica
te c
hem
ical
con
stitu
ents
that
do
not m
eet t
he S
AN
S 2
41-1
:201
1 S
tand
ard
Lim
it fo
r H
ealth
.
GW
E10
GW
E10
LV
01L
V01
LV
01L
V01
LV
WP
GW
E08
GW
E08
AB
E1A
BE1
HA
V7M
HA
V7M
WP
4W
P4
03/1
0/20
1304
/02/
2014
22/1
0/20
1223
/10/
2012
30/0
9/20
1311
/02/
2014
11/0
2/20
1430
/09/
2013
03/0
2/20
1407
/10/
2013
06/0
2/20
1407
/10/
2013
06/0
2/2
014
30/0
9/20
1306
/02/
2014
Op
eO
pe
Ss
-Sg
Ss
-Sg
Ss
-Sg
Ss
-Sg
QS
sS
sD
r-S
sD
r-S
sD
r-Q
Dr-
Q
Alu
min
ium
<30
0<
14<
1438
034
052
097
913
46<
1493
8612
413
733
265
6129
802
Ant
imon
y<
20<
10<
107
20<
10<
10<
10<
10<
10<
10<
10<
10<
10<
10<
10A
rsen
ic<
10<
10<
100
0<
1016
25<
10<
10<
10<
10<
10<
10<
10<
10C
adm
ium
<3
<1
620
20<
14
4<
13
<1
<1
<1
<1
<1
<1
Chr
omiu
m<
50<
10<
1060
60<
10<
10<
10<
10<
10<
10<
10<
10<
10<
1025
Cob
alt
<50
0<
7<
720
20<
7<
7<
7<
7<
7<
7<
7<
7<
7<
7<
7C
oppe
r<
2000
<22
<22
<22
<22
<22
<22
<22
<22
<22
<22
<22
<22
<22
<22
<22
Iron
<20
00<
1037
737
1200
880
499
1671
1027
3837
1876
9<
1051
5<
1010
854
228
92Le
ad<
10<
8<
840
<8
<8
<8
<8
<8
<8
<8
<8
<8
<8
<8
<8
Man
gane
se<
500
3450
8831
160
160
9311
6<
4034
149
1<
40<
4056
111
<40
<40
Mer
cury
<6
<1
<6
00
<1
<6
<6
<1
<6
<1
<6
<1
<6
<1
<6
Nic
kel
<70
<8
<8
120
80<
8<
8<
8<
8<
8<
8<
8<
8<
8<
8<
8S
elen
ium
<10
<10
<10
2427
<10
<10
<10
<10
<10
<20
<10
<20
<10
<10
<10
Van
adiu
m<
200
<10
0<
100
00
<10
0<
100
<10
0<
100
<10
0<
100
<10
0<
100
<10
0<
100
<10
0Zi
nc<
5000
<10
<10
4020
<10
<10
<10
<10
<10
2020
<10
20<
1040
Ch
em
ica
l C
on
stit
ue
nt
(in
µg
/l)
Sa
mp
leS
AN
S 2
41-
1:20
11S
tan
dar
d
Lim
it (
He
alth
)
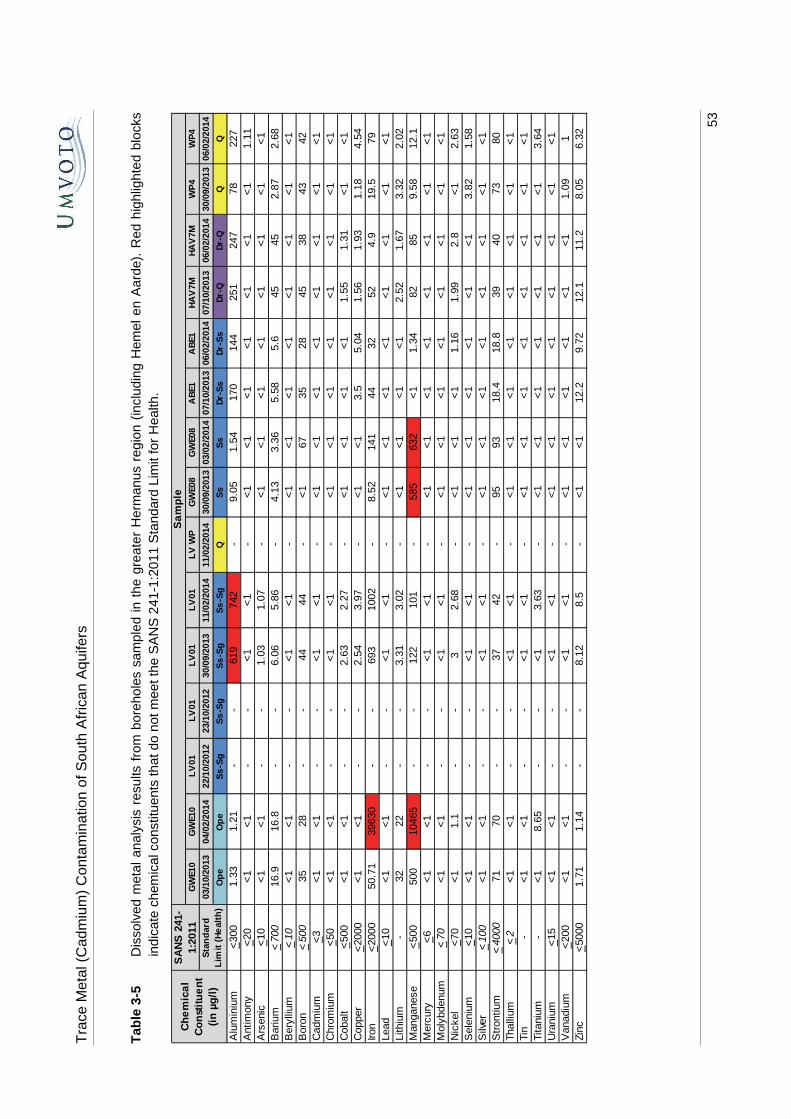
Tra
ce M
etal
(C
adm
ium
) C
onta
min
atio
n of
Sou
th A
fric
an A
quife
rs
53
Tab
le 3
-5
Dis
solv
ed m
etal
ana
lysi
s re
sults
fro
m b
oreh
oles
sam
pled
in
the
grea
ter
Her
man
us r
egio
n (in
clud
ing
Hem
el e
n A
arde
). R
ed h
ighl
ight
ed b
lock
s in
dica
te c
hem
ical
con
stitu
ents
that
do
not m
eet t
he S
AN
S 2
41-1
:201
1 S
tand
ard
Lim
it fo
r H
ealth
.
GW
E10
GW
E10
LV
01L
V01
LV
01L
V01
LV
WP
GW
E08
GW
E08
AB
E1A
BE1
HA
V7M
HA
V7M
WP
4W
P4
03/1
0/20
1304
/02/
2014
22/1
0/20
1223
/10/
2012
30/0
9/20
1311
/02/
2014
11/0
2/20
1430
/09/
2013
03/0
2/20
1407
/10/
2013
06/0
2/20
1407
/10/
2013
06/0
2/2
014
30/0
9/20
1306
/02/
2014
Op
eO
pe
Ss
-Sg
Ss
-Sg
Ss
-Sg
Ss
-Sg
QS
sS
sD
r-S
sD
r-S
sD
r-Q
Dr-
Q
Alu
min
ium
<30
01.
331.
21-
-61
974
2-
9.05
1.54
170
144
251
247
7822
7A
ntim
ony
<20
<1
<1
--
<1
<1
-<
1<
1<
1<
1<
1<
1<
11.
11A
rsen
ic<
10<
1<
1-
-1.
031.
07-
<1
<1
<1
<1
<1
<1
<1
<1
Bar
ium
<70
016
.916
.8-
-6.
065.
86-
4.13
3.36
5.58
5.6
4545
2.87
2.68
Ber
ylliu
m<
10<
1<
1-
-<
1<
1-
<1
<1
<1
<1
<1
<1
<1
<1
Bor
on<
500
3528
--
4444
-<
167
3528
4538
4342
Cad
miu
m<
3<
1<
1-
-<
1<
1-
<1
<1
<1
<1
<1
<1
<1
<1
Chr
omiu
m<
50<
1<
1-
-<
1<
1-
<1
<1
<1
<1
<1
<1
<1
<1
Cob
alt
<50
0<
1<
1-
-2.
632.
27-
<1
<1
<1
<1
1.55
1.31
<1
<1
Cop
per
<20
00<
1<
1-
-2.
543.
97-
<1
<1
3.5
5.04
1.56
1.93
1.18
4.54
Iron
<20
0050
.71
3963
0-
-69
310
02-
8.52
141
4432
524.
919
.579
Lead
<10
<1
<1
--
<1
<1
-<
1<
1<
1<
1<
1<
1<
1<
1Li
thiu
m-
3222
--
3.31
3.02
-<
1<
1<
1<
12.
521.
673.
322.
02M
anga
nese
<50
050
010
465
--
122
101
-58
563
2<
11.
3482
859.
5812
.1M
ercu
ry<
6<
1<
1-
-<
1<
1-
<1
<1
<1
<1
<1
<1
<1
<1
Mol
ybde
num
<70
<1
<1
--
<1
<1
-<
1<
1<
1<
1<
1<
1<
1<
1N
icke
l<
70<
11.
1-
-3
2.68
-<
1<
1<
11.
161.
992.
8<
12.
63S
elen
ium
<10
<1
<1
--
<1
<1
-<
1<
1<
1<
1<
1<
13.
821.
58S
ilver
<10
0<
1<
1-
-<
1<
1-
<1
<1
<1
<1
<1
<1
<1
<1
Str
ontiu
m<
4000
7170
--
3742
-95
9318
.418
.839
4073
80Th
alliu
m<
2<
1<
1-
-<
1<
1-
<1
<1
<1
<1
<1
<1
<1
<1
Tin
-<
1<
1-
-<
1<
1-
<1
<1
<1
<1
<1
<1
<1
<1
Tita
nium
-<
18.
65-
-<
13.
63-
<1
<1
<1
<1
<1
<1
<1
3.64
Ura
nium
<15
<1
<1
--
<1
<1
-<
1<
1<
1<
1<
1<
1<
1<
1V
anad
ium
<20
0<
1<
1-
-<
1<
1-
<1
<1
<1
<1
<1
<1
1.09
1Zi
nc<
5000
1.71
1.14
--
8.12
8.5
-<
1<
112
.29.
7212
.111
.28.
056.
32
Ch
em
ica
l C
on
stit
ue
nt
(in
µg
/l)
Sa
mp
le
Sta
nd
ard
L
imit
(H
eal
th)
SA
NS
241
-1:
2011
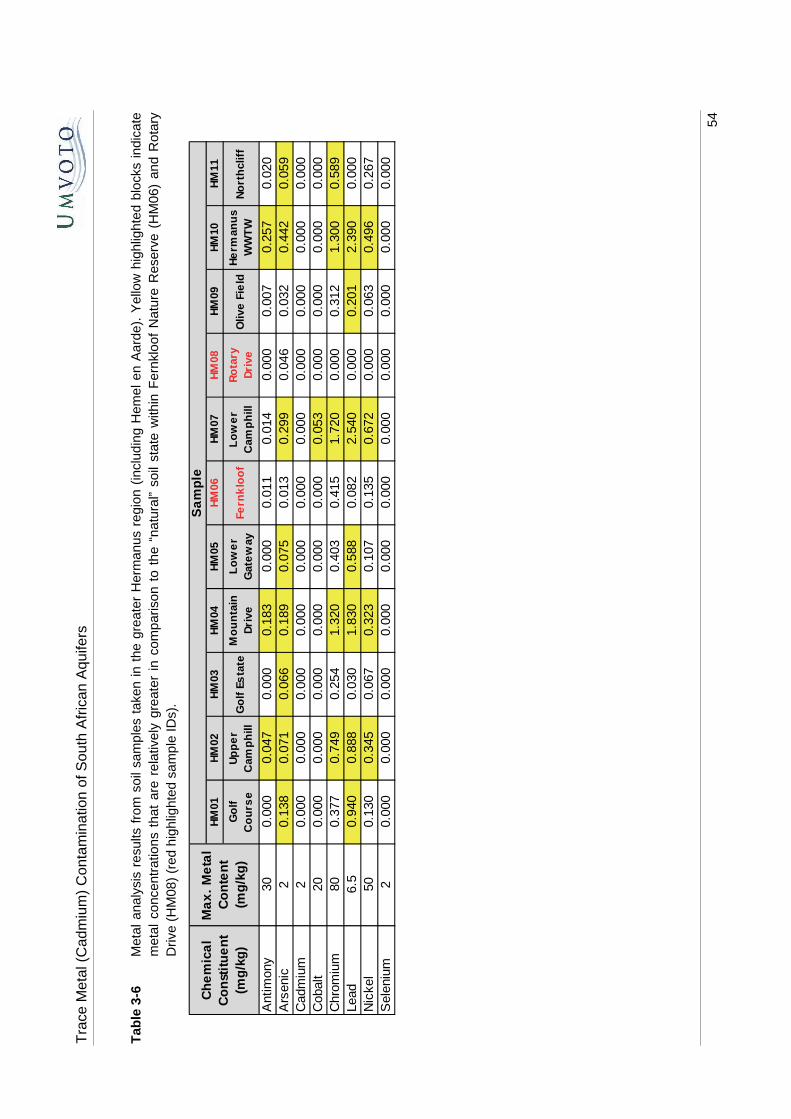
Tra
ce M
etal
(C
adm
ium
) C
onta
min
atio
n of
Sou
th A
fric
an A
quife
rs
54
Tab
le 3
-6
Met
al a
naly
sis
resu
lts f
rom
soi
l sam
ples
tak
en i
n th
e gr
eate
r H
erm
anus
reg
ion
(incl
udin
g H
emel
en
Aar
de).
Yel
low
hig
hlig
hted
blo
cks
indi
cate
m
etal
con
cent
ratio
ns t
hat
are
rela
tivel
y gr
eate
r in
com
paris
on t
o th
e “n
atur
al”
soil
stat
e w
ithin
Fer
nklo
of N
atur
e R
eser
ve (
HM
06)
and
Rot
ary
Driv
e (H
M08
) (r
ed h
ighl
ight
ed s
ampl
e ID
s).
HM
01H
M02
HM
03H
M04
HM
05H
M06
HM
07H
M08
HM
09H
M10
HM
11
Go
lf
Co
urs
eU
pp
er
Cam
ph
illG
olf
Es
tate
Mo
un
tain
D
rive
Lo
we
r G
ate
way
Fern
klo
of
Lo
we
r C
amp
hill
Ro
tary
D
rive
Oliv
e F
ield
He
rman
us
WW
TW
No
rth
clif
f
Ant
imon
y30
0.00
00.
047
0.00
00.
183
0.00
00.
011
0.01
40.
000
0.00
70.
257
0.02
0A
rsen
ic2
0.13
80.
071
0.06
60.
189
0.07
50.
013
0.29
90.
046
0.03
20.
442
0.05
9C
adm
ium
20.
000
0.00
00.
000
0.00
00.
000
0.00
00.
000
0.00
00.
000
0.00
00.
000
Cob
alt
200.
000
0.00
00.
000
0.00
00.
000
0.00
00.
053
0.00
00.
000
0.00
00.
000
Chr
omiu
m80
0.37
70.
749
0.25
41.
320
0.40
30.
415
1.72
00.
000
0.31
21.
300
0.58
9Le
ad6.
50.
940
0.88
80.
030
1.83
00.
588
0.08
22.
540
0.00
00.
201
2.39
00.
000
Nic
kel
500.
130
0.34
50.
067
0.32
30.
107
0.13
50.
672
0.00
00.
063
0.49
60.
267
Sel
eniu
m2
0.00
00.
000
0.00
00.
000
0.00
00.
000
0.00
00.
000
0.00
00.
000
0.00
0
Ch
em
ica
l C
on
stit
ue
nt
(mg
/kg
)
Sa
mp
leM
ax
. M
eta
l C
on
ten
t (m
g/k
g)
Trace Metal (Cadmium) Contamination of South African Aquifers
55
4. CONCLUSION, RECOMMENDATIONS AND FUTURE STUDIES
Cadmium is a highly mobile, bioavailable and potentially toxic trace metal, especially in environments such as acidic, sandy, non-calcareous soils (with low clay and organic matter contents) and acidic groundwater (with low salinity and hardness, and a low organic matter, suspended matter, clay and iron/manganese oxide/hydroxide content). Although at relatively low concentrations within the product itself, continuous application of phosphate fertilizer and treated sludge/wastewater with cadmium impurities can cause long term cadmium contamination of soil and ultimately (through leaching) groundwater systems. The observed cadmium (among other trace metals such as arsenic, lead, nickel and selenium) contamination within the unconfined Nardouw and Quaternary Aquifers in the greater Hermanus region (and specifically the eastern Fernkloof residential area), could possibly be a result of the application of phosphate fertilizer and treated wastewater/sludge in local recreational, residential and agricultural areas in association with acidic Table Mountain and Bredasdorp Group soil/sediment and groundwater. The following is recommended (incorporating potential future studies):
Local recommendations and studies
• Undertaking of additional detailed studies to supplement the results from the current project, due to the small sample size analysed for both groundwater and soils. This could include:
o Detailed analysis of fertilizer/wastewater composition and use (i.e. life cycle flows) in the greater Hermanus region.
o Further sampling of private Nardouw Aquifer boreholes in the vicinity of the Northcliff and Fernkloof residential areas, to determine the extent of possible Nardouw Aquifer contamination.
o Further sampling of Peninsula Aquifer production boreholes, in order to determine if cross contamination between aquifers is occurring.
o Detailed species analysis of cadmium found within groundwater (and soil, if present).
o Detailed soil and sediment analyses, including full trace and macrochemical analysis of soil constituents from 5 m deep auger samples through the entire soil and Bredasdorp Group unconsolidated sediment cover, in order to try isolate specific cadmium-soil interactions (if present).
o Botanical and biochemical studies of fynbos in the Hermanus region, to determine the extent to which indigenous vegetation absorbs cadmium from the soil and air.
Trace Metal (Cadmium) Contamination of South African Aquifers
56
• Updating or developing monitoring protocols for utilised aquifer systems to include seasonal trace metal (and specifically cadmium) sampling, especially with regards to vulnerable aquifers (i.e. unconfined primary and fractured aquifers with acidic groundwater) in the vicinity of agricultural/residential/industrials areas or golf courses.
• Detailed hydrochemical and geochemical studies of barium, boron, lithium and strontium in TMG lithology and groundwater, in order to determine reasons for variations of these trace elements in the Peninsula and Nardouw Aquifers, as well as what the provenance and source (marine shales versus basement rocks) of these elements are.
Regional and national recommendations and studies
• Undertaking of detailed geological, hydrogeological, hydrochemical and contamination studies on each of the eight clusters of cadmium groundwater pollution within South Africa (Cape Town-West Coast, Springbok, Southern Cape, De Aar, Rustenburg, Witwatersrand, Limpopo-Olifants and Phalaborwa clusters), in order to determine the source and mechanisms of cadmium contamination in these regions. Although not within any of the clusters, a detailed surface and groundwater, hydrochemical and contamination study should be undertaken in the Eastern Cape in the vicinity of the mid-2000s cadmium contamination event.
• Development of a GIS (and possibly web based) cadmium groundwater contamination risk assessment model for South Africa (using the eight identified clusters as baseline data input areas), incorporating hazard analysis (i.e. point and non-point sources of pollution, cadmium flow assessments), an environmental vulnerability assessment (e.g. geochemical characteristics of each area, soil properties, hydrogeology etc.), and coping capacity review (the extent to which cadmium regulation, reduction, removal and remediation has occurred within each area and the country as a whole).
Trace Metal (Cadmium) Contamination of South African Aquifers
57
5. REFERENCES
Al-Shawi, A. W. and Dahl, R. (1999). The determination of cadmium and six other heavy metals in nitrate/phosphate fertilizer solution by ion chromatography. Analytica Chimica, 391, 35-42.
Awofolu, O. R., Mbolekwa, Z., Mtshemla, V. and Fatoki, O. S. (2005). Levels of trace metals in water and sediment from Tyhume River and its effects on an irrigated farmland. Water SA, 31 (1), 87-94.
Baker, K. V. and Murray, R. (2013). Characterising the chemical composition of deep and shallow groundwater in an area considered for shale-gas exploration in the Main Karoo Basin. Deliverable 4 Progress Report Identification of Study Areas. Compiled by Groundwater Africa for WRC Project No. K5/2254, 45pp.
Bandara, J. M. R. S., Wijewardena, H. V. P. and Seneviratne, H. M. M. S (2010). Remediation of cadmium contaminated irrigation and drinking water: A large scale approach. Toxicology Letters, 198, 89-92.
Bennet-Chambers, M., Davies, P. and Knott, B. (1999). Cadmium in aquatic ecosystems in Western Australia: A legacy of nutrient-deficient soils. Journal of Environmental Management, 57, 283-295.
Bergback, B., Anderberg, S. and Lohm, U. (1994). Accumulated environmental impact: the case of cadmium in Sweden. The Science of the Total Environment, 145, 13-28.
Bester, P. K., Lobnik F., Erzen F., Kastelec, D. and Zupan, M. (2013). Prediction of cadmium concentration in selected home-produced vegetables. Ecotoxicology and Environmental Safety, 96, 182-190.
Cabrera, C., Ortega, E., Gallego, C., Lopez, M. C., Lorenzo, M. L. and Asensio, C. (1994). Cadmium concentration in farmlands in southern Spain: possible sources of contamination. The Science of the Total Environment, 153, 261-265.
Coetzee, H., Winde, F. and Wade, P. W. (2006). An assessment of sources, pathways, mechanisms and risks of current and potential future pollution of water and sediments in gold-mining areas of the Wonderfonteinspruit Catchment. Water Research Commission. Report No. 1214/1/06. 202pp.
Conrad, J., Colvin, C., Sililo, O., Gorgens, A., Weaver, J. and Reinhardt, C. (1999). Assessment of the impact of agricultural practices on the quality of groundwater resources in South Africa. WRC Report 641/1/99.
Cupit, M., Larsson, O., de Meeus, C., Eduljee, G. H. and Hutton, M. (2002). Assessment and management of risks arising from exposure to cadmium in fertilizers – II. The Science of the Total Environment, 291, 189-206.
Trace Metal (Cadmium) Contamination of South African Aquifers
58
de Meeus, C., Eduljee, G. H. and Hutton, M. (2002). Assessment and management of risks arising from exposure to cadmium in fertilizers – I. The Science of the Total Environment, 291. 167-187.
de Vries, W. and McLaughlin, M. J. (2013). Modeling the cadmium balance in Australian agricultural systems in view of potential impacts on food and water quality. Science of the Total Environment, 461-462, 240-257.
Department of Agriculture, Forestry and Fisheries. (2012). Regulations regarding fertilizers. No. R. 732 September 2012. Fertilizers, Farm Feeds, Agricultural Remedies and Stock Remedies Act (No. 36 of 1947).
Department of Health. (2004). Regulations relating to maximum levels for metals in foodstuffs. No. R. 500 30 April 2004. Foodstuffs, Cosmetics and Disinfectants Act (No. 54 of 1972).
Department of Water Affairs and Forestry (DWAF). (1996a). South African Water Quality Guidelines: Volume 4 Agricultural Use: Irrigation. DWAF, Pretoria, 199 pp.
Department of Water Affairs and Forestry (DWAF). (1996b). South African Water Quality Guidelines: Volume 5 Agricultural Use: Livestock Watering. DWAF, Pretoria, 163 pp.
Department of Water Affairs and Forestry (DWAF). (1996c). South African Water Quality Guidelines: Volume 7 Aquatic Ecosystems. DWAF, Pretoria, 159 pp.
Fatoki, O. S. and Awofolu, R. (2003). Levels of Cd, Hg and Zn in some surface waters from the Eastern Cape Province, South Africa. Water SA, 29 (4), 375-380.
Fatoki, O. S., Awofolu, O. R. and Genthe, B. (2004). Cadmium in the Umtata River and the associated health impact of on rural communities who are primary users of water from the river. Water SA, 30 (4), 507-513.
Fatoki, O. S., Lujiza, N. and Ogunfowokan, A. O. (2002). Trace metal pollution in Umtata River. Water SA, 28 (2), 182-189.
Hashim, M. A., Mukhopadhyay, S., Sahu J. N. and Sengupta, B. (2011). Remediation technologies for heavy metal contaminated groundwater. Journal of Environmental Management, 92, 2355-2388.
Henning, B. J., Snyman, H. G. and Aveling, T. A. S. (2001). Plant-soil interactions of sludge-borne heavy metals and the effect on maize (Zea mays L.) seedling growth. Water SA, 27 (1), 71-78.
Hill, G., Fraser, G. and Baiyegunhi, L. (2012). The impact of contaminated fertilizer on pineapple growers in the Eastern Cape, South Africa. African Journal of Agricultural Research, 7 (27), 3898-2905.
Trace Metal (Cadmium) Contamination of South African Aquifers
59
Hodgson, F. D. I. and Krantz, R. M. (1998). Investigation into groundwater quality deterioration in the Olifants River catchment above Loskop Dam with specialised investigation in the Witbank Dam sub-catchment. WRC Report No. 291/1/98, WRC, Pretoria, 272pp.
International Agency for Research on Cancer (IARC). (1997). IARC Monographs on the evaluation of carcinogenic risks to humans. Volume 58: Beryllium, cadmium, mercury, and exposures in the glass manufacturing industry. Summary of data reported and evaluation. WHO IARC, 21pp.
Jiao, W., Cheng, W., Chang, A. C. and Page, A. L. (2012). Environmental risks of trace elements associated with long-term phosphate fertilizers applications: A review. Environmental Pollution, 168, 44-53.
Jovanovic, N. Z., Petersen, C., Bugan, R. D. H. and van der Walt, E. (2012). Modelling the Fate of Pesticides: Primary Processes, Non-Point Source Data Collection and Guidelines. WRC Report No. 1516/2/12, Water Research Commission, Pretoria.
Klaassen, C. D., Liu, J. and Bhalchandra, A. D. (2010). Metallothionein protection of cadmium toxicity. Toxicology and Applied Pharmacology, 238 (3), 215-220.
Krishnamurti, G. S. R., McArthur, D. F. E., Wang, M. K., Kozak, L. M. and Huang, P. M. (2005). Biogeochemistry of soil cadmium and the impact on terrestrial food chain contamination. In: Huang, P. M. and Gobran, G. R. (Eds.), Biogeochemistry of Trace Elements in the Rhizosphere. Elsevier B. V., Amsterdam, 197-257.
Lambert, R., Grant, C. and Sauve, S. (2007). Cadmium and zinc in soil solution extracts following the application of phosphate fertilizers. Science of the Total Environment, 378. 293-305.
London, L., Dalvie M. A., Cairncross, E. and Solomons, A. (2000). The quality of surface and groundwater in the rural Western Cape with regard to pesticides. WRC Report 795/1/00, Water Research Commission, Pretoria.
Mann, S. S. and Ritchie, G. S. P. (1993). Forms of cadmium in sandy soils after amendment with soils of higher fixing capacity. Environmental Pollution, 87, 23-29.
Mar, S. S. and Okazaki, M. (2012). Investigation of Cd contents in several phosphate rocks used for the production of fertilizer. Microchemical Journal, 104, 17-21.
Mason-Jones, K. and von Blottnitz, H. (2010). Flows and fates of nickel-cadmium batteries in the City of Cape Town. Minerals Engineering, 23, 211-218.
McCarthy, T. (2010). The decanting of acid mine water in the Gauteng city-region: Analysis, prognosis and solutions. Gauteng City-Region Observatory Provocations Series, 26pp.
Trace Metal (Cadmium) Contamination of South African Aquifers
60
McCarthy, T. (2011). The impact of acid mine drainage in South Africa. South African Journal of Science, 107 (5/6), 7pp.
McLean, J. E. and Bledsoe, B. E. (1992). Behavior of metals in soils. EPA Ground Water Issue EPA/540/S-92/018, United States Environmental Protection Agency, 25pp.
Meerkotter, M. (2012). Sources of heavy metals in vegetables in Cape Town, and possible methods of rehabilitation. Unpublished PhD thesis, University of the Western Cape, Cape Town, 270pp.
Meyer, J. A. and Casey, N. H. (2004). Exposure assessment of potentially toxic trace elements in indigenous goats in the rural communal production systems of the northern region of South Africa. South African Journal of Animal Science, 34, 219-222.
National Health and Medical Research Council, National Resource Management Ministerial Council (NHMRC/NRMMC). (2011). Australian Drinking Water Guidelines Paper 6 National Water Quality Management Strategy. National Health and Medical Research Council, National Resource Management Ministerial Council, Commonwealth of Australia, Canberra.
Nengovhela, A. C., Yibas, B. and Ogola, J. S. (2006). Characterisation of gold tailings dams of the Witwatersrand Basin with reference to their acid mine drainage potential, Johannesburg, South Africa. Water SA, 32 (4), 499-506.
Okonkow, J. O. and Mothiba, M. (2004). Physico-chemical characteristics and pollution levels of heavy metals in the rivers in Thohoyandou, South Africa. Journal of Hydrology, 308, 122-127.
Otero, N., Vitoria, L., Soler, A. and Canals, A. (2005). Fertiliser characterisation: Major, trace and rare earth elements. Applied Geochemistry, 20, 1473-1488.
Roberts, D. L., Botha, G. A., Maud, R. R. and Pether, J. (2006). Coastal Cenozoic deposits. In: Johnson, M. R., Anhaeusser, C. R. and Thomas, R. J. (Eds.), The Geology of South Africa. Geological Society of South Africa, Johannesburg/Council for Geoscience, Pretoria, 605-628.
Salminen, R. (2005). Geochemical atlas of Europe. Part 1: Background information, methodology and maps. Geological Survey of Finland, Espoo, Finland, 526pp.
Samie, A., Meliko, M., Mojapelo, P., Mashau, F., Nefefe, T. and Ntekele, P. (2012). Parasites and related interactions in water resources and rural communities. WRC Report No.1910/1/11, WRC, Pretoria, 125pp.
Sanders, M. J., du Preez, H. H. and van Vuuren, J. H. J. (1999). Monitoring cadmium and zinc contamination in freshwater systems with the use of the freshwater river crab, Potamonautes warreni. Water SA, 25 (1), 91-98.
Trace Metal (Cadmium) Contamination of South African Aquifers
61
Satarug, S., Baker, R., Urbenjapol, S., Haswell-Elkins, M., Reilly, P. E. B., Williams, D. J. and Moore, M. R. (2003). A global perspective on cadmium pollution and toxicity in non-occupationally exposed population. Toxicology Letters, 137, 65-83.
Schoonbee, H. J., Adendorff, A., de Wet, L. M., de Wet, L. P. D., Fleischer, C. L., van der Merwe, C. G., van Eeden, P. H. and Venter, A. J. A. (1995). The occurrence and accumulation of selected heavy metals in fresh water ecosystems affected by mine and industrial effluent. WRC Report No. 312/1/96, WRC, Pretoria, 148pp.
Snyman, H. G. and Herselman, J. E. (2006). Guidelines for the utilisation and disposal of wastewater sludge. Volume 2: Requirements for the agricultural use of wastewater sludge. WRC Report TT 262/06, 34pp.
South African Bureau of Standards (SABS). (2011). South African National Standard (SANS) 241-1:2011. Drinking Water. Part 1: Microbiological, physical, aesthetic and chemical determinands.
Street, R. A., Kulkarni, M. G. Stirk, W.A., Southway, C., Abdillahi, H. S., Chinsamy, M. and Van Staden, J. (2009). Effect of cadmium uptake and accumulation on growth and antibacterial activity of Merwilla plumbea – An extensively used medicinal plant in South Africa. South African Journal of Botany, 75, 611-616.
Thamm, A. G. and Johnson, M. R. (2006). The Cape Supergroup. In: Johnson, M. R., Anhaeusser, C. R. and Thomas, R. J. (Eds.), The Geology of South Africa. Geological Society of South Africa, Johannesburg/Council for Geoscience, Pretoria, 433-460.
Umvoto Africa. (2007). Water Source Development and Management Plan for the Greater Hermanus Area. Interim Report on the Revised Geology and Preliminary Aquifer Storage. Prepared by Hartnady, C. J. H., Seyler, H. G. P. and Blake, D. of Umvoto Africa (Pty) Ltd for the Overstrand Local Municipality, 29 pp.
Umvoto Africa. (2011). Water Source Development and Management Plan for the Greater Hermanus Area. Gateway Wellfield Infrastructure Upgrade Technical Report. Prepared by Seyler, H. G. P., Hemsted, T., Galley, E., von Scherenberg, L. and Blake, D. of Umvoto Africa for the Overstrand Local Municipality (December 2011), 57pp.
Umvoto Africa. (2014a). Water Source Development and Management Plan for the Greater Hermanus Area. Annual Monitoring Report: October 2012 to September 2013. Volume 1: Gateway Wellfield. Prepared by Burgers, K. M., Jack, S. and Shoko, V. of Umvoto Africa for the Overstrand Local Municipality (March 2014), 55pp.
Umvoto Africa. (2014b). Water Source Development and Management Plan for the Greater Hermanus Area. Annual Monitoring Report: October 2012 to September 2013. Volume 2: Hemel en Aarde Valley Wellfields. Prepared by Burgers, K. M., Jack, S. and Shoko, V. of Umvoto Africa for the Overstrand Local Municipality (March 2014), 55pp.
Trace Metal (Cadmium) Contamination of South African Aquifers
62
United Nations Environment Programme (UNEP). (2010). Final review of scientific information on cadmium. UNEP Division of Technology, Industry and Economic (DTIE): Chemicals Branch, Geneva, 201pp.
United Nations International Strategy for Disaster Reduction (UN/ISDR). (2005). Hyogo Framework for Action 2005-2015: Building the Resilience of Nations and Communities to Disasters. UN/ISDR, World Conference on Disaster Reduction, January 2005, Hyogo, Japan, 22 pp.
Usher, B. H., Pretorius, J. A., Dennis, I., Jovanovic, N., Clarke, S., Cavé, L., Titus, R. and Xu, Y. (2004). Inorganic and organic contaminants and associated sources in South Africa's catchments. Report 1: Identification and prioritisation of groundwater contaminants and associated sources in South Africa’s urban catchments. WRC Report No. 1326-1-04. Water Research Commission, Pretoria, South Africa.
Usman, O. A. S. and Dosumu, O. O. (2007). Cadmium analysis in fertilizers and groundwater samples in Dass Local Government area of Bauchi State, Nigeria. Centrepoint (Science Edition), 14 (1&2), 208-213.
van Aardt, W. J. and Erdmann, R. (2004). Heavy metals (Cd, Pb, Cu, Zn) in mudfish and sediments from three hard-water dams of the Mooi River catchment, South Africa. Water SA, 30 (2), 211-218.
World Health Organisation (WHO). (2011). Guidelines for drinking-water quality. Fourth edition. WHO, Geneva, 541pp.